Energy Efficiency: Real, Reliable and Cost-Effective ... · Energy Efficiency: Real, Reliable and...
31
Saving Energy Together Power Saver TM Program Energy Efficiency: Real, Reliable and Cost-Effective Alternative Presented by Fred Yebra, P.E. December 4, 2007
Energy Efficiency: Real, Reliable and Cost-Effective ... · Energy Efficiency: Real, Reliable and Cost-Effective Alternative ... • Free home and business energy audits ... • NEMA:
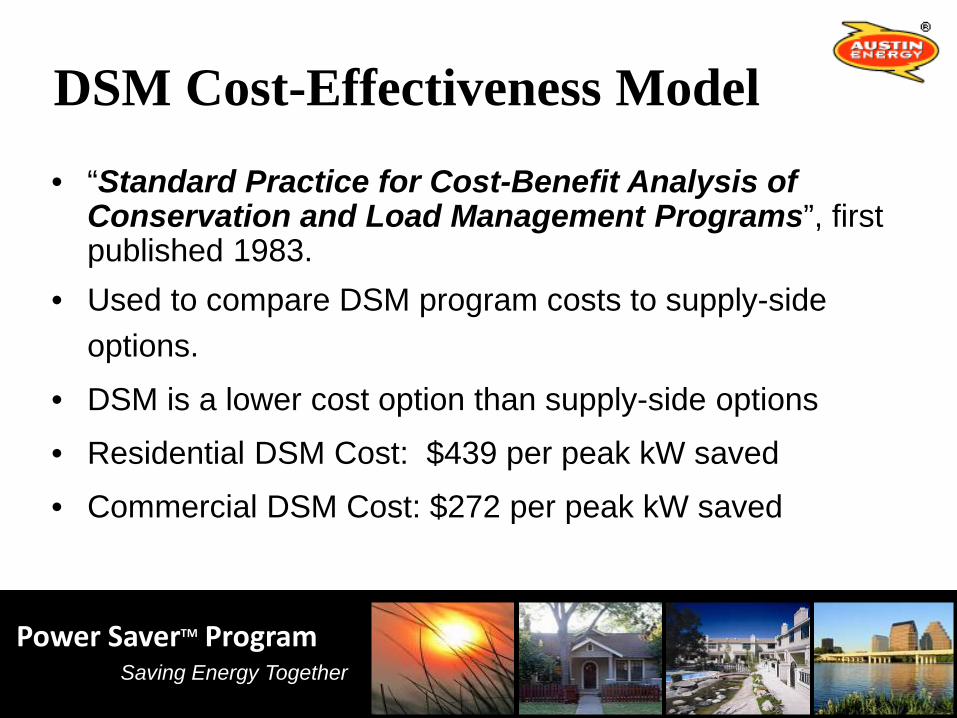
Resolution September 14 1999ldquoCost-effective conservation programs shall be the first priority in meeting new load growth requirements of Austin Energy rdquo
Clean Energy Resolution August 28 2003hellip Austin Energy Strategic Plan to ensure Austin remains a national and international leader in the development and use of clean energy
Saving Energy TogetherPower SaverTM Program
Austin Climate Protection Plan Will make Austin the national leader among
cities in the fight against global warming
Saving Energy TogetherPower SaverTM Program
Efficiency amp Renewables GoalEnergy Efficiency is first priority
ndash 15 energy savings by 2020ndash 700 MWs of peak demand savings by 2020
Renewable Energy Goalndash 30 Renewable Energy by 2020ndash 100 MWs of Solar by 2020
Saving Energy TogetherPower SaverTM Program
Promoting Energy Efficiencybull Cash rebates pay 20 ndash 30 of cost bull Up to 70 incentives for Small Businessbull Direct install measuresbull Free home and business energy auditsbull Low-income Free Weatherizationbull Public education amp outreach efforts
Saving Energy TogetherPower SaverTM Program
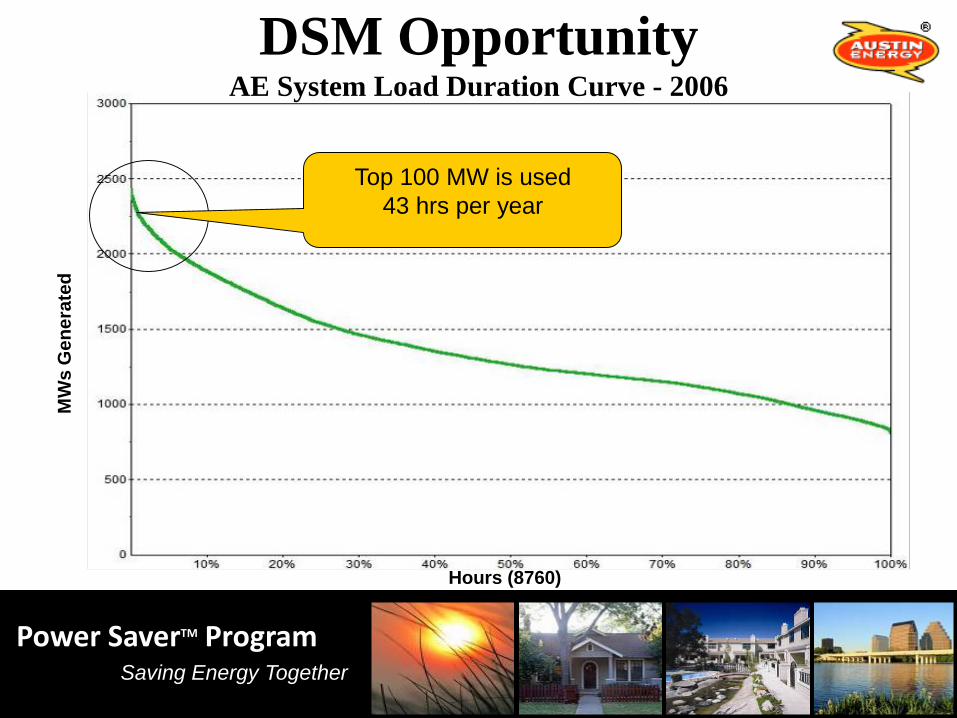
Top 100 MW is used 43 hrs per year
DSM OpportunityAE System Load Duration Curve - 2006
MW
s G
ener
ated
Hours (8760)
Saving Energy TogetherPower SaverTM Program
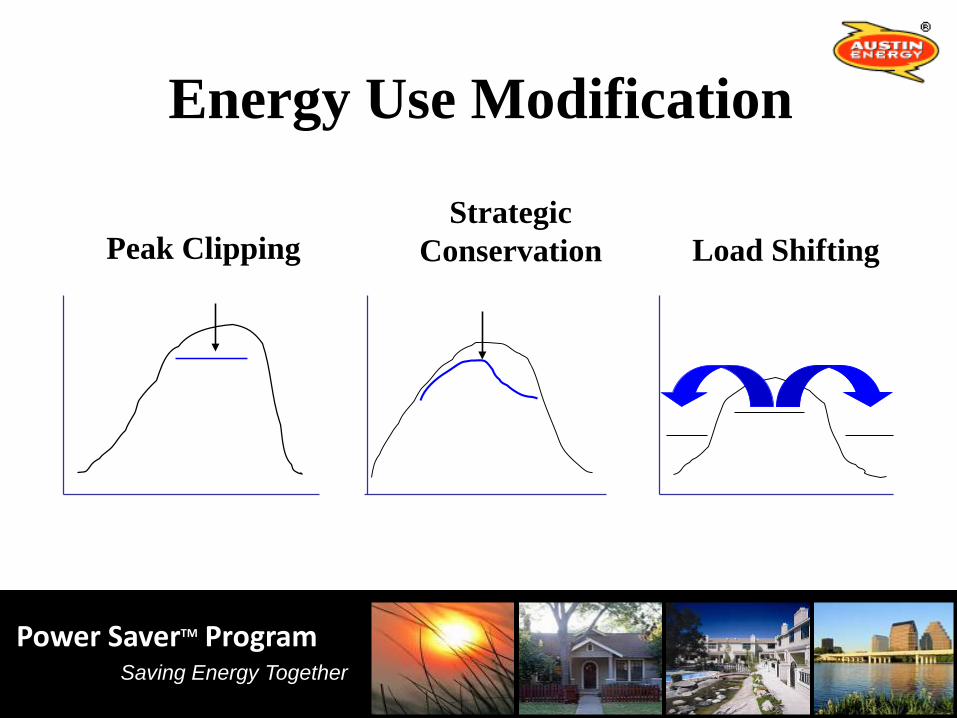
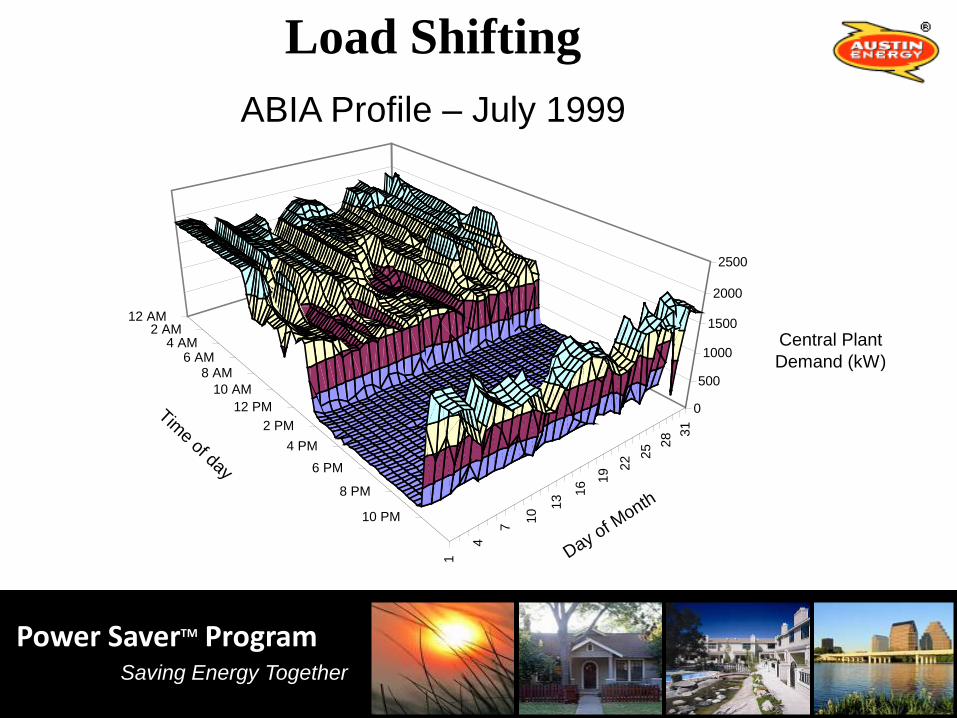
Peak ClippingStrategic
Conservation Load Shifting
Energy Use Modification
Saving Energy TogetherPower SaverTM Program
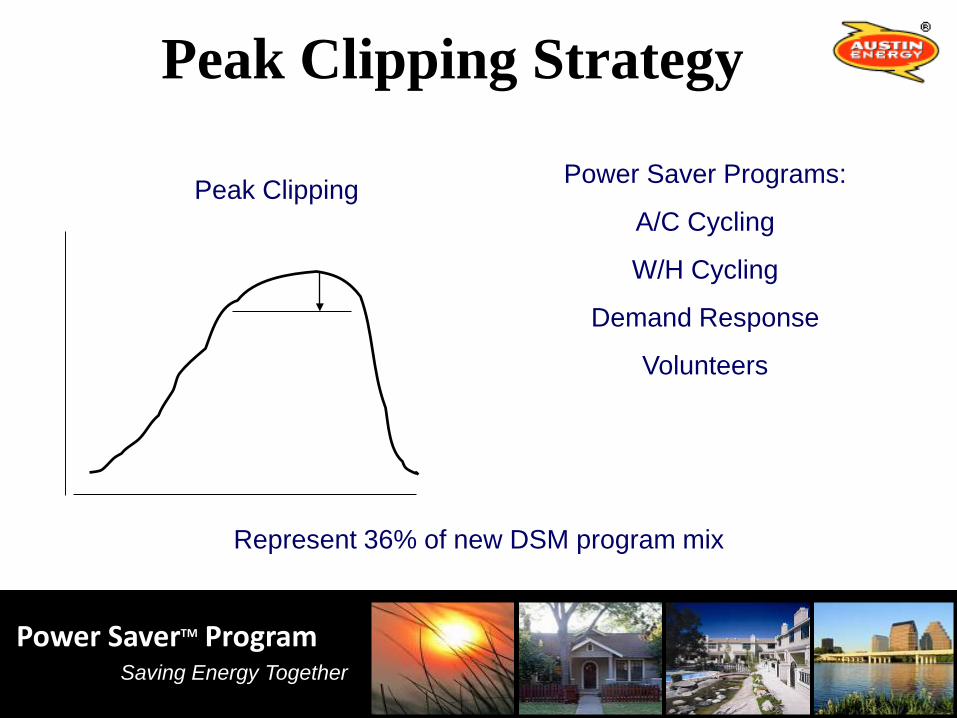
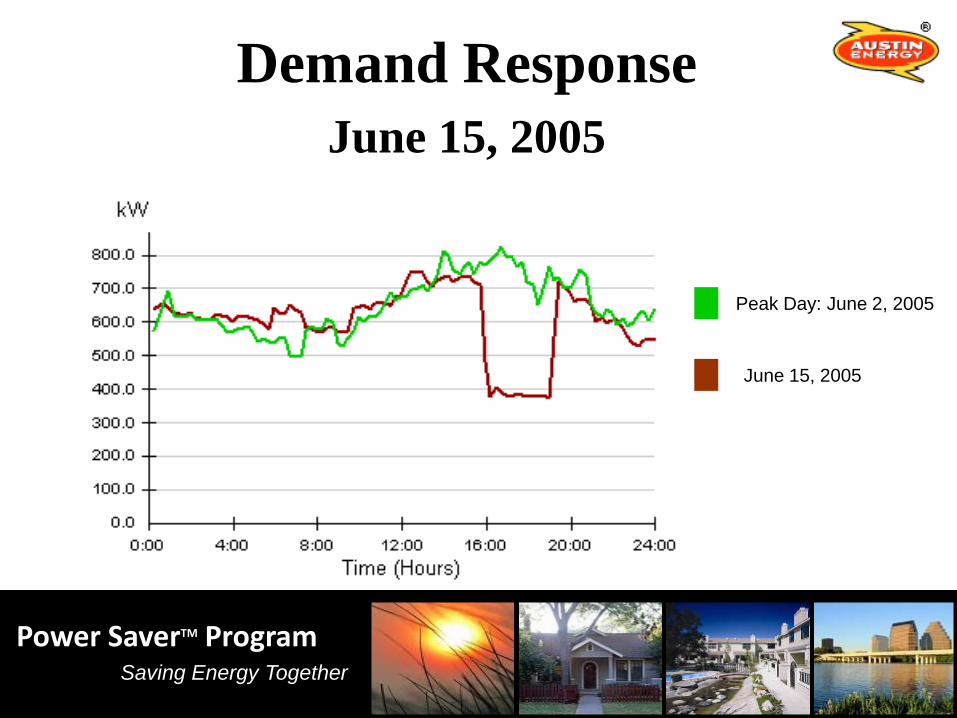
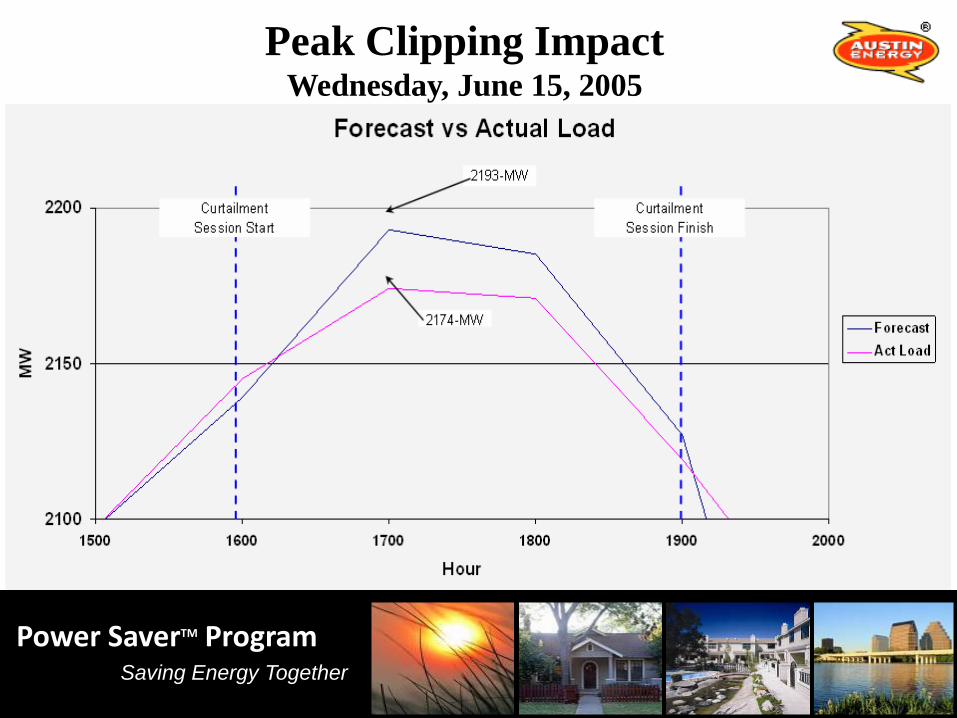
Peak Clipping Power Saver Programs
AC Cycling
WH Cycling
Demand Response
Volunteers
Peak Clipping Strategy
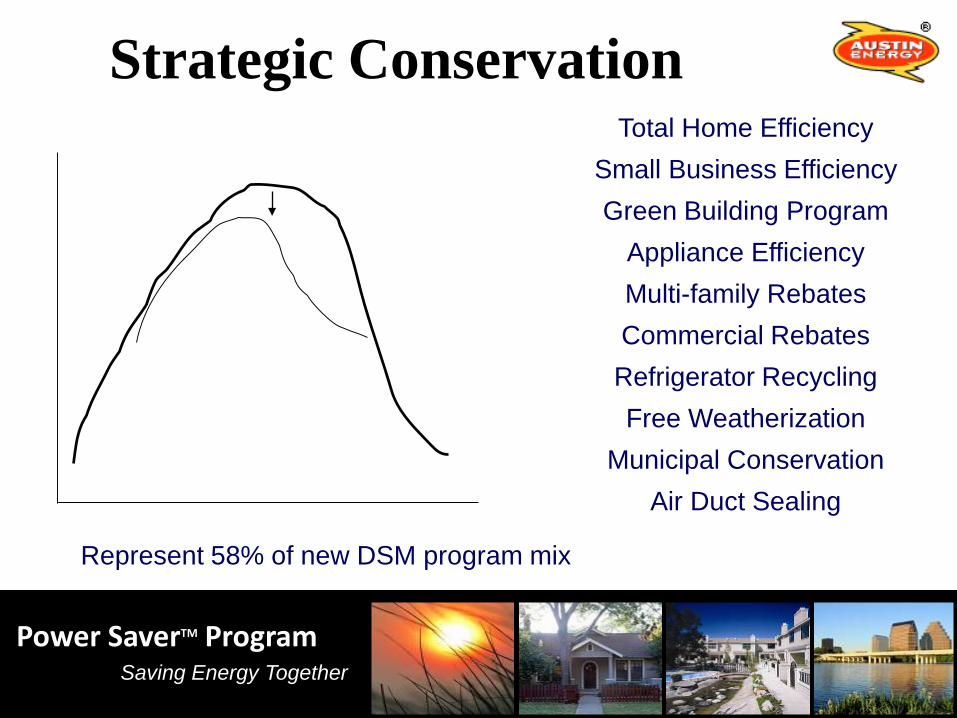
Represent 36 of new DSM program mix
Saving Energy TogetherPower SaverTM Program
Total Home EfficiencySmall Business EfficiencyGreen Building Program
bull ARI American Refrigeration Institutebull ANSI American National Standards Institutebull IESNA Illuminating Engineering Society of North Americabull NEMA National Electrical Manufacturerrsquos Associationbull ASTM American Society of Testing and Measurements
AEs Net Income Impact (8100000) (20000000) Deferred Cost of Capacity 12000000 AEs Net Cash Impact (8100000) (8000000)
CURRENT FORECAST
Cash Flow Projection of DSM
Cash flow chart
Chart1
Fuel Cost Reduction
Capacity Expense Reduction
Total Decrease In Expenses
REDUCTION IN EXPENSES DUE TO DSM PROGRAMS
5166240
5166240
8956848
8956848
13238528
13238528
14683328
26360828
11677500
16859440
31439440
14580000
20212576
37762576
17550000
24919120
45304120
20385000
30094336
53246836
23152500
34616096
60468596
25852500
40546848
69166848
28620000
47845120
79232620
31387500
Chart4
Fuel Cost without DSM
Fuel Cost with DSM
REDUCTION IN FUEL COST DUE TO DSM PROGRAMS
00233611231
00238400717
00226232559
00233069306
00220985648
00237472342
00217888198
00236848698
00215229268
00237472426
00216083296
00242335075
00224259386
00254383594
00226073357
00259502528
00240455083
00277315347
00255904506
00296726494
Sheet1
Sheet3
Saving Energy TogetherPower SaverTM Program
Questions
Saving Energy TogetherPower SaverTM Program
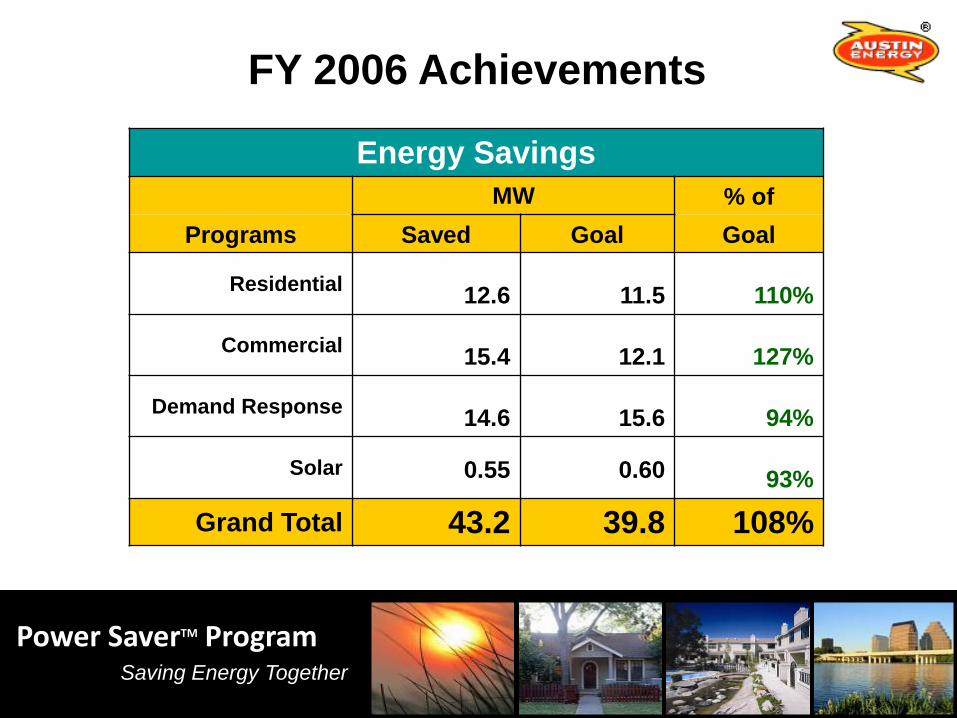
FY 2006 Achievements
Energy SavingsMW of
Programs Saved Goal Goal
Residential 126 115 110
Commercial 154 121 127
Demand Response 146 156 94
Solar 055 060 93
Grand Total 432 398 108
Saving Energy TogetherPower SaverTM Program
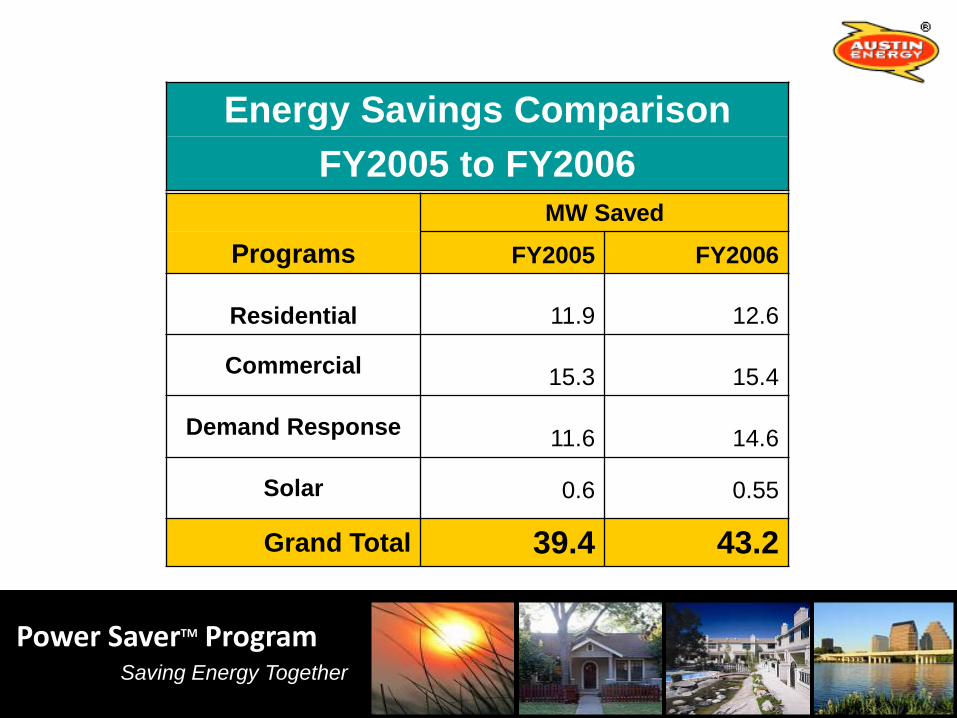
MW SavedPrograms FY2005 FY2006
Residential 119 126
Commercial 153 154
Demand Response 116 146
Solar 06 055
Grand Total 394 432
Energy Savings ComparisonFY2005 to FY2006
Saving Energy TogetherPower SaverTM Program
DSM Summary
bull DSM programs are saving peak kW amp kWh
bull Cost-effectiveness analyses include full program costs
bull DSM goals and budgets should vary to support AE resource plan requirements
Saving Energy TogetherPower SaverTM Program
Free Home WeatherizationEnergy Improvementsbull Insulate Atticsbull Duct Sealingbull Install CFLsbull Solar Screensbull Caulking and Weather-strippingbull Free Smoke amp Carbon Monoxide Detector bull Minor Energy Related Repairs
Saving Energy TogetherPower SaverTM Program
Power Saver Program
bull FREE Energy Saving Productsbull Lower energy costsbull 65000 installed in homes apartmentsbull 4000 installed in commercial buildings
Saving Energy TogetherPower SaverTM Program
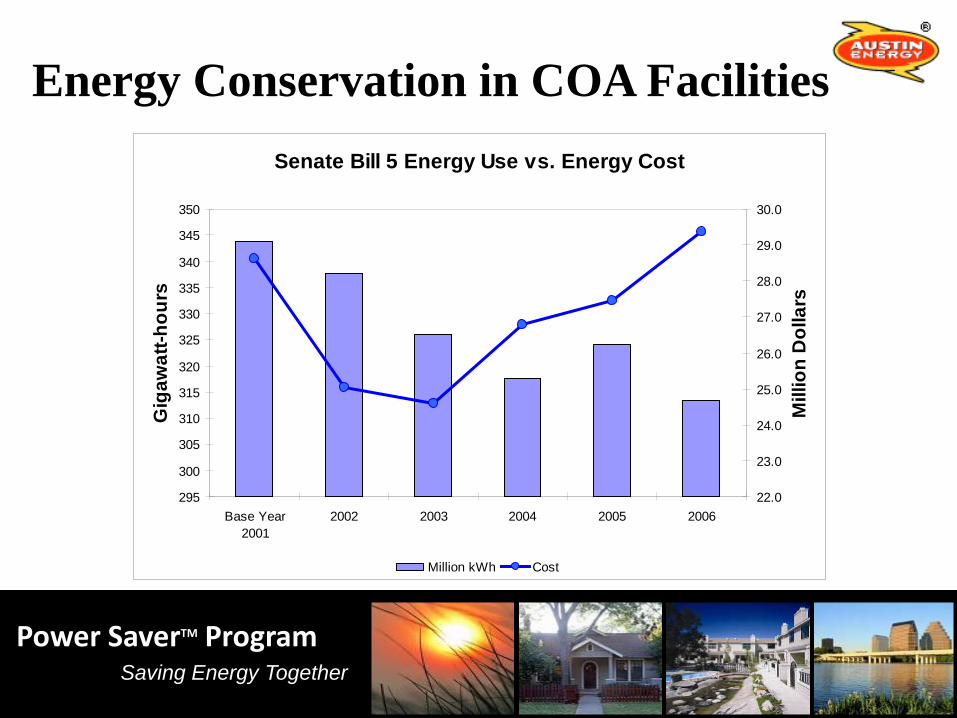
Energy Conservation in COA FacilitiesSenate Bill 5 Energy Use vs Energy Cost
295
300
305
310
315
320
325
330
335
340
345
350
Base Year2001
2002 2003 2004 2005 2006
Gig
awat
t-hou
rs
220
230
240
250
260
270
280
290
300
Mill
ion
Dol
lars
Million kWh Cost
Chart1
Million kWh
Cost
Gigawatt-hours
Million Dollars
Senate Bill 5 Energy Use vs Energy Cost
343667472
28619895
33757683
2504536
3260767692
24602549
31773020962
26778741
324036807
2745756918
313494864
2936354518
Sheet1
Sheet1
ampA
Page ampP
Million kWh
Gigawatt-hours
Senate Bill 5 Reported Energy Use
Sheet2
ampA
Page ampP
Million kWh
Cost
Gigawatt-hours
Million Dollars
Senate Bill 5 Energy Use vs Energy Cost
Sheet3
Energy Efficiency Real Reliable and Cost-Effective Alternative
Fuel cost savings assume all saved energy at average gas generation cost
Increased off-system sales margins assumes reduced demand plus associated reserve requirements could be sold for $15kWmonth (after 2007 this is an avoided capacity expense)
Fuel Factor expense increase is increased fuel expense plus purchased capacity cost
GFT reduction is base revenue and fuel cost reductions times 91
Base revenue wDSM
552961968
562415810
569170954
576627290
585065115
594497922
604045383
613657938
623249716
632762255
644233714
Base revenue wo DSM
557087606
570008130
580983849
592794909
605393639
619267826
633200893
646996029
660941168
674903660
690679622
kWh sales wDSM
10776303000
10954134000
11076488000
11213088000
11369667000
11546488000
11724454000
11897588000
12077216000
12256861000
12476492000
kWh sales wo DSM
10861087000
11109639000
11319110000
11544588000
11787201000
12054717000
12323440000
12582205000
12851412000
13121980000
13429845000
1000
kW sales wDSM
2435000
2442000
2443000
2471000
2477000
2486000
2486000
2490000
2515000
2535000
2539000
kW sales wo DSM
2476000
2527000
2572000
2644000
2693000
2746000
2788000
2833000
2898000
2959000
3004000
Fuel Forecast
Budget 2006 (3905)
Tot-2006
Tot-2007
Tot-2008
Tot-2009
Tot-2010
Tot-2011
Tot-2012
Tot-2013
Tot-2014
Tot-2015
Total
MWH
STP
3303339
3488217
3514415
3360759
3465191
3507755
3405921
3614690
3482746
3515635
34658668
FPP
4564135
4517773
4465943
4451812
4418334
4545733
4554494
4586879
4445603
4245674
44796380
Decker
2839387
511212
504648
615748
583574
563845
570235
550098
594337
757598
8090682
Holly
235228
28425
- 0
- 0
- 0
- 0
- 0
- 0
- 0
263653
Sand Hill CC
1533962
1538343
1565132
1615597
1553452
1600111
1516183
1666799
1687122
14276700
SH GT
465155
427320
523864
450359
458722
498276
432337
492003
574949
4322986
Decker GT
157126
216800
280985
238803
246172
264900
238141
266139
294200
2203267
Existing DG
17340
7248
7296
7065
7216
7268
7168
7137
7147
16838
91723
Future DG
110
110
101
2216
2659
4743
5273
7365
7750
17746
48073
PurchasePower
131996
- 0
204000
208800
206400
206400
134400
201600
136000
139200
1568796
Landfill Methane
87493
92450
92704
92450
92450
92450
92704
92450
92450
92450
920052
Future Bioenergy
- 0
- 0
134151
178705
384764
454206
673445
744600
978509
1057336
4605716
Wind
636291
669050
671181
669050
669050
669050
671181
669050
669050
669050
6662004
Solar
684
20026
32685
41438
50311
59183
68298
76929
85801
87839
523193
Shortfall Energy
3308
2419
3355
6021
3311
4269
7050
3075
3868
4281
40957
11584082
11699976
11841366
12004048
12188020
12373249
12553456
12740532
12928204
13159918
123072851
(10512)
(1)
(1)
0
0
(0)
1
1
(0)
0
(10505)
Dollars
STP
14024307
16411783
18054617
17815007
18997196
19874461
19872833
21713134
21541492
22417754
190722584
FPP
47959978
48327184
52942730
56530034
57287196
60262126
61527986
62666810
62927556
61809806
572241406
Decker
161242451
30007075
26150797
28534975
26297430
25902979
27510734
27253106
30904024
41053837
424857407
Holly
15649395
1939153
- 0
- 0
- 0
- 0
- 0
- 0
- 0
17588548
Sand Hill CC
71819840
62147912
53829988
54696364
53773560
56880544
56723452
64324432
66378796
540574888
SH GT
28915407
23018682
25201605
20614580
21546020
24873781
22042049
25993318
31798432
224003872
Decker GT
12129491
14068039
16315347
13248144
14062711
15831205
14654486
17002591
19718490
137030504
Existing DG
1066126
482134
392821
350785
361063
372817
379318
391499
407877
1055934
5260373
Future DG
5688
5352
3321
115774
140956
247241
281454
413559
455875
1154808
2824028
PurchasePower
5000000
- 0
17339160
16429042
16415314
16614357
11144008
17017280
11632503
11967200
123558864
Landfill Methane
3535734
3653844
3663855
3653844
3653844
3653844
3663855
3653844
3653844
3653844
36440353
Future Bioenergy
- 0
- 0
6036769
8041681
17314398
20439270
30305016
33507000
44032792
47579944
207256869
Wind
17374835
18256537
18314921
18256537
18256537
18256537
18314921
18256537
18256537
18256537
181800436
Solar
- 0
- 0
- 0
- 0
- 0
- 0
- 0
- 0
- 0
- 0
- 0
Shortfall Energy
248086
181420
251636
451599
248349
320172
528742
230590
290120
321058
3071771
250457205
245839462
244324412
245526217
247531370
255326093
271114397
278523346
301422961
327166440
2667231902
1792964
10
(12)
6
(1)
10
(27)
4
3
(6)
1793341
Gas MWh
2839387
2902683
2715536
2985730
2888333
2822192
2933522
2736759
3019278
3313869
29157288
Gas cost ($)
161242451
158521208
127324584
123881915
114856517
115285269
125096264
120673092
138224364
158949555
1344055218
Avg gas gen Cost ($MWh)
5679
5461
4689
4149
3977
4085
4264
4409
4578
4796
4610
NO DSM FUEL FACTOR
2006
2007
2008
2009
2010
2011
2012
2013
2014
2015
Thermal Unit Fuel Cost
232662512
236980848
213398064
215549344
211851680
220956944
237247920
240469984
264099856
293228672
Shortfall Purchases
248086
181420
251636
451599
248349
320172
528742
230590
290120
321058
Short-Term Power Purchases
5000000
- 0
29016660
31009042
33965314
36999357
34296508
42869780
40252503
43354700
Fuel Cell Gas Cost
119837
119837
119837
119837
119837
119837
119837
119837
119837
119837
Recoverable ERCOT Expenses
16825273
16825273
16825273
16825273
16825273
16825273
16825273
16825273
16825273
16825273
Fuel Factor Renewables
9998882
9706333
14540565
15223226
23255836
23418594
31052373
32981926
42305054
44649542
Total Fuel Factor Revenue
264854590
263813711
274152035
279178321
286266289
298640176
320070653
333497390
363892643
398499082
Total Renewables
20910569
21910381
28015544
29952062
39224779
42349651
52283792
55417381
65943173
69490325
TotThermal+PurchPwr+Renewables
249864319
245834121
244321076
245522607
247527546
255322004
271110126
278519139
301418805
327162135
Estimated Green Choice Sales
10911686
12204048
13474979
14728836
15968943
18931058
21231418
22435455
23638119
24840783
Fuel Factor Renewables
9998882
9706333
14540565
15223226
23255836
23418594
31052373
32981926
42305054
44649542
Forecast Annual GWh Sales
11110
11319
11545
11787
12055
12323
12582
12851
13122
13430
Average cost per kWh
$ 0023840
$ 0023307
$ 0023747
$ 0023685
$ 0023747
$ 0024234
$ 0025438
$ 0025950
$ 0027732
$ 0029673
Fuel Factors
Secondary
$ 0023475
$ 0022733
$ 0022206
$ 0021895
$ 0021627
$ 0021713
$ 0022535
$ 0022717
$ 0024162
$ 0025715
Primary
$ 0022776
$ 0022056
$ 0021545
$ 0021243
$ 0020984
$ 0021067
$ 0021864
$ 0022041
$ 0023443
$ 0024949
Transmission
$ 0022539
$ 0021828
$ 0021321
$ 0021022
$ 0020766
$ 0020848
$ 0021637
$ 0021812
$ 0023200
$ 0024690
2006
2007
2008
2009
2010
2011
2012
2013
2014
2015
Dag generation
11574
11700
11841
12004
12188
12373
12553
12741
12928
13160
Joe generation
11584
11700
11841
12004
12188
12373
12553
12741
12928
13160
difference
(10)
0
(0)
(0)
(0)
(0)
(0)
0
(0)
0
sales
10954
11076
11213
11370
11546
11724
11898
12077
12257
12476
losses
57
56
56
56
56
55
55
55
55
55
With DSM
Thermal Unit Fuel Cost wDSM
223705664
223742320
198714736
198689904
191639104
196037824
207153584
205853888
223553008
245383552
Short-Term Power Purchases
5000000
- 0
17339160
16429042
16415314
16614357
11144008
17017280
11632503
11967200
Average cost per kWh
$ 0023361
$ 0022623
$ 0022099
$ 0021789
$ 0021523
$ 0021608
$ 0022426
$ 0022607
$ 0024046
$ 0025590
Forecast Annual GWh Sales
10954
11076
11213
11370
11546
11724
11898
12077
12257
12476
255897742
250575183
247791207
247738881
248503713
253336056
266823817
273028794
294725795
319266462
CASH FLOW PURCHASE OPTION
2005
2006
2007
2008
2009
2010
2011
2012
2013
2014
2015
Base revenue reduction
4125638
7592320
11812895
16167619
20328524
24769904
29155510
33338091
37691451
42141405
46445908
Fuel cost reduction
5166240
8956848
13238528
14683328
16859440
20212576
24919120
30094336
34616096
40546848
47845120
Potential off-system sales margins
2767500
5737500
8707500
Capacity cost reduction
12000000
15000000
18000000
21000000
24000000
27000000
30000000
33000000
GFT reduction
845561
660413
773705
527757
576669
709301
827386
851560
807636
944644
1055853
845560920627699
Program cost
20689324
22819634
22819634
22819634
22819634
22819634
22819634
22819634
22819634
22819634
22819634
Recovery through base rates
14405492
14639186
14799075
14977916
15183688
15416391
15650684
15878624
16115254
16352636
16645725
Cash flow
-6796409
-9374854
-10352249
-23481580
-27387801
-31463846
-35497075
-39427542
-43588195
-47663759
-51563965
2005
2006
2007
2008
2009
2010
2011
2012
2013
2014
2015
Base Revenue Reduction
$ (4125638)
$ (7592320)
$ (11812895)
$ (16167619)
$ (20328524)
$ (24769904)
$ (29155510)
$ (33338091)
$ (37691451)
$ (42141405)
$ (46445908)
Fuel Revenue Reduction
$ (5166240)
$ (8956848)
$ (13238528)
$ (26683328)
$ (31859440)
$ (38212576)
$ (45919120)
$ (54094336)
$ (61616096)
$ (70546848)
$ (80845120)
Fuel Cost Reduction
$ 5166240
$ 8956848
$ 13238528
$ 26683328
$ 31859440
$ 38212576
$ 45919120
$ 54094336
$ 61616096
$ 70546848
$ 80845120
Potential off-system sales margins
$ 2767500
$ 5737500
$ 8707500
$ - 0
$ - 0
$ - 0
$ - 0
$ - 0
$ - 0
$ - 0
$ - 0
Net program costs
$ (5438271)
$ (7520034)
$ (7246854)
$ (7313961)
$ (7059277)
$ (6693942)
$ (6341565)
$ (6089451)
$ (5896744)
$ (5522354)
$ (5118057)
AEs net cash impact
$ (6796409)
$ (9374854)
$ (10352249)
$ (23481580)
$ (27387801)
$ (31463846)
$ (35497075)
$ (39427542)
$ (43588195)
$ (47663759)
$ (51563965)
Customer savings
$ 9291878
$ 16549168
$ 25051423
$ 42850947
$ 52187964
$ 62982480
$ 75074630
$ 87432427
$ 99307547
$ 112688253
$ 127291028
CASH FLOW BUILD OPTION
2005
2006
2007
2008
2009
2010
2011
2012
2013
2014
2015
Base revenue reduction
4125638
7592320
11812895
16167619
20328524
24769904
29155510
33338091
37691451
42141405
46445908
Fuel cost reduction
5166240
8956848
13238528
14683328
16859440
20212576
24919120
30094336
34616096
40546848
47845120
Potential off-system sales margins
2767500
5737500
8707500
Capacity cost reduction
7736295
11604442
11604442
15472589
15472589
19340737
19340737
23208884
GFT reduction
845561
660413
773705
527757
576669
709301
827386
851560
807636
944644
1055853
Program cost
20689324
22819634
22819634
22819634
22819634
22819634
22819634
22819634
22819634
22819634
22819634
Recovery through base rates
14405492
14639186
14799075
14977916
15183688
15416391
15650684
15878624
16115254
16352636
16645725
Cash flow
-6796409
-9374854
-10352249
-15745285
-15783359
-19859404
-20024486
-23954952
-24247459
-28323022
-28355080
-21195738994
Capacity cost Build option
Reduced capacity requirement (kW)
46125
95625
145125
194625
243000
292500
339750
385875
430875
477000
523125
Capacity added
200
300
300
400
400
500
500
600
Annual capacity cost
$386814737
$7736295
$11604442
$11604442
$15472589
$15472589
$19340737
$19340737
$23208884
Capacity cost Buy option
Reduced capacity requirement (kW)
46125
95625
145125
194625
243000
292500
339750
385875
430875
477000
523125
Capacity added
200
250
300
350
400
450
500
550
Annual capacity cost
$600000000
$12000000
$15000000
$18000000
$21000000
$24000000
$27000000
$30000000
$33000000
1994
2004
2005
2006
2007
2008
2009
2010
2011
2012
2013
2014
2015
Net MWh to system
7659242
10855000
11388814
11573570
11699976
11841366
12004047
12188019
12373248
12553455
12740532
12928203
13159916
Revenue multiplier
100
142
149
151
153
155
157
159
162
164
166
169
172
Revenue allocated to DSM
9688028
13730281
14405492
14639186
14799075
14977916
15183688
15416391
15650684
15878624
16115254
16352636
16645725
CentskWh in rates for DSM
0134
0134
0134
0134
0134
0134
0134
0133
0133
0133
0133
0133
Annual sales (MWh)
10262000
10776303
10954134
11076488
11213088
11369667
11546488
11724454
11897588
12077216
12256861
12476492
2006
2006
2007
2007
2008
2008
2009
2009
2010
2010
2011
2011
2012
2012
2013
2013
2014
2014
2015
2015
2005
2005
2005
2006
2006
2006
2007
2007
2007
2008
2008
2008
2009
2009
2009
2010
2010
2010
2011
2011
2011
2012
2012
2012
2013
2013
2013
2014
2014
2014
2015
2015
2015
2005
2006
2007
2008
2009
2010
2011
2012
2013
2014
2015
Base Revenue Reduction
$ (4125638)
$ (7592320)
$ (11812895)
$ (16167619)
$ (20328524)
$ (24769904)
$ (29155510)
$ (33338091)
$ (37691451)
$ (42141405)
$ (46445908)
Fuel Revenue Reduction
$ (5166240)
$ (8956848)
$ (13238528)
$ (26683328)
$ (31859440)
$ (38212576)
$ (45919120)
$ (54094336)
$ (61616096)
$ (70546848)
$ (80845120)
Fuel Cost Reduction
$ 5166240
$ 8956848
$ 13238528
$ 26683328
$ 31859440
$ 38212576
$ 45919120
$ 54094336
$ 61616096
$ 70546848
$ 80845120
Potential off-system sales margins
$ 2767500
$ 5737500
$ 8707500
$ - 0
$ - 0
$ - 0
$ - 0
$ - 0
$ - 0
$ - 0
$ - 0
Net program costs
$ (5438271)
$ (7520034)
$ (7246854)
$ (7313961)
$ (7059277)
$ (6693942)
$ (6341565)
$ (6089451)
$ (5896744)
$ (5522354)
$ (5118057)
AEs net cash impact
$ (6796409)
$ (9374854)
$ (10352249)
$ (23481580)
$ (27387801)
$ (31463846)
$ (35497075)
$ (39427542)
$ (43588195)
$ (47663759)
$ (51563965)
Customer savings
$ (9291878)
$ (16549168)
$ (25051423)
$ (42850947)
$ (52187964)
$ (62982480)
$ (75074630)
$ (87432427)
$ (99307547)
$ (112688253)
$ (127291028)
Estimated Annual Impact
Base Revenue Reduction
$ (16134252)
Fuel Revenue Reduction
$ (23790144)
Fuel Cost Reduction
$ 23790144
Potential off-system sales margins
$ 2889000
Net program costs
$ (7166814)
AEs net cash impact
$ (20412066)
Customer savings
$ (39924396)
CURRENT FORECAST
PROPOSED PROJECTION
DSM Analysis
2007
2008
2007
2008
keyed in to round
Base Revenue Reduction
(12000000)
(16000000)
(12000000)
(16000000)
Fuel Revenue Reduction
(13000000)
(15000000)
(5000000)
(7000000)
Customer Savings (Bill Reduction)
(25000000)
(31000000)
(17000000)
(23000000)
Fuel Cost Reduction
13000000
15000000
5000000
7000000
KW
$KW
NET
5 profit
Potential Off-system Capacity Sales
9000000
9000000
6207
$KW
145000
$ 62
$ 8990000
Net of fuel and GFT
$ 449500
TCOS Expense Reduction
900000
1000000
900000
1000000
GFT Reduction
2000000
3000000
2000000
3000000
Program Cost
(23000000)
(23000000)
Recovery through Base Rates
15000000
15000000
AEs Net Income Impact
(8100000)
(20000000)
(17100000)
(35000000)
Deferred Cost of Capacity
12000000
- 0
AEs Net Cash Impact
(8100000)
(8000000)
(17100000)
- 0
Outline for Oct 10 Leadership Team Update
1 Components of BenefitCost Ratios
2 Cash Flow of DSM
CURRENT FORECAST
PROPOSED PROJECTION
DSM Analysis
2007
2008
2007
2008
Base Revenue Reduction
(11812895)
(16167619)
(11812895)
(16167619)
Fuel Revenue Reduction
(13238528)
(14683328)
(5217969)
(5396810)
Fuel Cost Reduction
13238528
14683328
5217969
5396810
Potential off-system sales margins
8707500
8707500
Fuel Revenue Increase-Capacity
12000000
12000000
Fuel Cost Increase-Capacity
(12000000)
(12000000)
TCOS expense reduction
925987
977987
925987
977987
GFT reduction
2279680
2807436
2279680
2807436
Program cost
(22819634)
(22819634)
Recovery through base rates
14799075
14977916
AEs net income impact
(7920288)
(20223914)
100271
(12382196)
Deferred Cost of Capacity
12000000
12000000
AEs net cash impact including deferral
(7920288)
(8223914)
100271
(382196)
Customer savings-(net)
$ (25051423)
$ (30850947)
$ (17030864)
$ (21564429)
Recommend recovery thru fuel factor
Offset customer fuel savings due to DSM
Would not offset revenue loss
(before amp after)
In 2007 we still have excess capacity
Cost recovery
3yrs - recommended purch power
power is only needed during peak-dont utilize a plant
need declines as renewables increases
cash flow
Dynamic pricing-TOU rates motivating cust to conserve energy
would replace some of the energy efficiency rebates
option to self-generate
TCOS expense reduction due to DSM savings
Historical
Historical
Historical
Historical
Historical
Preliminary
Forecast
Forecast
Forecast
Forecast
Forecast
Forecast
Forecast
Forecast
Forecast
Forecast
2000
2001
2002
2003
2004
2005
2006
2007
2008
2009
2010
2011
2012
2013
2014
2015
ERCOT Postage Stamp Rate
1476
1528
1661
1778
1925
2055
2185
2315
2445
2575
2705
2835
2965
3095
3225
3355
Estimated DSM-kW savings applied to average 4CP
40000
40000
40000
40000
40000
40000
40000
40000
40000
40000
40000
Reduction to TCOS expense
$ 821987
$ 873987
$ 925987
$ 977987
$ 1029987
$ 1081987
$ 1133987
$ 1185987
$ 1237987
$ 1289987
$ 1341987
2005
2006
2007
2008
2009
2010
2011
2012
2013
2014
2015
Base revenue reduction
4125638
7592320
11812895
16167619
20328524
24769904
29155510
33338091
37691451
42141405
46445908
kWh reduction
84784000
155505000
242622000
331500000
417534000
508229000
598986000
684617000
774196000
865119000
953353000
Fuel cost reduction
5166240
8956848
13238528
14683328
16859440
20212576
24919120
30094336
34616096
40546848
47845120
Demand reduction (kW)
41000
85000
129000
173000
216000
260000
302000
343000
383000
424000
465000
Reduced reserve requirement (kW)
5125
10625
16125
21625
27000
32500
37750
42875
47875
53000
58125
2008
2009
2010
2011
2012
2013
2014
2015
Reduced capacity requirement (kW)
46125
95625
145125
194625
243000
292500
339750
385875
430875
477000
523125
194625
243000
292500
339750
385875
430875
477000
523125
Increased off-system sales margins
2767500
5737500
8707500
Capacity cost reduction
11677500
14580000
17550000
20385000
23152500
25852500
28620000
31387500
Fuel Factor expense decrease ($)
5166240
8956848
13238528
26360828
31439440
37762576
45304120
53246836
60468596
69166848
79232620
Fuel Factor decrease (centskWh)
00005
00007
00016
00019
00022
00026
00030
00033
00037
00041
Fuel Factor decrease
2
3
7
9
10
12
13
15
15
16
GFT reduction
845561
1505974
2279680
2807436
3384105
4093406
4920791
5772351
6579987
7524631
8580484
Program cost
20689324
22819634
22819634
22819634
22819634
22819634
22819634
22819634
22819634
22819634
22819634
Recovery through base rates
14405492
14639186
14799075
14977916
15183688
15416391
15650684
15878624
16115254
16352636
16645725
Cash flow
-7641970
-10035268
-11125954
-12331837
-13384470
-14623147
-15939461
-17126601
-18543331
-19988403
-21232317
Fuel cost savings assume all saved energy at average gas generation cost
Increased off-system sales margins assumes reduced demand plus associated reserve requirements could be sold for $15kWmonth (after 2007 this is an avoided capacity expense)
Fuel Factor expense increase is increased fuel expense plus purchased capacity cost
GFT reduction is base revenue and fuel cost reductions times 91
Base revenue wDSM
552961968
562415810
569170954
576627290
585065115
594497922
604045383
613657938
623249716
632762255
644233714
Base revenue wo DSM
557087606
570008130
580983849
592794909
605393639
619267826
633200893
646996029
660941168
674903660
690679622
kWh sales wDSM
10776303000
10954134000
11076488000
11213088000
11369667000
11546488000
11724454000
11897588000
12077216000
12256861000
12476492000
kWh sales wo DSM
10861087000
11109639000
11319110000
11544588000
11787201000
12054717000
12323440000
12582205000
12851412000
13121980000
13429845000
1000
kW sales wDSM
2435000
2442000
2443000
2471000
2477000
2486000
2486000
2490000
2515000
2535000
2539000
kW sales wo DSM
2476000
2527000
2572000
2644000
2693000
2746000
2788000
2833000
2898000
2959000
3004000
Fuel Forecast
Budget 2006 (3905)
Tot-2006
Tot-2007
Tot-2008
Tot-2009
Tot-2010
Tot-2011
Tot-2012
Tot-2013
Tot-2014
Tot-2015
Total
MWH
STP
3303339
3488217
3514415
3360759
3465191
3507755
3405921
3614690
3482746
3515635
34658668
FPP
4564135
4517773
4465943
4451812
4418334
4545733
4554494
4586879
4445603
4245674
44796380
Decker
2839387
511212
504648
615748
583574
563845
570235
550098
594337
757598
8090682
Holly
235228
28425
- 0
- 0
- 0
- 0
- 0
- 0
- 0
263653
Sand Hill CC
1533962
1538343
1565132
1615597
1553452
1600111
1516183
1666799
1687122
14276700
SH GT
465155
427320
523864
450359
458722
498276
432337
492003
574949
4322986
Decker GT
157126
216800
280985
238803
246172
264900
238141
266139
294200
2203267
Existing DG
17340
7248
7296
7065
7216
7268
7168
7137
7147
16838
91723
Future DG
110
110
101
2216
2659
4743
5273
7365
7750
17746
48073
PurchasePower
131996
- 0
204000
208800
206400
206400
134400
201600
136000
139200
1568796
Landfill Methane
87493
92450
92704
92450
92450
92450
92704
92450
92450
92450
920052
Future Bioenergy
- 0
- 0
134151
178705
384764
454206
673445
744600
978509
1057336
4605716
Wind
636291
669050
671181
669050
669050
669050
671181
669050
669050
669050
6662004
Solar
684
20026
32685
41438
50311
59183
68298
76929
85801
87839
523193
Shortfall Energy
3308
2419
3355
6021
3311
4269
7050
3075
3868
4281
40957
11584082
11699976
11841366
12004048
12188020
12373249
12553456
12740532
12928204
13159918
123072851
(10512)
(1)
(1)
0
0
(0)
1
1
(0)
0
(10505)
Dollars
STP
14024307
16411783
18054617
17815007
18997196
19874461
19872833
21713134
21541492
22417754
190722584
FPP
47959978
48327184
52942730
56530034
57287196
60262126
61527986
62666810
62927556
61809806
572241406
Decker
161242451
30007075
26150797
28534975
26297430
25902979
27510734
27253106
30904024
41053837
424857407
Holly
15649395
1939153
- 0
- 0
- 0
- 0
- 0
- 0
- 0
17588548
Sand Hill CC
71819840
62147912
53829988
54696364
53773560
56880544
56723452
64324432
66378796
540574888
SH GT
28915407
23018682
25201605
20614580
21546020
24873781
22042049
25993318
31798432
224003872
Decker GT
12129491
14068039
16315347
13248144
14062711
15831205
14654486
17002591
19718490
137030504
Existing DG
1066126
482134
392821
350785
361063
372817
379318
391499
407877
1055934
5260373
Future DG
5688
5352
3321
115774
140956
247241
281454
413559
455875
1154808
2824028
PurchasePower
5000000
- 0
17339160
16429042
16415314
16614357
11144008
17017280
11632503
11967200
123558864
Landfill Methane
3535734
3653844
3663855
3653844
3653844
3653844
3663855
3653844
3653844
3653844
36440353
Future Bioenergy
- 0
- 0
6036769
8041681
17314398
20439270
30305016
33507000
44032792
47579944
207256869
Wind
17374835
18256537
18314921
18256537
18256537
18256537
18314921
18256537
18256537
18256537
181800436
Solar
- 0
- 0
- 0
- 0
- 0
- 0
- 0
- 0
- 0
- 0
- 0
Shortfall Energy
248086
181420
251636
451599
248349
320172
528742
230590
290120
321058
3071771
250457205
245839462
244324412
245526217
247531370
255326093
271114397
278523346
301422961
327166440
2667231902
1792964
10
(12)
6
(1)
10
(27)
4
3
(6)
1793341
Gas MWh
2839387
2902683
2715536
2985730
2888333
2822192
2933522
2736759
3019278
3313869
29157288
Gas cost ($)
161242451
158521208
127324584
123881915
114856517
115285269
125096264
120673092
138224364
158949555
1344055218
Avg gas gen Cost ($MWh)
5679
5461
4689
4149
3977
4085
4264
4409
4578
4796
4610
NO DSM FUEL FACTOR
2006
2007
2008
2009
2010
2011
2012
2013
2014
2015
Thermal Unit Fuel Cost
232662512
236980848
213398064
215549344
211851680
220956944
237247920
240469984
264099856
293228672
Shortfall Purchases
248086
181420
251636
451599
248349
320172
528742
230590
290120
321058
Short-Term Power Purchases
5000000
- 0
29016660
31009042
33965314
36999357
34296508
42869780
40252503
43354700
Fuel Cell Gas Cost
119837
119837
119837
119837
119837
119837
119837
119837
119837
119837
Recoverable ERCOT Expenses
16825273
16825273
16825273
16825273
16825273
16825273
16825273
16825273
16825273
16825273
Fuel Factor Renewables
9998882
9706333
14540565
15223226
23255836
23418594
31052373
32981926
42305054
44649542
Total Fuel Factor Revenue
264854590
263813711
274152035
279178321
286266289
298640176
320070653
333497390
363892643
398499082
Total Renewables
20910569
21910381
28015544
29952062
39224779
42349651
52283792
55417381
65943173
69490325
TotThermal+PurchPwr+Renewables
249864319
245834121
244321076
245522607
247527546
255322004
271110126
278519139
301418805
327162135
Estimated Green Choice Sales
10911686
12204048
13474979
14728836
15968943
18931058
21231418
22435455
23638119
24840783
Fuel Factor Renewables
9998882
9706333
14540565
15223226
23255836
23418594
31052373
32981926
42305054
44649542
Forecast Annual GWh Sales
11110
11319
11545
11787
12055
12323
12582
12851
13122
13430
Average cost per kWh
$ 0023840
$ 0023307
$ 0023747
$ 0023685
$ 0023747
$ 0024234
$ 0025438
$ 0025950
$ 0027732
$ 0029673
Fuel Factors
Secondary
$ 0023475
$ 0022733
$ 0022206
$ 0021895
$ 0021627
$ 0021713
$ 0022535
$ 0022717
$ 0024162
$ 0025715
Primary
$ 0022776
$ 0022056
$ 0021545
$ 0021243
$ 0020984
$ 0021067
$ 0021864
$ 0022041
$ 0023443
$ 0024949
Transmission
$ 0022539
$ 0021828
$ 0021321
$ 0021022
$ 0020766
$ 0020848
$ 0021637
$ 0021812
$ 0023200
$ 0024690
2006
2007
2008
2009
2010
2011
2012
2013
2014
2015
Dag generation
11574
11700
11841
12004
12188
12373
12553
12741
12928
13160
Joe generation
11584
11700
11841
12004
12188
12373
12553
12741
12928
13160
difference
(10)
0
(0)
(0)
(0)
(0)
(0)
0
(0)
0
sales
10954
11076
11213
11370
11546
11724
11898
12077
12257
12476
losses
57
56
56
56
56
55
55
55
55
55
With DSM
Thermal Unit Fuel Cost wDSM
223705664
223742320
198714736
198689904
191639104
196037824
207153584
205853888
223553008
245383552
Short-Term Power Purchases
5000000
- 0
17339160
16429042
16415314
16614357
11144008
17017280
11632503
11967200
Average cost per kWh
$ 0023361
$ 0022623
$ 0022099
$ 0021789
$ 0021523
$ 0021608
$ 0022426
$ 0022607
$ 0024046
$ 0025590
Forecast Annual GWh Sales
10954
11076
11213
11370
11546
11724
11898
12077
12257
12476
255897742
250575183
247791207
247738881
248503713
253336056
266823817
273028794
294725795
319266462
CASH FLOW PURCHASE OPTION
2005
2006
2007
2008
2009
2010
2011
2012
2013
2014
2015
Base revenue reduction
4125638
7592320
11812895
16167619
20328524
24769904
29155510
33338091
37691451
42141405
46445908
Fuel cost reduction
5166240
8956848
13238528
14683328
16859440
20212576
24919120
30094336
34616096
40546848
47845120
Potential off-system sales margins
2767500
5737500
8707500
Capacity cost reduction
12000000
15000000
18000000
21000000
24000000
27000000
30000000
33000000
GFT reduction
845561
660413
773705
527757
576669
709301
827386
851560
807636
944644
1055853
845560920627699
Program cost
20689324
22819634
22819634
22819634
22819634
22819634
22819634
22819634
22819634
22819634
22819634
Recovery through base rates
14405492
14639186
14799075
14977916
15183688
15416391
15650684
15878624
16115254
16352636
16645725
Cash flow
-6796409
-9374854
-10352249
-23481580
-27387801
-31463846
-35497075
-39427542
-43588195
-47663759
-51563965
2005
2006
2007
2008
2009
2010
2011
2012
2013
2014
2015
Base Revenue Reduction
$ (4125638)
$ (7592320)
$ (11812895)
$ (16167619)
$ (20328524)
$ (24769904)
$ (29155510)
$ (33338091)
$ (37691451)
$ (42141405)
$ (46445908)
Fuel Revenue Reduction
$ (5166240)
$ (8956848)
$ (13238528)
$ (26683328)
$ (31859440)
$ (38212576)
$ (45919120)
$ (54094336)
$ (61616096)
$ (70546848)
$ (80845120)
Fuel Cost Reduction
$ 5166240
$ 8956848
$ 13238528
$ 26683328
$ 31859440
$ 38212576
$ 45919120
$ 54094336
$ 61616096
$ 70546848
$ 80845120
Potential off-system sales margins
$ 2767500
$ 5737500
$ 8707500
$ - 0
$ - 0
$ - 0
$ - 0
$ - 0
$ - 0
$ - 0
$ - 0
Net program costs
$ (5438271)
$ (7520034)
$ (7246854)
$ (7313961)
$ (7059277)
$ (6693942)
$ (6341565)
$ (6089451)
$ (5896744)
$ (5522354)
$ (5118057)
AEs net cash impact
$ (6796409)
$ (9374854)
$ (10352249)
$ (23481580)
$ (27387801)
$ (31463846)
$ (35497075)
$ (39427542)
$ (43588195)
$ (47663759)
$ (51563965)
Customer savings
$ 9291878
$ 16549168
$ 25051423
$ 42850947
$ 52187964
$ 62982480
$ 75074630
$ 87432427
$ 99307547
$ 112688253
$ 127291028
CASH FLOW BUILD OPTION
2005
2006
2007
2008
2009
2010
2011
2012
2013
2014
2015
Base revenue reduction
4125638
7592320
11812895
16167619
20328524
24769904
29155510
33338091
37691451
42141405
46445908
Fuel cost reduction
5166240
8956848
13238528
14683328
16859440
20212576
24919120
30094336
34616096
40546848
47845120
Potential off-system sales margins
2767500
5737500
8707500
Capacity cost reduction
7736295
11604442
11604442
15472589
15472589
19340737
19340737
23208884
GFT reduction
845561
660413
773705
527757
576669
709301
827386
851560
807636
944644
1055853
Program cost
20689324
22819634
22819634
22819634
22819634
22819634
22819634
22819634
22819634
22819634
22819634
Recovery through base rates
14405492
14639186
14799075
14977916
15183688
15416391
15650684
15878624
16115254
16352636
16645725
Cash flow
-6796409
-9374854
-10352249
-15745285
-15783359
-19859404
-20024486
-23954952
-24247459
-28323022
-28355080
-21195738994
Capacity cost Build option
Reduced capacity requirement (kW)
46125
95625
145125
194625
243000
292500
339750
385875
430875
477000
523125
Capacity added
200
300
300
400
400
500
500
600
Annual capacity cost
$386814737
$7736295
$11604442
$11604442
$15472589
$15472589
$19340737
$19340737
$23208884
Capacity cost Buy option
Reduced capacity requirement (kW)
46125
95625
145125
194625
243000
292500
339750
385875
430875
477000
523125
Capacity added
200
250
300
350
400
450
500
550
Annual capacity cost
$600000000
$12000000
$15000000
$18000000
$21000000
$24000000
$27000000
$30000000
$33000000
1994
2004
2005
2006
2007
2008
2009
2010
2011
2012
2013
2014
2015
Net MWh to system
7659242
10855000
11388814
11573570
11699976
11841366
12004047
12188019
12373248
12553455
12740532
12928203
13159916
Revenue multiplier
100
142
149
151
153
155
157
159
162
164
166
169
172
Revenue allocated to DSM
9688028
13730281
14405492
14639186
14799075
14977916
15183688
15416391
15650684
15878624
16115254
16352636
16645725
CentskWh in rates for DSM
0134
0134
0134
0134
0134
0134
0134
0133
0133
0133
0133
0133
Annual sales (MWh)
10262000
10776303
10954134
11076488
11213088
11369667
11546488
11724454
11897588
12077216
12256861
12476492
2006
2006
2007
2007
2008
2008
2009
2009
2010
2010
2011
2011
2012
2012
2013
2013
2014
2014
2015
2015
2005
2005
2005
2006
2006
2006
2007
2007
2007
2008
2008
2008
2009
2009
2009
2010
2010
2010
2011
2011
2011
2012
2012
2012
2013
2013
2013
2014
2014
2014
2015
2015
2015
2005
2006
2007
2008
2009
2010
2011
2012
2013
2014
2015
Base Revenue Reduction
$ (4125638)
$ (7592320)
$ (11812895)
$ (16167619)
$ (20328524)
$ (24769904)
$ (29155510)
$ (33338091)
$ (37691451)
$ (42141405)
$ (46445908)
Fuel Revenue Reduction
$ (5166240)
$ (8956848)
$ (13238528)
$ (26683328)
$ (31859440)
$ (38212576)
$ (45919120)
$ (54094336)
$ (61616096)
$ (70546848)
$ (80845120)
Fuel Cost Reduction
$ 5166240
$ 8956848
$ 13238528
$ 26683328
$ 31859440
$ 38212576
$ 45919120
$ 54094336
$ 61616096
$ 70546848
$ 80845120
Potential off-system sales margins
$ 2767500
$ 5737500
$ 8707500
$ - 0
$ - 0
$ - 0
$ - 0
$ - 0
$ - 0
$ - 0
$ - 0
Net program costs
$ (5438271)
$ (7520034)
$ (7246854)
$ (7313961)
$ (7059277)
$ (6693942)
$ (6341565)
$ (6089451)
$ (5896744)
$ (5522354)
$ (5118057)
AEs net cash impact
$ (6796409)
$ (9374854)
$ (10352249)
$ (23481580)
$ (27387801)
$ (31463846)
$ (35497075)
$ (39427542)
$ (43588195)
$ (47663759)
$ (51563965)
Customer savings
$ (9291878)
$ (16549168)
$ (25051423)
$ (42850947)
$ (52187964)
$ (62982480)
$ (75074630)
$ (87432427)
$ (99307547)
$ (112688253)
$ (127291028)
Estimated Annual Impact
Base Revenue Reduction
$ (16134252)
Fuel Revenue Reduction
$ (23790144)
Fuel Cost Reduction
$ 23790144
Potential off-system sales margins
$ 2889000
Net program costs
$ (7166814)
AEs net cash impact
$ (20412066)
Customer savings
$ (39924396)
CURRENT FORECAST
PROPOSED PROJECTION
DSM Analysis
2007
2008
2007
2008
keyed in to round
Base Revenue Reduction
(12000000)
(16000000)
(12000000)
(16000000)
Fuel Revenue Reduction
(13000000)
(15000000)
(5000000)
(7000000)
Fuel Cost Reduction
13000000
15000000
5000000
7000000
KW
$KW
NET
5 profit
Potential off-system capacity sales
9000000
9000000
6207
$KW
145000
$ 62
$ 8990000
Net of fuel and GFT
$ 449500
Fuel Revenue Increase-Capacity
12000000
12000000
6154
$KW
195000
$ 62
$ 12090000
Fuel Cost Increase-Capacity
(12000000)
(12000000)
TCOS expense reduction
900000
1000000
900000
1000000
GFT reduction
2000000
3000000
2000000
3000000
Program cost
(23000000)
(23000000)
Recovery through base rates
15000000
15000000
AEs net income impact
(8100000)
(20000000)
(100000)
(12000000)
Deferred Cost of Capacity
12000000
12000000
AEs net cash impact
(8100000)
(8000000)
(100000)
- 0
Customer savings-(net)
$ (25000000)
$ (31000000)
$ (17000000)
$ (35000000)
Outline for Oct 10 Leadership Team Update
1 Components of BenefitCost Ratios
2 Cash Flow of DSM
CURRENT FORECAST
PROPOSED PROJECTION
DSM Analysis
2007
2008
2007
2008
Base Revenue Reduction
(11812895)
(16167619)
(11812895)
(16167619)
Fuel Revenue Reduction
(13238528)
(14683328)
(5217969)
(5396810)
Fuel Cost Reduction
13238528
14683328
5217969
5396810
Potential off-system sales margins
8707500
8707500
Fuel Revenue Increase-Capacity
12000000
12000000
Fuel Cost Increase-Capacity
(12000000)
(12000000)
TCOS expense reduction
925987
977987
925987
977987
GFT reduction
2279680
2807436
2279680
2807436
Program cost
(22819634)
(22819634)
Recovery through base rates
14799075
14977916
AEs net income impact
(7920288)
(20223914)
100271
(12382196)
Deferred Cost of Capacity
12000000
12000000
AEs net cash impact including deferral
(7920288)
(8223914)
100271
(382196)
Customer savings-(net)
$ (25051423)
$ (30850947)
$ (17030864)
$ (33564429)
Recommend recovery thru fuel factor
Offset customer fuel savings due to DSM
Would not offset revenue loss
(before amp after)
In 2007 we still have excess capacity
Cost recovery
3yrs - recommended purch power
power is only needed during peak-dont utilize a plant
need declines as renewables increases
cash flow
Dynamic pricing-TOU rates motivating cust to conserve energy
would replace some of the energy efficiency rebates
Resolution September 14 1999ldquoCost-effective conservation programs shall be the first priority in meeting new load growth requirements of Austin Energy rdquo
Clean Energy Resolution August 28 2003hellip Austin Energy Strategic Plan to ensure Austin remains a national and international leader in the development and use of clean energy
Saving Energy TogetherPower SaverTM Program
Austin Climate Protection Plan Will make Austin the national leader among
cities in the fight against global warming
Saving Energy TogetherPower SaverTM Program
Efficiency amp Renewables GoalEnergy Efficiency is first priority
ndash 15 energy savings by 2020ndash 700 MWs of peak demand savings by 2020
Renewable Energy Goalndash 30 Renewable Energy by 2020ndash 100 MWs of Solar by 2020
Saving Energy TogetherPower SaverTM Program
Promoting Energy Efficiencybull Cash rebates pay 20 ndash 30 of cost bull Up to 70 incentives for Small Businessbull Direct install measuresbull Free home and business energy auditsbull Low-income Free Weatherizationbull Public education amp outreach efforts
Saving Energy TogetherPower SaverTM Program
Top 100 MW is used 43 hrs per year
DSM OpportunityAE System Load Duration Curve - 2006
MW
s G
ener
ated
Hours (8760)
Saving Energy TogetherPower SaverTM Program
Peak ClippingStrategic
Conservation Load Shifting
Energy Use Modification
Saving Energy TogetherPower SaverTM Program
Peak Clipping Power Saver Programs
AC Cycling
WH Cycling
Demand Response
Volunteers
Peak Clipping Strategy
Represent 36 of new DSM program mix
Saving Energy TogetherPower SaverTM Program
Total Home EfficiencySmall Business EfficiencyGreen Building Program
bull ARI American Refrigeration Institutebull ANSI American National Standards Institutebull IESNA Illuminating Engineering Society of North Americabull NEMA National Electrical Manufacturerrsquos Associationbull ASTM American Society of Testing and Measurements
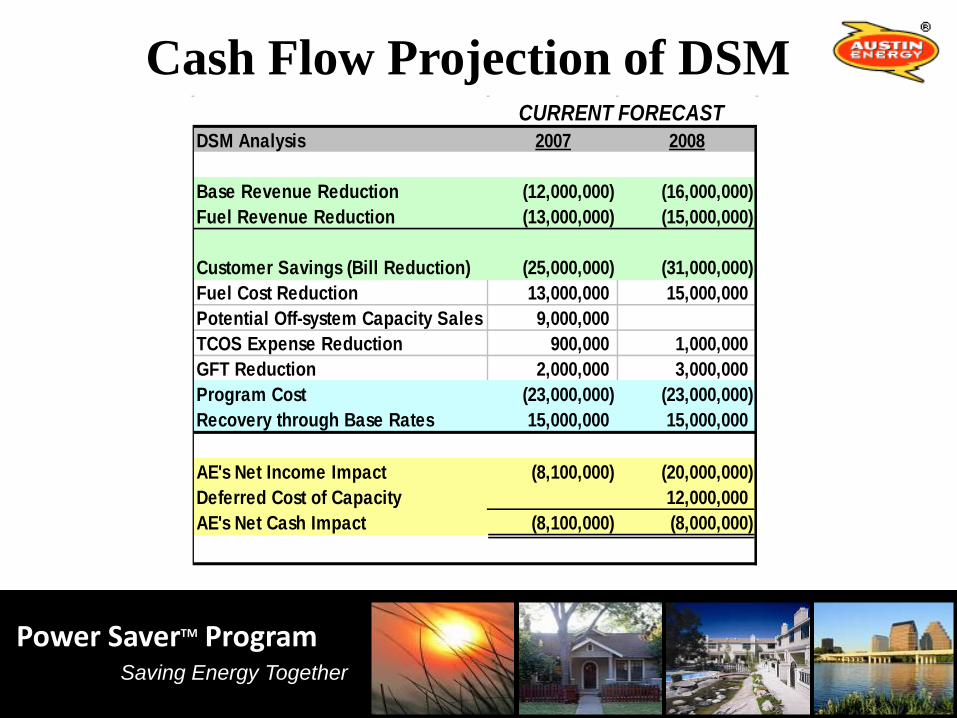
AEs Net Income Impact (8100000) (20000000) Deferred Cost of Capacity 12000000 AEs Net Cash Impact (8100000) (8000000)
CURRENT FORECAST
Cash Flow Projection of DSM
Cash flow chart
Chart1
Fuel Cost Reduction
Capacity Expense Reduction
Total Decrease In Expenses
REDUCTION IN EXPENSES DUE TO DSM PROGRAMS
5166240
5166240
8956848
8956848
13238528
13238528
14683328
26360828
11677500
16859440
31439440
14580000
20212576
37762576
17550000
24919120
45304120
20385000
30094336
53246836
23152500
34616096
60468596
25852500
40546848
69166848
28620000
47845120
79232620
31387500
Chart4
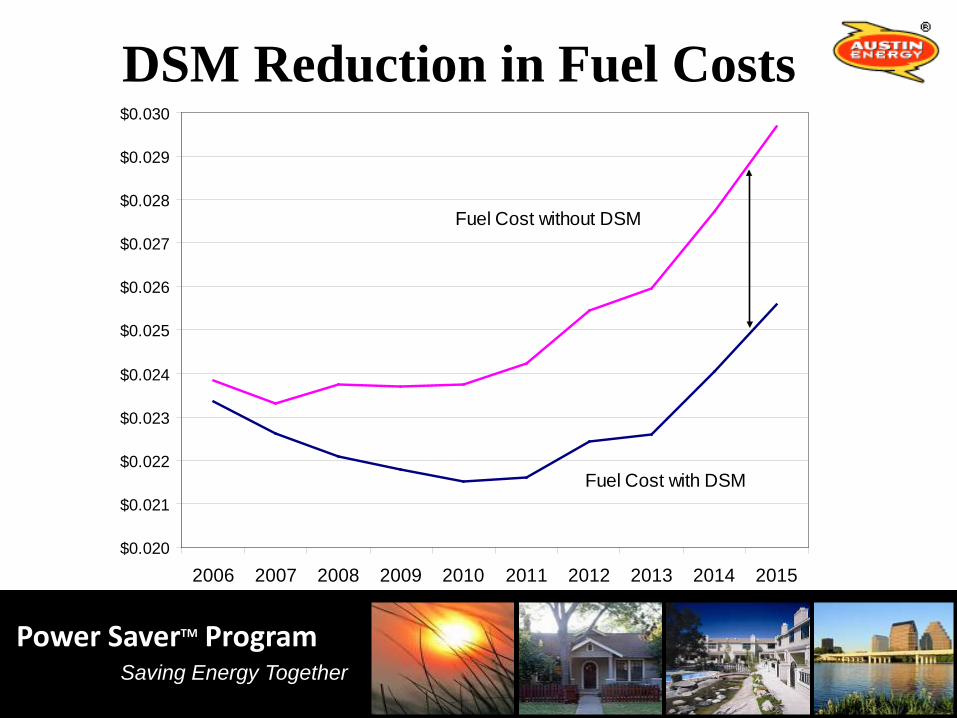
Fuel Cost without DSM
Fuel Cost with DSM
REDUCTION IN FUEL COST DUE TO DSM PROGRAMS
00233611231
00238400717
00226232559
00233069306
00220985648
00237472342
00217888198
00236848698
00215229268
00237472426
00216083296
00242335075
00224259386
00254383594
00226073357
00259502528
00240455083
00277315347
00255904506
00296726494
Sheet1
Sheet3
Saving Energy TogetherPower SaverTM Program
Questions
Saving Energy TogetherPower SaverTM Program
FY 2006 Achievements
Energy SavingsMW of
Programs Saved Goal Goal
Residential 126 115 110
Commercial 154 121 127
Demand Response 146 156 94
Solar 055 060 93
Grand Total 432 398 108
Saving Energy TogetherPower SaverTM Program
MW SavedPrograms FY2005 FY2006
Residential 119 126
Commercial 153 154
Demand Response 116 146
Solar 06 055
Grand Total 394 432
Energy Savings ComparisonFY2005 to FY2006
Saving Energy TogetherPower SaverTM Program
DSM Summary
bull DSM programs are saving peak kW amp kWh
bull Cost-effectiveness analyses include full program costs
bull DSM goals and budgets should vary to support AE resource plan requirements
Saving Energy TogetherPower SaverTM Program
Free Home WeatherizationEnergy Improvementsbull Insulate Atticsbull Duct Sealingbull Install CFLsbull Solar Screensbull Caulking and Weather-strippingbull Free Smoke amp Carbon Monoxide Detector bull Minor Energy Related Repairs
Saving Energy TogetherPower SaverTM Program
Power Saver Program
bull FREE Energy Saving Productsbull Lower energy costsbull 65000 installed in homes apartmentsbull 4000 installed in commercial buildings
Saving Energy TogetherPower SaverTM Program
Energy Conservation in COA FacilitiesSenate Bill 5 Energy Use vs Energy Cost
295
300
305
310
315
320
325
330
335
340
345
350
Base Year2001
2002 2003 2004 2005 2006
Gig
awat
t-hou
rs
220
230
240
250
260
270
280
290
300
Mill
ion
Dol
lars
Million kWh Cost
Chart1
Million kWh
Cost
Gigawatt-hours
Million Dollars
Senate Bill 5 Energy Use vs Energy Cost
343667472
28619895
33757683
2504536
3260767692
24602549
31773020962
26778741
324036807
2745756918
313494864
2936354518
Sheet1
Sheet1
ampA
Page ampP
Million kWh
Gigawatt-hours
Senate Bill 5 Reported Energy Use
Sheet2
ampA
Page ampP
Million kWh
Cost
Gigawatt-hours
Million Dollars
Senate Bill 5 Energy Use vs Energy Cost
Sheet3
Energy Efficiency Real Reliable and Cost-Effective Alternative
Fuel cost savings assume all saved energy at average gas generation cost
Increased off-system sales margins assumes reduced demand plus associated reserve requirements could be sold for $15kWmonth (after 2007 this is an avoided capacity expense)
Fuel Factor expense increase is increased fuel expense plus purchased capacity cost
GFT reduction is base revenue and fuel cost reductions times 91
Base revenue wDSM
552961968
562415810
569170954
576627290
585065115
594497922
604045383
613657938
623249716
632762255
644233714
Base revenue wo DSM
557087606
570008130
580983849
592794909
605393639
619267826
633200893
646996029
660941168
674903660
690679622
kWh sales wDSM
10776303000
10954134000
11076488000
11213088000
11369667000
11546488000
11724454000
11897588000
12077216000
12256861000
12476492000
kWh sales wo DSM
10861087000
11109639000
11319110000
11544588000
11787201000
12054717000
12323440000
12582205000
12851412000
13121980000
13429845000
1000
kW sales wDSM
2435000
2442000
2443000
2471000
2477000
2486000
2486000
2490000
2515000
2535000
2539000
kW sales wo DSM
2476000
2527000
2572000
2644000
2693000
2746000
2788000
2833000
2898000
2959000
3004000
Fuel Forecast
Budget 2006 (3905)
Tot-2006
Tot-2007
Tot-2008
Tot-2009
Tot-2010
Tot-2011
Tot-2012
Tot-2013
Tot-2014
Tot-2015
Total
MWH
STP
3303339
3488217
3514415
3360759
3465191
3507755
3405921
3614690
3482746
3515635
34658668
FPP
4564135
4517773
4465943
4451812
4418334
4545733
4554494
4586879
4445603
4245674
44796380
Decker
2839387
511212
504648
615748
583574
563845
570235
550098
594337
757598
8090682
Holly
235228
28425
- 0
- 0
- 0
- 0
- 0
- 0
- 0
263653
Sand Hill CC
1533962
1538343
1565132
1615597
1553452
1600111
1516183
1666799
1687122
14276700
SH GT
465155
427320
523864
450359
458722
498276
432337
492003
574949
4322986
Decker GT
157126
216800
280985
238803
246172
264900
238141
266139
294200
2203267
Existing DG
17340
7248
7296
7065
7216
7268
7168
7137
7147
16838
91723
Future DG
110
110
101
2216
2659
4743
5273
7365
7750
17746
48073
PurchasePower
131996
- 0
204000
208800
206400
206400
134400
201600
136000
139200
1568796
Landfill Methane
87493
92450
92704
92450
92450
92450
92704
92450
92450
92450
920052
Future Bioenergy
- 0
- 0
134151
178705
384764
454206
673445
744600
978509
1057336
4605716
Wind
636291
669050
671181
669050
669050
669050
671181
669050
669050
669050
6662004
Solar
684
20026
32685
41438
50311
59183
68298
76929
85801
87839
523193
Shortfall Energy
3308
2419
3355
6021
3311
4269
7050
3075
3868
4281
40957
11584082
11699976
11841366
12004048
12188020
12373249
12553456
12740532
12928204
13159918
123072851
(10512)
(1)
(1)
0
0
(0)
1
1
(0)
0
(10505)
Dollars
STP
14024307
16411783
18054617
17815007
18997196
19874461
19872833
21713134
21541492
22417754
190722584
FPP
47959978
48327184
52942730
56530034
57287196
60262126
61527986
62666810
62927556
61809806
572241406
Decker
161242451
30007075
26150797
28534975
26297430
25902979
27510734
27253106
30904024
41053837
424857407
Holly
15649395
1939153
- 0
- 0
- 0
- 0
- 0
- 0
- 0
17588548
Sand Hill CC
71819840
62147912
53829988
54696364
53773560
56880544
56723452
64324432
66378796
540574888
SH GT
28915407
23018682
25201605
20614580
21546020
24873781
22042049
25993318
31798432
224003872
Decker GT
12129491
14068039
16315347
13248144
14062711
15831205
14654486
17002591
19718490
137030504
Existing DG
1066126
482134
392821
350785
361063
372817
379318
391499
407877
1055934
5260373
Future DG
5688
5352
3321
115774
140956
247241
281454
413559
455875
1154808
2824028
PurchasePower
5000000
- 0
17339160
16429042
16415314
16614357
11144008
17017280
11632503
11967200
123558864
Landfill Methane
3535734
3653844
3663855
3653844
3653844
3653844
3663855
3653844
3653844
3653844
36440353
Future Bioenergy
- 0
- 0
6036769
8041681
17314398
20439270
30305016
33507000
44032792
47579944
207256869
Wind
17374835
18256537
18314921
18256537
18256537
18256537
18314921
18256537
18256537
18256537
181800436
Solar
- 0
- 0
- 0
- 0
- 0
- 0
- 0
- 0
- 0
- 0
- 0
Shortfall Energy
248086
181420
251636
451599
248349
320172
528742
230590
290120
321058
3071771
250457205
245839462
244324412
245526217
247531370
255326093
271114397
278523346
301422961
327166440
2667231902
1792964
10
(12)
6
(1)
10
(27)
4
3
(6)
1793341
Gas MWh
2839387
2902683
2715536
2985730
2888333
2822192
2933522
2736759
3019278
3313869
29157288
Gas cost ($)
161242451
158521208
127324584
123881915
114856517
115285269
125096264
120673092
138224364
158949555
1344055218
Avg gas gen Cost ($MWh)
5679
5461
4689
4149
3977
4085
4264
4409
4578
4796
4610
NO DSM FUEL FACTOR
2006
2007
2008
2009
2010
2011
2012
2013
2014
2015
Thermal Unit Fuel Cost
232662512
236980848
213398064
215549344
211851680
220956944
237247920
240469984
264099856
293228672
Shortfall Purchases
248086
181420
251636
451599
248349
320172
528742
230590
290120
321058
Short-Term Power Purchases
5000000
- 0
29016660
31009042
33965314
36999357
34296508
42869780
40252503
43354700
Fuel Cell Gas Cost
119837
119837
119837
119837
119837
119837
119837
119837
119837
119837
Recoverable ERCOT Expenses
16825273
16825273
16825273
16825273
16825273
16825273
16825273
16825273
16825273
16825273
Fuel Factor Renewables
9998882
9706333
14540565
15223226
23255836
23418594
31052373
32981926
42305054
44649542
Total Fuel Factor Revenue
264854590
263813711
274152035
279178321
286266289
298640176
320070653
333497390
363892643
398499082
Total Renewables
20910569
21910381
28015544
29952062
39224779
42349651
52283792
55417381
65943173
69490325
TotThermal+PurchPwr+Renewables
249864319
245834121
244321076
245522607
247527546
255322004
271110126
278519139
301418805
327162135
Estimated Green Choice Sales
10911686
12204048
13474979
14728836
15968943
18931058
21231418
22435455
23638119
24840783
Fuel Factor Renewables
9998882
9706333
14540565
15223226
23255836
23418594
31052373
32981926
42305054
44649542
Forecast Annual GWh Sales
11110
11319
11545
11787
12055
12323
12582
12851
13122
13430
Average cost per kWh
$ 0023840
$ 0023307
$ 0023747
$ 0023685
$ 0023747
$ 0024234
$ 0025438
$ 0025950
$ 0027732
$ 0029673
Fuel Factors
Secondary
$ 0023475
$ 0022733
$ 0022206
$ 0021895
$ 0021627
$ 0021713
$ 0022535
$ 0022717
$ 0024162
$ 0025715
Primary
$ 0022776
$ 0022056
$ 0021545
$ 0021243
$ 0020984
$ 0021067
$ 0021864
$ 0022041
$ 0023443
$ 0024949
Transmission
$ 0022539
$ 0021828
$ 0021321
$ 0021022
$ 0020766
$ 0020848
$ 0021637
$ 0021812
$ 0023200
$ 0024690
2006
2007
2008
2009
2010
2011
2012
2013
2014
2015
Dag generation
11574
11700
11841
12004
12188
12373
12553
12741
12928
13160
Joe generation
11584
11700
11841
12004
12188
12373
12553
12741
12928
13160
difference
(10)
0
(0)
(0)
(0)
(0)
(0)
0
(0)
0
sales
10954
11076
11213
11370
11546
11724
11898
12077
12257
12476
losses
57
56
56
56
56
55
55
55
55
55
With DSM
Thermal Unit Fuel Cost wDSM
223705664
223742320
198714736
198689904
191639104
196037824
207153584
205853888
223553008
245383552
Short-Term Power Purchases
5000000
- 0
17339160
16429042
16415314
16614357
11144008
17017280
11632503
11967200
Average cost per kWh
$ 0023361
$ 0022623
$ 0022099
$ 0021789
$ 0021523
$ 0021608
$ 0022426
$ 0022607
$ 0024046
$ 0025590
Forecast Annual GWh Sales
10954
11076
11213
11370
11546
11724
11898
12077
12257
12476
255897742
250575183
247791207
247738881
248503713
253336056
266823817
273028794
294725795
319266462
CASH FLOW PURCHASE OPTION
2005
2006
2007
2008
2009
2010
2011
2012
2013
2014
2015
Base revenue reduction
4125638
7592320
11812895
16167619
20328524
24769904
29155510
33338091
37691451
42141405
46445908
Fuel cost reduction
5166240
8956848
13238528
14683328
16859440
20212576
24919120
30094336
34616096
40546848
47845120
Potential off-system sales margins
2767500
5737500
8707500
Capacity cost reduction
12000000
15000000
18000000
21000000
24000000
27000000
30000000
33000000
GFT reduction
845561
660413
773705
527757
576669
709301
827386
851560
807636
944644
1055853
845560920627699
Program cost
20689324
22819634
22819634
22819634
22819634
22819634
22819634
22819634
22819634
22819634
22819634
Recovery through base rates
14405492
14639186
14799075
14977916
15183688
15416391
15650684
15878624
16115254
16352636
16645725
Cash flow
-6796409
-9374854
-10352249
-23481580
-27387801
-31463846
-35497075
-39427542
-43588195
-47663759
-51563965
2005
2006
2007
2008
2009
2010
2011
2012
2013
2014
2015
Base Revenue Reduction
$ (4125638)
$ (7592320)
$ (11812895)
$ (16167619)
$ (20328524)
$ (24769904)
$ (29155510)
$ (33338091)
$ (37691451)
$ (42141405)
$ (46445908)
Fuel Revenue Reduction
$ (5166240)
$ (8956848)
$ (13238528)
$ (26683328)
$ (31859440)
$ (38212576)
$ (45919120)
$ (54094336)
$ (61616096)
$ (70546848)
$ (80845120)
Fuel Cost Reduction
$ 5166240
$ 8956848
$ 13238528
$ 26683328
$ 31859440
$ 38212576
$ 45919120
$ 54094336
$ 61616096
$ 70546848
$ 80845120
Potential off-system sales margins
$ 2767500
$ 5737500
$ 8707500
$ - 0
$ - 0
$ - 0
$ - 0
$ - 0
$ - 0
$ - 0
$ - 0
Net program costs
$ (5438271)
$ (7520034)
$ (7246854)
$ (7313961)
$ (7059277)
$ (6693942)
$ (6341565)
$ (6089451)
$ (5896744)
$ (5522354)
$ (5118057)
AEs net cash impact
$ (6796409)
$ (9374854)
$ (10352249)
$ (23481580)
$ (27387801)
$ (31463846)
$ (35497075)
$ (39427542)
$ (43588195)
$ (47663759)
$ (51563965)
Customer savings
$ 9291878
$ 16549168
$ 25051423
$ 42850947
$ 52187964
$ 62982480
$ 75074630
$ 87432427
$ 99307547
$ 112688253
$ 127291028
CASH FLOW BUILD OPTION
2005
2006
2007
2008
2009
2010
2011
2012
2013
2014
2015
Base revenue reduction
4125638
7592320
11812895
16167619
20328524
24769904
29155510
33338091
37691451
42141405
46445908
Fuel cost reduction
5166240
8956848
13238528
14683328
16859440
20212576
24919120
30094336
34616096
40546848
47845120
Potential off-system sales margins
2767500
5737500
8707500
Capacity cost reduction
7736295
11604442
11604442
15472589
15472589
19340737
19340737
23208884
GFT reduction
845561
660413
773705
527757
576669
709301
827386
851560
807636
944644
1055853
Program cost
20689324
22819634
22819634
22819634
22819634
22819634
22819634
22819634
22819634
22819634
22819634
Recovery through base rates
14405492
14639186
14799075
14977916
15183688
15416391
15650684
15878624
16115254
16352636
16645725
Cash flow
-6796409
-9374854
-10352249
-15745285
-15783359
-19859404
-20024486
-23954952
-24247459
-28323022
-28355080
-21195738994
Capacity cost Build option
Reduced capacity requirement (kW)
46125
95625
145125
194625
243000
292500
339750
385875
430875
477000
523125
Capacity added
200
300
300
400
400
500
500
600
Annual capacity cost
$386814737
$7736295
$11604442
$11604442
$15472589
$15472589
$19340737
$19340737
$23208884
Capacity cost Buy option
Reduced capacity requirement (kW)
46125
95625
145125
194625
243000
292500
339750
385875
430875
477000
523125
Capacity added
200
250
300
350
400
450
500
550
Annual capacity cost
$600000000
$12000000
$15000000
$18000000
$21000000
$24000000
$27000000
$30000000
$33000000
1994
2004
2005
2006
2007
2008
2009
2010
2011
2012
2013
2014
2015
Net MWh to system
7659242
10855000
11388814
11573570
11699976
11841366
12004047
12188019
12373248
12553455
12740532
12928203
13159916
Revenue multiplier
100
142
149
151
153
155
157
159
162
164
166
169
172
Revenue allocated to DSM
9688028
13730281
14405492
14639186
14799075
14977916
15183688
15416391
15650684
15878624
16115254
16352636
16645725
CentskWh in rates for DSM
0134
0134
0134
0134
0134
0134
0134
0133
0133
0133
0133
0133
Annual sales (MWh)
10262000
10776303
10954134
11076488
11213088
11369667
11546488
11724454
11897588
12077216
12256861
12476492
2006
2006
2007
2007
2008
2008
2009
2009
2010
2010
2011
2011
2012
2012
2013
2013
2014
2014
2015
2015
2005
2005
2005
2006
2006
2006
2007
2007
2007
2008
2008
2008
2009
2009
2009
2010
2010
2010
2011
2011
2011
2012
2012
2012
2013
2013
2013
2014
2014
2014
2015
2015
2015
2005
2006
2007
2008
2009
2010
2011
2012
2013
2014
2015
Base Revenue Reduction
$ (4125638)
$ (7592320)
$ (11812895)
$ (16167619)
$ (20328524)
$ (24769904)
$ (29155510)
$ (33338091)
$ (37691451)
$ (42141405)
$ (46445908)
Fuel Revenue Reduction
$ (5166240)
$ (8956848)
$ (13238528)
$ (26683328)
$ (31859440)
$ (38212576)
$ (45919120)
$ (54094336)
$ (61616096)
$ (70546848)
$ (80845120)
Fuel Cost Reduction
$ 5166240
$ 8956848
$ 13238528
$ 26683328
$ 31859440
$ 38212576
$ 45919120
$ 54094336
$ 61616096
$ 70546848
$ 80845120
Potential off-system sales margins
$ 2767500
$ 5737500
$ 8707500
$ - 0
$ - 0
$ - 0
$ - 0
$ - 0
$ - 0
$ - 0
$ - 0
Net program costs
$ (5438271)
$ (7520034)
$ (7246854)
$ (7313961)
$ (7059277)
$ (6693942)
$ (6341565)
$ (6089451)
$ (5896744)
$ (5522354)
$ (5118057)
AEs net cash impact
$ (6796409)
$ (9374854)
$ (10352249)
$ (23481580)
$ (27387801)
$ (31463846)
$ (35497075)
$ (39427542)
$ (43588195)
$ (47663759)
$ (51563965)
Customer savings
$ (9291878)
$ (16549168)
$ (25051423)
$ (42850947)
$ (52187964)
$ (62982480)
$ (75074630)
$ (87432427)
$ (99307547)
$ (112688253)
$ (127291028)
Estimated Annual Impact
Base Revenue Reduction
$ (16134252)
Fuel Revenue Reduction
$ (23790144)
Fuel Cost Reduction
$ 23790144
Potential off-system sales margins
$ 2889000
Net program costs
$ (7166814)
AEs net cash impact
$ (20412066)
Customer savings
$ (39924396)
CURRENT FORECAST
PROPOSED PROJECTION
DSM Analysis
2007
2008
2007
2008
keyed in to round
Base Revenue Reduction
(12000000)
(16000000)
(12000000)
(16000000)
Fuel Revenue Reduction
(13000000)
(15000000)
(5000000)
(7000000)
Customer Savings (Bill Reduction)
(25000000)
(31000000)
(17000000)
(23000000)
Fuel Cost Reduction
13000000
15000000
5000000
7000000
KW
$KW
NET
5 profit
Potential Off-system Capacity Sales
9000000
9000000
6207
$KW
145000
$ 62
$ 8990000
Net of fuel and GFT
$ 449500
TCOS Expense Reduction
900000
1000000
900000
1000000
GFT Reduction
2000000
3000000
2000000
3000000
Program Cost
(23000000)
(23000000)
Recovery through Base Rates
15000000
15000000
AEs Net Income Impact
(8100000)
(20000000)
(17100000)
(35000000)
Deferred Cost of Capacity
12000000
- 0
AEs Net Cash Impact
(8100000)
(8000000)
(17100000)
- 0
Outline for Oct 10 Leadership Team Update
1 Components of BenefitCost Ratios
2 Cash Flow of DSM
CURRENT FORECAST
PROPOSED PROJECTION
DSM Analysis
2007
2008
2007
2008
Base Revenue Reduction
(11812895)
(16167619)
(11812895)
(16167619)
Fuel Revenue Reduction
(13238528)
(14683328)
(5217969)
(5396810)
Fuel Cost Reduction
13238528
14683328
5217969
5396810
Potential off-system sales margins
8707500
8707500
Fuel Revenue Increase-Capacity
12000000
12000000
Fuel Cost Increase-Capacity
(12000000)
(12000000)
TCOS expense reduction
925987
977987
925987
977987
GFT reduction
2279680
2807436
2279680
2807436
Program cost
(22819634)
(22819634)
Recovery through base rates
14799075
14977916
AEs net income impact
(7920288)
(20223914)
100271
(12382196)
Deferred Cost of Capacity
12000000
12000000
AEs net cash impact including deferral
(7920288)
(8223914)
100271
(382196)
Customer savings-(net)
$ (25051423)
$ (30850947)
$ (17030864)
$ (21564429)
Recommend recovery thru fuel factor
Offset customer fuel savings due to DSM
Would not offset revenue loss
(before amp after)
In 2007 we still have excess capacity
Cost recovery
3yrs - recommended purch power
power is only needed during peak-dont utilize a plant
need declines as renewables increases
cash flow
Dynamic pricing-TOU rates motivating cust to conserve energy
would replace some of the energy efficiency rebates
option to self-generate
TCOS expense reduction due to DSM savings
Historical
Historical
Historical
Historical
Historical
Preliminary
Forecast
Forecast
Forecast
Forecast
Forecast
Forecast
Forecast
Forecast
Forecast
Forecast
2000
2001
2002
2003
2004
2005
2006
2007
2008
2009
2010
2011
2012
2013
2014
2015
ERCOT Postage Stamp Rate
1476
1528
1661
1778
1925
2055
2185
2315
2445
2575
2705
2835
2965
3095
3225
3355
Estimated DSM-kW savings applied to average 4CP
40000
40000
40000
40000
40000
40000
40000
40000
40000
40000
40000
Reduction to TCOS expense
$ 821987
$ 873987
$ 925987
$ 977987
$ 1029987
$ 1081987
$ 1133987
$ 1185987
$ 1237987
$ 1289987
$ 1341987
2005
2006
2007
2008
2009
2010
2011
2012
2013
2014
2015
Base revenue reduction
4125638
7592320
11812895
16167619
20328524
24769904
29155510
33338091
37691451
42141405
46445908
kWh reduction
84784000
155505000
242622000
331500000
417534000
508229000
598986000
684617000
774196000
865119000
953353000
Fuel cost reduction
5166240
8956848
13238528
14683328
16859440
20212576
24919120
30094336
34616096
40546848
47845120
Demand reduction (kW)
41000
85000
129000
173000
216000
260000
302000
343000
383000
424000
465000
Reduced reserve requirement (kW)
5125
10625
16125
21625
27000
32500
37750
42875
47875
53000
58125
2008
2009
2010
2011
2012
2013
2014
2015
Reduced capacity requirement (kW)
46125
95625
145125
194625
243000
292500
339750
385875
430875
477000
523125
194625
243000
292500
339750
385875
430875
477000
523125
Increased off-system sales margins
2767500
5737500
8707500
Capacity cost reduction
11677500
14580000
17550000
20385000
23152500
25852500
28620000
31387500
Fuel Factor expense decrease ($)
5166240
8956848
13238528
26360828
31439440
37762576
45304120
53246836
60468596
69166848
79232620
Fuel Factor decrease (centskWh)
00005
00007
00016
00019
00022
00026
00030
00033
00037
00041
Fuel Factor decrease
2
3
7
9
10
12
13
15
15
16
GFT reduction
845561
1505974
2279680
2807436
3384105
4093406
4920791
5772351
6579987
7524631
8580484
Program cost
20689324
22819634
22819634
22819634
22819634
22819634
22819634
22819634
22819634
22819634
22819634
Recovery through base rates
14405492
14639186
14799075
14977916
15183688
15416391
15650684
15878624
16115254
16352636
16645725
Cash flow
-7641970
-10035268
-11125954
-12331837
-13384470
-14623147
-15939461
-17126601
-18543331
-19988403
-21232317
Fuel cost savings assume all saved energy at average gas generation cost
Increased off-system sales margins assumes reduced demand plus associated reserve requirements could be sold for $15kWmonth (after 2007 this is an avoided capacity expense)
Fuel Factor expense increase is increased fuel expense plus purchased capacity cost
GFT reduction is base revenue and fuel cost reductions times 91
Base revenue wDSM
552961968
562415810
569170954
576627290
585065115
594497922
604045383
613657938
623249716
632762255
644233714
Base revenue wo DSM
557087606
570008130
580983849
592794909
605393639
619267826
633200893
646996029
660941168
674903660
690679622
kWh sales wDSM
10776303000
10954134000
11076488000
11213088000
11369667000
11546488000
11724454000
11897588000
12077216000
12256861000
12476492000
kWh sales wo DSM
10861087000
11109639000
11319110000
11544588000
11787201000
12054717000
12323440000
12582205000
12851412000
13121980000
13429845000
1000
kW sales wDSM
2435000
2442000
2443000
2471000
2477000
2486000
2486000
2490000
2515000
2535000
2539000
kW sales wo DSM
2476000
2527000
2572000
2644000
2693000
2746000
2788000
2833000
2898000
2959000
3004000
Fuel Forecast
Budget 2006 (3905)
Tot-2006
Tot-2007
Tot-2008
Tot-2009
Tot-2010
Tot-2011
Tot-2012
Tot-2013
Tot-2014
Tot-2015
Total
MWH
STP
3303339
3488217
3514415
3360759
3465191
3507755
3405921
3614690
3482746
3515635
34658668
FPP
4564135
4517773
4465943
4451812
4418334
4545733
4554494
4586879
4445603
4245674
44796380
Decker
2839387
511212
504648
615748
583574
563845
570235
550098
594337
757598
8090682
Holly
235228
28425
- 0
- 0
- 0
- 0
- 0
- 0
- 0
263653
Sand Hill CC
1533962
1538343
1565132
1615597
1553452
1600111
1516183
1666799
1687122
14276700
SH GT
465155
427320
523864
450359
458722
498276
432337
492003
574949
4322986
Decker GT
157126
216800
280985
238803
246172
264900
238141
266139
294200
2203267
Existing DG
17340
7248
7296
7065
7216
7268
7168
7137
7147
16838
91723
Future DG
110
110
101
2216
2659
4743
5273
7365
7750
17746
48073
PurchasePower
131996
- 0
204000
208800
206400
206400
134400
201600
136000
139200
1568796
Landfill Methane
87493
92450
92704
92450
92450
92450
92704
92450
92450
92450
920052
Future Bioenergy
- 0
- 0
134151
178705
384764
454206
673445
744600
978509
1057336
4605716
Wind
636291
669050
671181
669050
669050
669050
671181
669050
669050
669050
6662004
Solar
684
20026
32685
41438
50311
59183
68298
76929
85801
87839
523193
Shortfall Energy
3308
2419
3355
6021
3311
4269
7050
3075
3868
4281
40957
11584082
11699976
11841366
12004048
12188020
12373249
12553456
12740532
12928204
13159918
123072851
(10512)
(1)
(1)
0
0
(0)
1
1
(0)
0
(10505)
Dollars
STP
14024307
16411783
18054617
17815007
18997196
19874461
19872833
21713134
21541492
22417754
190722584
FPP
47959978
48327184
52942730
56530034
57287196
60262126
61527986
62666810
62927556
61809806
572241406
Decker
161242451
30007075
26150797
28534975
26297430
25902979
27510734
27253106
30904024
41053837
424857407
Holly
15649395
1939153
- 0
- 0
- 0
- 0
- 0
- 0
- 0
17588548
Sand Hill CC
71819840
62147912
53829988
54696364
53773560
56880544
56723452
64324432
66378796
540574888
SH GT
28915407
23018682
25201605
20614580
21546020
24873781
22042049
25993318
31798432
224003872
Decker GT
12129491
14068039
16315347
13248144
14062711
15831205
14654486
17002591
19718490
137030504
Existing DG
1066126
482134
392821
350785
361063
372817
379318
391499
407877
1055934
5260373
Future DG
5688
5352
3321
115774
140956
247241
281454
413559
455875
1154808
2824028
PurchasePower
5000000
- 0
17339160
16429042
16415314
16614357
11144008
17017280
11632503
11967200
123558864
Landfill Methane
3535734
3653844
3663855
3653844
3653844
3653844
3663855
3653844
3653844
3653844
36440353
Future Bioenergy
- 0
- 0
6036769
8041681
17314398
20439270
30305016
33507000
44032792
47579944
207256869
Wind
17374835
18256537
18314921
18256537
18256537
18256537
18314921
18256537
18256537
18256537
181800436
Solar
- 0
- 0
- 0
- 0
- 0
- 0
- 0
- 0
- 0
- 0
- 0
Shortfall Energy
248086
181420
251636
451599
248349
320172
528742
230590
290120
321058
3071771
250457205
245839462
244324412
245526217
247531370
255326093
271114397
278523346
301422961
327166440
2667231902
1792964
10
(12)
6
(1)
10
(27)
4
3
(6)
1793341
Gas MWh
2839387
2902683
2715536
2985730
2888333
2822192
2933522
2736759
3019278
3313869
29157288
Gas cost ($)
161242451
158521208
127324584
123881915
114856517
115285269
125096264
120673092
138224364
158949555
1344055218
Avg gas gen Cost ($MWh)
5679
5461
4689
4149
3977
4085
4264
4409
4578
4796
4610
NO DSM FUEL FACTOR
2006
2007
2008
2009
2010
2011
2012
2013
2014
2015
Thermal Unit Fuel Cost
232662512
236980848
213398064
215549344
211851680
220956944
237247920
240469984
264099856
293228672
Shortfall Purchases
248086
181420
251636
451599
248349
320172
528742
230590
290120
321058
Short-Term Power Purchases
5000000
- 0
29016660
31009042
33965314
36999357
34296508
42869780
40252503
43354700
Fuel Cell Gas Cost
119837
119837
119837
119837
119837
119837
119837
119837
119837
119837
Recoverable ERCOT Expenses
16825273
16825273
16825273
16825273
16825273
16825273
16825273
16825273
16825273
16825273
Fuel Factor Renewables
9998882
9706333
14540565
15223226
23255836
23418594
31052373
32981926
42305054
44649542
Total Fuel Factor Revenue
264854590
263813711
274152035
279178321
286266289
298640176
320070653
333497390
363892643
398499082
Total Renewables
20910569
21910381
28015544
29952062
39224779
42349651
52283792
55417381
65943173
69490325
TotThermal+PurchPwr+Renewables
249864319
245834121
244321076
245522607
247527546
255322004
271110126
278519139
301418805
327162135
Estimated Green Choice Sales
10911686
12204048
13474979
14728836
15968943
18931058
21231418
22435455
23638119
24840783
Fuel Factor Renewables
9998882
9706333
14540565
15223226
23255836
23418594
31052373
32981926
42305054
44649542
Forecast Annual GWh Sales
11110
11319
11545
11787
12055
12323
12582
12851
13122
13430
Average cost per kWh
$ 0023840
$ 0023307
$ 0023747
$ 0023685
$ 0023747
$ 0024234
$ 0025438
$ 0025950
$ 0027732
$ 0029673
Fuel Factors
Secondary
$ 0023475
$ 0022733
$ 0022206
$ 0021895
$ 0021627
$ 0021713
$ 0022535
$ 0022717
$ 0024162
$ 0025715
Primary
$ 0022776
$ 0022056
$ 0021545
$ 0021243
$ 0020984
$ 0021067
$ 0021864
$ 0022041
$ 0023443
$ 0024949
Transmission
$ 0022539
$ 0021828
$ 0021321
$ 0021022
$ 0020766
$ 0020848
$ 0021637
$ 0021812
$ 0023200
$ 0024690
2006
2007
2008
2009
2010
2011
2012
2013
2014
2015
Dag generation
11574
11700
11841
12004
12188
12373
12553
12741
12928
13160
Joe generation
11584
11700
11841
12004
12188
12373
12553
12741
12928
13160
difference
(10)
0
(0)
(0)
(0)
(0)
(0)
0
(0)
0
sales
10954
11076
11213
11370
11546
11724
11898
12077
12257
12476
losses
57
56
56
56
56
55
55
55
55
55
With DSM
Thermal Unit Fuel Cost wDSM
223705664
223742320
198714736
198689904
191639104
196037824
207153584
205853888
223553008
245383552
Short-Term Power Purchases
5000000
- 0
17339160
16429042
16415314
16614357
11144008
17017280
11632503
11967200
Average cost per kWh
$ 0023361
$ 0022623
$ 0022099
$ 0021789
$ 0021523
$ 0021608
$ 0022426
$ 0022607
$ 0024046
$ 0025590
Forecast Annual GWh Sales
10954
11076
11213
11370
11546
11724
11898
12077
12257
12476
255897742
250575183
247791207
247738881
248503713
253336056
266823817
273028794
294725795
319266462
CASH FLOW PURCHASE OPTION
2005
2006
2007
2008
2009
2010
2011
2012
2013
2014
2015
Base revenue reduction
4125638
7592320
11812895
16167619
20328524
24769904
29155510
33338091
37691451
42141405
46445908
Fuel cost reduction
5166240
8956848
13238528
14683328
16859440
20212576
24919120
30094336
34616096
40546848
47845120
Potential off-system sales margins
2767500
5737500
8707500
Capacity cost reduction
12000000
15000000
18000000
21000000
24000000
27000000
30000000
33000000
GFT reduction
845561
660413
773705
527757
576669
709301
827386
851560
807636
944644
1055853
845560920627699
Program cost
20689324
22819634
22819634
22819634
22819634
22819634
22819634
22819634
22819634
22819634
22819634
Recovery through base rates
14405492
14639186
14799075
14977916
15183688
15416391
15650684
15878624
16115254
16352636
16645725
Cash flow
-6796409
-9374854
-10352249
-23481580
-27387801
-31463846
-35497075
-39427542
-43588195
-47663759
-51563965
2005
2006
2007
2008
2009
2010
2011
2012
2013
2014
2015
Base Revenue Reduction
$ (4125638)
$ (7592320)
$ (11812895)
$ (16167619)
$ (20328524)
$ (24769904)
$ (29155510)
$ (33338091)
$ (37691451)
$ (42141405)
$ (46445908)
Fuel Revenue Reduction
$ (5166240)
$ (8956848)
$ (13238528)
$ (26683328)
$ (31859440)
$ (38212576)
$ (45919120)
$ (54094336)
$ (61616096)
$ (70546848)
$ (80845120)
Fuel Cost Reduction
$ 5166240
$ 8956848
$ 13238528
$ 26683328
$ 31859440
$ 38212576
$ 45919120
$ 54094336
$ 61616096
$ 70546848
$ 80845120
Potential off-system sales margins
$ 2767500
$ 5737500
$ 8707500
$ - 0
$ - 0
$ - 0
$ - 0
$ - 0
$ - 0
$ - 0
$ - 0
Net program costs
$ (5438271)
$ (7520034)
$ (7246854)
$ (7313961)
$ (7059277)
$ (6693942)
$ (6341565)
$ (6089451)
$ (5896744)
$ (5522354)
$ (5118057)
AEs net cash impact
$ (6796409)
$ (9374854)
$ (10352249)
$ (23481580)
$ (27387801)
$ (31463846)
$ (35497075)
$ (39427542)
$ (43588195)
$ (47663759)
$ (51563965)
Customer savings
$ 9291878
$ 16549168
$ 25051423
$ 42850947
$ 52187964
$ 62982480
$ 75074630
$ 87432427
$ 99307547
$ 112688253
$ 127291028
CASH FLOW BUILD OPTION
2005
2006
2007
2008
2009
2010
2011
2012
2013
2014
2015
Base revenue reduction
4125638
7592320
11812895
16167619
20328524
24769904
29155510
33338091
37691451
42141405
46445908
Fuel cost reduction
5166240
8956848
13238528
14683328
16859440
20212576
24919120
30094336
34616096
40546848
47845120
Potential off-system sales margins
2767500
5737500
8707500
Capacity cost reduction
7736295
11604442
11604442
15472589
15472589
19340737
19340737
23208884
GFT reduction
845561
660413
773705
527757
576669
709301
827386
851560
807636
944644
1055853
Program cost
20689324
22819634
22819634
22819634
22819634
22819634
22819634
22819634
22819634
22819634
22819634
Recovery through base rates
14405492
14639186
14799075
14977916
15183688
15416391
15650684
15878624
16115254
16352636
16645725
Cash flow
-6796409
-9374854
-10352249
-15745285
-15783359
-19859404
-20024486
-23954952
-24247459
-28323022
-28355080
-21195738994
Capacity cost Build option
Reduced capacity requirement (kW)
46125
95625
145125
194625
243000
292500
339750
385875
430875
477000
523125
Capacity added
200
300
300
400
400
500
500
600
Annual capacity cost
$386814737
$7736295
$11604442
$11604442
$15472589
$15472589
$19340737
$19340737
$23208884
Capacity cost Buy option
Reduced capacity requirement (kW)
46125
95625
145125
194625
243000
292500
339750
385875
430875
477000
523125
Capacity added
200
250
300
350
400
450
500
550
Annual capacity cost
$600000000
$12000000
$15000000
$18000000
$21000000
$24000000
$27000000
$30000000
$33000000
1994
2004
2005
2006
2007
2008
2009
2010
2011
2012
2013
2014
2015
Net MWh to system
7659242
10855000
11388814
11573570
11699976
11841366
12004047
12188019
12373248
12553455
12740532
12928203
13159916
Revenue multiplier
100
142
149
151
153
155
157
159
162
164
166
169
172
Revenue allocated to DSM
9688028
13730281
14405492
14639186
14799075
14977916
15183688
15416391
15650684
15878624
16115254
16352636
16645725
CentskWh in rates for DSM
0134
0134
0134
0134
0134
0134
0134
0133
0133
0133
0133
0133
Annual sales (MWh)
10262000
10776303
10954134
11076488
11213088
11369667
11546488
11724454
11897588
12077216
12256861
12476492
2006
2006
2007
2007
2008
2008
2009
2009
2010
2010
2011
2011
2012
2012
2013
2013
2014
2014
2015
2015
2005
2005
2005
2006
2006
2006
2007
2007
2007
2008
2008
2008
2009
2009
2009
2010
2010
2010
2011
2011
2011
2012
2012
2012
2013
2013
2013
2014
2014
2014
2015
2015
2015
2005
2006
2007
2008
2009
2010
2011
2012
2013
2014
2015
Base Revenue Reduction
$ (4125638)
$ (7592320)
$ (11812895)
$ (16167619)
$ (20328524)
$ (24769904)
$ (29155510)
$ (33338091)
$ (37691451)
$ (42141405)
$ (46445908)
Fuel Revenue Reduction
$ (5166240)
$ (8956848)
$ (13238528)
$ (26683328)
$ (31859440)
$ (38212576)
$ (45919120)
$ (54094336)
$ (61616096)
$ (70546848)
$ (80845120)
Fuel Cost Reduction
$ 5166240
$ 8956848
$ 13238528
$ 26683328
$ 31859440
$ 38212576
$ 45919120
$ 54094336
$ 61616096
$ 70546848
$ 80845120
Potential off-system sales margins
$ 2767500
$ 5737500
$ 8707500
$ - 0
$ - 0
$ - 0
$ - 0
$ - 0
$ - 0
$ - 0
$ - 0
Net program costs
$ (5438271)
$ (7520034)
$ (7246854)
$ (7313961)
$ (7059277)
$ (6693942)
$ (6341565)
$ (6089451)
$ (5896744)
$ (5522354)
$ (5118057)
AEs net cash impact
$ (6796409)
$ (9374854)
$ (10352249)
$ (23481580)
$ (27387801)
$ (31463846)
$ (35497075)
$ (39427542)
$ (43588195)
$ (47663759)
$ (51563965)
Customer savings
$ (9291878)
$ (16549168)
$ (25051423)
$ (42850947)
$ (52187964)
$ (62982480)
$ (75074630)
$ (87432427)
$ (99307547)
$ (112688253)
$ (127291028)
Estimated Annual Impact
Base Revenue Reduction
$ (16134252)
Fuel Revenue Reduction
$ (23790144)
Fuel Cost Reduction
$ 23790144
Potential off-system sales margins
$ 2889000
Net program costs
$ (7166814)
AEs net cash impact
$ (20412066)
Customer savings
$ (39924396)
CURRENT FORECAST
PROPOSED PROJECTION
DSM Analysis
2007
2008
2007
2008
keyed in to round
Base Revenue Reduction
(12000000)
(16000000)
(12000000)
(16000000)
Fuel Revenue Reduction
(13000000)
(15000000)
(5000000)
(7000000)
Fuel Cost Reduction
13000000
15000000
5000000
7000000
KW
$KW
NET
5 profit
Potential off-system capacity sales
9000000
9000000
6207
$KW
145000
$ 62
$ 8990000
Net of fuel and GFT
$ 449500
Fuel Revenue Increase-Capacity
12000000
12000000
6154
$KW
195000
$ 62
$ 12090000
Fuel Cost Increase-Capacity
(12000000)
(12000000)
TCOS expense reduction
900000
1000000
900000
1000000
GFT reduction
2000000
3000000
2000000
3000000
Program cost
(23000000)
(23000000)
Recovery through base rates
15000000
15000000
AEs net income impact
(8100000)
(20000000)
(100000)
(12000000)
Deferred Cost of Capacity
12000000
12000000
AEs net cash impact
(8100000)
(8000000)
(100000)
- 0
Customer savings-(net)
$ (25000000)
$ (31000000)
$ (17000000)
$ (35000000)
Outline for Oct 10 Leadership Team Update
1 Components of BenefitCost Ratios
2 Cash Flow of DSM
CURRENT FORECAST
PROPOSED PROJECTION
DSM Analysis
2007
2008
2007
2008
Base Revenue Reduction
(11812895)
(16167619)
(11812895)
(16167619)
Fuel Revenue Reduction
(13238528)
(14683328)
(5217969)
(5396810)
Fuel Cost Reduction
13238528
14683328
5217969
5396810
Potential off-system sales margins
8707500
8707500
Fuel Revenue Increase-Capacity
12000000
12000000
Fuel Cost Increase-Capacity
(12000000)
(12000000)
TCOS expense reduction
925987
977987
925987
977987
GFT reduction
2279680
2807436
2279680
2807436
Program cost
(22819634)
(22819634)
Recovery through base rates
14799075
14977916
AEs net income impact
(7920288)
(20223914)
100271
(12382196)
Deferred Cost of Capacity
12000000
12000000
AEs net cash impact including deferral
(7920288)
(8223914)
100271
(382196)
Customer savings-(net)
$ (25051423)
$ (30850947)
$ (17030864)
$ (33564429)
Recommend recovery thru fuel factor
Offset customer fuel savings due to DSM
Would not offset revenue loss
(before amp after)
In 2007 we still have excess capacity
Cost recovery
3yrs - recommended purch power
power is only needed during peak-dont utilize a plant
need declines as renewables increases
cash flow
Dynamic pricing-TOU rates motivating cust to conserve energy
would replace some of the energy efficiency rebates
option to self-generate
TCOS expense reduction due to DSM savings
Historical
Historical
Historical
Historical
Historical
Preliminary
Forecast
Forecast
Forecast
Forecast
Forecast
Forecast
Forecast
Forecast
Forecast
Forecast
2000
2001
2002
2003
2004
2005
2006
2007
2008
2009
2010
2011
2012
2013
2014
2015
ERCOT Postage Stamp Rate
1476
1528
1661
1778
1925
2055
2185
2315
2445
2575
2705
2835
2965
3095
3225
3355
Estimated DSM-kW savings applied to average 4CP
40000
40000
40000
40000
40000
40000
40000
40000
40000
40000
40000
Reduction to TCOS expense
$ 821987
$ 873987
$ 925987
$ 977987
$ 1029987
$ 1081987
$ 1133987
$ 1185987
$ 1237987
$ 1289987
$ 1341987
Saving Energy TogetherPower SaverTM Program
Austin City Council
Resolution September 14 1999ldquoCost-effective conservation programs shall be the first priority in meeting new load growth requirements of Austin Energy rdquo
Clean Energy Resolution August 28 2003hellip Austin Energy Strategic Plan to ensure Austin remains a national and international leader in the development and use of clean energy
Saving Energy TogetherPower SaverTM Program
Austin Climate Protection Plan Will make Austin the national leader among
cities in the fight against global warming
Saving Energy TogetherPower SaverTM Program
Efficiency amp Renewables GoalEnergy Efficiency is first priority
ndash 15 energy savings by 2020ndash 700 MWs of peak demand savings by 2020
Renewable Energy Goalndash 30 Renewable Energy by 2020ndash 100 MWs of Solar by 2020
Saving Energy TogetherPower SaverTM Program
Promoting Energy Efficiencybull Cash rebates pay 20 ndash 30 of cost bull Up to 70 incentives for Small Businessbull Direct install measuresbull Free home and business energy auditsbull Low-income Free Weatherizationbull Public education amp outreach efforts
Saving Energy TogetherPower SaverTM Program
Top 100 MW is used 43 hrs per year
DSM OpportunityAE System Load Duration Curve - 2006
MW
s G
ener
ated
Hours (8760)
Saving Energy TogetherPower SaverTM Program
Peak ClippingStrategic
Conservation Load Shifting
Energy Use Modification
Saving Energy TogetherPower SaverTM Program
Peak Clipping Power Saver Programs
AC Cycling
WH Cycling
Demand Response
Volunteers
Peak Clipping Strategy
Represent 36 of new DSM program mix
Saving Energy TogetherPower SaverTM Program
Total Home EfficiencySmall Business EfficiencyGreen Building Program
bull ARI American Refrigeration Institutebull ANSI American National Standards Institutebull IESNA Illuminating Engineering Society of North Americabull NEMA National Electrical Manufacturerrsquos Associationbull ASTM American Society of Testing and Measurements
AEs Net Income Impact (8100000) (20000000) Deferred Cost of Capacity 12000000 AEs Net Cash Impact (8100000) (8000000)
CURRENT FORECAST
Cash Flow Projection of DSM
Cash flow chart
Chart1
Fuel Cost Reduction
Capacity Expense Reduction
Total Decrease In Expenses
REDUCTION IN EXPENSES DUE TO DSM PROGRAMS
5166240
5166240
8956848
8956848
13238528
13238528
14683328
26360828
11677500
16859440
31439440
14580000
20212576
37762576
17550000
24919120
45304120
20385000
30094336
53246836
23152500
34616096
60468596
25852500
40546848
69166848
28620000
47845120
79232620
31387500
Chart4
Fuel Cost without DSM
Fuel Cost with DSM
REDUCTION IN FUEL COST DUE TO DSM PROGRAMS
00233611231
00238400717
00226232559
00233069306
00220985648
00237472342
00217888198
00236848698
00215229268
00237472426
00216083296
00242335075
00224259386
00254383594
00226073357
00259502528
00240455083
00277315347
00255904506
00296726494
Sheet1
Sheet3
Saving Energy TogetherPower SaverTM Program
Questions
Saving Energy TogetherPower SaverTM Program
FY 2006 Achievements
Energy SavingsMW of
Programs Saved Goal Goal
Residential 126 115 110
Commercial 154 121 127
Demand Response 146 156 94
Solar 055 060 93
Grand Total 432 398 108
Saving Energy TogetherPower SaverTM Program
MW SavedPrograms FY2005 FY2006
Residential 119 126
Commercial 153 154
Demand Response 116 146
Solar 06 055
Grand Total 394 432
Energy Savings ComparisonFY2005 to FY2006
Saving Energy TogetherPower SaverTM Program
DSM Summary
bull DSM programs are saving peak kW amp kWh
bull Cost-effectiveness analyses include full program costs
bull DSM goals and budgets should vary to support AE resource plan requirements
Saving Energy TogetherPower SaverTM Program
Free Home WeatherizationEnergy Improvementsbull Insulate Atticsbull Duct Sealingbull Install CFLsbull Solar Screensbull Caulking and Weather-strippingbull Free Smoke amp Carbon Monoxide Detector bull Minor Energy Related Repairs
Saving Energy TogetherPower SaverTM Program
Power Saver Program
bull FREE Energy Saving Productsbull Lower energy costsbull 65000 installed in homes apartmentsbull 4000 installed in commercial buildings
Saving Energy TogetherPower SaverTM Program
Energy Conservation in COA FacilitiesSenate Bill 5 Energy Use vs Energy Cost
295
300
305
310
315
320
325
330
335
340
345
350
Base Year2001
2002 2003 2004 2005 2006
Gig
awat
t-hou
rs
220
230
240
250
260
270
280
290
300
Mill
ion
Dol
lars
Million kWh Cost
Chart1
Million kWh
Cost
Gigawatt-hours
Million Dollars
Senate Bill 5 Energy Use vs Energy Cost
343667472
28619895
33757683
2504536
3260767692
24602549
31773020962
26778741
324036807
2745756918
313494864
2936354518
Sheet1
Sheet1
ampA
Page ampP
Million kWh
Gigawatt-hours
Senate Bill 5 Reported Energy Use
Sheet2
ampA
Page ampP
Million kWh
Cost
Gigawatt-hours
Million Dollars
Senate Bill 5 Energy Use vs Energy Cost
Sheet3
Energy Efficiency Real Reliable and Cost-Effective Alternative
Fuel cost savings assume all saved energy at average gas generation cost
Increased off-system sales margins assumes reduced demand plus associated reserve requirements could be sold for $15kWmonth (after 2007 this is an avoided capacity expense)
Fuel Factor expense increase is increased fuel expense plus purchased capacity cost
GFT reduction is base revenue and fuel cost reductions times 91
Base revenue wDSM
552961968
562415810
569170954
576627290
585065115
594497922
604045383
613657938
623249716
632762255
644233714
Base revenue wo DSM
557087606
570008130
580983849
592794909
605393639
619267826
633200893
646996029
660941168
674903660
690679622
kWh sales wDSM
10776303000
10954134000
11076488000
11213088000
11369667000
11546488000
11724454000
11897588000
12077216000
12256861000
12476492000
kWh sales wo DSM
10861087000
11109639000
11319110000
11544588000
11787201000
12054717000
12323440000
12582205000
12851412000
13121980000
13429845000
1000
kW sales wDSM
2435000
2442000
2443000
2471000
2477000
2486000
2486000
2490000
2515000
2535000
2539000
kW sales wo DSM
2476000
2527000
2572000
2644000
2693000
2746000
2788000
2833000
2898000
2959000
3004000
Fuel Forecast
Budget 2006 (3905)
Tot-2006
Tot-2007
Tot-2008
Tot-2009
Tot-2010
Tot-2011
Tot-2012
Tot-2013
Tot-2014
Tot-2015
Total
MWH
STP
3303339
3488217
3514415
3360759
3465191
3507755
3405921
3614690
3482746
3515635
34658668
FPP
4564135
4517773
4465943
4451812
4418334
4545733
4554494
4586879
4445603
4245674
44796380
Decker
2839387
511212
504648
615748
583574
563845
570235
550098
594337
757598
8090682
Holly
235228
28425
- 0
- 0
- 0
- 0
- 0
- 0
- 0
263653
Sand Hill CC
1533962
1538343
1565132
1615597
1553452
1600111
1516183
1666799
1687122
14276700
SH GT
465155
427320
523864
450359
458722
498276
432337
492003
574949
4322986
Decker GT
157126
216800
280985
238803
246172
264900
238141
266139
294200
2203267
Existing DG
17340
7248
7296
7065
7216
7268
7168
7137
7147
16838
91723
Future DG
110
110
101
2216
2659
4743
5273
7365
7750
17746
48073
PurchasePower
131996
- 0
204000
208800
206400
206400
134400
201600
136000
139200
1568796
Landfill Methane
87493
92450
92704
92450
92450
92450
92704
92450
92450
92450
920052
Future Bioenergy
- 0
- 0
134151
178705
384764
454206
673445
744600
978509
1057336
4605716
Wind
636291
669050
671181
669050
669050
669050
671181
669050
669050
669050
6662004
Solar
684
20026
32685
41438
50311
59183
68298
76929
85801
87839
523193
Shortfall Energy
3308
2419
3355
6021
3311
4269
7050
3075
3868
4281
40957
11584082
11699976
11841366
12004048
12188020
12373249
12553456
12740532
12928204
13159918
123072851
(10512)
(1)
(1)
0
0
(0)
1
1
(0)
0
(10505)
Dollars
STP
14024307
16411783
18054617
17815007
18997196
19874461
19872833
21713134
21541492
22417754
190722584
FPP
47959978
48327184
52942730
56530034
57287196
60262126
61527986
62666810
62927556
61809806
572241406
Decker
161242451
30007075
26150797
28534975
26297430
25902979
27510734
27253106
30904024
41053837
424857407
Holly
15649395
1939153
- 0
- 0
- 0
- 0
- 0
- 0
- 0
17588548
Sand Hill CC
71819840
62147912
53829988
54696364
53773560
56880544
56723452
64324432
66378796
540574888
SH GT
28915407
23018682
25201605
20614580
21546020
24873781
22042049
25993318
31798432
224003872
Decker GT
12129491
14068039
16315347
13248144
14062711
15831205
14654486
17002591
19718490
137030504
Existing DG
1066126
482134
392821
350785
361063
372817
379318
391499
407877
1055934
5260373
Future DG
5688
5352
3321
115774
140956
247241
281454
413559
455875
1154808
2824028
PurchasePower
5000000
- 0
17339160
16429042
16415314
16614357
11144008
17017280
11632503
11967200
123558864
Landfill Methane
3535734
3653844
3663855
3653844
3653844
3653844
3663855
3653844
3653844
3653844
36440353
Future Bioenergy
- 0
- 0
6036769
8041681
17314398
20439270
30305016
33507000
44032792
47579944
207256869
Wind
17374835
18256537
18314921
18256537
18256537
18256537
18314921
18256537
18256537
18256537
181800436
Solar
- 0
- 0
- 0
- 0
- 0
- 0
- 0
- 0
- 0
- 0
- 0
Shortfall Energy
248086
181420
251636
451599
248349
320172
528742
230590
290120
321058
3071771
250457205
245839462
244324412
245526217
247531370
255326093
271114397
278523346
301422961
327166440
2667231902
1792964
10
(12)
6
(1)
10
(27)
4
3
(6)
1793341
Gas MWh
2839387
2902683
2715536
2985730
2888333
2822192
2933522
2736759
3019278
3313869
29157288
Gas cost ($)
161242451
158521208
127324584
123881915
114856517
115285269
125096264
120673092
138224364
158949555
1344055218
Avg gas gen Cost ($MWh)
5679
5461
4689
4149
3977
4085
4264
4409
4578
4796
4610
NO DSM FUEL FACTOR
2006
2007
2008
2009
2010
2011
2012
2013
2014
2015
Thermal Unit Fuel Cost
232662512
236980848
213398064
215549344
211851680
220956944
237247920
240469984
264099856
293228672
Shortfall Purchases
248086
181420
251636
451599
248349
320172
528742
230590
290120
321058
Short-Term Power Purchases
5000000
- 0
29016660
31009042
33965314
36999357
34296508
42869780
40252503
43354700
Fuel Cell Gas Cost
119837
119837
119837
119837
119837
119837
119837
119837
119837
119837
Recoverable ERCOT Expenses
16825273
16825273
16825273
16825273
16825273
16825273
16825273
16825273
16825273
16825273
Fuel Factor Renewables
9998882
9706333
14540565
15223226
23255836
23418594
31052373
32981926
42305054
44649542
Total Fuel Factor Revenue
264854590
263813711
274152035
279178321
286266289
298640176
320070653
333497390
363892643
398499082
Total Renewables
20910569
21910381
28015544
29952062
39224779
42349651
52283792
55417381
65943173
69490325
TotThermal+PurchPwr+Renewables
249864319
245834121
244321076
245522607
247527546
255322004
271110126
278519139
301418805
327162135
Estimated Green Choice Sales
10911686
12204048
13474979
14728836
15968943
18931058
21231418
22435455
23638119
24840783
Fuel Factor Renewables
9998882
9706333
14540565
15223226
23255836
23418594
31052373
32981926
42305054
44649542
Forecast Annual GWh Sales
11110
11319
11545
11787
12055
12323
12582
12851
13122
13430
Average cost per kWh
$ 0023840
$ 0023307
$ 0023747
$ 0023685
$ 0023747
$ 0024234
$ 0025438
$ 0025950
$ 0027732
$ 0029673
Fuel Factors
Secondary
$ 0023475
$ 0022733
$ 0022206
$ 0021895
$ 0021627
$ 0021713
$ 0022535
$ 0022717
$ 0024162
$ 0025715
Primary
$ 0022776
$ 0022056
$ 0021545
$ 0021243
$ 0020984
$ 0021067
$ 0021864
$ 0022041
$ 0023443
$ 0024949
Transmission
$ 0022539
$ 0021828
$ 0021321
$ 0021022
$ 0020766
$ 0020848
$ 0021637
$ 0021812
$ 0023200
$ 0024690
2006
2007
2008
2009
2010
2011
2012
2013
2014
2015
Dag generation
11574
11700
11841
12004
12188
12373
12553
12741
12928
13160
Joe generation
11584
11700
11841
12004
12188
12373
12553
12741
12928
13160
difference
(10)
0
(0)
(0)
(0)
(0)
(0)
0
(0)
0
sales
10954
11076
11213
11370
11546
11724
11898
12077
12257
12476
losses
57
56
56
56
56
55
55
55
55
55
With DSM
Thermal Unit Fuel Cost wDSM
223705664
223742320
198714736
198689904
191639104
196037824
207153584
205853888
223553008
245383552
Short-Term Power Purchases
5000000
- 0
17339160
16429042
16415314
16614357
11144008
17017280
11632503
11967200
Average cost per kWh
$ 0023361
$ 0022623
$ 0022099
$ 0021789
$ 0021523
$ 0021608
$ 0022426
$ 0022607
$ 0024046
$ 0025590
Forecast Annual GWh Sales
10954
11076
11213
11370
11546
11724
11898
12077
12257
12476
255897742
250575183
247791207
247738881
248503713
253336056
266823817
273028794
294725795
319266462
CASH FLOW PURCHASE OPTION
2005
2006
2007
2008
2009
2010
2011
2012
2013
2014
2015
Base revenue reduction
4125638
7592320
11812895
16167619
20328524
24769904
29155510
33338091
37691451
42141405
46445908
Fuel cost reduction
5166240
8956848
13238528
14683328
16859440
20212576
24919120
30094336
34616096
40546848
47845120
Potential off-system sales margins
2767500
5737500
8707500
Capacity cost reduction
12000000
15000000
18000000
21000000
24000000
27000000
30000000
33000000
GFT reduction
845561
660413
773705
527757
576669
709301
827386
851560
807636
944644
1055853
845560920627699
Program cost
20689324
22819634
22819634
22819634
22819634
22819634
22819634
22819634
22819634
22819634
22819634
Recovery through base rates
14405492
14639186
14799075
14977916
15183688
15416391
15650684
15878624
16115254
16352636
16645725
Cash flow
-6796409
-9374854
-10352249
-23481580
-27387801
-31463846
-35497075
-39427542
-43588195
-47663759
-51563965
2005
2006
2007
2008
2009
2010
2011
2012
2013
2014
2015
Base Revenue Reduction
$ (4125638)
$ (7592320)
$ (11812895)
$ (16167619)
$ (20328524)
$ (24769904)
$ (29155510)
$ (33338091)
$ (37691451)
$ (42141405)
$ (46445908)
Fuel Revenue Reduction
$ (5166240)
$ (8956848)
$ (13238528)
$ (26683328)
$ (31859440)
$ (38212576)
$ (45919120)
$ (54094336)
$ (61616096)
$ (70546848)
$ (80845120)
Fuel Cost Reduction
$ 5166240
$ 8956848
$ 13238528
$ 26683328
$ 31859440
$ 38212576
$ 45919120
$ 54094336
$ 61616096
$ 70546848
$ 80845120
Potential off-system sales margins
$ 2767500
$ 5737500
$ 8707500
$ - 0
$ - 0
$ - 0
$ - 0
$ - 0
$ - 0
$ - 0
$ - 0
Net program costs
$ (5438271)
$ (7520034)
$ (7246854)
$ (7313961)
$ (7059277)
$ (6693942)
$ (6341565)
$ (6089451)
$ (5896744)
$ (5522354)
$ (5118057)
AEs net cash impact
$ (6796409)
$ (9374854)
$ (10352249)
$ (23481580)
$ (27387801)
$ (31463846)
$ (35497075)
$ (39427542)
$ (43588195)
$ (47663759)
$ (51563965)
Customer savings
$ 9291878
$ 16549168
$ 25051423
$ 42850947
$ 52187964
$ 62982480
$ 75074630
$ 87432427
$ 99307547
$ 112688253
$ 127291028
CASH FLOW BUILD OPTION
2005
2006
2007
2008
2009
2010
2011
2012
2013
2014
2015
Base revenue reduction
4125638
7592320
11812895
16167619
20328524
24769904
29155510
33338091
37691451
42141405
46445908
Fuel cost reduction
5166240
8956848
13238528
14683328
16859440
20212576
24919120
30094336
34616096
40546848
47845120
Potential off-system sales margins
2767500
5737500
8707500
Capacity cost reduction
7736295
11604442
11604442
15472589
15472589
19340737
19340737
23208884
GFT reduction
845561
660413
773705
527757
576669
709301
827386
851560
807636
944644
1055853
Program cost
20689324
22819634
22819634
22819634
22819634
22819634
22819634
22819634
22819634
22819634
22819634
Recovery through base rates
14405492
14639186
14799075
14977916
15183688
15416391
15650684
15878624
16115254
16352636
16645725
Cash flow
-6796409
-9374854
-10352249
-15745285
-15783359
-19859404
-20024486
-23954952
-24247459
-28323022
-28355080
-21195738994
Capacity cost Build option
Reduced capacity requirement (kW)
46125
95625
145125
194625
243000
292500
339750
385875
430875
477000
523125
Capacity added
200
300
300
400
400
500
500
600
Annual capacity cost
$386814737
$7736295
$11604442
$11604442
$15472589
$15472589
$19340737
$19340737
$23208884
Capacity cost Buy option
Reduced capacity requirement (kW)
46125
95625
145125
194625
243000
292500
339750
385875
430875
477000
523125
Capacity added
200
250
300
350
400
450
500
550
Annual capacity cost
$600000000
$12000000
$15000000
$18000000
$21000000
$24000000
$27000000
$30000000
$33000000
1994
2004
2005
2006
2007
2008
2009
2010
2011
2012
2013
2014
2015
Net MWh to system
7659242
10855000
11388814
11573570
11699976
11841366
12004047
12188019
12373248
12553455
12740532
12928203
13159916
Revenue multiplier
100
142
149
151
153
155
157
159
162
164
166
169
172
Revenue allocated to DSM
9688028
13730281
14405492
14639186
14799075
14977916
15183688
15416391
15650684
15878624
16115254
16352636
16645725
CentskWh in rates for DSM
0134
0134
0134
0134
0134
0134
0134
0133
0133
0133
0133
0133
Annual sales (MWh)
10262000
10776303
10954134
11076488
11213088
11369667
11546488
11724454
11897588
12077216
12256861
12476492
2006
2006
2007
2007
2008
2008
2009
2009
2010
2010
2011
2011
2012
2012
2013
2013
2014
2014
2015
2015
2005
2005
2005
2006
2006
2006
2007
2007
2007
2008
2008
2008
2009
2009
2009
2010
2010
2010
2011
2011
2011
2012
2012
2012
2013
2013
2013
2014
2014
2014
2015
2015
2015
2005
2006
2007
2008
2009
2010
2011
2012
2013
2014
2015
Base Revenue Reduction
$ (4125638)
$ (7592320)
$ (11812895)
$ (16167619)
$ (20328524)
$ (24769904)
$ (29155510)
$ (33338091)
$ (37691451)
$ (42141405)
$ (46445908)
Fuel Revenue Reduction
$ (5166240)
$ (8956848)
$ (13238528)
$ (26683328)
$ (31859440)
$ (38212576)
$ (45919120)
$ (54094336)
$ (61616096)
$ (70546848)
$ (80845120)
Fuel Cost Reduction
$ 5166240
$ 8956848
$ 13238528
$ 26683328
$ 31859440
$ 38212576
$ 45919120
$ 54094336
$ 61616096
$ 70546848
$ 80845120
Potential off-system sales margins
$ 2767500
$ 5737500
$ 8707500
$ - 0
$ - 0
$ - 0
$ - 0
$ - 0
$ - 0
$ - 0
$ - 0
Net program costs
$ (5438271)
$ (7520034)
$ (7246854)
$ (7313961)
$ (7059277)
$ (6693942)
$ (6341565)
$ (6089451)
$ (5896744)
$ (5522354)
$ (5118057)
AEs net cash impact
$ (6796409)
$ (9374854)
$ (10352249)
$ (23481580)
$ (27387801)
$ (31463846)
$ (35497075)
$ (39427542)
$ (43588195)
$ (47663759)
$ (51563965)
Customer savings
$ (9291878)
$ (16549168)
$ (25051423)
$ (42850947)
$ (52187964)
$ (62982480)
$ (75074630)
$ (87432427)
$ (99307547)
$ (112688253)
$ (127291028)
Estimated Annual Impact
Base Revenue Reduction
$ (16134252)
Fuel Revenue Reduction
$ (23790144)
Fuel Cost Reduction
$ 23790144
Potential off-system sales margins
$ 2889000
Net program costs
$ (7166814)
AEs net cash impact
$ (20412066)
Customer savings
$ (39924396)
CURRENT FORECAST
PROPOSED PROJECTION
DSM Analysis
2007
2008
2007
2008
keyed in to round
Base Revenue Reduction
(12000000)
(16000000)
(12000000)
(16000000)
Fuel Revenue Reduction
(13000000)
(15000000)
(5000000)
(7000000)
Customer Savings (Bill Reduction)
(25000000)
(31000000)
(17000000)
(23000000)
Fuel Cost Reduction
13000000
15000000
5000000
7000000
KW
$KW
NET
5 profit
Potential Off-system Capacity Sales
9000000
9000000
6207
$KW
145000
$ 62
$ 8990000
Net of fuel and GFT
$ 449500
TCOS Expense Reduction
900000
1000000
900000
1000000
GFT Reduction
2000000
3000000
2000000
3000000
Program Cost
(23000000)
(23000000)
Recovery through Base Rates
15000000
15000000
AEs Net Income Impact
(8100000)
(20000000)
(17100000)
(35000000)
Deferred Cost of Capacity
12000000
- 0
AEs Net Cash Impact
(8100000)
(8000000)
(17100000)
- 0
Outline for Oct 10 Leadership Team Update
1 Components of BenefitCost Ratios
2 Cash Flow of DSM
CURRENT FORECAST
PROPOSED PROJECTION
DSM Analysis
2007
2008
2007
2008
Base Revenue Reduction
(11812895)
(16167619)
(11812895)
(16167619)
Fuel Revenue Reduction
(13238528)
(14683328)
(5217969)
(5396810)
Fuel Cost Reduction
13238528
14683328
5217969
5396810
Potential off-system sales margins
8707500
8707500
Fuel Revenue Increase-Capacity
12000000
12000000
Fuel Cost Increase-Capacity
(12000000)
(12000000)
TCOS expense reduction
925987
977987
925987
977987
GFT reduction
2279680
2807436
2279680
2807436
Program cost
(22819634)
(22819634)
Recovery through base rates
14799075
14977916
AEs net income impact
(7920288)
(20223914)
100271
(12382196)
Deferred Cost of Capacity
12000000
12000000
AEs net cash impact including deferral
(7920288)
(8223914)
100271
(382196)
Customer savings-(net)
$ (25051423)
$ (30850947)
$ (17030864)
$ (21564429)
Recommend recovery thru fuel factor
Offset customer fuel savings due to DSM
Would not offset revenue loss
(before amp after)
In 2007 we still have excess capacity
Cost recovery
3yrs - recommended purch power
power is only needed during peak-dont utilize a plant
need declines as renewables increases
cash flow
Dynamic pricing-TOU rates motivating cust to conserve energy
would replace some of the energy efficiency rebates
option to self-generate
TCOS expense reduction due to DSM savings
Historical
Historical
Historical
Historical
Historical
Preliminary
Forecast
Forecast
Forecast
Forecast
Forecast
Forecast
Forecast
Forecast
Forecast
Forecast
2000
2001
2002
2003
2004
2005
2006
2007
2008
2009
2010
2011
2012
2013
2014
2015
ERCOT Postage Stamp Rate
1476
1528
1661
1778
1925
2055
2185
2315
2445
2575
2705
2835
2965
3095
3225
3355
Estimated DSM-kW savings applied to average 4CP
40000
40000
40000
40000
40000
40000
40000
40000
40000
40000
40000
Reduction to TCOS expense
$ 821987
$ 873987
$ 925987
$ 977987
$ 1029987
$ 1081987
$ 1133987
$ 1185987
$ 1237987
$ 1289987
$ 1341987
2005
2006
2007
2008
2009
2010
2011
2012
2013
2014
2015
Base revenue reduction
4125638
7592320
11812895
16167619
20328524
24769904
29155510
33338091
37691451
42141405
46445908
kWh reduction
84784000
155505000
242622000
331500000
417534000
508229000
598986000
684617000
774196000
865119000
953353000
Fuel cost reduction
5166240
8956848
13238528
14683328
16859440
20212576
24919120
30094336
34616096
40546848
47845120
Demand reduction (kW)
41000
85000
129000
173000
216000
260000
302000
343000
383000
424000
465000
Reduced reserve requirement (kW)
5125
10625
16125
21625
27000
32500
37750
42875
47875
53000
58125
2008
2009
2010
2011
2012
2013
2014
2015
Reduced capacity requirement (kW)
46125
95625
145125
194625
243000
292500
339750
385875
430875
477000
523125
194625
243000
292500
339750
385875
430875
477000
523125
Increased off-system sales margins
2767500
5737500
8707500
Capacity cost reduction
11677500
14580000
17550000
20385000
23152500
25852500
28620000
31387500
Fuel Factor expense decrease ($)
5166240
8956848
13238528
26360828
31439440
37762576
45304120
53246836
60468596
69166848
79232620
Fuel Factor decrease (centskWh)
00005
00007
00016
00019
00022
00026
00030
00033
00037
00041
Fuel Factor decrease
2
3
7
9
10
12
13
15
15
16
GFT reduction
845561
1505974
2279680
2807436
3384105
4093406
4920791
5772351
6579987
7524631
8580484
Program cost
20689324
22819634
22819634
22819634
22819634
22819634
22819634
22819634
22819634
22819634
22819634
Recovery through base rates
14405492
14639186
14799075
14977916
15183688
15416391
15650684
15878624
16115254
16352636
16645725
Cash flow
-7641970
-10035268
-11125954
-12331837
-13384470
-14623147
-15939461
-17126601
-18543331
-19988403
-21232317
Fuel cost savings assume all saved energy at average gas generation cost
Increased off-system sales margins assumes reduced demand plus associated reserve requirements could be sold for $15kWmonth (after 2007 this is an avoided capacity expense)
Fuel Factor expense increase is increased fuel expense plus purchased capacity cost
GFT reduction is base revenue and fuel cost reductions times 91
Base revenue wDSM
552961968
562415810
569170954
576627290
585065115
594497922
604045383
613657938
623249716
632762255
644233714
Base revenue wo DSM
557087606
570008130
580983849
592794909
605393639
619267826
633200893
646996029
660941168
674903660
690679622
kWh sales wDSM
10776303000
10954134000
11076488000
11213088000
11369667000
11546488000
11724454000
11897588000
12077216000
12256861000
12476492000
kWh sales wo DSM
10861087000
11109639000
11319110000
11544588000
11787201000
12054717000
12323440000
12582205000
12851412000
13121980000
13429845000
1000
kW sales wDSM
2435000
2442000
2443000
2471000
2477000
2486000
2486000
2490000
2515000
2535000
2539000
kW sales wo DSM
2476000
2527000
2572000
2644000
2693000
2746000
2788000
2833000
2898000
2959000
3004000
Fuel Forecast
Budget 2006 (3905)
Tot-2006
Tot-2007
Tot-2008
Tot-2009
Tot-2010
Tot-2011
Tot-2012
Tot-2013
Tot-2014
Tot-2015
Total
MWH
STP
3303339
3488217
3514415
3360759
3465191
3507755
3405921
3614690
3482746
3515635
34658668
FPP
4564135
4517773
4465943
4451812
4418334
4545733
4554494
4586879
4445603
4245674
44796380
Decker
2839387
511212
504648
615748
583574
563845
570235
550098
594337
757598
8090682
Holly
235228
28425
- 0
- 0
- 0
- 0
- 0
- 0
- 0
263653
Sand Hill CC
1533962
1538343
1565132
1615597
1553452
1600111
1516183
1666799
1687122
14276700
SH GT
465155
427320
523864
450359
458722
498276
432337
492003
574949
4322986
Decker GT
157126
216800
280985
238803
246172
264900
238141
266139
294200
2203267
Existing DG
17340
7248
7296
7065
7216
7268
7168
7137
7147
16838
91723
Future DG
110
110
101
2216
2659
4743
5273
7365
7750
17746
48073
PurchasePower
131996
- 0
204000
208800
206400
206400
134400
201600
136000
139200
1568796
Landfill Methane
87493
92450
92704
92450
92450
92450
92704
92450
92450
92450
920052
Future Bioenergy
- 0
- 0
134151
178705
384764
454206
673445
744600
978509
1057336
4605716
Wind
636291
669050
671181
669050
669050
669050
671181
669050
669050
669050
6662004
Solar
684
20026
32685
41438
50311
59183
68298
76929
85801
87839
523193
Shortfall Energy
3308
2419
3355
6021
3311
4269
7050
3075
3868
4281
40957
11584082
11699976
11841366
12004048
12188020
12373249
12553456
12740532
12928204
13159918
123072851
(10512)
(1)
(1)
0
0
(0)
1
1
(0)
0
(10505)
Dollars
STP
14024307
16411783
18054617
17815007
18997196
19874461
19872833
21713134
21541492
22417754
190722584
FPP
47959978
48327184
52942730
56530034
57287196
60262126
61527986
62666810
62927556
61809806
572241406
Decker
161242451
30007075
26150797
28534975
26297430
25902979
27510734
27253106
30904024
41053837
424857407
Holly
15649395
1939153
- 0
- 0
- 0
- 0
- 0
- 0
- 0
17588548
Sand Hill CC
71819840
62147912
53829988
54696364
53773560
56880544
56723452
64324432
66378796
540574888
SH GT
28915407
23018682
25201605
20614580
21546020
24873781
22042049
25993318
31798432
224003872
Decker GT
12129491
14068039
16315347
13248144
14062711
15831205
14654486
17002591
19718490
137030504
Existing DG
1066126
482134
392821
350785
361063
372817
379318
391499
407877
1055934
5260373
Future DG
5688
5352
3321
115774
140956
247241
281454
413559
455875
1154808
2824028
PurchasePower
5000000
- 0
17339160
16429042
16415314
16614357
11144008
17017280
11632503
11967200
123558864
Landfill Methane
3535734
3653844
3663855
3653844
3653844
3653844
3663855
3653844
3653844
3653844
36440353
Future Bioenergy
- 0
- 0
6036769
8041681
17314398
20439270
30305016
33507000
44032792
47579944
207256869
Wind
17374835
18256537
18314921
18256537
18256537
18256537
18314921
18256537
18256537
18256537
181800436
Solar
- 0
- 0
- 0
- 0
- 0
- 0
- 0
- 0
- 0
- 0
- 0
Shortfall Energy
248086
181420
251636
451599
248349
320172
528742
230590
290120
321058
3071771
250457205
245839462
244324412
245526217
247531370
255326093
271114397
278523346
301422961
327166440
2667231902
1792964
10
(12)
6
(1)
10
(27)
4
3
(6)
1793341
Gas MWh
2839387
2902683
2715536
2985730
2888333
2822192
2933522
2736759
3019278
3313869
29157288
Gas cost ($)
161242451
158521208
127324584
123881915
114856517
115285269
125096264
120673092
138224364
158949555
1344055218
Avg gas gen Cost ($MWh)
5679
5461
4689
4149
3977
4085
4264
4409
4578
4796
4610
NO DSM FUEL FACTOR
2006
2007
2008
2009
2010
2011
2012
2013
2014
2015
Thermal Unit Fuel Cost
232662512
236980848
213398064
215549344
211851680
220956944
237247920
240469984
264099856
293228672
Shortfall Purchases
248086
181420
251636
451599
248349
320172
528742
230590
290120
321058
Short-Term Power Purchases
5000000
- 0
29016660
31009042
33965314
36999357
34296508
42869780
40252503
43354700
Fuel Cell Gas Cost
119837
119837
119837
119837
119837
119837
119837
119837
119837
119837
Recoverable ERCOT Expenses
16825273
16825273
16825273
16825273
16825273
16825273
16825273
16825273
16825273
16825273
Fuel Factor Renewables
9998882
9706333
14540565
15223226
23255836
23418594
31052373
32981926
42305054
44649542
Total Fuel Factor Revenue
264854590
263813711
274152035
279178321
286266289
298640176
320070653
333497390
363892643
398499082
Total Renewables
20910569
21910381
28015544
29952062
39224779
42349651
52283792
55417381
65943173
69490325
TotThermal+PurchPwr+Renewables
249864319
245834121
244321076
245522607
247527546
255322004
271110126
278519139
301418805
327162135
Estimated Green Choice Sales
10911686
12204048
13474979
14728836
15968943
18931058
21231418
22435455
23638119
24840783
Fuel Factor Renewables
9998882
9706333
14540565
15223226
23255836
23418594
31052373
32981926
42305054
44649542
Forecast Annual GWh Sales
11110
11319
11545
11787
12055
12323
12582
12851
13122
13430
Average cost per kWh
$ 0023840
$ 0023307
$ 0023747
$ 0023685
$ 0023747
$ 0024234
$ 0025438
$ 0025950
$ 0027732
$ 0029673
Fuel Factors
Secondary
$ 0023475
$ 0022733
$ 0022206
$ 0021895
$ 0021627
$ 0021713
$ 0022535
$ 0022717
$ 0024162
$ 0025715
Primary
$ 0022776
$ 0022056
$ 0021545
$ 0021243
$ 0020984
$ 0021067
$ 0021864
$ 0022041
$ 0023443
$ 0024949
Transmission
$ 0022539
$ 0021828
$ 0021321
$ 0021022
$ 0020766
$ 0020848
$ 0021637
$ 0021812
$ 0023200
$ 0024690
2006
2007
2008
2009
2010
2011
2012
2013
2014
2015
Dag generation
11574
11700
11841
12004
12188
12373
12553
12741
12928
13160
Joe generation
11584
11700
11841
12004
12188
12373
12553
12741
12928
13160
difference
(10)
0
(0)
(0)
(0)
(0)
(0)
0
(0)
0
sales
10954
11076
11213
11370
11546
11724
11898
12077
12257
12476
losses
57
56
56
56
56
55
55
55
55
55
With DSM
Thermal Unit Fuel Cost wDSM
223705664
223742320
198714736
198689904
191639104
196037824
207153584
205853888
223553008
245383552
Short-Term Power Purchases
5000000
- 0
17339160
16429042
16415314
16614357
11144008
17017280
11632503
11967200
Average cost per kWh
$ 0023361
$ 0022623
$ 0022099
$ 0021789
$ 0021523
$ 0021608
$ 0022426
$ 0022607
$ 0024046
$ 0025590
Forecast Annual GWh Sales
10954
11076
11213
11370
11546
11724
11898
12077
12257
12476
255897742
250575183
247791207
247738881
248503713
253336056
266823817
273028794
294725795
319266462
CASH FLOW PURCHASE OPTION
2005
2006
2007
2008
2009
2010
2011
2012
2013
2014
2015
Base revenue reduction
4125638
7592320
11812895
16167619
20328524
24769904
29155510
33338091
37691451
42141405
46445908
Fuel cost reduction
5166240
8956848
13238528
14683328
16859440
20212576
24919120
30094336
34616096
40546848
47845120
Potential off-system sales margins
2767500
5737500
8707500
Capacity cost reduction
12000000
15000000
18000000
21000000
24000000
27000000
30000000
33000000
GFT reduction
845561
660413
773705
527757
576669
709301
827386
851560
807636
944644
1055853
845560920627699
Program cost
20689324
22819634
22819634
22819634
22819634
22819634
22819634
22819634
22819634
22819634
22819634
Recovery through base rates
14405492
14639186
14799075
14977916
15183688
15416391
15650684
15878624
16115254
16352636
16645725
Cash flow
-6796409
-9374854
-10352249
-23481580
-27387801
-31463846
-35497075
-39427542
-43588195
-47663759
-51563965
2005
2006
2007
2008
2009
2010
2011
2012
2013
2014
2015
Base Revenue Reduction
$ (4125638)
$ (7592320)
$ (11812895)
$ (16167619)
$ (20328524)
$ (24769904)
$ (29155510)
$ (33338091)
$ (37691451)
$ (42141405)
$ (46445908)
Fuel Revenue Reduction
$ (5166240)
$ (8956848)
$ (13238528)
$ (26683328)
$ (31859440)
$ (38212576)
$ (45919120)
$ (54094336)
$ (61616096)
$ (70546848)
$ (80845120)
Fuel Cost Reduction
$ 5166240
$ 8956848
$ 13238528
$ 26683328
$ 31859440
$ 38212576
$ 45919120
$ 54094336
$ 61616096
$ 70546848
$ 80845120
Potential off-system sales margins
$ 2767500
$ 5737500
$ 8707500
$ - 0
$ - 0
$ - 0
$ - 0
$ - 0
$ - 0
$ - 0
$ - 0
Net program costs
$ (5438271)
$ (7520034)
$ (7246854)
$ (7313961)
$ (7059277)
$ (6693942)
$ (6341565)
$ (6089451)
$ (5896744)
$ (5522354)
$ (5118057)
AEs net cash impact
$ (6796409)
$ (9374854)
$ (10352249)
$ (23481580)
$ (27387801)
$ (31463846)
$ (35497075)
$ (39427542)
$ (43588195)
$ (47663759)
$ (51563965)
Customer savings
$ 9291878
$ 16549168
$ 25051423
$ 42850947
$ 52187964
$ 62982480
$ 75074630
$ 87432427
$ 99307547
$ 112688253
$ 127291028
CASH FLOW BUILD OPTION
2005
2006
2007
2008
2009
2010
2011
2012
2013
2014
2015
Base revenue reduction
4125638
7592320
11812895
16167619
20328524
24769904
29155510
33338091
37691451
42141405
46445908
Fuel cost reduction
5166240
8956848
13238528
14683328
16859440
20212576
24919120
30094336
34616096
40546848
47845120
Potential off-system sales margins
2767500
5737500
8707500
Capacity cost reduction
7736295
11604442
11604442
15472589
15472589
19340737
19340737
23208884
GFT reduction
845561
660413
773705
527757
576669
709301
827386
851560
807636
944644
1055853
Program cost
20689324
22819634
22819634
22819634
22819634
22819634
22819634
22819634
22819634
22819634
22819634
Recovery through base rates
14405492
14639186
14799075
14977916
15183688
15416391
15650684
15878624
16115254
16352636
16645725
Cash flow
-6796409
-9374854
-10352249
-15745285
-15783359
-19859404
-20024486
-23954952
-24247459
-28323022
-28355080
-21195738994
Capacity cost Build option
Reduced capacity requirement (kW)
46125
95625
145125
194625
243000
292500
339750
385875
430875
477000
523125
Capacity added
200
300
300
400
400
500
500
600
Annual capacity cost
$386814737
$7736295
$11604442
$11604442
$15472589
$15472589
$19340737
$19340737
$23208884
Capacity cost Buy option
Reduced capacity requirement (kW)
46125
95625
145125
194625
243000
292500
339750
385875
430875
477000
523125
Capacity added
200
250
300
350
400
450
500
550
Annual capacity cost
$600000000
$12000000
$15000000
$18000000
$21000000
$24000000
$27000000
$30000000
$33000000
1994
2004
2005
2006
2007
2008
2009
2010
2011
2012
2013
2014
2015
Net MWh to system
7659242
10855000
11388814
11573570
11699976
11841366
12004047
12188019
12373248
12553455
12740532
12928203
13159916
Revenue multiplier
100
142
149
151
153
155
157
159
162
164
166
169
172
Revenue allocated to DSM
9688028
13730281
14405492
14639186
14799075
14977916
15183688
15416391
15650684
15878624
16115254
16352636
16645725
CentskWh in rates for DSM
0134
0134
0134
0134
0134
0134
0134
0133
0133
0133
0133
0133
Annual sales (MWh)
10262000
10776303
10954134
11076488
11213088
11369667
11546488
11724454
11897588
12077216
12256861
12476492
2006
2006
2007
2007
2008
2008
2009
2009
2010
2010
2011
2011
2012
2012
2013
2013
2014
2014
2015
2015
2005
2005
2005
2006
2006
2006
2007
2007
2007
2008
2008
2008
2009
2009
2009
2010
2010
2010
2011
2011
2011
2012
2012
2012
2013
2013
2013
2014
2014
2014
2015
2015
2015
2005
2006
2007
2008
2009
2010
2011
2012
2013
2014
2015
Base Revenue Reduction
$ (4125638)
$ (7592320)
$ (11812895)
$ (16167619)
$ (20328524)
$ (24769904)
$ (29155510)
$ (33338091)
$ (37691451)
$ (42141405)
$ (46445908)
Fuel Revenue Reduction
$ (5166240)
$ (8956848)
$ (13238528)
$ (26683328)
$ (31859440)
$ (38212576)
$ (45919120)
$ (54094336)
$ (61616096)
$ (70546848)
$ (80845120)
Fuel Cost Reduction
$ 5166240
$ 8956848
$ 13238528
$ 26683328
$ 31859440
$ 38212576
$ 45919120
$ 54094336
$ 61616096
$ 70546848
$ 80845120
Potential off-system sales margins
$ 2767500
$ 5737500
$ 8707500
$ - 0
$ - 0
$ - 0
$ - 0
$ - 0
$ - 0
$ - 0
$ - 0
Net program costs
$ (5438271)
$ (7520034)
$ (7246854)
$ (7313961)
$ (7059277)
$ (6693942)
$ (6341565)
$ (6089451)
$ (5896744)
$ (5522354)
$ (5118057)
AEs net cash impact
$ (6796409)
$ (9374854)
$ (10352249)
$ (23481580)
$ (27387801)
$ (31463846)
$ (35497075)
$ (39427542)
$ (43588195)
$ (47663759)
$ (51563965)
Customer savings
$ (9291878)
$ (16549168)
$ (25051423)
$ (42850947)
$ (52187964)
$ (62982480)
$ (75074630)
$ (87432427)
$ (99307547)
$ (112688253)
$ (127291028)
Estimated Annual Impact
Base Revenue Reduction
$ (16134252)
Fuel Revenue Reduction
$ (23790144)
Fuel Cost Reduction
$ 23790144
Potential off-system sales margins
$ 2889000
Net program costs
$ (7166814)
AEs net cash impact
$ (20412066)
Customer savings
$ (39924396)
CURRENT FORECAST
PROPOSED PROJECTION
DSM Analysis
2007
2008
2007
2008
keyed in to round
Base Revenue Reduction
(12000000)
(16000000)
(12000000)
(16000000)
Fuel Revenue Reduction
(13000000)
(15000000)
(5000000)
(7000000)
Fuel Cost Reduction
13000000
15000000
5000000
7000000
KW
$KW
NET
5 profit
Potential off-system capacity sales
9000000
9000000
6207
$KW
145000
$ 62
$ 8990000
Net of fuel and GFT
$ 449500
Fuel Revenue Increase-Capacity
12000000
12000000
6154
$KW
195000
$ 62
$ 12090000
Fuel Cost Increase-Capacity
(12000000)
(12000000)
TCOS expense reduction
900000
1000000
900000
1000000
GFT reduction
2000000
3000000
2000000
3000000
Program cost
(23000000)
(23000000)
Recovery through base rates
15000000
15000000
AEs net income impact
(8100000)
(20000000)
(100000)
(12000000)
Deferred Cost of Capacity
12000000
12000000
AEs net cash impact
(8100000)
(8000000)
(100000)
- 0
Customer savings-(net)
$ (25000000)
$ (31000000)
$ (17000000)
$ (35000000)
Outline for Oct 10 Leadership Team Update
1 Components of BenefitCost Ratios
2 Cash Flow of DSM
CURRENT FORECAST
PROPOSED PROJECTION
DSM Analysis
2007
2008
2007
2008
Base Revenue Reduction
(11812895)
(16167619)
(11812895)
(16167619)
Fuel Revenue Reduction
(13238528)
(14683328)
(5217969)
(5396810)
Fuel Cost Reduction
13238528
14683328
5217969
5396810
Potential off-system sales margins
8707500
8707500
Fuel Revenue Increase-Capacity
12000000
12000000
Fuel Cost Increase-Capacity
(12000000)
(12000000)
TCOS expense reduction
925987
977987
925987
977987
GFT reduction
2279680
2807436
2279680
2807436
Program cost
(22819634)
(22819634)
Recovery through base rates
14799075
14977916
AEs net income impact
(7920288)
(20223914)
100271
(12382196)
Deferred Cost of Capacity
12000000
12000000
AEs net cash impact including deferral
(7920288)
(8223914)
100271
(382196)
Customer savings-(net)
$ (25051423)
$ (30850947)
$ (17030864)
$ (33564429)
Recommend recovery thru fuel factor
Offset customer fuel savings due to DSM
Would not offset revenue loss
(before amp after)
In 2007 we still have excess capacity
Cost recovery
3yrs - recommended purch power
power is only needed during peak-dont utilize a plant
need declines as renewables increases
cash flow
Dynamic pricing-TOU rates motivating cust to conserve energy
would replace some of the energy efficiency rebates
option to self-generate
TCOS expense reduction due to DSM savings
Historical
Historical
Historical
Historical
Historical
Preliminary
Forecast
Forecast
Forecast
Forecast
Forecast
Forecast
Forecast
Forecast
Forecast
Forecast
2000
2001
2002
2003
2004
2005
2006
2007
2008
2009
2010
2011
2012
2013
2014
2015
ERCOT Postage Stamp Rate
1476
1528
1661
1778
1925
2055
2185
2315
2445
2575
2705
2835
2965
3095
3225
3355
Estimated DSM-kW savings applied to average 4CP
40000
40000
40000
40000
40000
40000
40000
40000
40000
40000
40000
Reduction to TCOS expense
$ 821987
$ 873987
$ 925987
$ 977987
$ 1029987
$ 1081987
$ 1133987
$ 1185987
$ 1237987
$ 1289987
$ 1341987
Saving Energy TogetherPower SaverTM Program
Load ShiftingTime-of-Use Rate
Thermal Energy
Storage Systems
Load Shifting Strategy
Represent 6 of new DSM program mix
Saving Energy TogetherPower SaverTM Program
Load ShiftingABIA Thermal Energy Storage Profile ndash August 2000
Saving Energy TogetherPower SaverTM Program
12 AM2 AM
4 AM6 AM
8 AM10 AM
12 PM2 PM
4 PM6 PM
8 PM
10 PM
1
4
7 10
13
16
1922
2528
31
0
500
1000
1500
2000
2500
Day of Month
Time of day
Central Plant Demand (kW)
Load ShiftingABIA Profile ndash July 1999
Saving Energy TogetherPower SaverTM Program
Peak Day June 2 2005
Demand Response June 15 2005
June 15 2005
Saving Energy TogetherPower SaverTM Program
Peak Clipping ImpactWednesday June 15 2005
Saving Energy TogetherPower SaverTM Program
Strategic Conservation Impact
Traffic Signal Conversion to LED
Goal 5500 traffic signals
Existing incandescent lamps 135 wattsNew LED lamps 15 watts
bull ARI American Refrigeration Institutebull ANSI American National Standards Institutebull IESNA Illuminating Engineering Society of North Americabull NEMA National Electrical Manufacturerrsquos Associationbull ASTM American Society of Testing and Measurements
AEs Net Income Impact (8100000) (20000000) Deferred Cost of Capacity 12000000 AEs Net Cash Impact (8100000) (8000000)
CURRENT FORECAST
Cash Flow Projection of DSM
Cash flow chart
Chart1
Fuel Cost Reduction
Capacity Expense Reduction
Total Decrease In Expenses
REDUCTION IN EXPENSES DUE TO DSM PROGRAMS
5166240
5166240
8956848
8956848
13238528
13238528
14683328
26360828
11677500
16859440
31439440
14580000
20212576
37762576
17550000
24919120
45304120
20385000
30094336
53246836
23152500
34616096
60468596
25852500
40546848
69166848
28620000
47845120
79232620
31387500
Chart4
Fuel Cost without DSM
Fuel Cost with DSM
REDUCTION IN FUEL COST DUE TO DSM PROGRAMS
00233611231
00238400717
00226232559
00233069306
00220985648
00237472342
00217888198
00236848698
00215229268
00237472426
00216083296
00242335075
00224259386
00254383594
00226073357
00259502528
00240455083
00277315347
00255904506
00296726494
Sheet1
Sheet3
Saving Energy TogetherPower SaverTM Program
Questions
Saving Energy TogetherPower SaverTM Program
FY 2006 Achievements
Energy SavingsMW of
Programs Saved Goal Goal
Residential 126 115 110
Commercial 154 121 127
Demand Response 146 156 94
Solar 055 060 93
Grand Total 432 398 108
Saving Energy TogetherPower SaverTM Program
MW SavedPrograms FY2005 FY2006
Residential 119 126
Commercial 153 154
Demand Response 116 146
Solar 06 055
Grand Total 394 432
Energy Savings ComparisonFY2005 to FY2006
Saving Energy TogetherPower SaverTM Program
DSM Summary
bull DSM programs are saving peak kW amp kWh
bull Cost-effectiveness analyses include full program costs
bull DSM goals and budgets should vary to support AE resource plan requirements
Saving Energy TogetherPower SaverTM Program
Free Home WeatherizationEnergy Improvementsbull Insulate Atticsbull Duct Sealingbull Install CFLsbull Solar Screensbull Caulking and Weather-strippingbull Free Smoke amp Carbon Monoxide Detector bull Minor Energy Related Repairs
Saving Energy TogetherPower SaverTM Program
Power Saver Program
bull FREE Energy Saving Productsbull Lower energy costsbull 65000 installed in homes apartmentsbull 4000 installed in commercial buildings
Saving Energy TogetherPower SaverTM Program
Energy Conservation in COA FacilitiesSenate Bill 5 Energy Use vs Energy Cost
295
300
305
310
315
320
325
330
335
340
345
350
Base Year2001
2002 2003 2004 2005 2006
Gig
awat
t-hou
rs
220
230
240
250
260
270
280
290
300
Mill
ion
Dol
lars
Million kWh Cost
Chart1
Million kWh
Cost
Gigawatt-hours
Million Dollars
Senate Bill 5 Energy Use vs Energy Cost
343667472
28619895
33757683
2504536
3260767692
24602549
31773020962
26778741
324036807
2745756918
313494864
2936354518
Sheet1
Sheet1
ampA
Page ampP
Million kWh
Gigawatt-hours
Senate Bill 5 Reported Energy Use
Sheet2
ampA
Page ampP
Million kWh
Cost
Gigawatt-hours
Million Dollars
Senate Bill 5 Energy Use vs Energy Cost
Sheet3
Energy Efficiency Real Reliable and Cost-Effective Alternative
Fuel cost savings assume all saved energy at average gas generation cost
Increased off-system sales margins assumes reduced demand plus associated reserve requirements could be sold for $15kWmonth (after 2007 this is an avoided capacity expense)
Fuel Factor expense increase is increased fuel expense plus purchased capacity cost
GFT reduction is base revenue and fuel cost reductions times 91
Base revenue wDSM
552961968
562415810
569170954
576627290
585065115
594497922
604045383
613657938
623249716
632762255
644233714
Base revenue wo DSM
557087606
570008130
580983849
592794909
605393639
619267826
633200893
646996029
660941168
674903660
690679622
kWh sales wDSM
10776303000
10954134000
11076488000
11213088000
11369667000
11546488000
11724454000
11897588000
12077216000
12256861000
12476492000
kWh sales wo DSM
10861087000
11109639000
11319110000
11544588000
11787201000
12054717000
12323440000
12582205000
12851412000
13121980000
13429845000
1000
kW sales wDSM
2435000
2442000
2443000
2471000
2477000
2486000
2486000
2490000
2515000
2535000
2539000
kW sales wo DSM
2476000
2527000
2572000
2644000
2693000
2746000
2788000
2833000
2898000
2959000
3004000
Fuel Forecast
Budget 2006 (3905)
Tot-2006
Tot-2007
Tot-2008
Tot-2009
Tot-2010
Tot-2011
Tot-2012
Tot-2013
Tot-2014
Tot-2015
Total
MWH
STP
3303339
3488217
3514415
3360759
3465191
3507755
3405921
3614690
3482746
3515635
34658668
FPP
4564135
4517773
4465943
4451812
4418334
4545733
4554494
4586879
4445603
4245674
44796380
Decker
2839387
511212
504648
615748
583574
563845
570235
550098
594337
757598
8090682
Holly
235228
28425
- 0
- 0
- 0
- 0
- 0
- 0
- 0
263653
Sand Hill CC
1533962
1538343
1565132
1615597
1553452
1600111
1516183
1666799
1687122
14276700
SH GT
465155
427320
523864
450359
458722
498276
432337
492003
574949
4322986
Decker GT
157126
216800
280985
238803
246172
264900
238141
266139
294200
2203267
Existing DG
17340
7248
7296
7065
7216
7268
7168
7137
7147
16838
91723
Future DG
110
110
101
2216
2659
4743
5273
7365
7750
17746
48073
PurchasePower
131996
- 0
204000
208800
206400
206400
134400
201600
136000
139200
1568796
Landfill Methane
87493
92450
92704
92450
92450
92450
92704
92450
92450
92450
920052
Future Bioenergy
- 0
- 0
134151
178705
384764
454206
673445
744600
978509
1057336
4605716
Wind
636291
669050
671181
669050
669050
669050
671181
669050
669050
669050
6662004
Solar
684
20026
32685
41438
50311
59183
68298
76929
85801
87839
523193
Shortfall Energy
3308
2419
3355
6021
3311
4269
7050
3075
3868
4281
40957
11584082
11699976
11841366
12004048
12188020
12373249
12553456
12740532
12928204
13159918
123072851
(10512)
(1)
(1)
0
0
(0)
1
1
(0)
0
(10505)
Dollars
STP
14024307
16411783
18054617
17815007
18997196
19874461
19872833
21713134
21541492
22417754
190722584
FPP
47959978
48327184
52942730
56530034
57287196
60262126
61527986
62666810
62927556
61809806
572241406
Decker
161242451
30007075
26150797
28534975
26297430
25902979
27510734
27253106
30904024
41053837
424857407
Holly
15649395
1939153
- 0
- 0
- 0
- 0
- 0
- 0
- 0
17588548
Sand Hill CC
71819840
62147912
53829988
54696364
53773560
56880544
56723452
64324432
66378796
540574888
SH GT
28915407
23018682
25201605
20614580
21546020
24873781
22042049
25993318
31798432
224003872
Decker GT
12129491
14068039
16315347
13248144
14062711
15831205
14654486
17002591
19718490
137030504
Existing DG
1066126
482134
392821
350785
361063
372817
379318
391499
407877
1055934
5260373
Future DG
5688
5352
3321
115774
140956
247241
281454
413559
455875
1154808
2824028
PurchasePower
5000000
- 0
17339160
16429042
16415314
16614357
11144008
17017280
11632503
11967200
123558864
Landfill Methane
3535734
3653844
3663855
3653844
3653844
3653844
3663855
3653844
3653844
3653844
36440353
Future Bioenergy
- 0
- 0
6036769
8041681
17314398
20439270
30305016
33507000
44032792
47579944
207256869
Wind
17374835
18256537
18314921
18256537
18256537
18256537
18314921
18256537
18256537
18256537
181800436
Solar
- 0
- 0
- 0
- 0
- 0
- 0
- 0
- 0
- 0
- 0
- 0
Shortfall Energy
248086
181420
251636
451599
248349
320172
528742
230590
290120
321058
3071771
250457205
245839462
244324412
245526217
247531370
255326093
271114397
278523346
301422961
327166440
2667231902
1792964
10
(12)
6
(1)
10
(27)
4
3
(6)
1793341
Gas MWh
2839387
2902683
2715536
2985730
2888333
2822192
2933522
2736759
3019278
3313869
29157288
Gas cost ($)
161242451
158521208
127324584
123881915
114856517
115285269
125096264
120673092
138224364
158949555
1344055218
Avg gas gen Cost ($MWh)
5679
5461
4689
4149
3977
4085
4264
4409
4578
4796
4610
NO DSM FUEL FACTOR
2006
2007
2008
2009
2010
2011
2012
2013
2014
2015
Thermal Unit Fuel Cost
232662512
236980848
213398064
215549344
211851680
220956944
237247920
240469984
264099856
293228672
Shortfall Purchases
248086
181420
251636
451599
248349
320172
528742
230590
290120
321058
Short-Term Power Purchases
5000000
- 0
29016660
31009042
33965314
36999357
34296508
42869780
40252503
43354700
Fuel Cell Gas Cost
119837
119837
119837
119837
119837
119837
119837
119837
119837
119837
Recoverable ERCOT Expenses
16825273
16825273
16825273
16825273
16825273
16825273
16825273
16825273
16825273
16825273
Fuel Factor Renewables
9998882
9706333
14540565
15223226
23255836
23418594
31052373
32981926
42305054
44649542
Total Fuel Factor Revenue
264854590
263813711
274152035
279178321
286266289
298640176
320070653
333497390
363892643
398499082
Total Renewables
20910569
21910381
28015544
29952062
39224779
42349651
52283792
55417381
65943173
69490325
TotThermal+PurchPwr+Renewables
249864319
245834121
244321076
245522607
247527546
255322004
271110126
278519139
301418805
327162135
Estimated Green Choice Sales
10911686
12204048
13474979
14728836
15968943
18931058
21231418
22435455
23638119
24840783
Fuel Factor Renewables
9998882
9706333
14540565
15223226
23255836
23418594
31052373
32981926
42305054
44649542
Forecast Annual GWh Sales
11110
11319
11545
11787
12055
12323
12582
12851
13122
13430
Average cost per kWh
$ 0023840
$ 0023307
$ 0023747
$ 0023685
$ 0023747
$ 0024234
$ 0025438
$ 0025950
$ 0027732
$ 0029673
Fuel Factors
Secondary
$ 0023475
$ 0022733
$ 0022206
$ 0021895
$ 0021627
$ 0021713
$ 0022535
$ 0022717
$ 0024162
$ 0025715
Primary
$ 0022776
$ 0022056
$ 0021545
$ 0021243
$ 0020984
$ 0021067
$ 0021864
$ 0022041
$ 0023443
$ 0024949
Transmission
$ 0022539
$ 0021828
$ 0021321
$ 0021022
$ 0020766
$ 0020848
$ 0021637
$ 0021812
$ 0023200
$ 0024690
2006
2007
2008
2009
2010
2011
2012
2013
2014
2015
Dag generation
11574
11700
11841
12004
12188
12373
12553
12741
12928
13160
Joe generation
11584
11700
11841
12004
12188
12373
12553
12741
12928
13160
difference
(10)
0
(0)
(0)
(0)
(0)
(0)
0
(0)
0
sales
10954
11076
11213
11370
11546
11724
11898
12077
12257
12476
losses
57
56
56
56
56
55
55
55
55
55
With DSM
Thermal Unit Fuel Cost wDSM
223705664
223742320
198714736
198689904
191639104
196037824
207153584
205853888
223553008
245383552
Short-Term Power Purchases
5000000
- 0
17339160
16429042
16415314
16614357
11144008
17017280
11632503
11967200
Average cost per kWh
$ 0023361
$ 0022623
$ 0022099
$ 0021789
$ 0021523
$ 0021608
$ 0022426
$ 0022607
$ 0024046
$ 0025590
Forecast Annual GWh Sales
10954
11076
11213
11370
11546
11724
11898
12077
12257
12476
255897742
250575183
247791207
247738881
248503713
253336056
266823817
273028794
294725795
319266462
CASH FLOW PURCHASE OPTION
2005
2006
2007
2008
2009
2010
2011
2012
2013
2014
2015
Base revenue reduction
4125638
7592320
11812895
16167619
20328524
24769904
29155510
33338091
37691451
42141405
46445908
Fuel cost reduction
5166240
8956848
13238528
14683328
16859440
20212576
24919120
30094336
34616096
40546848
47845120
Potential off-system sales margins
2767500
5737500
8707500
Capacity cost reduction
12000000
15000000
18000000
21000000
24000000
27000000
30000000
33000000
GFT reduction
845561
660413
773705
527757
576669
709301
827386
851560
807636
944644
1055853
845560920627699
Program cost
20689324
22819634
22819634
22819634
22819634
22819634
22819634
22819634
22819634
22819634
22819634
Recovery through base rates
14405492
14639186
14799075
14977916
15183688
15416391
15650684
15878624
16115254
16352636
16645725
Cash flow
-6796409
-9374854
-10352249
-23481580
-27387801
-31463846
-35497075
-39427542
-43588195
-47663759
-51563965
2005
2006
2007
2008
2009
2010
2011
2012
2013
2014
2015
Base Revenue Reduction
$ (4125638)
$ (7592320)
$ (11812895)
$ (16167619)
$ (20328524)
$ (24769904)
$ (29155510)
$ (33338091)
$ (37691451)
$ (42141405)
$ (46445908)
Fuel Revenue Reduction
$ (5166240)
$ (8956848)
$ (13238528)
$ (26683328)
$ (31859440)
$ (38212576)
$ (45919120)
$ (54094336)
$ (61616096)
$ (70546848)
$ (80845120)
Fuel Cost Reduction
$ 5166240
$ 8956848
$ 13238528
$ 26683328
$ 31859440
$ 38212576
$ 45919120
$ 54094336
$ 61616096
$ 70546848
$ 80845120
Potential off-system sales margins
$ 2767500
$ 5737500
$ 8707500
$ - 0
$ - 0
$ - 0
$ - 0
$ - 0
$ - 0
$ - 0
$ - 0
Net program costs
$ (5438271)
$ (7520034)
$ (7246854)
$ (7313961)
$ (7059277)
$ (6693942)
$ (6341565)
$ (6089451)
$ (5896744)
$ (5522354)
$ (5118057)
AEs net cash impact
$ (6796409)
$ (9374854)
$ (10352249)
$ (23481580)
$ (27387801)
$ (31463846)
$ (35497075)
$ (39427542)
$ (43588195)
$ (47663759)
$ (51563965)
Customer savings
$ 9291878
$ 16549168
$ 25051423
$ 42850947
$ 52187964
$ 62982480
$ 75074630
$ 87432427
$ 99307547
$ 112688253
$ 127291028
CASH FLOW BUILD OPTION
2005
2006
2007
2008
2009
2010
2011
2012
2013
2014
2015
Base revenue reduction
4125638
7592320
11812895
16167619
20328524
24769904
29155510
33338091
37691451
42141405
46445908
Fuel cost reduction
5166240
8956848
13238528
14683328
16859440
20212576
24919120
30094336
34616096
40546848
47845120
Potential off-system sales margins
2767500
5737500
8707500
Capacity cost reduction
7736295
11604442
11604442
15472589
15472589
19340737
19340737
23208884
GFT reduction
845561
660413
773705
527757
576669
709301
827386
851560
807636
944644
1055853
Program cost
20689324
22819634
22819634
22819634
22819634
22819634
22819634
22819634
22819634
22819634
22819634
Recovery through base rates
14405492
14639186
14799075
14977916
15183688
15416391
15650684
15878624
16115254
16352636
16645725
Cash flow
-6796409
-9374854
-10352249
-15745285
-15783359
-19859404
-20024486
-23954952
-24247459
-28323022
-28355080
-21195738994
Capacity cost Build option
Reduced capacity requirement (kW)
46125
95625
145125
194625
243000
292500
339750
385875
430875
477000
523125
Capacity added
200
300
300
400
400
500
500
600
Annual capacity cost
$386814737
$7736295
$11604442
$11604442
$15472589
$15472589
$19340737
$19340737
$23208884
Capacity cost Buy option
Reduced capacity requirement (kW)
46125
95625
145125
194625
243000
292500
339750
385875
430875
477000
523125
Capacity added
200
250
300
350
400
450
500
550
Annual capacity cost
$600000000
$12000000
$15000000
$18000000
$21000000
$24000000
$27000000
$30000000
$33000000
1994
2004
2005
2006
2007
2008
2009
2010
2011
2012
2013
2014
2015
Net MWh to system
7659242
10855000
11388814
11573570
11699976
11841366
12004047
12188019
12373248
12553455
12740532
12928203
13159916
Revenue multiplier
100
142
149
151
153
155
157
159
162
164
166
169
172
Revenue allocated to DSM
9688028
13730281
14405492
14639186
14799075
14977916
15183688
15416391
15650684
15878624
16115254
16352636
16645725
CentskWh in rates for DSM
0134
0134
0134
0134
0134
0134
0134
0133
0133
0133
0133
0133
Annual sales (MWh)
10262000
10776303
10954134
11076488
11213088
11369667
11546488
11724454
11897588
12077216
12256861
12476492
2006
2006
2007
2007
2008
2008
2009
2009
2010
2010
2011
2011
2012
2012
2013
2013
2014
2014
2015
2015
2005
2005
2005
2006
2006
2006
2007
2007
2007
2008
2008
2008
2009
2009
2009
2010
2010
2010
2011
2011
2011
2012
2012
2012
2013
2013
2013
2014
2014
2014
2015
2015
2015
2005
2006
2007
2008
2009
2010
2011
2012
2013
2014
2015
Base Revenue Reduction
$ (4125638)
$ (7592320)
$ (11812895)
$ (16167619)
$ (20328524)
$ (24769904)
$ (29155510)
$ (33338091)
$ (37691451)
$ (42141405)
$ (46445908)
Fuel Revenue Reduction
$ (5166240)
$ (8956848)
$ (13238528)
$ (26683328)
$ (31859440)
$ (38212576)
$ (45919120)
$ (54094336)
$ (61616096)
$ (70546848)
$ (80845120)
Fuel Cost Reduction
$ 5166240
$ 8956848
$ 13238528
$ 26683328
$ 31859440
$ 38212576
$ 45919120
$ 54094336
$ 61616096
$ 70546848
$ 80845120
Potential off-system sales margins
$ 2767500
$ 5737500
$ 8707500
$ - 0
$ - 0
$ - 0
$ - 0
$ - 0
$ - 0
$ - 0
$ - 0
Net program costs
$ (5438271)
$ (7520034)
$ (7246854)
$ (7313961)
$ (7059277)
$ (6693942)
$ (6341565)
$ (6089451)
$ (5896744)
$ (5522354)
$ (5118057)
AEs net cash impact
$ (6796409)
$ (9374854)
$ (10352249)
$ (23481580)
$ (27387801)
$ (31463846)
$ (35497075)
$ (39427542)
$ (43588195)
$ (47663759)
$ (51563965)
Customer savings
$ (9291878)
$ (16549168)
$ (25051423)
$ (42850947)
$ (52187964)
$ (62982480)
$ (75074630)
$ (87432427)
$ (99307547)
$ (112688253)
$ (127291028)
Estimated Annual Impact
Base Revenue Reduction
$ (16134252)
Fuel Revenue Reduction
$ (23790144)
Fuel Cost Reduction
$ 23790144
Potential off-system sales margins
$ 2889000
Net program costs
$ (7166814)
AEs net cash impact
$ (20412066)
Customer savings
$ (39924396)
CURRENT FORECAST
PROPOSED PROJECTION
DSM Analysis
2007
2008
2007
2008
keyed in to round
Base Revenue Reduction
(12000000)
(16000000)
(12000000)
(16000000)
Fuel Revenue Reduction
(13000000)
(15000000)
(5000000)
(7000000)
Customer Savings (Bill Reduction)
(25000000)
(31000000)
(17000000)
(23000000)
Fuel Cost Reduction
13000000
15000000
5000000
7000000
KW
$KW
NET
5 profit
Potential Off-system Capacity Sales
9000000
9000000
6207
$KW
145000
$ 62
$ 8990000
Net of fuel and GFT
$ 449500
TCOS Expense Reduction
900000
1000000
900000
1000000
GFT Reduction
2000000
3000000
2000000
3000000
Program Cost
(23000000)
(23000000)
Recovery through Base Rates
15000000
15000000
AEs Net Income Impact
(8100000)
(20000000)
(17100000)
(35000000)
Deferred Cost of Capacity
12000000
- 0
AEs Net Cash Impact
(8100000)
(8000000)
(17100000)
- 0
Outline for Oct 10 Leadership Team Update
1 Components of BenefitCost Ratios
2 Cash Flow of DSM
CURRENT FORECAST
PROPOSED PROJECTION
DSM Analysis
2007
2008
2007
2008
Base Revenue Reduction
(11812895)
(16167619)
(11812895)
(16167619)
Fuel Revenue Reduction
(13238528)
(14683328)
(5217969)
(5396810)
Fuel Cost Reduction
13238528
14683328
5217969
5396810
Potential off-system sales margins
8707500
8707500
Fuel Revenue Increase-Capacity
12000000
12000000
Fuel Cost Increase-Capacity
(12000000)
(12000000)
TCOS expense reduction
925987
977987
925987
977987
GFT reduction
2279680
2807436
2279680
2807436
Program cost
(22819634)
(22819634)
Recovery through base rates
14799075
14977916
AEs net income impact
(7920288)
(20223914)
100271
(12382196)
Deferred Cost of Capacity
12000000
12000000
AEs net cash impact including deferral
(7920288)
(8223914)
100271
(382196)
Customer savings-(net)
$ (25051423)
$ (30850947)
$ (17030864)
$ (21564429)
Recommend recovery thru fuel factor
Offset customer fuel savings due to DSM
Would not offset revenue loss
(before amp after)
In 2007 we still have excess capacity
Cost recovery
3yrs - recommended purch power
power is only needed during peak-dont utilize a plant
need declines as renewables increases
cash flow
Dynamic pricing-TOU rates motivating cust to conserve energy
would replace some of the energy efficiency rebates
option to self-generate
TCOS expense reduction due to DSM savings
Historical
Historical
Historical
Historical
Historical
Preliminary
Forecast
Forecast
Forecast
Forecast
Forecast
Forecast
Forecast
Forecast
Forecast
Forecast
2000
2001
2002
2003
2004
2005
2006
2007
2008
2009
2010
2011
2012
2013
2014
2015
ERCOT Postage Stamp Rate
1476
1528
1661
1778
1925
2055
2185
2315
2445
2575
2705
2835
2965
3095
3225
3355
Estimated DSM-kW savings applied to average 4CP
40000
40000
40000
40000
40000
40000
40000
40000
40000
40000
40000
Reduction to TCOS expense
$ 821987
$ 873987
$ 925987
$ 977987
$ 1029987
$ 1081987
$ 1133987
$ 1185987
$ 1237987
$ 1289987
$ 1341987
2005
2006
2007
2008
2009
2010
2011
2012
2013
2014
2015
Base revenue reduction
4125638
7592320
11812895
16167619
20328524
24769904
29155510
33338091
37691451
42141405
46445908
kWh reduction
84784000
155505000
242622000
331500000
417534000
508229000
598986000
684617000
774196000
865119000
953353000
Fuel cost reduction
5166240
8956848
13238528
14683328
16859440
20212576
24919120
30094336
34616096
40546848
47845120
Demand reduction (kW)
41000
85000
129000
173000
216000
260000
302000
343000
383000
424000
465000
Reduced reserve requirement (kW)
5125
10625
16125
21625
27000
32500
37750
42875
47875
53000
58125
2008
2009
2010
2011
2012
2013
2014
2015
Reduced capacity requirement (kW)
46125
95625
145125
194625
243000
292500
339750
385875
430875
477000
523125
194625
243000
292500
339750
385875
430875
477000
523125
Increased off-system sales margins
2767500
5737500
8707500
Capacity cost reduction
11677500
14580000
17550000
20385000
23152500
25852500
28620000
31387500
Fuel Factor expense decrease ($)
5166240
8956848
13238528
26360828
31439440
37762576
45304120
53246836
60468596
69166848
79232620
Fuel Factor decrease (centskWh)
00005
00007
00016
00019
00022
00026
00030
00033
00037
00041
Fuel Factor decrease
2
3
7
9
10
12
13
15
15
16
GFT reduction
845561
1505974
2279680
2807436
3384105
4093406
4920791
5772351
6579987
7524631
8580484
Program cost
20689324
22819634
22819634
22819634
22819634
22819634
22819634
22819634
22819634
22819634
22819634
Recovery through base rates
14405492
14639186
14799075
14977916
15183688
15416391
15650684
15878624
16115254
16352636
16645725
Cash flow
-7641970
-10035268
-11125954
-12331837
-13384470
-14623147
-15939461
-17126601
-18543331
-19988403
-21232317
Fuel cost savings assume all saved energy at average gas generation cost
Increased off-system sales margins assumes reduced demand plus associated reserve requirements could be sold for $15kWmonth (after 2007 this is an avoided capacity expense)
Fuel Factor expense increase is increased fuel expense plus purchased capacity cost
GFT reduction is base revenue and fuel cost reductions times 91
Base revenue wDSM
552961968
562415810
569170954
576627290
585065115
594497922
604045383
613657938
623249716
632762255
644233714
Base revenue wo DSM
557087606
570008130
580983849
592794909
605393639
619267826
633200893
646996029
660941168
674903660
690679622
kWh sales wDSM
10776303000
10954134000
11076488000
11213088000
11369667000
11546488000
11724454000
11897588000
12077216000
12256861000
12476492000
kWh sales wo DSM
10861087000
11109639000
11319110000
11544588000
11787201000
12054717000
12323440000
12582205000
12851412000
13121980000
13429845000
1000
kW sales wDSM
2435000
2442000
2443000
2471000
2477000
2486000
2486000
2490000
2515000
2535000
2539000
kW sales wo DSM
2476000
2527000
2572000
2644000
2693000
2746000
2788000
2833000
2898000
2959000
3004000
Fuel Forecast
Budget 2006 (3905)
Tot-2006
Tot-2007
Tot-2008
Tot-2009
Tot-2010
Tot-2011
Tot-2012
Tot-2013
Tot-2014
Tot-2015
Total
MWH
STP
3303339
3488217
3514415
3360759
3465191
3507755
3405921
3614690
3482746
3515635
34658668
FPP
4564135
4517773
4465943
4451812
4418334
4545733
4554494
4586879
4445603
4245674
44796380
Decker
2839387
511212
504648
615748
583574
563845
570235
550098
594337
757598
8090682
Holly
235228
28425
- 0
- 0
- 0
- 0
- 0
- 0
- 0
263653
Sand Hill CC
1533962
1538343
1565132
1615597
1553452
1600111
1516183
1666799
1687122
14276700
SH GT
465155
427320
523864
450359
458722
498276
432337
492003
574949
4322986
Decker GT
157126
216800
280985
238803
246172
264900
238141
266139
294200
2203267
Existing DG
17340
7248
7296
7065
7216
7268
7168
7137
7147
16838
91723
Future DG
110
110
101
2216
2659
4743
5273
7365
7750
17746
48073
PurchasePower
131996
- 0
204000
208800
206400
206400
134400
201600
136000
139200
1568796
Landfill Methane
87493
92450
92704
92450
92450
92450
92704
92450
92450
92450
920052
Future Bioenergy
- 0
- 0
134151
178705
384764
454206
673445
744600
978509
1057336
4605716
Wind
636291
669050
671181
669050
669050
669050
671181
669050
669050
669050
6662004
Solar
684
20026
32685
41438
50311
59183
68298
76929
85801
87839
523193
Shortfall Energy
3308
2419
3355
6021
3311
4269
7050
3075
3868
4281
40957
11584082
11699976
11841366
12004048
12188020
12373249
12553456
12740532
12928204
13159918
123072851
(10512)
(1)
(1)
0
0
(0)
1
1
(0)
0
(10505)
Dollars
STP
14024307
16411783
18054617
17815007
18997196
19874461
19872833
21713134
21541492
22417754
190722584
FPP
47959978
48327184
52942730
56530034
57287196
60262126
61527986
62666810
62927556
61809806
572241406
Decker
161242451
30007075
26150797
28534975
26297430
25902979
27510734
27253106
30904024
41053837
424857407
Holly
15649395
1939153
- 0
- 0
- 0
- 0
- 0
- 0
- 0
17588548
Sand Hill CC
71819840
62147912
53829988
54696364
53773560
56880544
56723452
64324432
66378796
540574888
SH GT
28915407
23018682
25201605
20614580
21546020
24873781
22042049
25993318
31798432
224003872
Decker GT
12129491
14068039
16315347
13248144
14062711
15831205
14654486
17002591
19718490
137030504
Existing DG
1066126
482134
392821
350785
361063
372817
379318
391499
407877
1055934
5260373
Future DG
5688
5352
3321
115774
140956
247241
281454
413559
455875
1154808
2824028
PurchasePower
5000000
- 0
17339160
16429042
16415314
16614357
11144008
17017280
11632503
11967200
123558864
Landfill Methane
3535734
3653844
3663855
3653844
3653844
3653844
3663855
3653844
3653844
3653844
36440353
Future Bioenergy
- 0
- 0
6036769
8041681
17314398
20439270
30305016
33507000
44032792
47579944
207256869
Wind
17374835
18256537
18314921
18256537
18256537
18256537
18314921
18256537
18256537
18256537
181800436
Solar
- 0
- 0
- 0
- 0
- 0
- 0
- 0
- 0
- 0
- 0
- 0
Shortfall Energy
248086
181420
251636
451599
248349
320172
528742
230590
290120
321058
3071771
250457205
245839462
244324412
245526217
247531370
255326093
271114397
278523346
301422961
327166440
2667231902
1792964
10
(12)
6
(1)
10
(27)
4
3
(6)
1793341
Gas MWh
2839387
2902683
2715536
2985730
2888333
2822192
2933522
2736759
3019278
3313869
29157288
Gas cost ($)
161242451
158521208
127324584
123881915
114856517
115285269
125096264
120673092
138224364
158949555
1344055218
Avg gas gen Cost ($MWh)
5679
5461
4689
4149
3977
4085
4264
4409
4578
4796
4610
NO DSM FUEL FACTOR
2006
2007
2008
2009
2010
2011
2012
2013
2014
2015
Thermal Unit Fuel Cost
232662512
236980848
213398064
215549344
211851680
220956944
237247920
240469984
264099856
293228672
Shortfall Purchases
248086
181420
251636
451599
248349
320172
528742
230590
290120
321058
Short-Term Power Purchases
5000000
- 0
29016660
31009042
33965314
36999357
34296508
42869780
40252503
43354700
Fuel Cell Gas Cost
119837
119837
119837
119837
119837
119837
119837
119837
119837
119837
Recoverable ERCOT Expenses
16825273
16825273
16825273
16825273
16825273
16825273
16825273
16825273
16825273
16825273
Fuel Factor Renewables
9998882
9706333
14540565
15223226
23255836
23418594
31052373
32981926
42305054
44649542
Total Fuel Factor Revenue
264854590
263813711
274152035
279178321
286266289
298640176
320070653
333497390
363892643
398499082
Total Renewables
20910569
21910381
28015544
29952062
39224779
42349651
52283792
55417381
65943173
69490325
TotThermal+PurchPwr+Renewables
249864319
245834121
244321076
245522607
247527546
255322004
271110126
278519139
301418805
327162135
Estimated Green Choice Sales
10911686
12204048
13474979
14728836
15968943
18931058
21231418
22435455
23638119
24840783
Fuel Factor Renewables
9998882
9706333
14540565
15223226
23255836
23418594
31052373
32981926
42305054
44649542
Forecast Annual GWh Sales
11110
11319
11545
11787
12055
12323
12582
12851
13122
13430
Average cost per kWh
$ 0023840
$ 0023307
$ 0023747
$ 0023685
$ 0023747
$ 0024234
$ 0025438
$ 0025950
$ 0027732
$ 0029673
Fuel Factors
Secondary
$ 0023475
$ 0022733
$ 0022206
$ 0021895
$ 0021627
$ 0021713
$ 0022535
$ 0022717
$ 0024162
$ 0025715
Primary
$ 0022776
$ 0022056
$ 0021545
$ 0021243
$ 0020984
$ 0021067
$ 0021864
$ 0022041
$ 0023443
$ 0024949
Transmission
$ 0022539
$ 0021828
$ 0021321
$ 0021022
$ 0020766
$ 0020848
$ 0021637
$ 0021812
$ 0023200
$ 0024690
2006
2007
2008
2009
2010
2011
2012
2013
2014
2015
Dag generation
11574
11700
11841
12004
12188
12373
12553
12741
12928
13160
Joe generation
11584
11700
11841
12004
12188
12373
12553
12741
12928
13160
difference
(10)
0
(0)
(0)
(0)
(0)
(0)
0
(0)
0
sales
10954
11076
11213
11370
11546
11724
11898
12077
12257
12476
losses
57
56
56
56
56
55
55
55
55
55
With DSM
Thermal Unit Fuel Cost wDSM
223705664
223742320
198714736
198689904
191639104
196037824
207153584
205853888
223553008
245383552
Short-Term Power Purchases
5000000
- 0
17339160
16429042
16415314
16614357
11144008
17017280
11632503
11967200
Average cost per kWh
$ 0023361
$ 0022623
$ 0022099
$ 0021789
$ 0021523
$ 0021608
$ 0022426
$ 0022607
$ 0024046
$ 0025590
Forecast Annual GWh Sales
10954
11076
11213
11370
11546
11724
11898
12077
12257
12476
255897742
250575183
247791207
247738881
248503713
253336056
266823817
273028794
294725795
319266462
CASH FLOW PURCHASE OPTION
2005
2006
2007
2008
2009
2010
2011
2012
2013
2014
2015
Base revenue reduction
4125638
7592320
11812895
16167619
20328524
24769904
29155510
33338091
37691451
42141405
46445908
Fuel cost reduction
5166240
8956848
13238528
14683328
16859440
20212576
24919120
30094336
34616096
40546848
47845120
Potential off-system sales margins
2767500
5737500
8707500
Capacity cost reduction
12000000
15000000
18000000
21000000
24000000
27000000
30000000
33000000
GFT reduction
845561
660413
773705
527757
576669
709301
827386
851560
807636
944644
1055853
845560920627699
Program cost
20689324
22819634
22819634
22819634
22819634
22819634
22819634
22819634
22819634
22819634
22819634
Recovery through base rates
14405492
14639186
14799075
14977916
15183688
15416391
15650684
15878624
16115254
16352636
16645725
Cash flow
-6796409
-9374854
-10352249
-23481580
-27387801
-31463846
-35497075
-39427542
-43588195
-47663759
-51563965
2005
2006
2007
2008
2009
2010
2011
2012
2013
2014
2015
Base Revenue Reduction
$ (4125638)
$ (7592320)
$ (11812895)
$ (16167619)
$ (20328524)
$ (24769904)
$ (29155510)
$ (33338091)
$ (37691451)
$ (42141405)
$ (46445908)
Fuel Revenue Reduction
$ (5166240)
$ (8956848)
$ (13238528)
$ (26683328)
$ (31859440)
$ (38212576)
$ (45919120)
$ (54094336)
$ (61616096)
$ (70546848)
$ (80845120)
Fuel Cost Reduction
$ 5166240
$ 8956848
$ 13238528
$ 26683328
$ 31859440
$ 38212576
$ 45919120
$ 54094336
$ 61616096
$ 70546848
$ 80845120
Potential off-system sales margins
$ 2767500
$ 5737500
$ 8707500
$ - 0
$ - 0
$ - 0
$ - 0
$ - 0
$ - 0
$ - 0
$ - 0
Net program costs
$ (5438271)
$ (7520034)
$ (7246854)
$ (7313961)
$ (7059277)
$ (6693942)
$ (6341565)
$ (6089451)
$ (5896744)
$ (5522354)
$ (5118057)
AEs net cash impact
$ (6796409)
$ (9374854)
$ (10352249)
$ (23481580)
$ (27387801)
$ (31463846)
$ (35497075)
$ (39427542)
$ (43588195)
$ (47663759)
$ (51563965)
Customer savings
$ 9291878
$ 16549168
$ 25051423
$ 42850947
$ 52187964
$ 62982480
$ 75074630
$ 87432427
$ 99307547
$ 112688253
$ 127291028
CASH FLOW BUILD OPTION
2005
2006
2007
2008
2009
2010
2011
2012
2013
2014
2015
Base revenue reduction
4125638
7592320
11812895
16167619
20328524
24769904
29155510
33338091
37691451
42141405
46445908
Fuel cost reduction
5166240
8956848
13238528
14683328
16859440
20212576
24919120
30094336
34616096
40546848
47845120
Potential off-system sales margins
2767500
5737500
8707500
Capacity cost reduction
7736295
11604442
11604442
15472589
15472589
19340737
19340737
23208884
GFT reduction
845561
660413
773705
527757
576669
709301
827386
851560
807636
944644
1055853
Program cost
20689324
22819634
22819634
22819634
22819634
22819634
22819634
22819634
22819634
22819634
22819634
Recovery through base rates
14405492
14639186
14799075
14977916
15183688
15416391
15650684
15878624
16115254
16352636
16645725
Cash flow
-6796409
-9374854
-10352249
-15745285
-15783359
-19859404
-20024486
-23954952
-24247459
-28323022
-28355080
-21195738994
Capacity cost Build option
Reduced capacity requirement (kW)
46125
95625
145125
194625
243000
292500
339750
385875
430875
477000
523125
Capacity added
200
300
300
400
400
500
500
600
Annual capacity cost
$386814737
$7736295
$11604442
$11604442
$15472589
$15472589
$19340737
$19340737
$23208884
Capacity cost Buy option
Reduced capacity requirement (kW)
46125
95625
145125
194625
243000
292500
339750
385875
430875
477000
523125
Capacity added
200
250
300
350
400
450
500
550
Annual capacity cost
$600000000
$12000000
$15000000
$18000000
$21000000
$24000000
$27000000
$30000000
$33000000
1994
2004
2005
2006
2007
2008
2009
2010
2011
2012
2013
2014
2015
Net MWh to system
7659242
10855000
11388814
11573570
11699976
11841366
12004047
12188019
12373248
12553455
12740532
12928203
13159916
Revenue multiplier
100
142
149
151
153
155
157
159
162
164
166
169
172
Revenue allocated to DSM
9688028
13730281
14405492
14639186
14799075
14977916
15183688
15416391
15650684
15878624
16115254
16352636
16645725
CentskWh in rates for DSM
0134
0134
0134
0134
0134
0134
0134
0133
0133
0133
0133
0133
Annual sales (MWh)
10262000
10776303
10954134
11076488
11213088
11369667
11546488
11724454
11897588
12077216
12256861
12476492
2006
2006
2007
2007
2008
2008
2009
2009
2010
2010
2011
2011
2012
2012
2013
2013
2014
2014
2015
2015
2005
2005
2005
2006
2006
2006
2007
2007
2007
2008
2008
2008
2009
2009
2009
2010
2010
2010
2011
2011
2011
2012
2012
2012
2013
2013
2013
2014
2014
2014
2015
2015
2015
2005
2006
2007
2008
2009
2010
2011
2012
2013
2014
2015
Base Revenue Reduction
$ (4125638)
$ (7592320)
$ (11812895)
$ (16167619)
$ (20328524)
$ (24769904)
$ (29155510)
$ (33338091)
$ (37691451)
$ (42141405)
$ (46445908)
Fuel Revenue Reduction
$ (5166240)
$ (8956848)
$ (13238528)
$ (26683328)
$ (31859440)
$ (38212576)
$ (45919120)
$ (54094336)
$ (61616096)
$ (70546848)
$ (80845120)
Fuel Cost Reduction
$ 5166240
$ 8956848
$ 13238528
$ 26683328
$ 31859440
$ 38212576
$ 45919120
$ 54094336
$ 61616096
$ 70546848
$ 80845120
Potential off-system sales margins
$ 2767500
$ 5737500
$ 8707500
$ - 0
$ - 0
$ - 0
$ - 0
$ - 0
$ - 0
$ - 0
$ - 0
Net program costs
$ (5438271)
$ (7520034)
$ (7246854)
$ (7313961)
$ (7059277)
$ (6693942)
$ (6341565)
$ (6089451)
$ (5896744)
$ (5522354)
$ (5118057)
AEs net cash impact
$ (6796409)
$ (9374854)
$ (10352249)
$ (23481580)
$ (27387801)
$ (31463846)
$ (35497075)
$ (39427542)
$ (43588195)
$ (47663759)
$ (51563965)
Customer savings
$ (9291878)
$ (16549168)
$ (25051423)
$ (42850947)
$ (52187964)
$ (62982480)
$ (75074630)
$ (87432427)
$ (99307547)
$ (112688253)
$ (127291028)
Estimated Annual Impact
Base Revenue Reduction
$ (16134252)
Fuel Revenue Reduction
$ (23790144)
Fuel Cost Reduction
$ 23790144
Potential off-system sales margins
$ 2889000
Net program costs
$ (7166814)
AEs net cash impact
$ (20412066)
Customer savings
$ (39924396)
CURRENT FORECAST
PROPOSED PROJECTION
DSM Analysis
2007
2008
2007
2008
keyed in to round
Base Revenue Reduction
(12000000)
(16000000)
(12000000)
(16000000)
Fuel Revenue Reduction
(13000000)
(15000000)
(5000000)
(7000000)
Fuel Cost Reduction
13000000
15000000
5000000
7000000
KW
$KW
NET
5 profit
Potential off-system capacity sales
9000000
9000000
6207
$KW
145000
$ 62
$ 8990000
Net of fuel and GFT
$ 449500
Fuel Revenue Increase-Capacity
12000000
12000000
6154
$KW
195000
$ 62
$ 12090000
Fuel Cost Increase-Capacity
(12000000)
(12000000)
TCOS expense reduction
900000
1000000
900000
1000000
GFT reduction
2000000
3000000
2000000
3000000
Program cost
(23000000)
(23000000)
Recovery through base rates
15000000
15000000
AEs net income impact
(8100000)
(20000000)
(100000)
(12000000)
Deferred Cost of Capacity
12000000
12000000
AEs net cash impact
(8100000)
(8000000)
(100000)
- 0
Customer savings-(net)
$ (25000000)
$ (31000000)
$ (17000000)
$ (35000000)
Outline for Oct 10 Leadership Team Update
1 Components of BenefitCost Ratios
2 Cash Flow of DSM
CURRENT FORECAST
PROPOSED PROJECTION
DSM Analysis
2007
2008
2007
2008
Base Revenue Reduction
(11812895)
(16167619)
(11812895)
(16167619)
Fuel Revenue Reduction
(13238528)
(14683328)
(5217969)
(5396810)
Fuel Cost Reduction
13238528
14683328
5217969
5396810
Potential off-system sales margins
8707500
8707500
Fuel Revenue Increase-Capacity
12000000
12000000
Fuel Cost Increase-Capacity
(12000000)
(12000000)
TCOS expense reduction
925987
977987
925987
977987
GFT reduction
2279680
2807436
2279680
2807436
Program cost
(22819634)
(22819634)
Recovery through base rates
14799075
14977916
AEs net income impact
(7920288)
(20223914)
100271
(12382196)
Deferred Cost of Capacity
12000000
12000000
AEs net cash impact including deferral
(7920288)
(8223914)
100271
(382196)
Customer savings-(net)
$ (25051423)
$ (30850947)
$ (17030864)
$ (33564429)
Recommend recovery thru fuel factor
Offset customer fuel savings due to DSM
Would not offset revenue loss
(before amp after)
In 2007 we still have excess capacity
Cost recovery
3yrs - recommended purch power
power is only needed during peak-dont utilize a plant
need declines as renewables increases
cash flow
Dynamic pricing-TOU rates motivating cust to conserve energy
would replace some of the energy efficiency rebates
option to self-generate
TCOS expense reduction due to DSM savings
Historical
Historical
Historical
Historical
Historical
Preliminary
Forecast
Forecast
Forecast
Forecast
Forecast
Forecast
Forecast
Forecast
Forecast
Forecast
2000
2001
2002
2003
2004
2005
2006
2007
2008
2009
2010
2011
2012
2013
2014
2015
ERCOT Postage Stamp Rate
1476
1528
1661
1778
1925
2055
2185
2315
2445
2575
2705
2835
2965
3095
3225
3355
Estimated DSM-kW savings applied to average 4CP
40000
40000
40000
40000
40000
40000
40000
40000
40000
40000
40000
Reduction to TCOS expense
$ 821987
$ 873987
$ 925987
$ 977987
$ 1029987
$ 1081987
$ 1133987
$ 1185987
$ 1237987
$ 1289987
$ 1341987
Saving Energy TogetherPower SaverTM Program
Strategic Conservation Impact
Traffic Signal Conversion to LED
Goal 5500 traffic signals
Existing incandescent lamps 135 wattsNew LED lamps 15 watts
bull ARI American Refrigeration Institutebull ANSI American National Standards Institutebull IESNA Illuminating Engineering Society of North Americabull NEMA National Electrical Manufacturerrsquos Associationbull ASTM American Society of Testing and Measurements
AEs Net Income Impact (8100000) (20000000) Deferred Cost of Capacity 12000000 AEs Net Cash Impact (8100000) (8000000)
CURRENT FORECAST
Cash Flow Projection of DSM
Cash flow chart
Chart1
Fuel Cost Reduction
Capacity Expense Reduction
Total Decrease In Expenses
REDUCTION IN EXPENSES DUE TO DSM PROGRAMS
5166240
5166240
8956848
8956848
13238528
13238528
14683328
26360828
11677500
16859440
31439440
14580000
20212576
37762576
17550000
24919120
45304120
20385000
30094336
53246836
23152500
34616096
60468596
25852500
40546848
69166848
28620000
47845120
79232620
31387500
Chart4
Fuel Cost without DSM
Fuel Cost with DSM
REDUCTION IN FUEL COST DUE TO DSM PROGRAMS
00233611231
00238400717
00226232559
00233069306
00220985648
00237472342
00217888198
00236848698
00215229268
00237472426
00216083296
00242335075
00224259386
00254383594
00226073357
00259502528
00240455083
00277315347
00255904506
00296726494
Sheet1
Sheet3
Saving Energy TogetherPower SaverTM Program
Questions
Saving Energy TogetherPower SaverTM Program
FY 2006 Achievements
Energy SavingsMW of
Programs Saved Goal Goal
Residential 126 115 110
Commercial 154 121 127
Demand Response 146 156 94
Solar 055 060 93
Grand Total 432 398 108
Saving Energy TogetherPower SaverTM Program
MW SavedPrograms FY2005 FY2006
Residential 119 126
Commercial 153 154
Demand Response 116 146
Solar 06 055
Grand Total 394 432
Energy Savings ComparisonFY2005 to FY2006
Saving Energy TogetherPower SaverTM Program
DSM Summary
bull DSM programs are saving peak kW amp kWh
bull Cost-effectiveness analyses include full program costs
bull DSM goals and budgets should vary to support AE resource plan requirements
Saving Energy TogetherPower SaverTM Program
Free Home WeatherizationEnergy Improvementsbull Insulate Atticsbull Duct Sealingbull Install CFLsbull Solar Screensbull Caulking and Weather-strippingbull Free Smoke amp Carbon Monoxide Detector bull Minor Energy Related Repairs
Saving Energy TogetherPower SaverTM Program
Power Saver Program
bull FREE Energy Saving Productsbull Lower energy costsbull 65000 installed in homes apartmentsbull 4000 installed in commercial buildings
Saving Energy TogetherPower SaverTM Program
Energy Conservation in COA FacilitiesSenate Bill 5 Energy Use vs Energy Cost
295
300
305
310
315
320
325
330
335
340
345
350
Base Year2001
2002 2003 2004 2005 2006
Gig
awat
t-hou
rs
220
230
240
250
260
270
280
290
300
Mill
ion
Dol
lars
Million kWh Cost
Chart1
Million kWh
Cost
Gigawatt-hours
Million Dollars
Senate Bill 5 Energy Use vs Energy Cost
343667472
28619895
33757683
2504536
3260767692
24602549
31773020962
26778741
324036807
2745756918
313494864
2936354518
Sheet1
Sheet1
ampA
Page ampP
Million kWh
Gigawatt-hours
Senate Bill 5 Reported Energy Use
Sheet2
ampA
Page ampP
Million kWh
Cost
Gigawatt-hours
Million Dollars
Senate Bill 5 Energy Use vs Energy Cost
Sheet3
Energy Efficiency Real Reliable and Cost-Effective Alternative
Fuel cost savings assume all saved energy at average gas generation cost
Increased off-system sales margins assumes reduced demand plus associated reserve requirements could be sold for $15kWmonth (after 2007 this is an avoided capacity expense)
Fuel Factor expense increase is increased fuel expense plus purchased capacity cost
GFT reduction is base revenue and fuel cost reductions times 91
Base revenue wDSM
552961968
562415810
569170954
576627290
585065115
594497922
604045383
613657938
623249716
632762255
644233714
Base revenue wo DSM
557087606
570008130
580983849
592794909
605393639
619267826
633200893
646996029
660941168
674903660
690679622
kWh sales wDSM
10776303000
10954134000
11076488000
11213088000
11369667000
11546488000
11724454000
11897588000
12077216000
12256861000
12476492000
kWh sales wo DSM
10861087000
11109639000
11319110000
11544588000
11787201000
12054717000
12323440000
12582205000
12851412000
13121980000
13429845000
1000
kW sales wDSM
2435000
2442000
2443000
2471000
2477000
2486000
2486000
2490000
2515000
2535000
2539000
kW sales wo DSM
2476000
2527000
2572000
2644000
2693000
2746000
2788000
2833000
2898000
2959000
3004000
Fuel Forecast
Budget 2006 (3905)
Tot-2006
Tot-2007
Tot-2008
Tot-2009
Tot-2010
Tot-2011
Tot-2012
Tot-2013
Tot-2014
Tot-2015
Total
MWH
STP
3303339
3488217
3514415
3360759
3465191
3507755
3405921
3614690
3482746
3515635
34658668
FPP
4564135
4517773
4465943
4451812
4418334
4545733
4554494
4586879
4445603
4245674
44796380
Decker
2839387
511212
504648
615748
583574
563845
570235
550098
594337
757598
8090682
Holly
235228
28425
- 0
- 0
- 0
- 0
- 0
- 0
- 0
263653
Sand Hill CC
1533962
1538343
1565132
1615597
1553452
1600111
1516183
1666799
1687122
14276700
SH GT
465155
427320
523864
450359
458722
498276
432337
492003
574949
4322986
Decker GT
157126
216800
280985
238803
246172
264900
238141
266139
294200
2203267
Existing DG
17340
7248
7296
7065
7216
7268
7168
7137
7147
16838
91723
Future DG
110
110
101
2216
2659
4743
5273
7365
7750
17746
48073
PurchasePower
131996
- 0
204000
208800
206400
206400
134400
201600
136000
139200
1568796
Landfill Methane
87493
92450
92704
92450
92450
92450
92704
92450
92450
92450
920052
Future Bioenergy
- 0
- 0
134151
178705
384764
454206
673445
744600
978509
1057336
4605716
Wind
636291
669050
671181
669050
669050
669050
671181
669050
669050
669050
6662004
Solar
684
20026
32685
41438
50311
59183
68298
76929
85801
87839
523193
Shortfall Energy
3308
2419
3355
6021
3311
4269
7050
3075
3868
4281
40957
11584082
11699976
11841366
12004048
12188020
12373249
12553456
12740532
12928204
13159918
123072851
(10512)
(1)
(1)
0
0
(0)
1
1
(0)
0
(10505)
Dollars
STP
14024307
16411783
18054617
17815007
18997196
19874461
19872833
21713134
21541492
22417754
190722584
FPP
47959978
48327184
52942730
56530034
57287196
60262126
61527986
62666810
62927556
61809806
572241406
Decker
161242451
30007075
26150797
28534975
26297430
25902979
27510734
27253106
30904024
41053837
424857407
Holly
15649395
1939153
- 0
- 0
- 0
- 0
- 0
- 0
- 0
17588548
Sand Hill CC
71819840
62147912
53829988
54696364
53773560
56880544
56723452
64324432
66378796
540574888
SH GT
28915407
23018682
25201605
20614580
21546020
24873781
22042049
25993318
31798432
224003872
Decker GT
12129491
14068039
16315347
13248144
14062711
15831205
14654486
17002591
19718490
137030504
Existing DG
1066126
482134
392821
350785
361063
372817
379318
391499
407877
1055934
5260373
Future DG
5688
5352
3321
115774
140956
247241
281454
413559
455875
1154808
2824028
PurchasePower
5000000
- 0
17339160
16429042
16415314
16614357
11144008
17017280
11632503
11967200
123558864
Landfill Methane
3535734
3653844
3663855
3653844
3653844
3653844
3663855
3653844
3653844
3653844
36440353
Future Bioenergy
- 0
- 0
6036769
8041681
17314398
20439270
30305016
33507000
44032792
47579944
207256869
Wind
17374835
18256537
18314921
18256537
18256537
18256537
18314921
18256537
18256537
18256537
181800436
Solar
- 0
- 0
- 0
- 0
- 0
- 0
- 0
- 0
- 0
- 0
- 0
Shortfall Energy
248086
181420
251636
451599
248349
320172
528742
230590
290120
321058
3071771
250457205
245839462
244324412
245526217
247531370
255326093
271114397
278523346
301422961
327166440
2667231902
1792964
10
(12)
6
(1)
10
(27)
4
3
(6)
1793341
Gas MWh
2839387
2902683
2715536
2985730
2888333
2822192
2933522
2736759
3019278
3313869
29157288
Gas cost ($)
161242451
158521208
127324584
123881915
114856517
115285269
125096264
120673092
138224364
158949555
1344055218
Avg gas gen Cost ($MWh)
5679
5461
4689
4149
3977
4085
4264
4409
4578
4796
4610
NO DSM FUEL FACTOR
2006
2007
2008
2009
2010
2011
2012
2013
2014
2015
Thermal Unit Fuel Cost
232662512
236980848
213398064
215549344
211851680
220956944
237247920
240469984
264099856
293228672
Shortfall Purchases
248086
181420
251636
451599
248349
320172
528742
230590
290120
321058
Short-Term Power Purchases
5000000
- 0
29016660
31009042
33965314
36999357
34296508
42869780
40252503
43354700
Fuel Cell Gas Cost
119837
119837
119837
119837
119837
119837
119837
119837
119837
119837
Recoverable ERCOT Expenses
16825273
16825273
16825273
16825273
16825273
16825273
16825273
16825273
16825273
16825273
Fuel Factor Renewables
9998882
9706333
14540565
15223226
23255836
23418594
31052373
32981926
42305054
44649542
Total Fuel Factor Revenue
264854590
263813711
274152035
279178321
286266289
298640176
320070653
333497390
363892643
398499082
Total Renewables
20910569
21910381
28015544
29952062
39224779
42349651
52283792
55417381
65943173
69490325
TotThermal+PurchPwr+Renewables
249864319
245834121
244321076
245522607
247527546
255322004
271110126
278519139
301418805
327162135
Estimated Green Choice Sales
10911686
12204048
13474979
14728836
15968943
18931058
21231418
22435455
23638119
24840783
Fuel Factor Renewables
9998882
9706333
14540565
15223226
23255836
23418594
31052373
32981926
42305054
44649542
Forecast Annual GWh Sales
11110
11319
11545
11787
12055
12323
12582
12851
13122
13430
Average cost per kWh
$ 0023840
$ 0023307
$ 0023747
$ 0023685
$ 0023747
$ 0024234
$ 0025438
$ 0025950
$ 0027732
$ 0029673
Fuel Factors
Secondary
$ 0023475
$ 0022733
$ 0022206
$ 0021895
$ 0021627
$ 0021713
$ 0022535
$ 0022717
$ 0024162
$ 0025715
Primary
$ 0022776
$ 0022056
$ 0021545
$ 0021243
$ 0020984
$ 0021067
$ 0021864
$ 0022041
$ 0023443
$ 0024949
Transmission
$ 0022539
$ 0021828
$ 0021321
$ 0021022
$ 0020766
$ 0020848
$ 0021637
$ 0021812
$ 0023200
$ 0024690
2006
2007
2008
2009
2010
2011
2012
2013
2014
2015
Dag generation
11574
11700
11841
12004
12188
12373
12553
12741
12928
13160
Joe generation
11584
11700
11841
12004
12188
12373
12553
12741
12928
13160
difference
(10)
0
(0)
(0)
(0)
(0)
(0)
0
(0)
0
sales
10954
11076
11213
11370
11546
11724
11898
12077
12257
12476
losses
57
56
56
56
56
55
55
55
55
55
With DSM
Thermal Unit Fuel Cost wDSM
223705664
223742320
198714736
198689904
191639104
196037824
207153584
205853888
223553008
245383552
Short-Term Power Purchases
5000000
- 0
17339160
16429042
16415314
16614357
11144008
17017280
11632503
11967200
Average cost per kWh
$ 0023361
$ 0022623
$ 0022099
$ 0021789
$ 0021523
$ 0021608
$ 0022426
$ 0022607
$ 0024046
$ 0025590
Forecast Annual GWh Sales
10954
11076
11213
11370
11546
11724
11898
12077
12257
12476
255897742
250575183
247791207
247738881
248503713
253336056
266823817
273028794
294725795
319266462
CASH FLOW PURCHASE OPTION
2005
2006
2007
2008
2009
2010
2011
2012
2013
2014
2015
Base revenue reduction
4125638
7592320
11812895
16167619
20328524
24769904
29155510
33338091
37691451
42141405
46445908
Fuel cost reduction
5166240
8956848
13238528
14683328
16859440
20212576
24919120
30094336
34616096
40546848
47845120
Potential off-system sales margins
2767500
5737500
8707500
Capacity cost reduction
12000000
15000000
18000000
21000000
24000000
27000000
30000000
33000000
GFT reduction
845561
660413
773705
527757
576669
709301
827386
851560
807636
944644
1055853
845560920627699
Program cost
20689324
22819634
22819634
22819634
22819634
22819634
22819634
22819634
22819634
22819634
22819634
Recovery through base rates
14405492
14639186
14799075
14977916
15183688
15416391
15650684
15878624
16115254
16352636
16645725
Cash flow
-6796409
-9374854
-10352249
-23481580
-27387801
-31463846
-35497075
-39427542
-43588195
-47663759
-51563965
2005
2006
2007
2008
2009
2010
2011
2012
2013
2014
2015
Base Revenue Reduction
$ (4125638)
$ (7592320)
$ (11812895)
$ (16167619)
$ (20328524)
$ (24769904)
$ (29155510)
$ (33338091)
$ (37691451)
$ (42141405)
$ (46445908)
Fuel Revenue Reduction
$ (5166240)
$ (8956848)
$ (13238528)
$ (26683328)
$ (31859440)
$ (38212576)
$ (45919120)
$ (54094336)
$ (61616096)
$ (70546848)
$ (80845120)
Fuel Cost Reduction
$ 5166240
$ 8956848
$ 13238528
$ 26683328
$ 31859440
$ 38212576
$ 45919120
$ 54094336
$ 61616096
$ 70546848
$ 80845120
Potential off-system sales margins
$ 2767500
$ 5737500
$ 8707500
$ - 0
$ - 0
$ - 0
$ - 0
$ - 0
$ - 0
$ - 0
$ - 0
Net program costs
$ (5438271)
$ (7520034)
$ (7246854)
$ (7313961)
$ (7059277)
$ (6693942)
$ (6341565)
$ (6089451)
$ (5896744)
$ (5522354)
$ (5118057)
AEs net cash impact
$ (6796409)
$ (9374854)
$ (10352249)
$ (23481580)
$ (27387801)
$ (31463846)
$ (35497075)
$ (39427542)
$ (43588195)
$ (47663759)
$ (51563965)
Customer savings
$ 9291878
$ 16549168
$ 25051423
$ 42850947
$ 52187964
$ 62982480
$ 75074630
$ 87432427
$ 99307547
$ 112688253
$ 127291028
CASH FLOW BUILD OPTION
2005
2006
2007
2008
2009
2010
2011
2012
2013
2014
2015
Base revenue reduction
4125638
7592320
11812895
16167619
20328524
24769904
29155510
33338091
37691451
42141405
46445908
Fuel cost reduction
5166240
8956848
13238528
14683328
16859440
20212576
24919120
30094336
34616096
40546848
47845120
Potential off-system sales margins
2767500
5737500
8707500
Capacity cost reduction
7736295
11604442
11604442
15472589
15472589
19340737
19340737
23208884
GFT reduction
845561
660413
773705
527757
576669
709301
827386
851560
807636
944644
1055853
Program cost
20689324
22819634
22819634
22819634
22819634
22819634
22819634
22819634
22819634
22819634
22819634
Recovery through base rates
14405492
14639186
14799075
14977916
15183688
15416391
15650684
15878624
16115254
16352636
16645725
Cash flow
-6796409
-9374854
-10352249
-15745285
-15783359
-19859404
-20024486
-23954952
-24247459
-28323022
-28355080
-21195738994
Capacity cost Build option
Reduced capacity requirement (kW)
46125
95625
145125
194625
243000
292500
339750
385875
430875
477000
523125
Capacity added
200
300
300
400
400
500
500
600
Annual capacity cost
$386814737
$7736295
$11604442
$11604442
$15472589
$15472589
$19340737
$19340737
$23208884
Capacity cost Buy option
Reduced capacity requirement (kW)
46125
95625
145125
194625
243000
292500
339750
385875
430875
477000
523125
Capacity added
200
250
300
350
400
450
500
550
Annual capacity cost
$600000000
$12000000
$15000000
$18000000
$21000000
$24000000
$27000000
$30000000
$33000000
1994
2004
2005
2006
2007
2008
2009
2010
2011
2012
2013
2014
2015
Net MWh to system
7659242
10855000
11388814
11573570
11699976
11841366
12004047
12188019
12373248
12553455
12740532
12928203
13159916
Revenue multiplier
100
142
149
151
153
155
157
159
162
164
166
169
172
Revenue allocated to DSM
9688028
13730281
14405492
14639186
14799075
14977916
15183688
15416391
15650684
15878624
16115254
16352636
16645725
CentskWh in rates for DSM
0134
0134
0134
0134
0134
0134
0134
0133
0133
0133
0133
0133
Annual sales (MWh)
10262000
10776303
10954134
11076488
11213088
11369667
11546488
11724454
11897588
12077216
12256861
12476492
2006
2006
2007
2007
2008
2008
2009
2009
2010
2010
2011
2011
2012
2012
2013
2013
2014
2014
2015
2015
2005
2005
2005
2006
2006
2006
2007
2007
2007
2008
2008
2008
2009
2009
2009
2010
2010
2010
2011
2011
2011
2012
2012
2012
2013
2013
2013
2014
2014
2014
2015
2015
2015
2005
2006
2007
2008
2009
2010
2011
2012
2013
2014
2015
Base Revenue Reduction
$ (4125638)
$ (7592320)
$ (11812895)
$ (16167619)
$ (20328524)
$ (24769904)
$ (29155510)
$ (33338091)
$ (37691451)
$ (42141405)
$ (46445908)
Fuel Revenue Reduction
$ (5166240)
$ (8956848)
$ (13238528)
$ (26683328)
$ (31859440)
$ (38212576)
$ (45919120)
$ (54094336)
$ (61616096)
$ (70546848)
$ (80845120)
Fuel Cost Reduction
$ 5166240
$ 8956848
$ 13238528
$ 26683328
$ 31859440
$ 38212576
$ 45919120
$ 54094336
$ 61616096
$ 70546848
$ 80845120
Potential off-system sales margins
$ 2767500
$ 5737500
$ 8707500
$ - 0
$ - 0
$ - 0
$ - 0
$ - 0
$ - 0
$ - 0
$ - 0
Net program costs
$ (5438271)
$ (7520034)
$ (7246854)
$ (7313961)
$ (7059277)
$ (6693942)
$ (6341565)
$ (6089451)
$ (5896744)
$ (5522354)
$ (5118057)
AEs net cash impact
$ (6796409)
$ (9374854)
$ (10352249)
$ (23481580)
$ (27387801)
$ (31463846)
$ (35497075)
$ (39427542)
$ (43588195)
$ (47663759)
$ (51563965)
Customer savings
$ (9291878)
$ (16549168)
$ (25051423)
$ (42850947)
$ (52187964)
$ (62982480)
$ (75074630)
$ (87432427)
$ (99307547)
$ (112688253)
$ (127291028)
Estimated Annual Impact
Base Revenue Reduction
$ (16134252)
Fuel Revenue Reduction
$ (23790144)
Fuel Cost Reduction
$ 23790144
Potential off-system sales margins
$ 2889000
Net program costs
$ (7166814)
AEs net cash impact
$ (20412066)
Customer savings
$ (39924396)
CURRENT FORECAST
PROPOSED PROJECTION
DSM Analysis
2007
2008
2007
2008
keyed in to round
Base Revenue Reduction
(12000000)
(16000000)
(12000000)
(16000000)
Fuel Revenue Reduction
(13000000)
(15000000)
(5000000)
(7000000)
Customer Savings (Bill Reduction)
(25000000)
(31000000)
(17000000)
(23000000)
Fuel Cost Reduction
13000000
15000000
5000000
7000000
KW
$KW
NET
5 profit
Potential Off-system Capacity Sales
9000000
9000000
6207
$KW
145000
$ 62
$ 8990000
Net of fuel and GFT
$ 449500
TCOS Expense Reduction
900000
1000000
900000
1000000
GFT Reduction
2000000
3000000
2000000
3000000
Program Cost
(23000000)
(23000000)
Recovery through Base Rates
15000000
15000000
AEs Net Income Impact
(8100000)
(20000000)
(17100000)
(35000000)
Deferred Cost of Capacity
12000000
- 0
AEs Net Cash Impact
(8100000)
(8000000)
(17100000)
- 0
Outline for Oct 10 Leadership Team Update
1 Components of BenefitCost Ratios
2 Cash Flow of DSM
CURRENT FORECAST
PROPOSED PROJECTION
DSM Analysis
2007
2008
2007
2008
Base Revenue Reduction
(11812895)
(16167619)
(11812895)
(16167619)
Fuel Revenue Reduction
(13238528)
(14683328)
(5217969)
(5396810)
Fuel Cost Reduction
13238528
14683328
5217969
5396810
Potential off-system sales margins
8707500
8707500
Fuel Revenue Increase-Capacity
12000000
12000000
Fuel Cost Increase-Capacity
(12000000)
(12000000)
TCOS expense reduction
925987
977987
925987
977987
GFT reduction
2279680
2807436
2279680
2807436
Program cost
(22819634)
(22819634)
Recovery through base rates
14799075
14977916
AEs net income impact
(7920288)
(20223914)
100271
(12382196)
Deferred Cost of Capacity
12000000
12000000
AEs net cash impact including deferral
(7920288)
(8223914)
100271
(382196)
Customer savings-(net)
$ (25051423)
$ (30850947)
$ (17030864)
$ (21564429)
Recommend recovery thru fuel factor
Offset customer fuel savings due to DSM
Would not offset revenue loss
(before amp after)
In 2007 we still have excess capacity
Cost recovery
3yrs - recommended purch power
power is only needed during peak-dont utilize a plant
need declines as renewables increases
cash flow
Dynamic pricing-TOU rates motivating cust to conserve energy
would replace some of the energy efficiency rebates
option to self-generate
TCOS expense reduction due to DSM savings
Historical
Historical
Historical
Historical
Historical
Preliminary
Forecast
Forecast
Forecast
Forecast
Forecast
Forecast
Forecast
Forecast
Forecast
Forecast
2000
2001
2002
2003
2004
2005
2006
2007
2008
2009
2010
2011
2012
2013
2014
2015
ERCOT Postage Stamp Rate
1476
1528
1661
1778
1925
2055
2185
2315
2445
2575
2705
2835
2965
3095
3225
3355
Estimated DSM-kW savings applied to average 4CP
40000
40000
40000
40000
40000
40000
40000
40000
40000
40000
40000
Reduction to TCOS expense
$ 821987
$ 873987
$ 925987
$ 977987
$ 1029987
$ 1081987
$ 1133987
$ 1185987
$ 1237987
$ 1289987
$ 1341987
2005
2006
2007
2008
2009
2010
2011
2012
2013
2014
2015
Base revenue reduction
4125638
7592320
11812895
16167619
20328524
24769904
29155510
33338091
37691451
42141405
46445908
kWh reduction
84784000
155505000
242622000
331500000
417534000
508229000
598986000
684617000
774196000
865119000
953353000
Fuel cost reduction
5166240
8956848
13238528
14683328
16859440
20212576
24919120
30094336
34616096
40546848
47845120
Demand reduction (kW)
41000
85000
129000
173000
216000
260000
302000
343000
383000
424000
465000
Reduced reserve requirement (kW)
5125
10625
16125
21625
27000
32500
37750
42875
47875
53000
58125
2008
2009
2010
2011
2012
2013
2014
2015
Reduced capacity requirement (kW)
46125
95625
145125
194625
243000
292500
339750
385875
430875
477000
523125
194625
243000
292500
339750
385875
430875
477000
523125
Increased off-system sales margins
2767500
5737500
8707500
Capacity cost reduction
11677500
14580000
17550000
20385000
23152500
25852500
28620000
31387500
Fuel Factor expense decrease ($)
5166240
8956848
13238528
26360828
31439440
37762576
45304120
53246836
60468596
69166848
79232620
Fuel Factor decrease (centskWh)
00005
00007
00016
00019
00022
00026
00030
00033
00037
00041
Fuel Factor decrease
2
3
7
9
10
12
13
15
15
16
GFT reduction
845561
1505974
2279680
2807436
3384105
4093406
4920791
5772351
6579987
7524631
8580484
Program cost
20689324
22819634
22819634
22819634
22819634
22819634
22819634
22819634
22819634
22819634
22819634
Recovery through base rates
14405492
14639186
14799075
14977916
15183688
15416391
15650684
15878624
16115254
16352636
16645725
Cash flow
-7641970
-10035268
-11125954
-12331837
-13384470
-14623147
-15939461
-17126601
-18543331
-19988403
-21232317
Fuel cost savings assume all saved energy at average gas generation cost
Increased off-system sales margins assumes reduced demand plus associated reserve requirements could be sold for $15kWmonth (after 2007 this is an avoided capacity expense)
Fuel Factor expense increase is increased fuel expense plus purchased capacity cost
GFT reduction is base revenue and fuel cost reductions times 91
Base revenue wDSM
552961968
562415810
569170954
576627290
585065115
594497922
604045383
613657938
623249716
632762255
644233714
Base revenue wo DSM
557087606
570008130
580983849
592794909
605393639
619267826
633200893
646996029
660941168
674903660
690679622
kWh sales wDSM
10776303000
10954134000
11076488000
11213088000
11369667000
11546488000
11724454000
11897588000
12077216000
12256861000
12476492000
kWh sales wo DSM
10861087000
11109639000
11319110000
11544588000
11787201000
12054717000
12323440000
12582205000
12851412000
13121980000
13429845000
1000
kW sales wDSM
2435000
2442000
2443000
2471000
2477000
2486000
2486000
2490000
2515000
2535000
2539000
kW sales wo DSM
2476000
2527000
2572000
2644000
2693000
2746000
2788000
2833000
2898000
2959000
3004000
Fuel Forecast
Budget 2006 (3905)
Tot-2006
Tot-2007
Tot-2008
Tot-2009
Tot-2010
Tot-2011
Tot-2012
Tot-2013
Tot-2014
Tot-2015
Total
MWH
STP
3303339
3488217
3514415
3360759
3465191
3507755
3405921
3614690
3482746
3515635
34658668
FPP
4564135
4517773
4465943
4451812
4418334
4545733
4554494
4586879
4445603
4245674
44796380
Decker
2839387
511212
504648
615748
583574
563845
570235
550098
594337
757598
8090682
Holly
235228
28425
- 0
- 0
- 0
- 0
- 0
- 0
- 0
263653
Sand Hill CC
1533962
1538343
1565132
1615597
1553452
1600111
1516183
1666799
1687122
14276700
SH GT
465155
427320
523864
450359
458722
498276
432337
492003
574949
4322986
Decker GT
157126
216800
280985
238803
246172
264900
238141
266139
294200
2203267
Existing DG
17340
7248
7296
7065
7216
7268
7168
7137
7147
16838
91723
Future DG
110
110
101
2216
2659
4743
5273
7365
7750
17746
48073
PurchasePower
131996
- 0
204000
208800
206400
206400
134400
201600
136000
139200
1568796
Landfill Methane
87493
92450
92704
92450
92450
92450
92704
92450
92450
92450
920052
Future Bioenergy
- 0
- 0
134151
178705
384764
454206
673445
744600
978509
1057336
4605716
Wind
636291
669050
671181
669050
669050
669050
671181
669050
669050
669050
6662004
Solar
684
20026
32685
41438
50311
59183
68298
76929
85801
87839
523193
Shortfall Energy
3308
2419
3355
6021
3311
4269
7050
3075
3868
4281
40957
11584082
11699976
11841366
12004048
12188020
12373249
12553456
12740532
12928204
13159918
123072851
(10512)
(1)
(1)
0
0
(0)
1
1
(0)
0
(10505)
Dollars
STP
14024307
16411783
18054617
17815007
18997196
19874461
19872833
21713134
21541492
22417754
190722584
FPP
47959978
48327184
52942730
56530034
57287196
60262126
61527986
62666810
62927556
61809806
572241406
Decker
161242451
30007075
26150797
28534975
26297430
25902979
27510734
27253106
30904024
41053837
424857407
Holly
15649395
1939153
- 0
- 0
- 0
- 0
- 0
- 0
- 0
17588548
Sand Hill CC
71819840
62147912
53829988
54696364
53773560
56880544
56723452
64324432
66378796
540574888
SH GT
28915407
23018682
25201605
20614580
21546020
24873781
22042049
25993318
31798432
224003872
Decker GT
12129491
14068039
16315347
13248144
14062711
15831205
14654486
17002591
19718490
137030504
Existing DG
1066126
482134
392821
350785
361063
372817
379318
391499
407877
1055934
5260373
Future DG
5688
5352
3321
115774
140956
247241
281454
413559
455875
1154808
2824028
PurchasePower
5000000
- 0
17339160
16429042
16415314
16614357
11144008
17017280
11632503
11967200
123558864
Landfill Methane
3535734
3653844
3663855
3653844
3653844
3653844
3663855
3653844
3653844
3653844
36440353
Future Bioenergy
- 0
- 0
6036769
8041681
17314398
20439270
30305016
33507000
44032792
47579944
207256869
Wind
17374835
18256537
18314921
18256537
18256537
18256537
18314921
18256537
18256537
18256537
181800436
Solar
- 0
- 0
- 0
- 0
- 0
- 0
- 0
- 0
- 0
- 0
- 0
Shortfall Energy
248086
181420
251636
451599
248349
320172
528742
230590
290120
321058
3071771
250457205
245839462
244324412
245526217
247531370
255326093
271114397
278523346
301422961
327166440
2667231902
1792964
10
(12)
6
(1)
10
(27)
4
3
(6)
1793341
Gas MWh
2839387
2902683
2715536
2985730
2888333
2822192
2933522
2736759
3019278
3313869
29157288
Gas cost ($)
161242451
158521208
127324584
123881915
114856517
115285269
125096264
120673092
138224364
158949555
1344055218
Avg gas gen Cost ($MWh)
5679
5461
4689
4149
3977
4085
4264
4409
4578
4796
4610
NO DSM FUEL FACTOR
2006
2007
2008
2009
2010
2011
2012
2013
2014
2015
Thermal Unit Fuel Cost
232662512
236980848
213398064
215549344
211851680
220956944
237247920
240469984
264099856
293228672
Shortfall Purchases
248086
181420
251636
451599
248349
320172
528742
230590
290120
321058
Short-Term Power Purchases
5000000
- 0
29016660
31009042
33965314
36999357
34296508
42869780
40252503
43354700
Fuel Cell Gas Cost
119837
119837
119837
119837
119837
119837
119837
119837
119837
119837
Recoverable ERCOT Expenses
16825273
16825273
16825273
16825273
16825273
16825273
16825273
16825273
16825273
16825273
Fuel Factor Renewables
9998882
9706333
14540565
15223226
23255836
23418594
31052373
32981926
42305054
44649542
Total Fuel Factor Revenue
264854590
263813711
274152035
279178321
286266289
298640176
320070653
333497390
363892643
398499082
Total Renewables
20910569
21910381
28015544
29952062
39224779
42349651
52283792
55417381
65943173
69490325
TotThermal+PurchPwr+Renewables
249864319
245834121
244321076
245522607
247527546
255322004
271110126
278519139
301418805
327162135
Estimated Green Choice Sales
10911686
12204048
13474979
14728836
15968943
18931058
21231418
22435455
23638119
24840783
Fuel Factor Renewables
9998882
9706333
14540565
15223226
23255836
23418594
31052373
32981926
42305054
44649542
Forecast Annual GWh Sales
11110
11319
11545
11787
12055
12323
12582
12851
13122
13430
Average cost per kWh
$ 0023840
$ 0023307
$ 0023747
$ 0023685
$ 0023747
$ 0024234
$ 0025438
$ 0025950
$ 0027732
$ 0029673
Fuel Factors
Secondary
$ 0023475
$ 0022733
$ 0022206
$ 0021895
$ 0021627
$ 0021713
$ 0022535
$ 0022717
$ 0024162
$ 0025715
Primary
$ 0022776
$ 0022056
$ 0021545
$ 0021243
$ 0020984
$ 0021067
$ 0021864
$ 0022041
$ 0023443
$ 0024949
Transmission
$ 0022539
$ 0021828
$ 0021321
$ 0021022
$ 0020766
$ 0020848
$ 0021637
$ 0021812
$ 0023200
$ 0024690
2006
2007
2008
2009
2010
2011
2012
2013
2014
2015
Dag generation
11574
11700
11841
12004
12188
12373
12553
12741
12928
13160
Joe generation
11584
11700
11841
12004
12188
12373
12553
12741
12928
13160
difference
(10)
0
(0)
(0)
(0)
(0)
(0)
0
(0)
0
sales
10954
11076
11213
11370
11546
11724
11898
12077
12257
12476
losses
57
56
56
56
56
55
55
55
55
55
With DSM
Thermal Unit Fuel Cost wDSM
223705664
223742320
198714736
198689904
191639104
196037824
207153584
205853888
223553008
245383552
Short-Term Power Purchases
5000000
- 0
17339160
16429042
16415314
16614357
11144008
17017280
11632503
11967200
Average cost per kWh
$ 0023361
$ 0022623
$ 0022099
$ 0021789
$ 0021523
$ 0021608
$ 0022426
$ 0022607
$ 0024046
$ 0025590
Forecast Annual GWh Sales
10954
11076
11213
11370
11546
11724
11898
12077
12257
12476
255897742
250575183
247791207
247738881
248503713
253336056
266823817
273028794
294725795
319266462
CASH FLOW PURCHASE OPTION
2005
2006
2007
2008
2009
2010
2011
2012
2013
2014
2015
Base revenue reduction
4125638
7592320
11812895
16167619
20328524
24769904
29155510
33338091
37691451
42141405
46445908
Fuel cost reduction
5166240
8956848
13238528
14683328
16859440
20212576
24919120
30094336
34616096
40546848
47845120
Potential off-system sales margins
2767500
5737500
8707500
Capacity cost reduction
12000000
15000000
18000000
21000000
24000000
27000000
30000000
33000000
GFT reduction
845561
660413
773705
527757
576669
709301
827386
851560
807636
944644
1055853
845560920627699
Program cost
20689324
22819634
22819634
22819634
22819634
22819634
22819634
22819634
22819634
22819634
22819634
Recovery through base rates
14405492
14639186
14799075
14977916
15183688
15416391
15650684
15878624
16115254
16352636
16645725
Cash flow
-6796409
-9374854
-10352249
-23481580
-27387801
-31463846
-35497075
-39427542
-43588195
-47663759
-51563965
2005
2006
2007
2008
2009
2010
2011
2012
2013
2014
2015
Base Revenue Reduction
$ (4125638)
$ (7592320)
$ (11812895)
$ (16167619)
$ (20328524)
$ (24769904)
$ (29155510)
$ (33338091)
$ (37691451)
$ (42141405)
$ (46445908)
Fuel Revenue Reduction
$ (5166240)
$ (8956848)
$ (13238528)
$ (26683328)
$ (31859440)
$ (38212576)
$ (45919120)
$ (54094336)
$ (61616096)
$ (70546848)
$ (80845120)
Fuel Cost Reduction
$ 5166240
$ 8956848
$ 13238528
$ 26683328
$ 31859440
$ 38212576
$ 45919120
$ 54094336
$ 61616096
$ 70546848
$ 80845120
Potential off-system sales margins
$ 2767500
$ 5737500
$ 8707500
$ - 0
$ - 0
$ - 0
$ - 0
$ - 0
$ - 0
$ - 0
$ - 0
Net program costs
$ (5438271)
$ (7520034)
$ (7246854)
$ (7313961)
$ (7059277)
$ (6693942)
$ (6341565)
$ (6089451)
$ (5896744)
$ (5522354)
$ (5118057)
AEs net cash impact
$ (6796409)
$ (9374854)
$ (10352249)
$ (23481580)
$ (27387801)
$ (31463846)
$ (35497075)
$ (39427542)
$ (43588195)
$ (47663759)
$ (51563965)
Customer savings
$ 9291878
$ 16549168
$ 25051423
$ 42850947
$ 52187964
$ 62982480
$ 75074630
$ 87432427
$ 99307547
$ 112688253
$ 127291028
CASH FLOW BUILD OPTION
2005
2006
2007
2008
2009
2010
2011
2012
2013
2014
2015
Base revenue reduction
4125638
7592320
11812895
16167619
20328524
24769904
29155510
33338091
37691451
42141405
46445908
Fuel cost reduction
5166240
8956848
13238528
14683328
16859440
20212576
24919120
30094336
34616096
40546848
47845120
Potential off-system sales margins
2767500
5737500
8707500
Capacity cost reduction
7736295
11604442
11604442
15472589
15472589
19340737
19340737
23208884
GFT reduction
845561
660413
773705
527757
576669
709301
827386
851560
807636
944644
1055853
Program cost
20689324
22819634
22819634
22819634
22819634
22819634
22819634
22819634
22819634
22819634
22819634
Recovery through base rates
14405492
14639186
14799075
14977916
15183688
15416391
15650684
15878624
16115254
16352636
16645725
Cash flow
-6796409
-9374854
-10352249
-15745285
-15783359
-19859404
-20024486
-23954952
-24247459
-28323022
-28355080
-21195738994
Capacity cost Build option
Reduced capacity requirement (kW)
46125
95625
145125
194625
243000
292500
339750
385875
430875
477000
523125
Capacity added
200
300
300
400
400
500
500
600
Annual capacity cost
$386814737
$7736295
$11604442
$11604442
$15472589
$15472589
$19340737
$19340737
$23208884
Capacity cost Buy option
Reduced capacity requirement (kW)
46125
95625
145125
194625
243000
292500
339750
385875
430875
477000
523125
Capacity added
200
250
300
350
400
450
500
550
Annual capacity cost
$600000000
$12000000
$15000000
$18000000
$21000000
$24000000
$27000000
$30000000
$33000000
1994
2004
2005
2006
2007
2008
2009
2010
2011
2012
2013
2014
2015
Net MWh to system
7659242
10855000
11388814
11573570
11699976
11841366
12004047
12188019
12373248
12553455
12740532
12928203
13159916
Revenue multiplier
100
142
149
151
153
155
157
159
162
164
166
169
172
Revenue allocated to DSM
9688028
13730281
14405492
14639186
14799075
14977916
15183688
15416391
15650684
15878624
16115254
16352636
16645725
CentskWh in rates for DSM
0134
0134
0134
0134
0134
0134
0134
0133
0133
0133
0133
0133
Annual sales (MWh)
10262000
10776303
10954134
11076488
11213088
11369667
11546488
11724454
11897588
12077216
12256861
12476492
2006
2006
2007
2007
2008
2008
2009
2009
2010
2010
2011
2011
2012
2012
2013
2013
2014
2014
2015
2015
2005
2005
2005
2006
2006
2006
2007
2007
2007
2008
2008
2008
2009
2009
2009
2010
2010
2010
2011
2011
2011
2012
2012
2012
2013
2013
2013
2014
2014
2014
2015
2015
2015
2005
2006
2007
2008
2009
2010
2011
2012
2013
2014
2015
Base Revenue Reduction
$ (4125638)
$ (7592320)
$ (11812895)
$ (16167619)
$ (20328524)
$ (24769904)
$ (29155510)
$ (33338091)
$ (37691451)
$ (42141405)
$ (46445908)
Fuel Revenue Reduction
$ (5166240)
$ (8956848)
$ (13238528)
$ (26683328)
$ (31859440)
$ (38212576)
$ (45919120)
$ (54094336)
$ (61616096)
$ (70546848)
$ (80845120)
Fuel Cost Reduction
$ 5166240
$ 8956848
$ 13238528
$ 26683328
$ 31859440
$ 38212576
$ 45919120
$ 54094336
$ 61616096
$ 70546848
$ 80845120
Potential off-system sales margins
$ 2767500
$ 5737500
$ 8707500
$ - 0
$ - 0
$ - 0
$ - 0
$ - 0
$ - 0
$ - 0
$ - 0
Net program costs
$ (5438271)
$ (7520034)
$ (7246854)
$ (7313961)
$ (7059277)
$ (6693942)
$ (6341565)
$ (6089451)
$ (5896744)
$ (5522354)
$ (5118057)
AEs net cash impact
$ (6796409)
$ (9374854)
$ (10352249)
$ (23481580)
$ (27387801)
$ (31463846)
$ (35497075)
$ (39427542)
$ (43588195)
$ (47663759)
$ (51563965)
Customer savings
$ (9291878)
$ (16549168)
$ (25051423)
$ (42850947)
$ (52187964)
$ (62982480)
$ (75074630)
$ (87432427)
$ (99307547)
$ (112688253)
$ (127291028)
Estimated Annual Impact
Base Revenue Reduction
$ (16134252)
Fuel Revenue Reduction
$ (23790144)
Fuel Cost Reduction
$ 23790144
Potential off-system sales margins
$ 2889000
Net program costs
$ (7166814)
AEs net cash impact
$ (20412066)
Customer savings
$ (39924396)
CURRENT FORECAST
PROPOSED PROJECTION
DSM Analysis
2007
2008
2007
2008
keyed in to round
Base Revenue Reduction
(12000000)
(16000000)
(12000000)
(16000000)
Fuel Revenue Reduction
(13000000)
(15000000)
(5000000)
(7000000)
Fuel Cost Reduction
13000000
15000000
5000000
7000000
KW
$KW
NET
5 profit
Potential off-system capacity sales
9000000
9000000
6207
$KW
145000
$ 62
$ 8990000
Net of fuel and GFT
$ 449500
Fuel Revenue Increase-Capacity
12000000
12000000
6154
$KW
195000
$ 62
$ 12090000
Fuel Cost Increase-Capacity
(12000000)
(12000000)
TCOS expense reduction
900000
1000000
900000
1000000
GFT reduction
2000000
3000000
2000000
3000000
Program cost
(23000000)
(23000000)
Recovery through base rates
15000000
15000000
AEs net income impact
(8100000)
(20000000)
(100000)
(12000000)
Deferred Cost of Capacity
12000000
12000000
AEs net cash impact
(8100000)
(8000000)
(100000)
- 0
Customer savings-(net)
$ (25000000)
$ (31000000)
$ (17000000)
$ (35000000)
Outline for Oct 10 Leadership Team Update
1 Components of BenefitCost Ratios
2 Cash Flow of DSM
CURRENT FORECAST
PROPOSED PROJECTION
DSM Analysis
2007
2008
2007
2008
Base Revenue Reduction
(11812895)
(16167619)
(11812895)
(16167619)
Fuel Revenue Reduction
(13238528)
(14683328)
(5217969)
(5396810)
Fuel Cost Reduction
13238528
14683328
5217969
5396810
Potential off-system sales margins
8707500
8707500
Fuel Revenue Increase-Capacity
12000000
12000000
Fuel Cost Increase-Capacity
(12000000)
(12000000)
TCOS expense reduction
925987
977987
925987
977987
GFT reduction
2279680
2807436
2279680
2807436
Program cost
(22819634)
(22819634)
Recovery through base rates
14799075
14977916
AEs net income impact
(7920288)
(20223914)
100271
(12382196)
Deferred Cost of Capacity
12000000
12000000
AEs net cash impact including deferral
(7920288)
(8223914)
100271
(382196)
Customer savings-(net)
$ (25051423)
$ (30850947)
$ (17030864)
$ (33564429)
Recommend recovery thru fuel factor
Offset customer fuel savings due to DSM
Would not offset revenue loss
(before amp after)
In 2007 we still have excess capacity
Cost recovery
3yrs - recommended purch power
power is only needed during peak-dont utilize a plant
need declines as renewables increases
cash flow
Dynamic pricing-TOU rates motivating cust to conserve energy
would replace some of the energy efficiency rebates
option to self-generate
TCOS expense reduction due to DSM savings
Historical
Historical
Historical
Historical
Historical
Preliminary
Forecast
Forecast
Forecast
Forecast
Forecast
Forecast
Forecast
Forecast
Forecast
Forecast
2000
2001
2002
2003
2004
2005
2006
2007
2008
2009
2010
2011
2012
2013
2014
2015
ERCOT Postage Stamp Rate
1476
1528
1661
1778
1925
2055
2185
2315
2445
2575
2705
2835
2965
3095
3225
3355
Estimated DSM-kW savings applied to average 4CP
40000
40000
40000
40000
40000
40000
40000
40000
40000
40000
40000
Reduction to TCOS expense
$ 821987
$ 873987
$ 925987
$ 977987
$ 1029987
$ 1081987
$ 1133987
$ 1185987
$ 1237987
$ 1289987
$ 1341987
Saving Energy TogetherPower SaverTM Program
DSM Cost-Effectiveness Modelbull ldquoStandard Practice for Cost-Benefit Analysis of
Conservation and Load Management Programsrdquo first published 1983
bull Used to compare DSM program costs to supply-side options
bull DSM is a lower cost option than supply-side optionsbull Residential DSM Cost $439 per peak kW savedbull Commercial DSM Cost $272 per peak kW saved
Saving Energy TogetherPower SaverTM Program
Modeling DSM Programs in Load Forecast
bull Hourly electric load shapes are created for DSMbull Hourly KW savings are determined using
computer modelsbull Participation budgets are established annually bull DSM impacts are included in load forecast
Saving Energy TogetherPower SaverTM Program
DSM Savings Forecast
Saving Energy TogetherPower SaverTM Program
DSM Reduction in Fuel Costs
$0020
$0021
$0022
$0023
$0024
$0025
$0026
$0027
$0028
$0029
$0030
2006 2007 2008 2009 2010 2011 2012 2013 2014 2015
Fuel Cost without DSM
Fuel Cost with DSM
Cash flow chart
Chart1
Fuel Cost Reduction
Capacity Expense Reduction
Total Decrease In Expenses
REDUCTION IN EXPENSES DUE TO DSM PROGRAMS
5166240
5166240
8956848
8956848
13238528
13238528
14683328
26360828
11677500
16859440
31439440
14580000
20212576
37762576
17550000
24919120
45304120
20385000
30094336
53246836
23152500
34616096
60468596
25852500
40546848
69166848
28620000
47845120
79232620
31387500
Chart4
Fuel Cost without DSM
Fuel Cost with DSM
00233611231
00238400717
00226232559
00233069306
00220985648
00237472342
00217888198
00236848698
00215229268
00237472426
00216083296
00242335075
00224259386
00254383594
00226073357
00259502528
00240455083
00277315347
00255904506
00296726494
Sheet1
Sheet3
Saving Energy TogetherPower SaverTM Program
DSM Analysis 2007 2008
Base Revenue Reduction (12000000) (16000000) Fuel Revenue Reduction (13000000) (15000000)
AEs Net Income Impact (8100000) (20000000) Deferred Cost of Capacity 12000000 AEs Net Cash Impact (8100000) (8000000)
CURRENT FORECAST
Cash Flow Projection of DSM
Cash flow chart
Chart1
Fuel Cost Reduction
Capacity Expense Reduction
Total Decrease In Expenses
REDUCTION IN EXPENSES DUE TO DSM PROGRAMS
5166240
5166240
8956848
8956848
13238528
13238528
14683328
26360828
11677500
16859440
31439440
14580000
20212576
37762576
17550000
24919120
45304120
20385000
30094336
53246836
23152500
34616096
60468596
25852500
40546848
69166848
28620000
47845120
79232620
31387500
Chart4
Fuel Cost without DSM
Fuel Cost with DSM
REDUCTION IN FUEL COST DUE TO DSM PROGRAMS
00233611231
00238400717
00226232559
00233069306
00220985648
00237472342
00217888198
00236848698
00215229268
00237472426
00216083296
00242335075
00224259386
00254383594
00226073357
00259502528
00240455083
00277315347
00255904506
00296726494
Sheet1
Sheet3
Saving Energy TogetherPower SaverTM Program
Questions
Saving Energy TogetherPower SaverTM Program
FY 2006 Achievements
Energy SavingsMW of
Programs Saved Goal Goal
Residential 126 115 110
Commercial 154 121 127
Demand Response 146 156 94
Solar 055 060 93
Grand Total 432 398 108
Saving Energy TogetherPower SaverTM Program
MW SavedPrograms FY2005 FY2006
Residential 119 126
Commercial 153 154
Demand Response 116 146
Solar 06 055
Grand Total 394 432
Energy Savings ComparisonFY2005 to FY2006
Saving Energy TogetherPower SaverTM Program
DSM Summary
bull DSM programs are saving peak kW amp kWh
bull Cost-effectiveness analyses include full program costs
bull DSM goals and budgets should vary to support AE resource plan requirements
Saving Energy TogetherPower SaverTM Program
Free Home WeatherizationEnergy Improvementsbull Insulate Atticsbull Duct Sealingbull Install CFLsbull Solar Screensbull Caulking and Weather-strippingbull Free Smoke amp Carbon Monoxide Detector bull Minor Energy Related Repairs
Saving Energy TogetherPower SaverTM Program
Power Saver Program
bull FREE Energy Saving Productsbull Lower energy costsbull 65000 installed in homes apartmentsbull 4000 installed in commercial buildings
Saving Energy TogetherPower SaverTM Program
Energy Conservation in COA FacilitiesSenate Bill 5 Energy Use vs Energy Cost
295
300
305
310
315
320
325
330
335
340
345
350
Base Year2001
2002 2003 2004 2005 2006
Gig
awat
t-hou
rs
220
230
240
250
260
270
280
290
300
Mill
ion
Dol
lars
Million kWh Cost
Chart1
Million kWh
Cost
Gigawatt-hours
Million Dollars
Senate Bill 5 Energy Use vs Energy Cost
343667472
28619895
33757683
2504536
3260767692
24602549
31773020962
26778741
324036807
2745756918
313494864
2936354518
Sheet1
Sheet1
ampA
Page ampP
Million kWh
Gigawatt-hours
Senate Bill 5 Reported Energy Use
Sheet2
ampA
Page ampP
Million kWh
Cost
Gigawatt-hours
Million Dollars
Senate Bill 5 Energy Use vs Energy Cost
Sheet3
Energy Efficiency Real Reliable and Cost-Effective Alternative
Fuel cost savings assume all saved energy at average gas generation cost
Increased off-system sales margins assumes reduced demand plus associated reserve requirements could be sold for $15kWmonth (after 2007 this is an avoided capacity expense)
Fuel Factor expense increase is increased fuel expense plus purchased capacity cost
GFT reduction is base revenue and fuel cost reductions times 91
Base revenue wDSM
552961968
562415810
569170954
576627290
585065115
594497922
604045383
613657938
623249716
632762255
644233714
Base revenue wo DSM
557087606
570008130
580983849
592794909
605393639
619267826
633200893
646996029
660941168
674903660
690679622
kWh sales wDSM
10776303000
10954134000
11076488000
11213088000
11369667000
11546488000
11724454000
11897588000
12077216000
12256861000
12476492000
kWh sales wo DSM
10861087000
11109639000
11319110000
11544588000
11787201000
12054717000
12323440000
12582205000
12851412000
13121980000
13429845000
1000
kW sales wDSM
2435000
2442000
2443000
2471000
2477000
2486000
2486000
2490000
2515000
2535000
2539000
kW sales wo DSM
2476000
2527000
2572000
2644000
2693000
2746000
2788000
2833000
2898000
2959000
3004000
Fuel Forecast
Budget 2006 (3905)
Tot-2006
Tot-2007
Tot-2008
Tot-2009
Tot-2010
Tot-2011
Tot-2012
Tot-2013
Tot-2014
Tot-2015
Total
MWH
STP
3303339
3488217
3514415
3360759
3465191
3507755
3405921
3614690
3482746
3515635
34658668
FPP
4564135
4517773
4465943
4451812
4418334
4545733
4554494
4586879
4445603
4245674
44796380
Decker
2839387
511212
504648
615748
583574
563845
570235
550098
594337
757598
8090682
Holly
235228
28425
- 0
- 0
- 0
- 0
- 0
- 0
- 0
263653
Sand Hill CC
1533962
1538343
1565132
1615597
1553452
1600111
1516183
1666799
1687122
14276700
SH GT
465155
427320
523864
450359
458722
498276
432337
492003
574949
4322986
Decker GT
157126
216800
280985
238803
246172
264900
238141
266139
294200
2203267
Existing DG
17340
7248
7296
7065
7216
7268
7168
7137
7147
16838
91723
Future DG
110
110
101
2216
2659
4743
5273
7365
7750
17746
48073
PurchasePower
131996
- 0
204000
208800
206400
206400
134400
201600
136000
139200
1568796
Landfill Methane
87493
92450
92704
92450
92450
92450
92704
92450
92450
92450
920052
Future Bioenergy
- 0
- 0
134151
178705
384764
454206
673445
744600
978509
1057336
4605716
Wind
636291
669050
671181
669050
669050
669050
671181
669050
669050
669050
6662004
Solar
684
20026
32685
41438
50311
59183
68298
76929
85801
87839
523193
Shortfall Energy
3308
2419
3355
6021
3311
4269
7050
3075
3868
4281
40957
11584082
11699976
11841366
12004048
12188020
12373249
12553456
12740532
12928204
13159918
123072851
(10512)
(1)
(1)
0
0
(0)
1
1
(0)
0
(10505)
Dollars
STP
14024307
16411783
18054617
17815007
18997196
19874461
19872833
21713134
21541492
22417754
190722584
FPP
47959978
48327184
52942730
56530034
57287196
60262126
61527986
62666810
62927556
61809806
572241406
Decker
161242451
30007075
26150797
28534975
26297430
25902979
27510734
27253106
30904024
41053837
424857407
Holly
15649395
1939153
- 0
- 0
- 0
- 0
- 0
- 0
- 0
17588548
Sand Hill CC
71819840
62147912
53829988
54696364
53773560
56880544
56723452
64324432
66378796
540574888
SH GT
28915407
23018682
25201605
20614580
21546020
24873781
22042049
25993318
31798432
224003872
Decker GT
12129491
14068039
16315347
13248144
14062711
15831205
14654486
17002591
19718490
137030504
Existing DG
1066126
482134
392821
350785
361063
372817
379318
391499
407877
1055934
5260373
Future DG
5688
5352
3321
115774
140956
247241
281454
413559
455875
1154808
2824028
PurchasePower
5000000
- 0
17339160
16429042
16415314
16614357
11144008
17017280
11632503
11967200
123558864
Landfill Methane
3535734
3653844
3663855
3653844
3653844
3653844
3663855
3653844
3653844
3653844
36440353
Future Bioenergy
- 0
- 0
6036769
8041681
17314398
20439270
30305016
33507000
44032792
47579944
207256869
Wind
17374835
18256537
18314921
18256537
18256537
18256537
18314921
18256537
18256537
18256537
181800436
Solar
- 0
- 0
- 0
- 0
- 0
- 0
- 0
- 0
- 0
- 0
- 0
Shortfall Energy
248086
181420
251636
451599
248349
320172
528742
230590
290120
321058
3071771
250457205
245839462
244324412
245526217
247531370
255326093
271114397
278523346
301422961
327166440
2667231902
1792964
10
(12)
6
(1)
10
(27)
4
3
(6)
1793341
Gas MWh
2839387
2902683
2715536
2985730
2888333
2822192
2933522
2736759
3019278
3313869
29157288
Gas cost ($)
161242451
158521208
127324584
123881915
114856517
115285269
125096264
120673092
138224364
158949555
1344055218
Avg gas gen Cost ($MWh)
5679
5461
4689
4149
3977
4085
4264
4409
4578
4796
4610
NO DSM FUEL FACTOR
2006
2007
2008
2009
2010
2011
2012
2013
2014
2015
Thermal Unit Fuel Cost
232662512
236980848
213398064
215549344
211851680
220956944
237247920
240469984
264099856
293228672
Shortfall Purchases
248086
181420
251636
451599
248349
320172
528742
230590
290120
321058
Short-Term Power Purchases
5000000
- 0
29016660
31009042
33965314
36999357
34296508
42869780
40252503
43354700
Fuel Cell Gas Cost
119837
119837
119837
119837
119837
119837
119837
119837
119837
119837
Recoverable ERCOT Expenses
16825273
16825273
16825273
16825273
16825273
16825273
16825273
16825273
16825273
16825273
Fuel Factor Renewables
9998882
9706333
14540565
15223226
23255836
23418594
31052373
32981926
42305054
44649542
Total Fuel Factor Revenue
264854590
263813711
274152035
279178321
286266289
298640176
320070653
333497390
363892643
398499082
Total Renewables
20910569
21910381
28015544
29952062
39224779
42349651
52283792
55417381
65943173
69490325
TotThermal+PurchPwr+Renewables
249864319
245834121
244321076
245522607
247527546
255322004
271110126
278519139
301418805
327162135
Estimated Green Choice Sales
10911686
12204048
13474979
14728836
15968943
18931058
21231418
22435455
23638119
24840783
Fuel Factor Renewables
9998882
9706333
14540565
15223226
23255836
23418594
31052373
32981926
42305054
44649542
Forecast Annual GWh Sales
11110
11319
11545
11787
12055
12323
12582
12851
13122
13430
Average cost per kWh
$ 0023840
$ 0023307
$ 0023747
$ 0023685
$ 0023747
$ 0024234
$ 0025438
$ 0025950
$ 0027732
$ 0029673
Fuel Factors
Secondary
$ 0023475
$ 0022733
$ 0022206
$ 0021895
$ 0021627
$ 0021713
$ 0022535
$ 0022717
$ 0024162
$ 0025715
Primary
$ 0022776
$ 0022056
$ 0021545
$ 0021243
$ 0020984
$ 0021067
$ 0021864
$ 0022041
$ 0023443
$ 0024949
Transmission
$ 0022539
$ 0021828
$ 0021321
$ 0021022
$ 0020766
$ 0020848
$ 0021637
$ 0021812
$ 0023200
$ 0024690
2006
2007
2008
2009
2010
2011
2012
2013
2014
2015
Dag generation
11574
11700
11841
12004
12188
12373
12553
12741
12928
13160
Joe generation
11584
11700
11841
12004
12188
12373
12553
12741
12928
13160
difference
(10)
0
(0)
(0)
(0)
(0)
(0)
0
(0)
0
sales
10954
11076
11213
11370
11546
11724
11898
12077
12257
12476
losses
57
56
56
56
56
55
55
55
55
55
With DSM
Thermal Unit Fuel Cost wDSM
223705664
223742320
198714736
198689904
191639104
196037824
207153584
205853888
223553008
245383552
Short-Term Power Purchases
5000000
- 0
17339160
16429042
16415314
16614357
11144008
17017280
11632503
11967200
Average cost per kWh
$ 0023361
$ 0022623
$ 0022099
$ 0021789
$ 0021523
$ 0021608
$ 0022426
$ 0022607
$ 0024046
$ 0025590
Forecast Annual GWh Sales
10954
11076
11213
11370
11546
11724
11898
12077
12257
12476
255897742
250575183
247791207
247738881
248503713
253336056
266823817
273028794
294725795
319266462
CASH FLOW PURCHASE OPTION
2005
2006
2007
2008
2009
2010
2011
2012
2013
2014
2015
Base revenue reduction
4125638
7592320
11812895
16167619
20328524
24769904
29155510
33338091
37691451
42141405
46445908
Fuel cost reduction
5166240
8956848
13238528
14683328
16859440
20212576
24919120
30094336
34616096
40546848
47845120
Potential off-system sales margins
2767500
5737500
8707500
Capacity cost reduction
12000000
15000000
18000000
21000000
24000000
27000000
30000000
33000000
GFT reduction
845561
660413
773705
527757
576669
709301
827386
851560
807636
944644
1055853
845560920627699
Program cost
20689324
22819634
22819634
22819634
22819634
22819634
22819634
22819634
22819634
22819634
22819634
Recovery through base rates
14405492
14639186
14799075
14977916
15183688
15416391
15650684
15878624
16115254
16352636
16645725
Cash flow
-6796409
-9374854
-10352249
-23481580
-27387801
-31463846
-35497075
-39427542
-43588195
-47663759
-51563965
2005
2006
2007
2008
2009
2010
2011
2012
2013
2014
2015
Base Revenue Reduction
$ (4125638)
$ (7592320)
$ (11812895)
$ (16167619)
$ (20328524)
$ (24769904)
$ (29155510)
$ (33338091)
$ (37691451)
$ (42141405)
$ (46445908)
Fuel Revenue Reduction
$ (5166240)
$ (8956848)
$ (13238528)
$ (26683328)
$ (31859440)
$ (38212576)
$ (45919120)
$ (54094336)
$ (61616096)
$ (70546848)
$ (80845120)
Fuel Cost Reduction
$ 5166240
$ 8956848
$ 13238528
$ 26683328
$ 31859440
$ 38212576
$ 45919120
$ 54094336
$ 61616096
$ 70546848
$ 80845120
Potential off-system sales margins
$ 2767500
$ 5737500
$ 8707500
$ - 0
$ - 0
$ - 0
$ - 0
$ - 0
$ - 0
$ - 0
$ - 0
Net program costs
$ (5438271)
$ (7520034)
$ (7246854)
$ (7313961)
$ (7059277)
$ (6693942)
$ (6341565)
$ (6089451)
$ (5896744)
$ (5522354)
$ (5118057)
AEs net cash impact
$ (6796409)
$ (9374854)
$ (10352249)
$ (23481580)
$ (27387801)
$ (31463846)
$ (35497075)
$ (39427542)
$ (43588195)
$ (47663759)
$ (51563965)
Customer savings
$ 9291878
$ 16549168
$ 25051423
$ 42850947
$ 52187964
$ 62982480
$ 75074630
$ 87432427
$ 99307547
$ 112688253
$ 127291028
CASH FLOW BUILD OPTION
2005
2006
2007
2008
2009
2010
2011
2012
2013
2014
2015
Base revenue reduction
4125638
7592320
11812895
16167619
20328524
24769904
29155510
33338091
37691451
42141405
46445908
Fuel cost reduction
5166240
8956848
13238528
14683328
16859440
20212576
24919120
30094336
34616096
40546848
47845120
Potential off-system sales margins
2767500
5737500
8707500
Capacity cost reduction
7736295
11604442
11604442
15472589
15472589
19340737
19340737
23208884
GFT reduction
845561
660413
773705
527757
576669
709301
827386
851560
807636
944644
1055853
Program cost
20689324
22819634
22819634
22819634
22819634
22819634
22819634
22819634
22819634
22819634
22819634
Recovery through base rates
14405492
14639186
14799075
14977916
15183688
15416391
15650684
15878624
16115254
16352636
16645725
Cash flow
-6796409
-9374854
-10352249
-15745285
-15783359
-19859404
-20024486
-23954952
-24247459
-28323022
-28355080
-21195738994
Capacity cost Build option
Reduced capacity requirement (kW)
46125
95625
145125
194625
243000
292500
339750
385875
430875
477000
523125
Capacity added
200
300
300
400
400
500
500
600
Annual capacity cost
$386814737
$7736295
$11604442
$11604442
$15472589
$15472589
$19340737
$19340737
$23208884
Capacity cost Buy option
Reduced capacity requirement (kW)
46125
95625
145125
194625
243000
292500
339750
385875
430875
477000
523125
Capacity added
200
250
300
350
400
450
500
550
Annual capacity cost
$600000000
$12000000
$15000000
$18000000
$21000000
$24000000
$27000000
$30000000
$33000000
1994
2004
2005
2006
2007
2008
2009
2010
2011
2012
2013
2014
2015
Net MWh to system
7659242
10855000
11388814
11573570
11699976
11841366
12004047
12188019
12373248
12553455
12740532
12928203
13159916
Revenue multiplier
100
142
149
151
153
155
157
159
162
164
166
169
172
Revenue allocated to DSM
9688028
13730281
14405492
14639186
14799075
14977916
15183688
15416391
15650684
15878624
16115254
16352636
16645725
CentskWh in rates for DSM
0134
0134
0134
0134
0134
0134
0134
0133
0133
0133
0133
0133
Annual sales (MWh)
10262000
10776303
10954134
11076488
11213088
11369667
11546488
11724454
11897588
12077216
12256861
12476492
2006
2006
2007
2007
2008
2008
2009
2009
2010
2010
2011
2011
2012
2012
2013
2013
2014
2014
2015
2015
2005
2005
2005
2006
2006
2006
2007
2007
2007
2008
2008
2008
2009
2009
2009
2010
2010
2010
2011
2011
2011
2012
2012
2012
2013
2013
2013
2014
2014
2014
2015
2015
2015
2005
2006
2007
2008
2009
2010
2011
2012
2013
2014
2015
Base Revenue Reduction
$ (4125638)
$ (7592320)
$ (11812895)
$ (16167619)
$ (20328524)
$ (24769904)
$ (29155510)
$ (33338091)
$ (37691451)
$ (42141405)
$ (46445908)
Fuel Revenue Reduction
$ (5166240)
$ (8956848)
$ (13238528)
$ (26683328)
$ (31859440)
$ (38212576)
$ (45919120)
$ (54094336)
$ (61616096)
$ (70546848)
$ (80845120)
Fuel Cost Reduction
$ 5166240
$ 8956848
$ 13238528
$ 26683328
$ 31859440
$ 38212576
$ 45919120
$ 54094336
$ 61616096
$ 70546848
$ 80845120
Potential off-system sales margins
$ 2767500
$ 5737500
$ 8707500
$ - 0
$ - 0
$ - 0
$ - 0
$ - 0
$ - 0
$ - 0
$ - 0
Net program costs
$ (5438271)
$ (7520034)
$ (7246854)
$ (7313961)
$ (7059277)
$ (6693942)
$ (6341565)
$ (6089451)
$ (5896744)
$ (5522354)
$ (5118057)
AEs net cash impact
$ (6796409)
$ (9374854)
$ (10352249)
$ (23481580)
$ (27387801)
$ (31463846)
$ (35497075)
$ (39427542)
$ (43588195)
$ (47663759)
$ (51563965)
Customer savings
$ (9291878)
$ (16549168)
$ (25051423)
$ (42850947)
$ (52187964)
$ (62982480)
$ (75074630)
$ (87432427)
$ (99307547)
$ (112688253)
$ (127291028)
Estimated Annual Impact
Base Revenue Reduction
$ (16134252)
Fuel Revenue Reduction
$ (23790144)
Fuel Cost Reduction
$ 23790144
Potential off-system sales margins
$ 2889000
Net program costs
$ (7166814)
AEs net cash impact
$ (20412066)
Customer savings
$ (39924396)
CURRENT FORECAST
PROPOSED PROJECTION
DSM Analysis
2007
2008
2007
2008
keyed in to round
Base Revenue Reduction
(12000000)
(16000000)
(12000000)
(16000000)
Fuel Revenue Reduction
(13000000)
(15000000)
(5000000)
(7000000)
Customer Savings (Bill Reduction)
(25000000)
(31000000)
(17000000)
(23000000)
Fuel Cost Reduction
13000000
15000000
5000000
7000000
KW
$KW
NET
5 profit
Potential Off-system Capacity Sales
9000000
9000000
6207
$KW
145000
$ 62
$ 8990000
Net of fuel and GFT
$ 449500
TCOS Expense Reduction
900000
1000000
900000
1000000
GFT Reduction
2000000
3000000
2000000
3000000
Program Cost
(23000000)
(23000000)
Recovery through Base Rates
15000000
15000000
AEs Net Income Impact
(8100000)
(20000000)
(17100000)
(35000000)
Deferred Cost of Capacity
12000000
- 0
AEs Net Cash Impact
(8100000)
(8000000)
(17100000)
- 0
Outline for Oct 10 Leadership Team Update
1 Components of BenefitCost Ratios
2 Cash Flow of DSM
CURRENT FORECAST
PROPOSED PROJECTION
DSM Analysis
2007
2008
2007
2008
Base Revenue Reduction
(11812895)
(16167619)
(11812895)
(16167619)
Fuel Revenue Reduction
(13238528)
(14683328)
(5217969)
(5396810)
Fuel Cost Reduction
13238528
14683328
5217969
5396810
Potential off-system sales margins
8707500
8707500
Fuel Revenue Increase-Capacity
12000000
12000000
Fuel Cost Increase-Capacity
(12000000)
(12000000)
TCOS expense reduction
925987
977987
925987
977987
GFT reduction
2279680
2807436
2279680
2807436
Program cost
(22819634)
(22819634)
Recovery through base rates
14799075
14977916
AEs net income impact
(7920288)
(20223914)
100271
(12382196)
Deferred Cost of Capacity
12000000
12000000
AEs net cash impact including deferral
(7920288)
(8223914)
100271
(382196)
Customer savings-(net)
$ (25051423)
$ (30850947)
$ (17030864)
$ (21564429)
Recommend recovery thru fuel factor
Offset customer fuel savings due to DSM
Would not offset revenue loss
(before amp after)
In 2007 we still have excess capacity
Cost recovery
3yrs - recommended purch power
power is only needed during peak-dont utilize a plant
need declines as renewables increases
cash flow
Dynamic pricing-TOU rates motivating cust to conserve energy
would replace some of the energy efficiency rebates
option to self-generate
TCOS expense reduction due to DSM savings
Historical
Historical
Historical
Historical
Historical
Preliminary
Forecast
Forecast
Forecast
Forecast
Forecast
Forecast
Forecast
Forecast
Forecast
Forecast
2000
2001
2002
2003
2004
2005
2006
2007
2008
2009
2010
2011
2012
2013
2014
2015
ERCOT Postage Stamp Rate
1476
1528
1661
1778
1925
2055
2185
2315
2445
2575
2705
2835
2965
3095
3225
3355
Estimated DSM-kW savings applied to average 4CP
40000
40000
40000
40000
40000
40000
40000
40000
40000
40000
40000
Reduction to TCOS expense
$ 821987
$ 873987
$ 925987
$ 977987
$ 1029987
$ 1081987
$ 1133987
$ 1185987
$ 1237987
$ 1289987
$ 1341987
2005
2006
2007
2008
2009
2010
2011
2012
2013
2014
2015
Base revenue reduction
4125638
7592320
11812895
16167619
20328524
24769904
29155510
33338091
37691451
42141405
46445908
kWh reduction
84784000
155505000
242622000
331500000
417534000
508229000
598986000
684617000
774196000
865119000
953353000
Fuel cost reduction
5166240
8956848
13238528
14683328
16859440
20212576
24919120
30094336
34616096
40546848
47845120
Demand reduction (kW)
41000
85000
129000
173000
216000
260000
302000
343000
383000
424000
465000
Reduced reserve requirement (kW)
5125
10625
16125
21625
27000
32500
37750
42875
47875
53000
58125
2008
2009
2010
2011
2012
2013
2014
2015
Reduced capacity requirement (kW)
46125
95625
145125
194625
243000
292500
339750
385875
430875
477000
523125
194625
243000
292500
339750
385875
430875
477000
523125
Increased off-system sales margins
2767500
5737500
8707500
Capacity cost reduction
11677500
14580000
17550000
20385000
23152500
25852500
28620000
31387500
Fuel Factor expense decrease ($)
5166240
8956848
13238528
26360828
31439440
37762576
45304120
53246836
60468596
69166848
79232620
Fuel Factor decrease (centskWh)
00005
00007
00016
00019
00022
00026
00030
00033
00037
00041
Fuel Factor decrease
2
3
7
9
10
12
13
15
15
16
GFT reduction
845561
1505974
2279680
2807436
3384105
4093406
4920791
5772351
6579987
7524631
8580484
Program cost
20689324
22819634
22819634
22819634
22819634
22819634
22819634
22819634
22819634
22819634
22819634
Recovery through base rates
14405492
14639186
14799075
14977916
15183688
15416391
15650684
15878624
16115254
16352636
16645725
Cash flow
-7641970
-10035268
-11125954
-12331837
-13384470
-14623147
-15939461
-17126601
-18543331
-19988403
-21232317
Fuel cost savings assume all saved energy at average gas generation cost
Increased off-system sales margins assumes reduced demand plus associated reserve requirements could be sold for $15kWmonth (after 2007 this is an avoided capacity expense)
Fuel Factor expense increase is increased fuel expense plus purchased capacity cost
GFT reduction is base revenue and fuel cost reductions times 91
Base revenue wDSM
552961968
562415810
569170954
576627290
585065115
594497922
604045383
613657938
623249716
632762255
644233714
Base revenue wo DSM
557087606
570008130
580983849
592794909
605393639
619267826
633200893
646996029
660941168
674903660
690679622
kWh sales wDSM
10776303000
10954134000
11076488000
11213088000
11369667000
11546488000
11724454000
11897588000
12077216000
12256861000
12476492000
kWh sales wo DSM
10861087000
11109639000
11319110000
11544588000
11787201000
12054717000
12323440000
12582205000
12851412000
13121980000
13429845000
1000
kW sales wDSM
2435000
2442000
2443000
2471000
2477000
2486000
2486000
2490000
2515000
2535000
2539000
kW sales wo DSM
2476000
2527000
2572000
2644000
2693000
2746000
2788000
2833000
2898000
2959000
3004000
Fuel Forecast
Budget 2006 (3905)
Tot-2006
Tot-2007
Tot-2008
Tot-2009
Tot-2010
Tot-2011
Tot-2012
Tot-2013
Tot-2014
Tot-2015
Total
MWH
STP
3303339
3488217
3514415
3360759
3465191
3507755
3405921
3614690
3482746
3515635
34658668
FPP
4564135
4517773
4465943
4451812
4418334
4545733
4554494
4586879
4445603
4245674
44796380
Decker
2839387
511212
504648
615748
583574
563845
570235
550098
594337
757598
8090682
Holly
235228
28425
- 0
- 0
- 0
- 0
- 0
- 0
- 0
263653
Sand Hill CC
1533962
1538343
1565132
1615597
1553452
1600111
1516183
1666799
1687122
14276700
SH GT
465155
427320
523864
450359
458722
498276
432337
492003
574949
4322986
Decker GT
157126
216800
280985
238803
246172
264900
238141
266139
294200
2203267
Existing DG
17340
7248
7296
7065
7216
7268
7168
7137
7147
16838
91723
Future DG
110
110
101
2216
2659
4743
5273
7365
7750
17746
48073
PurchasePower
131996
- 0
204000
208800
206400
206400
134400
201600
136000
139200
1568796
Landfill Methane
87493
92450
92704
92450
92450
92450
92704
92450
92450
92450
920052
Future Bioenergy
- 0
- 0
134151
178705
384764
454206
673445
744600
978509
1057336
4605716
Wind
636291
669050
671181
669050
669050
669050
671181
669050
669050
669050
6662004
Solar
684
20026
32685
41438
50311
59183
68298
76929
85801
87839
523193
Shortfall Energy
3308
2419
3355
6021
3311
4269
7050
3075
3868
4281
40957
11584082
11699976
11841366
12004048
12188020
12373249
12553456
12740532
12928204
13159918
123072851
(10512)
(1)
(1)
0
0
(0)
1
1
(0)
0
(10505)
Dollars
STP
14024307
16411783
18054617
17815007
18997196
19874461
19872833
21713134
21541492
22417754
190722584
FPP
47959978
48327184
52942730
56530034
57287196
60262126
61527986
62666810
62927556
61809806
572241406
Decker
161242451
30007075
26150797
28534975
26297430
25902979
27510734
27253106
30904024
41053837
424857407
Holly
15649395
1939153
- 0
- 0
- 0
- 0
- 0
- 0
- 0
17588548
Sand Hill CC
71819840
62147912
53829988
54696364
53773560
56880544
56723452
64324432
66378796
540574888
SH GT
28915407
23018682
25201605
20614580
21546020
24873781
22042049
25993318
31798432
224003872
Decker GT
12129491
14068039
16315347
13248144
14062711
15831205
14654486
17002591
19718490
137030504
Existing DG
1066126
482134
392821
350785
361063
372817
379318
391499
407877
1055934
5260373
Future DG
5688
5352
3321
115774
140956
247241
281454
413559
455875
1154808
2824028
PurchasePower
5000000
- 0
17339160
16429042
16415314
16614357
11144008
17017280
11632503
11967200
123558864
Landfill Methane
3535734
3653844
3663855
3653844
3653844
3653844
3663855
3653844
3653844
3653844
36440353
Future Bioenergy
- 0
- 0
6036769
8041681
17314398
20439270
30305016
33507000
44032792
47579944
207256869
Wind
17374835
18256537
18314921
18256537
18256537
18256537
18314921
18256537
18256537
18256537
181800436
Solar
- 0
- 0
- 0
- 0
- 0
- 0
- 0
- 0
- 0
- 0
- 0
Shortfall Energy
248086
181420
251636
451599
248349
320172
528742
230590
290120
321058
3071771
250457205
245839462
244324412
245526217
247531370
255326093
271114397
278523346
301422961
327166440
2667231902
1792964
10
(12)
6
(1)
10
(27)
4
3
(6)
1793341
Gas MWh
2839387
2902683
2715536
2985730
2888333
2822192
2933522
2736759
3019278
3313869
29157288
Gas cost ($)
161242451
158521208
127324584
123881915
114856517
115285269
125096264
120673092
138224364
158949555
1344055218
Avg gas gen Cost ($MWh)
5679
5461
4689
4149
3977
4085
4264
4409
4578
4796
4610
NO DSM FUEL FACTOR
2006
2007
2008
2009
2010
2011
2012
2013
2014
2015
Thermal Unit Fuel Cost
232662512
236980848
213398064
215549344
211851680
220956944
237247920
240469984
264099856
293228672
Shortfall Purchases
248086
181420
251636
451599
248349
320172
528742
230590
290120
321058
Short-Term Power Purchases
5000000
- 0
29016660
31009042
33965314
36999357
34296508
42869780
40252503
43354700
Fuel Cell Gas Cost
119837
119837
119837
119837
119837
119837
119837
119837
119837
119837
Recoverable ERCOT Expenses
16825273
16825273
16825273
16825273
16825273
16825273
16825273
16825273
16825273
16825273
Fuel Factor Renewables
9998882
9706333
14540565
15223226
23255836
23418594
31052373
32981926
42305054
44649542
Total Fuel Factor Revenue
264854590
263813711
274152035
279178321
286266289
298640176
320070653
333497390
363892643
398499082
Total Renewables
20910569
21910381
28015544
29952062
39224779
42349651
52283792
55417381
65943173
69490325
TotThermal+PurchPwr+Renewables
249864319
245834121
244321076
245522607
247527546
255322004
271110126
278519139
301418805
327162135
Estimated Green Choice Sales
10911686
12204048
13474979
14728836
15968943
18931058
21231418
22435455
23638119
24840783
Fuel Factor Renewables
9998882
9706333
14540565
15223226
23255836
23418594
31052373
32981926
42305054
44649542
Forecast Annual GWh Sales
11110
11319
11545
11787
12055
12323
12582
12851
13122
13430
Average cost per kWh
$ 0023840
$ 0023307
$ 0023747
$ 0023685
$ 0023747
$ 0024234
$ 0025438
$ 0025950
$ 0027732
$ 0029673
Fuel Factors
Secondary
$ 0023475
$ 0022733
$ 0022206
$ 0021895
$ 0021627
$ 0021713
$ 0022535
$ 0022717
$ 0024162
$ 0025715
Primary
$ 0022776
$ 0022056
$ 0021545
$ 0021243
$ 0020984
$ 0021067
$ 0021864
$ 0022041
$ 0023443
$ 0024949
Transmission
$ 0022539
$ 0021828
$ 0021321
$ 0021022
$ 0020766
$ 0020848
$ 0021637
$ 0021812
$ 0023200
$ 0024690
2006
2007
2008
2009
2010
2011
2012
2013
2014
2015
Dag generation
11574
11700
11841
12004
12188
12373
12553
12741
12928
13160
Joe generation
11584
11700
11841
12004
12188
12373
12553
12741
12928
13160
difference
(10)
0
(0)
(0)
(0)
(0)
(0)
0
(0)
0
sales
10954
11076
11213
11370
11546
11724
11898
12077
12257
12476
losses
57
56
56
56
56
55
55
55
55
55
With DSM
Thermal Unit Fuel Cost wDSM
223705664
223742320
198714736
198689904
191639104
196037824
207153584
205853888
223553008
245383552
Short-Term Power Purchases
5000000
- 0
17339160
16429042
16415314
16614357
11144008
17017280
11632503
11967200
Average cost per kWh
$ 0023361
$ 0022623
$ 0022099
$ 0021789
$ 0021523
$ 0021608
$ 0022426
$ 0022607
$ 0024046
$ 0025590
Forecast Annual GWh Sales
10954
11076
11213
11370
11546
11724
11898
12077
12257
12476
255897742
250575183
247791207
247738881
248503713
253336056
266823817
273028794
294725795
319266462
CASH FLOW PURCHASE OPTION
2005
2006
2007
2008
2009
2010
2011
2012
2013
2014
2015
Base revenue reduction
4125638
7592320
11812895
16167619
20328524
24769904
29155510
33338091
37691451
42141405
46445908
Fuel cost reduction
5166240
8956848
13238528
14683328
16859440
20212576
24919120
30094336
34616096
40546848
47845120
Potential off-system sales margins
2767500
5737500
8707500
Capacity cost reduction
12000000
15000000
18000000
21000000
24000000
27000000
30000000
33000000
GFT reduction
845561
660413
773705
527757
576669
709301
827386
851560
807636
944644
1055853
845560920627699
Program cost
20689324
22819634
22819634
22819634
22819634
22819634
22819634
22819634
22819634
22819634
22819634
Recovery through base rates
14405492
14639186
14799075
14977916
15183688
15416391
15650684
15878624
16115254
16352636
16645725
Cash flow
-6796409
-9374854
-10352249
-23481580
-27387801
-31463846
-35497075
-39427542
-43588195
-47663759
-51563965
2005
2006
2007
2008
2009
2010
2011
2012
2013
2014
2015
Base Revenue Reduction
$ (4125638)
$ (7592320)
$ (11812895)
$ (16167619)
$ (20328524)
$ (24769904)
$ (29155510)
$ (33338091)
$ (37691451)
$ (42141405)
$ (46445908)
Fuel Revenue Reduction
$ (5166240)
$ (8956848)
$ (13238528)
$ (26683328)
$ (31859440)
$ (38212576)
$ (45919120)
$ (54094336)
$ (61616096)
$ (70546848)
$ (80845120)
Fuel Cost Reduction
$ 5166240
$ 8956848
$ 13238528
$ 26683328
$ 31859440
$ 38212576
$ 45919120
$ 54094336
$ 61616096
$ 70546848
$ 80845120
Potential off-system sales margins
$ 2767500
$ 5737500
$ 8707500
$ - 0
$ - 0
$ - 0
$ - 0
$ - 0
$ - 0
$ - 0
$ - 0
Net program costs
$ (5438271)
$ (7520034)
$ (7246854)
$ (7313961)
$ (7059277)
$ (6693942)
$ (6341565)
$ (6089451)
$ (5896744)
$ (5522354)
$ (5118057)
AEs net cash impact
$ (6796409)
$ (9374854)
$ (10352249)
$ (23481580)
$ (27387801)
$ (31463846)
$ (35497075)
$ (39427542)
$ (43588195)
$ (47663759)
$ (51563965)
Customer savings
$ 9291878
$ 16549168
$ 25051423
$ 42850947
$ 52187964
$ 62982480
$ 75074630
$ 87432427
$ 99307547
$ 112688253
$ 127291028
CASH FLOW BUILD OPTION
2005
2006
2007
2008
2009
2010
2011
2012
2013
2014
2015
Base revenue reduction
4125638
7592320
11812895
16167619
20328524
24769904
29155510
33338091
37691451
42141405
46445908
Fuel cost reduction
5166240
8956848
13238528
14683328
16859440
20212576
24919120
30094336
34616096
40546848
47845120
Potential off-system sales margins
2767500
5737500
8707500
Capacity cost reduction
7736295
11604442
11604442
15472589
15472589
19340737
19340737
23208884
GFT reduction
845561
660413
773705
527757
576669
709301
827386
851560
807636
944644
1055853
Program cost
20689324
22819634
22819634
22819634
22819634
22819634
22819634
22819634
22819634
22819634
22819634
Recovery through base rates
14405492
14639186
14799075
14977916
15183688
15416391
15650684
15878624
16115254
16352636
16645725
Cash flow
-6796409
-9374854
-10352249
-15745285
-15783359
-19859404
-20024486
-23954952
-24247459
-28323022
-28355080
-21195738994
Capacity cost Build option
Reduced capacity requirement (kW)
46125
95625
145125
194625
243000
292500
339750
385875
430875
477000
523125
Capacity added
200
300
300
400
400
500
500
600
Annual capacity cost
$386814737
$7736295
$11604442
$11604442
$15472589
$15472589
$19340737
$19340737
$23208884
Capacity cost Buy option
Reduced capacity requirement (kW)
46125
95625
145125
194625
243000
292500
339750
385875
430875
477000
523125
Capacity added
200
250
300
350
400
450
500
550
Annual capacity cost
$600000000
$12000000
$15000000
$18000000
$21000000
$24000000
$27000000
$30000000
$33000000
1994
2004
2005
2006
2007
2008
2009
2010
2011
2012
2013
2014
2015
Net MWh to system
7659242
10855000
11388814
11573570
11699976
11841366
12004047
12188019
12373248
12553455
12740532
12928203
13159916
Revenue multiplier
100
142
149
151
153
155
157
159
162
164
166
169
172
Revenue allocated to DSM
9688028
13730281
14405492
14639186
14799075
14977916
15183688
15416391
15650684
15878624
16115254
16352636
16645725
CentskWh in rates for DSM
0134
0134
0134
0134
0134
0134
0134
0133
0133
0133
0133
0133
Annual sales (MWh)
10262000
10776303
10954134
11076488
11213088
11369667
11546488
11724454
11897588
12077216
12256861
12476492
2006
2006
2007
2007
2008
2008
2009
2009
2010
2010
2011
2011
2012
2012
2013
2013
2014
2014
2015
2015
2005
2005
2005
2006
2006
2006
2007
2007
2007
2008
2008
2008
2009
2009
2009
2010
2010
2010
2011
2011
2011
2012
2012
2012
2013
2013
2013
2014
2014
2014
2015
2015
2015
2005
2006
2007
2008
2009
2010
2011
2012
2013
2014
2015
Base Revenue Reduction
$ (4125638)
$ (7592320)
$ (11812895)
$ (16167619)
$ (20328524)
$ (24769904)
$ (29155510)
$ (33338091)
$ (37691451)
$ (42141405)
$ (46445908)
Fuel Revenue Reduction
$ (5166240)
$ (8956848)
$ (13238528)
$ (26683328)
$ (31859440)
$ (38212576)
$ (45919120)
$ (54094336)
$ (61616096)
$ (70546848)
$ (80845120)
Fuel Cost Reduction
$ 5166240
$ 8956848
$ 13238528
$ 26683328
$ 31859440
$ 38212576
$ 45919120
$ 54094336
$ 61616096
$ 70546848
$ 80845120
Potential off-system sales margins
$ 2767500
$ 5737500
$ 8707500
$ - 0
$ - 0
$ - 0
$ - 0
$ - 0
$ - 0
$ - 0
$ - 0
Net program costs
$ (5438271)
$ (7520034)
$ (7246854)
$ (7313961)
$ (7059277)
$ (6693942)
$ (6341565)
$ (6089451)
$ (5896744)
$ (5522354)
$ (5118057)
AEs net cash impact
$ (6796409)
$ (9374854)
$ (10352249)
$ (23481580)
$ (27387801)
$ (31463846)
$ (35497075)
$ (39427542)
$ (43588195)
$ (47663759)
$ (51563965)
Customer savings
$ (9291878)
$ (16549168)
$ (25051423)
$ (42850947)
$ (52187964)
$ (62982480)
$ (75074630)
$ (87432427)
$ (99307547)
$ (112688253)
$ (127291028)
Estimated Annual Impact
Base Revenue Reduction
$ (16134252)
Fuel Revenue Reduction
$ (23790144)
Fuel Cost Reduction
$ 23790144
Potential off-system sales margins
$ 2889000
Net program costs
$ (7166814)
AEs net cash impact
$ (20412066)
Customer savings
$ (39924396)
CURRENT FORECAST
PROPOSED PROJECTION
DSM Analysis
2007
2008
2007
2008
keyed in to round
Base Revenue Reduction
(12000000)
(16000000)
(12000000)
(16000000)
Fuel Revenue Reduction
(13000000)
(15000000)
(5000000)
(7000000)
Fuel Cost Reduction
13000000
15000000
5000000
7000000
KW
$KW
NET
5 profit
Potential off-system capacity sales
9000000
9000000
6207
$KW
145000
$ 62
$ 8990000
Net of fuel and GFT
$ 449500
Fuel Revenue Increase-Capacity
12000000
12000000
6154
$KW
195000
$ 62
$ 12090000
Fuel Cost Increase-Capacity
(12000000)
(12000000)
TCOS expense reduction
900000
1000000
900000
1000000
GFT reduction
2000000
3000000
2000000
3000000
Program cost
(23000000)
(23000000)
Recovery through base rates
15000000
15000000
AEs net income impact
(8100000)
(20000000)
(100000)
(12000000)
Deferred Cost of Capacity
12000000
12000000
AEs net cash impact
(8100000)
(8000000)
(100000)
- 0
Customer savings-(net)
$ (25000000)
$ (31000000)
$ (17000000)
$ (35000000)
Outline for Oct 10 Leadership Team Update
1 Components of BenefitCost Ratios
2 Cash Flow of DSM
CURRENT FORECAST
PROPOSED PROJECTION
DSM Analysis
2007
2008
2007
2008
Base Revenue Reduction
(11812895)
(16167619)
(11812895)
(16167619)
Fuel Revenue Reduction
(13238528)
(14683328)
(5217969)
(5396810)
Fuel Cost Reduction
13238528
14683328
5217969
5396810
Potential off-system sales margins
8707500
8707500
Fuel Revenue Increase-Capacity
12000000
12000000
Fuel Cost Increase-Capacity
(12000000)
(12000000)
TCOS expense reduction
925987
977987
925987
977987
GFT reduction
2279680
2807436
2279680
2807436
Program cost
(22819634)
(22819634)
Recovery through base rates
14799075
14977916
AEs net income impact
(7920288)
(20223914)
100271
(12382196)
Deferred Cost of Capacity
12000000
12000000
AEs net cash impact including deferral
(7920288)
(8223914)
100271
(382196)
Customer savings-(net)
$ (25051423)
$ (30850947)
$ (17030864)
$ (33564429)
Recommend recovery thru fuel factor
Offset customer fuel savings due to DSM
Would not offset revenue loss
(before amp after)
In 2007 we still have excess capacity
Cost recovery
3yrs - recommended purch power
power is only needed during peak-dont utilize a plant
need declines as renewables increases
cash flow
Dynamic pricing-TOU rates motivating cust to conserve energy
would replace some of the energy efficiency rebates
option to self-generate
TCOS expense reduction due to DSM savings
Historical
Historical
Historical
Historical
Historical
Preliminary
Forecast
Forecast
Forecast
Forecast
Forecast
Forecast
Forecast
Forecast
Forecast
Forecast
2000
2001
2002
2003
2004
2005
2006
2007
2008
2009
2010
2011
2012
2013
2014
2015
ERCOT Postage Stamp Rate
1476
1528
1661
1778
1925
2055
2185
2315
2445
2575
2705
2835
2965
3095
3225
3355
Estimated DSM-kW savings applied to average 4CP
40000
40000
40000
40000
40000
40000
40000
40000
40000
40000
40000
Reduction to TCOS expense
$ 821987
$ 873987
$ 925987
$ 977987
$ 1029987
$ 1081987
$ 1133987
$ 1185987
$ 1237987
$ 1289987
$ 1341987
Saving Energy TogetherPower SaverTM Program
DSM Reduction in Fuel Costs
$0020
$0021
$0022
$0023
$0024
$0025
$0026
$0027
$0028
$0029
$0030
2006 2007 2008 2009 2010 2011 2012 2013 2014 2015
Fuel Cost without DSM
Fuel Cost with DSM
Cash flow chart
Chart1
Fuel Cost Reduction
Capacity Expense Reduction
Total Decrease In Expenses
REDUCTION IN EXPENSES DUE TO DSM PROGRAMS
5166240
5166240
8956848
8956848
13238528
13238528
14683328
26360828
11677500
16859440
31439440
14580000
20212576
37762576
17550000
24919120
45304120
20385000
30094336
53246836
23152500
34616096
60468596
25852500
40546848
69166848
28620000
47845120
79232620
31387500
Chart4
Fuel Cost without DSM
Fuel Cost with DSM
00233611231
00238400717
00226232559
00233069306
00220985648
00237472342
00217888198
00236848698
00215229268
00237472426
00216083296
00242335075
00224259386
00254383594
00226073357
00259502528
00240455083
00277315347
00255904506
00296726494
Sheet1
Sheet3
Saving Energy TogetherPower SaverTM Program
DSM Analysis 2007 2008
Base Revenue Reduction (12000000) (16000000) Fuel Revenue Reduction (13000000) (15000000)
AEs Net Income Impact (8100000) (20000000) Deferred Cost of Capacity 12000000 AEs Net Cash Impact (8100000) (8000000)
CURRENT FORECAST
Cash Flow Projection of DSM
Cash flow chart
Chart1
Fuel Cost Reduction
Capacity Expense Reduction
Total Decrease In Expenses
REDUCTION IN EXPENSES DUE TO DSM PROGRAMS
5166240
5166240
8956848
8956848
13238528
13238528
14683328
26360828
11677500
16859440
31439440
14580000
20212576
37762576
17550000
24919120
45304120
20385000
30094336
53246836
23152500
34616096
60468596
25852500
40546848
69166848
28620000
47845120
79232620
31387500
Chart4
Fuel Cost without DSM
Fuel Cost with DSM
REDUCTION IN FUEL COST DUE TO DSM PROGRAMS
00233611231
00238400717
00226232559
00233069306
00220985648
00237472342
00217888198
00236848698
00215229268
00237472426
00216083296
00242335075
00224259386
00254383594
00226073357
00259502528
00240455083
00277315347
00255904506
00296726494
Sheet1
Sheet3
Saving Energy TogetherPower SaverTM Program
Questions
Saving Energy TogetherPower SaverTM Program
FY 2006 Achievements
Energy SavingsMW of
Programs Saved Goal Goal
Residential 126 115 110
Commercial 154 121 127
Demand Response 146 156 94
Solar 055 060 93
Grand Total 432 398 108
Saving Energy TogetherPower SaverTM Program
MW SavedPrograms FY2005 FY2006
Residential 119 126
Commercial 153 154
Demand Response 116 146
Solar 06 055
Grand Total 394 432
Energy Savings ComparisonFY2005 to FY2006
Saving Energy TogetherPower SaverTM Program
DSM Summary
bull DSM programs are saving peak kW amp kWh
bull Cost-effectiveness analyses include full program costs
bull DSM goals and budgets should vary to support AE resource plan requirements
Saving Energy TogetherPower SaverTM Program
Free Home WeatherizationEnergy Improvementsbull Insulate Atticsbull Duct Sealingbull Install CFLsbull Solar Screensbull Caulking and Weather-strippingbull Free Smoke amp Carbon Monoxide Detector bull Minor Energy Related Repairs
Saving Energy TogetherPower SaverTM Program
Power Saver Program
bull FREE Energy Saving Productsbull Lower energy costsbull 65000 installed in homes apartmentsbull 4000 installed in commercial buildings
Saving Energy TogetherPower SaverTM Program
Energy Conservation in COA FacilitiesSenate Bill 5 Energy Use vs Energy Cost
295
300
305
310
315
320
325
330
335
340
345
350
Base Year2001
2002 2003 2004 2005 2006
Gig
awat
t-hou
rs
220
230
240
250
260
270
280
290
300
Mill
ion
Dol
lars
Million kWh Cost
Chart1
Million kWh
Cost
Gigawatt-hours
Million Dollars
Senate Bill 5 Energy Use vs Energy Cost
343667472
28619895
33757683
2504536
3260767692
24602549
31773020962
26778741
324036807
2745756918
313494864
2936354518
Sheet1
Sheet1
ampA
Page ampP
Million kWh
Gigawatt-hours
Senate Bill 5 Reported Energy Use
Sheet2
ampA
Page ampP
Million kWh
Cost
Gigawatt-hours
Million Dollars
Senate Bill 5 Energy Use vs Energy Cost
Sheet3
Energy Efficiency Real Reliable and Cost-Effective Alternative
Fuel cost savings assume all saved energy at average gas generation cost
Increased off-system sales margins assumes reduced demand plus associated reserve requirements could be sold for $15kWmonth (after 2007 this is an avoided capacity expense)
Fuel Factor expense increase is increased fuel expense plus purchased capacity cost
GFT reduction is base revenue and fuel cost reductions times 91
Base revenue wDSM
552961968
562415810
569170954
576627290
585065115
594497922
604045383
613657938
623249716
632762255
644233714
Base revenue wo DSM
557087606
570008130
580983849
592794909
605393639
619267826
633200893
646996029
660941168
674903660
690679622
kWh sales wDSM
10776303000
10954134000
11076488000
11213088000
11369667000
11546488000
11724454000
11897588000
12077216000
12256861000
12476492000
kWh sales wo DSM
10861087000
11109639000
11319110000
11544588000
11787201000
12054717000
12323440000
12582205000
12851412000
13121980000
13429845000
1000
kW sales wDSM
2435000
2442000
2443000
2471000
2477000
2486000
2486000
2490000
2515000
2535000
2539000
kW sales wo DSM
2476000
2527000
2572000
2644000
2693000
2746000
2788000
2833000
2898000
2959000
3004000
Fuel Forecast
Budget 2006 (3905)
Tot-2006
Tot-2007
Tot-2008
Tot-2009
Tot-2010
Tot-2011
Tot-2012
Tot-2013
Tot-2014
Tot-2015
Total
MWH
STP
3303339
3488217
3514415
3360759
3465191
3507755
3405921
3614690
3482746
3515635
34658668
FPP
4564135
4517773
4465943
4451812
4418334
4545733
4554494
4586879
4445603
4245674
44796380
Decker
2839387
511212
504648
615748
583574
563845
570235
550098
594337
757598
8090682
Holly
235228
28425
- 0
- 0
- 0
- 0
- 0
- 0
- 0
263653
Sand Hill CC
1533962
1538343
1565132
1615597
1553452
1600111
1516183
1666799
1687122
14276700
SH GT
465155
427320
523864
450359
458722
498276
432337
492003
574949
4322986
Decker GT
157126
216800
280985
238803
246172
264900
238141
266139
294200
2203267
Existing DG
17340
7248
7296
7065
7216
7268
7168
7137
7147
16838
91723
Future DG
110
110
101
2216
2659
4743
5273
7365
7750
17746
48073
PurchasePower
131996
- 0
204000
208800
206400
206400
134400
201600
136000
139200
1568796
Landfill Methane
87493
92450
92704
92450
92450
92450
92704
92450
92450
92450
920052
Future Bioenergy
- 0
- 0
134151
178705
384764
454206
673445
744600
978509
1057336
4605716
Wind
636291
669050
671181
669050
669050
669050
671181
669050
669050
669050
6662004
Solar
684
20026
32685
41438
50311
59183
68298
76929
85801
87839
523193
Shortfall Energy
3308
2419
3355
6021
3311
4269
7050
3075
3868
4281
40957
11584082
11699976
11841366
12004048
12188020
12373249
12553456
12740532
12928204
13159918
123072851
(10512)
(1)
(1)
0
0
(0)
1
1
(0)
0
(10505)
Dollars
STP
14024307
16411783
18054617
17815007
18997196
19874461
19872833
21713134
21541492
22417754
190722584
FPP
47959978
48327184
52942730
56530034
57287196
60262126
61527986
62666810
62927556
61809806
572241406
Decker
161242451
30007075
26150797
28534975
26297430
25902979
27510734
27253106
30904024
41053837
424857407
Holly
15649395
1939153
- 0
- 0
- 0
- 0
- 0
- 0
- 0
17588548
Sand Hill CC
71819840
62147912
53829988
54696364
53773560
56880544
56723452
64324432
66378796
540574888
SH GT
28915407
23018682
25201605
20614580
21546020
24873781
22042049
25993318
31798432
224003872
Decker GT
12129491
14068039
16315347
13248144
14062711
15831205
14654486
17002591
19718490
137030504
Existing DG
1066126
482134
392821
350785
361063
372817
379318
391499
407877
1055934
5260373
Future DG
5688
5352
3321
115774
140956
247241
281454
413559
455875
1154808
2824028
PurchasePower
5000000
- 0
17339160
16429042
16415314
16614357
11144008
17017280
11632503
11967200
123558864
Landfill Methane
3535734
3653844
3663855
3653844
3653844
3653844
3663855
3653844
3653844
3653844
36440353
Future Bioenergy
- 0
- 0
6036769
8041681
17314398
20439270
30305016
33507000
44032792
47579944
207256869
Wind
17374835
18256537
18314921
18256537
18256537
18256537
18314921
18256537
18256537
18256537
181800436
Solar
- 0
- 0
- 0
- 0
- 0
- 0
- 0
- 0
- 0
- 0
- 0
Shortfall Energy
248086
181420
251636
451599
248349
320172
528742
230590
290120
321058
3071771
250457205
245839462
244324412
245526217
247531370
255326093
271114397
278523346
301422961
327166440
2667231902
1792964
10
(12)
6
(1)
10
(27)
4
3
(6)
1793341
Gas MWh
2839387
2902683
2715536
2985730
2888333
2822192
2933522
2736759
3019278
3313869
29157288
Gas cost ($)
161242451
158521208
127324584
123881915
114856517
115285269
125096264
120673092
138224364
158949555
1344055218
Avg gas gen Cost ($MWh)
5679
5461
4689
4149
3977
4085
4264
4409
4578
4796
4610
NO DSM FUEL FACTOR
2006
2007
2008
2009
2010
2011
2012
2013
2014
2015
Thermal Unit Fuel Cost
232662512
236980848
213398064
215549344
211851680
220956944
237247920
240469984
264099856
293228672
Shortfall Purchases
248086
181420
251636
451599
248349
320172
528742
230590
290120
321058
Short-Term Power Purchases
5000000
- 0
29016660
31009042
33965314
36999357
34296508
42869780
40252503
43354700
Fuel Cell Gas Cost
119837
119837
119837
119837
119837
119837
119837
119837
119837
119837
Recoverable ERCOT Expenses
16825273
16825273
16825273
16825273
16825273
16825273
16825273
16825273
16825273
16825273
Fuel Factor Renewables
9998882
9706333
14540565
15223226
23255836
23418594
31052373
32981926
42305054
44649542
Total Fuel Factor Revenue
264854590
263813711
274152035
279178321
286266289
298640176
320070653
333497390
363892643
398499082
Total Renewables
20910569
21910381
28015544
29952062
39224779
42349651
52283792
55417381
65943173
69490325
TotThermal+PurchPwr+Renewables
249864319
245834121
244321076
245522607
247527546
255322004
271110126
278519139
301418805
327162135
Estimated Green Choice Sales
10911686
12204048
13474979
14728836
15968943
18931058
21231418
22435455
23638119
24840783
Fuel Factor Renewables
9998882
9706333
14540565
15223226
23255836
23418594
31052373
32981926
42305054
44649542
Forecast Annual GWh Sales
11110
11319
11545
11787
12055
12323
12582
12851
13122
13430
Average cost per kWh
$ 0023840
$ 0023307
$ 0023747
$ 0023685
$ 0023747
$ 0024234
$ 0025438
$ 0025950
$ 0027732
$ 0029673
Fuel Factors
Secondary
$ 0023475
$ 0022733
$ 0022206
$ 0021895
$ 0021627
$ 0021713
$ 0022535
$ 0022717
$ 0024162
$ 0025715
Primary
$ 0022776
$ 0022056
$ 0021545
$ 0021243
$ 0020984
$ 0021067
$ 0021864
$ 0022041
$ 0023443
$ 0024949
Transmission
$ 0022539
$ 0021828
$ 0021321
$ 0021022
$ 0020766
$ 0020848
$ 0021637
$ 0021812
$ 0023200
$ 0024690
2006
2007
2008
2009
2010
2011
2012
2013
2014
2015
Dag generation
11574
11700
11841
12004
12188
12373
12553
12741
12928
13160
Joe generation
11584
11700
11841
12004
12188
12373
12553
12741
12928
13160
difference
(10)
0
(0)
(0)
(0)
(0)
(0)
0
(0)
0
sales
10954
11076
11213
11370
11546
11724
11898
12077
12257
12476
losses
57
56
56
56
56
55
55
55
55
55
With DSM
Thermal Unit Fuel Cost wDSM
223705664
223742320
198714736
198689904
191639104
196037824
207153584
205853888
223553008
245383552
Short-Term Power Purchases
5000000
- 0
17339160
16429042
16415314
16614357
11144008
17017280
11632503
11967200
Average cost per kWh
$ 0023361
$ 0022623
$ 0022099
$ 0021789
$ 0021523
$ 0021608
$ 0022426
$ 0022607
$ 0024046
$ 0025590
Forecast Annual GWh Sales
10954
11076
11213
11370
11546
11724
11898
12077
12257
12476
255897742
250575183
247791207
247738881
248503713
253336056
266823817
273028794
294725795
319266462
CASH FLOW PURCHASE OPTION
2005
2006
2007
2008
2009
2010
2011
2012
2013
2014
2015
Base revenue reduction
4125638
7592320
11812895
16167619
20328524
24769904
29155510
33338091
37691451
42141405
46445908
Fuel cost reduction
5166240
8956848
13238528
14683328
16859440
20212576
24919120
30094336
34616096
40546848
47845120
Potential off-system sales margins
2767500
5737500
8707500
Capacity cost reduction
12000000
15000000
18000000
21000000
24000000
27000000
30000000
33000000
GFT reduction
845561
660413
773705
527757
576669
709301
827386
851560
807636
944644
1055853
845560920627699
Program cost
20689324
22819634
22819634
22819634
22819634
22819634
22819634
22819634
22819634
22819634
22819634
Recovery through base rates
14405492
14639186
14799075
14977916
15183688
15416391
15650684
15878624
16115254
16352636
16645725
Cash flow
-6796409
-9374854
-10352249
-23481580
-27387801
-31463846
-35497075
-39427542
-43588195
-47663759
-51563965
2005
2006
2007
2008
2009
2010
2011
2012
2013
2014
2015
Base Revenue Reduction
$ (4125638)
$ (7592320)
$ (11812895)
$ (16167619)
$ (20328524)
$ (24769904)
$ (29155510)
$ (33338091)
$ (37691451)
$ (42141405)
$ (46445908)
Fuel Revenue Reduction
$ (5166240)
$ (8956848)
$ (13238528)
$ (26683328)
$ (31859440)
$ (38212576)
$ (45919120)
$ (54094336)
$ (61616096)
$ (70546848)
$ (80845120)
Fuel Cost Reduction
$ 5166240
$ 8956848
$ 13238528
$ 26683328
$ 31859440
$ 38212576
$ 45919120
$ 54094336
$ 61616096
$ 70546848
$ 80845120
Potential off-system sales margins
$ 2767500
$ 5737500
$ 8707500
$ - 0
$ - 0
$ - 0
$ - 0
$ - 0
$ - 0
$ - 0
$ - 0
Net program costs
$ (5438271)
$ (7520034)
$ (7246854)
$ (7313961)
$ (7059277)
$ (6693942)
$ (6341565)
$ (6089451)
$ (5896744)
$ (5522354)
$ (5118057)
AEs net cash impact
$ (6796409)
$ (9374854)
$ (10352249)
$ (23481580)
$ (27387801)
$ (31463846)
$ (35497075)
$ (39427542)
$ (43588195)
$ (47663759)
$ (51563965)
Customer savings
$ 9291878
$ 16549168
$ 25051423
$ 42850947
$ 52187964
$ 62982480
$ 75074630
$ 87432427
$ 99307547
$ 112688253
$ 127291028
CASH FLOW BUILD OPTION
2005
2006
2007
2008
2009
2010
2011
2012
2013
2014
2015
Base revenue reduction
4125638
7592320
11812895
16167619
20328524
24769904
29155510
33338091
37691451
42141405
46445908
Fuel cost reduction
5166240
8956848
13238528
14683328
16859440
20212576
24919120
30094336
34616096
40546848
47845120
Potential off-system sales margins
2767500
5737500
8707500
Capacity cost reduction
7736295
11604442
11604442
15472589
15472589
19340737
19340737
23208884
GFT reduction
845561
660413
773705
527757
576669
709301
827386
851560
807636
944644
1055853
Program cost
20689324
22819634
22819634
22819634
22819634
22819634
22819634
22819634
22819634
22819634
22819634
Recovery through base rates
14405492
14639186
14799075
14977916
15183688
15416391
15650684
15878624
16115254
16352636
16645725
Cash flow
-6796409
-9374854
-10352249
-15745285
-15783359
-19859404
-20024486
-23954952
-24247459
-28323022
-28355080
-21195738994
Capacity cost Build option
Reduced capacity requirement (kW)
46125
95625
145125
194625
243000
292500
339750
385875
430875
477000
523125
Capacity added
200
300
300
400
400
500
500
600
Annual capacity cost
$386814737
$7736295
$11604442
$11604442
$15472589
$15472589
$19340737
$19340737
$23208884
Capacity cost Buy option
Reduced capacity requirement (kW)
46125
95625
145125
194625
243000
292500
339750
385875
430875
477000
523125
Capacity added
200
250
300
350
400
450
500
550
Annual capacity cost
$600000000
$12000000
$15000000
$18000000
$21000000
$24000000
$27000000
$30000000
$33000000
1994
2004
2005
2006
2007
2008
2009
2010
2011
2012
2013
2014
2015
Net MWh to system
7659242
10855000
11388814
11573570
11699976
11841366
12004047
12188019
12373248
12553455
12740532
12928203
13159916
Revenue multiplier
100
142
149
151
153
155
157
159
162
164
166
169
172
Revenue allocated to DSM
9688028
13730281
14405492
14639186
14799075
14977916
15183688
15416391
15650684
15878624
16115254
16352636
16645725
CentskWh in rates for DSM
0134
0134
0134
0134
0134
0134
0134
0133
0133
0133
0133
0133
Annual sales (MWh)
10262000
10776303
10954134
11076488
11213088
11369667
11546488
11724454
11897588
12077216
12256861
12476492
2006
2006
2007
2007
2008
2008
2009
2009
2010
2010
2011
2011
2012
2012
2013
2013
2014
2014
2015
2015
2005
2005
2005
2006
2006
2006
2007
2007
2007
2008
2008
2008
2009
2009
2009
2010
2010
2010
2011
2011
2011
2012
2012
2012
2013
2013
2013
2014
2014
2014
2015
2015
2015
2005
2006
2007
2008
2009
2010
2011
2012
2013
2014
2015
Base Revenue Reduction
$ (4125638)
$ (7592320)
$ (11812895)
$ (16167619)
$ (20328524)
$ (24769904)
$ (29155510)
$ (33338091)
$ (37691451)
$ (42141405)
$ (46445908)
Fuel Revenue Reduction
$ (5166240)
$ (8956848)
$ (13238528)
$ (26683328)
$ (31859440)
$ (38212576)
$ (45919120)
$ (54094336)
$ (61616096)
$ (70546848)
$ (80845120)
Fuel Cost Reduction
$ 5166240
$ 8956848
$ 13238528
$ 26683328
$ 31859440
$ 38212576
$ 45919120
$ 54094336
$ 61616096
$ 70546848
$ 80845120
Potential off-system sales margins
$ 2767500
$ 5737500
$ 8707500
$ - 0
$ - 0
$ - 0
$ - 0
$ - 0
$ - 0
$ - 0
$ - 0
Net program costs
$ (5438271)
$ (7520034)
$ (7246854)
$ (7313961)
$ (7059277)
$ (6693942)
$ (6341565)
$ (6089451)
$ (5896744)
$ (5522354)
$ (5118057)
AEs net cash impact
$ (6796409)
$ (9374854)
$ (10352249)
$ (23481580)
$ (27387801)
$ (31463846)
$ (35497075)
$ (39427542)
$ (43588195)
$ (47663759)
$ (51563965)
Customer savings
$ (9291878)
$ (16549168)
$ (25051423)
$ (42850947)
$ (52187964)
$ (62982480)
$ (75074630)
$ (87432427)
$ (99307547)
$ (112688253)
$ (127291028)
Estimated Annual Impact
Base Revenue Reduction
$ (16134252)
Fuel Revenue Reduction
$ (23790144)
Fuel Cost Reduction
$ 23790144
Potential off-system sales margins
$ 2889000
Net program costs
$ (7166814)
AEs net cash impact
$ (20412066)
Customer savings
$ (39924396)
CURRENT FORECAST
PROPOSED PROJECTION
DSM Analysis
2007
2008
2007
2008
keyed in to round
Base Revenue Reduction
(12000000)
(16000000)
(12000000)
(16000000)
Fuel Revenue Reduction
(13000000)
(15000000)
(5000000)
(7000000)
Customer Savings (Bill Reduction)
(25000000)
(31000000)
(17000000)
(23000000)
Fuel Cost Reduction
13000000
15000000
5000000
7000000
KW
$KW
NET
5 profit
Potential Off-system Capacity Sales
9000000
9000000
6207
$KW
145000
$ 62
$ 8990000
Net of fuel and GFT
$ 449500
TCOS Expense Reduction
900000
1000000
900000
1000000
GFT Reduction
2000000
3000000
2000000
3000000
Program Cost
(23000000)
(23000000)
Recovery through Base Rates
15000000
15000000
AEs Net Income Impact
(8100000)
(20000000)
(17100000)
(35000000)
Deferred Cost of Capacity
12000000
- 0
AEs Net Cash Impact
(8100000)
(8000000)
(17100000)
- 0
Outline for Oct 10 Leadership Team Update
1 Components of BenefitCost Ratios
2 Cash Flow of DSM
CURRENT FORECAST
PROPOSED PROJECTION
DSM Analysis
2007
2008
2007
2008
Base Revenue Reduction
(11812895)
(16167619)
(11812895)
(16167619)
Fuel Revenue Reduction
(13238528)
(14683328)
(5217969)
(5396810)
Fuel Cost Reduction
13238528
14683328
5217969
5396810
Potential off-system sales margins
8707500
8707500
Fuel Revenue Increase-Capacity
12000000
12000000
Fuel Cost Increase-Capacity
(12000000)
(12000000)
TCOS expense reduction
925987
977987
925987
977987
GFT reduction
2279680
2807436
2279680
2807436
Program cost
(22819634)
(22819634)
Recovery through base rates
14799075
14977916
AEs net income impact
(7920288)
(20223914)
100271
(12382196)
Deferred Cost of Capacity
12000000
12000000
AEs net cash impact including deferral
(7920288)
(8223914)
100271
(382196)
Customer savings-(net)
$ (25051423)
$ (30850947)
$ (17030864)
$ (21564429)
Recommend recovery thru fuel factor
Offset customer fuel savings due to DSM
Would not offset revenue loss
(before amp after)
In 2007 we still have excess capacity
Cost recovery
3yrs - recommended purch power
power is only needed during peak-dont utilize a plant
need declines as renewables increases
cash flow
Dynamic pricing-TOU rates motivating cust to conserve energy
would replace some of the energy efficiency rebates
option to self-generate
TCOS expense reduction due to DSM savings
Historical
Historical
Historical
Historical
Historical
Preliminary
Forecast
Forecast
Forecast
Forecast
Forecast
Forecast
Forecast
Forecast
Forecast
Forecast
2000
2001
2002
2003
2004
2005
2006
2007
2008
2009
2010
2011
2012
2013
2014
2015
ERCOT Postage Stamp Rate
1476
1528
1661
1778
1925
2055
2185
2315
2445
2575
2705
2835
2965
3095
3225
3355
Estimated DSM-kW savings applied to average 4CP
40000
40000
40000
40000
40000
40000
40000
40000
40000
40000
40000
Reduction to TCOS expense
$ 821987
$ 873987
$ 925987
$ 977987
$ 1029987
$ 1081987
$ 1133987
$ 1185987
$ 1237987
$ 1289987
$ 1341987
2005
2006
2007
2008
2009
2010
2011
2012
2013
2014
2015
Base revenue reduction
4125638
7592320
11812895
16167619
20328524
24769904
29155510
33338091
37691451
42141405
46445908
kWh reduction
84784000
155505000
242622000
331500000
417534000
508229000
598986000
684617000
774196000
865119000
953353000
Fuel cost reduction
5166240
8956848
13238528
14683328
16859440
20212576
24919120
30094336
34616096
40546848
47845120
Demand reduction (kW)
41000
85000
129000
173000
216000
260000
302000
343000
383000
424000
465000
Reduced reserve requirement (kW)
5125
10625
16125
21625
27000
32500
37750
42875
47875
53000
58125
2008
2009
2010
2011
2012
2013
2014
2015
Reduced capacity requirement (kW)
46125
95625
145125
194625
243000
292500
339750
385875
430875
477000
523125
194625
243000
292500
339750
385875
430875
477000
523125
Increased off-system sales margins
2767500
5737500
8707500
Capacity cost reduction
11677500
14580000
17550000
20385000
23152500
25852500
28620000
31387500
Fuel Factor expense decrease ($)
5166240
8956848
13238528
26360828
31439440
37762576
45304120
53246836
60468596
69166848
79232620
Fuel Factor decrease (centskWh)
00005
00007
00016
00019
00022
00026
00030
00033
00037
00041
Fuel Factor decrease
2
3
7
9
10
12
13
15
15
16
GFT reduction
845561
1505974
2279680
2807436
3384105
4093406
4920791
5772351
6579987
7524631
8580484
Program cost
20689324
22819634
22819634
22819634
22819634
22819634
22819634
22819634
22819634
22819634
22819634
Recovery through base rates
14405492
14639186
14799075
14977916
15183688
15416391
15650684
15878624
16115254
16352636
16645725
Cash flow
-7641970
-10035268
-11125954
-12331837
-13384470
-14623147
-15939461
-17126601
-18543331
-19988403
-21232317
Fuel cost savings assume all saved energy at average gas generation cost
Increased off-system sales margins assumes reduced demand plus associated reserve requirements could be sold for $15kWmonth (after 2007 this is an avoided capacity expense)
Fuel Factor expense increase is increased fuel expense plus purchased capacity cost
GFT reduction is base revenue and fuel cost reductions times 91
Base revenue wDSM
552961968
562415810
569170954
576627290
585065115
594497922
604045383
613657938
623249716
632762255
644233714
Base revenue wo DSM
557087606
570008130
580983849
592794909
605393639
619267826
633200893
646996029
660941168
674903660
690679622
kWh sales wDSM
10776303000
10954134000
11076488000
11213088000
11369667000
11546488000
11724454000
11897588000
12077216000
12256861000
12476492000
kWh sales wo DSM
10861087000
11109639000
11319110000
11544588000
11787201000
12054717000
12323440000
12582205000
12851412000
13121980000
13429845000
1000
kW sales wDSM
2435000
2442000
2443000
2471000
2477000
2486000
2486000
2490000
2515000
2535000
2539000
kW sales wo DSM
2476000
2527000
2572000
2644000
2693000
2746000
2788000
2833000
2898000
2959000
3004000
Fuel Forecast
Budget 2006 (3905)
Tot-2006
Tot-2007
Tot-2008
Tot-2009
Tot-2010
Tot-2011
Tot-2012
Tot-2013
Tot-2014
Tot-2015
Total
MWH
STP
3303339
3488217
3514415
3360759
3465191
3507755
3405921
3614690
3482746
3515635
34658668
FPP
4564135
4517773
4465943
4451812
4418334
4545733
4554494
4586879
4445603
4245674
44796380
Decker
2839387
511212
504648
615748
583574
563845
570235
550098
594337
757598
8090682
Holly
235228
28425
- 0
- 0
- 0
- 0
- 0
- 0
- 0
263653
Sand Hill CC
1533962
1538343
1565132
1615597
1553452
1600111
1516183
1666799
1687122
14276700
SH GT
465155
427320
523864
450359
458722
498276
432337
492003
574949
4322986
Decker GT
157126
216800
280985
238803
246172
264900
238141
266139
294200
2203267
Existing DG
17340
7248
7296
7065
7216
7268
7168
7137
7147
16838
91723
Future DG
110
110
101
2216
2659
4743
5273
7365
7750
17746
48073
PurchasePower
131996
- 0
204000
208800
206400
206400
134400
201600
136000
139200
1568796
Landfill Methane
87493
92450
92704
92450
92450
92450
92704
92450
92450
92450
920052
Future Bioenergy
- 0
- 0
134151
178705
384764
454206
673445
744600
978509
1057336
4605716
Wind
636291
669050
671181
669050
669050
669050
671181
669050
669050
669050
6662004
Solar
684
20026
32685
41438
50311
59183
68298
76929
85801
87839
523193
Shortfall Energy
3308
2419
3355
6021
3311
4269
7050
3075
3868
4281
40957
11584082
11699976
11841366
12004048
12188020
12373249
12553456
12740532
12928204
13159918
123072851
(10512)
(1)
(1)
0
0
(0)
1
1
(0)
0
(10505)
Dollars
STP
14024307
16411783
18054617
17815007
18997196
19874461
19872833
21713134
21541492
22417754
190722584
FPP
47959978
48327184
52942730
56530034
57287196
60262126
61527986
62666810
62927556
61809806
572241406
Decker
161242451
30007075
26150797
28534975
26297430
25902979
27510734
27253106
30904024
41053837
424857407
Holly
15649395
1939153
- 0
- 0
- 0
- 0
- 0
- 0
- 0
17588548
Sand Hill CC
71819840
62147912
53829988
54696364
53773560
56880544
56723452
64324432
66378796
540574888
SH GT
28915407
23018682
25201605
20614580
21546020
24873781
22042049
25993318
31798432
224003872
Decker GT
12129491
14068039
16315347
13248144
14062711
15831205
14654486
17002591
19718490
137030504
Existing DG
1066126
482134
392821
350785
361063
372817
379318
391499
407877
1055934
5260373
Future DG
5688
5352
3321
115774
140956
247241
281454
413559
455875
1154808
2824028
PurchasePower
5000000
- 0
17339160
16429042
16415314
16614357
11144008
17017280
11632503
11967200
123558864
Landfill Methane
3535734
3653844
3663855
3653844
3653844
3653844
3663855
3653844
3653844
3653844
36440353
Future Bioenergy
- 0
- 0
6036769
8041681
17314398
20439270
30305016
33507000
44032792
47579944
207256869
Wind
17374835
18256537
18314921
18256537
18256537
18256537
18314921
18256537
18256537
18256537
181800436
Solar
- 0
- 0
- 0
- 0
- 0
- 0
- 0
- 0
- 0
- 0
- 0
Shortfall Energy
248086
181420
251636
451599
248349
320172
528742
230590
290120
321058
3071771
250457205
245839462
244324412
245526217
247531370
255326093
271114397
278523346
301422961
327166440
2667231902
1792964
10
(12)
6
(1)
10
(27)
4
3
(6)
1793341
Gas MWh
2839387
2902683
2715536
2985730
2888333
2822192
2933522
2736759
3019278
3313869
29157288
Gas cost ($)
161242451
158521208
127324584
123881915
114856517
115285269
125096264
120673092
138224364
158949555
1344055218
Avg gas gen Cost ($MWh)
5679
5461
4689
4149
3977
4085
4264
4409
4578
4796
4610
NO DSM FUEL FACTOR
2006
2007
2008
2009
2010
2011
2012
2013
2014
2015
Thermal Unit Fuel Cost
232662512
236980848
213398064
215549344
211851680
220956944
237247920
240469984
264099856
293228672
Shortfall Purchases
248086
181420
251636
451599
248349
320172
528742
230590
290120
321058
Short-Term Power Purchases
5000000
- 0
29016660
31009042
33965314
36999357
34296508
42869780
40252503
43354700
Fuel Cell Gas Cost
119837
119837
119837
119837
119837
119837
119837
119837
119837
119837
Recoverable ERCOT Expenses
16825273
16825273
16825273
16825273
16825273
16825273
16825273
16825273
16825273
16825273
Fuel Factor Renewables
9998882
9706333
14540565
15223226
23255836
23418594
31052373
32981926
42305054
44649542
Total Fuel Factor Revenue
264854590
263813711
274152035
279178321
286266289
298640176
320070653
333497390
363892643
398499082
Total Renewables
20910569
21910381
28015544
29952062
39224779
42349651
52283792
55417381
65943173
69490325
TotThermal+PurchPwr+Renewables
249864319
245834121
244321076
245522607
247527546
255322004
271110126
278519139
301418805
327162135
Estimated Green Choice Sales
10911686
12204048
13474979
14728836
15968943
18931058
21231418
22435455
23638119
24840783
Fuel Factor Renewables
9998882
9706333
14540565
15223226
23255836
23418594
31052373
32981926
42305054
44649542
Forecast Annual GWh Sales
11110
11319
11545
11787
12055
12323
12582
12851
13122
13430
Average cost per kWh
$ 0023840
$ 0023307
$ 0023747
$ 0023685
$ 0023747
$ 0024234
$ 0025438
$ 0025950
$ 0027732
$ 0029673
Fuel Factors
Secondary
$ 0023475
$ 0022733
$ 0022206
$ 0021895
$ 0021627
$ 0021713
$ 0022535
$ 0022717
$ 0024162
$ 0025715
Primary
$ 0022776
$ 0022056
$ 0021545
$ 0021243
$ 0020984
$ 0021067
$ 0021864
$ 0022041
$ 0023443
$ 0024949
Transmission
$ 0022539
$ 0021828
$ 0021321
$ 0021022
$ 0020766
$ 0020848
$ 0021637
$ 0021812
$ 0023200
$ 0024690
2006
2007
2008
2009
2010
2011
2012
2013
2014
2015
Dag generation
11574
11700
11841
12004
12188
12373
12553
12741
12928
13160
Joe generation
11584
11700
11841
12004
12188
12373
12553
12741
12928
13160
difference
(10)
0
(0)
(0)
(0)
(0)
(0)
0
(0)
0
sales
10954
11076
11213
11370
11546
11724
11898
12077
12257
12476
losses
57
56
56
56
56
55
55
55
55
55
With DSM
Thermal Unit Fuel Cost wDSM
223705664
223742320
198714736
198689904
191639104
196037824
207153584
205853888
223553008
245383552
Short-Term Power Purchases
5000000
- 0
17339160
16429042
16415314
16614357
11144008
17017280
11632503
11967200
Average cost per kWh
$ 0023361
$ 0022623
$ 0022099
$ 0021789
$ 0021523
$ 0021608
$ 0022426
$ 0022607
$ 0024046
$ 0025590
Forecast Annual GWh Sales
10954
11076
11213
11370
11546
11724
11898
12077
12257
12476
255897742
250575183
247791207
247738881
248503713
253336056
266823817
273028794
294725795
319266462
CASH FLOW PURCHASE OPTION
2005
2006
2007
2008
2009
2010
2011
2012
2013
2014
2015
Base revenue reduction
4125638
7592320
11812895
16167619
20328524
24769904
29155510
33338091
37691451
42141405
46445908
Fuel cost reduction
5166240
8956848
13238528
14683328
16859440
20212576
24919120
30094336
34616096
40546848
47845120
Potential off-system sales margins
2767500
5737500
8707500
Capacity cost reduction
12000000
15000000
18000000
21000000
24000000
27000000
30000000
33000000
GFT reduction
845561
660413
773705
527757
576669
709301
827386
851560
807636
944644
1055853
845560920627699
Program cost
20689324
22819634
22819634
22819634
22819634
22819634
22819634
22819634
22819634
22819634
22819634
Recovery through base rates
14405492
14639186
14799075
14977916
15183688
15416391
15650684
15878624
16115254
16352636
16645725
Cash flow
-6796409
-9374854
-10352249
-23481580
-27387801
-31463846
-35497075
-39427542
-43588195
-47663759
-51563965
2005
2006
2007
2008
2009
2010
2011
2012
2013
2014
2015
Base Revenue Reduction
$ (4125638)
$ (7592320)
$ (11812895)
$ (16167619)
$ (20328524)
$ (24769904)
$ (29155510)
$ (33338091)
$ (37691451)
$ (42141405)
$ (46445908)
Fuel Revenue Reduction
$ (5166240)
$ (8956848)
$ (13238528)
$ (26683328)
$ (31859440)
$ (38212576)
$ (45919120)
$ (54094336)
$ (61616096)
$ (70546848)
$ (80845120)
Fuel Cost Reduction
$ 5166240
$ 8956848
$ 13238528
$ 26683328
$ 31859440
$ 38212576
$ 45919120
$ 54094336
$ 61616096
$ 70546848
$ 80845120
Potential off-system sales margins
$ 2767500
$ 5737500
$ 8707500
$ - 0
$ - 0
$ - 0
$ - 0
$ - 0
$ - 0
$ - 0
$ - 0
Net program costs
$ (5438271)
$ (7520034)
$ (7246854)
$ (7313961)
$ (7059277)
$ (6693942)
$ (6341565)
$ (6089451)
$ (5896744)
$ (5522354)
$ (5118057)
AEs net cash impact
$ (6796409)
$ (9374854)
$ (10352249)
$ (23481580)
$ (27387801)
$ (31463846)
$ (35497075)
$ (39427542)
$ (43588195)
$ (47663759)
$ (51563965)
Customer savings
$ 9291878
$ 16549168
$ 25051423
$ 42850947
$ 52187964
$ 62982480
$ 75074630
$ 87432427
$ 99307547
$ 112688253
$ 127291028
CASH FLOW BUILD OPTION
2005
2006
2007
2008
2009
2010
2011
2012
2013
2014
2015
Base revenue reduction
4125638
7592320
11812895
16167619
20328524
24769904
29155510
33338091
37691451
42141405
46445908
Fuel cost reduction
5166240
8956848
13238528
14683328
16859440
20212576
24919120
30094336
34616096
40546848
47845120
Potential off-system sales margins
2767500
5737500
8707500
Capacity cost reduction
7736295
11604442
11604442
15472589
15472589
19340737
19340737
23208884
GFT reduction
845561
660413
773705
527757
576669
709301
827386
851560
807636
944644
1055853
Program cost
20689324
22819634
22819634
22819634
22819634
22819634
22819634
22819634
22819634
22819634
22819634
Recovery through base rates
14405492
14639186
14799075
14977916
15183688
15416391
15650684
15878624
16115254
16352636
16645725
Cash flow
-6796409
-9374854
-10352249
-15745285
-15783359
-19859404
-20024486
-23954952
-24247459
-28323022
-28355080
-21195738994
Capacity cost Build option
Reduced capacity requirement (kW)
46125
95625
145125
194625
243000
292500
339750
385875
430875
477000
523125
Capacity added
200
300
300
400
400
500
500
600
Annual capacity cost
$386814737
$7736295
$11604442
$11604442
$15472589
$15472589
$19340737
$19340737
$23208884
Capacity cost Buy option
Reduced capacity requirement (kW)
46125
95625
145125
194625
243000
292500
339750
385875
430875
477000
523125
Capacity added
200
250
300
350
400
450
500
550
Annual capacity cost
$600000000
$12000000
$15000000
$18000000
$21000000
$24000000
$27000000
$30000000
$33000000
1994
2004
2005
2006
2007
2008
2009
2010
2011
2012
2013
2014
2015
Net MWh to system
7659242
10855000
11388814
11573570
11699976
11841366
12004047
12188019
12373248
12553455
12740532
12928203
13159916
Revenue multiplier
100
142
149
151
153
155
157
159
162
164
166
169
172
Revenue allocated to DSM
9688028
13730281
14405492
14639186
14799075
14977916
15183688
15416391
15650684
15878624
16115254
16352636
16645725
CentskWh in rates for DSM
0134
0134
0134
0134
0134
0134
0134
0133
0133
0133
0133
0133
Annual sales (MWh)
10262000
10776303
10954134
11076488
11213088
11369667
11546488
11724454
11897588
12077216
12256861
12476492
2006
2006
2007
2007
2008
2008
2009
2009
2010
2010
2011
2011
2012
2012
2013
2013
2014
2014
2015
2015
2005
2005
2005
2006
2006
2006
2007
2007
2007
2008
2008
2008
2009
2009
2009
2010
2010
2010
2011
2011
2011
2012
2012
2012
2013
2013
2013
2014
2014
2014
2015
2015
2015
2005
2006
2007
2008
2009
2010
2011
2012
2013
2014
2015
Base Revenue Reduction
$ (4125638)
$ (7592320)
$ (11812895)
$ (16167619)
$ (20328524)
$ (24769904)
$ (29155510)
$ (33338091)
$ (37691451)
$ (42141405)
$ (46445908)
Fuel Revenue Reduction
$ (5166240)
$ (8956848)
$ (13238528)
$ (26683328)
$ (31859440)
$ (38212576)
$ (45919120)
$ (54094336)
$ (61616096)
$ (70546848)
$ (80845120)
Fuel Cost Reduction
$ 5166240
$ 8956848
$ 13238528
$ 26683328
$ 31859440
$ 38212576
$ 45919120
$ 54094336
$ 61616096
$ 70546848
$ 80845120
Potential off-system sales margins
$ 2767500
$ 5737500
$ 8707500
$ - 0
$ - 0
$ - 0
$ - 0
$ - 0
$ - 0
$ - 0
$ - 0
Net program costs
$ (5438271)
$ (7520034)
$ (7246854)
$ (7313961)
$ (7059277)
$ (6693942)
$ (6341565)
$ (6089451)
$ (5896744)
$ (5522354)
$ (5118057)
AEs net cash impact
$ (6796409)
$ (9374854)
$ (10352249)
$ (23481580)
$ (27387801)
$ (31463846)
$ (35497075)
$ (39427542)
$ (43588195)
$ (47663759)
$ (51563965)
Customer savings
$ (9291878)
$ (16549168)
$ (25051423)
$ (42850947)
$ (52187964)
$ (62982480)
$ (75074630)
$ (87432427)
$ (99307547)
$ (112688253)
$ (127291028)
Estimated Annual Impact
Base Revenue Reduction
$ (16134252)
Fuel Revenue Reduction
$ (23790144)
Fuel Cost Reduction
$ 23790144
Potential off-system sales margins
$ 2889000
Net program costs
$ (7166814)
AEs net cash impact
$ (20412066)
Customer savings
$ (39924396)
CURRENT FORECAST
PROPOSED PROJECTION
DSM Analysis
2007
2008
2007
2008
keyed in to round
Base Revenue Reduction
(12000000)
(16000000)
(12000000)
(16000000)
Fuel Revenue Reduction
(13000000)
(15000000)
(5000000)
(7000000)
Fuel Cost Reduction
13000000
15000000
5000000
7000000
KW
$KW
NET
5 profit
Potential off-system capacity sales
9000000
9000000
6207
$KW
145000
$ 62
$ 8990000
Net of fuel and GFT
$ 449500
Fuel Revenue Increase-Capacity
12000000
12000000
6154
$KW
195000
$ 62
$ 12090000
Fuel Cost Increase-Capacity
(12000000)
(12000000)
TCOS expense reduction
900000
1000000
900000
1000000
GFT reduction
2000000
3000000
2000000
3000000
Program cost
(23000000)
(23000000)
Recovery through base rates
15000000
15000000
AEs net income impact
(8100000)
(20000000)
(100000)
(12000000)
Deferred Cost of Capacity
12000000
12000000
AEs net cash impact
(8100000)
(8000000)
(100000)
- 0
Customer savings-(net)
$ (25000000)
$ (31000000)
$ (17000000)
$ (35000000)
Outline for Oct 10 Leadership Team Update
1 Components of BenefitCost Ratios
2 Cash Flow of DSM
CURRENT FORECAST
PROPOSED PROJECTION
DSM Analysis
2007
2008
2007
2008
Base Revenue Reduction
(11812895)
(16167619)
(11812895)
(16167619)
Fuel Revenue Reduction
(13238528)
(14683328)
(5217969)
(5396810)
Fuel Cost Reduction
13238528
14683328
5217969
5396810
Potential off-system sales margins
8707500
8707500
Fuel Revenue Increase-Capacity
12000000
12000000
Fuel Cost Increase-Capacity
(12000000)
(12000000)
TCOS expense reduction
925987
977987
925987
977987
GFT reduction
2279680
2807436
2279680
2807436
Program cost
(22819634)
(22819634)
Recovery through base rates
14799075
14977916
AEs net income impact
(7920288)
(20223914)
100271
(12382196)
Deferred Cost of Capacity
12000000
12000000
AEs net cash impact including deferral
(7920288)
(8223914)
100271
(382196)
Customer savings-(net)
$ (25051423)
$ (30850947)
$ (17030864)
$ (33564429)
Recommend recovery thru fuel factor
Offset customer fuel savings due to DSM
Would not offset revenue loss
(before amp after)
In 2007 we still have excess capacity
Cost recovery
3yrs - recommended purch power
power is only needed during peak-dont utilize a plant
need declines as renewables increases
cash flow
Dynamic pricing-TOU rates motivating cust to conserve energy
would replace some of the energy efficiency rebates
option to self-generate
TCOS expense reduction due to DSM savings
Historical
Historical
Historical
Historical
Historical
Preliminary
Forecast
Forecast
Forecast
Forecast
Forecast
Forecast
Forecast
Forecast
Forecast
Forecast
2000
2001
2002
2003
2004
2005
2006
2007
2008
2009
2010
2011
2012
2013
2014
2015
ERCOT Postage Stamp Rate
1476
1528
1661
1778
1925
2055
2185
2315
2445
2575
2705
2835
2965
3095
3225
3355
Estimated DSM-kW savings applied to average 4CP
40000
40000
40000
40000
40000
40000
40000
40000
40000
40000
40000
Reduction to TCOS expense
$ 821987
$ 873987
$ 925987
$ 977987
$ 1029987
$ 1081987
$ 1133987
$ 1185987
$ 1237987
$ 1289987
$ 1341987
Cash flow chart
Chart1
Fuel Cost Reduction
Capacity Expense Reduction
Total Decrease In Expenses
REDUCTION IN EXPENSES DUE TO DSM PROGRAMS
5166240
5166240
8956848
8956848
13238528
13238528
14683328
26360828
11677500
16859440
31439440
14580000
20212576
37762576
17550000
24919120
45304120
20385000
30094336
53246836
23152500
34616096
60468596
25852500
40546848
69166848
28620000
47845120
79232620
31387500
Chart4
Fuel Cost without DSM
Fuel Cost with DSM
00233611231
00238400717
00226232559
00233069306
00220985648
00237472342
00217888198
00236848698
00215229268
00237472426
00216083296
00242335075
00224259386
00254383594
00226073357
00259502528
00240455083
00277315347
00255904506
00296726494
Sheet1
Sheet3
Saving Energy TogetherPower SaverTM Program
DSM Analysis 2007 2008
Base Revenue Reduction (12000000) (16000000) Fuel Revenue Reduction (13000000) (15000000)
AEs Net Income Impact (8100000) (20000000) Deferred Cost of Capacity 12000000 AEs Net Cash Impact (8100000) (8000000)
CURRENT FORECAST
Cash Flow Projection of DSM
Cash flow chart
Chart1
Fuel Cost Reduction
Capacity Expense Reduction
Total Decrease In Expenses
REDUCTION IN EXPENSES DUE TO DSM PROGRAMS
5166240
5166240
8956848
8956848
13238528
13238528
14683328
26360828
11677500
16859440
31439440
14580000
20212576
37762576
17550000
24919120
45304120
20385000
30094336
53246836
23152500
34616096
60468596
25852500
40546848
69166848
28620000
47845120
79232620
31387500
Chart4
Fuel Cost without DSM
Fuel Cost with DSM
REDUCTION IN FUEL COST DUE TO DSM PROGRAMS
00233611231
00238400717
00226232559
00233069306
00220985648
00237472342
00217888198
00236848698
00215229268
00237472426
00216083296
00242335075
00224259386
00254383594
00226073357
00259502528
00240455083
00277315347
00255904506
00296726494
Sheet1
Sheet3
Saving Energy TogetherPower SaverTM Program
Questions
Saving Energy TogetherPower SaverTM Program
FY 2006 Achievements
Energy SavingsMW of
Programs Saved Goal Goal
Residential 126 115 110
Commercial 154 121 127
Demand Response 146 156 94
Solar 055 060 93
Grand Total 432 398 108
Saving Energy TogetherPower SaverTM Program
MW SavedPrograms FY2005 FY2006
Residential 119 126
Commercial 153 154
Demand Response 116 146
Solar 06 055
Grand Total 394 432
Energy Savings ComparisonFY2005 to FY2006
Saving Energy TogetherPower SaverTM Program
DSM Summary
bull DSM programs are saving peak kW amp kWh
bull Cost-effectiveness analyses include full program costs
bull DSM goals and budgets should vary to support AE resource plan requirements
Saving Energy TogetherPower SaverTM Program
Free Home WeatherizationEnergy Improvementsbull Insulate Atticsbull Duct Sealingbull Install CFLsbull Solar Screensbull Caulking and Weather-strippingbull Free Smoke amp Carbon Monoxide Detector bull Minor Energy Related Repairs
Saving Energy TogetherPower SaverTM Program
Power Saver Program
bull FREE Energy Saving Productsbull Lower energy costsbull 65000 installed in homes apartmentsbull 4000 installed in commercial buildings
Saving Energy TogetherPower SaverTM Program
Energy Conservation in COA FacilitiesSenate Bill 5 Energy Use vs Energy Cost
295
300
305
310
315
320
325
330
335
340
345
350
Base Year2001
2002 2003 2004 2005 2006
Gig
awat
t-hou
rs
220
230
240
250
260
270
280
290
300
Mill
ion
Dol
lars
Million kWh Cost
Chart1
Million kWh
Cost
Gigawatt-hours
Million Dollars
Senate Bill 5 Energy Use vs Energy Cost
343667472
28619895
33757683
2504536
3260767692
24602549
31773020962
26778741
324036807
2745756918
313494864
2936354518
Sheet1
Sheet1
ampA
Page ampP
Million kWh
Gigawatt-hours
Senate Bill 5 Reported Energy Use
Sheet2
ampA
Page ampP
Million kWh
Cost
Gigawatt-hours
Million Dollars
Senate Bill 5 Energy Use vs Energy Cost
Sheet3
Energy Efficiency Real Reliable and Cost-Effective Alternative
Fuel cost savings assume all saved energy at average gas generation cost
Increased off-system sales margins assumes reduced demand plus associated reserve requirements could be sold for $15kWmonth (after 2007 this is an avoided capacity expense)
Fuel Factor expense increase is increased fuel expense plus purchased capacity cost
GFT reduction is base revenue and fuel cost reductions times 91
Base revenue wDSM
552961968
562415810
569170954
576627290
585065115
594497922
604045383
613657938
623249716
632762255
644233714
Base revenue wo DSM
557087606
570008130
580983849
592794909
605393639
619267826
633200893
646996029
660941168
674903660
690679622
kWh sales wDSM
10776303000
10954134000
11076488000
11213088000
11369667000
11546488000
11724454000
11897588000
12077216000
12256861000
12476492000
kWh sales wo DSM
10861087000
11109639000
11319110000
11544588000
11787201000
12054717000
12323440000
12582205000
12851412000
13121980000
13429845000
1000
kW sales wDSM
2435000
2442000
2443000
2471000
2477000
2486000
2486000
2490000
2515000
2535000
2539000
kW sales wo DSM
2476000
2527000
2572000
2644000
2693000
2746000
2788000
2833000
2898000
2959000
3004000
Fuel Forecast
Budget 2006 (3905)
Tot-2006
Tot-2007
Tot-2008
Tot-2009
Tot-2010
Tot-2011
Tot-2012
Tot-2013
Tot-2014
Tot-2015
Total
MWH
STP
3303339
3488217
3514415
3360759
3465191
3507755
3405921
3614690
3482746
3515635
34658668
FPP
4564135
4517773
4465943
4451812
4418334
4545733
4554494
4586879
4445603
4245674
44796380
Decker
2839387
511212
504648
615748
583574
563845
570235
550098
594337
757598
8090682
Holly
235228
28425
- 0
- 0
- 0
- 0
- 0
- 0
- 0
263653
Sand Hill CC
1533962
1538343
1565132
1615597
1553452
1600111
1516183
1666799
1687122
14276700
SH GT
465155
427320
523864
450359
458722
498276
432337
492003
574949
4322986
Decker GT
157126
216800
280985
238803
246172
264900
238141
266139
294200
2203267
Existing DG
17340
7248
7296
7065
7216
7268
7168
7137
7147
16838
91723
Future DG
110
110
101
2216
2659
4743
5273
7365
7750
17746
48073
PurchasePower
131996
- 0
204000
208800
206400
206400
134400
201600
136000
139200
1568796
Landfill Methane
87493
92450
92704
92450
92450
92450
92704
92450
92450
92450
920052
Future Bioenergy
- 0
- 0
134151
178705
384764
454206
673445
744600
978509
1057336
4605716
Wind
636291
669050
671181
669050
669050
669050
671181
669050
669050
669050
6662004
Solar
684
20026
32685
41438
50311
59183
68298
76929
85801
87839
523193
Shortfall Energy
3308
2419
3355
6021
3311
4269
7050
3075
3868
4281
40957
11584082
11699976
11841366
12004048
12188020
12373249
12553456
12740532
12928204
13159918
123072851
(10512)
(1)
(1)
0
0
(0)
1
1
(0)
0
(10505)
Dollars
STP
14024307
16411783
18054617
17815007
18997196
19874461
19872833
21713134
21541492
22417754
190722584
FPP
47959978
48327184
52942730
56530034
57287196
60262126
61527986
62666810
62927556
61809806
572241406
Decker
161242451
30007075
26150797
28534975
26297430
25902979
27510734
27253106
30904024
41053837
424857407
Holly
15649395
1939153
- 0
- 0
- 0
- 0
- 0
- 0
- 0
17588548
Sand Hill CC
71819840
62147912
53829988
54696364
53773560
56880544
56723452
64324432
66378796
540574888
SH GT
28915407
23018682
25201605
20614580
21546020
24873781
22042049
25993318
31798432
224003872
Decker GT
12129491
14068039
16315347
13248144
14062711
15831205
14654486
17002591
19718490
137030504
Existing DG
1066126
482134
392821
350785
361063
372817
379318
391499
407877
1055934
5260373
Future DG
5688
5352
3321
115774
140956
247241
281454
413559
455875
1154808
2824028
PurchasePower
5000000
- 0
17339160
16429042
16415314
16614357
11144008
17017280
11632503
11967200
123558864
Landfill Methane
3535734
3653844
3663855
3653844
3653844
3653844
3663855
3653844
3653844
3653844
36440353
Future Bioenergy
- 0
- 0
6036769
8041681
17314398
20439270
30305016
33507000
44032792
47579944
207256869
Wind
17374835
18256537
18314921
18256537
18256537
18256537
18314921
18256537
18256537
18256537
181800436
Solar
- 0
- 0
- 0
- 0
- 0
- 0
- 0
- 0
- 0
- 0
- 0
Shortfall Energy
248086
181420
251636
451599
248349
320172
528742
230590
290120
321058
3071771
250457205
245839462
244324412
245526217
247531370
255326093
271114397
278523346
301422961
327166440
2667231902
1792964
10
(12)
6
(1)
10
(27)
4
3
(6)
1793341
Gas MWh
2839387
2902683
2715536
2985730
2888333
2822192
2933522
2736759
3019278
3313869
29157288
Gas cost ($)
161242451
158521208
127324584
123881915
114856517
115285269
125096264
120673092
138224364
158949555
1344055218
Avg gas gen Cost ($MWh)
5679
5461
4689
4149
3977
4085
4264
4409
4578
4796
4610
NO DSM FUEL FACTOR
2006
2007
2008
2009
2010
2011
2012
2013
2014
2015
Thermal Unit Fuel Cost
232662512
236980848
213398064
215549344
211851680
220956944
237247920
240469984
264099856
293228672
Shortfall Purchases
248086
181420
251636
451599
248349
320172
528742
230590
290120
321058
Short-Term Power Purchases
5000000
- 0
29016660
31009042
33965314
36999357
34296508
42869780
40252503
43354700
Fuel Cell Gas Cost
119837
119837
119837
119837
119837
119837
119837
119837
119837
119837
Recoverable ERCOT Expenses
16825273
16825273
16825273
16825273
16825273
16825273
16825273
16825273
16825273
16825273
Fuel Factor Renewables
9998882
9706333
14540565
15223226
23255836
23418594
31052373
32981926
42305054
44649542
Total Fuel Factor Revenue
264854590
263813711
274152035
279178321
286266289
298640176
320070653
333497390
363892643
398499082
Total Renewables
20910569
21910381
28015544
29952062
39224779
42349651
52283792
55417381
65943173
69490325
TotThermal+PurchPwr+Renewables
249864319
245834121
244321076
245522607
247527546
255322004
271110126
278519139
301418805
327162135
Estimated Green Choice Sales
10911686
12204048
13474979
14728836
15968943
18931058
21231418
22435455
23638119
24840783
Fuel Factor Renewables
9998882
9706333
14540565
15223226
23255836
23418594
31052373
32981926
42305054
44649542
Forecast Annual GWh Sales
11110
11319
11545
11787
12055
12323
12582
12851
13122
13430
Average cost per kWh
$ 0023840
$ 0023307
$ 0023747
$ 0023685
$ 0023747
$ 0024234
$ 0025438
$ 0025950
$ 0027732
$ 0029673
Fuel Factors
Secondary
$ 0023475
$ 0022733
$ 0022206
$ 0021895
$ 0021627
$ 0021713
$ 0022535
$ 0022717
$ 0024162
$ 0025715
Primary
$ 0022776
$ 0022056
$ 0021545
$ 0021243
$ 0020984
$ 0021067
$ 0021864
$ 0022041
$ 0023443
$ 0024949
Transmission
$ 0022539
$ 0021828
$ 0021321
$ 0021022
$ 0020766
$ 0020848
$ 0021637
$ 0021812
$ 0023200
$ 0024690
2006
2007
2008
2009
2010
2011
2012
2013
2014
2015
Dag generation
11574
11700
11841
12004
12188
12373
12553
12741
12928
13160
Joe generation
11584
11700
11841
12004
12188
12373
12553
12741
12928
13160
difference
(10)
0
(0)
(0)
(0)
(0)
(0)
0
(0)
0
sales
10954
11076
11213
11370
11546
11724
11898
12077
12257
12476
losses
57
56
56
56
56
55
55
55
55
55
With DSM
Thermal Unit Fuel Cost wDSM
223705664
223742320
198714736
198689904
191639104
196037824
207153584
205853888
223553008
245383552
Short-Term Power Purchases
5000000
- 0
17339160
16429042
16415314
16614357
11144008
17017280
11632503
11967200
Average cost per kWh
$ 0023361
$ 0022623
$ 0022099
$ 0021789
$ 0021523
$ 0021608
$ 0022426
$ 0022607
$ 0024046
$ 0025590
Forecast Annual GWh Sales
10954
11076
11213
11370
11546
11724
11898
12077
12257
12476
255897742
250575183
247791207
247738881
248503713
253336056
266823817
273028794
294725795
319266462
CASH FLOW PURCHASE OPTION
2005
2006
2007
2008
2009
2010
2011
2012
2013
2014
2015
Base revenue reduction
4125638
7592320
11812895
16167619
20328524
24769904
29155510
33338091
37691451
42141405
46445908
Fuel cost reduction
5166240
8956848
13238528
14683328
16859440
20212576
24919120
30094336
34616096
40546848
47845120
Potential off-system sales margins
2767500
5737500
8707500
Capacity cost reduction
12000000
15000000
18000000
21000000
24000000
27000000
30000000
33000000
GFT reduction
845561
660413
773705
527757
576669
709301
827386
851560
807636
944644
1055853
845560920627699
Program cost
20689324
22819634
22819634
22819634
22819634
22819634
22819634
22819634
22819634
22819634
22819634
Recovery through base rates
14405492
14639186
14799075
14977916
15183688
15416391
15650684
15878624
16115254
16352636
16645725
Cash flow
-6796409
-9374854
-10352249
-23481580
-27387801
-31463846
-35497075
-39427542
-43588195
-47663759
-51563965
2005
2006
2007
2008
2009
2010
2011
2012
2013
2014
2015
Base Revenue Reduction
$ (4125638)
$ (7592320)
$ (11812895)
$ (16167619)
$ (20328524)
$ (24769904)
$ (29155510)
$ (33338091)
$ (37691451)
$ (42141405)
$ (46445908)
Fuel Revenue Reduction
$ (5166240)
$ (8956848)
$ (13238528)
$ (26683328)
$ (31859440)
$ (38212576)
$ (45919120)
$ (54094336)
$ (61616096)
$ (70546848)
$ (80845120)
Fuel Cost Reduction
$ 5166240
$ 8956848
$ 13238528
$ 26683328
$ 31859440
$ 38212576
$ 45919120
$ 54094336
$ 61616096
$ 70546848
$ 80845120
Potential off-system sales margins
$ 2767500
$ 5737500
$ 8707500
$ - 0
$ - 0
$ - 0
$ - 0
$ - 0
$ - 0
$ - 0
$ - 0
Net program costs
$ (5438271)
$ (7520034)
$ (7246854)
$ (7313961)
$ (7059277)
$ (6693942)
$ (6341565)
$ (6089451)
$ (5896744)
$ (5522354)
$ (5118057)
AEs net cash impact
$ (6796409)
$ (9374854)
$ (10352249)
$ (23481580)
$ (27387801)
$ (31463846)
$ (35497075)
$ (39427542)
$ (43588195)
$ (47663759)
$ (51563965)
Customer savings
$ 9291878
$ 16549168
$ 25051423
$ 42850947
$ 52187964
$ 62982480
$ 75074630
$ 87432427
$ 99307547
$ 112688253
$ 127291028
CASH FLOW BUILD OPTION
2005
2006
2007
2008
2009
2010
2011
2012
2013
2014
2015
Base revenue reduction
4125638
7592320
11812895
16167619
20328524
24769904
29155510
33338091
37691451
42141405
46445908
Fuel cost reduction
5166240
8956848
13238528
14683328
16859440
20212576
24919120
30094336
34616096
40546848
47845120
Potential off-system sales margins
2767500
5737500
8707500
Capacity cost reduction
7736295
11604442
11604442
15472589
15472589
19340737
19340737
23208884
GFT reduction
845561
660413
773705
527757
576669
709301
827386
851560
807636
944644
1055853
Program cost
20689324
22819634
22819634
22819634
22819634
22819634
22819634
22819634
22819634
22819634
22819634
Recovery through base rates
14405492
14639186
14799075
14977916
15183688
15416391
15650684
15878624
16115254
16352636
16645725
Cash flow
-6796409
-9374854
-10352249
-15745285
-15783359
-19859404
-20024486
-23954952
-24247459
-28323022
-28355080
-21195738994
Capacity cost Build option
Reduced capacity requirement (kW)
46125
95625
145125
194625
243000
292500
339750
385875
430875
477000
523125
Capacity added
200
300
300
400
400
500
500
600
Annual capacity cost
$386814737
$7736295
$11604442
$11604442
$15472589
$15472589
$19340737
$19340737
$23208884
Capacity cost Buy option
Reduced capacity requirement (kW)
46125
95625
145125
194625
243000
292500
339750
385875
430875
477000
523125
Capacity added
200
250
300
350
400
450
500
550
Annual capacity cost
$600000000
$12000000
$15000000
$18000000
$21000000
$24000000
$27000000
$30000000
$33000000
1994
2004
2005
2006
2007
2008
2009
2010
2011
2012
2013
2014
2015
Net MWh to system
7659242
10855000
11388814
11573570
11699976
11841366
12004047
12188019
12373248
12553455
12740532
12928203
13159916
Revenue multiplier
100
142
149
151
153
155
157
159
162
164
166
169
172
Revenue allocated to DSM
9688028
13730281
14405492
14639186
14799075
14977916
15183688
15416391
15650684
15878624
16115254
16352636
16645725
CentskWh in rates for DSM
0134
0134
0134
0134
0134
0134
0134
0133
0133
0133
0133
0133
Annual sales (MWh)
10262000
10776303
10954134
11076488
11213088
11369667
11546488
11724454
11897588
12077216
12256861
12476492
2006
2006
2007
2007
2008
2008
2009
2009
2010
2010
2011
2011
2012
2012
2013
2013
2014
2014
2015
2015
2005
2005
2005
2006
2006
2006
2007
2007
2007
2008
2008
2008
2009
2009
2009
2010
2010
2010
2011
2011
2011
2012
2012
2012
2013
2013
2013
2014
2014
2014
2015
2015
2015
2005
2006
2007
2008
2009
2010
2011
2012
2013
2014
2015
Base Revenue Reduction
$ (4125638)
$ (7592320)
$ (11812895)
$ (16167619)
$ (20328524)
$ (24769904)
$ (29155510)
$ (33338091)
$ (37691451)
$ (42141405)
$ (46445908)
Fuel Revenue Reduction
$ (5166240)
$ (8956848)
$ (13238528)
$ (26683328)
$ (31859440)
$ (38212576)
$ (45919120)
$ (54094336)
$ (61616096)
$ (70546848)
$ (80845120)
Fuel Cost Reduction
$ 5166240
$ 8956848
$ 13238528
$ 26683328
$ 31859440
$ 38212576
$ 45919120
$ 54094336
$ 61616096
$ 70546848
$ 80845120
Potential off-system sales margins
$ 2767500
$ 5737500
$ 8707500
$ - 0
$ - 0
$ - 0
$ - 0
$ - 0
$ - 0
$ - 0
$ - 0
Net program costs
$ (5438271)
$ (7520034)
$ (7246854)
$ (7313961)
$ (7059277)
$ (6693942)
$ (6341565)
$ (6089451)
$ (5896744)
$ (5522354)
$ (5118057)
AEs net cash impact
$ (6796409)
$ (9374854)
$ (10352249)
$ (23481580)
$ (27387801)
$ (31463846)
$ (35497075)
$ (39427542)
$ (43588195)
$ (47663759)
$ (51563965)
Customer savings
$ (9291878)
$ (16549168)
$ (25051423)
$ (42850947)
$ (52187964)
$ (62982480)
$ (75074630)
$ (87432427)
$ (99307547)
$ (112688253)
$ (127291028)
Estimated Annual Impact
Base Revenue Reduction
$ (16134252)
Fuel Revenue Reduction
$ (23790144)
Fuel Cost Reduction
$ 23790144
Potential off-system sales margins
$ 2889000
Net program costs
$ (7166814)
AEs net cash impact
$ (20412066)
Customer savings
$ (39924396)
CURRENT FORECAST
PROPOSED PROJECTION
DSM Analysis
2007
2008
2007
2008
keyed in to round
Base Revenue Reduction
(12000000)
(16000000)
(12000000)
(16000000)
Fuel Revenue Reduction
(13000000)
(15000000)
(5000000)
(7000000)
Customer Savings (Bill Reduction)
(25000000)
(31000000)
(17000000)
(23000000)
Fuel Cost Reduction
13000000
15000000
5000000
7000000
KW
$KW
NET
5 profit
Potential Off-system Capacity Sales
9000000
9000000
6207
$KW
145000
$ 62
$ 8990000
Net of fuel and GFT
$ 449500
TCOS Expense Reduction
900000
1000000
900000
1000000
GFT Reduction
2000000
3000000
2000000
3000000
Program Cost
(23000000)
(23000000)
Recovery through Base Rates
15000000
15000000
AEs Net Income Impact
(8100000)
(20000000)
(17100000)
(35000000)
Deferred Cost of Capacity
12000000
- 0
AEs Net Cash Impact
(8100000)
(8000000)
(17100000)
- 0
Outline for Oct 10 Leadership Team Update
1 Components of BenefitCost Ratios
2 Cash Flow of DSM
CURRENT FORECAST
PROPOSED PROJECTION
DSM Analysis
2007
2008
2007
2008
Base Revenue Reduction
(11812895)
(16167619)
(11812895)
(16167619)
Fuel Revenue Reduction
(13238528)
(14683328)
(5217969)
(5396810)
Fuel Cost Reduction
13238528
14683328
5217969
5396810
Potential off-system sales margins
8707500
8707500
Fuel Revenue Increase-Capacity
12000000
12000000
Fuel Cost Increase-Capacity
(12000000)
(12000000)
TCOS expense reduction
925987
977987
925987
977987
GFT reduction
2279680
2807436
2279680
2807436
Program cost
(22819634)
(22819634)
Recovery through base rates
14799075
14977916
AEs net income impact
(7920288)
(20223914)
100271
(12382196)
Deferred Cost of Capacity
12000000
12000000
AEs net cash impact including deferral
(7920288)
(8223914)
100271
(382196)
Customer savings-(net)
$ (25051423)
$ (30850947)
$ (17030864)
$ (21564429)
Recommend recovery thru fuel factor
Offset customer fuel savings due to DSM
Would not offset revenue loss
(before amp after)
In 2007 we still have excess capacity
Cost recovery
3yrs - recommended purch power
power is only needed during peak-dont utilize a plant
need declines as renewables increases
cash flow
Dynamic pricing-TOU rates motivating cust to conserve energy
would replace some of the energy efficiency rebates
option to self-generate
TCOS expense reduction due to DSM savings
Historical
Historical
Historical
Historical
Historical
Preliminary
Forecast
Forecast
Forecast
Forecast
Forecast
Forecast
Forecast
Forecast
Forecast
Forecast
2000
2001
2002
2003
2004
2005
2006
2007
2008
2009
2010
2011
2012
2013
2014
2015
ERCOT Postage Stamp Rate
1476
1528
1661
1778
1925
2055
2185
2315
2445
2575
2705
2835
2965
3095
3225
3355
Estimated DSM-kW savings applied to average 4CP
40000
40000
40000
40000
40000
40000
40000
40000
40000
40000
40000
Reduction to TCOS expense
$ 821987
$ 873987
$ 925987
$ 977987
$ 1029987
$ 1081987
$ 1133987
$ 1185987
$ 1237987
$ 1289987
$ 1341987
2005
2006
2007
2008
2009
2010
2011
2012
2013
2014
2015
Base revenue reduction
4125638
7592320
11812895
16167619
20328524
24769904
29155510
33338091
37691451
42141405
46445908
kWh reduction
84784000
155505000
242622000
331500000
417534000
508229000
598986000
684617000
774196000
865119000
953353000
Fuel cost reduction
5166240
8956848
13238528
14683328
16859440
20212576
24919120
30094336
34616096
40546848
47845120
Demand reduction (kW)
41000
85000
129000
173000
216000
260000
302000
343000
383000
424000
465000
Reduced reserve requirement (kW)
5125
10625
16125
21625
27000
32500
37750
42875
47875
53000
58125
2008
2009
2010
2011
2012
2013
2014
2015
Reduced capacity requirement (kW)
46125
95625
145125
194625
243000
292500
339750
385875
430875
477000
523125
194625
243000
292500
339750
385875
430875
477000
523125
Increased off-system sales margins
2767500
5737500
8707500
Capacity cost reduction
11677500
14580000
17550000
20385000
23152500
25852500
28620000
31387500
Fuel Factor expense decrease ($)
5166240
8956848
13238528
26360828
31439440
37762576
45304120
53246836
60468596
69166848
79232620
Fuel Factor decrease (centskWh)
00005
00007
00016
00019
00022
00026
00030
00033
00037
00041
Fuel Factor decrease
2
3
7
9
10
12
13
15
15
16
GFT reduction
845561
1505974
2279680
2807436
3384105
4093406
4920791
5772351
6579987
7524631
8580484
Program cost
20689324
22819634
22819634
22819634
22819634
22819634
22819634
22819634
22819634
22819634
22819634
Recovery through base rates
14405492
14639186
14799075
14977916
15183688
15416391
15650684
15878624
16115254
16352636
16645725
Cash flow
-7641970
-10035268
-11125954
-12331837
-13384470
-14623147
-15939461
-17126601
-18543331
-19988403
-21232317
Fuel cost savings assume all saved energy at average gas generation cost
Increased off-system sales margins assumes reduced demand plus associated reserve requirements could be sold for $15kWmonth (after 2007 this is an avoided capacity expense)
Fuel Factor expense increase is increased fuel expense plus purchased capacity cost
GFT reduction is base revenue and fuel cost reductions times 91
Base revenue wDSM
552961968
562415810
569170954
576627290
585065115
594497922
604045383
613657938
623249716
632762255
644233714
Base revenue wo DSM
557087606
570008130
580983849
592794909
605393639
619267826
633200893
646996029
660941168
674903660
690679622
kWh sales wDSM
10776303000
10954134000
11076488000
11213088000
11369667000
11546488000
11724454000
11897588000
12077216000
12256861000
12476492000
kWh sales wo DSM
10861087000
11109639000
11319110000
11544588000
11787201000
12054717000
12323440000
12582205000
12851412000
13121980000
13429845000
1000
kW sales wDSM
2435000
2442000
2443000
2471000
2477000
2486000
2486000
2490000
2515000
2535000
2539000
kW sales wo DSM
2476000
2527000
2572000
2644000
2693000
2746000
2788000
2833000
2898000
2959000
3004000
Fuel Forecast
Budget 2006 (3905)
Tot-2006
Tot-2007
Tot-2008
Tot-2009
Tot-2010
Tot-2011
Tot-2012
Tot-2013
Tot-2014
Tot-2015
Total
MWH
STP
3303339
3488217
3514415
3360759
3465191
3507755
3405921
3614690
3482746
3515635
34658668
FPP
4564135
4517773
4465943
4451812
4418334
4545733
4554494
4586879
4445603
4245674
44796380
Decker
2839387
511212
504648
615748
583574
563845
570235
550098
594337
757598
8090682
Holly
235228
28425
- 0
- 0
- 0
- 0
- 0
- 0
- 0
263653
Sand Hill CC
1533962
1538343
1565132
1615597
1553452
1600111
1516183
1666799
1687122
14276700
SH GT
465155
427320
523864
450359
458722
498276
432337
492003
574949
4322986
Decker GT
157126
216800
280985
238803
246172
264900
238141
266139
294200
2203267
Existing DG
17340
7248
7296
7065
7216
7268
7168
7137
7147
16838
91723
Future DG
110
110
101
2216
2659
4743
5273
7365
7750
17746
48073
PurchasePower
131996
- 0
204000
208800
206400
206400
134400
201600
136000
139200
1568796
Landfill Methane
87493
92450
92704
92450
92450
92450
92704
92450
92450
92450
920052
Future Bioenergy
- 0
- 0
134151
178705
384764
454206
673445
744600
978509
1057336
4605716
Wind
636291
669050
671181
669050
669050
669050
671181
669050
669050
669050
6662004
Solar
684
20026
32685
41438
50311
59183
68298
76929
85801
87839
523193
Shortfall Energy
3308
2419
3355
6021
3311
4269
7050
3075
3868
4281
40957
11584082
11699976
11841366
12004048
12188020
12373249
12553456
12740532
12928204
13159918
123072851
(10512)
(1)
(1)
0
0
(0)
1
1
(0)
0
(10505)
Dollars
STP
14024307
16411783
18054617
17815007
18997196
19874461
19872833
21713134
21541492
22417754
190722584
FPP
47959978
48327184
52942730
56530034
57287196
60262126
61527986
62666810
62927556
61809806
572241406
Decker
161242451
30007075
26150797
28534975
26297430
25902979
27510734
27253106
30904024
41053837
424857407
Holly
15649395
1939153
- 0
- 0
- 0
- 0
- 0
- 0
- 0
17588548
Sand Hill CC
71819840
62147912
53829988
54696364
53773560
56880544
56723452
64324432
66378796
540574888
SH GT
28915407
23018682
25201605
20614580
21546020
24873781
22042049
25993318
31798432
224003872
Decker GT
12129491
14068039
16315347
13248144
14062711
15831205
14654486
17002591
19718490
137030504
Existing DG
1066126
482134
392821
350785
361063
372817
379318
391499
407877
1055934
5260373
Future DG
5688
5352
3321
115774
140956
247241
281454
413559
455875
1154808
2824028
PurchasePower
5000000
- 0
17339160
16429042
16415314
16614357
11144008
17017280
11632503
11967200
123558864
Landfill Methane
3535734
3653844
3663855
3653844
3653844
3653844
3663855
3653844
3653844
3653844
36440353
Future Bioenergy
- 0
- 0
6036769
8041681
17314398
20439270
30305016
33507000
44032792
47579944
207256869
Wind
17374835
18256537
18314921
18256537
18256537
18256537
18314921
18256537
18256537
18256537
181800436
Solar
- 0
- 0
- 0
- 0
- 0
- 0
- 0
- 0
- 0
- 0
- 0
Shortfall Energy
248086
181420
251636
451599
248349
320172
528742
230590
290120
321058
3071771
250457205
245839462
244324412
245526217
247531370
255326093
271114397
278523346
301422961
327166440
2667231902
1792964
10
(12)
6
(1)
10
(27)
4
3
(6)
1793341
Gas MWh
2839387
2902683
2715536
2985730
2888333
2822192
2933522
2736759
3019278
3313869
29157288
Gas cost ($)
161242451
158521208
127324584
123881915
114856517
115285269
125096264
120673092
138224364
158949555
1344055218
Avg gas gen Cost ($MWh)
5679
5461
4689
4149
3977
4085
4264
4409
4578
4796
4610
NO DSM FUEL FACTOR
2006
2007
2008
2009
2010
2011
2012
2013
2014
2015
Thermal Unit Fuel Cost
232662512
236980848
213398064
215549344
211851680
220956944
237247920
240469984
264099856
293228672
Shortfall Purchases
248086
181420
251636
451599
248349
320172
528742
230590
290120
321058
Short-Term Power Purchases
5000000
- 0
29016660
31009042
33965314
36999357
34296508
42869780
40252503
43354700
Fuel Cell Gas Cost
119837
119837
119837
119837
119837
119837
119837
119837
119837
119837
Recoverable ERCOT Expenses
16825273
16825273
16825273
16825273
16825273
16825273
16825273
16825273
16825273
16825273
Fuel Factor Renewables
9998882
9706333
14540565
15223226
23255836
23418594
31052373
32981926
42305054
44649542
Total Fuel Factor Revenue
264854590
263813711
274152035
279178321
286266289
298640176
320070653
333497390
363892643
398499082
Total Renewables
20910569
21910381
28015544
29952062
39224779
42349651
52283792
55417381
65943173
69490325
TotThermal+PurchPwr+Renewables
249864319
245834121
244321076
245522607
247527546
255322004
271110126
278519139
301418805
327162135
Estimated Green Choice Sales
10911686
12204048
13474979
14728836
15968943
18931058
21231418
22435455
23638119
24840783
Fuel Factor Renewables
9998882
9706333
14540565
15223226
23255836
23418594
31052373
32981926
42305054
44649542
Forecast Annual GWh Sales
11110
11319
11545
11787
12055
12323
12582
12851
13122
13430
Average cost per kWh
$ 0023840
$ 0023307
$ 0023747
$ 0023685
$ 0023747
$ 0024234
$ 0025438
$ 0025950
$ 0027732
$ 0029673
Fuel Factors
Secondary
$ 0023475
$ 0022733
$ 0022206
$ 0021895
$ 0021627
$ 0021713
$ 0022535
$ 0022717
$ 0024162
$ 0025715
Primary
$ 0022776
$ 0022056
$ 0021545
$ 0021243
$ 0020984
$ 0021067
$ 0021864
$ 0022041
$ 0023443
$ 0024949
Transmission
$ 0022539
$ 0021828
$ 0021321
$ 0021022
$ 0020766
$ 0020848
$ 0021637
$ 0021812
$ 0023200
$ 0024690
2006
2007
2008
2009
2010
2011
2012
2013
2014
2015
Dag generation
11574
11700
11841
12004
12188
12373
12553
12741
12928
13160
Joe generation
11584
11700
11841
12004
12188
12373
12553
12741
12928
13160
difference
(10)
0
(0)
(0)
(0)
(0)
(0)
0
(0)
0
sales
10954
11076
11213
11370
11546
11724
11898
12077
12257
12476
losses
57
56
56
56
56
55
55
55
55
55
With DSM
Thermal Unit Fuel Cost wDSM
223705664
223742320
198714736
198689904
191639104
196037824
207153584
205853888
223553008
245383552
Short-Term Power Purchases
5000000
- 0
17339160
16429042
16415314
16614357
11144008
17017280
11632503
11967200
Average cost per kWh
$ 0023361
$ 0022623
$ 0022099
$ 0021789
$ 0021523
$ 0021608
$ 0022426
$ 0022607
$ 0024046
$ 0025590
Forecast Annual GWh Sales
10954
11076
11213
11370
11546
11724
11898
12077
12257
12476
255897742
250575183
247791207
247738881
248503713
253336056
266823817
273028794
294725795
319266462
CASH FLOW PURCHASE OPTION
2005
2006
2007
2008
2009
2010
2011
2012
2013
2014
2015
Base revenue reduction
4125638
7592320
11812895
16167619
20328524
24769904
29155510
33338091
37691451
42141405
46445908
Fuel cost reduction
5166240
8956848
13238528
14683328
16859440
20212576
24919120
30094336
34616096
40546848
47845120
Potential off-system sales margins
2767500
5737500
8707500
Capacity cost reduction
12000000
15000000
18000000
21000000
24000000
27000000
30000000
33000000
GFT reduction
845561
660413
773705
527757
576669
709301
827386
851560
807636
944644
1055853
845560920627699
Program cost
20689324
22819634
22819634
22819634
22819634
22819634
22819634
22819634
22819634
22819634
22819634
Recovery through base rates
14405492
14639186
14799075
14977916
15183688
15416391
15650684
15878624
16115254
16352636
16645725
Cash flow
-6796409
-9374854
-10352249
-23481580
-27387801
-31463846
-35497075
-39427542
-43588195
-47663759
-51563965
2005
2006
2007
2008
2009
2010
2011
2012
2013
2014
2015
Base Revenue Reduction
$ (4125638)
$ (7592320)
$ (11812895)
$ (16167619)
$ (20328524)
$ (24769904)
$ (29155510)
$ (33338091)
$ (37691451)
$ (42141405)
$ (46445908)
Fuel Revenue Reduction
$ (5166240)
$ (8956848)
$ (13238528)
$ (26683328)
$ (31859440)
$ (38212576)
$ (45919120)
$ (54094336)
$ (61616096)
$ (70546848)
$ (80845120)
Fuel Cost Reduction
$ 5166240
$ 8956848
$ 13238528
$ 26683328
$ 31859440
$ 38212576
$ 45919120
$ 54094336
$ 61616096
$ 70546848
$ 80845120
Potential off-system sales margins
$ 2767500
$ 5737500
$ 8707500
$ - 0
$ - 0
$ - 0
$ - 0
$ - 0
$ - 0
$ - 0
$ - 0
Net program costs
$ (5438271)
$ (7520034)
$ (7246854)
$ (7313961)
$ (7059277)
$ (6693942)
$ (6341565)
$ (6089451)
$ (5896744)
$ (5522354)
$ (5118057)
AEs net cash impact
$ (6796409)
$ (9374854)
$ (10352249)
$ (23481580)
$ (27387801)
$ (31463846)
$ (35497075)
$ (39427542)
$ (43588195)
$ (47663759)
$ (51563965)
Customer savings
$ 9291878
$ 16549168
$ 25051423
$ 42850947
$ 52187964
$ 62982480
$ 75074630
$ 87432427
$ 99307547
$ 112688253
$ 127291028
CASH FLOW BUILD OPTION
2005
2006
2007
2008
2009
2010
2011
2012
2013
2014
2015
Base revenue reduction
4125638
7592320
11812895
16167619
20328524
24769904
29155510
33338091
37691451
42141405
46445908
Fuel cost reduction
5166240
8956848
13238528
14683328
16859440
20212576
24919120
30094336
34616096
40546848
47845120
Potential off-system sales margins
2767500
5737500
8707500
Capacity cost reduction
7736295
11604442
11604442
15472589
15472589
19340737
19340737
23208884
GFT reduction
845561
660413
773705
527757
576669
709301
827386
851560
807636
944644
1055853
Program cost
20689324
22819634
22819634
22819634
22819634
22819634
22819634
22819634
22819634
22819634
22819634
Recovery through base rates
14405492
14639186
14799075
14977916
15183688
15416391
15650684
15878624
16115254
16352636
16645725
Cash flow
-6796409
-9374854
-10352249
-15745285
-15783359
-19859404
-20024486
-23954952
-24247459
-28323022
-28355080
-21195738994
Capacity cost Build option
Reduced capacity requirement (kW)
46125
95625
145125
194625
243000
292500
339750
385875
430875
477000
523125
Capacity added
200
300
300
400
400
500
500
600
Annual capacity cost
$386814737
$7736295
$11604442
$11604442
$15472589
$15472589
$19340737
$19340737
$23208884
Capacity cost Buy option
Reduced capacity requirement (kW)
46125
95625
145125
194625
243000
292500
339750
385875
430875
477000
523125
Capacity added
200
250
300
350
400
450
500
550
Annual capacity cost
$600000000
$12000000
$15000000
$18000000
$21000000
$24000000
$27000000
$30000000
$33000000
1994
2004
2005
2006
2007
2008
2009
2010
2011
2012
2013
2014
2015
Net MWh to system
7659242
10855000
11388814
11573570
11699976
11841366
12004047
12188019
12373248
12553455
12740532
12928203
13159916
Revenue multiplier
100
142
149
151
153
155
157
159
162
164
166
169
172
Revenue allocated to DSM
9688028
13730281
14405492
14639186
14799075
14977916
15183688
15416391
15650684
15878624
16115254
16352636
16645725
CentskWh in rates for DSM
0134
0134
0134
0134
0134
0134
0134
0133
0133
0133
0133
0133
Annual sales (MWh)
10262000
10776303
10954134
11076488
11213088
11369667
11546488
11724454
11897588
12077216
12256861
12476492
2006
2006
2007
2007
2008
2008
2009
2009
2010
2010
2011
2011
2012
2012
2013
2013
2014
2014
2015
2015
2005
2005
2005
2006
2006
2006
2007
2007
2007
2008
2008
2008
2009
2009
2009
2010
2010
2010
2011
2011
2011
2012
2012
2012
2013
2013
2013
2014
2014
2014
2015
2015
2015
2005
2006
2007
2008
2009
2010
2011
2012
2013
2014
2015
Base Revenue Reduction
$ (4125638)
$ (7592320)
$ (11812895)
$ (16167619)
$ (20328524)
$ (24769904)
$ (29155510)
$ (33338091)
$ (37691451)
$ (42141405)
$ (46445908)
Fuel Revenue Reduction
$ (5166240)
$ (8956848)
$ (13238528)
$ (26683328)
$ (31859440)
$ (38212576)
$ (45919120)
$ (54094336)
$ (61616096)
$ (70546848)
$ (80845120)
Fuel Cost Reduction
$ 5166240
$ 8956848
$ 13238528
$ 26683328
$ 31859440
$ 38212576
$ 45919120
$ 54094336
$ 61616096
$ 70546848
$ 80845120
Potential off-system sales margins
$ 2767500
$ 5737500
$ 8707500
$ - 0
$ - 0
$ - 0
$ - 0
$ - 0
$ - 0
$ - 0
$ - 0
Net program costs
$ (5438271)
$ (7520034)
$ (7246854)
$ (7313961)
$ (7059277)
$ (6693942)
$ (6341565)
$ (6089451)
$ (5896744)
$ (5522354)
$ (5118057)
AEs net cash impact
$ (6796409)
$ (9374854)
$ (10352249)
$ (23481580)
$ (27387801)
$ (31463846)
$ (35497075)
$ (39427542)
$ (43588195)
$ (47663759)
$ (51563965)
Customer savings
$ (9291878)
$ (16549168)
$ (25051423)
$ (42850947)
$ (52187964)
$ (62982480)
$ (75074630)
$ (87432427)
$ (99307547)
$ (112688253)
$ (127291028)
Estimated Annual Impact
Base Revenue Reduction
$ (16134252)
Fuel Revenue Reduction
$ (23790144)
Fuel Cost Reduction
$ 23790144
Potential off-system sales margins
$ 2889000
Net program costs
$ (7166814)
AEs net cash impact
$ (20412066)
Customer savings
$ (39924396)
CURRENT FORECAST
PROPOSED PROJECTION
DSM Analysis
2007
2008
2007
2008
keyed in to round
Base Revenue Reduction
(12000000)
(16000000)
(12000000)
(16000000)
Fuel Revenue Reduction
(13000000)
(15000000)
(5000000)
(7000000)
Fuel Cost Reduction
13000000
15000000
5000000
7000000
KW
$KW
NET
5 profit
Potential off-system capacity sales
9000000
9000000
6207
$KW
145000
$ 62
$ 8990000
Net of fuel and GFT
$ 449500
Fuel Revenue Increase-Capacity
12000000
12000000
6154
$KW
195000
$ 62
$ 12090000
Fuel Cost Increase-Capacity
(12000000)
(12000000)
TCOS expense reduction
900000
1000000
900000
1000000
GFT reduction
2000000
3000000
2000000
3000000
Program cost
(23000000)
(23000000)
Recovery through base rates
15000000
15000000
AEs net income impact
(8100000)
(20000000)
(100000)
(12000000)
Deferred Cost of Capacity
12000000
12000000
AEs net cash impact
(8100000)
(8000000)
(100000)
- 0
Customer savings-(net)
$ (25000000)
$ (31000000)
$ (17000000)
$ (35000000)
Outline for Oct 10 Leadership Team Update
1 Components of BenefitCost Ratios
2 Cash Flow of DSM
CURRENT FORECAST
PROPOSED PROJECTION
DSM Analysis
2007
2008
2007
2008
Base Revenue Reduction
(11812895)
(16167619)
(11812895)
(16167619)
Fuel Revenue Reduction
(13238528)
(14683328)
(5217969)
(5396810)
Fuel Cost Reduction
13238528
14683328
5217969
5396810
Potential off-system sales margins
8707500
8707500
Fuel Revenue Increase-Capacity
12000000
12000000
Fuel Cost Increase-Capacity
(12000000)
(12000000)
TCOS expense reduction
925987
977987
925987
977987
GFT reduction
2279680
2807436
2279680
2807436
Program cost
(22819634)
(22819634)
Recovery through base rates
14799075
14977916
AEs net income impact
(7920288)
(20223914)
100271
(12382196)
Deferred Cost of Capacity
12000000
12000000
AEs net cash impact including deferral
(7920288)
(8223914)
100271
(382196)
Customer savings-(net)
$ (25051423)
$ (30850947)
$ (17030864)
$ (33564429)
Recommend recovery thru fuel factor
Offset customer fuel savings due to DSM
Would not offset revenue loss
(before amp after)
In 2007 we still have excess capacity
Cost recovery
3yrs - recommended purch power
power is only needed during peak-dont utilize a plant
need declines as renewables increases
cash flow
Dynamic pricing-TOU rates motivating cust to conserve energy
would replace some of the energy efficiency rebates
option to self-generate
TCOS expense reduction due to DSM savings
Historical
Historical
Historical
Historical
Historical
Preliminary
Forecast
Forecast
Forecast
Forecast
Forecast
Forecast
Forecast
Forecast
Forecast
Forecast
2000
2001
2002
2003
2004
2005
2006
2007
2008
2009
2010
2011
2012
2013
2014
2015
ERCOT Postage Stamp Rate
1476
1528
1661
1778
1925
2055
2185
2315
2445
2575
2705
2835
2965
3095
3225
3355
Estimated DSM-kW savings applied to average 4CP
40000
40000
40000
40000
40000
40000
40000
40000
40000
40000
40000
Reduction to TCOS expense
$ 821987
$ 873987
$ 925987
$ 977987
$ 1029987
$ 1081987
$ 1133987
$ 1185987
$ 1237987
$ 1289987
$ 1341987
Chart1
Fuel Cost Reduction
Capacity Expense Reduction
Total Decrease In Expenses
REDUCTION IN EXPENSES DUE TO DSM PROGRAMS
5166240
5166240
8956848
8956848
13238528
13238528
14683328
26360828
11677500
16859440
31439440
14580000
20212576
37762576
17550000
24919120
45304120
20385000
30094336
53246836
23152500
34616096
60468596
25852500
40546848
69166848
28620000
47845120
79232620
31387500
Chart4
Fuel Cost without DSM
Fuel Cost with DSM
00233611231
00238400717
00226232559
00233069306
00220985648
00237472342
00217888198
00236848698
00215229268
00237472426
00216083296
00242335075
00224259386
00254383594
00226073357
00259502528
00240455083
00277315347
00255904506
00296726494
Sheet1
Sheet3
Saving Energy TogetherPower SaverTM Program
DSM Analysis 2007 2008
Base Revenue Reduction (12000000) (16000000) Fuel Revenue Reduction (13000000) (15000000)
AEs Net Income Impact (8100000) (20000000) Deferred Cost of Capacity 12000000 AEs Net Cash Impact (8100000) (8000000)
CURRENT FORECAST
Cash Flow Projection of DSM
Cash flow chart
Chart1
Fuel Cost Reduction
Capacity Expense Reduction
Total Decrease In Expenses
REDUCTION IN EXPENSES DUE TO DSM PROGRAMS
5166240
5166240
8956848
8956848
13238528
13238528
14683328
26360828
11677500
16859440
31439440
14580000
20212576
37762576
17550000
24919120
45304120
20385000
30094336
53246836
23152500
34616096
60468596
25852500
40546848
69166848
28620000
47845120
79232620
31387500
Chart4
Fuel Cost without DSM
Fuel Cost with DSM
REDUCTION IN FUEL COST DUE TO DSM PROGRAMS
00233611231
00238400717
00226232559
00233069306
00220985648
00237472342
00217888198
00236848698
00215229268
00237472426
00216083296
00242335075
00224259386
00254383594
00226073357
00259502528
00240455083
00277315347
00255904506
00296726494
Sheet1
Sheet3
Saving Energy TogetherPower SaverTM Program
Questions
Saving Energy TogetherPower SaverTM Program
FY 2006 Achievements
Energy SavingsMW of
Programs Saved Goal Goal
Residential 126 115 110
Commercial 154 121 127
Demand Response 146 156 94
Solar 055 060 93
Grand Total 432 398 108
Saving Energy TogetherPower SaverTM Program
MW SavedPrograms FY2005 FY2006
Residential 119 126
Commercial 153 154
Demand Response 116 146
Solar 06 055
Grand Total 394 432
Energy Savings ComparisonFY2005 to FY2006
Saving Energy TogetherPower SaverTM Program
DSM Summary
bull DSM programs are saving peak kW amp kWh
bull Cost-effectiveness analyses include full program costs
bull DSM goals and budgets should vary to support AE resource plan requirements
Saving Energy TogetherPower SaverTM Program
Free Home WeatherizationEnergy Improvementsbull Insulate Atticsbull Duct Sealingbull Install CFLsbull Solar Screensbull Caulking and Weather-strippingbull Free Smoke amp Carbon Monoxide Detector bull Minor Energy Related Repairs
Saving Energy TogetherPower SaverTM Program
Power Saver Program
bull FREE Energy Saving Productsbull Lower energy costsbull 65000 installed in homes apartmentsbull 4000 installed in commercial buildings
Saving Energy TogetherPower SaverTM Program
Energy Conservation in COA FacilitiesSenate Bill 5 Energy Use vs Energy Cost
295
300
305
310
315
320
325
330
335
340
345
350
Base Year2001
2002 2003 2004 2005 2006
Gig
awat
t-hou
rs
220
230
240
250
260
270
280
290
300
Mill
ion
Dol
lars
Million kWh Cost
Chart1
Million kWh
Cost
Gigawatt-hours
Million Dollars
Senate Bill 5 Energy Use vs Energy Cost
343667472
28619895
33757683
2504536
3260767692
24602549
31773020962
26778741
324036807
2745756918
313494864
2936354518
Sheet1
Sheet1
ampA
Page ampP
Million kWh
Gigawatt-hours
Senate Bill 5 Reported Energy Use
Sheet2
ampA
Page ampP
Million kWh
Cost
Gigawatt-hours
Million Dollars
Senate Bill 5 Energy Use vs Energy Cost
Sheet3
Energy Efficiency Real Reliable and Cost-Effective Alternative
Fuel cost savings assume all saved energy at average gas generation cost
Increased off-system sales margins assumes reduced demand plus associated reserve requirements could be sold for $15kWmonth (after 2007 this is an avoided capacity expense)
Fuel Factor expense increase is increased fuel expense plus purchased capacity cost
GFT reduction is base revenue and fuel cost reductions times 91
Base revenue wDSM
552961968
562415810
569170954
576627290
585065115
594497922
604045383
613657938
623249716
632762255
644233714
Base revenue wo DSM
557087606
570008130
580983849
592794909
605393639
619267826
633200893
646996029
660941168
674903660
690679622
kWh sales wDSM
10776303000
10954134000
11076488000
11213088000
11369667000
11546488000
11724454000
11897588000
12077216000
12256861000
12476492000
kWh sales wo DSM
10861087000
11109639000
11319110000
11544588000
11787201000
12054717000
12323440000
12582205000
12851412000
13121980000
13429845000
1000
kW sales wDSM
2435000
2442000
2443000
2471000
2477000
2486000
2486000
2490000
2515000
2535000
2539000
kW sales wo DSM
2476000
2527000
2572000
2644000
2693000
2746000
2788000
2833000
2898000
2959000
3004000
Fuel Forecast
Budget 2006 (3905)
Tot-2006
Tot-2007
Tot-2008
Tot-2009
Tot-2010
Tot-2011
Tot-2012
Tot-2013
Tot-2014
Tot-2015
Total
MWH
STP
3303339
3488217
3514415
3360759
3465191
3507755
3405921
3614690
3482746
3515635
34658668
FPP
4564135
4517773
4465943
4451812
4418334
4545733
4554494
4586879
4445603
4245674
44796380
Decker
2839387
511212
504648
615748
583574
563845
570235
550098
594337
757598
8090682
Holly
235228
28425
- 0
- 0
- 0
- 0
- 0
- 0
- 0
263653
Sand Hill CC
1533962
1538343
1565132
1615597
1553452
1600111
1516183
1666799
1687122
14276700
SH GT
465155
427320
523864
450359
458722
498276
432337
492003
574949
4322986
Decker GT
157126
216800
280985
238803
246172
264900
238141
266139
294200
2203267
Existing DG
17340
7248
7296
7065
7216
7268
7168
7137
7147
16838
91723
Future DG
110
110
101
2216
2659
4743
5273
7365
7750
17746
48073
PurchasePower
131996
- 0
204000
208800
206400
206400
134400
201600
136000
139200
1568796
Landfill Methane
87493
92450
92704
92450
92450
92450
92704
92450
92450
92450
920052
Future Bioenergy
- 0
- 0
134151
178705
384764
454206
673445
744600
978509
1057336
4605716
Wind
636291
669050
671181
669050
669050
669050
671181
669050
669050
669050
6662004
Solar
684
20026
32685
41438
50311
59183
68298
76929
85801
87839
523193
Shortfall Energy
3308
2419
3355
6021
3311
4269
7050
3075
3868
4281
40957
11584082
11699976
11841366
12004048
12188020
12373249
12553456
12740532
12928204
13159918
123072851
(10512)
(1)
(1)
0
0
(0)
1
1
(0)
0
(10505)
Dollars
STP
14024307
16411783
18054617
17815007
18997196
19874461
19872833
21713134
21541492
22417754
190722584
FPP
47959978
48327184
52942730
56530034
57287196
60262126
61527986
62666810
62927556
61809806
572241406
Decker
161242451
30007075
26150797
28534975
26297430
25902979
27510734
27253106
30904024
41053837
424857407
Holly
15649395
1939153
- 0
- 0
- 0
- 0
- 0
- 0
- 0
17588548
Sand Hill CC
71819840
62147912
53829988
54696364
53773560
56880544
56723452
64324432
66378796
540574888
SH GT
28915407
23018682
25201605
20614580
21546020
24873781
22042049
25993318
31798432
224003872
Decker GT
12129491
14068039
16315347
13248144
14062711
15831205
14654486
17002591
19718490
137030504
Existing DG
1066126
482134
392821
350785
361063
372817
379318
391499
407877
1055934
5260373
Future DG
5688
5352
3321
115774
140956
247241
281454
413559
455875
1154808
2824028
PurchasePower
5000000
- 0
17339160
16429042
16415314
16614357
11144008
17017280
11632503
11967200
123558864
Landfill Methane
3535734
3653844
3663855
3653844
3653844
3653844
3663855
3653844
3653844
3653844
36440353
Future Bioenergy
- 0
- 0
6036769
8041681
17314398
20439270
30305016
33507000
44032792
47579944
207256869
Wind
17374835
18256537
18314921
18256537
18256537
18256537
18314921
18256537
18256537
18256537
181800436
Solar
- 0
- 0
- 0
- 0
- 0
- 0
- 0
- 0
- 0
- 0
- 0
Shortfall Energy
248086
181420
251636
451599
248349
320172
528742
230590
290120
321058
3071771
250457205
245839462
244324412
245526217
247531370
255326093
271114397
278523346
301422961
327166440
2667231902
1792964
10
(12)
6
(1)
10
(27)
4
3
(6)
1793341
Gas MWh
2839387
2902683
2715536
2985730
2888333
2822192
2933522
2736759
3019278
3313869
29157288
Gas cost ($)
161242451
158521208
127324584
123881915
114856517
115285269
125096264
120673092
138224364
158949555
1344055218
Avg gas gen Cost ($MWh)
5679
5461
4689
4149
3977
4085
4264
4409
4578
4796
4610
NO DSM FUEL FACTOR
2006
2007
2008
2009
2010
2011
2012
2013
2014
2015
Thermal Unit Fuel Cost
232662512
236980848
213398064
215549344
211851680
220956944
237247920
240469984
264099856
293228672
Shortfall Purchases
248086
181420
251636
451599
248349
320172
528742
230590
290120
321058
Short-Term Power Purchases
5000000
- 0
29016660
31009042
33965314
36999357
34296508
42869780
40252503
43354700
Fuel Cell Gas Cost
119837
119837
119837
119837
119837
119837
119837
119837
119837
119837
Recoverable ERCOT Expenses
16825273
16825273
16825273
16825273
16825273
16825273
16825273
16825273
16825273
16825273
Fuel Factor Renewables
9998882
9706333
14540565
15223226
23255836
23418594
31052373
32981926
42305054
44649542
Total Fuel Factor Revenue
264854590
263813711
274152035
279178321
286266289
298640176
320070653
333497390
363892643
398499082
Total Renewables
20910569
21910381
28015544
29952062
39224779
42349651
52283792
55417381
65943173
69490325
TotThermal+PurchPwr+Renewables
249864319
245834121
244321076
245522607
247527546
255322004
271110126
278519139
301418805
327162135
Estimated Green Choice Sales
10911686
12204048
13474979
14728836
15968943
18931058
21231418
22435455
23638119
24840783
Fuel Factor Renewables
9998882
9706333
14540565
15223226
23255836
23418594
31052373
32981926
42305054
44649542
Forecast Annual GWh Sales
11110
11319
11545
11787
12055
12323
12582
12851
13122
13430
Average cost per kWh
$ 0023840
$ 0023307
$ 0023747
$ 0023685
$ 0023747
$ 0024234
$ 0025438
$ 0025950
$ 0027732
$ 0029673
Fuel Factors
Secondary
$ 0023475
$ 0022733
$ 0022206
$ 0021895
$ 0021627
$ 0021713
$ 0022535
$ 0022717
$ 0024162
$ 0025715
Primary
$ 0022776
$ 0022056
$ 0021545
$ 0021243
$ 0020984
$ 0021067
$ 0021864
$ 0022041
$ 0023443
$ 0024949
Transmission
$ 0022539
$ 0021828
$ 0021321
$ 0021022
$ 0020766
$ 0020848
$ 0021637
$ 0021812
$ 0023200
$ 0024690
2006
2007
2008
2009
2010
2011
2012
2013
2014
2015
Dag generation
11574
11700
11841
12004
12188
12373
12553
12741
12928
13160
Joe generation
11584
11700
11841
12004
12188
12373
12553
12741
12928
13160
difference
(10)
0
(0)
(0)
(0)
(0)
(0)
0
(0)
0
sales
10954
11076
11213
11370
11546
11724
11898
12077
12257
12476
losses
57
56
56
56
56
55
55
55
55
55
With DSM
Thermal Unit Fuel Cost wDSM
223705664
223742320
198714736
198689904
191639104
196037824
207153584
205853888
223553008
245383552
Short-Term Power Purchases
5000000
- 0
17339160
16429042
16415314
16614357
11144008
17017280
11632503
11967200
Average cost per kWh
$ 0023361
$ 0022623
$ 0022099
$ 0021789
$ 0021523
$ 0021608
$ 0022426
$ 0022607
$ 0024046
$ 0025590
Forecast Annual GWh Sales
10954
11076
11213
11370
11546
11724
11898
12077
12257
12476
255897742
250575183
247791207
247738881
248503713
253336056
266823817
273028794
294725795
319266462
CASH FLOW PURCHASE OPTION
2005
2006
2007
2008
2009
2010
2011
2012
2013
2014
2015
Base revenue reduction
4125638
7592320
11812895
16167619
20328524
24769904
29155510
33338091
37691451
42141405
46445908
Fuel cost reduction
5166240
8956848
13238528
14683328
16859440
20212576
24919120
30094336
34616096
40546848
47845120
Potential off-system sales margins
2767500
5737500
8707500
Capacity cost reduction
12000000
15000000
18000000
21000000
24000000
27000000
30000000
33000000
GFT reduction
845561
660413
773705
527757
576669
709301
827386
851560
807636
944644
1055853
845560920627699
Program cost
20689324
22819634
22819634
22819634
22819634
22819634
22819634
22819634
22819634
22819634
22819634
Recovery through base rates
14405492
14639186
14799075
14977916
15183688
15416391
15650684
15878624
16115254
16352636
16645725
Cash flow
-6796409
-9374854
-10352249
-23481580
-27387801
-31463846
-35497075
-39427542
-43588195
-47663759
-51563965
2005
2006
2007
2008
2009
2010
2011
2012
2013
2014
2015
Base Revenue Reduction
$ (4125638)
$ (7592320)
$ (11812895)
$ (16167619)
$ (20328524)
$ (24769904)
$ (29155510)
$ (33338091)
$ (37691451)
$ (42141405)
$ (46445908)
Fuel Revenue Reduction
$ (5166240)
$ (8956848)
$ (13238528)
$ (26683328)
$ (31859440)
$ (38212576)
$ (45919120)
$ (54094336)
$ (61616096)
$ (70546848)
$ (80845120)
Fuel Cost Reduction
$ 5166240
$ 8956848
$ 13238528
$ 26683328
$ 31859440
$ 38212576
$ 45919120
$ 54094336
$ 61616096
$ 70546848
$ 80845120
Potential off-system sales margins
$ 2767500
$ 5737500
$ 8707500
$ - 0
$ - 0
$ - 0
$ - 0
$ - 0
$ - 0
$ - 0
$ - 0
Net program costs
$ (5438271)
$ (7520034)
$ (7246854)
$ (7313961)
$ (7059277)
$ (6693942)
$ (6341565)
$ (6089451)
$ (5896744)
$ (5522354)
$ (5118057)
AEs net cash impact
$ (6796409)
$ (9374854)
$ (10352249)
$ (23481580)
$ (27387801)
$ (31463846)
$ (35497075)
$ (39427542)
$ (43588195)
$ (47663759)
$ (51563965)
Customer savings
$ 9291878
$ 16549168
$ 25051423
$ 42850947
$ 52187964
$ 62982480
$ 75074630
$ 87432427
$ 99307547
$ 112688253
$ 127291028
CASH FLOW BUILD OPTION
2005
2006
2007
2008
2009
2010
2011
2012
2013
2014
2015
Base revenue reduction
4125638
7592320
11812895
16167619
20328524
24769904
29155510
33338091
37691451
42141405
46445908
Fuel cost reduction
5166240
8956848
13238528
14683328
16859440
20212576
24919120
30094336
34616096
40546848
47845120
Potential off-system sales margins
2767500
5737500
8707500
Capacity cost reduction
7736295
11604442
11604442
15472589
15472589
19340737
19340737
23208884
GFT reduction
845561
660413
773705
527757
576669
709301
827386
851560
807636
944644
1055853
Program cost
20689324
22819634
22819634
22819634
22819634
22819634
22819634
22819634
22819634
22819634
22819634
Recovery through base rates
14405492
14639186
14799075
14977916
15183688
15416391
15650684
15878624
16115254
16352636
16645725
Cash flow
-6796409
-9374854
-10352249
-15745285
-15783359
-19859404
-20024486
-23954952
-24247459
-28323022
-28355080
-21195738994
Capacity cost Build option
Reduced capacity requirement (kW)
46125
95625
145125
194625
243000
292500
339750
385875
430875
477000
523125
Capacity added
200
300
300
400
400
500
500
600
Annual capacity cost
$386814737
$7736295
$11604442
$11604442
$15472589
$15472589
$19340737
$19340737
$23208884
Capacity cost Buy option
Reduced capacity requirement (kW)
46125
95625
145125
194625
243000
292500
339750
385875
430875
477000
523125
Capacity added
200
250
300
350
400
450
500
550
Annual capacity cost
$600000000
$12000000
$15000000
$18000000
$21000000
$24000000
$27000000
$30000000
$33000000
1994
2004
2005
2006
2007
2008
2009
2010
2011
2012
2013
2014
2015
Net MWh to system
7659242
10855000
11388814
11573570
11699976
11841366
12004047
12188019
12373248
12553455
12740532
12928203
13159916
Revenue multiplier
100
142
149
151
153
155
157
159
162
164
166
169
172
Revenue allocated to DSM
9688028
13730281
14405492
14639186
14799075
14977916
15183688
15416391
15650684
15878624
16115254
16352636
16645725
CentskWh in rates for DSM
0134
0134
0134
0134
0134
0134
0134
0133
0133
0133
0133
0133
Annual sales (MWh)
10262000
10776303
10954134
11076488
11213088
11369667
11546488
11724454
11897588
12077216
12256861
12476492
2006
2006
2007
2007
2008
2008
2009
2009
2010
2010
2011
2011
2012
2012
2013
2013
2014
2014
2015
2015
2005
2005
2005
2006
2006
2006
2007
2007
2007
2008
2008
2008
2009
2009
2009
2010
2010
2010
2011
2011
2011
2012
2012
2012
2013
2013
2013
2014
2014
2014
2015
2015
2015
2005
2006
2007
2008
2009
2010
2011
2012
2013
2014
2015
Base Revenue Reduction
$ (4125638)
$ (7592320)
$ (11812895)
$ (16167619)
$ (20328524)
$ (24769904)
$ (29155510)
$ (33338091)
$ (37691451)
$ (42141405)
$ (46445908)
Fuel Revenue Reduction
$ (5166240)
$ (8956848)
$ (13238528)
$ (26683328)
$ (31859440)
$ (38212576)
$ (45919120)
$ (54094336)
$ (61616096)
$ (70546848)
$ (80845120)
Fuel Cost Reduction
$ 5166240
$ 8956848
$ 13238528
$ 26683328
$ 31859440
$ 38212576
$ 45919120
$ 54094336
$ 61616096
$ 70546848
$ 80845120
Potential off-system sales margins
$ 2767500
$ 5737500
$ 8707500
$ - 0
$ - 0
$ - 0
$ - 0
$ - 0
$ - 0
$ - 0
$ - 0
Net program costs
$ (5438271)
$ (7520034)
$ (7246854)
$ (7313961)
$ (7059277)
$ (6693942)
$ (6341565)
$ (6089451)
$ (5896744)
$ (5522354)
$ (5118057)
AEs net cash impact
$ (6796409)
$ (9374854)
$ (10352249)
$ (23481580)
$ (27387801)
$ (31463846)
$ (35497075)
$ (39427542)
$ (43588195)
$ (47663759)
$ (51563965)
Customer savings
$ (9291878)
$ (16549168)
$ (25051423)
$ (42850947)
$ (52187964)
$ (62982480)
$ (75074630)
$ (87432427)
$ (99307547)
$ (112688253)
$ (127291028)
Estimated Annual Impact
Base Revenue Reduction
$ (16134252)
Fuel Revenue Reduction
$ (23790144)
Fuel Cost Reduction
$ 23790144
Potential off-system sales margins
$ 2889000
Net program costs
$ (7166814)
AEs net cash impact
$ (20412066)
Customer savings
$ (39924396)
CURRENT FORECAST
PROPOSED PROJECTION
DSM Analysis
2007
2008
2007
2008
keyed in to round
Base Revenue Reduction
(12000000)
(16000000)
(12000000)
(16000000)
Fuel Revenue Reduction
(13000000)
(15000000)
(5000000)
(7000000)
Customer Savings (Bill Reduction)
(25000000)
(31000000)
(17000000)
(23000000)
Fuel Cost Reduction
13000000
15000000
5000000
7000000
KW
$KW
NET
5 profit
Potential Off-system Capacity Sales
9000000
9000000
6207
$KW
145000
$ 62
$ 8990000
Net of fuel and GFT
$ 449500
TCOS Expense Reduction
900000
1000000
900000
1000000
GFT Reduction
2000000
3000000
2000000
3000000
Program Cost
(23000000)
(23000000)
Recovery through Base Rates
15000000
15000000
AEs Net Income Impact
(8100000)
(20000000)
(17100000)
(35000000)
Deferred Cost of Capacity
12000000
- 0
AEs Net Cash Impact
(8100000)
(8000000)
(17100000)
- 0
Outline for Oct 10 Leadership Team Update
1 Components of BenefitCost Ratios
2 Cash Flow of DSM
CURRENT FORECAST
PROPOSED PROJECTION
DSM Analysis
2007
2008
2007
2008
Base Revenue Reduction
(11812895)
(16167619)
(11812895)
(16167619)
Fuel Revenue Reduction
(13238528)
(14683328)
(5217969)
(5396810)
Fuel Cost Reduction
13238528
14683328
5217969
5396810
Potential off-system sales margins
8707500
8707500
Fuel Revenue Increase-Capacity
12000000
12000000
Fuel Cost Increase-Capacity
(12000000)
(12000000)
TCOS expense reduction
925987
977987
925987
977987
GFT reduction
2279680
2807436
2279680
2807436
Program cost
(22819634)
(22819634)
Recovery through base rates
14799075
14977916
AEs net income impact
(7920288)
(20223914)
100271
(12382196)
Deferred Cost of Capacity
12000000
12000000
AEs net cash impact including deferral
(7920288)
(8223914)
100271
(382196)
Customer savings-(net)
$ (25051423)
$ (30850947)
$ (17030864)
$ (21564429)
Recommend recovery thru fuel factor
Offset customer fuel savings due to DSM
Would not offset revenue loss
(before amp after)
In 2007 we still have excess capacity
Cost recovery
3yrs - recommended purch power
power is only needed during peak-dont utilize a plant
need declines as renewables increases
cash flow
Dynamic pricing-TOU rates motivating cust to conserve energy
would replace some of the energy efficiency rebates
option to self-generate
TCOS expense reduction due to DSM savings
Historical
Historical
Historical
Historical
Historical
Preliminary
Forecast
Forecast
Forecast
Forecast
Forecast
Forecast
Forecast
Forecast
Forecast
Forecast
2000
2001
2002
2003
2004
2005
2006
2007
2008
2009
2010
2011
2012
2013
2014
2015
ERCOT Postage Stamp Rate
1476
1528
1661
1778
1925
2055
2185
2315
2445
2575
2705
2835
2965
3095
3225
3355
Estimated DSM-kW savings applied to average 4CP
40000
40000
40000
40000
40000
40000
40000
40000
40000
40000
40000
Reduction to TCOS expense
$ 821987
$ 873987
$ 925987
$ 977987
$ 1029987
$ 1081987
$ 1133987
$ 1185987
$ 1237987
$ 1289987
$ 1341987
2005
2006
2007
2008
2009
2010
2011
2012
2013
2014
2015
Base revenue reduction
4125638
7592320
11812895
16167619
20328524
24769904
29155510
33338091
37691451
42141405
46445908
kWh reduction
84784000
155505000
242622000
331500000
417534000
508229000
598986000
684617000
774196000
865119000
953353000
Fuel cost reduction
5166240
8956848
13238528
14683328
16859440
20212576
24919120
30094336
34616096
40546848
47845120
Demand reduction (kW)
41000
85000
129000
173000
216000
260000
302000
343000
383000
424000
465000
Reduced reserve requirement (kW)
5125
10625
16125
21625
27000
32500
37750
42875
47875
53000
58125
2008
2009
2010
2011
2012
2013
2014
2015
Reduced capacity requirement (kW)
46125
95625
145125
194625
243000
292500
339750
385875
430875
477000
523125
194625
243000
292500
339750
385875
430875
477000
523125
Increased off-system sales margins
2767500
5737500
8707500
Capacity cost reduction
11677500
14580000
17550000
20385000
23152500
25852500
28620000
31387500
Fuel Factor expense decrease ($)
5166240
8956848
13238528
26360828
31439440
37762576
45304120
53246836
60468596
69166848
79232620
Fuel Factor decrease (centskWh)
00005
00007
00016
00019
00022
00026
00030
00033
00037
00041
Fuel Factor decrease
2
3
7
9
10
12
13
15
15
16
GFT reduction
845561
1505974
2279680
2807436
3384105
4093406
4920791
5772351
6579987
7524631
8580484
Program cost
20689324
22819634
22819634
22819634
22819634
22819634
22819634
22819634
22819634
22819634
22819634
Recovery through base rates
14405492
14639186
14799075
14977916
15183688
15416391
15650684
15878624
16115254
16352636
16645725
Cash flow
-7641970
-10035268
-11125954
-12331837
-13384470
-14623147
-15939461
-17126601
-18543331
-19988403
-21232317
Fuel cost savings assume all saved energy at average gas generation cost
Increased off-system sales margins assumes reduced demand plus associated reserve requirements could be sold for $15kWmonth (after 2007 this is an avoided capacity expense)
Fuel Factor expense increase is increased fuel expense plus purchased capacity cost
GFT reduction is base revenue and fuel cost reductions times 91
Base revenue wDSM
552961968
562415810
569170954
576627290
585065115
594497922
604045383
613657938
623249716
632762255
644233714
Base revenue wo DSM
557087606
570008130
580983849
592794909
605393639
619267826
633200893
646996029
660941168
674903660
690679622
kWh sales wDSM
10776303000
10954134000
11076488000
11213088000
11369667000
11546488000
11724454000
11897588000
12077216000
12256861000
12476492000
kWh sales wo DSM
10861087000
11109639000
11319110000
11544588000
11787201000
12054717000
12323440000
12582205000
12851412000
13121980000
13429845000
1000
kW sales wDSM
2435000
2442000
2443000
2471000
2477000
2486000
2486000
2490000
2515000
2535000
2539000
kW sales wo DSM
2476000
2527000
2572000
2644000
2693000
2746000
2788000
2833000
2898000
2959000
3004000
Fuel Forecast
Budget 2006 (3905)
Tot-2006
Tot-2007
Tot-2008
Tot-2009
Tot-2010
Tot-2011
Tot-2012
Tot-2013
Tot-2014
Tot-2015
Total
MWH
STP
3303339
3488217
3514415
3360759
3465191
3507755
3405921
3614690
3482746
3515635
34658668
FPP
4564135
4517773
4465943
4451812
4418334
4545733
4554494
4586879
4445603
4245674
44796380
Decker
2839387
511212
504648
615748
583574
563845
570235
550098
594337
757598
8090682
Holly
235228
28425
- 0
- 0
- 0
- 0
- 0
- 0
- 0
263653
Sand Hill CC
1533962
1538343
1565132
1615597
1553452
1600111
1516183
1666799
1687122
14276700
SH GT
465155
427320
523864
450359
458722
498276
432337
492003
574949
4322986
Decker GT
157126
216800
280985
238803
246172
264900
238141
266139
294200
2203267
Existing DG
17340
7248
7296
7065
7216
7268
7168
7137
7147
16838
91723
Future DG
110
110
101
2216
2659
4743
5273
7365
7750
17746
48073
PurchasePower
131996
- 0
204000
208800
206400
206400
134400
201600
136000
139200
1568796
Landfill Methane
87493
92450
92704
92450
92450
92450
92704
92450
92450
92450
920052
Future Bioenergy
- 0
- 0
134151
178705
384764
454206
673445
744600
978509
1057336
4605716
Wind
636291
669050
671181
669050
669050
669050
671181
669050
669050
669050
6662004
Solar
684
20026
32685
41438
50311
59183
68298
76929
85801
87839
523193
Shortfall Energy
3308
2419
3355
6021
3311
4269
7050
3075
3868
4281
40957
11584082
11699976
11841366
12004048
12188020
12373249
12553456
12740532
12928204
13159918
123072851
(10512)
(1)
(1)
0
0
(0)
1
1
(0)
0
(10505)
Dollars
STP
14024307
16411783
18054617
17815007
18997196
19874461
19872833
21713134
21541492
22417754
190722584
FPP
47959978
48327184
52942730
56530034
57287196
60262126
61527986
62666810
62927556
61809806
572241406
Decker
161242451
30007075
26150797
28534975
26297430
25902979
27510734
27253106
30904024
41053837
424857407
Holly
15649395
1939153
- 0
- 0
- 0
- 0
- 0
- 0
- 0
17588548
Sand Hill CC
71819840
62147912
53829988
54696364
53773560
56880544
56723452
64324432
66378796
540574888
SH GT
28915407
23018682
25201605
20614580
21546020
24873781
22042049
25993318
31798432
224003872
Decker GT
12129491
14068039
16315347
13248144
14062711
15831205
14654486
17002591
19718490
137030504
Existing DG
1066126
482134
392821
350785
361063
372817
379318
391499
407877
1055934
5260373
Future DG
5688
5352
3321
115774
140956
247241
281454
413559
455875
1154808
2824028
PurchasePower
5000000
- 0
17339160
16429042
16415314
16614357
11144008
17017280
11632503
11967200
123558864
Landfill Methane
3535734
3653844
3663855
3653844
3653844
3653844
3663855
3653844
3653844
3653844
36440353
Future Bioenergy
- 0
- 0
6036769
8041681
17314398
20439270
30305016
33507000
44032792
47579944
207256869
Wind
17374835
18256537
18314921
18256537
18256537
18256537
18314921
18256537
18256537
18256537
181800436
Solar
- 0
- 0
- 0
- 0
- 0
- 0
- 0
- 0
- 0
- 0
- 0
Shortfall Energy
248086
181420
251636
451599
248349
320172
528742
230590
290120
321058
3071771
250457205
245839462
244324412
245526217
247531370
255326093
271114397
278523346
301422961
327166440
2667231902
1792964
10
(12)
6
(1)
10
(27)
4
3
(6)
1793341
Gas MWh
2839387
2902683
2715536
2985730
2888333
2822192
2933522
2736759
3019278
3313869
29157288
Gas cost ($)
161242451
158521208
127324584
123881915
114856517
115285269
125096264
120673092
138224364
158949555
1344055218
Avg gas gen Cost ($MWh)
5679
5461
4689
4149
3977
4085
4264
4409
4578
4796
4610
NO DSM FUEL FACTOR
2006
2007
2008
2009
2010
2011
2012
2013
2014
2015
Thermal Unit Fuel Cost
232662512
236980848
213398064
215549344
211851680
220956944
237247920
240469984
264099856
293228672
Shortfall Purchases
248086
181420
251636
451599
248349
320172
528742
230590
290120
321058
Short-Term Power Purchases
5000000
- 0
29016660
31009042
33965314
36999357
34296508
42869780
40252503
43354700
Fuel Cell Gas Cost
119837
119837
119837
119837
119837
119837
119837
119837
119837
119837
Recoverable ERCOT Expenses
16825273
16825273
16825273
16825273
16825273
16825273
16825273
16825273
16825273
16825273
Fuel Factor Renewables
9998882
9706333
14540565
15223226
23255836
23418594
31052373
32981926
42305054
44649542
Total Fuel Factor Revenue
264854590
263813711
274152035
279178321
286266289
298640176
320070653
333497390
363892643
398499082
Total Renewables
20910569
21910381
28015544
29952062
39224779
42349651
52283792
55417381
65943173
69490325
TotThermal+PurchPwr+Renewables
249864319
245834121
244321076
245522607
247527546
255322004
271110126
278519139
301418805
327162135
Estimated Green Choice Sales
10911686
12204048
13474979
14728836
15968943
18931058
21231418
22435455
23638119
24840783
Fuel Factor Renewables
9998882
9706333
14540565
15223226
23255836
23418594
31052373
32981926
42305054
44649542
Forecast Annual GWh Sales
11110
11319
11545
11787
12055
12323
12582
12851
13122
13430
Average cost per kWh
$ 0023840
$ 0023307
$ 0023747
$ 0023685
$ 0023747
$ 0024234
$ 0025438
$ 0025950
$ 0027732
$ 0029673
Fuel Factors
Secondary
$ 0023475
$ 0022733
$ 0022206
$ 0021895
$ 0021627
$ 0021713
$ 0022535
$ 0022717
$ 0024162
$ 0025715
Primary
$ 0022776
$ 0022056
$ 0021545
$ 0021243
$ 0020984
$ 0021067
$ 0021864
$ 0022041
$ 0023443
$ 0024949
Transmission
$ 0022539
$ 0021828
$ 0021321
$ 0021022
$ 0020766
$ 0020848
$ 0021637
$ 0021812
$ 0023200
$ 0024690
2006
2007
2008
2009
2010
2011
2012
2013
2014
2015
Dag generation
11574
11700
11841
12004
12188
12373
12553
12741
12928
13160
Joe generation
11584
11700
11841
12004
12188
12373
12553
12741
12928
13160
difference
(10)
0
(0)
(0)
(0)
(0)
(0)
0
(0)
0
sales
10954
11076
11213
11370
11546
11724
11898
12077
12257
12476
losses
57
56
56
56
56
55
55
55
55
55
With DSM
Thermal Unit Fuel Cost wDSM
223705664
223742320
198714736
198689904
191639104
196037824
207153584
205853888
223553008
245383552
Short-Term Power Purchases
5000000
- 0
17339160
16429042
16415314
16614357
11144008
17017280
11632503
11967200
Average cost per kWh
$ 0023361
$ 0022623
$ 0022099
$ 0021789
$ 0021523
$ 0021608
$ 0022426
$ 0022607
$ 0024046
$ 0025590
Forecast Annual GWh Sales
10954
11076
11213
11370
11546
11724
11898
12077
12257
12476
255897742
250575183
247791207
247738881
248503713
253336056
266823817
273028794
294725795
319266462
CASH FLOW PURCHASE OPTION
2005
2006
2007
2008
2009
2010
2011
2012
2013
2014
2015
Base revenue reduction
4125638
7592320
11812895
16167619
20328524
24769904
29155510
33338091
37691451
42141405
46445908
Fuel cost reduction
5166240
8956848
13238528
14683328
16859440
20212576
24919120
30094336
34616096
40546848
47845120
Potential off-system sales margins
2767500
5737500
8707500
Capacity cost reduction
12000000
15000000
18000000
21000000
24000000
27000000
30000000
33000000
GFT reduction
845561
660413
773705
527757
576669
709301
827386
851560
807636
944644
1055853
845560920627699
Program cost
20689324
22819634
22819634
22819634
22819634
22819634
22819634
22819634
22819634
22819634
22819634
Recovery through base rates
14405492
14639186
14799075
14977916
15183688
15416391
15650684
15878624
16115254
16352636
16645725
Cash flow
-6796409
-9374854
-10352249
-23481580
-27387801
-31463846
-35497075
-39427542
-43588195
-47663759
-51563965
2005
2006
2007
2008
2009
2010
2011
2012
2013
2014
2015
Base Revenue Reduction
$ (4125638)
$ (7592320)
$ (11812895)
$ (16167619)
$ (20328524)
$ (24769904)
$ (29155510)
$ (33338091)
$ (37691451)
$ (42141405)
$ (46445908)
Fuel Revenue Reduction
$ (5166240)
$ (8956848)
$ (13238528)
$ (26683328)
$ (31859440)
$ (38212576)
$ (45919120)
$ (54094336)
$ (61616096)
$ (70546848)
$ (80845120)
Fuel Cost Reduction
$ 5166240
$ 8956848
$ 13238528
$ 26683328
$ 31859440
$ 38212576
$ 45919120
$ 54094336
$ 61616096
$ 70546848
$ 80845120
Potential off-system sales margins
$ 2767500
$ 5737500
$ 8707500
$ - 0
$ - 0
$ - 0
$ - 0
$ - 0
$ - 0
$ - 0
$ - 0
Net program costs
$ (5438271)
$ (7520034)
$ (7246854)
$ (7313961)
$ (7059277)
$ (6693942)
$ (6341565)
$ (6089451)
$ (5896744)
$ (5522354)
$ (5118057)
AEs net cash impact
$ (6796409)
$ (9374854)
$ (10352249)
$ (23481580)
$ (27387801)
$ (31463846)
$ (35497075)
$ (39427542)
$ (43588195)
$ (47663759)
$ (51563965)
Customer savings
$ 9291878
$ 16549168
$ 25051423
$ 42850947
$ 52187964
$ 62982480
$ 75074630
$ 87432427
$ 99307547
$ 112688253
$ 127291028
CASH FLOW BUILD OPTION
2005
2006
2007
2008
2009
2010
2011
2012
2013
2014
2015
Base revenue reduction
4125638
7592320
11812895
16167619
20328524
24769904
29155510
33338091
37691451
42141405
46445908
Fuel cost reduction
5166240
8956848
13238528
14683328
16859440
20212576
24919120
30094336
34616096
40546848
47845120
Potential off-system sales margins
2767500
5737500
8707500
Capacity cost reduction
7736295
11604442
11604442
15472589
15472589
19340737
19340737
23208884
GFT reduction
845561
660413
773705
527757
576669
709301
827386
851560
807636
944644
1055853
Program cost
20689324
22819634
22819634
22819634
22819634
22819634
22819634
22819634
22819634
22819634
22819634
Recovery through base rates
14405492
14639186
14799075
14977916
15183688
15416391
15650684
15878624
16115254
16352636
16645725
Cash flow
-6796409
-9374854
-10352249
-15745285
-15783359
-19859404
-20024486
-23954952
-24247459
-28323022
-28355080
-21195738994
Capacity cost Build option
Reduced capacity requirement (kW)
46125
95625
145125
194625
243000
292500
339750
385875
430875
477000
523125
Capacity added
200
300
300
400
400
500
500
600
Annual capacity cost
$386814737
$7736295
$11604442
$11604442
$15472589
$15472589
$19340737
$19340737
$23208884
Capacity cost Buy option
Reduced capacity requirement (kW)
46125
95625
145125
194625
243000
292500
339750
385875
430875
477000
523125
Capacity added
200
250
300
350
400
450
500
550
Annual capacity cost
$600000000
$12000000
$15000000
$18000000
$21000000
$24000000
$27000000
$30000000
$33000000
1994
2004
2005
2006
2007
2008
2009
2010
2011
2012
2013
2014
2015
Net MWh to system
7659242
10855000
11388814
11573570
11699976
11841366
12004047
12188019
12373248
12553455
12740532
12928203
13159916
Revenue multiplier
100
142
149
151
153
155
157
159
162
164
166
169
172
Revenue allocated to DSM
9688028
13730281
14405492
14639186
14799075
14977916
15183688
15416391
15650684
15878624
16115254
16352636
16645725
CentskWh in rates for DSM
0134
0134
0134
0134
0134
0134
0134
0133
0133
0133
0133
0133
Annual sales (MWh)
10262000
10776303
10954134
11076488
11213088
11369667
11546488
11724454
11897588
12077216
12256861
12476492
2006
2006
2007
2007
2008
2008
2009
2009
2010
2010
2011
2011
2012
2012
2013
2013
2014
2014
2015
2015
2005
2005
2005
2006
2006
2006
2007
2007
2007
2008
2008
2008
2009
2009
2009
2010
2010
2010
2011
2011
2011
2012
2012
2012
2013
2013
2013
2014
2014
2014
2015
2015
2015
Chart4
Fuel Cost without DSM
Fuel Cost with DSM
00233611231
00238400717
00226232559
00233069306
00220985648
00237472342
00217888198
00236848698
00215229268
00237472426
00216083296
00242335075
00224259386
00254383594
00226073357
00259502528
00240455083
00277315347
00255904506
00296726494
Sheet1
Sheet3
Saving Energy TogetherPower SaverTM Program
DSM Analysis 2007 2008
Base Revenue Reduction (12000000) (16000000) Fuel Revenue Reduction (13000000) (15000000)
AEs Net Income Impact (8100000) (20000000) Deferred Cost of Capacity 12000000 AEs Net Cash Impact (8100000) (8000000)
CURRENT FORECAST
Cash Flow Projection of DSM
Cash flow chart
Chart1
Fuel Cost Reduction
Capacity Expense Reduction
Total Decrease In Expenses
REDUCTION IN EXPENSES DUE TO DSM PROGRAMS
5166240
5166240
8956848
8956848
13238528
13238528
14683328
26360828
11677500
16859440
31439440
14580000
20212576
37762576
17550000
24919120
45304120
20385000
30094336
53246836
23152500
34616096
60468596
25852500
40546848
69166848
28620000
47845120
79232620
31387500
Chart4
Fuel Cost without DSM
Fuel Cost with DSM
REDUCTION IN FUEL COST DUE TO DSM PROGRAMS
00233611231
00238400717
00226232559
00233069306
00220985648
00237472342
00217888198
00236848698
00215229268
00237472426
00216083296
00242335075
00224259386
00254383594
00226073357
00259502528
00240455083
00277315347
00255904506
00296726494
Sheet1
Sheet3
Saving Energy TogetherPower SaverTM Program
Questions
Saving Energy TogetherPower SaverTM Program
FY 2006 Achievements
Energy SavingsMW of
Programs Saved Goal Goal
Residential 126 115 110
Commercial 154 121 127
Demand Response 146 156 94
Solar 055 060 93
Grand Total 432 398 108
Saving Energy TogetherPower SaverTM Program
MW SavedPrograms FY2005 FY2006
Residential 119 126
Commercial 153 154
Demand Response 116 146
Solar 06 055
Grand Total 394 432
Energy Savings ComparisonFY2005 to FY2006
Saving Energy TogetherPower SaverTM Program
DSM Summary
bull DSM programs are saving peak kW amp kWh
bull Cost-effectiveness analyses include full program costs
bull DSM goals and budgets should vary to support AE resource plan requirements
Saving Energy TogetherPower SaverTM Program
Free Home WeatherizationEnergy Improvementsbull Insulate Atticsbull Duct Sealingbull Install CFLsbull Solar Screensbull Caulking and Weather-strippingbull Free Smoke amp Carbon Monoxide Detector bull Minor Energy Related Repairs
Saving Energy TogetherPower SaverTM Program
Power Saver Program
bull FREE Energy Saving Productsbull Lower energy costsbull 65000 installed in homes apartmentsbull 4000 installed in commercial buildings
Saving Energy TogetherPower SaverTM Program
Energy Conservation in COA FacilitiesSenate Bill 5 Energy Use vs Energy Cost
295
300
305
310
315
320
325
330
335
340
345
350
Base Year2001
2002 2003 2004 2005 2006
Gig
awat
t-hou
rs
220
230
240
250
260
270
280
290
300
Mill
ion
Dol
lars
Million kWh Cost
Chart1
Million kWh
Cost
Gigawatt-hours
Million Dollars
Senate Bill 5 Energy Use vs Energy Cost
343667472
28619895
33757683
2504536
3260767692
24602549
31773020962
26778741
324036807
2745756918
313494864
2936354518
Sheet1
Sheet1
ampA
Page ampP
Million kWh
Gigawatt-hours
Senate Bill 5 Reported Energy Use
Sheet2
ampA
Page ampP
Million kWh
Cost
Gigawatt-hours
Million Dollars
Senate Bill 5 Energy Use vs Energy Cost
Sheet3
Energy Efficiency Real Reliable and Cost-Effective Alternative
Fuel cost savings assume all saved energy at average gas generation cost
Increased off-system sales margins assumes reduced demand plus associated reserve requirements could be sold for $15kWmonth (after 2007 this is an avoided capacity expense)
Fuel Factor expense increase is increased fuel expense plus purchased capacity cost
GFT reduction is base revenue and fuel cost reductions times 91
Base revenue wDSM
552961968
562415810
569170954
576627290
585065115
594497922
604045383
613657938
623249716
632762255
644233714
Base revenue wo DSM
557087606
570008130
580983849
592794909
605393639
619267826
633200893
646996029
660941168
674903660
690679622
kWh sales wDSM
10776303000
10954134000
11076488000
11213088000
11369667000
11546488000
11724454000
11897588000
12077216000
12256861000
12476492000
kWh sales wo DSM
10861087000
11109639000
11319110000
11544588000
11787201000
12054717000
12323440000
12582205000
12851412000
13121980000
13429845000
1000
kW sales wDSM
2435000
2442000
2443000
2471000
2477000
2486000
2486000
2490000
2515000
2535000
2539000
kW sales wo DSM
2476000
2527000
2572000
2644000
2693000
2746000
2788000
2833000
2898000
2959000
3004000
Fuel Forecast
Budget 2006 (3905)
Tot-2006
Tot-2007
Tot-2008
Tot-2009
Tot-2010
Tot-2011
Tot-2012
Tot-2013
Tot-2014
Tot-2015
Total
MWH
STP
3303339
3488217
3514415
3360759
3465191
3507755
3405921
3614690
3482746
3515635
34658668
FPP
4564135
4517773
4465943
4451812
4418334
4545733
4554494
4586879
4445603
4245674
44796380
Decker
2839387
511212
504648
615748
583574
563845
570235
550098
594337
757598
8090682
Holly
235228
28425
- 0
- 0
- 0
- 0
- 0
- 0
- 0
263653
Sand Hill CC
1533962
1538343
1565132
1615597
1553452
1600111
1516183
1666799
1687122
14276700
SH GT
465155
427320
523864
450359
458722
498276
432337
492003
574949
4322986
Decker GT
157126
216800
280985
238803
246172
264900
238141
266139
294200
2203267
Existing DG
17340
7248
7296
7065
7216
7268
7168
7137
7147
16838
91723
Future DG
110
110
101
2216
2659
4743
5273
7365
7750
17746
48073
PurchasePower
131996
- 0
204000
208800
206400
206400
134400
201600
136000
139200
1568796
Landfill Methane
87493
92450
92704
92450
92450
92450
92704
92450
92450
92450
920052
Future Bioenergy
- 0
- 0
134151
178705
384764
454206
673445
744600
978509
1057336
4605716
Wind
636291
669050
671181
669050
669050
669050
671181
669050
669050
669050
6662004
Solar
684
20026
32685
41438
50311
59183
68298
76929
85801
87839
523193
Shortfall Energy
3308
2419
3355
6021
3311
4269
7050
3075
3868
4281
40957
11584082
11699976
11841366
12004048
12188020
12373249
12553456
12740532
12928204
13159918
123072851
(10512)
(1)
(1)
0
0
(0)
1
1
(0)
0
(10505)
Dollars
STP
14024307
16411783
18054617
17815007
18997196
19874461
19872833
21713134
21541492
22417754
190722584
FPP
47959978
48327184
52942730
56530034
57287196
60262126
61527986
62666810
62927556
61809806
572241406
Decker
161242451
30007075
26150797
28534975
26297430
25902979
27510734
27253106
30904024
41053837
424857407
Holly
15649395
1939153
- 0
- 0
- 0
- 0
- 0
- 0
- 0
17588548
Sand Hill CC
71819840
62147912
53829988
54696364
53773560
56880544
56723452
64324432
66378796
540574888
SH GT
28915407
23018682
25201605
20614580
21546020
24873781
22042049
25993318
31798432
224003872
Decker GT
12129491
14068039
16315347
13248144
14062711
15831205
14654486
17002591
19718490
137030504
Existing DG
1066126
482134
392821
350785
361063
372817
379318
391499
407877
1055934
5260373
Future DG
5688
5352
3321
115774
140956
247241
281454
413559
455875
1154808
2824028
PurchasePower
5000000
- 0
17339160
16429042
16415314
16614357
11144008
17017280
11632503
11967200
123558864
Landfill Methane
3535734
3653844
3663855
3653844
3653844
3653844
3663855
3653844
3653844
3653844
36440353
Future Bioenergy
- 0
- 0
6036769
8041681
17314398
20439270
30305016
33507000
44032792
47579944
207256869
Wind
17374835
18256537
18314921
18256537
18256537
18256537
18314921
18256537
18256537
18256537
181800436
Solar
- 0
- 0
- 0
- 0
- 0
- 0
- 0
- 0
- 0
- 0
- 0
Shortfall Energy
248086
181420
251636
451599
248349
320172
528742
230590
290120
321058
3071771
250457205
245839462
244324412
245526217
247531370
255326093
271114397
278523346
301422961
327166440
2667231902
1792964
10
(12)
6
(1)
10
(27)
4
3
(6)
1793341
Gas MWh
2839387
2902683
2715536
2985730
2888333
2822192
2933522
2736759
3019278
3313869
29157288
Gas cost ($)
161242451
158521208
127324584
123881915
114856517
115285269
125096264
120673092
138224364
158949555
1344055218
Avg gas gen Cost ($MWh)
5679
5461
4689
4149
3977
4085
4264
4409
4578
4796
4610
NO DSM FUEL FACTOR
2006
2007
2008
2009
2010
2011
2012
2013
2014
2015
Thermal Unit Fuel Cost
232662512
236980848
213398064
215549344
211851680
220956944
237247920
240469984
264099856
293228672
Shortfall Purchases
248086
181420
251636
451599
248349
320172
528742
230590
290120
321058
Short-Term Power Purchases
5000000
- 0
29016660
31009042
33965314
36999357
34296508
42869780
40252503
43354700
Fuel Cell Gas Cost
119837
119837
119837
119837
119837
119837
119837
119837
119837
119837
Recoverable ERCOT Expenses
16825273
16825273
16825273
16825273
16825273
16825273
16825273
16825273
16825273
16825273
Fuel Factor Renewables
9998882
9706333
14540565
15223226
23255836
23418594
31052373
32981926
42305054
44649542
Total Fuel Factor Revenue
264854590
263813711
274152035
279178321
286266289
298640176
320070653
333497390
363892643
398499082
Total Renewables
20910569
21910381
28015544
29952062
39224779
42349651
52283792
55417381
65943173
69490325
TotThermal+PurchPwr+Renewables
249864319
245834121
244321076
245522607
247527546
255322004
271110126
278519139
301418805
327162135
Estimated Green Choice Sales
10911686
12204048
13474979
14728836
15968943
18931058
21231418
22435455
23638119
24840783
Fuel Factor Renewables
9998882
9706333
14540565
15223226
23255836
23418594
31052373
32981926
42305054
44649542
Forecast Annual GWh Sales
11110
11319
11545
11787
12055
12323
12582
12851
13122
13430
Average cost per kWh
$ 0023840
$ 0023307
$ 0023747
$ 0023685
$ 0023747
$ 0024234
$ 0025438
$ 0025950
$ 0027732
$ 0029673
Fuel Factors
Secondary
$ 0023475
$ 0022733
$ 0022206
$ 0021895
$ 0021627
$ 0021713
$ 0022535
$ 0022717
$ 0024162
$ 0025715
Primary
$ 0022776
$ 0022056
$ 0021545
$ 0021243
$ 0020984
$ 0021067
$ 0021864
$ 0022041
$ 0023443
$ 0024949
Transmission
$ 0022539
$ 0021828
$ 0021321
$ 0021022
$ 0020766
$ 0020848
$ 0021637
$ 0021812
$ 0023200
$ 0024690
2006
2007
2008
2009
2010
2011
2012
2013
2014
2015
Dag generation
11574
11700
11841
12004
12188
12373
12553
12741
12928
13160
Joe generation
11584
11700
11841
12004
12188
12373
12553
12741
12928
13160
difference
(10)
0
(0)
(0)
(0)
(0)
(0)
0
(0)
0
sales
10954
11076
11213
11370
11546
11724
11898
12077
12257
12476
losses
57
56
56
56
56
55
55
55
55
55
With DSM
Thermal Unit Fuel Cost wDSM
223705664
223742320
198714736
198689904
191639104
196037824
207153584
205853888
223553008
245383552
Short-Term Power Purchases
5000000
- 0
17339160
16429042
16415314
16614357
11144008
17017280
11632503
11967200
Average cost per kWh
$ 0023361
$ 0022623
$ 0022099
$ 0021789
$ 0021523
$ 0021608
$ 0022426
$ 0022607
$ 0024046
$ 0025590
Forecast Annual GWh Sales
10954
11076
11213
11370
11546
11724
11898
12077
12257
12476
255897742
250575183
247791207
247738881
248503713
253336056
266823817
273028794
294725795
319266462
CASH FLOW PURCHASE OPTION
2005
2006
2007
2008
2009
2010
2011
2012
2013
2014
2015
Base revenue reduction
4125638
7592320
11812895
16167619
20328524
24769904
29155510
33338091
37691451
42141405
46445908
Fuel cost reduction
5166240
8956848
13238528
14683328
16859440
20212576
24919120
30094336
34616096
40546848
47845120
Potential off-system sales margins
2767500
5737500
8707500
Capacity cost reduction
12000000
15000000
18000000
21000000
24000000
27000000
30000000
33000000
GFT reduction
845561
660413
773705
527757
576669
709301
827386
851560
807636
944644
1055853
845560920627699
Program cost
20689324
22819634
22819634
22819634
22819634
22819634
22819634
22819634
22819634
22819634
22819634
Recovery through base rates
14405492
14639186
14799075
14977916
15183688
15416391
15650684
15878624
16115254
16352636
16645725
Cash flow
-6796409
-9374854
-10352249
-23481580
-27387801
-31463846
-35497075
-39427542
-43588195
-47663759
-51563965
2005
2006
2007
2008
2009
2010
2011
2012
2013
2014
2015
Base Revenue Reduction
$ (4125638)
$ (7592320)
$ (11812895)
$ (16167619)
$ (20328524)
$ (24769904)
$ (29155510)
$ (33338091)
$ (37691451)
$ (42141405)
$ (46445908)
Fuel Revenue Reduction
$ (5166240)
$ (8956848)
$ (13238528)
$ (26683328)
$ (31859440)
$ (38212576)
$ (45919120)
$ (54094336)
$ (61616096)
$ (70546848)
$ (80845120)
Fuel Cost Reduction
$ 5166240
$ 8956848
$ 13238528
$ 26683328
$ 31859440
$ 38212576
$ 45919120
$ 54094336
$ 61616096
$ 70546848
$ 80845120
Potential off-system sales margins
$ 2767500
$ 5737500
$ 8707500
$ - 0
$ - 0
$ - 0
$ - 0
$ - 0
$ - 0
$ - 0
$ - 0
Net program costs
$ (5438271)
$ (7520034)
$ (7246854)
$ (7313961)
$ (7059277)
$ (6693942)
$ (6341565)
$ (6089451)
$ (5896744)
$ (5522354)
$ (5118057)
AEs net cash impact
$ (6796409)
$ (9374854)
$ (10352249)
$ (23481580)
$ (27387801)
$ (31463846)
$ (35497075)
$ (39427542)
$ (43588195)
$ (47663759)
$ (51563965)
Customer savings
$ 9291878
$ 16549168
$ 25051423
$ 42850947
$ 52187964
$ 62982480
$ 75074630
$ 87432427
$ 99307547
$ 112688253
$ 127291028
CASH FLOW BUILD OPTION
2005
2006
2007
2008
2009
2010
2011
2012
2013
2014
2015
Base revenue reduction
4125638
7592320
11812895
16167619
20328524
24769904
29155510
33338091
37691451
42141405
46445908
Fuel cost reduction
5166240
8956848
13238528
14683328
16859440
20212576
24919120
30094336
34616096
40546848
47845120
Potential off-system sales margins
2767500
5737500
8707500
Capacity cost reduction
7736295
11604442
11604442
15472589
15472589
19340737
19340737
23208884
GFT reduction
845561
660413
773705
527757
576669
709301
827386
851560
807636
944644
1055853
Program cost
20689324
22819634
22819634
22819634
22819634
22819634
22819634
22819634
22819634
22819634
22819634
Recovery through base rates
14405492
14639186
14799075
14977916
15183688
15416391
15650684
15878624
16115254
16352636
16645725
Cash flow
-6796409
-9374854
-10352249
-15745285
-15783359
-19859404
-20024486
-23954952
-24247459
-28323022
-28355080
-21195738994
Capacity cost Build option
Reduced capacity requirement (kW)
46125
95625
145125
194625
243000
292500
339750
385875
430875
477000
523125
Capacity added
200
300
300
400
400
500
500
600
Annual capacity cost
$386814737
$7736295
$11604442
$11604442
$15472589
$15472589
$19340737
$19340737
$23208884
Capacity cost Buy option
Reduced capacity requirement (kW)
46125
95625
145125
194625
243000
292500
339750
385875
430875
477000
523125
Capacity added
200
250
300
350
400
450
500
550
Annual capacity cost
$600000000
$12000000
$15000000
$18000000
$21000000
$24000000
$27000000
$30000000
$33000000
1994
2004
2005
2006
2007
2008
2009
2010
2011
2012
2013
2014
2015
Net MWh to system
7659242
10855000
11388814
11573570
11699976
11841366
12004047
12188019
12373248
12553455
12740532
12928203
13159916
Revenue multiplier
100
142
149
151
153
155
157
159
162
164
166
169
172
Revenue allocated to DSM
9688028
13730281
14405492
14639186
14799075
14977916
15183688
15416391
15650684
15878624
16115254
16352636
16645725
CentskWh in rates for DSM
0134
0134
0134
0134
0134
0134
0134
0133
0133
0133
0133
0133
Annual sales (MWh)
10262000
10776303
10954134
11076488
11213088
11369667
11546488
11724454
11897588
12077216
12256861
12476492
2006
2006
2007
2007
2008
2008
2009
2009
2010
2010
2011
2011
2012
2012
2013
2013
2014
2014
2015
2015
2005
2005
2005
2006
2006
2006
2007
2007
2007
2008
2008
2008
2009
2009
2009
2010
2010
2010
2011
2011
2011
2012
2012
2012
2013
2013
2013
2014
2014
2014
2015
2015
2015
2005
2006
2007
2008
2009
2010
2011
2012
2013
2014
2015
Base Revenue Reduction
$ (4125638)
$ (7592320)
$ (11812895)
$ (16167619)
$ (20328524)
$ (24769904)
$ (29155510)
$ (33338091)
$ (37691451)
$ (42141405)
$ (46445908)
Fuel Revenue Reduction
$ (5166240)
$ (8956848)
$ (13238528)
$ (26683328)
$ (31859440)
$ (38212576)
$ (45919120)
$ (54094336)
$ (61616096)
$ (70546848)
$ (80845120)
Fuel Cost Reduction
$ 5166240
$ 8956848
$ 13238528
$ 26683328
$ 31859440
$ 38212576
$ 45919120
$ 54094336
$ 61616096
$ 70546848
$ 80845120
Potential off-system sales margins
$ 2767500
$ 5737500
$ 8707500
$ - 0
$ - 0
$ - 0
$ - 0
$ - 0
$ - 0
$ - 0
$ - 0
Net program costs
$ (5438271)
$ (7520034)
$ (7246854)
$ (7313961)
$ (7059277)
$ (6693942)
$ (6341565)
$ (6089451)
$ (5896744)
$ (5522354)
$ (5118057)
AEs net cash impact
$ (6796409)
$ (9374854)
$ (10352249)
$ (23481580)
$ (27387801)
$ (31463846)
$ (35497075)
$ (39427542)
$ (43588195)
$ (47663759)
$ (51563965)
Customer savings
$ (9291878)
$ (16549168)
$ (25051423)
$ (42850947)
$ (52187964)
$ (62982480)
$ (75074630)
$ (87432427)
$ (99307547)
$ (112688253)
$ (127291028)
Estimated Annual Impact
Base Revenue Reduction
$ (16134252)
Fuel Revenue Reduction
$ (23790144)
Fuel Cost Reduction
$ 23790144
Potential off-system sales margins
$ 2889000
Net program costs
$ (7166814)
AEs net cash impact
$ (20412066)
Customer savings
$ (39924396)
CURRENT FORECAST
PROPOSED PROJECTION
DSM Analysis
2007
2008
2007
2008
keyed in to round
Base Revenue Reduction
(12000000)
(16000000)
(12000000)
(16000000)
Fuel Revenue Reduction
(13000000)
(15000000)
(5000000)
(7000000)
Customer Savings (Bill Reduction)
(25000000)
(31000000)
(17000000)
(23000000)
Fuel Cost Reduction
13000000
15000000
5000000
7000000
KW
$KW
NET
5 profit
Potential Off-system Capacity Sales
9000000
9000000
6207
$KW
145000
$ 62
$ 8990000
Net of fuel and GFT
$ 449500
TCOS Expense Reduction
900000
1000000
900000
1000000
GFT Reduction
2000000
3000000
2000000
3000000
Program Cost
(23000000)
(23000000)
Recovery through Base Rates
15000000
15000000
AEs Net Income Impact
(8100000)
(20000000)
(17100000)
(35000000)
Deferred Cost of Capacity
12000000
- 0
AEs Net Cash Impact
(8100000)
(8000000)
(17100000)
- 0
Outline for Oct 10 Leadership Team Update
1 Components of BenefitCost Ratios
2 Cash Flow of DSM
CURRENT FORECAST
PROPOSED PROJECTION
DSM Analysis
2007
2008
2007
2008
Base Revenue Reduction
(11812895)
(16167619)
(11812895)
(16167619)
Fuel Revenue Reduction
(13238528)
(14683328)
(5217969)
(5396810)
Fuel Cost Reduction
13238528
14683328
5217969
5396810
Potential off-system sales margins
8707500
8707500
Fuel Revenue Increase-Capacity
12000000
12000000
Fuel Cost Increase-Capacity
(12000000)
(12000000)
TCOS expense reduction
925987
977987
925987
977987
GFT reduction
2279680
2807436
2279680
2807436
Program cost
(22819634)
(22819634)
Recovery through base rates
14799075
14977916
AEs net income impact
(7920288)
(20223914)
100271
(12382196)
Deferred Cost of Capacity
12000000
12000000
AEs net cash impact including deferral
(7920288)
(8223914)
100271
(382196)
Customer savings-(net)
$ (25051423)
$ (30850947)
$ (17030864)
$ (21564429)
Recommend recovery thru fuel factor
Offset customer fuel savings due to DSM
Would not offset revenue loss
(before amp after)
In 2007 we still have excess capacity
Cost recovery
3yrs - recommended purch power
power is only needed during peak-dont utilize a plant
need declines as renewables increases
cash flow
Dynamic pricing-TOU rates motivating cust to conserve energy
would replace some of the energy efficiency rebates
option to self-generate
TCOS expense reduction due to DSM savings
Historical
Historical
Historical
Historical
Historical
Preliminary
Forecast
Forecast
Forecast
Forecast
Forecast
Forecast
Forecast
Forecast
Forecast
Forecast
2000
2001
2002
2003
2004
2005
2006
2007
2008
2009
2010
2011
2012
2013
2014
2015
ERCOT Postage Stamp Rate
1476
1528
1661
1778
1925
2055
2185
2315
2445
2575
2705
2835
2965
3095
3225
3355
Estimated DSM-kW savings applied to average 4CP
40000
40000
40000
40000
40000
40000
40000
40000
40000
40000
40000
Reduction to TCOS expense
$ 821987
$ 873987
$ 925987
$ 977987
$ 1029987
$ 1081987
$ 1133987
$ 1185987
$ 1237987
$ 1289987
$ 1341987
2005
2006
2007
2008
2009
2010
2011
2012
2013
2014
2015
Base revenue reduction
4125638
7592320
11812895
16167619
20328524
24769904
29155510
33338091
37691451
42141405
46445908
kWh reduction
84784000
155505000
242622000
331500000
417534000
508229000
598986000
684617000
774196000
865119000
953353000
Fuel cost reduction
5166240
8956848
13238528
14683328
16859440
20212576
24919120
30094336
34616096
40546848
47845120
Demand reduction (kW)
41000
85000
129000
173000
216000
260000
302000
343000
383000
424000
465000
Reduced reserve requirement (kW)
5125
10625
16125
21625
27000
32500
37750
42875
47875
53000
58125
2008
2009
2010
2011
2012
2013
2014
2015
Reduced capacity requirement (kW)
46125
95625
145125
194625
243000
292500
339750
385875
430875
477000
523125
194625
243000
292500
339750
385875
430875
477000
523125
Increased off-system sales margins
2767500
5737500
8707500
Capacity cost reduction
11677500
14580000
17550000
20385000
23152500
25852500
28620000
31387500
Fuel Factor expense decrease ($)
5166240
8956848
13238528
26360828
31439440
37762576
45304120
53246836
60468596
69166848
79232620
Fuel Factor decrease (centskWh)
00005
00007
00016
00019
00022
00026
00030
00033
00037
00041
Fuel Factor decrease
2
3
7
9
10
12
13
15
15
16
GFT reduction
845561
1505974
2279680
2807436
3384105
4093406
4920791
5772351
6579987
7524631
8580484
Program cost
20689324
22819634
22819634
22819634
22819634
22819634
22819634
22819634
22819634
22819634
22819634
Recovery through base rates
14405492
14639186
14799075
14977916
15183688
15416391
15650684
15878624
16115254
16352636
16645725
Cash flow
-7641970
-10035268
-11125954
-12331837
-13384470
-14623147
-15939461
-17126601
-18543331
-19988403
-21232317
Fuel cost savings assume all saved energy at average gas generation cost
Increased off-system sales margins assumes reduced demand plus associated reserve requirements could be sold for $15kWmonth (after 2007 this is an avoided capacity expense)
Fuel Factor expense increase is increased fuel expense plus purchased capacity cost
GFT reduction is base revenue and fuel cost reductions times 91
Base revenue wDSM
552961968
562415810
569170954
576627290
585065115
594497922
604045383
613657938
623249716
632762255
644233714
Base revenue wo DSM
557087606
570008130
580983849
592794909
605393639
619267826
633200893
646996029
660941168
674903660
690679622
kWh sales wDSM
10776303000
10954134000
11076488000
11213088000
11369667000
11546488000
11724454000
11897588000
12077216000
12256861000
12476492000
kWh sales wo DSM
10861087000
11109639000
11319110000
11544588000
11787201000
12054717000
12323440000
12582205000
12851412000
13121980000
13429845000
1000
kW sales wDSM
2435000
2442000
2443000
2471000
2477000
2486000
2486000
2490000
2515000
2535000
2539000
kW sales wo DSM
2476000
2527000
2572000
2644000
2693000
2746000
2788000
2833000
2898000
2959000
3004000
Fuel Forecast
Budget 2006 (3905)
Tot-2006
Tot-2007
Tot-2008
Tot-2009
Tot-2010
Tot-2011
Tot-2012
Tot-2013
Tot-2014
Tot-2015
Total
MWH
STP
3303339
3488217
3514415
3360759
3465191
3507755
3405921
3614690
3482746
3515635
34658668
FPP
4564135
4517773
4465943
4451812
4418334
4545733
4554494
4586879
4445603
4245674
44796380
Decker
2839387
511212
504648
615748
583574
563845
570235
550098
594337
757598
8090682
Holly
235228
28425
- 0
- 0
- 0
- 0
- 0
- 0
- 0
263653
Sand Hill CC
1533962
1538343
1565132
1615597
1553452
1600111
1516183
1666799
1687122
14276700
SH GT
465155
427320
523864
450359
458722
498276
432337
492003
574949
4322986
Decker GT
157126
216800
280985
238803
246172
264900
238141
266139
294200
2203267
Existing DG
17340
7248
7296
7065
7216
7268
7168
7137
7147
16838
91723
Future DG
110
110
101
2216
2659
4743
5273
7365
7750
17746
48073
PurchasePower
131996
- 0
204000
208800
206400
206400
134400
201600
136000
139200
1568796
Landfill Methane
87493
92450
92704
92450
92450
92450
92704
92450
92450
92450
920052
Future Bioenergy
- 0
- 0
134151
178705
384764
454206
673445
744600
978509
1057336
4605716
Wind
636291
669050
671181
669050
669050
669050
671181
669050
669050
669050
6662004
Solar
684
20026
32685
41438
50311
59183
68298
76929
85801
87839
523193
Shortfall Energy
3308
2419
3355
6021
3311
4269
7050
3075
3868
4281
40957
11584082
11699976
11841366
12004048
12188020
12373249
12553456
12740532
12928204
13159918
123072851
(10512)
(1)
(1)
0
0
(0)
1
1
(0)
0
(10505)
Dollars
STP
14024307
16411783
18054617
17815007
18997196
19874461
19872833
21713134
21541492
22417754
190722584
FPP
47959978
48327184
52942730
56530034
57287196
60262126
61527986
62666810
62927556
61809806
572241406
Decker
161242451
30007075
26150797
28534975
26297430
25902979
27510734
27253106
30904024
41053837
424857407
Holly
15649395
1939153
- 0
- 0
- 0
- 0
- 0
- 0
- 0
17588548
Sand Hill CC
71819840
62147912
53829988
54696364
53773560
56880544
56723452
64324432
66378796
540574888
SH GT
28915407
23018682
25201605
20614580
21546020
24873781
22042049
25993318
31798432
224003872
Decker GT
12129491
14068039
16315347
13248144
14062711
15831205
14654486
17002591
19718490
137030504
Existing DG
1066126
482134
392821
350785
361063
372817
379318
391499
407877
1055934
5260373
Future DG
5688
5352
3321
115774
140956
247241
281454
413559
455875
1154808
2824028
PurchasePower
5000000
- 0
17339160
16429042
16415314
16614357
11144008
17017280
11632503
11967200
123558864
Landfill Methane
3535734
3653844
3663855
3653844
3653844
3653844
3663855
3653844
3653844
3653844
36440353
Future Bioenergy
- 0
- 0
6036769
8041681
17314398
20439270
30305016
33507000
44032792
47579944
207256869
Wind
17374835
18256537
18314921
18256537
18256537
18256537
18314921
18256537
18256537
18256537
181800436
Solar
- 0
- 0
- 0
- 0
- 0
- 0
- 0
- 0
- 0
- 0
- 0
Shortfall Energy
248086
181420
251636
451599
248349
320172
528742
230590
290120
321058
3071771
250457205
245839462
244324412
245526217
247531370
255326093
271114397
278523346
301422961
327166440
2667231902
1792964
10
(12)
6
(1)
10
(27)
4
3
(6)
1793341
Gas MWh
2839387
2902683
2715536
2985730
2888333
2822192
2933522
2736759
3019278
3313869
29157288
Gas cost ($)
161242451
158521208
127324584
123881915
114856517
115285269
125096264
120673092
138224364
158949555
1344055218
Avg gas gen Cost ($MWh)
5679
5461
4689
4149
3977
4085
4264
4409
4578
4796
4610
NO DSM FUEL FACTOR
2006
2007
2008
2009
2010
2011
2012
2013
2014
2015
Thermal Unit Fuel Cost
232662512
236980848
213398064
215549344
211851680
220956944
237247920
240469984
264099856
293228672
Shortfall Purchases
248086
181420
251636
451599
248349
320172
528742
230590
290120
321058
Short-Term Power Purchases
5000000
- 0
29016660
31009042
33965314
36999357
34296508
42869780
40252503
43354700
Fuel Cell Gas Cost
119837
119837
119837
119837
119837
119837
119837
119837
119837
119837
Recoverable ERCOT Expenses
16825273
16825273
16825273
16825273
16825273
16825273
16825273
16825273
16825273
16825273
Fuel Factor Renewables
9998882
9706333
14540565
15223226
23255836
23418594
31052373
32981926
42305054
44649542
Total Fuel Factor Revenue
264854590
263813711
274152035
279178321
286266289
298640176
320070653
333497390
363892643
398499082
Total Renewables
20910569
21910381
28015544
29952062
39224779
42349651
52283792
55417381
65943173
69490325
TotThermal+PurchPwr+Renewables
249864319
245834121
244321076
245522607
247527546
255322004
271110126
278519139
301418805
327162135
Estimated Green Choice Sales
10911686
12204048
13474979
14728836
15968943
18931058
21231418
22435455
23638119
24840783
Fuel Factor Renewables
9998882
9706333
14540565
15223226
23255836
23418594
31052373
32981926
42305054
44649542
Forecast Annual GWh Sales
11110
11319
11545
11787
12055
12323
12582
12851
13122
13430
Average cost per kWh
$ 0023840
$ 0023307
$ 0023747
$ 0023685
$ 0023747
$ 0024234
$ 0025438
$ 0025950
$ 0027732
$ 0029673
Fuel Factors
Secondary
$ 0023475
$ 0022733
$ 0022206
$ 0021895
$ 0021627
$ 0021713
$ 0022535
$ 0022717
$ 0024162
$ 0025715
Primary
$ 0022776
$ 0022056
$ 0021545
$ 0021243
$ 0020984
$ 0021067
$ 0021864
$ 0022041
$ 0023443
$ 0024949
Transmission
$ 0022539
$ 0021828
$ 0021321
$ 0021022
$ 0020766
$ 0020848
$ 0021637
$ 0021812
$ 0023200
$ 0024690
2006
2007
2008
2009
2010
2011
2012
2013
2014
2015
Dag generation
11574
11700
11841
12004
12188
12373
12553
12741
12928
13160
Joe generation
11584
11700
11841
12004
12188
12373
12553
12741
12928
13160
difference
(10)
0
(0)
(0)
(0)
(0)
(0)
0
(0)
0
sales
10954
11076
11213
11370
11546
11724
11898
12077
12257
12476
losses
57
56
56
56
56
55
55
55
55
55
With DSM
Thermal Unit Fuel Cost wDSM
223705664
223742320
198714736
198689904
191639104
196037824
207153584
205853888
223553008
245383552
Short-Term Power Purchases
5000000
- 0
17339160
16429042
16415314
16614357
11144008
17017280
11632503
11967200
Average cost per kWh
$ 0023361
$ 0022623
$ 0022099
$ 0021789
$ 0021523
$ 0021608
$ 0022426
$ 0022607
$ 0024046
$ 0025590
Forecast Annual GWh Sales
10954
11076
11213
11370
11546
11724
11898
12077
12257
12476
255897742
250575183
247791207
247738881
248503713
253336056
266823817
273028794
294725795
319266462
CASH FLOW PURCHASE OPTION
2005
2006
2007
2008
2009
2010
2011
2012
2013
2014
2015
Base revenue reduction
4125638
7592320
11812895
16167619
20328524
24769904
29155510
33338091
37691451
42141405
46445908
Fuel cost reduction
5166240
8956848
13238528
14683328
16859440
20212576
24919120
30094336
34616096
40546848
47845120
Potential off-system sales margins
2767500
5737500
8707500
Capacity cost reduction
12000000
15000000
18000000
21000000
24000000
27000000
30000000
33000000
GFT reduction
845561
660413
773705
527757
576669
709301
827386
851560
807636
944644
1055853
845560920627699
Program cost
20689324
22819634
22819634
22819634
22819634
22819634
22819634
22819634
22819634
22819634
22819634
Recovery through base rates
14405492
14639186
14799075
14977916
15183688
15416391
15650684
15878624
16115254
16352636
16645725
Cash flow
-6796409
-9374854
-10352249
-23481580
-27387801
-31463846
-35497075
-39427542
-43588195
-47663759
-51563965
2005
2006
2007
2008
2009
2010
2011
2012
2013
2014
2015
Base Revenue Reduction
$ (4125638)
$ (7592320)
$ (11812895)
$ (16167619)
$ (20328524)
$ (24769904)
$ (29155510)
$ (33338091)
$ (37691451)
$ (42141405)
$ (46445908)
Fuel Revenue Reduction
$ (5166240)
$ (8956848)
$ (13238528)
$ (26683328)
$ (31859440)
$ (38212576)
$ (45919120)
$ (54094336)
$ (61616096)
$ (70546848)
$ (80845120)
Fuel Cost Reduction
$ 5166240
$ 8956848
$ 13238528
$ 26683328
$ 31859440
$ 38212576
$ 45919120
$ 54094336
$ 61616096
$ 70546848
$ 80845120
Potential off-system sales margins
$ 2767500
$ 5737500
$ 8707500
$ - 0
$ - 0
$ - 0
$ - 0
$ - 0
$ - 0
$ - 0
$ - 0
Net program costs
$ (5438271)
$ (7520034)
$ (7246854)
$ (7313961)
$ (7059277)
$ (6693942)
$ (6341565)
$ (6089451)
$ (5896744)
$ (5522354)
$ (5118057)
AEs net cash impact
$ (6796409)
$ (9374854)
$ (10352249)
$ (23481580)
$ (27387801)
$ (31463846)
$ (35497075)
$ (39427542)
$ (43588195)
$ (47663759)
$ (51563965)
Customer savings
$ 9291878
$ 16549168
$ 25051423
$ 42850947
$ 52187964
$ 62982480
$ 75074630
$ 87432427
$ 99307547
$ 112688253
$ 127291028
CASH FLOW BUILD OPTION
2005
2006
2007
2008
2009
2010
2011
2012
2013
2014
2015
Base revenue reduction
4125638
7592320
11812895
16167619
20328524
24769904
29155510
33338091
37691451
42141405
46445908
Fuel cost reduction
5166240
8956848
13238528
14683328
16859440
20212576
24919120
30094336
34616096
40546848
47845120
Potential off-system sales margins
2767500
5737500
8707500
Capacity cost reduction
7736295
11604442
11604442
15472589
15472589
19340737
19340737
23208884
GFT reduction
845561
660413
773705
527757
576669
709301
827386
851560
807636
944644
1055853
Program cost
20689324
22819634
22819634
22819634
22819634
22819634
22819634
22819634
22819634
22819634
22819634
Recovery through base rates
14405492
14639186
14799075
14977916
15183688
15416391
15650684
15878624
16115254
16352636
16645725
Cash flow
-6796409
-9374854
-10352249
-15745285
-15783359
-19859404
-20024486
-23954952
-24247459
-28323022
-28355080
-21195738994
Capacity cost Build option
Reduced capacity requirement (kW)
46125
95625
145125
194625
243000
292500
339750
385875
430875
477000
523125
Capacity added
200
300
300
400
400
500
500
600
Annual capacity cost
$386814737
$7736295
$11604442
$11604442
$15472589
$15472589
$19340737
$19340737
$23208884
Capacity cost Buy option
Reduced capacity requirement (kW)
46125
95625
145125
194625
243000
292500
339750
385875
430875
477000
523125
Capacity added
200
250
300
350
400
450
500
550
Annual capacity cost
$600000000
$12000000
$15000000
$18000000
$21000000
$24000000
$27000000
$30000000
$33000000
1994
2004
2005
2006
2007
2008
2009
2010
2011
2012
2013
2014
2015
Net MWh to system
7659242
10855000
11388814
11573570
11699976
11841366
12004047
12188019
12373248
12553455
12740532
12928203
13159916
Revenue multiplier
100
142
149
151
153
155
157
159
162
164
166
169
172
Revenue allocated to DSM
9688028
13730281
14405492
14639186
14799075
14977916
15183688
15416391
15650684
15878624
16115254
16352636
16645725
CentskWh in rates for DSM
0134
0134
0134
0134
0134
0134
0134
0133
0133
0133
0133
0133
Annual sales (MWh)
10262000
10776303
10954134
11076488
11213088
11369667
11546488
11724454
11897588
12077216
12256861
12476492
2006
2006
2007
2007
2008
2008
2009
2009
2010
2010
2011
2011
2012
2012
2013
2013
2014
2014
2015
2015
Sheet1
Sheet3
Saving Energy TogetherPower SaverTM Program
DSM Analysis 2007 2008
Base Revenue Reduction (12000000) (16000000) Fuel Revenue Reduction (13000000) (15000000)
AEs Net Income Impact (8100000) (20000000) Deferred Cost of Capacity 12000000 AEs Net Cash Impact (8100000) (8000000)
CURRENT FORECAST
Cash Flow Projection of DSM
Cash flow chart
Chart1
Fuel Cost Reduction
Capacity Expense Reduction
Total Decrease In Expenses
REDUCTION IN EXPENSES DUE TO DSM PROGRAMS
5166240
5166240
8956848
8956848
13238528
13238528
14683328
26360828
11677500
16859440
31439440
14580000
20212576
37762576
17550000
24919120
45304120
20385000
30094336
53246836
23152500
34616096
60468596
25852500
40546848
69166848
28620000
47845120
79232620
31387500
Chart4
Fuel Cost without DSM
Fuel Cost with DSM
REDUCTION IN FUEL COST DUE TO DSM PROGRAMS
00233611231
00238400717
00226232559
00233069306
00220985648
00237472342
00217888198
00236848698
00215229268
00237472426
00216083296
00242335075
00224259386
00254383594
00226073357
00259502528
00240455083
00277315347
00255904506
00296726494
Sheet1
Sheet3
Saving Energy TogetherPower SaverTM Program
Questions
Saving Energy TogetherPower SaverTM Program
FY 2006 Achievements
Energy SavingsMW of
Programs Saved Goal Goal
Residential 126 115 110
Commercial 154 121 127
Demand Response 146 156 94
Solar 055 060 93
Grand Total 432 398 108
Saving Energy TogetherPower SaverTM Program
MW SavedPrograms FY2005 FY2006
Residential 119 126
Commercial 153 154
Demand Response 116 146
Solar 06 055
Grand Total 394 432
Energy Savings ComparisonFY2005 to FY2006
Saving Energy TogetherPower SaverTM Program
DSM Summary
bull DSM programs are saving peak kW amp kWh
bull Cost-effectiveness analyses include full program costs
bull DSM goals and budgets should vary to support AE resource plan requirements
Saving Energy TogetherPower SaverTM Program
Free Home WeatherizationEnergy Improvementsbull Insulate Atticsbull Duct Sealingbull Install CFLsbull Solar Screensbull Caulking and Weather-strippingbull Free Smoke amp Carbon Monoxide Detector bull Minor Energy Related Repairs
Saving Energy TogetherPower SaverTM Program
Power Saver Program
bull FREE Energy Saving Productsbull Lower energy costsbull 65000 installed in homes apartmentsbull 4000 installed in commercial buildings
Saving Energy TogetherPower SaverTM Program
Energy Conservation in COA FacilitiesSenate Bill 5 Energy Use vs Energy Cost
295
300
305
310
315
320
325
330
335
340
345
350
Base Year2001
2002 2003 2004 2005 2006
Gig
awat
t-hou
rs
220
230
240
250
260
270
280
290
300
Mill
ion
Dol
lars
Million kWh Cost
Chart1
Million kWh
Cost
Gigawatt-hours
Million Dollars
Senate Bill 5 Energy Use vs Energy Cost
343667472
28619895
33757683
2504536
3260767692
24602549
31773020962
26778741
324036807
2745756918
313494864
2936354518
Sheet1
Sheet1
ampA
Page ampP
Million kWh
Gigawatt-hours
Senate Bill 5 Reported Energy Use
Sheet2
ampA
Page ampP
Million kWh
Cost
Gigawatt-hours
Million Dollars
Senate Bill 5 Energy Use vs Energy Cost
Sheet3
Energy Efficiency Real Reliable and Cost-Effective Alternative
Fuel cost savings assume all saved energy at average gas generation cost
Increased off-system sales margins assumes reduced demand plus associated reserve requirements could be sold for $15kWmonth (after 2007 this is an avoided capacity expense)
Fuel Factor expense increase is increased fuel expense plus purchased capacity cost
GFT reduction is base revenue and fuel cost reductions times 91
Base revenue wDSM
552961968
562415810
569170954
576627290
585065115
594497922
604045383
613657938
623249716
632762255
644233714
Base revenue wo DSM
557087606
570008130
580983849
592794909
605393639
619267826
633200893
646996029
660941168
674903660
690679622
kWh sales wDSM
10776303000
10954134000
11076488000
11213088000
11369667000
11546488000
11724454000
11897588000
12077216000
12256861000
12476492000
kWh sales wo DSM
10861087000
11109639000
11319110000
11544588000
11787201000
12054717000
12323440000
12582205000
12851412000
13121980000
13429845000
1000
kW sales wDSM
2435000
2442000
2443000
2471000
2477000
2486000
2486000
2490000
2515000
2535000
2539000
kW sales wo DSM
2476000
2527000
2572000
2644000
2693000
2746000
2788000
2833000
2898000
2959000
3004000
Fuel Forecast
Budget 2006 (3905)
Tot-2006
Tot-2007
Tot-2008
Tot-2009
Tot-2010
Tot-2011
Tot-2012
Tot-2013
Tot-2014
Tot-2015
Total
MWH
STP
3303339
3488217
3514415
3360759
3465191
3507755
3405921
3614690
3482746
3515635
34658668
FPP
4564135
4517773
4465943
4451812
4418334
4545733
4554494
4586879
4445603
4245674
44796380
Decker
2839387
511212
504648
615748
583574
563845
570235
550098
594337
757598
8090682
Holly
235228
28425
- 0
- 0
- 0
- 0
- 0
- 0
- 0
263653
Sand Hill CC
1533962
1538343
1565132
1615597
1553452
1600111
1516183
1666799
1687122
14276700
SH GT
465155
427320
523864
450359
458722
498276
432337
492003
574949
4322986
Decker GT
157126
216800
280985
238803
246172
264900
238141
266139
294200
2203267
Existing DG
17340
7248
7296
7065
7216
7268
7168
7137
7147
16838
91723
Future DG
110
110
101
2216
2659
4743
5273
7365
7750
17746
48073
PurchasePower
131996
- 0
204000
208800
206400
206400
134400
201600
136000
139200
1568796
Landfill Methane
87493
92450
92704
92450
92450
92450
92704
92450
92450
92450
920052
Future Bioenergy
- 0
- 0
134151
178705
384764
454206
673445
744600
978509
1057336
4605716
Wind
636291
669050
671181
669050
669050
669050
671181
669050
669050
669050
6662004
Solar
684
20026
32685
41438
50311
59183
68298
76929
85801
87839
523193
Shortfall Energy
3308
2419
3355
6021
3311
4269
7050
3075
3868
4281
40957
11584082
11699976
11841366
12004048
12188020
12373249
12553456
12740532
12928204
13159918
123072851
(10512)
(1)
(1)
0
0
(0)
1
1
(0)
0
(10505)
Dollars
STP
14024307
16411783
18054617
17815007
18997196
19874461
19872833
21713134
21541492
22417754
190722584
FPP
47959978
48327184
52942730
56530034
57287196
60262126
61527986
62666810
62927556
61809806
572241406
Decker
161242451
30007075
26150797
28534975
26297430
25902979
27510734
27253106
30904024
41053837
424857407
Holly
15649395
1939153
- 0
- 0
- 0
- 0
- 0
- 0
- 0
17588548
Sand Hill CC
71819840
62147912
53829988
54696364
53773560
56880544
56723452
64324432
66378796
540574888
SH GT
28915407
23018682
25201605
20614580
21546020
24873781
22042049
25993318
31798432
224003872
Decker GT
12129491
14068039
16315347
13248144
14062711
15831205
14654486
17002591
19718490
137030504
Existing DG
1066126
482134
392821
350785
361063
372817
379318
391499
407877
1055934
5260373
Future DG
5688
5352
3321
115774
140956
247241
281454
413559
455875
1154808
2824028
PurchasePower
5000000
- 0
17339160
16429042
16415314
16614357
11144008
17017280
11632503
11967200
123558864
Landfill Methane
3535734
3653844
3663855
3653844
3653844
3653844
3663855
3653844
3653844
3653844
36440353
Future Bioenergy
- 0
- 0
6036769
8041681
17314398
20439270
30305016
33507000
44032792
47579944
207256869
Wind
17374835
18256537
18314921
18256537
18256537
18256537
18314921
18256537
18256537
18256537
181800436
Solar
- 0
- 0
- 0
- 0
- 0
- 0
- 0
- 0
- 0
- 0
- 0
Shortfall Energy
248086
181420
251636
451599
248349
320172
528742
230590
290120
321058
3071771
250457205
245839462
244324412
245526217
247531370
255326093
271114397
278523346
301422961
327166440
2667231902
1792964
10
(12)
6
(1)
10
(27)
4
3
(6)
1793341
Gas MWh
2839387
2902683
2715536
2985730
2888333
2822192
2933522
2736759
3019278
3313869
29157288
Gas cost ($)
161242451
158521208
127324584
123881915
114856517
115285269
125096264
120673092
138224364
158949555
1344055218
Avg gas gen Cost ($MWh)
5679
5461
4689
4149
3977
4085
4264
4409
4578
4796
4610
NO DSM FUEL FACTOR
2006
2007
2008
2009
2010
2011
2012
2013
2014
2015
Thermal Unit Fuel Cost
232662512
236980848
213398064
215549344
211851680
220956944
237247920
240469984
264099856
293228672
Shortfall Purchases
248086
181420
251636
451599
248349
320172
528742
230590
290120
321058
Short-Term Power Purchases
5000000
- 0
29016660
31009042
33965314
36999357
34296508
42869780
40252503
43354700
Fuel Cell Gas Cost
119837
119837
119837
119837
119837
119837
119837
119837
119837
119837
Recoverable ERCOT Expenses
16825273
16825273
16825273
16825273
16825273
16825273
16825273
16825273
16825273
16825273
Fuel Factor Renewables
9998882
9706333
14540565
15223226
23255836
23418594
31052373
32981926
42305054
44649542
Total Fuel Factor Revenue
264854590
263813711
274152035
279178321
286266289
298640176
320070653
333497390
363892643
398499082
Total Renewables
20910569
21910381
28015544
29952062
39224779
42349651
52283792
55417381
65943173
69490325
TotThermal+PurchPwr+Renewables
249864319
245834121
244321076
245522607
247527546
255322004
271110126
278519139
301418805
327162135
Estimated Green Choice Sales
10911686
12204048
13474979
14728836
15968943
18931058
21231418
22435455
23638119
24840783
Fuel Factor Renewables
9998882
9706333
14540565
15223226
23255836
23418594
31052373
32981926
42305054
44649542
Forecast Annual GWh Sales
11110
11319
11545
11787
12055
12323
12582
12851
13122
13430
Average cost per kWh
$ 0023840
$ 0023307
$ 0023747
$ 0023685
$ 0023747
$ 0024234
$ 0025438
$ 0025950
$ 0027732
$ 0029673
Fuel Factors
Secondary
$ 0023475
$ 0022733
$ 0022206
$ 0021895
$ 0021627
$ 0021713
$ 0022535
$ 0022717
$ 0024162
$ 0025715
Primary
$ 0022776
$ 0022056
$ 0021545
$ 0021243
$ 0020984
$ 0021067
$ 0021864
$ 0022041
$ 0023443
$ 0024949
Transmission
$ 0022539
$ 0021828
$ 0021321
$ 0021022
$ 0020766
$ 0020848
$ 0021637
$ 0021812
$ 0023200
$ 0024690
2006
2007
2008
2009
2010
2011
2012
2013
2014
2015
Dag generation
11574
11700
11841
12004
12188
12373
12553
12741
12928
13160
Joe generation
11584
11700
11841
12004
12188
12373
12553
12741
12928
13160
difference
(10)
0
(0)
(0)
(0)
(0)
(0)
0
(0)
0
sales
10954
11076
11213
11370
11546
11724
11898
12077
12257
12476
losses
57
56
56
56
56
55
55
55
55
55
With DSM
Thermal Unit Fuel Cost wDSM
223705664
223742320
198714736
198689904
191639104
196037824
207153584
205853888
223553008
245383552
Short-Term Power Purchases
5000000
- 0
17339160
16429042
16415314
16614357
11144008
17017280
11632503
11967200
Average cost per kWh
$ 0023361
$ 0022623
$ 0022099
$ 0021789
$ 0021523
$ 0021608
$ 0022426
$ 0022607
$ 0024046
$ 0025590
Forecast Annual GWh Sales
10954
11076
11213
11370
11546
11724
11898
12077
12257
12476
255897742
250575183
247791207
247738881
248503713
253336056
266823817
273028794
294725795
319266462
CASH FLOW PURCHASE OPTION
2005
2006
2007
2008
2009
2010
2011
2012
2013
2014
2015
Base revenue reduction
4125638
7592320
11812895
16167619
20328524
24769904
29155510
33338091
37691451
42141405
46445908
Fuel cost reduction
5166240
8956848
13238528
14683328
16859440
20212576
24919120
30094336
34616096
40546848
47845120
Potential off-system sales margins
2767500
5737500
8707500
Capacity cost reduction
12000000
15000000
18000000
21000000
24000000
27000000
30000000
33000000
GFT reduction
845561
660413
773705
527757
576669
709301
827386
851560
807636
944644
1055853
845560920627699
Program cost
20689324
22819634
22819634
22819634
22819634
22819634
22819634
22819634
22819634
22819634
22819634
Recovery through base rates
14405492
14639186
14799075
14977916
15183688
15416391
15650684
15878624
16115254
16352636
16645725
Cash flow
-6796409
-9374854
-10352249
-23481580
-27387801
-31463846
-35497075
-39427542
-43588195
-47663759
-51563965
2005
2006
2007
2008
2009
2010
2011
2012
2013
2014
2015
Base Revenue Reduction
$ (4125638)
$ (7592320)
$ (11812895)
$ (16167619)
$ (20328524)
$ (24769904)
$ (29155510)
$ (33338091)
$ (37691451)
$ (42141405)
$ (46445908)
Fuel Revenue Reduction
$ (5166240)
$ (8956848)
$ (13238528)
$ (26683328)
$ (31859440)
$ (38212576)
$ (45919120)
$ (54094336)
$ (61616096)
$ (70546848)
$ (80845120)
Fuel Cost Reduction
$ 5166240
$ 8956848
$ 13238528
$ 26683328
$ 31859440
$ 38212576
$ 45919120
$ 54094336
$ 61616096
$ 70546848
$ 80845120
Potential off-system sales margins
$ 2767500
$ 5737500
$ 8707500
$ - 0
$ - 0
$ - 0
$ - 0
$ - 0
$ - 0
$ - 0
$ - 0
Net program costs
$ (5438271)
$ (7520034)
$ (7246854)
$ (7313961)
$ (7059277)
$ (6693942)
$ (6341565)
$ (6089451)
$ (5896744)
$ (5522354)
$ (5118057)
AEs net cash impact
$ (6796409)
$ (9374854)
$ (10352249)
$ (23481580)
$ (27387801)
$ (31463846)
$ (35497075)
$ (39427542)
$ (43588195)
$ (47663759)
$ (51563965)
Customer savings
$ 9291878
$ 16549168
$ 25051423
$ 42850947
$ 52187964
$ 62982480
$ 75074630
$ 87432427
$ 99307547
$ 112688253
$ 127291028
CASH FLOW BUILD OPTION
2005
2006
2007
2008
2009
2010
2011
2012
2013
2014
2015
Base revenue reduction
4125638
7592320
11812895
16167619
20328524
24769904
29155510
33338091
37691451
42141405
46445908
Fuel cost reduction
5166240
8956848
13238528
14683328
16859440
20212576
24919120
30094336
34616096
40546848
47845120
Potential off-system sales margins
2767500
5737500
8707500
Capacity cost reduction
7736295
11604442
11604442
15472589
15472589
19340737
19340737
23208884
GFT reduction
845561
660413
773705
527757
576669
709301
827386
851560
807636
944644
1055853
Program cost
20689324
22819634
22819634
22819634
22819634
22819634
22819634
22819634
22819634
22819634
22819634
Recovery through base rates
14405492
14639186
14799075
14977916
15183688
15416391
15650684
15878624
16115254
16352636
16645725
Cash flow
-6796409
-9374854
-10352249
-15745285
-15783359
-19859404
-20024486
-23954952
-24247459
-28323022
-28355080
-21195738994
Capacity cost Build option
Reduced capacity requirement (kW)
46125
95625
145125
194625
243000
292500
339750
385875
430875
477000
523125
Capacity added
200
300
300
400
400
500
500
600
Annual capacity cost
$386814737
$7736295
$11604442
$11604442
$15472589
$15472589
$19340737
$19340737
$23208884
Capacity cost Buy option
Reduced capacity requirement (kW)
46125
95625
145125
194625
243000
292500
339750
385875
430875
477000
523125
Capacity added
200
250
300
350
400
450
500
550
Annual capacity cost
$600000000
$12000000
$15000000
$18000000
$21000000
$24000000
$27000000
$30000000
$33000000
1994
2004
2005
2006
2007
2008
2009
2010
2011
2012
2013
2014
2015
Net MWh to system
7659242
10855000
11388814
11573570
11699976
11841366
12004047
12188019
12373248
12553455
12740532
12928203
13159916
Revenue multiplier
100
142
149
151
153
155
157
159
162
164
166
169
172
Revenue allocated to DSM
9688028
13730281
14405492
14639186
14799075
14977916
15183688
15416391
15650684
15878624
16115254
16352636
16645725
CentskWh in rates for DSM
0134
0134
0134
0134
0134
0134
0134
0133
0133
0133
0133
0133
Annual sales (MWh)
10262000
10776303
10954134
11076488
11213088
11369667
11546488
11724454
11897588
12077216
12256861
12476492
2006
2006
2007
2007
2008
2008
2009
2009
2010
2010
2011
2011
2012
2012
2013
2013
2014
2014
2015
2015
2005
2005
2005
2006
2006
2006
2007
2007
2007
2008
2008
2008
2009
2009
2009
2010
2010
2010
2011
2011
2011
2012
2012
2012
2013
2013
2013
2014
2014
2014
2015
2015
2015
2005
2006
2007
2008
2009
2010
2011
2012
2013
2014
2015
Base Revenue Reduction
$ (4125638)
$ (7592320)
$ (11812895)
$ (16167619)
$ (20328524)
$ (24769904)
$ (29155510)
$ (33338091)
$ (37691451)
$ (42141405)
$ (46445908)
Fuel Revenue Reduction
$ (5166240)
$ (8956848)
$ (13238528)
$ (26683328)
$ (31859440)
$ (38212576)
$ (45919120)
$ (54094336)
$ (61616096)
$ (70546848)
$ (80845120)
Fuel Cost Reduction
$ 5166240
$ 8956848
$ 13238528
$ 26683328
$ 31859440
$ 38212576
$ 45919120
$ 54094336
$ 61616096
$ 70546848
$ 80845120
Potential off-system sales margins
$ 2767500
$ 5737500
$ 8707500
$ - 0
$ - 0
$ - 0
$ - 0
$ - 0
$ - 0
$ - 0
$ - 0
Net program costs
$ (5438271)
$ (7520034)
$ (7246854)
$ (7313961)
$ (7059277)
$ (6693942)
$ (6341565)
$ (6089451)
$ (5896744)
$ (5522354)
$ (5118057)
AEs net cash impact
$ (6796409)
$ (9374854)
$ (10352249)
$ (23481580)
$ (27387801)
$ (31463846)
$ (35497075)
$ (39427542)
$ (43588195)
$ (47663759)
$ (51563965)
Customer savings
$ (9291878)
$ (16549168)
$ (25051423)
$ (42850947)
$ (52187964)
$ (62982480)
$ (75074630)
$ (87432427)
$ (99307547)
$ (112688253)
$ (127291028)
Estimated Annual Impact
Base Revenue Reduction
$ (16134252)
Fuel Revenue Reduction
$ (23790144)
Fuel Cost Reduction
$ 23790144
Potential off-system sales margins
$ 2889000
Net program costs
$ (7166814)
AEs net cash impact
$ (20412066)
Customer savings
$ (39924396)
CURRENT FORECAST
PROPOSED PROJECTION
DSM Analysis
2007
2008
2007
2008
keyed in to round
Base Revenue Reduction
(12000000)
(16000000)
(12000000)
(16000000)
Fuel Revenue Reduction
(13000000)
(15000000)
(5000000)
(7000000)
Customer Savings (Bill Reduction)
(25000000)
(31000000)
(17000000)
(23000000)
Fuel Cost Reduction
13000000
15000000
5000000
7000000
KW
$KW
NET
5 profit
Potential Off-system Capacity Sales
9000000
9000000
6207
$KW
145000
$ 62
$ 8990000
Net of fuel and GFT
$ 449500
TCOS Expense Reduction
900000
1000000
900000
1000000
GFT Reduction
2000000
3000000
2000000
3000000
Program Cost
(23000000)
(23000000)
Recovery through Base Rates
15000000
15000000
AEs Net Income Impact
(8100000)
(20000000)
(17100000)
(35000000)
Deferred Cost of Capacity
12000000
- 0
AEs Net Cash Impact
(8100000)
(8000000)
(17100000)
- 0
Outline for Oct 10 Leadership Team Update
1 Components of BenefitCost Ratios
2 Cash Flow of DSM
CURRENT FORECAST
PROPOSED PROJECTION
DSM Analysis
2007
2008
2007
2008
Base Revenue Reduction
(11812895)
(16167619)
(11812895)
(16167619)
Fuel Revenue Reduction
(13238528)
(14683328)
(5217969)
(5396810)
Fuel Cost Reduction
13238528
14683328
5217969
5396810
Potential off-system sales margins
8707500
8707500
Fuel Revenue Increase-Capacity
12000000
12000000
Fuel Cost Increase-Capacity
(12000000)
(12000000)
TCOS expense reduction
925987
977987
925987
977987
GFT reduction
2279680
2807436
2279680
2807436
Program cost
(22819634)
(22819634)
Recovery through base rates
14799075
14977916
AEs net income impact
(7920288)
(20223914)
100271
(12382196)
Deferred Cost of Capacity
12000000
12000000
AEs net cash impact including deferral
(7920288)
(8223914)
100271
(382196)
Customer savings-(net)
$ (25051423)
$ (30850947)
$ (17030864)
$ (21564429)
Recommend recovery thru fuel factor
Offset customer fuel savings due to DSM
Would not offset revenue loss
(before amp after)
In 2007 we still have excess capacity
Cost recovery
3yrs - recommended purch power
power is only needed during peak-dont utilize a plant
need declines as renewables increases
cash flow
Dynamic pricing-TOU rates motivating cust to conserve energy
would replace some of the energy efficiency rebates
option to self-generate
TCOS expense reduction due to DSM savings
Historical
Historical
Historical
Historical
Historical
Preliminary
Forecast
Forecast
Forecast
Forecast
Forecast
Forecast
Forecast
Forecast
Forecast
Forecast
2000
2001
2002
2003
2004
2005
2006
2007
2008
2009
2010
2011
2012
2013
2014
2015
ERCOT Postage Stamp Rate
1476
1528
1661
1778
1925
2055
2185
2315
2445
2575
2705
2835
2965
3095
3225
3355
Estimated DSM-kW savings applied to average 4CP
40000
40000
40000
40000
40000
40000
40000
40000
40000
40000
40000
Reduction to TCOS expense
$ 821987
$ 873987
$ 925987
$ 977987
$ 1029987
$ 1081987
$ 1133987
$ 1185987
$ 1237987
$ 1289987
$ 1341987
2005
2006
2007
2008
2009
2010
2011
2012
2013
2014
2015
Base revenue reduction
4125638
7592320
11812895
16167619
20328524
24769904
29155510
33338091
37691451
42141405
46445908
kWh reduction
84784000
155505000
242622000
331500000
417534000
508229000
598986000
684617000
774196000
865119000
953353000
Fuel cost reduction
5166240
8956848
13238528
14683328
16859440
20212576
24919120
30094336
34616096
40546848
47845120
Demand reduction (kW)
41000
85000
129000
173000
216000
260000
302000
343000
383000
424000
465000
Reduced reserve requirement (kW)
5125
10625
16125
21625
27000
32500
37750
42875
47875
53000
58125
2008
2009
2010
2011
2012
2013
2014
2015
Reduced capacity requirement (kW)
46125
95625
145125
194625
243000
292500
339750
385875
430875
477000
523125
194625
243000
292500
339750
385875
430875
477000
523125
Increased off-system sales margins
2767500
5737500
8707500
Capacity cost reduction
11677500
14580000
17550000
20385000
23152500
25852500
28620000
31387500
Fuel Factor expense decrease ($)
5166240
8956848
13238528
26360828
31439440
37762576
45304120
53246836
60468596
69166848
79232620
Fuel Factor decrease (centskWh)
00005
00007
00016
00019
00022
00026
00030
00033
00037
00041
Fuel Factor decrease
2
3
7
9
10
12
13
15
15
16
GFT reduction
845561
1505974
2279680
2807436
3384105
4093406
4920791
5772351
6579987
7524631
8580484
Program cost
20689324
22819634
22819634
22819634
22819634
22819634
22819634
22819634
22819634
22819634
22819634
Recovery through base rates
14405492
14639186
14799075
14977916
15183688
15416391
15650684
15878624
16115254
16352636
16645725
Cash flow
-7641970
-10035268
-11125954
-12331837
-13384470
-14623147
-15939461
-17126601
-18543331
-19988403
-21232317
Fuel cost savings assume all saved energy at average gas generation cost
Increased off-system sales margins assumes reduced demand plus associated reserve requirements could be sold for $15kWmonth (after 2007 this is an avoided capacity expense)
Fuel Factor expense increase is increased fuel expense plus purchased capacity cost
GFT reduction is base revenue and fuel cost reductions times 91
Base revenue wDSM
552961968
562415810
569170954
576627290
585065115
594497922
604045383
613657938
623249716
632762255
644233714
Base revenue wo DSM
557087606
570008130
580983849
592794909
605393639
619267826
633200893
646996029
660941168
674903660
690679622
kWh sales wDSM
10776303000
10954134000
11076488000
11213088000
11369667000
11546488000
11724454000
11897588000
12077216000
12256861000
12476492000
kWh sales wo DSM
10861087000
11109639000
11319110000
11544588000
11787201000
12054717000
12323440000
12582205000
12851412000
13121980000
13429845000
1000
kW sales wDSM
2435000
2442000
2443000
2471000
2477000
2486000
2486000
2490000
2515000
2535000
2539000
kW sales wo DSM
2476000
2527000
2572000
2644000
2693000
2746000
2788000
2833000
2898000
2959000
3004000
Fuel Forecast
Budget 2006 (3905)
Tot-2006
Tot-2007
Tot-2008
Tot-2009
Tot-2010
Tot-2011
Tot-2012
Tot-2013
Tot-2014
Tot-2015
Total
MWH
STP
3303339
3488217
3514415
3360759
3465191
3507755
3405921
3614690
3482746
3515635
34658668
FPP
4564135
4517773
4465943
4451812
4418334
4545733
4554494
4586879
4445603
4245674
44796380
Decker
2839387
511212
504648
615748
583574
563845
570235
550098
594337
757598
8090682
Holly
235228
28425
- 0
- 0
- 0
- 0
- 0
- 0
- 0
263653
Sand Hill CC
1533962
1538343
1565132
1615597
1553452
1600111
1516183
1666799
1687122
14276700
SH GT
465155
427320
523864
450359
458722
498276
432337
492003
574949
4322986
Decker GT
157126
216800
280985
238803
246172
264900
238141
266139
294200
2203267
Existing DG
17340
7248
7296
7065
7216
7268
7168
7137
7147
16838
91723
Future DG
110
110
101
2216
2659
4743
5273
7365
7750
17746
48073
PurchasePower
131996
- 0
204000
208800
206400
206400
134400
201600
136000
139200
1568796
Landfill Methane
87493
92450
92704
92450
92450
92450
92704
92450
92450
92450
920052
Future Bioenergy
- 0
- 0
134151
178705
384764
454206
673445
744600
978509
1057336
4605716
Wind
636291
669050
671181
669050
669050
669050
671181
669050
669050
669050
6662004
Solar
684
20026
32685
41438
50311
59183
68298
76929
85801
87839
523193
Shortfall Energy
3308
2419
3355
6021
3311
4269
7050
3075
3868
4281
40957
11584082
11699976
11841366
12004048
12188020
12373249
12553456
12740532
12928204
13159918
123072851
(10512)
(1)
(1)
0
0
(0)
1
1
(0)
0
(10505)
Dollars
STP
14024307
16411783
18054617
17815007
18997196
19874461
19872833
21713134
21541492
22417754
190722584
FPP
47959978
48327184
52942730
56530034
57287196
60262126
61527986
62666810
62927556
61809806
572241406
Decker
161242451
30007075
26150797
28534975
26297430
25902979
27510734
27253106
30904024
41053837
424857407
Holly
15649395
1939153
- 0
- 0
- 0
- 0
- 0
- 0
- 0
17588548
Sand Hill CC
71819840
62147912
53829988
54696364
53773560
56880544
56723452
64324432
66378796
540574888
SH GT
28915407
23018682
25201605
20614580
21546020
24873781
22042049
25993318
31798432
224003872
Decker GT
12129491
14068039
16315347
13248144
14062711
15831205
14654486
17002591
19718490
137030504
Existing DG
1066126
482134
392821
350785
361063
372817
379318
391499
407877
1055934
5260373
Future DG
5688
5352
3321
115774
140956
247241
281454
413559
455875
1154808
2824028
PurchasePower
5000000
- 0
17339160
16429042
16415314
16614357
11144008
17017280
11632503
11967200
123558864
Landfill Methane
3535734
3653844
3663855
3653844
3653844
3653844
3663855
3653844
3653844
3653844
36440353
Future Bioenergy
- 0
- 0
6036769
8041681
17314398
20439270
30305016
33507000
44032792
47579944
207256869
Wind
17374835
18256537
18314921
18256537
18256537
18256537
18314921
18256537
18256537
18256537
181800436
Solar
- 0
- 0
- 0
- 0
- 0
- 0
- 0
- 0
- 0
- 0
- 0
Shortfall Energy
248086
181420
251636
451599
248349
320172
528742
230590
290120
321058
3071771
250457205
245839462
244324412
245526217
247531370
255326093
271114397
278523346
301422961
327166440
2667231902
1792964
10
(12)
6
(1)
10
(27)
4
3
(6)
1793341
Gas MWh
2839387
2902683
2715536
2985730
2888333
2822192
2933522
2736759
3019278
3313869
29157288
Gas cost ($)
161242451
158521208
127324584
123881915
114856517
115285269
125096264
120673092
138224364
158949555
1344055218
Avg gas gen Cost ($MWh)
5679
5461
4689
4149
3977
4085
4264
4409
4578
4796
4610
NO DSM FUEL FACTOR
2006
2007
2008
2009
2010
2011
2012
2013
2014
2015
Thermal Unit Fuel Cost
232662512
236980848
213398064
215549344
211851680
220956944
237247920
240469984
264099856
293228672
Shortfall Purchases
248086
181420
251636
451599
248349
320172
528742
230590
290120
321058
Short-Term Power Purchases
5000000
- 0
29016660
31009042
33965314
36999357
34296508
42869780
40252503
43354700
Fuel Cell Gas Cost
119837
119837
119837
119837
119837
119837
119837
119837
119837
119837
Recoverable ERCOT Expenses
16825273
16825273
16825273
16825273
16825273
16825273
16825273
16825273
16825273
16825273
Fuel Factor Renewables
9998882
9706333
14540565
15223226
23255836
23418594
31052373
32981926
42305054
44649542
Total Fuel Factor Revenue
264854590
263813711
274152035
279178321
286266289
298640176
320070653
333497390
363892643
398499082
Total Renewables
20910569
21910381
28015544
29952062
39224779
42349651
52283792
55417381
65943173
69490325
TotThermal+PurchPwr+Renewables
249864319
245834121
244321076
245522607
247527546
255322004
271110126
278519139
301418805
327162135
Estimated Green Choice Sales
10911686
12204048
13474979
14728836
15968943
18931058
21231418
22435455
23638119
24840783
Fuel Factor Renewables
9998882
9706333
14540565
15223226
23255836
23418594
31052373
32981926
42305054
44649542
Forecast Annual GWh Sales
11110
11319
11545
11787
12055
12323
12582
12851
13122
13430
Average cost per kWh
$ 0023840
$ 0023307
$ 0023747
$ 0023685
$ 0023747
$ 0024234
$ 0025438
$ 0025950
$ 0027732
$ 0029673
Fuel Factors
Secondary
$ 0023475
$ 0022733
$ 0022206
$ 0021895
$ 0021627
$ 0021713
$ 0022535
$ 0022717
$ 0024162
$ 0025715
Primary
$ 0022776
$ 0022056
$ 0021545
$ 0021243
$ 0020984
$ 0021067
$ 0021864
$ 0022041
$ 0023443
$ 0024949
Transmission
$ 0022539
$ 0021828
$ 0021321
$ 0021022
$ 0020766
$ 0020848
$ 0021637
$ 0021812
$ 0023200
$ 0024690
2006
2007
2008
2009
2010
2011
2012
2013
2014
2015
Dag generation
11574
11700
11841
12004
12188
12373
12553
12741
12928
13160
Joe generation
11584
11700
11841
12004
12188
12373
12553
12741
12928
13160
difference
(10)
0
(0)
(0)
(0)
(0)
(0)
0
(0)
0
sales
10954
11076
11213
11370
11546
11724
11898
12077
12257
12476
losses
57
56
56
56
56
55
55
55
55
55
With DSM
Thermal Unit Fuel Cost wDSM
223705664
223742320
198714736
198689904
191639104
196037824
207153584
205853888
223553008
245383552
Short-Term Power Purchases
5000000
- 0
17339160
16429042
16415314
16614357
11144008
17017280
11632503
11967200
Average cost per kWh
$ 0023361
$ 0022623
$ 0022099
$ 0021789
$ 0021523
$ 0021608
$ 0022426
$ 0022607
$ 0024046
$ 0025590
Forecast Annual GWh Sales
10954
11076
11213
11370
11546
11724
11898
12077
12257
12476
255897742
250575183
247791207
247738881
248503713
253336056
266823817
273028794
294725795
319266462
CASH FLOW PURCHASE OPTION
2005
2006
2007
2008
2009
2010
2011
2012
2013
2014
2015
Base revenue reduction
4125638
7592320
11812895
16167619
20328524
24769904
29155510
33338091
37691451
42141405
46445908
Fuel cost reduction
5166240
8956848
13238528
14683328
16859440
20212576
24919120
30094336
34616096
40546848
47845120
Potential off-system sales margins
2767500
5737500
8707500
Capacity cost reduction
12000000
15000000
18000000
21000000
24000000
27000000
30000000
33000000
GFT reduction
845561
660413
773705
527757
576669
709301
827386
851560
807636
944644
1055853
845560920627699
Program cost
20689324
22819634
22819634
22819634
22819634
22819634
22819634
22819634
22819634
22819634
22819634
Recovery through base rates
14405492
14639186
14799075
14977916
15183688
15416391
15650684
15878624
16115254
16352636
16645725
Cash flow
-6796409
-9374854
-10352249
-23481580
-27387801
-31463846
-35497075
-39427542
-43588195
-47663759
-51563965
2005
2006
2007
2008
2009
2010
2011
2012
2013
2014
2015
Base Revenue Reduction
$ (4125638)
$ (7592320)
$ (11812895)
$ (16167619)
$ (20328524)
$ (24769904)
$ (29155510)
$ (33338091)
$ (37691451)
$ (42141405)
$ (46445908)
Fuel Revenue Reduction
$ (5166240)
$ (8956848)
$ (13238528)
$ (26683328)
$ (31859440)
$ (38212576)
$ (45919120)
$ (54094336)
$ (61616096)
$ (70546848)
$ (80845120)
Fuel Cost Reduction
$ 5166240
$ 8956848
$ 13238528
$ 26683328
$ 31859440
$ 38212576
$ 45919120
$ 54094336
$ 61616096
$ 70546848
$ 80845120
Potential off-system sales margins
$ 2767500
$ 5737500
$ 8707500
$ - 0
$ - 0
$ - 0
$ - 0
$ - 0
$ - 0
$ - 0
$ - 0
Net program costs
$ (5438271)
$ (7520034)
$ (7246854)
$ (7313961)
$ (7059277)
$ (6693942)
$ (6341565)
$ (6089451)
$ (5896744)
$ (5522354)
$ (5118057)
AEs net cash impact
$ (6796409)
$ (9374854)
$ (10352249)
$ (23481580)
$ (27387801)
$ (31463846)
$ (35497075)
$ (39427542)
$ (43588195)
$ (47663759)
$ (51563965)
Customer savings
$ 9291878
$ 16549168
$ 25051423
$ 42850947
$ 52187964
$ 62982480
$ 75074630
$ 87432427
$ 99307547
$ 112688253
$ 127291028
CASH FLOW BUILD OPTION
2005
2006
2007
2008
2009
2010
2011
2012
2013
2014
2015
Base revenue reduction
4125638
7592320
11812895
16167619
20328524
24769904
29155510
33338091
37691451
42141405
46445908
Fuel cost reduction
5166240
8956848
13238528
14683328
16859440
20212576
24919120
30094336
34616096
40546848
47845120
Potential off-system sales margins
2767500
5737500
8707500
Capacity cost reduction
7736295
11604442
11604442
15472589
15472589
19340737
19340737
23208884
GFT reduction
845561
660413
773705
527757
576669
709301
827386
851560
807636
944644
1055853
Program cost
20689324
22819634
22819634
22819634
22819634
22819634
22819634
22819634
22819634
22819634
22819634
Recovery through base rates
14405492
14639186
14799075
14977916
15183688
15416391
15650684
15878624
16115254
16352636
16645725
Cash flow
-6796409
-9374854
-10352249
-15745285
-15783359
-19859404
-20024486
-23954952
-24247459
-28323022
-28355080
-21195738994
Capacity cost Build option
Reduced capacity requirement (kW)
46125
95625
145125
194625
243000
292500
339750
385875
430875
477000
523125
Capacity added
200
300
300
400
400
500
500
600
Annual capacity cost
$386814737
$7736295
$11604442
$11604442
$15472589
$15472589
$19340737
$19340737
$23208884
Capacity cost Buy option
Reduced capacity requirement (kW)
46125
95625
145125
194625
243000
292500
339750
385875
430875
477000
523125
Capacity added
200
250
300
350
400
450
500
550
Annual capacity cost
$600000000
$12000000
$15000000
$18000000
$21000000
$24000000
$27000000
$30000000
$33000000
1994
2004
2005
2006
2007
2008
2009
2010
2011
2012
2013
2014
2015
Net MWh to system
7659242
10855000
11388814
11573570
11699976
11841366
12004047
12188019
12373248
12553455
12740532
12928203
13159916
Revenue multiplier
100
142
149
151
153
155
157
159
162
164
166
169
172
Revenue allocated to DSM
9688028
13730281
14405492
14639186
14799075
14977916
15183688
15416391
15650684
15878624
16115254
16352636
16645725
CentskWh in rates for DSM
0134
0134
0134
0134
0134
0134
0134
0133
0133
0133
0133
0133
Annual sales (MWh)
10262000
10776303
10954134
11076488
11213088
11369667
11546488
11724454
11897588
12077216
12256861
12476492
Sheet3
Saving Energy TogetherPower SaverTM Program
DSM Analysis 2007 2008
Base Revenue Reduction (12000000) (16000000) Fuel Revenue Reduction (13000000) (15000000)
AEs Net Income Impact (8100000) (20000000) Deferred Cost of Capacity 12000000 AEs Net Cash Impact (8100000) (8000000)
CURRENT FORECAST
Cash Flow Projection of DSM
Cash flow chart
Chart1
Fuel Cost Reduction
Capacity Expense Reduction
Total Decrease In Expenses
REDUCTION IN EXPENSES DUE TO DSM PROGRAMS
5166240
5166240
8956848
8956848
13238528
13238528
14683328
26360828
11677500
16859440
31439440
14580000
20212576
37762576
17550000
24919120
45304120
20385000
30094336
53246836
23152500
34616096
60468596
25852500
40546848
69166848
28620000
47845120
79232620
31387500
Chart4
Fuel Cost without DSM
Fuel Cost with DSM
REDUCTION IN FUEL COST DUE TO DSM PROGRAMS
00233611231
00238400717
00226232559
00233069306
00220985648
00237472342
00217888198
00236848698
00215229268
00237472426
00216083296
00242335075
00224259386
00254383594
00226073357
00259502528
00240455083
00277315347
00255904506
00296726494
Sheet1
Sheet3
Saving Energy TogetherPower SaverTM Program
Questions
Saving Energy TogetherPower SaverTM Program
FY 2006 Achievements
Energy SavingsMW of
Programs Saved Goal Goal
Residential 126 115 110
Commercial 154 121 127
Demand Response 146 156 94
Solar 055 060 93
Grand Total 432 398 108
Saving Energy TogetherPower SaverTM Program
MW SavedPrograms FY2005 FY2006
Residential 119 126
Commercial 153 154
Demand Response 116 146
Solar 06 055
Grand Total 394 432
Energy Savings ComparisonFY2005 to FY2006
Saving Energy TogetherPower SaverTM Program
DSM Summary
bull DSM programs are saving peak kW amp kWh
bull Cost-effectiveness analyses include full program costs
bull DSM goals and budgets should vary to support AE resource plan requirements
Saving Energy TogetherPower SaverTM Program
Free Home WeatherizationEnergy Improvementsbull Insulate Atticsbull Duct Sealingbull Install CFLsbull Solar Screensbull Caulking and Weather-strippingbull Free Smoke amp Carbon Monoxide Detector bull Minor Energy Related Repairs
Saving Energy TogetherPower SaverTM Program
Power Saver Program
bull FREE Energy Saving Productsbull Lower energy costsbull 65000 installed in homes apartmentsbull 4000 installed in commercial buildings
Saving Energy TogetherPower SaverTM Program
Energy Conservation in COA FacilitiesSenate Bill 5 Energy Use vs Energy Cost
295
300
305
310
315
320
325
330
335
340
345
350
Base Year2001
2002 2003 2004 2005 2006
Gig
awat
t-hou
rs
220
230
240
250
260
270
280
290
300
Mill
ion
Dol
lars
Million kWh Cost
Chart1
Million kWh
Cost
Gigawatt-hours
Million Dollars
Senate Bill 5 Energy Use vs Energy Cost
343667472
28619895
33757683
2504536
3260767692
24602549
31773020962
26778741
324036807
2745756918
313494864
2936354518
Sheet1
Sheet1
ampA
Page ampP
Million kWh
Gigawatt-hours
Senate Bill 5 Reported Energy Use
Sheet2
ampA
Page ampP
Million kWh
Cost
Gigawatt-hours
Million Dollars
Senate Bill 5 Energy Use vs Energy Cost
Sheet3
Energy Efficiency Real Reliable and Cost-Effective Alternative
Fuel cost savings assume all saved energy at average gas generation cost
Increased off-system sales margins assumes reduced demand plus associated reserve requirements could be sold for $15kWmonth (after 2007 this is an avoided capacity expense)
Fuel Factor expense increase is increased fuel expense plus purchased capacity cost
GFT reduction is base revenue and fuel cost reductions times 91
Base revenue wDSM
552961968
562415810
569170954
576627290
585065115
594497922
604045383
613657938
623249716
632762255
644233714
Base revenue wo DSM
557087606
570008130
580983849
592794909
605393639
619267826
633200893
646996029
660941168
674903660
690679622
kWh sales wDSM
10776303000
10954134000
11076488000
11213088000
11369667000
11546488000
11724454000
11897588000
12077216000
12256861000
12476492000
kWh sales wo DSM
10861087000
11109639000
11319110000
11544588000
11787201000
12054717000
12323440000
12582205000
12851412000
13121980000
13429845000
1000
kW sales wDSM
2435000
2442000
2443000
2471000
2477000
2486000
2486000
2490000
2515000
2535000
2539000
kW sales wo DSM
2476000
2527000
2572000
2644000
2693000
2746000
2788000
2833000
2898000
2959000
3004000
Fuel Forecast
Budget 2006 (3905)
Tot-2006
Tot-2007
Tot-2008
Tot-2009
Tot-2010
Tot-2011
Tot-2012
Tot-2013
Tot-2014
Tot-2015
Total
MWH
STP
3303339
3488217
3514415
3360759
3465191
3507755
3405921
3614690
3482746
3515635
34658668
FPP
4564135
4517773
4465943
4451812
4418334
4545733
4554494
4586879
4445603
4245674
44796380
Decker
2839387
511212
504648
615748
583574
563845
570235
550098
594337
757598
8090682
Holly
235228
28425
- 0
- 0
- 0
- 0
- 0
- 0
- 0
263653
Sand Hill CC
1533962
1538343
1565132
1615597
1553452
1600111
1516183
1666799
1687122
14276700
SH GT
465155
427320
523864
450359
458722
498276
432337
492003
574949
4322986
Decker GT
157126
216800
280985
238803
246172
264900
238141
266139
294200
2203267
Existing DG
17340
7248
7296
7065
7216
7268
7168
7137
7147
16838
91723
Future DG
110
110
101
2216
2659
4743
5273
7365
7750
17746
48073
PurchasePower
131996
- 0
204000
208800
206400
206400
134400
201600
136000
139200
1568796
Landfill Methane
87493
92450
92704
92450
92450
92450
92704
92450
92450
92450
920052
Future Bioenergy
- 0
- 0
134151
178705
384764
454206
673445
744600
978509
1057336
4605716
Wind
636291
669050
671181
669050
669050
669050
671181
669050
669050
669050
6662004
Solar
684
20026
32685
41438
50311
59183
68298
76929
85801
87839
523193
Shortfall Energy
3308
2419
3355
6021
3311
4269
7050
3075
3868
4281
40957
11584082
11699976
11841366
12004048
12188020
12373249
12553456
12740532
12928204
13159918
123072851
(10512)
(1)
(1)
0
0
(0)
1
1
(0)
0
(10505)
Dollars
STP
14024307
16411783
18054617
17815007
18997196
19874461
19872833
21713134
21541492
22417754
190722584
FPP
47959978
48327184
52942730
56530034
57287196
60262126
61527986
62666810
62927556
61809806
572241406
Decker
161242451
30007075
26150797
28534975
26297430
25902979
27510734
27253106
30904024
41053837
424857407
Holly
15649395
1939153
- 0
- 0
- 0
- 0
- 0
- 0
- 0
17588548
Sand Hill CC
71819840
62147912
53829988
54696364
53773560
56880544
56723452
64324432
66378796
540574888
SH GT
28915407
23018682
25201605
20614580
21546020
24873781
22042049
25993318
31798432
224003872
Decker GT
12129491
14068039
16315347
13248144
14062711
15831205
14654486
17002591
19718490
137030504
Existing DG
1066126
482134
392821
350785
361063
372817
379318
391499
407877
1055934
5260373
Future DG
5688
5352
3321
115774
140956
247241
281454
413559
455875
1154808
2824028
PurchasePower
5000000
- 0
17339160
16429042
16415314
16614357
11144008
17017280
11632503
11967200
123558864
Landfill Methane
3535734
3653844
3663855
3653844
3653844
3653844
3663855
3653844
3653844
3653844
36440353
Future Bioenergy
- 0
- 0
6036769
8041681
17314398
20439270
30305016
33507000
44032792
47579944
207256869
Wind
17374835
18256537
18314921
18256537
18256537
18256537
18314921
18256537
18256537
18256537
181800436
Solar
- 0
- 0
- 0
- 0
- 0
- 0
- 0
- 0
- 0
- 0
- 0
Shortfall Energy
248086
181420
251636
451599
248349
320172
528742
230590
290120
321058
3071771
250457205
245839462
244324412
245526217
247531370
255326093
271114397
278523346
301422961
327166440
2667231902
1792964
10
(12)
6
(1)
10
(27)
4
3
(6)
1793341
Gas MWh
2839387
2902683
2715536
2985730
2888333
2822192
2933522
2736759
3019278
3313869
29157288
Gas cost ($)
161242451
158521208
127324584
123881915
114856517
115285269
125096264
120673092
138224364
158949555
1344055218
Avg gas gen Cost ($MWh)
5679
5461
4689
4149
3977
4085
4264
4409
4578
4796
4610
NO DSM FUEL FACTOR
2006
2007
2008
2009
2010
2011
2012
2013
2014
2015
Thermal Unit Fuel Cost
232662512
236980848
213398064
215549344
211851680
220956944
237247920
240469984
264099856
293228672
Shortfall Purchases
248086
181420
251636
451599
248349
320172
528742
230590
290120
321058
Short-Term Power Purchases
5000000
- 0
29016660
31009042
33965314
36999357
34296508
42869780
40252503
43354700
Fuel Cell Gas Cost
119837
119837
119837
119837
119837
119837
119837
119837
119837
119837
Recoverable ERCOT Expenses
16825273
16825273
16825273
16825273
16825273
16825273
16825273
16825273
16825273
16825273
Fuel Factor Renewables
9998882
9706333
14540565
15223226
23255836
23418594
31052373
32981926
42305054
44649542
Total Fuel Factor Revenue
264854590
263813711
274152035
279178321
286266289
298640176
320070653
333497390
363892643
398499082
Total Renewables
20910569
21910381
28015544
29952062
39224779
42349651
52283792
55417381
65943173
69490325
TotThermal+PurchPwr+Renewables
249864319
245834121
244321076
245522607
247527546
255322004
271110126
278519139
301418805
327162135
Estimated Green Choice Sales
10911686
12204048
13474979
14728836
15968943
18931058
21231418
22435455
23638119
24840783
Fuel Factor Renewables
9998882
9706333
14540565
15223226
23255836
23418594
31052373
32981926
42305054
44649542
Forecast Annual GWh Sales
11110
11319
11545
11787
12055
12323
12582
12851
13122
13430
Average cost per kWh
$ 0023840
$ 0023307
$ 0023747
$ 0023685
$ 0023747
$ 0024234
$ 0025438
$ 0025950
$ 0027732
$ 0029673
Fuel Factors
Secondary
$ 0023475
$ 0022733
$ 0022206
$ 0021895
$ 0021627
$ 0021713
$ 0022535
$ 0022717
$ 0024162
$ 0025715
Primary
$ 0022776
$ 0022056
$ 0021545
$ 0021243
$ 0020984
$ 0021067
$ 0021864
$ 0022041
$ 0023443
$ 0024949
Transmission
$ 0022539
$ 0021828
$ 0021321
$ 0021022
$ 0020766
$ 0020848
$ 0021637
$ 0021812
$ 0023200
$ 0024690
2006
2007
2008
2009
2010
2011
2012
2013
2014
2015
Dag generation
11574
11700
11841
12004
12188
12373
12553
12741
12928
13160
Joe generation
11584
11700
11841
12004
12188
12373
12553
12741
12928
13160
difference
(10)
0
(0)
(0)
(0)
(0)
(0)
0
(0)
0
sales
10954
11076
11213
11370
11546
11724
11898
12077
12257
12476
losses
57
56
56
56
56
55
55
55
55
55
With DSM
Thermal Unit Fuel Cost wDSM
223705664
223742320
198714736
198689904
191639104
196037824
207153584
205853888
223553008
245383552
Short-Term Power Purchases
5000000
- 0
17339160
16429042
16415314
16614357
11144008
17017280
11632503
11967200
Average cost per kWh
$ 0023361
$ 0022623
$ 0022099
$ 0021789
$ 0021523
$ 0021608
$ 0022426
$ 0022607
$ 0024046
$ 0025590
Forecast Annual GWh Sales
10954
11076
11213
11370
11546
11724
11898
12077
12257
12476
255897742
250575183
247791207
247738881
248503713
253336056
266823817
273028794
294725795
319266462
CASH FLOW PURCHASE OPTION
2005
2006
2007
2008
2009
2010
2011
2012
2013
2014
2015
Base revenue reduction
4125638
7592320
11812895
16167619
20328524
24769904
29155510
33338091
37691451
42141405
46445908
Fuel cost reduction
5166240
8956848
13238528
14683328
16859440
20212576
24919120
30094336
34616096
40546848
47845120
Potential off-system sales margins
2767500
5737500
8707500
Capacity cost reduction
12000000
15000000
18000000
21000000
24000000
27000000
30000000
33000000
GFT reduction
845561
660413
773705
527757
576669
709301
827386
851560
807636
944644
1055853
845560920627699
Program cost
20689324
22819634
22819634
22819634
22819634
22819634
22819634
22819634
22819634
22819634
22819634
Recovery through base rates
14405492
14639186
14799075
14977916
15183688
15416391
15650684
15878624
16115254
16352636
16645725
Cash flow
-6796409
-9374854
-10352249
-23481580
-27387801
-31463846
-35497075
-39427542
-43588195
-47663759
-51563965
2005
2006
2007
2008
2009
2010
2011
2012
2013
2014
2015
Base Revenue Reduction
$ (4125638)
$ (7592320)
$ (11812895)
$ (16167619)
$ (20328524)
$ (24769904)
$ (29155510)
$ (33338091)
$ (37691451)
$ (42141405)
$ (46445908)
Fuel Revenue Reduction
$ (5166240)
$ (8956848)
$ (13238528)
$ (26683328)
$ (31859440)
$ (38212576)
$ (45919120)
$ (54094336)
$ (61616096)
$ (70546848)
$ (80845120)
Fuel Cost Reduction
$ 5166240
$ 8956848
$ 13238528
$ 26683328
$ 31859440
$ 38212576
$ 45919120
$ 54094336
$ 61616096
$ 70546848
$ 80845120
Potential off-system sales margins
$ 2767500
$ 5737500
$ 8707500
$ - 0
$ - 0
$ - 0
$ - 0
$ - 0
$ - 0
$ - 0
$ - 0
Net program costs
$ (5438271)
$ (7520034)
$ (7246854)
$ (7313961)
$ (7059277)
$ (6693942)
$ (6341565)
$ (6089451)
$ (5896744)
$ (5522354)
$ (5118057)
AEs net cash impact
$ (6796409)
$ (9374854)
$ (10352249)
$ (23481580)
$ (27387801)
$ (31463846)
$ (35497075)
$ (39427542)
$ (43588195)
$ (47663759)
$ (51563965)
Customer savings
$ 9291878
$ 16549168
$ 25051423
$ 42850947
$ 52187964
$ 62982480
$ 75074630
$ 87432427
$ 99307547
$ 112688253
$ 127291028
CASH FLOW BUILD OPTION
2005
2006
2007
2008
2009
2010
2011
2012
2013
2014
2015
Base revenue reduction
4125638
7592320
11812895
16167619
20328524
24769904
29155510
33338091
37691451
42141405
46445908
Fuel cost reduction
5166240
8956848
13238528
14683328
16859440
20212576
24919120
30094336
34616096
40546848
47845120
Potential off-system sales margins
2767500
5737500
8707500
Capacity cost reduction
7736295
11604442
11604442
15472589
15472589
19340737
19340737
23208884
GFT reduction
845561
660413
773705
527757
576669
709301
827386
851560
807636
944644
1055853
Program cost
20689324
22819634
22819634
22819634
22819634
22819634
22819634
22819634
22819634
22819634
22819634
Recovery through base rates
14405492
14639186
14799075
14977916
15183688
15416391
15650684
15878624
16115254
16352636
16645725
Cash flow
-6796409
-9374854
-10352249
-15745285
-15783359
-19859404
-20024486
-23954952
-24247459
-28323022
-28355080
-21195738994
Capacity cost Build option
Reduced capacity requirement (kW)
46125
95625
145125
194625
243000
292500
339750
385875
430875
477000
523125
Capacity added
200
300
300
400
400
500
500
600
Annual capacity cost
$386814737
$7736295
$11604442
$11604442
$15472589
$15472589
$19340737
$19340737
$23208884
Capacity cost Buy option
Reduced capacity requirement (kW)
46125
95625
145125
194625
243000
292500
339750
385875
430875
477000
523125
Capacity added
200
250
300
350
400
450
500
550
Annual capacity cost
$600000000
$12000000
$15000000
$18000000
$21000000
$24000000
$27000000
$30000000
$33000000
1994
2004
2005
2006
2007
2008
2009
2010
2011
2012
2013
2014
2015
Net MWh to system
7659242
10855000
11388814
11573570
11699976
11841366
12004047
12188019
12373248
12553455
12740532
12928203
13159916
Revenue multiplier
100
142
149
151
153
155
157
159
162
164
166
169
172
Revenue allocated to DSM
9688028
13730281
14405492
14639186
14799075
14977916
15183688
15416391
15650684
15878624
16115254
16352636
16645725
CentskWh in rates for DSM
0134
0134
0134
0134
0134
0134
0134
0133
0133
0133
0133
0133
Annual sales (MWh)
10262000
10776303
10954134
11076488
11213088
11369667
11546488
11724454
11897588
12077216
12256861
12476492
2006
2006
2007
2007
2008
2008
2009
2009
2010
2010
2011
2011
2012
2012
2013
2013
2014
2014
2015
2015
2005
2005
2005
2006
2006
2006
2007
2007
2007
2008
2008
2008
2009
2009
2009
2010
2010
2010
2011
2011
2011
2012
2012
2012
2013
2013
2013
2014
2014
2014
2015
2015
2015
2005
2006
2007
2008
2009
2010
2011
2012
2013
2014
2015
Base Revenue Reduction
$ (4125638)
$ (7592320)
$ (11812895)
$ (16167619)
$ (20328524)
$ (24769904)
$ (29155510)
$ (33338091)
$ (37691451)
$ (42141405)
$ (46445908)
Fuel Revenue Reduction
$ (5166240)
$ (8956848)
$ (13238528)
$ (26683328)
$ (31859440)
$ (38212576)
$ (45919120)
$ (54094336)
$ (61616096)
$ (70546848)
$ (80845120)
Fuel Cost Reduction
$ 5166240
$ 8956848
$ 13238528
$ 26683328
$ 31859440
$ 38212576
$ 45919120
$ 54094336
$ 61616096
$ 70546848
$ 80845120
Potential off-system sales margins
$ 2767500
$ 5737500
$ 8707500
$ - 0
$ - 0
$ - 0
$ - 0
$ - 0
$ - 0
$ - 0
$ - 0
Net program costs
$ (5438271)
$ (7520034)
$ (7246854)
$ (7313961)
$ (7059277)
$ (6693942)
$ (6341565)
$ (6089451)
$ (5896744)
$ (5522354)
$ (5118057)
AEs net cash impact
$ (6796409)
$ (9374854)
$ (10352249)
$ (23481580)
$ (27387801)
$ (31463846)
$ (35497075)
$ (39427542)
$ (43588195)
$ (47663759)
$ (51563965)
Customer savings
$ (9291878)
$ (16549168)
$ (25051423)
$ (42850947)
$ (52187964)
$ (62982480)
$ (75074630)
$ (87432427)
$ (99307547)
$ (112688253)
$ (127291028)
Estimated Annual Impact
Base Revenue Reduction
$ (16134252)
Fuel Revenue Reduction
$ (23790144)
Fuel Cost Reduction
$ 23790144
Potential off-system sales margins
$ 2889000
Net program costs
$ (7166814)
AEs net cash impact
$ (20412066)
Customer savings
$ (39924396)
CURRENT FORECAST
PROPOSED PROJECTION
DSM Analysis
2007
2008
2007
2008
keyed in to round
Base Revenue Reduction
(12000000)
(16000000)
(12000000)
(16000000)
Fuel Revenue Reduction
(13000000)
(15000000)
(5000000)
(7000000)
Customer Savings (Bill Reduction)
(25000000)
(31000000)
(17000000)
(23000000)
Fuel Cost Reduction
13000000
15000000
5000000
7000000
KW
$KW
NET
5 profit
Potential Off-system Capacity Sales
9000000
9000000
6207
$KW
145000
$ 62
$ 8990000
Net of fuel and GFT
$ 449500
TCOS Expense Reduction
900000
1000000
900000
1000000
GFT Reduction
2000000
3000000
2000000
3000000
Program Cost
(23000000)
(23000000)
Recovery through Base Rates
15000000
15000000
AEs Net Income Impact
(8100000)
(20000000)
(17100000)
(35000000)
Deferred Cost of Capacity
12000000
- 0
AEs Net Cash Impact
(8100000)
(8000000)
(17100000)
- 0
Outline for Oct 10 Leadership Team Update
1 Components of BenefitCost Ratios
2 Cash Flow of DSM
CURRENT FORECAST
PROPOSED PROJECTION
DSM Analysis
2007
2008
2007
2008
Base Revenue Reduction
(11812895)
(16167619)
(11812895)
(16167619)
Fuel Revenue Reduction
(13238528)
(14683328)
(5217969)
(5396810)
Fuel Cost Reduction
13238528
14683328
5217969
5396810
Potential off-system sales margins
8707500
8707500
Fuel Revenue Increase-Capacity
12000000
12000000
Fuel Cost Increase-Capacity
(12000000)
(12000000)
TCOS expense reduction
925987
977987
925987
977987
GFT reduction
2279680
2807436
2279680
2807436
Program cost
(22819634)
(22819634)
Recovery through base rates
14799075
14977916
AEs net income impact
(7920288)
(20223914)
100271
(12382196)
Deferred Cost of Capacity
12000000
12000000
AEs net cash impact including deferral
(7920288)
(8223914)
100271
(382196)
Customer savings-(net)
$ (25051423)
$ (30850947)
$ (17030864)
$ (21564429)
Recommend recovery thru fuel factor
Offset customer fuel savings due to DSM
Would not offset revenue loss
(before amp after)
In 2007 we still have excess capacity
Cost recovery
3yrs - recommended purch power
power is only needed during peak-dont utilize a plant
need declines as renewables increases
cash flow
Dynamic pricing-TOU rates motivating cust to conserve energy
would replace some of the energy efficiency rebates
option to self-generate
TCOS expense reduction due to DSM savings
Historical
Historical
Historical
Historical
Historical
Preliminary
Forecast
Forecast
Forecast
Forecast
Forecast
Forecast
Forecast
Forecast
Forecast
Forecast
2000
2001
2002
2003
2004
2005
2006
2007
2008
2009
2010
2011
2012
2013
2014
2015
ERCOT Postage Stamp Rate
1476
1528
1661
1778
1925
2055
2185
2315
2445
2575
2705
2835
2965
3095
3225
3355
Estimated DSM-kW savings applied to average 4CP
40000
40000
40000
40000
40000
40000
40000
40000
40000
40000
40000
Reduction to TCOS expense
$ 821987
$ 873987
$ 925987
$ 977987
$ 1029987
$ 1081987
$ 1133987
$ 1185987
$ 1237987
$ 1289987
$ 1341987
Saving Energy TogetherPower SaverTM Program
DSM Analysis 2007 2008
Base Revenue Reduction (12000000) (16000000) Fuel Revenue Reduction (13000000) (15000000)
AEs Net Income Impact (8100000) (20000000) Deferred Cost of Capacity 12000000 AEs Net Cash Impact (8100000) (8000000)
CURRENT FORECAST
Cash Flow Projection of DSM
Cash flow chart
Chart1
Fuel Cost Reduction
Capacity Expense Reduction
Total Decrease In Expenses
REDUCTION IN EXPENSES DUE TO DSM PROGRAMS
5166240
5166240
8956848
8956848
13238528
13238528
14683328
26360828
11677500
16859440
31439440
14580000
20212576
37762576
17550000
24919120
45304120
20385000
30094336
53246836
23152500
34616096
60468596
25852500
40546848
69166848
28620000
47845120
79232620
31387500
Chart4
Fuel Cost without DSM
Fuel Cost with DSM
REDUCTION IN FUEL COST DUE TO DSM PROGRAMS
00233611231
00238400717
00226232559
00233069306
00220985648
00237472342
00217888198
00236848698
00215229268
00237472426
00216083296
00242335075
00224259386
00254383594
00226073357
00259502528
00240455083
00277315347
00255904506
00296726494
Sheet1
Sheet3
Saving Energy TogetherPower SaverTM Program
Questions
Saving Energy TogetherPower SaverTM Program
FY 2006 Achievements
Energy SavingsMW of
Programs Saved Goal Goal
Residential 126 115 110
Commercial 154 121 127
Demand Response 146 156 94
Solar 055 060 93
Grand Total 432 398 108
Saving Energy TogetherPower SaverTM Program
MW SavedPrograms FY2005 FY2006
Residential 119 126
Commercial 153 154
Demand Response 116 146
Solar 06 055
Grand Total 394 432
Energy Savings ComparisonFY2005 to FY2006
Saving Energy TogetherPower SaverTM Program
DSM Summary
bull DSM programs are saving peak kW amp kWh
bull Cost-effectiveness analyses include full program costs
bull DSM goals and budgets should vary to support AE resource plan requirements
Saving Energy TogetherPower SaverTM Program
Free Home WeatherizationEnergy Improvementsbull Insulate Atticsbull Duct Sealingbull Install CFLsbull Solar Screensbull Caulking and Weather-strippingbull Free Smoke amp Carbon Monoxide Detector bull Minor Energy Related Repairs
Saving Energy TogetherPower SaverTM Program
Power Saver Program
bull FREE Energy Saving Productsbull Lower energy costsbull 65000 installed in homes apartmentsbull 4000 installed in commercial buildings
Saving Energy TogetherPower SaverTM Program
Energy Conservation in COA FacilitiesSenate Bill 5 Energy Use vs Energy Cost
295
300
305
310
315
320
325
330
335
340
345
350
Base Year2001
2002 2003 2004 2005 2006
Gig
awat
t-hou
rs
220
230
240
250
260
270
280
290
300
Mill
ion
Dol
lars
Million kWh Cost
Chart1
Million kWh
Cost
Gigawatt-hours
Million Dollars
Senate Bill 5 Energy Use vs Energy Cost
343667472
28619895
33757683
2504536
3260767692
24602549
31773020962
26778741
324036807
2745756918
313494864
2936354518
Sheet1
Sheet1
ampA
Page ampP
Million kWh
Gigawatt-hours
Senate Bill 5 Reported Energy Use
Sheet2
ampA
Page ampP
Million kWh
Cost
Gigawatt-hours
Million Dollars
Senate Bill 5 Energy Use vs Energy Cost
Sheet3
Energy Efficiency Real Reliable and Cost-Effective Alternative
Fuel cost savings assume all saved energy at average gas generation cost
Increased off-system sales margins assumes reduced demand plus associated reserve requirements could be sold for $15kWmonth (after 2007 this is an avoided capacity expense)
Fuel Factor expense increase is increased fuel expense plus purchased capacity cost
GFT reduction is base revenue and fuel cost reductions times 91
Base revenue wDSM
552961968
562415810
569170954
576627290
585065115
594497922
604045383
613657938
623249716
632762255
644233714
Base revenue wo DSM
557087606
570008130
580983849
592794909
605393639
619267826
633200893
646996029
660941168
674903660
690679622
kWh sales wDSM
10776303000
10954134000
11076488000
11213088000
11369667000
11546488000
11724454000
11897588000
12077216000
12256861000
12476492000
kWh sales wo DSM
10861087000
11109639000
11319110000
11544588000
11787201000
12054717000
12323440000
12582205000
12851412000
13121980000
13429845000
1000
kW sales wDSM
2435000
2442000
2443000
2471000
2477000
2486000
2486000
2490000
2515000
2535000
2539000
kW sales wo DSM
2476000
2527000
2572000
2644000
2693000
2746000
2788000
2833000
2898000
2959000
3004000
Fuel Forecast
Budget 2006 (3905)
Tot-2006
Tot-2007
Tot-2008
Tot-2009
Tot-2010
Tot-2011
Tot-2012
Tot-2013
Tot-2014
Tot-2015
Total
MWH
STP
3303339
3488217
3514415
3360759
3465191
3507755
3405921
3614690
3482746
3515635
34658668
FPP
4564135
4517773
4465943
4451812
4418334
4545733
4554494
4586879
4445603
4245674
44796380
Decker
2839387
511212
504648
615748
583574
563845
570235
550098
594337
757598
8090682
Holly
235228
28425
- 0
- 0
- 0
- 0
- 0
- 0
- 0
263653
Sand Hill CC
1533962
1538343
1565132
1615597
1553452
1600111
1516183
1666799
1687122
14276700
SH GT
465155
427320
523864
450359
458722
498276
432337
492003
574949
4322986
Decker GT
157126
216800
280985
238803
246172
264900
238141
266139
294200
2203267
Existing DG
17340
7248
7296
7065
7216
7268
7168
7137
7147
16838
91723
Future DG
110
110
101
2216
2659
4743
5273
7365
7750
17746
48073
PurchasePower
131996
- 0
204000
208800
206400
206400
134400
201600
136000
139200
1568796
Landfill Methane
87493
92450
92704
92450
92450
92450
92704
92450
92450
92450
920052
Future Bioenergy
- 0
- 0
134151
178705
384764
454206
673445
744600
978509
1057336
4605716
Wind
636291
669050
671181
669050
669050
669050
671181
669050
669050
669050
6662004
Solar
684
20026
32685
41438
50311
59183
68298
76929
85801
87839
523193
Shortfall Energy
3308
2419
3355
6021
3311
4269
7050
3075
3868
4281
40957
11584082
11699976
11841366
12004048
12188020
12373249
12553456
12740532
12928204
13159918
123072851
(10512)
(1)
(1)
0
0
(0)
1
1
(0)
0
(10505)
Dollars
STP
14024307
16411783
18054617
17815007
18997196
19874461
19872833
21713134
21541492
22417754
190722584
FPP
47959978
48327184
52942730
56530034
57287196
60262126
61527986
62666810
62927556
61809806
572241406
Decker
161242451
30007075
26150797
28534975
26297430
25902979
27510734
27253106
30904024
41053837
424857407
Holly
15649395
1939153
- 0
- 0
- 0
- 0
- 0
- 0
- 0
17588548
Sand Hill CC
71819840
62147912
53829988
54696364
53773560
56880544
56723452
64324432
66378796
540574888
SH GT
28915407
23018682
25201605
20614580
21546020
24873781
22042049
25993318
31798432
224003872
Decker GT
12129491
14068039
16315347
13248144
14062711
15831205
14654486
17002591
19718490
137030504
Existing DG
1066126
482134
392821
350785
361063
372817
379318
391499
407877
1055934
5260373
Future DG
5688
5352
3321
115774
140956
247241
281454
413559
455875
1154808
2824028
PurchasePower
5000000
- 0
17339160
16429042
16415314
16614357
11144008
17017280
11632503
11967200
123558864
Landfill Methane
3535734
3653844
3663855
3653844
3653844
3653844
3663855
3653844
3653844
3653844
36440353
Future Bioenergy
- 0
- 0
6036769
8041681
17314398
20439270
30305016
33507000
44032792
47579944
207256869
Wind
17374835
18256537
18314921
18256537
18256537
18256537
18314921
18256537
18256537
18256537
181800436
Solar
- 0
- 0
- 0
- 0
- 0
- 0
- 0
- 0
- 0
- 0
- 0
Shortfall Energy
248086
181420
251636
451599
248349
320172
528742
230590
290120
321058
3071771
250457205
245839462
244324412
245526217
247531370
255326093
271114397
278523346
301422961
327166440
2667231902
1792964
10
(12)
6
(1)
10
(27)
4
3
(6)
1793341
Gas MWh
2839387
2902683
2715536
2985730
2888333
2822192
2933522
2736759
3019278
3313869
29157288
Gas cost ($)
161242451
158521208
127324584
123881915
114856517
115285269
125096264
120673092
138224364
158949555
1344055218
Avg gas gen Cost ($MWh)
5679
5461
4689
4149
3977
4085
4264
4409
4578
4796
4610
NO DSM FUEL FACTOR
2006
2007
2008
2009
2010
2011
2012
2013
2014
2015
Thermal Unit Fuel Cost
232662512
236980848
213398064
215549344
211851680
220956944
237247920
240469984
264099856
293228672
Shortfall Purchases
248086
181420
251636
451599
248349
320172
528742
230590
290120
321058
Short-Term Power Purchases
5000000
- 0
29016660
31009042
33965314
36999357
34296508
42869780
40252503
43354700
Fuel Cell Gas Cost
119837
119837
119837
119837
119837
119837
119837
119837
119837
119837
Recoverable ERCOT Expenses
16825273
16825273
16825273
16825273
16825273
16825273
16825273
16825273
16825273
16825273
Fuel Factor Renewables
9998882
9706333
14540565
15223226
23255836
23418594
31052373
32981926
42305054
44649542
Total Fuel Factor Revenue
264854590
263813711
274152035
279178321
286266289
298640176
320070653
333497390
363892643
398499082
Total Renewables
20910569
21910381
28015544
29952062
39224779
42349651
52283792
55417381
65943173
69490325
TotThermal+PurchPwr+Renewables
249864319
245834121
244321076
245522607
247527546
255322004
271110126
278519139
301418805
327162135
Estimated Green Choice Sales
10911686
12204048
13474979
14728836
15968943
18931058
21231418
22435455
23638119
24840783
Fuel Factor Renewables
9998882
9706333
14540565
15223226
23255836
23418594
31052373
32981926
42305054
44649542
Forecast Annual GWh Sales
11110
11319
11545
11787
12055
12323
12582
12851
13122
13430
Average cost per kWh
$ 0023840
$ 0023307
$ 0023747
$ 0023685
$ 0023747
$ 0024234
$ 0025438
$ 0025950
$ 0027732
$ 0029673
Fuel Factors
Secondary
$ 0023475
$ 0022733
$ 0022206
$ 0021895
$ 0021627
$ 0021713
$ 0022535
$ 0022717
$ 0024162
$ 0025715
Primary
$ 0022776
$ 0022056
$ 0021545
$ 0021243
$ 0020984
$ 0021067
$ 0021864
$ 0022041
$ 0023443
$ 0024949
Transmission
$ 0022539
$ 0021828
$ 0021321
$ 0021022
$ 0020766
$ 0020848
$ 0021637
$ 0021812
$ 0023200
$ 0024690
2006
2007
2008
2009
2010
2011
2012
2013
2014
2015
Dag generation
11574
11700
11841
12004
12188
12373
12553
12741
12928
13160
Joe generation
11584
11700
11841
12004
12188
12373
12553
12741
12928
13160
difference
(10)
0
(0)
(0)
(0)
(0)
(0)
0
(0)
0
sales
10954
11076
11213
11370
11546
11724
11898
12077
12257
12476
losses
57
56
56
56
56
55
55
55
55
55
With DSM
Thermal Unit Fuel Cost wDSM
223705664
223742320
198714736
198689904
191639104
196037824
207153584
205853888
223553008
245383552
Short-Term Power Purchases
5000000
- 0
17339160
16429042
16415314
16614357
11144008
17017280
11632503
11967200
Average cost per kWh
$ 0023361
$ 0022623
$ 0022099
$ 0021789
$ 0021523
$ 0021608
$ 0022426
$ 0022607
$ 0024046
$ 0025590
Forecast Annual GWh Sales
10954
11076
11213
11370
11546
11724
11898
12077
12257
12476
255897742
250575183
247791207
247738881
248503713
253336056
266823817
273028794
294725795
319266462
CASH FLOW PURCHASE OPTION
2005
2006
2007
2008
2009
2010
2011
2012
2013
2014
2015
Base revenue reduction
4125638
7592320
11812895
16167619
20328524
24769904
29155510
33338091
37691451
42141405
46445908
Fuel cost reduction
5166240
8956848
13238528
14683328
16859440
20212576
24919120
30094336
34616096
40546848
47845120
Potential off-system sales margins
2767500
5737500
8707500
Capacity cost reduction
12000000
15000000
18000000
21000000
24000000
27000000
30000000
33000000
GFT reduction
845561
660413
773705
527757
576669
709301
827386
851560
807636
944644
1055853
845560920627699
Program cost
20689324
22819634
22819634
22819634
22819634
22819634
22819634
22819634
22819634
22819634
22819634
Recovery through base rates
14405492
14639186
14799075
14977916
15183688
15416391
15650684
15878624
16115254
16352636
16645725
Cash flow
-6796409
-9374854
-10352249
-23481580
-27387801
-31463846
-35497075
-39427542
-43588195
-47663759
-51563965
2005
2006
2007
2008
2009
2010
2011
2012
2013
2014
2015
Base Revenue Reduction
$ (4125638)
$ (7592320)
$ (11812895)
$ (16167619)
$ (20328524)
$ (24769904)
$ (29155510)
$ (33338091)
$ (37691451)
$ (42141405)
$ (46445908)
Fuel Revenue Reduction
$ (5166240)
$ (8956848)
$ (13238528)
$ (26683328)
$ (31859440)
$ (38212576)
$ (45919120)
$ (54094336)
$ (61616096)
$ (70546848)
$ (80845120)
Fuel Cost Reduction
$ 5166240
$ 8956848
$ 13238528
$ 26683328
$ 31859440
$ 38212576
$ 45919120
$ 54094336
$ 61616096
$ 70546848
$ 80845120
Potential off-system sales margins
$ 2767500
$ 5737500
$ 8707500
$ - 0
$ - 0
$ - 0
$ - 0
$ - 0
$ - 0
$ - 0
$ - 0
Net program costs
$ (5438271)
$ (7520034)
$ (7246854)
$ (7313961)
$ (7059277)
$ (6693942)
$ (6341565)
$ (6089451)
$ (5896744)
$ (5522354)
$ (5118057)
AEs net cash impact
$ (6796409)
$ (9374854)
$ (10352249)
$ (23481580)
$ (27387801)
$ (31463846)
$ (35497075)
$ (39427542)
$ (43588195)
$ (47663759)
$ (51563965)
Customer savings
$ 9291878
$ 16549168
$ 25051423
$ 42850947
$ 52187964
$ 62982480
$ 75074630
$ 87432427
$ 99307547
$ 112688253
$ 127291028
CASH FLOW BUILD OPTION
2005
2006
2007
2008
2009
2010
2011
2012
2013
2014
2015
Base revenue reduction
4125638
7592320
11812895
16167619
20328524
24769904
29155510
33338091
37691451
42141405
46445908
Fuel cost reduction
5166240
8956848
13238528
14683328
16859440
20212576
24919120
30094336
34616096
40546848
47845120
Potential off-system sales margins
2767500
5737500
8707500
Capacity cost reduction
7736295
11604442
11604442
15472589
15472589
19340737
19340737
23208884
GFT reduction
845561
660413
773705
527757
576669
709301
827386
851560
807636
944644
1055853
Program cost
20689324
22819634
22819634
22819634
22819634
22819634
22819634
22819634
22819634
22819634
22819634
Recovery through base rates
14405492
14639186
14799075
14977916
15183688
15416391
15650684
15878624
16115254
16352636
16645725
Cash flow
-6796409
-9374854
-10352249
-15745285
-15783359
-19859404
-20024486
-23954952
-24247459
-28323022
-28355080
-21195738994
Capacity cost Build option
Reduced capacity requirement (kW)
46125
95625
145125
194625
243000
292500
339750
385875
430875
477000
523125
Capacity added
200
300
300
400
400
500
500
600
Annual capacity cost
$386814737
$7736295
$11604442
$11604442
$15472589
$15472589
$19340737
$19340737
$23208884
Capacity cost Buy option
Reduced capacity requirement (kW)
46125
95625
145125
194625
243000
292500
339750
385875
430875
477000
523125
Capacity added
200
250
300
350
400
450
500
550
Annual capacity cost
$600000000
$12000000
$15000000
$18000000
$21000000
$24000000
$27000000
$30000000
$33000000
1994
2004
2005
2006
2007
2008
2009
2010
2011
2012
2013
2014
2015
Net MWh to system
7659242
10855000
11388814
11573570
11699976
11841366
12004047
12188019
12373248
12553455
12740532
12928203
13159916
Revenue multiplier
100
142
149
151
153
155
157
159
162
164
166
169
172
Revenue allocated to DSM
9688028
13730281
14405492
14639186
14799075
14977916
15183688
15416391
15650684
15878624
16115254
16352636
16645725
CentskWh in rates for DSM
0134
0134
0134
0134
0134
0134
0134
0133
0133
0133
0133
0133
Annual sales (MWh)
10262000
10776303
10954134
11076488
11213088
11369667
11546488
11724454
11897588
12077216
12256861
12476492
2006
2006
2007
2007
2008
2008
2009
2009
2010
2010
2011
2011
2012
2012
2013
2013
2014
2014
2015
2015
2005
2005
2005
2006
2006
2006
2007
2007
2007
2008
2008
2008
2009
2009
2009
2010
2010
2010
2011
2011
2011
2012
2012
2012
2013
2013
2013
2014
2014
2014
2015
2015
2015
2005
2006
2007
2008
2009
2010
2011
2012
2013
2014
2015
Base Revenue Reduction
$ (4125638)
$ (7592320)
$ (11812895)
$ (16167619)
$ (20328524)
$ (24769904)
$ (29155510)
$ (33338091)
$ (37691451)
$ (42141405)
$ (46445908)
Fuel Revenue Reduction
$ (5166240)
$ (8956848)
$ (13238528)
$ (26683328)
$ (31859440)
$ (38212576)
$ (45919120)
$ (54094336)
$ (61616096)
$ (70546848)
$ (80845120)
Fuel Cost Reduction
$ 5166240
$ 8956848
$ 13238528
$ 26683328
$ 31859440
$ 38212576
$ 45919120
$ 54094336
$ 61616096
$ 70546848
$ 80845120
Potential off-system sales margins
$ 2767500
$ 5737500
$ 8707500
$ - 0
$ - 0
$ - 0
$ - 0
$ - 0
$ - 0
$ - 0
$ - 0
Net program costs
$ (5438271)
$ (7520034)
$ (7246854)
$ (7313961)
$ (7059277)
$ (6693942)
$ (6341565)
$ (6089451)
$ (5896744)
$ (5522354)
$ (5118057)
AEs net cash impact
$ (6796409)
$ (9374854)
$ (10352249)
$ (23481580)
$ (27387801)
$ (31463846)
$ (35497075)
$ (39427542)
$ (43588195)
$ (47663759)
$ (51563965)
Customer savings
$ (9291878)
$ (16549168)
$ (25051423)
$ (42850947)
$ (52187964)
$ (62982480)
$ (75074630)
$ (87432427)
$ (99307547)
$ (112688253)
$ (127291028)
Estimated Annual Impact
Base Revenue Reduction
$ (16134252)
Fuel Revenue Reduction
$ (23790144)
Fuel Cost Reduction
$ 23790144
Potential off-system sales margins
$ 2889000
Net program costs
$ (7166814)
AEs net cash impact
$ (20412066)
Customer savings
$ (39924396)
CURRENT FORECAST
PROPOSED PROJECTION
DSM Analysis
2007
2008
2007
2008
keyed in to round
Base Revenue Reduction
(12000000)
(16000000)
(12000000)
(16000000)
Fuel Revenue Reduction
(13000000)
(15000000)
(5000000)
(7000000)
Customer Savings (Bill Reduction)
(25000000)
(31000000)
(17000000)
(23000000)
Fuel Cost Reduction
13000000
15000000
5000000
7000000
KW
$KW
NET
5 profit
Potential Off-system Capacity Sales
9000000
9000000
6207
$KW
145000
$ 62
$ 8990000
Net of fuel and GFT
$ 449500
TCOS Expense Reduction
900000
1000000
900000
1000000
GFT Reduction
2000000
3000000
2000000
3000000
Program Cost
(23000000)
(23000000)
Recovery through Base Rates
15000000
15000000
AEs Net Income Impact
(8100000)
(20000000)
(17100000)
(35000000)
Deferred Cost of Capacity
12000000
- 0
AEs Net Cash Impact
(8100000)
(8000000)
(17100000)
- 0
Outline for Oct 10 Leadership Team Update
1 Components of BenefitCost Ratios
2 Cash Flow of DSM
CURRENT FORECAST
PROPOSED PROJECTION
DSM Analysis
2007
2008
2007
2008
Base Revenue Reduction
(11812895)
(16167619)
(11812895)
(16167619)
Fuel Revenue Reduction
(13238528)
(14683328)
(5217969)
(5396810)
Fuel Cost Reduction
13238528
14683328
5217969
5396810
Potential off-system sales margins
8707500
8707500
Fuel Revenue Increase-Capacity
12000000
12000000
Fuel Cost Increase-Capacity
(12000000)
(12000000)
TCOS expense reduction
925987
977987
925987
977987
GFT reduction
2279680
2807436
2279680
2807436
Program cost
(22819634)
(22819634)
Recovery through base rates
14799075
14977916
AEs net income impact
(7920288)
(20223914)
100271
(12382196)
Deferred Cost of Capacity
12000000
12000000
AEs net cash impact including deferral
(7920288)
(8223914)
100271
(382196)
Customer savings-(net)
$ (25051423)
$ (30850947)
$ (17030864)
$ (21564429)
Recommend recovery thru fuel factor
Offset customer fuel savings due to DSM
Would not offset revenue loss
(before amp after)
In 2007 we still have excess capacity
Cost recovery
3yrs - recommended purch power
power is only needed during peak-dont utilize a plant
need declines as renewables increases
cash flow
Dynamic pricing-TOU rates motivating cust to conserve energy
would replace some of the energy efficiency rebates
option to self-generate
TCOS expense reduction due to DSM savings
Historical
Historical
Historical
Historical
Historical
Preliminary
Forecast
Forecast
Forecast
Forecast
Forecast
Forecast
Forecast
Forecast
Forecast
Forecast
2000
2001
2002
2003
2004
2005
2006
2007
2008
2009
2010
2011
2012
2013
2014
2015
ERCOT Postage Stamp Rate
1476
1528
1661
1778
1925
2055
2185
2315
2445
2575
2705
2835
2965
3095
3225
3355
Estimated DSM-kW savings applied to average 4CP
40000
40000
40000
40000
40000
40000
40000
40000
40000
40000
40000
Reduction to TCOS expense
$ 821987
$ 873987
$ 925987
$ 977987
$ 1029987
$ 1081987
$ 1133987
$ 1185987
$ 1237987
$ 1289987
$ 1341987
Chart1
Fuel Cost Reduction
Capacity Expense Reduction
Total Decrease In Expenses
REDUCTION IN EXPENSES DUE TO DSM PROGRAMS
5166240
5166240
8956848
8956848
13238528
13238528
14683328
26360828
11677500
16859440
31439440
14580000
20212576
37762576
17550000
24919120
45304120
20385000
30094336
53246836
23152500
34616096
60468596
25852500
40546848
69166848
28620000
47845120
79232620
31387500
Chart4
Fuel Cost without DSM
Fuel Cost with DSM
REDUCTION IN FUEL COST DUE TO DSM PROGRAMS
00233611231
00238400717
00226232559
00233069306
00220985648
00237472342
00217888198
00236848698
00215229268
00237472426
00216083296
00242335075
00224259386
00254383594
00226073357
00259502528
00240455083
00277315347
00255904506
00296726494
Sheet1
Sheet3
Saving Energy TogetherPower SaverTM Program
Questions
Saving Energy TogetherPower SaverTM Program
FY 2006 Achievements
Energy SavingsMW of
Programs Saved Goal Goal
Residential 126 115 110
Commercial 154 121 127
Demand Response 146 156 94
Solar 055 060 93
Grand Total 432 398 108
Saving Energy TogetherPower SaverTM Program
MW SavedPrograms FY2005 FY2006
Residential 119 126
Commercial 153 154
Demand Response 116 146
Solar 06 055
Grand Total 394 432
Energy Savings ComparisonFY2005 to FY2006
Saving Energy TogetherPower SaverTM Program
DSM Summary
bull DSM programs are saving peak kW amp kWh
bull Cost-effectiveness analyses include full program costs
bull DSM goals and budgets should vary to support AE resource plan requirements
Saving Energy TogetherPower SaverTM Program
Free Home WeatherizationEnergy Improvementsbull Insulate Atticsbull Duct Sealingbull Install CFLsbull Solar Screensbull Caulking and Weather-strippingbull Free Smoke amp Carbon Monoxide Detector bull Minor Energy Related Repairs
Saving Energy TogetherPower SaverTM Program
Power Saver Program
bull FREE Energy Saving Productsbull Lower energy costsbull 65000 installed in homes apartmentsbull 4000 installed in commercial buildings
Saving Energy TogetherPower SaverTM Program
Energy Conservation in COA FacilitiesSenate Bill 5 Energy Use vs Energy Cost
295
300
305
310
315
320
325
330
335
340
345
350
Base Year2001
2002 2003 2004 2005 2006
Gig
awat
t-hou
rs
220
230
240
250
260
270
280
290
300
Mill
ion
Dol
lars
Million kWh Cost
Chart1
Million kWh
Cost
Gigawatt-hours
Million Dollars
Senate Bill 5 Energy Use vs Energy Cost
343667472
28619895
33757683
2504536
3260767692
24602549
31773020962
26778741
324036807
2745756918
313494864
2936354518
Sheet1
Sheet1
ampA
Page ampP
Million kWh
Gigawatt-hours
Senate Bill 5 Reported Energy Use
Sheet2
ampA
Page ampP
Million kWh
Cost
Gigawatt-hours
Million Dollars
Senate Bill 5 Energy Use vs Energy Cost
Sheet3
Energy Efficiency Real Reliable and Cost-Effective Alternative
Fuel cost savings assume all saved energy at average gas generation cost
Increased off-system sales margins assumes reduced demand plus associated reserve requirements could be sold for $15kWmonth (after 2007 this is an avoided capacity expense)
Fuel Factor expense increase is increased fuel expense plus purchased capacity cost
GFT reduction is base revenue and fuel cost reductions times 91
Base revenue wDSM
552961968
562415810
569170954
576627290
585065115
594497922
604045383
613657938
623249716
632762255
644233714
Base revenue wo DSM
557087606
570008130
580983849
592794909
605393639
619267826
633200893
646996029
660941168
674903660
690679622
kWh sales wDSM
10776303000
10954134000
11076488000
11213088000
11369667000
11546488000
11724454000
11897588000
12077216000
12256861000
12476492000
kWh sales wo DSM
10861087000
11109639000
11319110000
11544588000
11787201000
12054717000
12323440000
12582205000
12851412000
13121980000
13429845000
1000
kW sales wDSM
2435000
2442000
2443000
2471000
2477000
2486000
2486000
2490000
2515000
2535000
2539000
kW sales wo DSM
2476000
2527000
2572000
2644000
2693000
2746000
2788000
2833000
2898000
2959000
3004000
Fuel Forecast
Budget 2006 (3905)
Tot-2006
Tot-2007
Tot-2008
Tot-2009
Tot-2010
Tot-2011
Tot-2012
Tot-2013
Tot-2014
Tot-2015
Total
MWH
STP
3303339
3488217
3514415
3360759
3465191
3507755
3405921
3614690
3482746
3515635
34658668
FPP
4564135
4517773
4465943
4451812
4418334
4545733
4554494
4586879
4445603
4245674
44796380
Decker
2839387
511212
504648
615748
583574
563845
570235
550098
594337
757598
8090682
Holly
235228
28425
- 0
- 0
- 0
- 0
- 0
- 0
- 0
263653
Sand Hill CC
1533962
1538343
1565132
1615597
1553452
1600111
1516183
1666799
1687122
14276700
SH GT
465155
427320
523864
450359
458722
498276
432337
492003
574949
4322986
Decker GT
157126
216800
280985
238803
246172
264900
238141
266139
294200
2203267
Existing DG
17340
7248
7296
7065
7216
7268
7168
7137
7147
16838
91723
Future DG
110
110
101
2216
2659
4743
5273
7365
7750
17746
48073
PurchasePower
131996
- 0
204000
208800
206400
206400
134400
201600
136000
139200
1568796
Landfill Methane
87493
92450
92704
92450
92450
92450
92704
92450
92450
92450
920052
Future Bioenergy
- 0
- 0
134151
178705
384764
454206
673445
744600
978509
1057336
4605716
Wind
636291
669050
671181
669050
669050
669050
671181
669050
669050
669050
6662004
Solar
684
20026
32685
41438
50311
59183
68298
76929
85801
87839
523193
Shortfall Energy
3308
2419
3355
6021
3311
4269
7050
3075
3868
4281
40957
11584082
11699976
11841366
12004048
12188020
12373249
12553456
12740532
12928204
13159918
123072851
(10512)
(1)
(1)
0
0
(0)
1
1
(0)
0
(10505)
Dollars
STP
14024307
16411783
18054617
17815007
18997196
19874461
19872833
21713134
21541492
22417754
190722584
FPP
47959978
48327184
52942730
56530034
57287196
60262126
61527986
62666810
62927556
61809806
572241406
Decker
161242451
30007075
26150797
28534975
26297430
25902979
27510734
27253106
30904024
41053837
424857407
Holly
15649395
1939153
- 0
- 0
- 0
- 0
- 0
- 0
- 0
17588548
Sand Hill CC
71819840
62147912
53829988
54696364
53773560
56880544
56723452
64324432
66378796
540574888
SH GT
28915407
23018682
25201605
20614580
21546020
24873781
22042049
25993318
31798432
224003872
Decker GT
12129491
14068039
16315347
13248144
14062711
15831205
14654486
17002591
19718490
137030504
Existing DG
1066126
482134
392821
350785
361063
372817
379318
391499
407877
1055934
5260373
Future DG
5688
5352
3321
115774
140956
247241
281454
413559
455875
1154808
2824028
PurchasePower
5000000
- 0
17339160
16429042
16415314
16614357
11144008
17017280
11632503
11967200
123558864
Landfill Methane
3535734
3653844
3663855
3653844
3653844
3653844
3663855
3653844
3653844
3653844
36440353
Future Bioenergy
- 0
- 0
6036769
8041681
17314398
20439270
30305016
33507000
44032792
47579944
207256869
Wind
17374835
18256537
18314921
18256537
18256537
18256537
18314921
18256537
18256537
18256537
181800436
Solar
- 0
- 0
- 0
- 0
- 0
- 0
- 0
- 0
- 0
- 0
- 0
Shortfall Energy
248086
181420
251636
451599
248349
320172
528742
230590
290120
321058
3071771
250457205
245839462
244324412
245526217
247531370
255326093
271114397
278523346
301422961
327166440
2667231902
1792964
10
(12)
6
(1)
10
(27)
4
3
(6)
1793341
Gas MWh
2839387
2902683
2715536
2985730
2888333
2822192
2933522
2736759
3019278
3313869
29157288
Gas cost ($)
161242451
158521208
127324584
123881915
114856517
115285269
125096264
120673092
138224364
158949555
1344055218
Avg gas gen Cost ($MWh)
5679
5461
4689
4149
3977
4085
4264
4409
4578
4796
4610
NO DSM FUEL FACTOR
2006
2007
2008
2009
2010
2011
2012
2013
2014
2015
Thermal Unit Fuel Cost
232662512
236980848
213398064
215549344
211851680
220956944
237247920
240469984
264099856
293228672
Shortfall Purchases
248086
181420
251636
451599
248349
320172
528742
230590
290120
321058
Short-Term Power Purchases
5000000
- 0
29016660
31009042
33965314
36999357
34296508
42869780
40252503
43354700
Fuel Cell Gas Cost
119837
119837
119837
119837
119837
119837
119837
119837
119837
119837
Recoverable ERCOT Expenses
16825273
16825273
16825273
16825273
16825273
16825273
16825273
16825273
16825273
16825273
Fuel Factor Renewables
9998882
9706333
14540565
15223226
23255836
23418594
31052373
32981926
42305054
44649542
Total Fuel Factor Revenue
264854590
263813711
274152035
279178321
286266289
298640176
320070653
333497390
363892643
398499082
Total Renewables
20910569
21910381
28015544
29952062
39224779
42349651
52283792
55417381
65943173
69490325
TotThermal+PurchPwr+Renewables
249864319
245834121
244321076
245522607
247527546
255322004
271110126
278519139
301418805
327162135
Estimated Green Choice Sales
10911686
12204048
13474979
14728836
15968943
18931058
21231418
22435455
23638119
24840783
Fuel Factor Renewables
9998882
9706333
14540565
15223226
23255836
23418594
31052373
32981926
42305054
44649542
Forecast Annual GWh Sales
11110
11319
11545
11787
12055
12323
12582
12851
13122
13430
Average cost per kWh
$ 0023840
$ 0023307
$ 0023747
$ 0023685
$ 0023747
$ 0024234
$ 0025438
$ 0025950
$ 0027732
$ 0029673
Fuel Factors
Secondary
$ 0023475
$ 0022733
$ 0022206
$ 0021895
$ 0021627
$ 0021713
$ 0022535
$ 0022717
$ 0024162
$ 0025715
Primary
$ 0022776
$ 0022056
$ 0021545
$ 0021243
$ 0020984
$ 0021067
$ 0021864
$ 0022041
$ 0023443
$ 0024949
Transmission
$ 0022539
$ 0021828
$ 0021321
$ 0021022
$ 0020766
$ 0020848
$ 0021637
$ 0021812
$ 0023200
$ 0024690
2006
2007
2008
2009
2010
2011
2012
2013
2014
2015
Dag generation
11574
11700
11841
12004
12188
12373
12553
12741
12928
13160
Joe generation
11584
11700
11841
12004
12188
12373
12553
12741
12928
13160
difference
(10)
0
(0)
(0)
(0)
(0)
(0)
0
(0)
0
sales
10954
11076
11213
11370
11546
11724
11898
12077
12257
12476
losses
57
56
56
56
56
55
55
55
55
55
With DSM
Thermal Unit Fuel Cost wDSM
223705664
223742320
198714736
198689904
191639104
196037824
207153584
205853888
223553008
245383552
Short-Term Power Purchases
5000000
- 0
17339160
16429042
16415314
16614357
11144008
17017280
11632503
11967200
Average cost per kWh
$ 0023361
$ 0022623
$ 0022099
$ 0021789
$ 0021523
$ 0021608
$ 0022426
$ 0022607
$ 0024046
$ 0025590
Forecast Annual GWh Sales
10954
11076
11213
11370
11546
11724
11898
12077
12257
12476
255897742
250575183
247791207
247738881
248503713
253336056
266823817
273028794
294725795
319266462
CASH FLOW PURCHASE OPTION
2005
2006
2007
2008
2009
2010
2011
2012
2013
2014
2015
Base revenue reduction
4125638
7592320
11812895
16167619
20328524
24769904
29155510
33338091
37691451
42141405
46445908
Fuel cost reduction
5166240
8956848
13238528
14683328
16859440
20212576
24919120
30094336
34616096
40546848
47845120
Potential off-system sales margins
2767500
5737500
8707500
Capacity cost reduction
12000000
15000000
18000000
21000000
24000000
27000000
30000000
33000000
GFT reduction
845561
660413
773705
527757
576669
709301
827386
851560
807636
944644
1055853
845560920627699
Program cost
20689324
22819634
22819634
22819634
22819634
22819634
22819634
22819634
22819634
22819634
22819634
Recovery through base rates
14405492
14639186
14799075
14977916
15183688
15416391
15650684
15878624
16115254
16352636
16645725
Cash flow
-6796409
-9374854
-10352249
-23481580
-27387801
-31463846
-35497075
-39427542
-43588195
-47663759
-51563965
2005
2006
2007
2008
2009
2010
2011
2012
2013
2014
2015
Base Revenue Reduction
$ (4125638)
$ (7592320)
$ (11812895)
$ (16167619)
$ (20328524)
$ (24769904)
$ (29155510)
$ (33338091)
$ (37691451)
$ (42141405)
$ (46445908)
Fuel Revenue Reduction
$ (5166240)
$ (8956848)
$ (13238528)
$ (26683328)
$ (31859440)
$ (38212576)
$ (45919120)
$ (54094336)
$ (61616096)
$ (70546848)
$ (80845120)
Fuel Cost Reduction
$ 5166240
$ 8956848
$ 13238528
$ 26683328
$ 31859440
$ 38212576
$ 45919120
$ 54094336
$ 61616096
$ 70546848
$ 80845120
Potential off-system sales margins
$ 2767500
$ 5737500
$ 8707500
$ - 0
$ - 0
$ - 0
$ - 0
$ - 0
$ - 0
$ - 0
$ - 0
Net program costs
$ (5438271)
$ (7520034)
$ (7246854)
$ (7313961)
$ (7059277)
$ (6693942)
$ (6341565)
$ (6089451)
$ (5896744)
$ (5522354)
$ (5118057)
AEs net cash impact
$ (6796409)
$ (9374854)
$ (10352249)
$ (23481580)
$ (27387801)
$ (31463846)
$ (35497075)
$ (39427542)
$ (43588195)
$ (47663759)
$ (51563965)
Customer savings
$ 9291878
$ 16549168
$ 25051423
$ 42850947
$ 52187964
$ 62982480
$ 75074630
$ 87432427
$ 99307547
$ 112688253
$ 127291028
CASH FLOW BUILD OPTION
2005
2006
2007
2008
2009
2010
2011
2012
2013
2014
2015
Base revenue reduction
4125638
7592320
11812895
16167619
20328524
24769904
29155510
33338091
37691451
42141405
46445908
Fuel cost reduction
5166240
8956848
13238528
14683328
16859440
20212576
24919120
30094336
34616096
40546848
47845120
Potential off-system sales margins
2767500
5737500
8707500
Capacity cost reduction
7736295
11604442
11604442
15472589
15472589
19340737
19340737
23208884
GFT reduction
845561
660413
773705
527757
576669
709301
827386
851560
807636
944644
1055853
Program cost
20689324
22819634
22819634
22819634
22819634
22819634
22819634
22819634
22819634
22819634
22819634
Recovery through base rates
14405492
14639186
14799075
14977916
15183688
15416391
15650684
15878624
16115254
16352636
16645725
Cash flow
-6796409
-9374854
-10352249
-15745285
-15783359
-19859404
-20024486
-23954952
-24247459
-28323022
-28355080
-21195738994
Capacity cost Build option
Reduced capacity requirement (kW)
46125
95625
145125
194625
243000
292500
339750
385875
430875
477000
523125
Capacity added
200
300
300
400
400
500
500
600
Annual capacity cost
$386814737
$7736295
$11604442
$11604442
$15472589
$15472589
$19340737
$19340737
$23208884
Capacity cost Buy option
Reduced capacity requirement (kW)
46125
95625
145125
194625
243000
292500
339750
385875
430875
477000
523125
Capacity added
200
250
300
350
400
450
500
550
Annual capacity cost
$600000000
$12000000
$15000000
$18000000
$21000000
$24000000
$27000000
$30000000
$33000000
1994
2004
2005
2006
2007
2008
2009
2010
2011
2012
2013
2014
2015
Net MWh to system
7659242
10855000
11388814
11573570
11699976
11841366
12004047
12188019
12373248
12553455
12740532
12928203
13159916
Revenue multiplier
100
142
149
151
153
155
157
159
162
164
166
169
172
Revenue allocated to DSM
9688028
13730281
14405492
14639186
14799075
14977916
15183688
15416391
15650684
15878624
16115254
16352636
16645725
CentskWh in rates for DSM
0134
0134
0134
0134
0134
0134
0134
0133
0133
0133
0133
0133
Annual sales (MWh)
10262000
10776303
10954134
11076488
11213088
11369667
11546488
11724454
11897588
12077216
12256861
12476492
2006
2006
2007
2007
2008
2008
2009
2009
2010
2010
2011
2011
2012
2012
2013
2013
2014
2014
2015
2015
2005
2005
2005
2006
2006
2006
2007
2007
2007
2008
2008
2008
2009
2009
2009
2010
2010
2010
2011
2011
2011
2012
2012
2012
2013
2013
2013
2014
2014
2014
2015
2015
2015
Chart4
Fuel Cost without DSM
Fuel Cost with DSM
REDUCTION IN FUEL COST DUE TO DSM PROGRAMS
00233611231
00238400717
00226232559
00233069306
00220985648
00237472342
00217888198
00236848698
00215229268
00237472426
00216083296
00242335075
00224259386
00254383594
00226073357
00259502528
00240455083
00277315347
00255904506
00296726494
Sheet1
Sheet3
Saving Energy TogetherPower SaverTM Program
Questions
Saving Energy TogetherPower SaverTM Program
FY 2006 Achievements
Energy SavingsMW of
Programs Saved Goal Goal
Residential 126 115 110
Commercial 154 121 127
Demand Response 146 156 94
Solar 055 060 93
Grand Total 432 398 108
Saving Energy TogetherPower SaverTM Program
MW SavedPrograms FY2005 FY2006
Residential 119 126
Commercial 153 154
Demand Response 116 146
Solar 06 055
Grand Total 394 432
Energy Savings ComparisonFY2005 to FY2006
Saving Energy TogetherPower SaverTM Program
DSM Summary
bull DSM programs are saving peak kW amp kWh
bull Cost-effectiveness analyses include full program costs
bull DSM goals and budgets should vary to support AE resource plan requirements
Saving Energy TogetherPower SaverTM Program
Free Home WeatherizationEnergy Improvementsbull Insulate Atticsbull Duct Sealingbull Install CFLsbull Solar Screensbull Caulking and Weather-strippingbull Free Smoke amp Carbon Monoxide Detector bull Minor Energy Related Repairs
Saving Energy TogetherPower SaverTM Program
Power Saver Program
bull FREE Energy Saving Productsbull Lower energy costsbull 65000 installed in homes apartmentsbull 4000 installed in commercial buildings
Saving Energy TogetherPower SaverTM Program
Energy Conservation in COA FacilitiesSenate Bill 5 Energy Use vs Energy Cost
295
300
305
310
315
320
325
330
335
340
345
350
Base Year2001
2002 2003 2004 2005 2006
Gig
awat
t-hou
rs
220
230
240
250
260
270
280
290
300
Mill
ion
Dol
lars
Million kWh Cost
Chart1
Million kWh
Cost
Gigawatt-hours
Million Dollars
Senate Bill 5 Energy Use vs Energy Cost
343667472
28619895
33757683
2504536
3260767692
24602549
31773020962
26778741
324036807
2745756918
313494864
2936354518
Sheet1
Sheet1
ampA
Page ampP
Million kWh
Gigawatt-hours
Senate Bill 5 Reported Energy Use
Sheet2
ampA
Page ampP
Million kWh
Cost
Gigawatt-hours
Million Dollars
Senate Bill 5 Energy Use vs Energy Cost
Sheet3
Energy Efficiency Real Reliable and Cost-Effective Alternative
Fuel cost savings assume all saved energy at average gas generation cost
Increased off-system sales margins assumes reduced demand plus associated reserve requirements could be sold for $15kWmonth (after 2007 this is an avoided capacity expense)
Fuel Factor expense increase is increased fuel expense plus purchased capacity cost
GFT reduction is base revenue and fuel cost reductions times 91
Base revenue wDSM
552961968
562415810
569170954
576627290
585065115
594497922
604045383
613657938
623249716
632762255
644233714
Base revenue wo DSM
557087606
570008130
580983849
592794909
605393639
619267826
633200893
646996029
660941168
674903660
690679622
kWh sales wDSM
10776303000
10954134000
11076488000
11213088000
11369667000
11546488000
11724454000
11897588000
12077216000
12256861000
12476492000
kWh sales wo DSM
10861087000
11109639000
11319110000
11544588000
11787201000
12054717000
12323440000
12582205000
12851412000
13121980000
13429845000
1000
kW sales wDSM
2435000
2442000
2443000
2471000
2477000
2486000
2486000
2490000
2515000
2535000
2539000
kW sales wo DSM
2476000
2527000
2572000
2644000
2693000
2746000
2788000
2833000
2898000
2959000
3004000
Fuel Forecast
Budget 2006 (3905)
Tot-2006
Tot-2007
Tot-2008
Tot-2009
Tot-2010
Tot-2011
Tot-2012
Tot-2013
Tot-2014
Tot-2015
Total
MWH
STP
3303339
3488217
3514415
3360759
3465191
3507755
3405921
3614690
3482746
3515635
34658668
FPP
4564135
4517773
4465943
4451812
4418334
4545733
4554494
4586879
4445603
4245674
44796380
Decker
2839387
511212
504648
615748
583574
563845
570235
550098
594337
757598
8090682
Holly
235228
28425
- 0
- 0
- 0
- 0
- 0
- 0
- 0
263653
Sand Hill CC
1533962
1538343
1565132
1615597
1553452
1600111
1516183
1666799
1687122
14276700
SH GT
465155
427320
523864
450359
458722
498276
432337
492003
574949
4322986
Decker GT
157126
216800
280985
238803
246172
264900
238141
266139
294200
2203267
Existing DG
17340
7248
7296
7065
7216
7268
7168
7137
7147
16838
91723
Future DG
110
110
101
2216
2659
4743
5273
7365
7750
17746
48073
PurchasePower
131996
- 0
204000
208800
206400
206400
134400
201600
136000
139200
1568796
Landfill Methane
87493
92450
92704
92450
92450
92450
92704
92450
92450
92450
920052
Future Bioenergy
- 0
- 0
134151
178705
384764
454206
673445
744600
978509
1057336
4605716
Wind
636291
669050
671181
669050
669050
669050
671181
669050
669050
669050
6662004
Solar
684
20026
32685
41438
50311
59183
68298
76929
85801
87839
523193
Shortfall Energy
3308
2419
3355
6021
3311
4269
7050
3075
3868
4281
40957
11584082
11699976
11841366
12004048
12188020
12373249
12553456
12740532
12928204
13159918
123072851
(10512)
(1)
(1)
0
0
(0)
1
1
(0)
0
(10505)
Dollars
STP
14024307
16411783
18054617
17815007
18997196
19874461
19872833
21713134
21541492
22417754
190722584
FPP
47959978
48327184
52942730
56530034
57287196
60262126
61527986
62666810
62927556
61809806
572241406
Decker
161242451
30007075
26150797
28534975
26297430
25902979
27510734
27253106
30904024
41053837
424857407
Holly
15649395
1939153
- 0
- 0
- 0
- 0
- 0
- 0
- 0
17588548
Sand Hill CC
71819840
62147912
53829988
54696364
53773560
56880544
56723452
64324432
66378796
540574888
SH GT
28915407
23018682
25201605
20614580
21546020
24873781
22042049
25993318
31798432
224003872
Decker GT
12129491
14068039
16315347
13248144
14062711
15831205
14654486
17002591
19718490
137030504
Existing DG
1066126
482134
392821
350785
361063
372817
379318
391499
407877
1055934
5260373
Future DG
5688
5352
3321
115774
140956
247241
281454
413559
455875
1154808
2824028
PurchasePower
5000000
- 0
17339160
16429042
16415314
16614357
11144008
17017280
11632503
11967200
123558864
Landfill Methane
3535734
3653844
3663855
3653844
3653844
3653844
3663855
3653844
3653844
3653844
36440353
Future Bioenergy
- 0
- 0
6036769
8041681
17314398
20439270
30305016
33507000
44032792
47579944
207256869
Wind
17374835
18256537
18314921
18256537
18256537
18256537
18314921
18256537
18256537
18256537
181800436
Solar
- 0
- 0
- 0
- 0
- 0
- 0
- 0
- 0
- 0
- 0
- 0
Shortfall Energy
248086
181420
251636
451599
248349
320172
528742
230590
290120
321058
3071771
250457205
245839462
244324412
245526217
247531370
255326093
271114397
278523346
301422961
327166440
2667231902
1792964
10
(12)
6
(1)
10
(27)
4
3
(6)
1793341
Gas MWh
2839387
2902683
2715536
2985730
2888333
2822192
2933522
2736759
3019278
3313869
29157288
Gas cost ($)
161242451
158521208
127324584
123881915
114856517
115285269
125096264
120673092
138224364
158949555
1344055218
Avg gas gen Cost ($MWh)
5679
5461
4689
4149
3977
4085
4264
4409
4578
4796
4610
NO DSM FUEL FACTOR
2006
2007
2008
2009
2010
2011
2012
2013
2014
2015
Thermal Unit Fuel Cost
232662512
236980848
213398064
215549344
211851680
220956944
237247920
240469984
264099856
293228672
Shortfall Purchases
248086
181420
251636
451599
248349
320172
528742
230590
290120
321058
Short-Term Power Purchases
5000000
- 0
29016660
31009042
33965314
36999357
34296508
42869780
40252503
43354700
Fuel Cell Gas Cost
119837
119837
119837
119837
119837
119837
119837
119837
119837
119837
Recoverable ERCOT Expenses
16825273
16825273
16825273
16825273
16825273
16825273
16825273
16825273
16825273
16825273
Fuel Factor Renewables
9998882
9706333
14540565
15223226
23255836
23418594
31052373
32981926
42305054
44649542
Total Fuel Factor Revenue
264854590
263813711
274152035
279178321
286266289
298640176
320070653
333497390
363892643
398499082
Total Renewables
20910569
21910381
28015544
29952062
39224779
42349651
52283792
55417381
65943173
69490325
TotThermal+PurchPwr+Renewables
249864319
245834121
244321076
245522607
247527546
255322004
271110126
278519139
301418805
327162135
Estimated Green Choice Sales
10911686
12204048
13474979
14728836
15968943
18931058
21231418
22435455
23638119
24840783
Fuel Factor Renewables
9998882
9706333
14540565
15223226
23255836
23418594
31052373
32981926
42305054
44649542
Forecast Annual GWh Sales
11110
11319
11545
11787
12055
12323
12582
12851
13122
13430
Average cost per kWh
$ 0023840
$ 0023307
$ 0023747
$ 0023685
$ 0023747
$ 0024234
$ 0025438
$ 0025950
$ 0027732
$ 0029673
Fuel Factors
Secondary
$ 0023475
$ 0022733
$ 0022206
$ 0021895
$ 0021627
$ 0021713
$ 0022535
$ 0022717
$ 0024162
$ 0025715
Primary
$ 0022776
$ 0022056
$ 0021545
$ 0021243
$ 0020984
$ 0021067
$ 0021864
$ 0022041
$ 0023443
$ 0024949
Transmission
$ 0022539
$ 0021828
$ 0021321
$ 0021022
$ 0020766
$ 0020848
$ 0021637
$ 0021812
$ 0023200
$ 0024690
2006
2007
2008
2009
2010
2011
2012
2013
2014
2015
Dag generation
11574
11700
11841
12004
12188
12373
12553
12741
12928
13160
Joe generation
11584
11700
11841
12004
12188
12373
12553
12741
12928
13160
difference
(10)
0
(0)
(0)
(0)
(0)
(0)
0
(0)
0
sales
10954
11076
11213
11370
11546
11724
11898
12077
12257
12476
losses
57
56
56
56
56
55
55
55
55
55
With DSM
Thermal Unit Fuel Cost wDSM
223705664
223742320
198714736
198689904
191639104
196037824
207153584
205853888
223553008
245383552
Short-Term Power Purchases
5000000
- 0
17339160
16429042
16415314
16614357
11144008
17017280
11632503
11967200
Average cost per kWh
$ 0023361
$ 0022623
$ 0022099
$ 0021789
$ 0021523
$ 0021608
$ 0022426
$ 0022607
$ 0024046
$ 0025590
Forecast Annual GWh Sales
10954
11076
11213
11370
11546
11724
11898
12077
12257
12476
255897742
250575183
247791207
247738881
248503713
253336056
266823817
273028794
294725795
319266462
CASH FLOW PURCHASE OPTION
2005
2006
2007
2008
2009
2010
2011
2012
2013
2014
2015
Base revenue reduction
4125638
7592320
11812895
16167619
20328524
24769904
29155510
33338091
37691451
42141405
46445908
Fuel cost reduction
5166240
8956848
13238528
14683328
16859440
20212576
24919120
30094336
34616096
40546848
47845120
Potential off-system sales margins
2767500
5737500
8707500
Capacity cost reduction
12000000
15000000
18000000
21000000
24000000
27000000
30000000
33000000
GFT reduction
845561
660413
773705
527757
576669
709301
827386
851560
807636
944644
1055853
845560920627699
Program cost
20689324
22819634
22819634
22819634
22819634
22819634
22819634
22819634
22819634
22819634
22819634
Recovery through base rates
14405492
14639186
14799075
14977916
15183688
15416391
15650684
15878624
16115254
16352636
16645725
Cash flow
-6796409
-9374854
-10352249
-23481580
-27387801
-31463846
-35497075
-39427542
-43588195
-47663759
-51563965
2005
2006
2007
2008
2009
2010
2011
2012
2013
2014
2015
Base Revenue Reduction
$ (4125638)
$ (7592320)
$ (11812895)
$ (16167619)
$ (20328524)
$ (24769904)
$ (29155510)
$ (33338091)
$ (37691451)
$ (42141405)
$ (46445908)
Fuel Revenue Reduction
$ (5166240)
$ (8956848)
$ (13238528)
$ (26683328)
$ (31859440)
$ (38212576)
$ (45919120)
$ (54094336)
$ (61616096)
$ (70546848)
$ (80845120)
Fuel Cost Reduction
$ 5166240
$ 8956848
$ 13238528
$ 26683328
$ 31859440
$ 38212576
$ 45919120
$ 54094336
$ 61616096
$ 70546848
$ 80845120
Potential off-system sales margins
$ 2767500
$ 5737500
$ 8707500
$ - 0
$ - 0
$ - 0
$ - 0
$ - 0
$ - 0
$ - 0
$ - 0
Net program costs
$ (5438271)
$ (7520034)
$ (7246854)
$ (7313961)
$ (7059277)
$ (6693942)
$ (6341565)
$ (6089451)
$ (5896744)
$ (5522354)
$ (5118057)
AEs net cash impact
$ (6796409)
$ (9374854)
$ (10352249)
$ (23481580)
$ (27387801)
$ (31463846)
$ (35497075)
$ (39427542)
$ (43588195)
$ (47663759)
$ (51563965)
Customer savings
$ 9291878
$ 16549168
$ 25051423
$ 42850947
$ 52187964
$ 62982480
$ 75074630
$ 87432427
$ 99307547
$ 112688253
$ 127291028
CASH FLOW BUILD OPTION
2005
2006
2007
2008
2009
2010
2011
2012
2013
2014
2015
Base revenue reduction
4125638
7592320
11812895
16167619
20328524
24769904
29155510
33338091
37691451
42141405
46445908
Fuel cost reduction
5166240
8956848
13238528
14683328
16859440
20212576
24919120
30094336
34616096
40546848
47845120
Potential off-system sales margins
2767500
5737500
8707500
Capacity cost reduction
7736295
11604442
11604442
15472589
15472589
19340737
19340737
23208884
GFT reduction
845561
660413
773705
527757
576669
709301
827386
851560
807636
944644
1055853
Program cost
20689324
22819634
22819634
22819634
22819634
22819634
22819634
22819634
22819634
22819634
22819634
Recovery through base rates
14405492
14639186
14799075
14977916
15183688
15416391
15650684
15878624
16115254
16352636
16645725
Cash flow
-6796409
-9374854
-10352249
-15745285
-15783359
-19859404
-20024486
-23954952
-24247459
-28323022
-28355080
-21195738994
Capacity cost Build option
Reduced capacity requirement (kW)
46125
95625
145125
194625
243000
292500
339750
385875
430875
477000
523125
Capacity added
200
300
300
400
400
500
500
600
Annual capacity cost
$386814737
$7736295
$11604442
$11604442
$15472589
$15472589
$19340737
$19340737
$23208884
Capacity cost Buy option
Reduced capacity requirement (kW)
46125
95625
145125
194625
243000
292500
339750
385875
430875
477000
523125
Capacity added
200
250
300
350
400
450
500
550
Annual capacity cost
$600000000
$12000000
$15000000
$18000000
$21000000
$24000000
$27000000
$30000000
$33000000
1994
2004
2005
2006
2007
2008
2009
2010
2011
2012
2013
2014
2015
Net MWh to system
7659242
10855000
11388814
11573570
11699976
11841366
12004047
12188019
12373248
12553455
12740532
12928203
13159916
Revenue multiplier
100
142
149
151
153
155
157
159
162
164
166
169
172
Revenue allocated to DSM
9688028
13730281
14405492
14639186
14799075
14977916
15183688
15416391
15650684
15878624
16115254
16352636
16645725
CentskWh in rates for DSM
0134
0134
0134
0134
0134
0134
0134
0133
0133
0133
0133
0133
Annual sales (MWh)
10262000
10776303
10954134
11076488
11213088
11369667
11546488
11724454
11897588
12077216
12256861
12476492
2006
2006
2007
2007
2008
2008
2009
2009
2010
2010
2011
2011
2012
2012
2013
2013
2014
2014
2015
2015
Sheet1
Sheet3
Saving Energy TogetherPower SaverTM Program
Questions
Saving Energy TogetherPower SaverTM Program
FY 2006 Achievements
Energy SavingsMW of
Programs Saved Goal Goal
Residential 126 115 110
Commercial 154 121 127
Demand Response 146 156 94
Solar 055 060 93
Grand Total 432 398 108
Saving Energy TogetherPower SaverTM Program
MW SavedPrograms FY2005 FY2006
Residential 119 126
Commercial 153 154
Demand Response 116 146
Solar 06 055
Grand Total 394 432
Energy Savings ComparisonFY2005 to FY2006
Saving Energy TogetherPower SaverTM Program
DSM Summary
bull DSM programs are saving peak kW amp kWh
bull Cost-effectiveness analyses include full program costs
bull DSM goals and budgets should vary to support AE resource plan requirements
Saving Energy TogetherPower SaverTM Program
Free Home WeatherizationEnergy Improvementsbull Insulate Atticsbull Duct Sealingbull Install CFLsbull Solar Screensbull Caulking and Weather-strippingbull Free Smoke amp Carbon Monoxide Detector bull Minor Energy Related Repairs
Saving Energy TogetherPower SaverTM Program
Power Saver Program
bull FREE Energy Saving Productsbull Lower energy costsbull 65000 installed in homes apartmentsbull 4000 installed in commercial buildings
Saving Energy TogetherPower SaverTM Program
Energy Conservation in COA FacilitiesSenate Bill 5 Energy Use vs Energy Cost
295
300
305
310
315
320
325
330
335
340
345
350
Base Year2001
2002 2003 2004 2005 2006
Gig
awat
t-hou
rs
220
230
240
250
260
270
280
290
300
Mill
ion
Dol
lars
Million kWh Cost
Chart1
Million kWh
Cost
Gigawatt-hours
Million Dollars
Senate Bill 5 Energy Use vs Energy Cost
343667472
28619895
33757683
2504536
3260767692
24602549
31773020962
26778741
324036807
2745756918
313494864
2936354518
Sheet1
Sheet1
ampA
Page ampP
Million kWh
Gigawatt-hours
Senate Bill 5 Reported Energy Use
Sheet2
ampA
Page ampP
Million kWh
Cost
Gigawatt-hours
Million Dollars
Senate Bill 5 Energy Use vs Energy Cost
Sheet3
Energy Efficiency Real Reliable and Cost-Effective Alternative
Fuel cost savings assume all saved energy at average gas generation cost
Increased off-system sales margins assumes reduced demand plus associated reserve requirements could be sold for $15kWmonth (after 2007 this is an avoided capacity expense)
Fuel Factor expense increase is increased fuel expense plus purchased capacity cost
GFT reduction is base revenue and fuel cost reductions times 91
Base revenue wDSM
552961968
562415810
569170954
576627290
585065115
594497922
604045383
613657938
623249716
632762255
644233714
Base revenue wo DSM
557087606
570008130
580983849
592794909
605393639
619267826
633200893
646996029
660941168
674903660
690679622
kWh sales wDSM
10776303000
10954134000
11076488000
11213088000
11369667000
11546488000
11724454000
11897588000
12077216000
12256861000
12476492000
kWh sales wo DSM
10861087000
11109639000
11319110000
11544588000
11787201000
12054717000
12323440000
12582205000
12851412000
13121980000
13429845000
1000
kW sales wDSM
2435000
2442000
2443000
2471000
2477000
2486000
2486000
2490000
2515000
2535000
2539000
kW sales wo DSM
2476000
2527000
2572000
2644000
2693000
2746000
2788000
2833000
2898000
2959000
3004000
Fuel Forecast
Budget 2006 (3905)
Tot-2006
Tot-2007
Tot-2008
Tot-2009
Tot-2010
Tot-2011
Tot-2012
Tot-2013
Tot-2014
Tot-2015
Total
MWH
STP
3303339
3488217
3514415
3360759
3465191
3507755
3405921
3614690
3482746
3515635
34658668
FPP
4564135
4517773
4465943
4451812
4418334
4545733
4554494
4586879
4445603
4245674
44796380
Decker
2839387
511212
504648
615748
583574
563845
570235
550098
594337
757598
8090682
Holly
235228
28425
- 0
- 0
- 0
- 0
- 0
- 0
- 0
263653
Sand Hill CC
1533962
1538343
1565132
1615597
1553452
1600111
1516183
1666799
1687122
14276700
SH GT
465155
427320
523864
450359
458722
498276
432337
492003
574949
4322986
Decker GT
157126
216800
280985
238803
246172
264900
238141
266139
294200
2203267
Existing DG
17340
7248
7296
7065
7216
7268
7168
7137
7147
16838
91723
Future DG
110
110
101
2216
2659
4743
5273
7365
7750
17746
48073
PurchasePower
131996
- 0
204000
208800
206400
206400
134400
201600
136000
139200
1568796
Landfill Methane
87493
92450
92704
92450
92450
92450
92704
92450
92450
92450
920052
Future Bioenergy
- 0
- 0
134151
178705
384764
454206
673445
744600
978509
1057336
4605716
Wind
636291
669050
671181
669050
669050
669050
671181
669050
669050
669050
6662004
Solar
684
20026
32685
41438
50311
59183
68298
76929
85801
87839
523193
Shortfall Energy
3308
2419
3355
6021
3311
4269
7050
3075
3868
4281
40957
11584082
11699976
11841366
12004048
12188020
12373249
12553456
12740532
12928204
13159918
123072851
(10512)
(1)
(1)
0
0
(0)
1
1
(0)
0
(10505)
Dollars
STP
14024307
16411783
18054617
17815007
18997196
19874461
19872833
21713134
21541492
22417754
190722584
FPP
47959978
48327184
52942730
56530034
57287196
60262126
61527986
62666810
62927556
61809806
572241406
Decker
161242451
30007075
26150797
28534975
26297430
25902979
27510734
27253106
30904024
41053837
424857407
Holly
15649395
1939153
- 0
- 0
- 0
- 0
- 0
- 0
- 0
17588548
Sand Hill CC
71819840
62147912
53829988
54696364
53773560
56880544
56723452
64324432
66378796
540574888
SH GT
28915407
23018682
25201605
20614580
21546020
24873781
22042049
25993318
31798432
224003872
Decker GT
12129491
14068039
16315347
13248144
14062711
15831205
14654486
17002591
19718490
137030504
Existing DG
1066126
482134
392821
350785
361063
372817
379318
391499
407877
1055934
5260373
Future DG
5688
5352
3321
115774
140956
247241
281454
413559
455875
1154808
2824028
PurchasePower
5000000
- 0
17339160
16429042
16415314
16614357
11144008
17017280
11632503
11967200
123558864
Landfill Methane
3535734
3653844
3663855
3653844
3653844
3653844
3663855
3653844
3653844
3653844
36440353
Future Bioenergy
- 0
- 0
6036769
8041681
17314398
20439270
30305016
33507000
44032792
47579944
207256869
Wind
17374835
18256537
18314921
18256537
18256537
18256537
18314921
18256537
18256537
18256537
181800436
Solar
- 0
- 0
- 0
- 0
- 0
- 0
- 0
- 0
- 0
- 0
- 0
Shortfall Energy
248086
181420
251636
451599
248349
320172
528742
230590
290120
321058
3071771
250457205
245839462
244324412
245526217
247531370
255326093
271114397
278523346
301422961
327166440
2667231902
1792964
10
(12)
6
(1)
10
(27)
4
3
(6)
1793341
Gas MWh
2839387
2902683
2715536
2985730
2888333
2822192
2933522
2736759
3019278
3313869
29157288
Gas cost ($)
161242451
158521208
127324584
123881915
114856517
115285269
125096264
120673092
138224364
158949555
1344055218
Avg gas gen Cost ($MWh)
5679
5461
4689
4149
3977
4085
4264
4409
4578
4796
4610
NO DSM FUEL FACTOR
2006
2007
2008
2009
2010
2011
2012
2013
2014
2015
Thermal Unit Fuel Cost
232662512
236980848
213398064
215549344
211851680
220956944
237247920
240469984
264099856
293228672
Shortfall Purchases
248086
181420
251636
451599
248349
320172
528742
230590
290120
321058
Short-Term Power Purchases
5000000
- 0
29016660
31009042
33965314
36999357
34296508
42869780
40252503
43354700
Fuel Cell Gas Cost
119837
119837
119837
119837
119837
119837
119837
119837
119837
119837
Recoverable ERCOT Expenses
16825273
16825273
16825273
16825273
16825273
16825273
16825273
16825273
16825273
16825273
Fuel Factor Renewables
9998882
9706333
14540565
15223226
23255836
23418594
31052373
32981926
42305054
44649542
Total Fuel Factor Revenue
264854590
263813711
274152035
279178321
286266289
298640176
320070653
333497390
363892643
398499082
Total Renewables
20910569
21910381
28015544
29952062
39224779
42349651
52283792
55417381
65943173
69490325
TotThermal+PurchPwr+Renewables
249864319
245834121
244321076
245522607
247527546
255322004
271110126
278519139
301418805
327162135
Estimated Green Choice Sales
10911686
12204048
13474979
14728836
15968943
18931058
21231418
22435455
23638119
24840783
Fuel Factor Renewables
9998882
9706333
14540565
15223226
23255836
23418594
31052373
32981926
42305054
44649542
Forecast Annual GWh Sales
11110
11319
11545
11787
12055
12323
12582
12851
13122
13430
Average cost per kWh
$ 0023840
$ 0023307
$ 0023747
$ 0023685
$ 0023747
$ 0024234
$ 0025438
$ 0025950
$ 0027732
$ 0029673
Fuel Factors
Secondary
$ 0023475
$ 0022733
$ 0022206
$ 0021895
$ 0021627
$ 0021713
$ 0022535
$ 0022717
$ 0024162
$ 0025715
Primary
$ 0022776
$ 0022056
$ 0021545
$ 0021243
$ 0020984
$ 0021067
$ 0021864
$ 0022041
$ 0023443
$ 0024949
Transmission
$ 0022539
$ 0021828
$ 0021321
$ 0021022
$ 0020766
$ 0020848
$ 0021637
$ 0021812
$ 0023200
$ 0024690
2006
2007
2008
2009
2010
2011
2012
2013
2014
2015
Dag generation
11574
11700
11841
12004
12188
12373
12553
12741
12928
13160
Joe generation
11584
11700
11841
12004
12188
12373
12553
12741
12928
13160
difference
(10)
0
(0)
(0)
(0)
(0)
(0)
0
(0)
0
sales
10954
11076
11213
11370
11546
11724
11898
12077
12257
12476
losses
57
56
56
56
56
55
55
55
55
55
With DSM
Thermal Unit Fuel Cost wDSM
223705664
223742320
198714736
198689904
191639104
196037824
207153584
205853888
223553008
245383552
Short-Term Power Purchases
5000000
- 0
17339160
16429042
16415314
16614357
11144008
17017280
11632503
11967200
Average cost per kWh
$ 0023361
$ 0022623
$ 0022099
$ 0021789
$ 0021523
$ 0021608
$ 0022426
$ 0022607
$ 0024046
$ 0025590
Forecast Annual GWh Sales
10954
11076
11213
11370
11546
11724
11898
12077
12257
12476
255897742
250575183
247791207
247738881
248503713
253336056
266823817
273028794
294725795
319266462
CASH FLOW PURCHASE OPTION
2005
2006
2007
2008
2009
2010
2011
2012
2013
2014
2015
Base revenue reduction
4125638
7592320
11812895
16167619
20328524
24769904
29155510
33338091
37691451
42141405
46445908
Fuel cost reduction
5166240
8956848
13238528
14683328
16859440
20212576
24919120
30094336
34616096
40546848
47845120
Potential off-system sales margins
2767500
5737500
8707500
Capacity cost reduction
12000000
15000000
18000000
21000000
24000000
27000000
30000000
33000000
GFT reduction
845561
660413
773705
527757
576669
709301
827386
851560
807636
944644
1055853
845560920627699
Program cost
20689324
22819634
22819634
22819634
22819634
22819634
22819634
22819634
22819634
22819634
22819634
Recovery through base rates
14405492
14639186
14799075
14977916
15183688
15416391
15650684
15878624
16115254
16352636
16645725
Cash flow
-6796409
-9374854
-10352249
-23481580
-27387801
-31463846
-35497075
-39427542
-43588195
-47663759
-51563965
2005
2006
2007
2008
2009
2010
2011
2012
2013
2014
2015
Base Revenue Reduction
$ (4125638)
$ (7592320)
$ (11812895)
$ (16167619)
$ (20328524)
$ (24769904)
$ (29155510)
$ (33338091)
$ (37691451)
$ (42141405)
$ (46445908)
Fuel Revenue Reduction
$ (5166240)
$ (8956848)
$ (13238528)
$ (26683328)
$ (31859440)
$ (38212576)
$ (45919120)
$ (54094336)
$ (61616096)
$ (70546848)
$ (80845120)
Fuel Cost Reduction
$ 5166240
$ 8956848
$ 13238528
$ 26683328
$ 31859440
$ 38212576
$ 45919120
$ 54094336
$ 61616096
$ 70546848
$ 80845120
Potential off-system sales margins
$ 2767500
$ 5737500
$ 8707500
$ - 0
$ - 0
$ - 0
$ - 0
$ - 0
$ - 0
$ - 0
$ - 0
Net program costs
$ (5438271)
$ (7520034)
$ (7246854)
$ (7313961)
$ (7059277)
$ (6693942)
$ (6341565)
$ (6089451)
$ (5896744)
$ (5522354)
$ (5118057)
AEs net cash impact
$ (6796409)
$ (9374854)
$ (10352249)
$ (23481580)
$ (27387801)
$ (31463846)
$ (35497075)
$ (39427542)
$ (43588195)
$ (47663759)
$ (51563965)
Customer savings
$ 9291878
$ 16549168
$ 25051423
$ 42850947
$ 52187964
$ 62982480
$ 75074630
$ 87432427
$ 99307547
$ 112688253
$ 127291028
CASH FLOW BUILD OPTION
2005
2006
2007
2008
2009
2010
2011
2012
2013
2014
2015
Base revenue reduction
4125638
7592320
11812895
16167619
20328524
24769904
29155510
33338091
37691451
42141405
46445908
Fuel cost reduction
5166240
8956848
13238528
14683328
16859440
20212576
24919120
30094336
34616096
40546848
47845120
Potential off-system sales margins
2767500
5737500
8707500
Capacity cost reduction
7736295
11604442
11604442
15472589
15472589
19340737
19340737
23208884
GFT reduction
845561
660413
773705
527757
576669
709301
827386
851560
807636
944644
1055853
Program cost
20689324
22819634
22819634
22819634
22819634
22819634
22819634
22819634
22819634
22819634
22819634
Recovery through base rates
14405492
14639186
14799075
14977916
15183688
15416391
15650684
15878624
16115254
16352636
16645725
Cash flow
-6796409
-9374854
-10352249
-15745285
-15783359
-19859404
-20024486
-23954952
-24247459
-28323022
-28355080
-21195738994
Capacity cost Build option
Reduced capacity requirement (kW)
46125
95625
145125
194625
243000
292500
339750
385875
430875
477000
523125
Capacity added
200
300
300
400
400
500
500
600
Annual capacity cost
$386814737
$7736295
$11604442
$11604442
$15472589
$15472589
$19340737
$19340737
$23208884
Capacity cost Buy option
Reduced capacity requirement (kW)
46125
95625
145125
194625
243000
292500
339750
385875
430875
477000
523125
Capacity added
200
250
300
350
400
450
500
550
Annual capacity cost
$600000000
$12000000
$15000000
$18000000
$21000000
$24000000
$27000000
$30000000
$33000000
1994
2004
2005
2006
2007
2008
2009
2010
2011
2012
2013
2014
2015
Net MWh to system
7659242
10855000
11388814
11573570
11699976
11841366
12004047
12188019
12373248
12553455
12740532
12928203
13159916
Revenue multiplier
100
142
149
151
153
155
157
159
162
164
166
169
172
Revenue allocated to DSM
9688028
13730281
14405492
14639186
14799075
14977916
15183688
15416391
15650684
15878624
16115254
16352636
16645725
CentskWh in rates for DSM
0134
0134
0134
0134
0134
0134
0134
0133
0133
0133
0133
0133
Annual sales (MWh)
10262000
10776303
10954134
11076488
11213088
11369667
11546488
11724454
11897588
12077216
12256861
12476492
Sheet3
Saving Energy TogetherPower SaverTM Program
Questions
Saving Energy TogetherPower SaverTM Program
FY 2006 Achievements
Energy SavingsMW of
Programs Saved Goal Goal
Residential 126 115 110
Commercial 154 121 127
Demand Response 146 156 94
Solar 055 060 93
Grand Total 432 398 108
Saving Energy TogetherPower SaverTM Program
MW SavedPrograms FY2005 FY2006
Residential 119 126
Commercial 153 154
Demand Response 116 146
Solar 06 055
Grand Total 394 432
Energy Savings ComparisonFY2005 to FY2006
Saving Energy TogetherPower SaverTM Program
DSM Summary
bull DSM programs are saving peak kW amp kWh
bull Cost-effectiveness analyses include full program costs
bull DSM goals and budgets should vary to support AE resource plan requirements
Saving Energy TogetherPower SaverTM Program
Free Home WeatherizationEnergy Improvementsbull Insulate Atticsbull Duct Sealingbull Install CFLsbull Solar Screensbull Caulking and Weather-strippingbull Free Smoke amp Carbon Monoxide Detector bull Minor Energy Related Repairs
Saving Energy TogetherPower SaverTM Program
Power Saver Program
bull FREE Energy Saving Productsbull Lower energy costsbull 65000 installed in homes apartmentsbull 4000 installed in commercial buildings
Saving Energy TogetherPower SaverTM Program
Energy Conservation in COA FacilitiesSenate Bill 5 Energy Use vs Energy Cost
295
300
305
310
315
320
325
330
335
340
345
350
Base Year2001
2002 2003 2004 2005 2006
Gig
awat
t-hou
rs
220
230
240
250
260
270
280
290
300
Mill
ion
Dol
lars
Million kWh Cost
Chart1
Million kWh
Cost
Gigawatt-hours
Million Dollars
Senate Bill 5 Energy Use vs Energy Cost
343667472
28619895
33757683
2504536
3260767692
24602549
31773020962
26778741
324036807
2745756918
313494864
2936354518
Sheet1
Sheet1
ampA
Page ampP
Million kWh
Gigawatt-hours
Senate Bill 5 Reported Energy Use
Sheet2
ampA
Page ampP
Million kWh
Cost
Gigawatt-hours
Million Dollars
Senate Bill 5 Energy Use vs Energy Cost
Sheet3
Energy Efficiency Real Reliable and Cost-Effective Alternative