Embed Size (px)
Citation preview

Distr. LIMITED
E/ESCWA/SDPD/2017/Technical Paper.1 31 January 2017 ORIGINAL: ENGLISH
Economic and Social Commission for Western Asia (ESCWA)
Energy Efficiency Indicators in Intensive Energy Consuming
Industries (IECI) in the Arab Region
United Nations
Beirut, 2017
_______________
Note: The opinions expressed in this document are those of the authors and do not necessarily reflect the views of ESCWA.
17-00047

iii
CONTENTS
Page
Summary............................................................................................................................................. v Acronyms ........................................................................................................................................... vi
Chapter
A. The industrial sector worldwide ....................................................................................... 1 B. The industrial sector in the Arab region ........................................................................... 2
A. IECI characteristics........................................................................................................... 6
B. Energy efficiency indicators in IECI ................................................................................ 7 C. Energy consumption and potential savings in IECI ......................................................... 8 D. IECI technologies and energy use in selected industries .................................................. 10
A. Selected IECI in Arab countries ....................................................................................... 15 B. Energy consumption in selected IECI .............................................................................. 17 C. Energy saving and EE measures ....................................................................................... 19
D. IECI CO2 emission indicators ........................................................................................... 21 E. Net profit EE and CO2 abatement measures ..................................................................... 22

iv

v
Summary
This working paper reviews energy efficiency (EE) indicators in intensive energy consuming industries
(IECI) in the Arab region in the general framework of the United Nations Secretary General’s Sustainable Energy for All (SE4ALL) initiative and the 2030 Agenda for Sustainable Development, in particular Goals 7 (target 3), 9, 12 and 13.
In chapter I, the paper reviews the energy consumption indicators in the industrial sector worldwide and looks at the contribution of industry to gross domestic product (GDP) and added value in the Arab region. The chapter considers energy consumption patterns, the potential for saving energy and related priority areas, carbon dioxide (CO2) emissions and reductions due to EE improvements, and specific energy consumption (SEC).
Chapter II discusses the main characteristics of intensive energy consuming industries (IECI), energy consumption patterns and efficiency indicators. It also provides indicative values for potential energy savings in different IECI, and overviews the technologies and energy aspects in the most significant IECI (aluminum,
cement, iron and steel, and chemicals, petrochemicals and fertilizers).
Chapter III presents calculations of energy consumption, energy saving, CO2 emissions and reductions, and potential revenue due to implementing net profit EE and CO2 abatement measures in 65 IECI in Arab
countries. It also looks at priority areas, measures and policies for improving EE in IECI.
In conclusion, the paper discusses the components of a national EE programme in IECI and related
actions to put them into effect, and also potential barriers to implementation in Arab counties. Work is needed in several areas, including: more data on end-use energy consumption among IECI, energy audits and the drafting of national EE strategies for IECI that reflect the goals of the 2030 Agenda.

vi
ACRONYMS
BAT best available technology
BF-BOF blast furnace-basic oxygen furnace
BOF basic oxygen furnaces
BPT best practice technologies
CHP combined heat and power
CO2 carbon dioxide
DRI-EF direct reduced iron with electric furnace
EAF electric arc furnace
EE energy efficiency
EP energy productivity
exajoule (ej) 1,000,000,000,000,000,000 joules
gigajoule (gj) 1,000,000,000 joules
GCC Gulf Cooperation Council
GDP gross domestic product
Gt gigatons
IEA International Energy Agency
IECI intensive energy consuming industries
ISIC International Standard Industrial Classification of All Economic Activities
kgoe kilogrammes of oil equivalent
kVA kilovolt-amps
kW kilowatt
MACC marginal abatement cost curve
OHF open hearth furnace
petajoule (pj) Equivalent to 1015 joules
SEC specific energy consumption
SE4ALL Sustainable Energy For All
Toe/Mtoe Tons of oil equivalent/Million tons of oil equivalent
WHR waste heat recovery
ENERGY SITUATION IN THE INDUSTRIAL SECTOR
A. THE INDUSTRIAL SECTOR WORLDWIDE
The industrial sector supports economic and social development, providing strategic products and supporting other sectors, such as agriculture and services. It attracts foreign direct investment and contributes to boosting exports and GDP. It also creates, through value chains, a considerable number of decent jobs.
The industrial sector accounts for more than one third of global primary energy use;1 in terms of end energy use, the figure is higher (about half the global total) due to non-fuel uses and conversion losses in the
industrial sector.2 Industry is also responsible for one third of energy-related carbon dioxide emissions.3 Global industrial energy use is expected to double current levels by 2050 in the absence of new emission reduction measures. Even with the most ambitious reductions policy, energy use will still increase by at least 50 per cent.4 Intensive energy consuming industries (IECI), especially chemicals and petrochemicals, and iron and steel, account for around half of total global industrial energy use.5
In 2014, industry accounted for 42.5 per cent of electricity, 38.6 per cent of natural gas, 8 per cent of oil and 79.8 per cent of coal consumption around the world. The rate of electricity, natural gas, oil and coal use in
the industrial sector recorded annual rises between 1973 and 2014 of, respectively, 4.9 per cent, 1.2 per cent, -0.8 per cent, 2.6 per cent respectively, with total annual growth of energy consumption of 1.5 per cent.6 On average, energy accounts for between 10 per cent and 20 per cent of the total production cost of industrial
products.7 In developing countries, the industrial sector consumes more than half of energy supply.8 In the Arab region, it represents 29 per cent of total energy consumption in the industrial sector. Consumption
between 2010 and 2014 grew by an average of 6.18 per cent, rising from 162.07 million tons of oil equivalent (Mtoe) to 229.89 Mtoe.9,10
The potential for global energy cost savings is estimated at $230 billion a year, including energy savings
through improved operation and maintenance practices and equipment retrofits, but excluding modernization to adopt best available technologies (BAT). The developed world accounts for $65 billion of that total, and
1 Aimee McKane and others, Policies for Promoting Industrial Energy Efficiency in Developing Countries and Transition
Economies, Executive Summary, United Nations Industrial Development Organization (UNIDO, Vienna, 2008). Available from
https://www.unido.org/fileadmin/media/documents/pdf/Energy_Environment/ind_energy_efficiencyEbookv2.pdf.
2 See www.eia.gov/tools/faqs/faq.cfm?id=447&t=1.
3 McKane, Policies.
4 Tamaryn Brown and others, Reducing CO2 emissions from heavy industry: a review of technologies and considerations for
policy makers, briefing paper No. 7, Grantham Institute for Climate Change (London: Imperial College, February 2012).
Available from https://www.imperial.ac.uk/media/imperial-college/grantham-institute/public/publications/briefing-papers/Reducing-
CO2-emissions-from-heavy-industry---Grantham-BP-7.pdf.
5 Rangan Banerjee and others, Energy End-Use: Industry, Global Energy Assessment – Toward a Sustainable Future, chap.
8 (Cambridge: Cambridge University Press, 2012). Available from www.iiasa.ac.at/web/home/research/Flagship-Projects/Global-
Energy-Assessment/GEA_Chapter8_industry_hires.pdf.
6 International Energy Agency (IEA), Key world energy statistics (Paris: 2016). Available from
www.iea.org/publications/freepublications/publication/KeyWorld2016.pdf.
7 Deger Saygin and others, Global industrial energy efficiency benchmarking: an energy policy tool, working paper (UNIDO,
November 2010). Available from https://www.unido.org/fileadmin/user_media/Services/Energy_and_Climate_Change/Energy_
Efficiency/Benchmarking_%20Energy_%20Policy_Tool.pdf.
8 McKane, Policies.
9 Organization of Arab Petroleum Exporting Countries (OAPEC) – Tenth Arab Energy Conference, 2014.
� ا)'&�ام ا����� �� ا�$��ع ا�"!� � �� ا��ول ا������، ����� ا����� ا����� ا�����، ا�ردن، أ��ر/���� 2006 10�)��.

2
developing countries and economies in transition the remainder.11 Those savings represent about 2 per cent of current industrial value added worldwide. If developing countries implement the appropriate EE measures to
meet specific energy consumption (SEC) in developed countries, total energy consumption in the industrial sector could fall by more than half.12 Implementing BAT in the next 20 years could lead to energy savings of 34 per cent, with a yearly improvement rate of 1.7 per cent.13
B. THE INDUSTRIAL SECTOR IN THE ARAB REGION
Characteristics: The industrial sector in Arab countries is characterized by: dependence on imported technology; use of fossil fuels, particularly oil and natural gas (some key industries are making the transition to natural gas); lack of investment needed for development; high cost of energy in non-oil producing countries;
public and private ownership; low energy efficiency, mainly due to energy subsidies and use of old technologies; low labour productivity, due to the lack of skills and inadequate training. Development of the industrial sector in the Arab region is influenced by a range of factors, including: population growth; the rising
consumption of individual industrial products; a shift to the services sector; the expansion of heavy industries; a trend towards the adoption of EE policies, especially the use of alternative energy sources and EE
technologies.14
Contribution to GDP: Mining and quarrying contributed 40 per cent of GDP in the Arab countries in 2012 (see table 1 and figure 1). That contribution was as high as 60 per cent in oil-rich countries such as Iraq
and Qatar, as little as 5 per cent in Jordan, and even less in Djibouti, Lebanon, Palestine, Somalia and the Sudan. On average, manufacturing accounted for 10 per cent of GDP across the region. That figure reached 16 per cent in non-oil rich countries like Egypt, Jordan and Tunisia, but was below 5 per cent in oil-rich countries such as Iraq and Kuwait.15 The sharp decrease in the share of mining and quarrying in GDP in 2009 was mainly due to the drop in the price of oil from $94.10 a barrel in 2008 to $60.86 in 2009.16 The added value (in millions of United States dollars) for manufacturing and mining and quarrying industries for the years (2010-2012) in ESCWA countries is given in table 2. Many Arab countries have made considerable efforts to
boost the contribution of their industrial sectors to GDP. Several countries are working on diversifying income sources through industrial development, particularly in IECI, which will lead to an increase in industry energy consumption.
Output: Based on 2005 constant prices, output of mining and quarrying industries in Arab countries increased from $1,381 per capita in 2009 to $1,508 per capita in 2012 (annual average growth rate of 3.07 per cent). In ESCWA member countries, it increased from $1,475 per capita in 2009 to $1,628 in 2012 (annual average growth rate of 3.5 per cent). For manufacturing industries, output in Arab countries rose from $405 per capita to $440 between 2009 and 2012 (annual average growth rate of 2.9 per cent), and in ESCWA member countries from $456 per capita to $496 (annual average growth rate of 2.92 per cent).17
11 McKane, Policies.
12 Ibid.
13 Deger Saygin, Global.
14 Ibid.
15 E/ESCWA/SD/2015/2.
16 See www.statista.com/statistics/262858/change-in-opec-crude-oil-prices-since-1960/.
17 E/ESCWA/SD/2015/2.

3
Table 1. GDP share in Arab countries (percentage), 2012
Country Mining and quarrying Manufacturing
Algeria 35.6 4.2
Bahrain 26.4 15.0
Djibouti 4.7 2.2
Egypt 16.4 15.5
Iraq 59.2 1.9
Jordan 5.5 16.5
Kuwait 64.0 5.4
Lebanon -2.2* 7.4
Libya 54.4 4.6
Mauritania 22.0 6.2
Morocco 7.3 14.8
Oman 53.8 10.1
Palestine 2.2 10.8
Qatar 58.2 9.8
Saudi Arabia 48.1 10.1
Somalia 0.6 2.2
Sudan 2.4 9.7
Syrian Arab Republic 21.5 4.7
Tunisia 8.5 16.0
United Arab Emirates 42.6 9.0
Yemen 23.2 8.8
Total Arab countries 40.5 9.2
ESCWA member countries 41.0 9.6
Other Arab countries 35.0 4.2
Source: E/ESCWA/SD/2015/2.
* Electricity and water supply only, and including mining and quarrying.
4
Figure 1. Share of industries in GDP in Arab countries, 2006-2012
(a) Mining and quarrying (b) Manufacturing
Source: E/ESCWA/SD/2015/2.
Table 2. Added value for manufacturing, mining and quarrying in ESCWA countries
(millions of United States dollars)
Country
Manufacturing
industries
Mining and
quarrying
Total
industry
Percentage of mining
and quarrying from
total industry Year
Bahrain 3,349 5,527 8,876 62.3% 2010
Egypt 19,494 23,666 43,160 54.8% 2010
Iraq 1,655 NA NA NA 2012
Jordan 5,378 1,453 6,831 21.3% 2011
Kuwait 8,072 96,374 104,446 92.3% 2011
Lebanon 2,026 2 2,028 0.1% 2007
Morocco 11,307 NA NA NA 2010
Oman 6,157 NA NA NA 2010
Palestine 1,483 34 1,517 2.2% 2012
Qatar 8,801 61,396 70,197 87.5% 2010
Saudi Arabia 13,073 NA NA NA 2005
Sudan 1,658 NA NA NA 2007
Syria Arab Republic 3,256 12,938 16,194 79.9% 2010
Tunisia 7,092 2,484 9,576 25.9% 2007
United Arab Emirates 25,143 88,510 113,653 77.9% 2010
Yemen 2,884 7,361 10,245 71.8% 2012
Source: E/ESCWA/SD/2013/12.

5
Energy: In the Arab region, industry accounts for consumption of 20 per cent of oil, 22 per cent of natural gas, 3.5 per cent of electricity and 0.2 per cent of coal.18 Table 3 shows estimated annual overall energy
consumption (in Mtoe) in the industrial sector in 17 Arab countries between 2010 and 2014.19 Total consumption in that sector rose from 162.07 Mtoe in 2010 to 230 Mtoe in 2014 (annual average growth rate of 6.18 per cent). Industry accounts for 29 per cent of total consumption, but the figure varies considerably
from one country to another (from 10.7 per cent in Morocco to 56 per cent in the United Arab Emirates). Within the industrial sector, manufacturing accounts for 61 per cent of total energy consumption in the Arab countries, while mining and quarrying represent 29 per cent.
Table 3. Energy consumption in the industrial sector (Mtoe/year)*
Country 2010 2011 2012 2013 2014
Annual
growth rate
(2010-2014)
Share of industrial
sector in total
energy consumption
(2010-2014)
Algeria 7.0 7.4 7.9 8.4 8.9 3.9% 16.0%
Bahrain 3.3 3.6 3.8 4.1 4.4 3.8% 28.5%
Egypt 19.7 20.5 21.4 22.4 23.4 2.4% 25.2%
Iraq 8.6 8.9 9.2 9.6 9.9 -3.3% 23.6%
Jordan 1.3 1.3 1.4 1.5 1.6 3.4% 18.0%
Kuwait 4.8 5.0 5.2 5.3 5.5 6.7% 19.3%
Lebanon 0.8 1.0 1.2 1.4 1.7 25.6% 19.8%
Libya 4.4 4.5 4.6 4.7 4.9 16.9% 21.1%
Morocco 1.2 1.5 1.8 2.3 2.9 18.6% 10.7%
Oman 4.7 6.4 8.8 12.0 16.5 23.5% 38.7%
Qatar 11.8 13.0 14.3 15.7 17.3 7.0% 20.9%
Saudi Arabia 51.8 55.3 59.0 62.9 67.1 2.0% 31.1%
Sudan 0.8 0.8 0.9 1.0 1.0 18.4% 15.7%
Syria Arab Republic 5.7 5.9 6.2 6.5 6.7 14.2% 28.2%
Tunisia 1.9 1.9 2.0 2.0 2.1 1.3% 24.3%
United Arab Emirates 31.4 35.7 40.7 46.3 52.8 8.4% 56.0%
Yemen 3.1 3.2 3.2 3.3 3.4 0.1% 42.0%
Total 162.07 175.88 191.52 209.36 229.89 6.18% 28.8%
* Estimates based on annual growth rate from 1980 to 2009.
�� �� ا��ول ا������، أ� ��� 21-23 آ�� ن أول/د����� 2014 18���� ا����� ا���#�، ��ص $�#�� ا"! �ك ا��� .'&$�� ا�19 Organization of Arab Petroleum Exporting Countries (OAPEC) – Tenth Arab Energy Conference, 2014.

6
INTENSIVE ENERGY CONSUMING INDUSTRIES (IECI):
CHARACTERISTICS, ENERGY CONSUMPTION
AND POTENTIAL EFFICIENCY GAINS
A. IECI CHARACTERISTICS
Industries are classified by three categories in terms of energy consumption:20 Intensive energy
consuming industries (IECI), such as cement, glass, iron and steel, aluminum, and chemicals and petrochemicals; medium energy consuming industries (MECI), such as furniture, tobacco, printing, leather and
textiles; and low energy consuming industries (LECI), such as cars, computers, appliances, electrical and electronic, equipment and machinery industries.
Energy in IECI is used in industrial processes for heating/cooling, power and electricity generation, and in some cases as a raw material “feed stock”, such as natural gas in the petrochemicals/fertilizer industry and coal in the steel industry. IECI are characterized by:
• High SEC. Smaller and older IECI plants are typically high SEC and inefficient. A plant that operates below capacity has a higher SEC compared with a plant that operates at nameplate
capacity;
• High proportion of industrial sector energy consumption. For example, the chemical and petrochemical and iron and steel industries account for approximately half of all industrial sector
energy used worldwide;21 in Egypt, the figure is more than 60 per cent;
• High potential for energy saving. Approximately two thirds of the total savings potential in the
industrial sector can be found in IECI. Such savings could reduce total production costs by between 3 and 4 per cent;22
• High portion of energy cost in total production cost (20 to 50 per cent for the chemicals industry,23
15 to 20 per cent for the steel industry, 20 to 40 per cent for the cement industry,24 14 per cent for the glass industry in the United States of America);25
• Heavy impact on the environment because of the type of fuels and raw materials used. The iron and steel industry accounts for 25 per cent of direct global industrial CO2 emissions, followed by chemicals and petrochemicals, with for 16 per cent;26
• High possibility of using alternative energy sources. In the steel industry, for instance, by-product gases from coke ovens, blast furnaces and basic oxygen furnaces (BOF) can be fully reused. Waste
heat from sulfur units in the fertilizer industry can be recovered, and waste chemicals, wood waste, used tires and biomass in the cement industry can be used;
• Use of energy in major processes, including the extraction of natural resources and their conversion
into raw materials, and in the manufacture of finished products.
20 E/ESCWA/ENR/2001/14.
21 Deger Saygin, Global.
22 Ibid.
23 Ibid.
24 See www.climatetechwiki.org/technology/energy-saving-cement.
25 See www.energystar.gov/ia/business/industry/Glass-Guide.pdf.
26 IEA, Tracking industrial energy efficiency and CO2 emissions (Paris, 2007). Available from https://www.iea.org/
publications/freepublications/publication/tracking_emissions.pdf.

7
The presence of IECI is generally either steady or in decline in industrialized countries. In developing countries where infrastructure and buildings are being constructed, the presence of IECI is growing and in many cases
they account for more than half of the industrial sector’s energy consumption.27 There are IECI in many Arab countries (figure 2).
Figure 2. Main IECI in the Arab countries
B. ENERGY EFFICIENCY INDICATORS IN IECI
EE indicators provide a crucial guide for energy policy and are essential for tracking progress in the implementation of energy efficiency strategies. The International Energy Agency (IEA) uses a pyramid of energy productivity (EP) indicators, divided into four levels (figure 3).
Figure 3. Industrial EP indicators
In order to obtain an overall picture with regard to IECI energy efficiency, EE indicators are needed at various levels, starting with plant equipment and moving up through the levels of facility, subsector, sector and, finally, the national level. Each level has its own specific indicators.
The EE indicator measures the ratio between energy consumption (in energy units) and activity data (in physical units). In IECI, they can measure energy consumption per ton of product or per United States dollar
27 McKane, Policies.
Iron and steel
• Algeria
• Egypt
• Iraq
• Saudi Arabia
• United Arab Emirates
Aluminum
• Bahrain
• Egypt
• Jordan
• Qatar
• Saudi Arabia
• United Arab Emirates
Cement
• All Arab countries
Fertilizers
• Algeria
• Egypt
• Jordan
• Qatar
• Morocco
• Saudi Arabia
Petrochemicals
• Algeria
• Egypt
• Jordan
• Qatar
• Morocco
• Saudi Arabia
Glass
• Almost all Arab countries

8
of added value. Average SEC for the cement, fertilizer, iron and steel, and aluminum industries in some countries is given in figure 4. The only consolidated case study on EE in IECI for an Arab country comes from
Egypt, conducted in the framework of the United Nations Industrial Development Organization (UNIDO) Industrial Energy Efficiency Project.
Figure 4. Average SEC of IECI in selected countries
Source: UNIDO and others, Industrial Energy Efficiency Baseline Assessment Report: Industrial Energy Efficiency Project in Egypt (2014). Available from http://ieeegypt.net/wp-content/uploads/2016/04/IEE_Activity_Final.pdf.
C. ENERGY CONSUMPTION AND POTENTIAL SAVINGS IN IECI
1. Consumption patterns
Patterns of energy consumption and losses, whether thermal or electrical, vary from one industry to another, as does the percentage of energy use and losses. For example, in the United States of America, according to one study, steam generation is the main source of energy in the chemical and food industries, while furnaces predominate in the aluminum and iron and steel sectors (table 4). Determining the type and indicative percentages of energy end use and onsite energy losses in different industries helps to identify the direction of EE efforts and rank priority areas by industry.
9
Table 4. Share of fuels and electricity, energy end-use distribution and onsite energy losses
for selected industries (indicative values) in the United States of America
Industries
Thermal/fuel share
(percentage)
Electricity share*
(percentage) Energy end use distribution
(percentage) Onsite energy losses (percentage)
IECI
Chemicals
(including fertilizers)
84% 16%
Aluminum 44% 56%
Iron and steel mills
90% 10%
Cement 89% 11% NA NA
Glass and glass products
79% 21% NA NA
Petroleum refining
96% 4%
Non-IECI
Food and beverage
79% 21%
Mining 68% 32%
Textile 61% 39% NA NA
Plastics and rubber
44% 56% NA NA
Fabricated metal 60% 40% NA NA
Transported
equipment 60% 40%
NA NA
Foundries 73% 27% NA NA
Source: Energetics, Incorporated and E3M, Energy Use, Loss and Opportunities Analysis, U.S. Manufacturing and Mining (December 2014).
* Based on equivalence of electrical energy with thermal energy.

10
2. Saving potential
IECI can increase EE by: upgrading inefficient equipment and technologies; improving operational and
maintenance practices; adopting energy management policies at the company level, and implementing energy management systems like ISO 50001. The broad adoption of best practice technologies (BPT) would could bring about significant reductions in energy consumption.28 Efforts in the past 40 years have brought a global
reduction in SEC of 50 per cent, but the cost of energy still represents a considerable portion of total production cost in IECI. There is still great potential for short-term energy savings in selected IECI, in particular in developing countries (table 5).
Table 5. Energy savings potential in selected IECI in industrialized and developing countries
Industry
Short-term energy savings (percentage)
Industrialized countries Developing countries
Iron and steel 10% 30%
Cement 20% 25%
Glass 30-35% 40%
Aluminum Alumina production 35% 50%
Aluminum smelters 5-10% 5%
Chemicals and
petrochemicals
Steam cracking (excluding feedstock) 20-25% 25-30%
Ammonia 11% 25%
Methanol 9% 14%
Petroleum refineries 10-25% 40-45%
Source: Deger Saygin and others, Global industrial energy efficiency benchmarking: an energy policy tool, working paper
(UNIDO, November 2010). Available from https://www.unido.org/fileadmin/user_media/Services/Energy_and_Climate_Change/ Energy_Efficiency/Benchmarking_%20Energy_%20Policy_Tool.pdf.
D. IECI TECHNOLOGIES AND ENERGY USE IN SELECTED INDUSTRIES
1. Cement
The cement industry, with simple processes, well defined system boundaries and a uniform product, is well suited to EE indicator analysis enabling comparison of performance between plants in various regions
and countries. Cement manufacturing is the third largest energy-consuming and CO2 emitting sector globally, with an estimated 1.9Gt of CO2 emissions from thermal energy consumption and production processes (about
5 per cent of all CO2 emissions) in 2006. Some of the key energy intensity indicators include: total primary energy consumption per ton of clinker produced; thermal energy consumption per ton of clinker produced; electricity consumption per ton of clinker produced; clinker-to-cement ratio; CO2 emissions per ton of cement.
28 Deger Saygin, Global.
11
Moreover, over half of CO2 emissions related to cement production are due to chemical reactions, especially in the production of lime (the key element in cement).29
Limestone (calcium carbonate/CaCO3), clay and sand are used to produce cement. The raw materials are milled, mixed and fed in to a kiln system. Inside the pre-heaters, the raw material is heated to around 900oC.30 Cement is produced using either wet or dry technology. The former is characterized by low energy
efficiency, which can be improved by optimizing preheating and combustion systems, adapting to semi-wet conversion, and enhancing heat recovery in clinker coolers. Wet processes tend to be the preserve of old plants built in the 1960s and 1970s, most of which have been phased out in Arab countries. The dry process, which eliminates the need for water evaporation, is less energy intense. The other major difference lies in the use of
the more efficient rotary kilns, rather than vertical shaft kilns. EE gains in the dry process could be made in terms of preheating, heat recovery and cogeneration.
Energy is consumed mainly in fire and steam systems and motor drives, and above all in the heating
(which accounts for about 74 per cent of energy consumption31), calcining and sintering of blended and ground materials to form clinker. About 30 per cent of electrical energy is consumed in grinding, 30 per cent in the
clinker burning process (mainly used for the fans), and 24 per cent in mills.32
EE gains and reductions in CO2 emissions in the cement industry can be achieved in three main ways: by changing production processes, with a focus on energy systems; adjusting the chemical composition of
cement; and using more energy efficient technologies.33 This could involve increasing the ratio of clinker substitutes in order to reduce process emissions from calcination,phasing out old kilns and adding pre-heaters and a pre-calciner to modern rotary kilns, and using advanced milling and grinding equipment.34 The high cost of energy in the cement industry should serve as an incentive to improve EE and reduce energy consumption.35
Worldwide, the cement industry consumes 2.7 Mtoe of biomass and 0.8 Mtoe of waste per year, making up less than 2 per cent of total fuel use in the industry. Tires, wood, chemicals, plastics and other types of waste could be used “in large quantities” as co-combustion in kilns. In some countries (Belgium, France, Germany,
the Netherlands and Switzerland) kilns are fired using 30 to 70 per cent alternative fuels. In the United States, the cement industry burns 53 million used tires (0.39 million tons, with an energy equivalent of 15pj).36 In some Arab countries, alternative fuels used include solid and liquid waste, coke oil and shale oil. The national
cement company in the United Arab Emirates uses tires with fuel oil; 5 per cent of the fuel mix used in cement factories in Jordan is olive peat.37
29 See www.climatetechwiki.org/technology/energy-saving-cement.
30 Brown and others, Reducing CO2 emissions.
31 See www.climatetechwiki.org/technology/energy-saving-cement.
32 See www.energyefficiencyasia.org/docs/IndustrySectorsCement_draftMay05.pdf.
33 See www.climatetechwiki.org/technology/energy-saving-cement.
34 Brown and others, Reducing CO2 emissions.
35 See www.climatetechwiki.org/technology/energy-saving-cement.
36 Ibid.
�� �� ا�+*�(�ت 37�� 2012، $��0/ آ.�ءة ا��� '�56 ا��:!�ر �5�5 م ا7�!+�د��، ا���56 ا4ول ا���د ا4ول ا��*� ا4و�3، ��12ان/�http://www.omu.edu.ly/articles/OMU%20Journal/forms/No%201.pdf .�;ك �� ا��ول ا������آ�ح <5= (�5 ا������ د. ،� ا7"! ��. .

12
2. Chemical and petrochemical sector and fertilizers
The chemical and petrochemical industry converts raw materials such as natural gas, oil, water, air,
metals and minerals into thousands of products, such as fertilizers, industrial gases, plastics, fibres and resins, which in turn are essential for manufacturing many consumer goods and materials needed in other industries.
Fossil fuels are used in the chemical and petrochemical industry sector as a source of thermal energy for
heating, cooling, steam generation and the like. More than half are also used as “feed stock” in many chemical processes. The sector accounts for more than 30 per cent of total industrial energy usage around the world.38
The main types of fertilizer are potassium (K), phosphorus (P) and nitrogen (N). Ammonia (NH3) is the main active element and 90 per cent of fertilizers are produced from it. Its production, particularly the
compression and heating processes, is highly energy intensive. In the Haber-Bosch process, ammonia is produced by combining hydrogen and nitrogen at high temperatures (300-550°C) and under high pressure (150-300 bar).39
Considerable energy savings can be made in the chemical and petrochemical sector. For example, in olefins and aromatics, savings could range from 10 per cent in polyvinyl chloride to 40 per cent in various
types of polypropylene. Application of the best available technology to ammonia production could bring savings of about 20 per cent.40
In the Arab region, the petrochemicals industry is a key mover of economic development. Saudi Arabia
accounts for 60 per cent of production in the region, followed by: Libya (11 per cent), Qatar (7 per cent), Kuwait (6.8 per cent), Egypt (5.5 per cent), Algeria (4.4 per cent), Iraq (2.9 per cent), Bahrain (2 per cent) and Jordan, Morocco, Oman, the Syrian Arab Republic and the United Arab Emirates (the remaining 0.4 per cent). As for fertilizers, the Arab region has about 70 per cent of the world's reserves of phosphate rock and 30 per cent of natural gas reserves, as well as generous stocks of sulfur and potash.
Gulf Cooperation Council (GCC) countries are considered a hub for the chemical and petrochemical industry, with an annual growth rate of 12 per cent. The chemical industry is the second largest manufacturing
sector in GCC countries and represents 2.9 per cent of GDP, with annual revenues of $97.3 billion. The industry employs more than 148,700 people directly and for every job creates on average of three additional jobs in related industries.
3. Iron and steel
Between 2003 and 2013, global crude steel production rose from 927 million tons to 1,606 million tons, 48.5 per cent of it produced in China. By 2050, world output is expected to grow by 1.5 times that of 2013.41 Steel is essential for many sectors, including infrastructure and construction (bridges, buildings), transport (railways, automobiles), utilities (power stations and municipal water systems), and manufacturing (including military hardware, energy and food storage equipment, appliances and tools). The construction sector accounts
38 Energy Information Administration, Manufacturing energy consumption survey (MECS): Chemical industry analysis brief.
Available from www.eia.gov/consumption/manufacturing/briefs/chemical/index.cfm.
39 UNIDO, Industrial energy efficiency project: benchmarking report for the fertilizer sector (Vienna, 2014). Available from
https://open.unido.org/api/documents/4677044/download/Industrial%20Energy%20Efficiency%20Benchmarking%20Report%20for
%20the%20Fertilizer%20Sector.
40 IEA, Tracking industrial energy efficiency.
41 World Steel Association, Energy use in the steel industry fact sheet. Available from https://www.worldsteel.org/
publications/fact-sheets.html.
13
for 50 per cent of world steel consumption followed by transport (16 per cent), machinery (14 per cent), metal products (14 per cent), domestic appliances (3 per cent) and electrical equipment (3 per cent).42
The steel industry accounts for 5 to 10 per cent of CO2 emissions worldwide. Given growth predictions, per unit emissions would have to be cut by half in order to stabilize emissions by 2050 at current levels.43
Primary steel production relies on coal, iron ore and limestone, and sometimes uses recycled steel, and
consumes excessive energy per ton. Secondary production uses recycled steel. There are various industrial processes: direct reduction of iron ore; the manufacture of pig iron in molten or solid form; the conversion of pig iron into steel; the making of steel; the manufacture of shapes (such as bars, plates, rods, sheets, strips and wire); and the production of tubes and pipes.
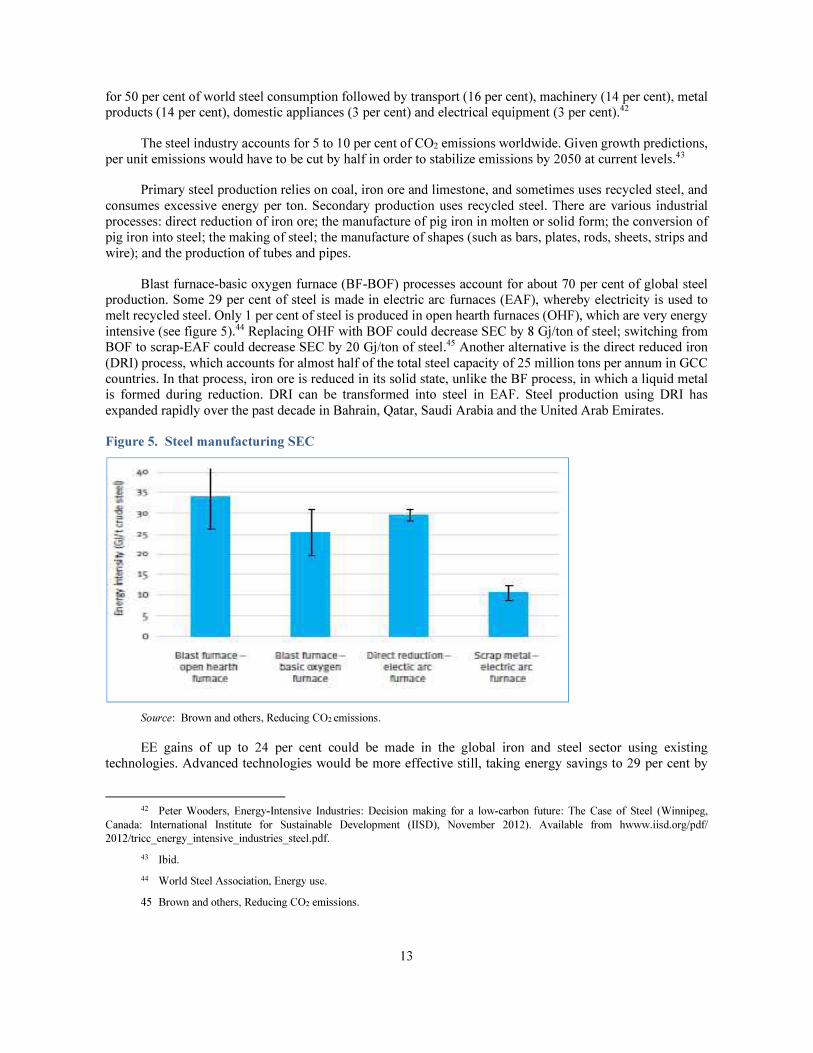
Blast furnace-basic oxygen furnace (BF-BOF) processes account for about 70 per cent of global steel production. Some 29 per cent of steel is made in electric arc furnaces (EAF), whereby electricity is used to melt recycled steel. Only 1 per cent of steel is produced in open hearth furnaces (OHF), which are very energy
intensive (see figure 5).44 Replacing OHF with BOF could decrease SEC by 8 Gj/ton of steel; switching from BOF to scrap-EAF could decrease SEC by 20 Gj/ton of steel.45 Another alternative is the direct reduced iron
(DRI) process, which accounts for almost half of the total steel capacity of 25 million tons per annum in GCC countries. In that process, iron ore is reduced in its solid state, unlike the BF process, in which a liquid metal is formed during reduction. DRI can be transformed into steel in EAF. Steel production using DRI has
expanded rapidly over the past decade in Bahrain, Qatar, Saudi Arabia and the United Arab Emirates.
Figure 5. Steel manufacturing SEC
Source: Brown and others, Reducing CO2 emissions.
EE gains of up to 24 per cent could be made in the global iron and steel sector using existing technologies. Advanced technologies would be more effective still, taking energy savings to 29 per cent by
42 Peter Wooders, Energy-Intensive Industries: Decision making for a low-carbon future: The Case of Steel (Winnipeg,
Canada: International Institute for Sustainable Development (IISD), November 2012). Available from hwww.iisd.org/pdf/
2012/tricc_energy_intensive_industries_steel.pdf.
43 Ibid.
44 World Steel Association, Energy use.
45 Brown and others, Reducing CO2 emissions.
14
2020.46 Although SEC in iron and steel has fallen by 60 per cent since 1960, energy still represents 20 to 40 cent of the total cost of steel production. Further improvement could come through: switching to more efficient
processing methods (such as by phasing out OHF and using more scrap-AEF); increasing waste heat recovery (WHR) from hot gases and using a heat integration approach in blast furnaces and BOF; and implementing efficient methods in final steel production and finishing. There is great WHR potential through by-product
gases emitted from the coke oven, blast furnace and basic oxygen furnace; more than 90 per cent of coke oven gas can be recovered in integrated steel plants.47
Steel is the most recycled material in the world. About 650 million tons of steel can be recycled annually. Recycling makes a significant contribution to in energy and raw materials savings: more than 1,400kg of iron
ore, 740kg of coal, and 120kg of limestone can be saved for every recycled ton of steel.48 SEC in steel production using recycled steel requires 8 GJ/ton of steel, as opposed to 20.6 GJ/ton when producing from iron ore.49
4. Aluminum
Alumina (Al2O3) is used to produce aluminum (or aluminium) and is obtained by grinding raw bauxite. Refinement starts with “digesting”, the chemical process to dissolve the alumina, followed by
settling/precipitation, mainly using gravity with some chemicals, and then calcination, whereby water is removed from the alumina hydrate by heating it to 1,100°C in the kiln. The alumina is then transformed into aluminum at a metal plant in a process requiring electricity, carbon and aluminum oxide. The result is liquid
aluminum, which is then cast for use in manufacturing.50
Aluminum is one of the most produced and used metals in the world. In 2012, around 49 million metric tons of primary aluminum and over 100 million metric tons of alumina were produced worldwide.51 The key aluminum producers are Australia, Brazil, Canada, China, India, Norway and the Russian Federation.52 China accounts for 23 per cent of world production, followed by the Russian Federation, with 12 per cent.53 Annual global demand of aluminum is projected to increase to 70 million metric tons by 2020, 40 per cent of it from GCC countries.
In 2014, GCC countries produced 4.7 million tons of aluminum (8.8 per cent of global production). The Gulf aluminum industry is growing by 8.4 per cent annually, while the average annual global growth is about 3.5 per cent. The United Arab Emirates produces more than half of the Gulf's aluminum.
Aluminum production is energy-intensive and time-consuming. However, once made, it can be recycled over and over without any loss in quality. Energy accounts for 20 to 40 per cent of aluminum production cost. Roughly 14,000 kilowatt-hours (kWh) of electricity are required to produce one ton of aluminum (table 6).
46 McKane, Policies.
47 World Steel Association, Energy use.
48 World Steel Association, World steel in figures 2014. Available from https://www.worldsteel.org/en/dam/jcr:17354f46-
9851-45c2-a1b6-a896c2e68f37/World+Steel+in+Figures+2014+Final.pdf.
49 Saygin and others, Global.
50 See also www.hydro.com/en/About-aluminium/How-its-made.
51 Statista, Global aluminum demand and supply growth rates. Available from: www.statista.com/statistics/242777/
aluminum-demand-and-supply-growth-rates/.
52 Banerjee, Energy End-Use.
53 McKane, Policies.

15
Table 6. SEC for aluminum production by region, 2014
Region SEC (kWh/ton) (AC))
Africa 14,569
Asia (except China) 14,714
China 13,596
Europe 15,513
GCC Countries 14,889
North America 14,870
Oceania 14,770
South America 15,038
Average World 14,289
Source: World Aluminium, Primary aluminium smelting energy intensity. Available from www.world-aluminium.org/statistics/ primary-aluminium-smelting-energy-intensity. Accessed 20 July 2015.
Note: AC value refers to the power consumed by facilities for the smelting process including rectification from AC to DC and normal smelter auxiliaries (including pollution control equipment) up to the point where the liquid aluminum is tapped from the pots. It excludes power used in casting and carbon plants.
Aluminum is a unique lightweight metal characterized by its flexibility, high electrical conductivity, strength, high resistance to corrosion and endless recyclability. About 75 per cent of all aluminum produced is still in use; recycling of aluminum saves 84 million tons of greenhouse gases every year.54 Due to its lightness, aluminum is used extensively in car manufacturing (which accounts for 39 per cent of aluminum produced in
Europe). The amount of aluminum used per car produced in Europe has tripled since 1990, reaching 140kg. The use of aluminum in car manufacture reduces fuel consumption by an annual average of 65 litres,55 and reduces CO2 emissions (a car containing 10 per cent aluminum emits 6.8 per cent less CO2 than the same
vehicle without aluminum).
IECI ENERGY EFFICIENCY AND THE 2030 AGENDA IN THE ARAB REGION
A. SELECTED IECI IN ARAB COUNTRIES
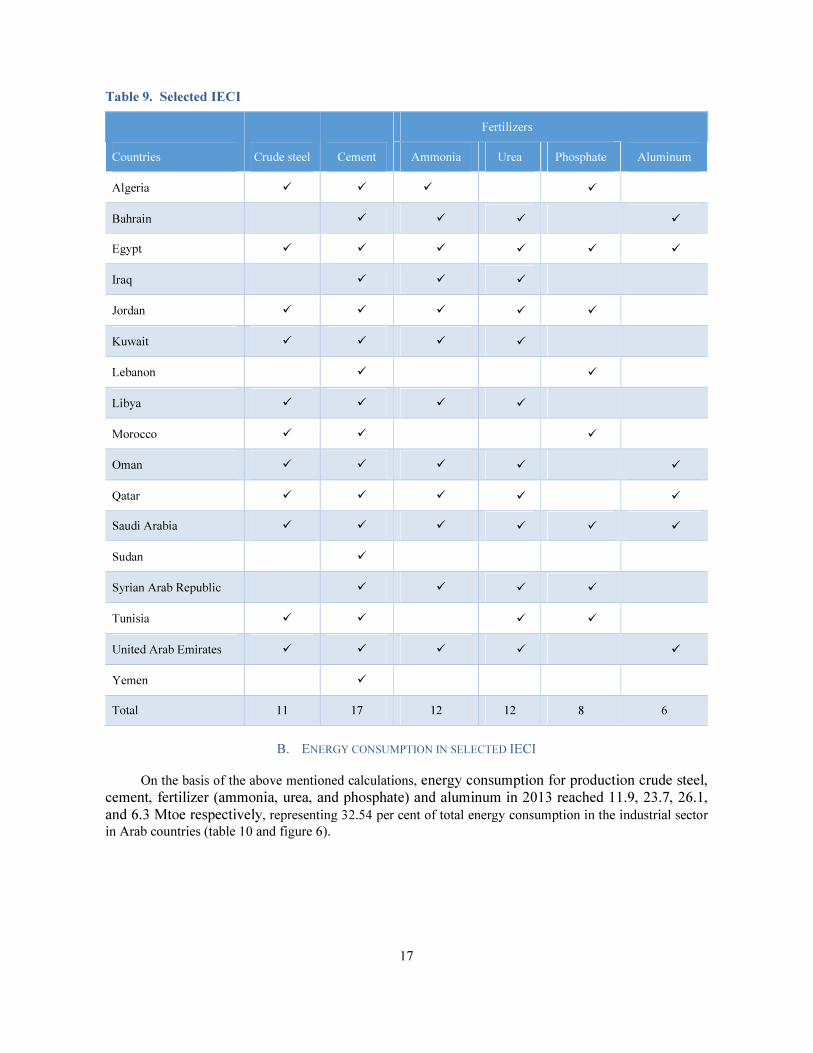
Measuring energy consumption in IECI is the key to calculating EE potential and indicators. Owing to a lack of such data in Arab countries, consumption is estimated on the basis of production and SEC. Annual energy consumption for specific IECI can be estimated by multiplying production (table 7) by SEC (table 8). Given the lack of national SEC data for the region, average world values have been used in this study. Similarly, national IECI production data are hard to come by. Data has thus been collected from a variety of sources for selected IECI in up to 17 Arab countries (table 9). Calculations were then performed for energy
54 See https://unfccc.int/files/meetings/workshops/other_meetings/application/vnd.ms-powerpoint/marx.pps.
55 European Aluminium Association, Sustainable development indicators for the aluminium industry in Europe: 2012 key
facts and figures (Brussels, November 2013). Available from http://alucan.cat/wp-content/uploads/2015/06/EAA-leaflet.pdf.

16
consumption, energy saving, CO2 emissions and reduction, and revenues due to implementing the net profit EE and CO2 abatement measures in those IECI. The results appear in the following sections.
Table 7. Annual production of selected IECI in Arab countries (1,000 ton/year), 2013
Country Crude steel Cement
Fertilizers
Aluminum Ammonia Urea Phosphate
Algeria 440 18,500 509 NA 1,496 NA
Bahrain NA 1,200 562 652 NA 930
Egypt 6,754 50,000 3,200 1,813 512 340
Iraq NA 3,657 1,295 1,970 NA NA
Jordan 150 5,000 678 NA
Kuwait 1,500 2,250 799 910 NA NA
Lebanon NA 5,831 NA NA 370 NA
Libya 715 2,000 359 221 NA NA
Morocco 558 14,900 NA NA 2,175 NA
Oman 160 4,472 1,100 1,000 NA 354
Qatar 2,236 5,335 2,985 4,737 NA 610
Saudi Arabia 5,471 57,000 4,004 4,858 3,810 500
Sudan NA 3,500 NA NA NA NA
Syrian Arab Republic NA 10,800 238 330 207 NA
Tunisia 109 7,504 131 NA 2,309 NA
United Arab Emirates 2,878 21,000 702 618 NA 2,400
Yemen NA 3,000 NA NA NA NA
Total 20,971 215,949 16,562 17,109 10,879 5,134
Sources: E/ESCWA/SD/2013/12; E/ESCWA/SDPD/2005/1(Part I); FAO Resource Statistics - Fertilizers, 2015
(https://knoema.com/FAORSF2015/fao-resource-statistics-fertilizers); www.statista.com/statistics/264624/global-production-of-aluminum -by-country; USGS 2013 Minerals Yearbook (https://minerals.usgs.gov/minerals); The Tenth Arab Energy Conference, 2014.
Note: Where 2013 data is unavailable, production is estimated on the basis of growth in previous years, considering a 4 per cent annual production growth rate.
Table 8. Average world and latest technology SEC (kgoe/ton product) and energy saving potential
for selected IECI
Crude
Steel Cement
Fertilizer
Aluminum Ammonia Urea Phosphate
Average World 570 110 941 660 80 1230
Latest technology 425 93 685 458 69 1131
Energy saving potential 25.4% 15.5% 27.2% 30.6% 13.8% 8%
Sources: Saygin, Global (see table 5); IEA, Tracking industrial energy efficiency and CO2 emissions (Paris, 2007; available from https://www.iea.org/publications/freepublications/publication/tracking_emissions.pdf); The Tenth Arab Energy Conference, 2014.
Note: Energy saving potential is the difference between average world and latest technology SEC.
17
Table 9. Selected IECI
Countries Crude steel Cement
Fertilizers
Aluminum Ammonia Urea Phosphate
Algeria � � � �
Bahrain � � � �
Egypt � � � � � �
Iraq � � �
Jordan � � � � �
Kuwait � � � �
Lebanon � �
Libya � � � �
Morocco � � �
Oman � � � � �
Qatar � � � � �
Saudi Arabia � � � � � �
Sudan �
Syrian Arab Republic � � � �
Tunisia � � � �
United Arab Emirates � � � � �
Yemen �
Total 11 17 12 12 8 6
B. ENERGY CONSUMPTION IN SELECTED IECI
On the basis of the above mentioned calculations, energy consumption for production crude steel,
cement, fertilizer (ammonia, urea, and phosphate) and aluminum in 2013 reached 11.9, 23.7, 26.1,
and 6.3 Mtoe respectively, representing 32.54 per cent of total energy consumption in the industrial sector
in Arab countries (table 10 and figure 6).

18
Table 10. Energy consumption in selected IECI in Arab countries (Mtoe), 2013
Country
Total
industrial
energy
consumption
IECI energy consumption
Crude
steel Cement Fertilizers Aluminum
Total
selected
IECI
Selected IECI
as portion of
industry (%)
Algeria 8.38 0.25 2.04 0.60 NA 2.88 34.42%
Bahrain 4.09 NA 0.13 0.96 1.14 2.24 54.66%
Egypt 22.37 3.85 5.50 4.25 0.42 14.02 62.66%
Iraq 9.58 NA 0.40 2.52 NA 2.92 30.49%
Jordan 1.50 0.09 0.55 0.38 NA 1.02 67.69%
Kuwait 5.33 0.86 0.25 1.35 NA 2.45 46.06%
Lebanon 1.41 NA 0.64 0.03 NA 0.67 47.59%
Libya 4.74 0.41 0.22 0.15 NA 0.77 16.32%
Morocco 2.29 0.32 1.64 0.17 NA 2.13 93.06%
Oman 12.00 0.09 0.49 0.66 0.44 1.68 13.99%
Qatar 15.73 1.28 0.59 5.94 0.75 8.55 54.34%
Saudi Arabia 62.90 3.12 6.27 7.28 0.62 17.28 27.48%
Sudan 0.96 NA 0.39 NA NA 0.39 40.10%
Syrian Arab Republic 6.45 NA 1.19 0.46 NA 1.65 25.52%
Tunisia 2.02 0.06 0.83 0.31 NA 1.2 59.19%
United Arab Emirates 46.33 1.64 2.31 1.07 2.95 7.97 17.20%
Yemen 3.30 NA 0.33 NA NA 0.33 10.00%
Total 209.38 11.953 23.754 26.116 6.315 68.14 32.54%
Energy consumption in IECI = Production (table 7) x SEC (table 8).
Figure 6. Distribution of energy consumption in selected IECI in Arab countries, 2013
Non-IECI141.24 million TOE,
67%
6%
11%
13%
3%
IECI68.1 million TOE,
33%
Crude steel
Cement
Fertilizer
Aluminum
19
Figure 7. Distribution of energy savings in selected IECI in Arab countries (Mtoe and percentage), 2013
C. ENERGY SAVING AND EE MEASURES
1. Energy saving potential
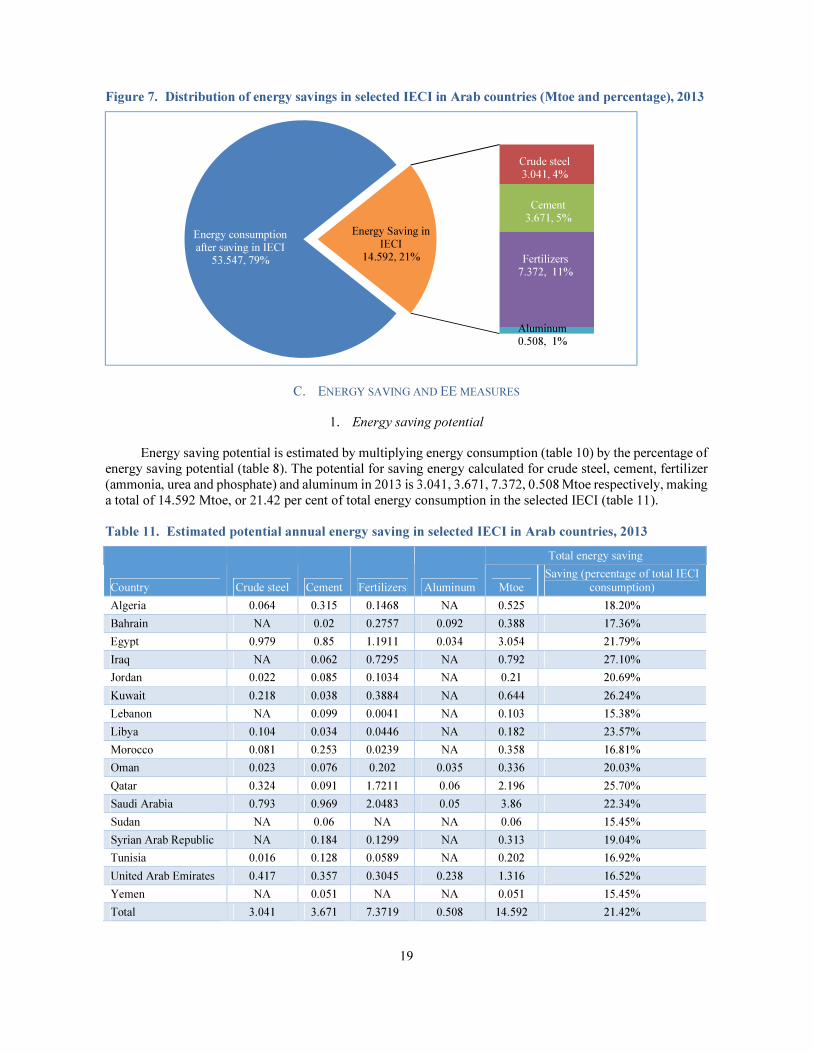
Energy saving potential is estimated by multiplying energy consumption (table 10) by the percentage of energy saving potential (table 8). The potential for saving energy calculated for crude steel, cement, fertilizer (ammonia, urea and phosphate) and aluminum in 2013 is 3.041, 3.671, 7.372, 0.508 Mtoe respectively, making a total of 14.592 Mtoe, or 21.42 per cent of total energy consumption in the selected IECI (table 11).
Table 11. Estimated potential annual energy saving in selected IECI in Arab countries, 2013
Country Crude steel Cement Fertilizers Aluminum
Total energy saving
Mtoe
Saving (percentage of total IECI
consumption)
Algeria 0.064 0.315 0.1468 NA 0.525 18.20%
Bahrain NA 0.02 0.2757 0.092 0.388 17.36%
Egypt 0.979 0.85 1.1911 0.034 3.054 21.79%
Iraq NA 0.062 0.7295 NA 0.792 27.10%
Jordan 0.022 0.085 0.1034 NA 0.21 20.69%
Kuwait 0.218 0.038 0.3884 NA 0.644 26.24%
Lebanon NA 0.099 0.0041 NA 0.103 15.38%
Libya 0.104 0.034 0.0446 NA 0.182 23.57%
Morocco 0.081 0.253 0.0239 NA 0.358 16.81%
Oman 0.023 0.076 0.202 0.035 0.336 20.03%
Qatar 0.324 0.091 1.7211 0.06 2.196 25.70%
Saudi Arabia 0.793 0.969 2.0483 0.05 3.86 22.34%
Sudan NA 0.06 NA NA 0.06 15.45%
Syrian Arab Republic NA 0.184 0.1299 NA 0.313 19.04%
Tunisia 0.016 0.128 0.0589 NA 0.202 16.92%
United Arab Emirates 0.417 0.357 0.3045 0.238 1.316 16.52%
Yemen NA 0.051 NA NA 0.051 15.45%
Total 3.041 3.671 7.3719 0.508 14.592 21.42%
Energy consumption after saving in IECI
53.547, 79%
Crude steel3.041, 4%
Cement3.671, 5%
Fertilizers7.372, 11%
Aluminum0.508, 1%
Energy Saving in IECI
14.592, 21%
20
2. EE measures and priorities areas
Eleven key measures and technologies for saving energy in IECI (and non-IECI) are set forth in table
12, which also displays indicative energy savings, payback periods for each measure and priority levels of implementation in each industry. Priority given to a certain measure/technology depends on cost, the amount of potential energy saving and other technical, environmental and social considerations. High priority measures
include: industrial process control; WHR; improved combustion efficiency; improved thermal insulation; power factor improvements; high-efficiency motors; and cogeneration.
Implementation of EE measures requires appropriate policies and institutional and regulatory frameworks. Incentives could include soft loans for EE, cash back on energy loans, tax reduction for EE
equipment, and subsidized energy audits, which should be carried out periodically at various levels in IECI. Also helpful is a total energy management approach (thermal and electrical). Energy tariff restructuring could include: time of use (TOU) tariffs; demand charge tariffs (peak demand contract in kW or kVA); seasonal
(summer and winter) rate tariffs; power factor tariffs (PFT). Other measures include: applying energy efficiency standards and codes for energy equipment (such as boilers, furnaces, kilns and electric motors),
restricting the import of inefficient equipment; improving operation and maintenance routine and housekeeping in IECI facilities; and enhancing capacity-building and training in EE.
Table 12. Proposed EE measures, indicative energy saving, payback period and priority of
implementation in IECI and non- IECI in Arab countries
Industries Indust
rial pro
cess
contr
ol
WH
R
Impro
vem
ent of co
mbust
ion
effi
cien
cy
Ener
gy
managem
ent sy
stem
s
Com
bin
ed h
eat and p
ow
er
(CH
P)/
Cogen
erati
on
Pow
er fact
or
impro
vem
ent
Hig
h-e
ffic
iency
moto
rs
Advance
d insu
lati
on a
nd
refr
act
ori
es
Impro
ving s
team
sys
tem
s
Usi
ng a
lter
nati
ve (
solid)
fuel
s
Hig
h-e
ffic
iency
lig
hti
ng
Expected energy saving 5-15 5-45 5-25 7-20 5-40 5-15 5-10 5-20 5-50 2-15 15-50
Expected payback period
(number of years) <2 0.5-1.5 1-3 <2 1-5 1-2 3-5 2-3 1-3 <5 0-0.5
Industry Priority of implementation (1 = high priority, 2 = medium priority, 3 = low priority)
IECI
Chemicals (fertilizers) 1 1 1 1 1 1 1 1 1 2 1
Aluminum 1 1 2 1 2 1 1 2 3 2 2
Iron and steel 1 1 1 1 1 1 1 2 3 1 2
Cement 1 2 1 2 3 1 1 2 3 1 2
Glass 2 1 1 2 2 1 1 1 3 2 2
Petroleum refining 1 2 1 2 1 1 1 1 1 3 1
Non-
IECI
Food and beverage 1 1 1 2 1 1 1 1 1 1 1
Mining 3 3 3 3 3 1 1 3 3 3 2
Textile 2 1 1 2 1 1 1 1 1 1 1
Plastics and rubber 2 2 2 1 2 1 1 2 3 3 2
Fabricated metal 1 2 2 1 3 1 1 3 3 3 2
Transported
equipment 3 3 3 3 2 1 1 3 3 3 2
Foundries 2 2 1 2 3 1 1 1 3 2 2
Sources: Energetics, Incorporated and E3M, Energy Use (see table 4); E/ESCWA/ENR/2001/14; surveys and energy audits undertaken in Arab countries.

21
D. IECI CO2 EMISSION INDICATORS
About 40 per cent of total global CO2 emissions come from industry through fuel combustion and
chemical reaction in industrial processes. If they remain unchecked, total CO2 emissions could increase by 90 per cent by 2050 compared with 2007.56 IECI are major CO2 emitters: the cement, iron and steel, and chemical and petrochemical industries accounted for 73 per cent of total industrial CO2 emission worldwide in 2007.57
In order to meet that challenge, there is a need to improve EE along the energy path and, where possible, switch to low carbon energy sources.
CO2 emissions due to energy use in the selected IECI in Arab countries were estimated by multiplying the emission factor (kg CO2/koe) by energy consumption (table 10). The estimated combined emissions for
the selected IECI in the 17 countries studied are 191.71 million tons (table 13), or 32.4 per cent of total industrial sector emissions. Potential emission reduction is estimated by multiplying the emission factor by the energy saving potential calculated in table 11. The results appear in table 13 and figure 8.
Table 13. Annual CO2 emissions and reduction due to energy saving in selected IECI in Arab
countries, 2013
Country CO
2 e
mis
sion f
acto
r
(kg C
O2/k
goe)
Tota
l C
O2 e
mis
sion
from
indust
rial
sect
or
(mil
lion to
n/y
ear)
CO2 emissions (million tons/year) Reduction in CO2 emissions due to energy saving
(million tons/year)
Cru
de
stee
l
Cem
ent
Fer
tili
zers
Alu
min
um
Tota
l IE
CI
Cru
de
stee
l
Cem
ent
Fer
tili
zers
Alu
min
um
Tota
l re
duct
ion
Algeria 2.9 24.3 0.73 5.9 1.74 0 8.36 0.19 0.91 0.43 0 1.52
Bahrain 1.9 7.77 0 0.25 1.82 2.17 4.25 0 0.04 0.52 0.17 0.74
Egypt 2.9 64.87 11.16 15.95 12.32 1.21 40.65 2.84 2.47 3.45 0.1 8.86
Iraq 3.3 31.61 0 1.33 8.31 0 9.64 0 0.21 2.41 0 2.61
Jordan 2.6 3.9 0.22 1.43 0.99 0 2.64 0.06 0.22 0.27 0 0.55
Kuwait 2.8 14.92 2.39 0.69 3.79 0 6.87 0.61 0.11 1.09 0 1.8
Lebanon 3.2 4.51 0 2.05 0.09 0 2.15 0 0.32 0.01 0 0.33
Libya 2.9 13.75 1.18 0.64 0.42 0 2.24 0.3 0.1 0.13 0 0.53
Morocco 3.1 7.1 0.99 5.08 0.54 0 6.61 0.25 0.79 0.07 0 1.11
Oman 2.5 30 0.23 1.23 1.65 1.09 4.2 0.06 0.19 0.51 0.09 0.84
Qatar 2.6 40.9 3.31 1.53 15.43 1.95 22.22 0.84 0.24 4.47 0.16 5.71
Saudi Arabia 2.9 182.41 9.04 18.18 21.11 1.78 50.12 2.3 2.81 5.94 0.14 11.19
Sudan 1 0.96 0 0.39 0 0 0.39 0 0.06 0 0 0.06
Syrian
Arab Republic 2.9 18.71 0 3.45 1.33 0 4.77 0 0.53 0.38 0 0.91
Tunisia 2.7 5.45 0.17 2.23 0.83 0 3.23 0.04 0.34 0.16 0 0.55
United
Arab Emirates 2.8 129.72 4.59 6.47 2.99 8.27 22.32 1.17 1 0.85 0.67 3.69
Yemen 3.2 10.56 0 1.06 0 0 1.06 0 0.16 0 0 0.16
Total 591.45 34.02 67.85 73.37 16.47 191.71 8.65 10.49 20.69 1.33 41.16
Notes: 0 = data unavailable.
The CO2 emission factor (kg CO2/koe) represents average values at the national level.
56 Brown and others, Reducing CO2 emissions.
57 Ibid.
22
Figure 8. Distribution of CO2 emissions reduction in selected IECI in Arab countries (millions of tons
and percentage), 2013
E. NET PROFIT EE AND CO2 ABATEMENT MEASURES
The marginal abatement cost curve (MACC) for CO2 mitigation technologies is crucial when it comes to selecting EE and CO2 abatement measures and technologies. In one study, 41 new and retrofitted CO2 abatement measures and technologies have been identified for three IECI (iron and steel, cement, and chemicals and petrochemicals). Fifteen of them are negative cost (see table 14), while 25 are positive cost and
one measure is zero cost. Negative cost for a specific technology provides net profit (revenue) along the life cycle of the technology, while positive cost requires expenditure.58
Table 14. Negative cost EE & CO2 abatement measures and technologies
Iron and steel Cogeneration (NB)
Cogeneration (RF)
Coke substitution (NB)
Coke substitution (RF)
Chemicals Efficient motor systems (NB)
Fuel shift oil to gas (NB)
Efficient motor systems (RF)
Fuel shift oil to gas (RF)
CHP (NB)
CHP (RF)
Cement Clinker substitution by other mineral components (NB)
Clinker substitution by fly ash (NB)
Alternative fuels (waste) (NB)
Clinker substitution by slag (NB)
WHR (NB)
Source: Brown and others, Reducing CO2 emissions.
Notes: NB: New build; RF: Retrofit.
58 Ibid.
CO2 emission after energy saving150.55, 79%
Crude steel
8.65, 4%
Cement 10.49, 5%
Fertilizer
20.69, 11%
Aluminum 1.33, 1%
CO2 emission mitigation
due to energy saving41.16, 21%
23
Annual revenue generated by implementation of the 15 net profit EE and CO2 abatement measures and technologies in the selected IECI (table 14) could reach $574.8 million (table 15).
Table 15. Revenue from due to net profit EE & CO2 abatement measures and technologies in the
Arab region, 2013
Industry
The most
economic (negative cost) EE & CO2
abatement
measures and technologies
Total CO2
reduction
(million tons/
year)*
(1)
Percent of
negative cost
of CO2 abatement from total
abatement**
(2)
Distribution of CO2 reduction EE & CO2 abatement measures/
technologies**
(3)
Amount of CO2
reduction by technology (million
ton/year)
(4)=(1)x(2)x(3)
Negative CO2
abatement
cost/revenue
(United States dollar/ton saved
CO2
equivalent/year)**
(5)
Annual revenue due to CO2 abatement (million United
States dollars/year)
(6)=(4) x (5)
Iron and steel
Cogeneration (NB)
8.65 21% 65% 1.18 75.5 89.1
Cogeneration
(RF)
8.65 21% 25% 0.45 71.0 32.2
Iron and steel
coke
substitution
(NB)
8.65 21% 7% 0.13 11.3 1.4
Coke
substitution (RF)
8.65 21% 3% 0.05 10.1 0.6
Total iron and steel 100% 1.8 109.54
Chemicals
Efficient
motor systems
(NB)
20.69 30% 50% 3.10 69.8 246.7
Fuel shift oil
to gas (NB)
20.69 30% 15% 0.93 57.4 53.5
Efficient
motor systems
(RF)
20.69 30% 4% 0.25 57.4 14.3
Fuel shift oil to gas (RF)
20.69 30% 4% 0.25 52.9 13.1
CHP (NB) 20.69 30% 20% 1.24 6.8 8.4
CHP (RF) 20.69 30% 7% 0.43 2.3 1.0
Total chemicals 100% 6.2 337.0
Cement
Cement clinker
substitution by
other MIC (NB
10.49 68% 20% 1.43 36.0 51.4
Clinker
substitution by
fly ash (NB)
10.49 68% 25% 1.78 22.5 40.1
Alternative
fuels (waste) (NB)
10.49 68% 25% 1.78 9.0 16.1
Clinker
substitution by
slag (NB)
10.49 68% 25% 1.78 3.4 6.0
Waste heat
recovery (NB)
10.49 68% 5% 0.36 2.3 0.8
Total Cement 100% 7.1 114.4
Grand Total 15.2 574.8
* From table 13.
** Based on Brown and others, Reducing CO2 emissions.

24
CONCLUSIONS
The potential for energy saving in IECI in Arab countries could be as high as 21 per cent of energy consumption. To achieve that, they must carry out long-term EE programmes, comprising four components and including 17 actions (figure 9). Implementation will require a strong commitment by decision-makers. In
developing countries, particularly in the short term, savings could be as high as: 50 per cent in aluminum (5 per cent in aluminum smelters); 40 per cent in glass; 30 per cent in the iron and steel industry; 25 per cent in cement; and 14 to 30 per cent in the chemical and petrochemical sector. That alone should motivate governments and decision-makers to act.
Potential EE measures in IECI include: industrial process control; WHR; cogeneration; improved combustion efficiency; better thermal insulation; improved power factor; high-efficiency motors; energy
management systems; and improved operation and maintenance practices. Integrating EE systems in IECI through initial design (or substantial redesign) and by introducing advanced technologies is expensive, but more profitable in the long run than retrofitting existing technologies.
A range of barriers could stand in the way of EE programmes in IECI in the Arab countries:
(a) Financing: The lack of financial resources or simply an unwillingness to fund EE measures (particularly those with long payback periods) or replace existing technologies with more efficient ones;
(b) Energy subsidies: Elevated subsidies (among the highest in the world, according to IEA) on energy and fuel in the Arab countries, especially in IECI, which lead to high growth rates in energy consumption, poor
service and low efficiency in industrial facilities;
(c) Institutional and regulatory weaknesses: Weak EE institutional frameworks, combined with the absence of appropriate standards, codes, legislation and regulations (including audit and monitoring mechanisms);
(d) Skills, capacity and awareness: A shortage of skilled EE technicians and engineers, a lack of awareness (particularly among decision-makers) of the economic and environmental benefits deriving from improved EE in IECI, a scarcity of data, and the failure to disseminate information on rational energy consumption and EE.
Figure 9. Main components for EE programmes in IECI and related actions
• Creating an energy efficiency and management body
• Identifying EE stakeholders and their respective responsibilities
Component I
Developing EE institutional
frameworks
•Reforming energy tariffs (fuels and electricity)
• Issuing certifications, codes, standards and labels for EE in IECI
•Launching economic incentives to encourage EE in IECI
•Enhancing finance mechanisms for EE projects
•Capacity-building
Component II
Developing EE policies and
regulations
•Performing energy audits/surveys, field visits and data collection
at various levels in IECI
•Identifying and assessing EE measures and policies based on
economic, technical and environmental criteria
•Identifying priority areas for EE (measures and policies)
Component III
Identifying and assessing EE measures
•Making a commitment to the EE programme
•Setting benchmarks/goals/targets
•Creating an action plan within a proposed timeframe, including
needs, stakeholders and responsibilities
• Implementing the action plan
•Evaluating the progress achieved
•Monitoring and reassessing
•Disseminating the results and replicating the implementation
Component IV
Implementing the programme

25
In order to meet those challenges, policymakers in Arab countries need to develop appropriate institutional and regulatory frameworks, engage in energy price and subsidy reform, enhance the business and
financial environment for EE, and build skills and technical capacity. Policy and programme planning and setting realistic targets are keys. Equally important is the monitoring of progress using EE analytical tools, such as gap analysis using normalization techniques; SEC norms; ISO 50001; energy audits in IECI; and
benchmarking. Key recommendations include:
• Institutional and regulatory frameworks should be developed within the total/integrated energy management concept, focusing on EE codes and standards, incentives and environmental regulations;
• Energy prices should be restructured and subsidies in IECI reformed, including through use of time of use (TOU) rates, demand (capacity) charges and seasonal rates;
• Efforts should be made to foster the use of advanced technologies in IECI with a view to making
industry more sustainable, including through technology and knowledge transfer, enhanced cooperation with developed countries, investment in innovation and R&D;
• Financing mechanisms need to be established to encourage the implementation of EE programmes in IECI, with a focus on bankable and financially feasible programmes;
• IECI energy data collection should be improved, including through energy audits and the
compilation of energy indicators;
• Capacity needs to be built through skills training, aware-raising and the dissemination of information on EE in IECI.