Embed Size (px)
Citation preview
Energy Efficiency in PJM Capacity Market
DOE Webinar
November 15, 2012 Terri Esterly
Sr. Lead Engineer
PJM Capacity Market Operations
www.pjm.com PJM©2012
PJM©2012 2
PJM Interconnection
www.pjm.com
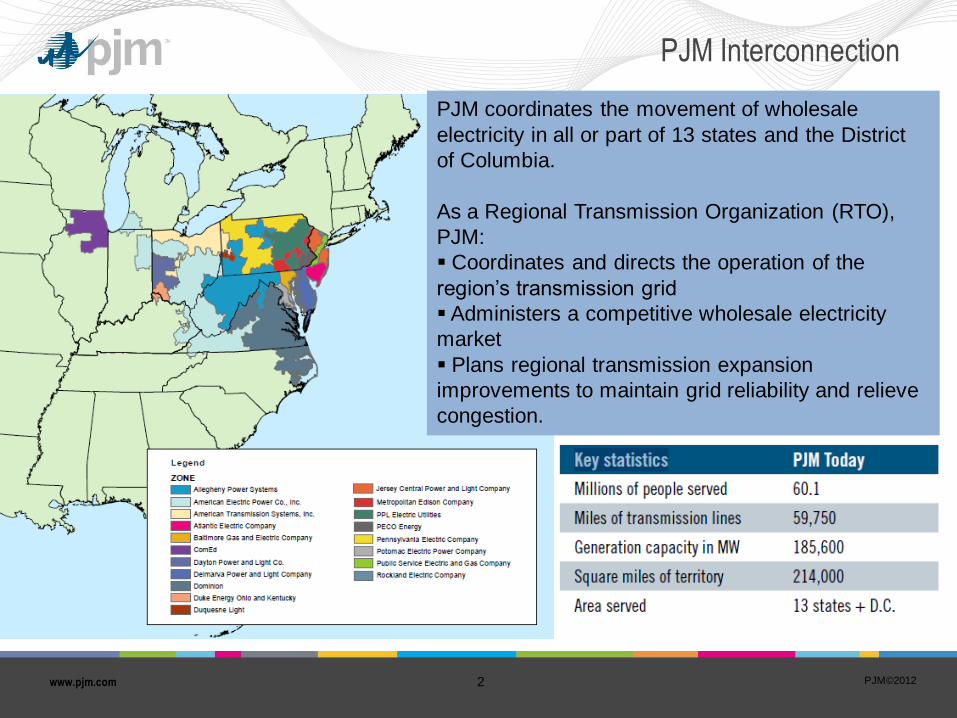
PJM coordinates the movement of wholesale
electricity in all or part of 13 states and the District
of Columbia.
As a Regional Transmission Organization (RTO),
PJM:
Coordinates and directs the operation of the
region’s transmission grid
Administers a competitive wholesale electricity
market
Plans regional transmission expansion
improvements to maintain grid reliability and relieve
congestion.
PJM©2012 3
What does Capacity mean?
• Capacity represents the commitment of
generation and demand side resources to ensure
that the demand for electricity can be meet.
• A Load Serving Entity (LSE) (i.e., a utility or other
electricity supplier) is required to have the
resources to meet its’ customers’ demand plus a
reserve amount.
• A LSE can meet that requirement with capacity
resources that they own, with capacity purchased
from others under contract, or with capacity
obtained through PJM’s capacity market auctions.
www.pjm.com
PJM©2012 4
PJM Capacity Market
• PJM’s capacity market, known as Reliability
Pricing Model (RPM), procures capacity
resources for future LSE requirements.
• Provides forward pricing signals to encourage
retention of existing resources and development
of new resources.
• RPM is a series of auctions for a Delivery Year
in the future.
• Majority of capacity is procured in the first
auction conducted for a Delivery Year, known as
the Base Residual Auction.
www.pjm.com
PJM©2012 5
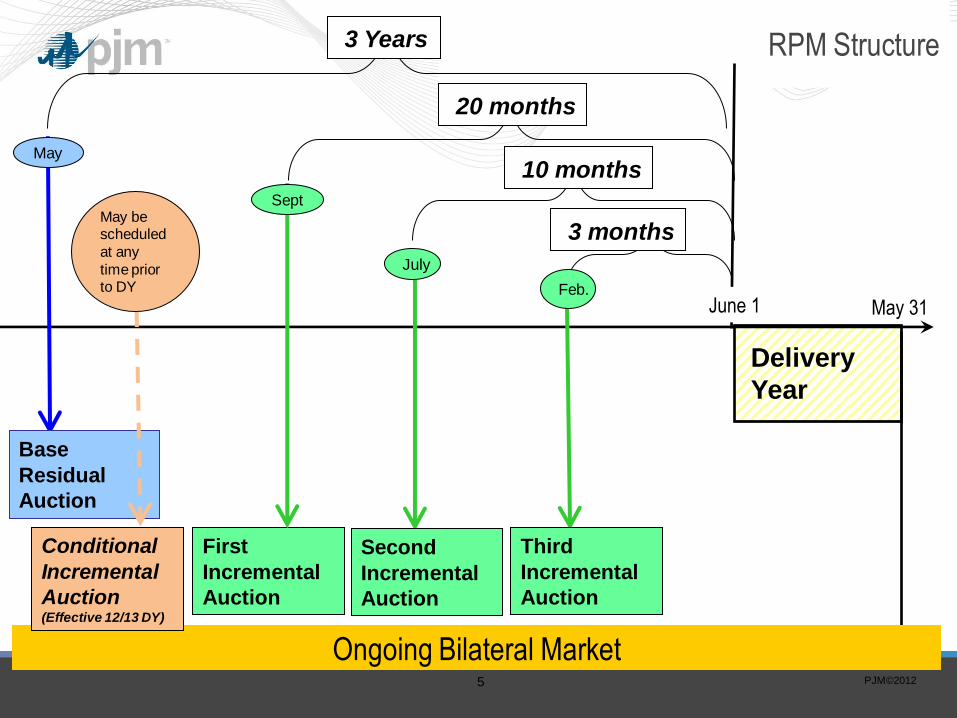
RPM Structure
Base
Residual
Auction
Delivery
Year
3 Years
Second
Incremental
Auction
Third
Incremental
Auction
May 31
3 months
10 months
First
Incremental
Auction
20 months
Ongoing Bilateral Market
May
Feb.
July
Sept
Conditional
Incremental
Auction (Effective 12/13 DY)
May be scheduled
at any
time prior to DY
June 1
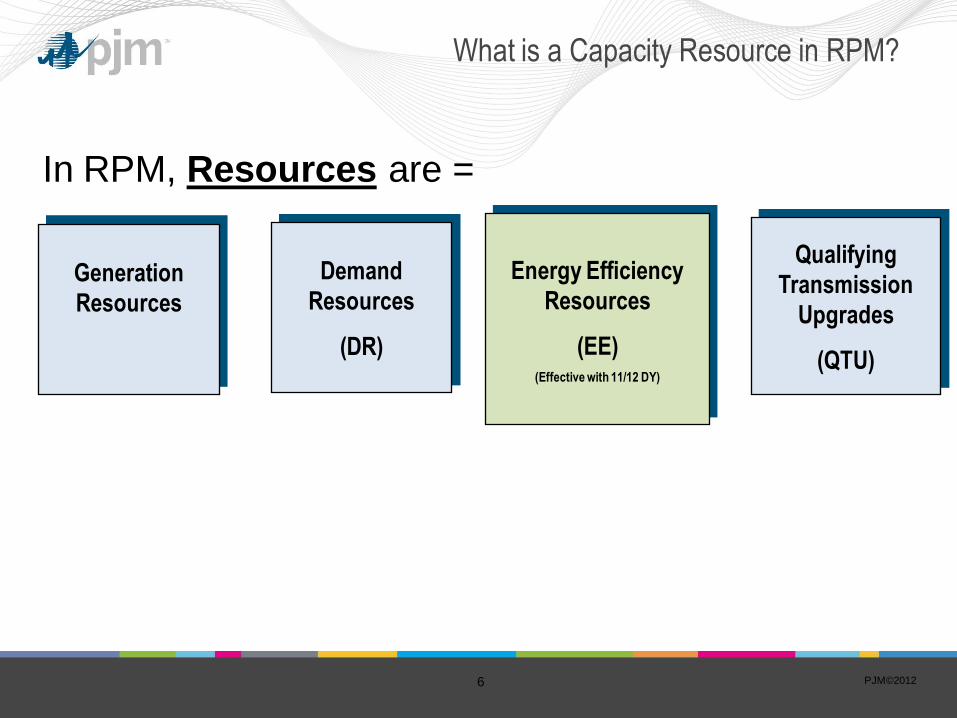
What is a Capacity Resource in RPM?
In RPM, Resources are =
Demand
Resources
(DR)
Qualifying
Transmission
Upgrades
(QTU)
Generation
Resources
Energy Efficiency
Resources
(EE) (Effective with 11/12 DY)
PJM©2012 6
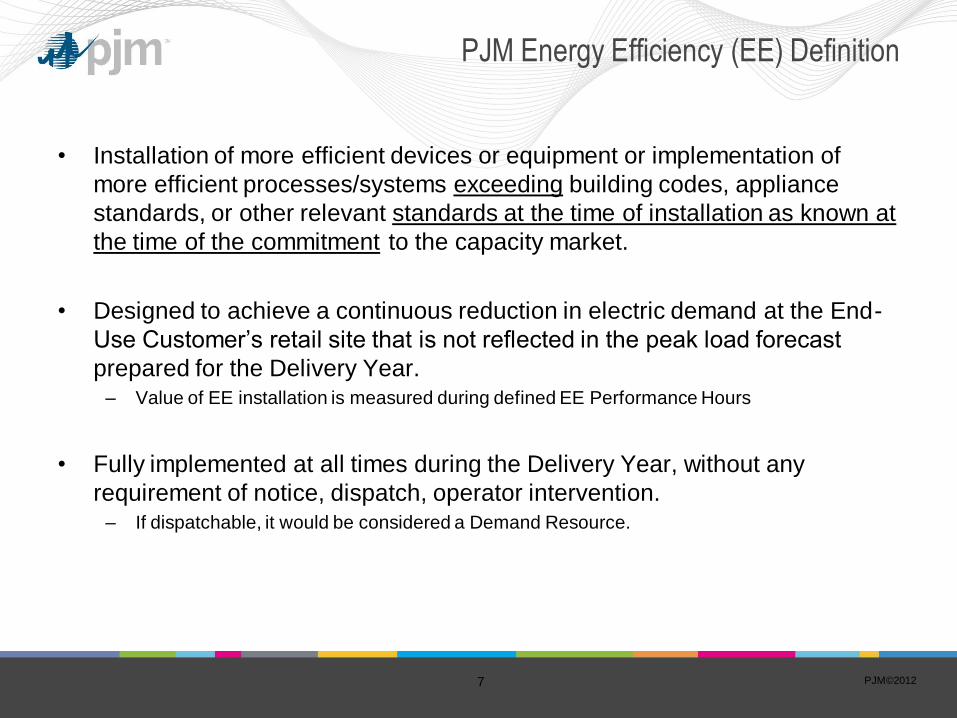
PJM Energy Efficiency (EE) Definition
• Installation of more efficient devices or equipment or implementation of
more efficient processes/systems exceeding building codes, appliance
standards, or other relevant standards at the time of installation as known at
the time of the commitment to the capacity market.
• Designed to achieve a continuous reduction in electric demand at the End-
Use Customer’s retail site that is not reflected in the peak load forecast
prepared for the Delivery Year. – Value of EE installation is measured during defined EE Performance Hours
• Fully implemented at all times during the Delivery Year, without any
requirement of notice, dispatch, operator intervention. – If dispatchable, it would be considered a Demand Resource.
PJM©2012 7
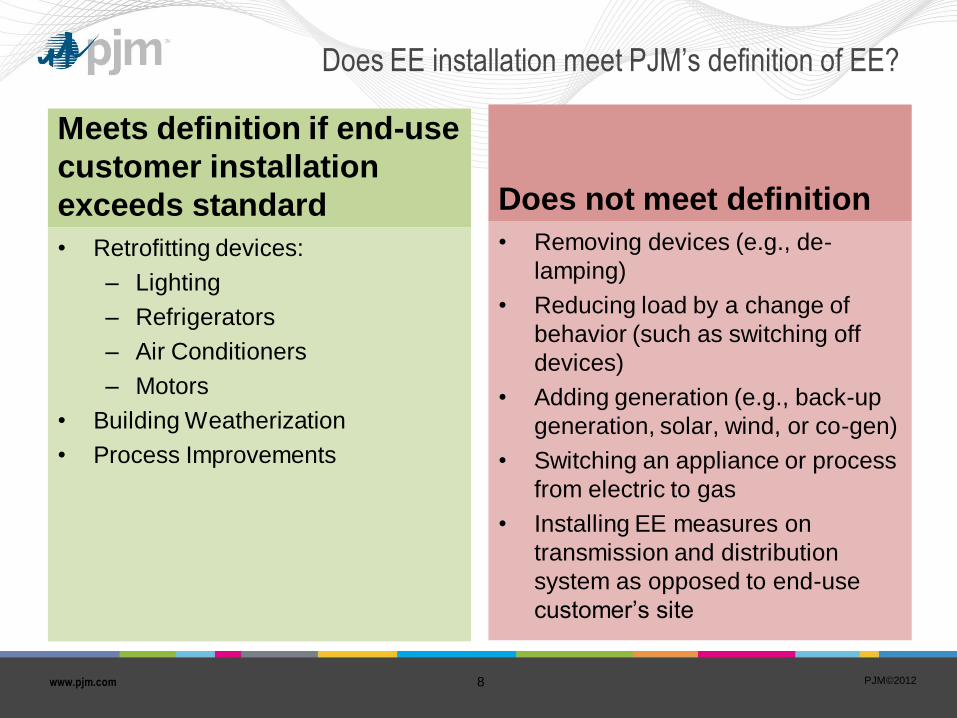
Does EE installation meet PJM’s definition of EE?
Meets definition if end-use
customer installation
exceeds standard Does not meet definition
• Retrofitting devices:
– Lighting
– Refrigerators
– Air Conditioners
– Motors
• Building Weatherization
• Process Improvements
• Removing devices (e.g., de-
lamping)
• Reducing load by a change of
behavior (such as switching off
devices)
• Adding generation (e.g., back-up
generation, solar, wind, or co-gen)
• Switching an appliance or process
from electric to gas
• Installing EE measures on
transmission and distribution
system as opposed to end-use
customer’s site
PJM©2012 8www.pjm.com
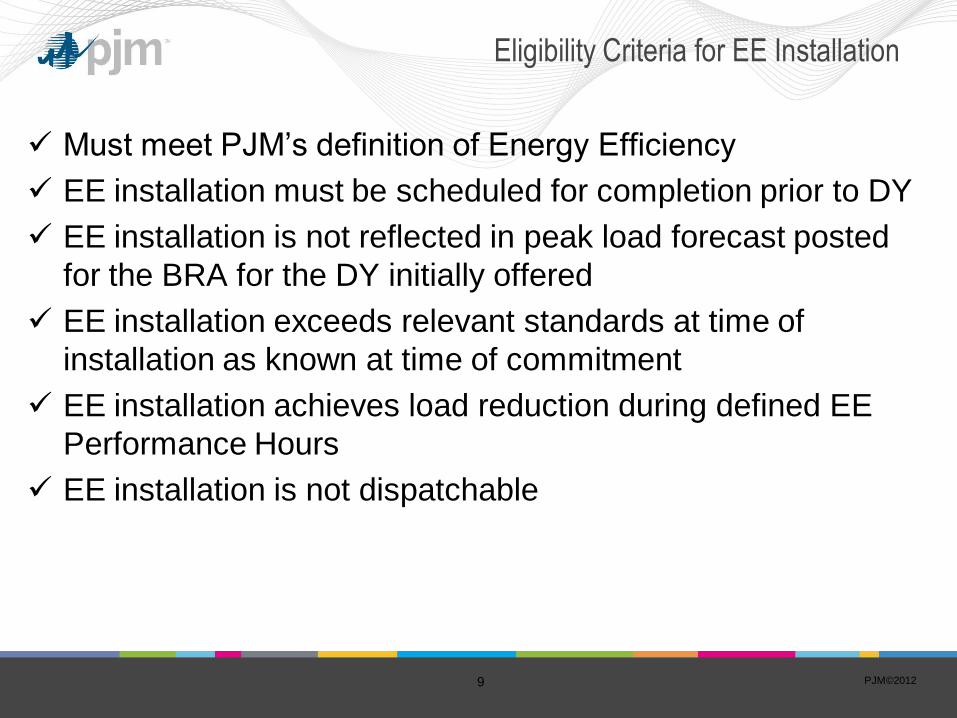
Eligibility Criteria for EE Installation
Must meet PJM’s definition of Energy Efficiency
EE installation must be scheduled for completion prior to DY
EE installation is not reflected in peak load forecast posted
for the BRA for the DY initially offered
EE installation exceeds relevant standards at time of
installation as known at time of commitment
EE installation achieves load reduction during defined EE
Performance Hours
EE installation is not dispatchable
PJM©2012 9
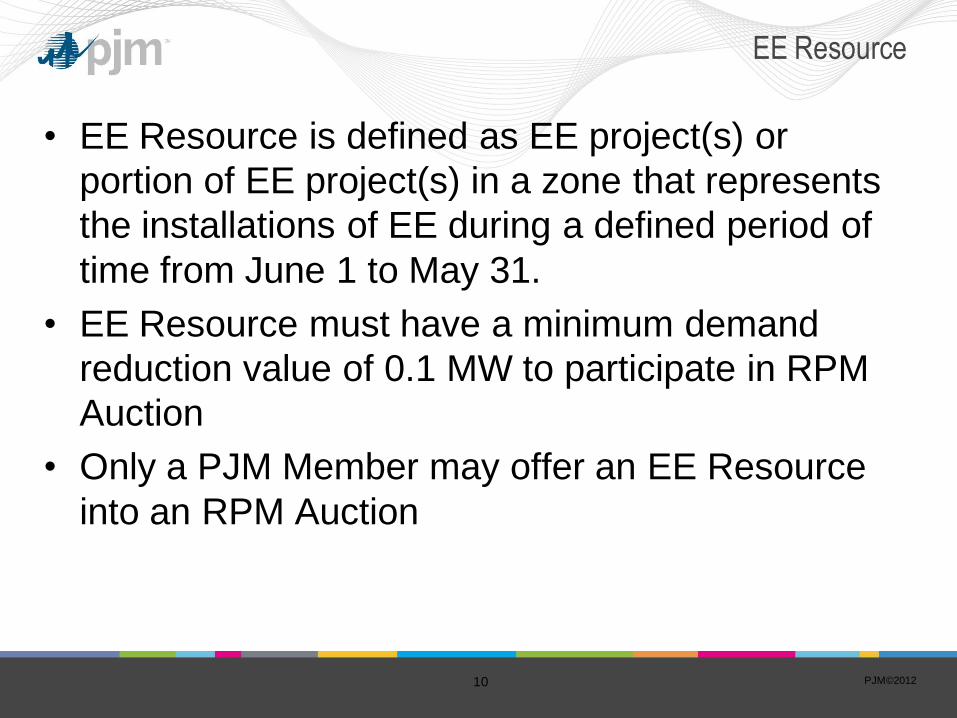
EE Resource
• EE Resource is defined as EE project(s) or
portion of EE project(s) in a zone that represents
the installations of EE during a defined period of
time from June 1 to May 31.
•EE Resource must have a minimum demand
reduction value of 0.1 MW to participate in RPM
Auction
•Only a PJM Member may offer an EE Resource
into an RPM Auction
PJM©2012 10
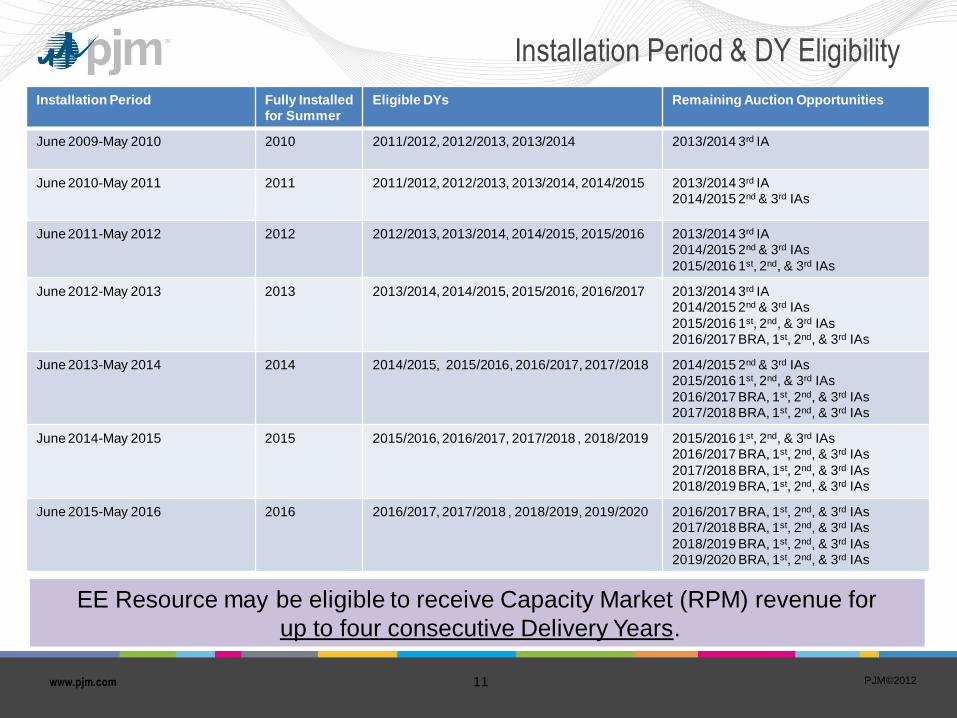
Installation Period & DY Eligibility
Installation Period Fully Installed
for Summer
Eligible DYs Remaining Auction Opportunities
June 2009-May 2010 2010 2011/2012, 2012/2013, 2013/2014 2013/2014 3rd IA
June 2010-May 2011 2011 2011/2012, 2012/2013, 2013/2014, 2014/2015 2013/2014 3rd IA
2014/2015 2nd & 3rd IAs
June 2011-May 2012 2012 2012/2013, 2013/2014, 2014/2015, 2015/2016 2013/2014 3rd IA
2014/2015 2nd & 3rd IAs
2015/2016 1st, 2nd, & 3rd IAs
June 2012-May 2013 2013 2013/2014, 2014/2015, 2015/2016, 2016/2017 2013/2014 3rd IA
2014/2015 2nd & 3rd IAs
2015/2016 1st, 2nd, & 3rd IAs
2016/2017 BRA, 1st, 2nd, & 3rd IAs
June 2013-May 2014 2014 2014/2015, 2015/2016, 2016/2017, 2017/2018 2014/2015 2nd & 3rd IAs
2015/2016 1st, 2nd, & 3rd IAs
2016/2017 BRA, 1st, 2nd, & 3rd IAs
2017/2018 BRA, 1st, 2nd, & 3rd IAs
June 2014-May 2015 2015 2015/2016, 2016/2017, 2017/2018 , 2018/2019 2015/2016 1st, 2nd, & 3rd IAs
2016/2017 BRA, 1st, 2nd, & 3rd IAs
2017/2018 BRA, 1st, 2nd, & 3rd IAs
2018/2019 BRA, 1st, 2nd, & 3rd IAs
June 2015-May 2016 2016 2016/2017, 2017/2018 , 2018/2019, 2019/2020 2016/2017 BRA, 1st, 2nd, & 3rd IAs
2017/2018 BRA, 1st, 2nd, & 3rd IAs
2018/2019 BRA, 1st, 2nd, & 3rd IAs
2019/2020 BRA, 1st, 2nd, & 3rd IAs
EE Resource may be eligible to receive Capacity Market (RPM) revenue for up to four consecutive Delivery Years.
PJM©2012 11www.pjm.com
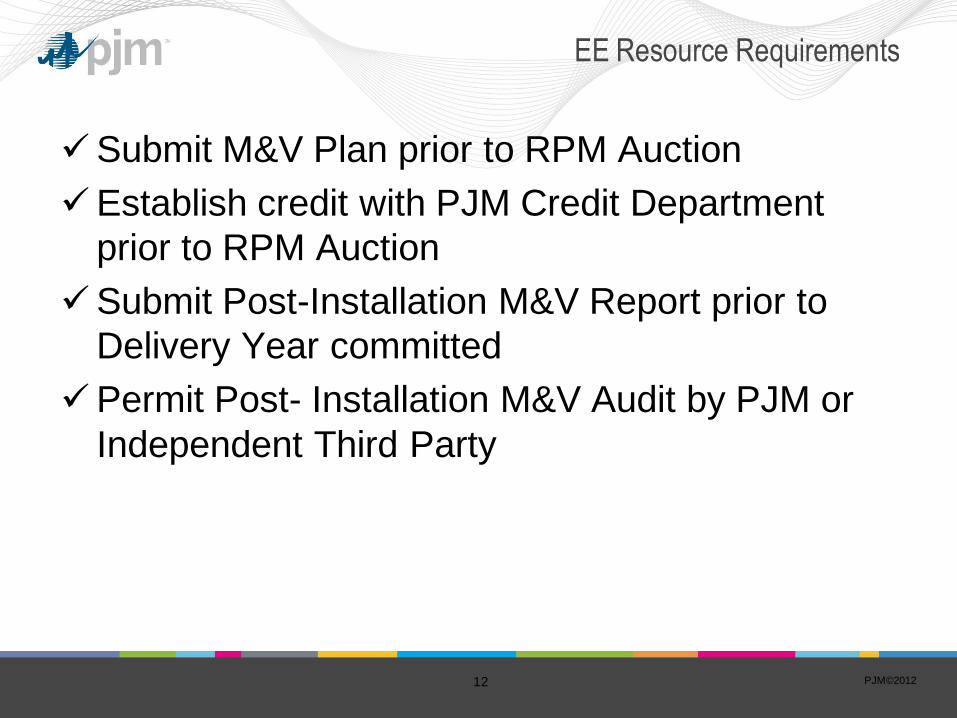
EE Resource Requirements
Submit M&V Plan prior to RPM Auction
Establish credit with PJM Credit Department
prior to RPM Auction
Submit Post-Installation M&V Report prior to
Delivery Year committed
Permit Post- Installation M&V Audit by PJM or
Independent Third Party
PJM©2012 12
Measurement & Verification
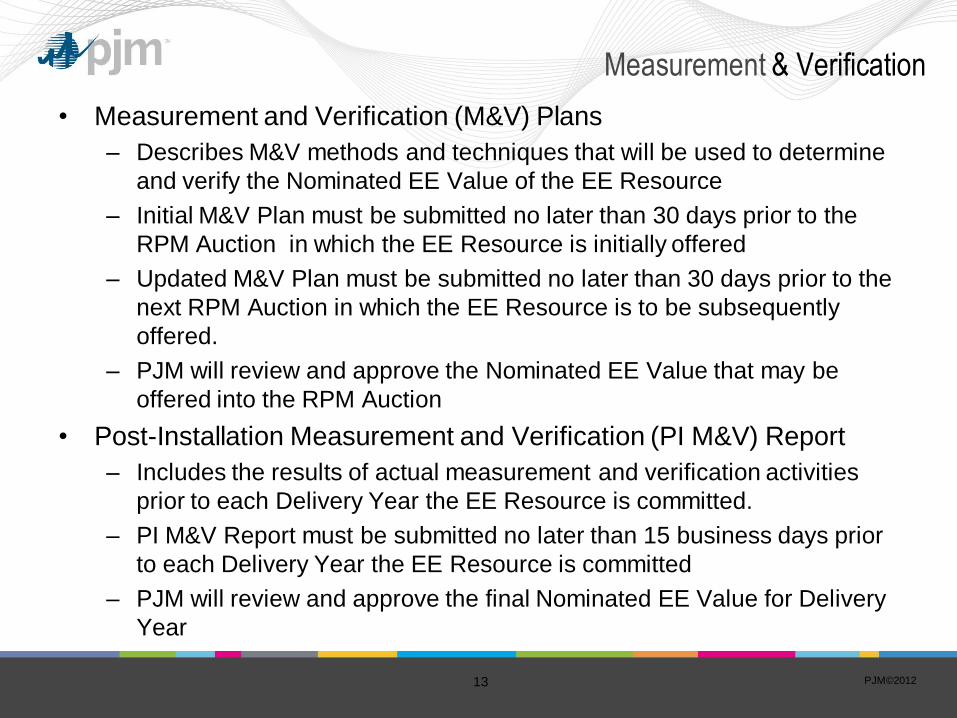
• Measurement and Verification (M&V) Plans
– Describes M&V methods and techniques that will be used to determine
and verify the Nominated EE Value of the EE Resource
– Initial M&V Plan must be submitted no later than 30 days prior to the
RPM Auction in which the EE Resource is initially offered
– Updated M&V Plan must be submitted no later than 30 days prior to the
next RPM Auction in which the EE Resource is to be subsequently
offered.
– PJM will review and approve the Nominated EE Value that may be
offered into the RPM Auction
• Post-Installation Measurement and Verification (PI M&V) Report
– Includes the results of actual measurement and verification activities
prior to each Delivery Year the EE Resource is committed.
– PI M&V Report must be submitted no later than 15 business days prior
to each Delivery Year the EE Resource is committed
– PJM will review and approve the final Nominated EE Value for Delivery
Year
PJM©2012 13
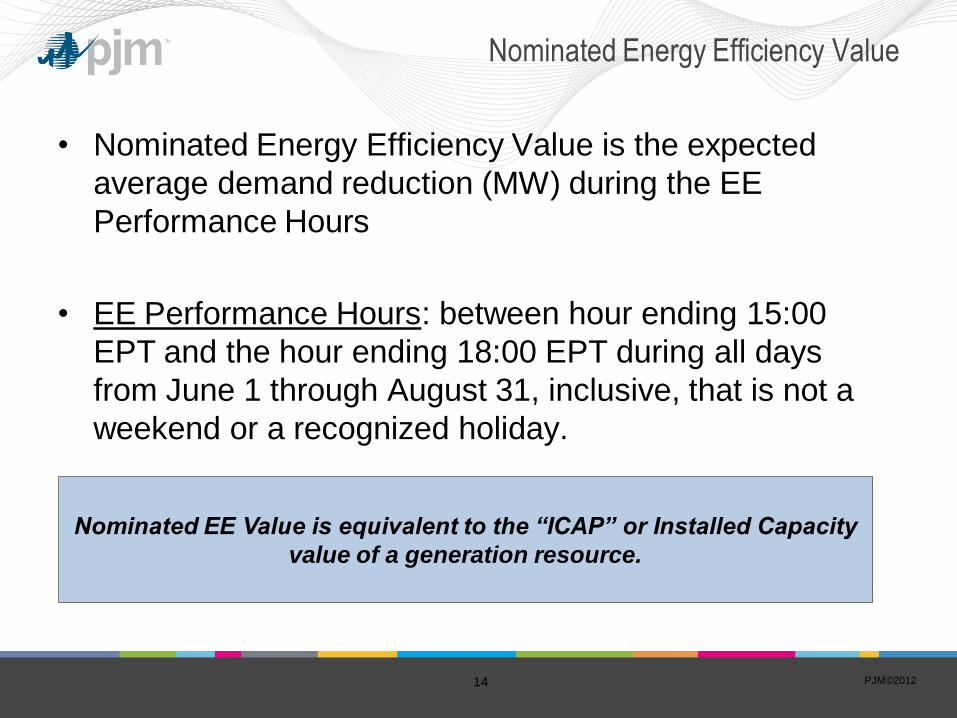
Nominated Energy Efficiency Value
• Nominated Energy Efficiency Value is the expected
average demand reduction (MW) during the EE Performance Hours
• EE Performance Hours: between hour ending 15:00
EPT and the hour ending 18:00 EPT during all days
from June 1 through August 31, inclusive, that is not a
weekend or a recognized holiday.
PJM©2012 14
Nominated EE Value is equivalent to the “ICAP” or Installed Capacity
value of a generation resource.
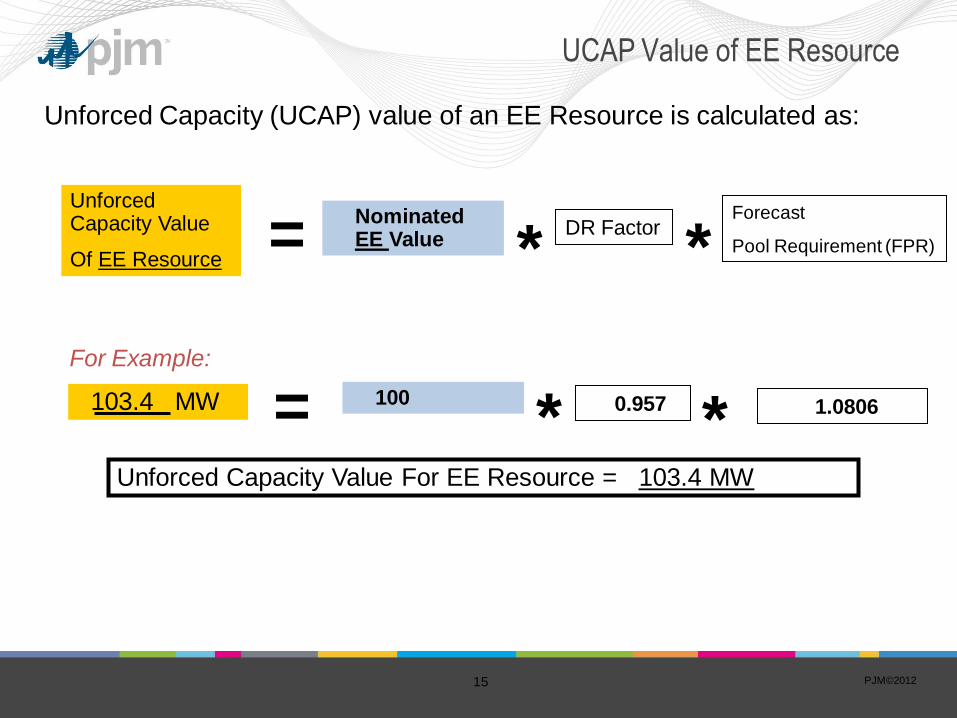
UCAP Value of EE Resource
Unforced Capacity (UCAP) value of an EE Resource is calculated as:
= Nominated EE Value *
DR Factor
* Forecast
Pool Requirement (FPR)
Unforced Capacity Value
Of EE Resource
For Example:
100
*103.4 MW = 0.957 * 1.0806
Unforced Capacity Value For EE Resource = 103.4 MW
PJM©2012 15
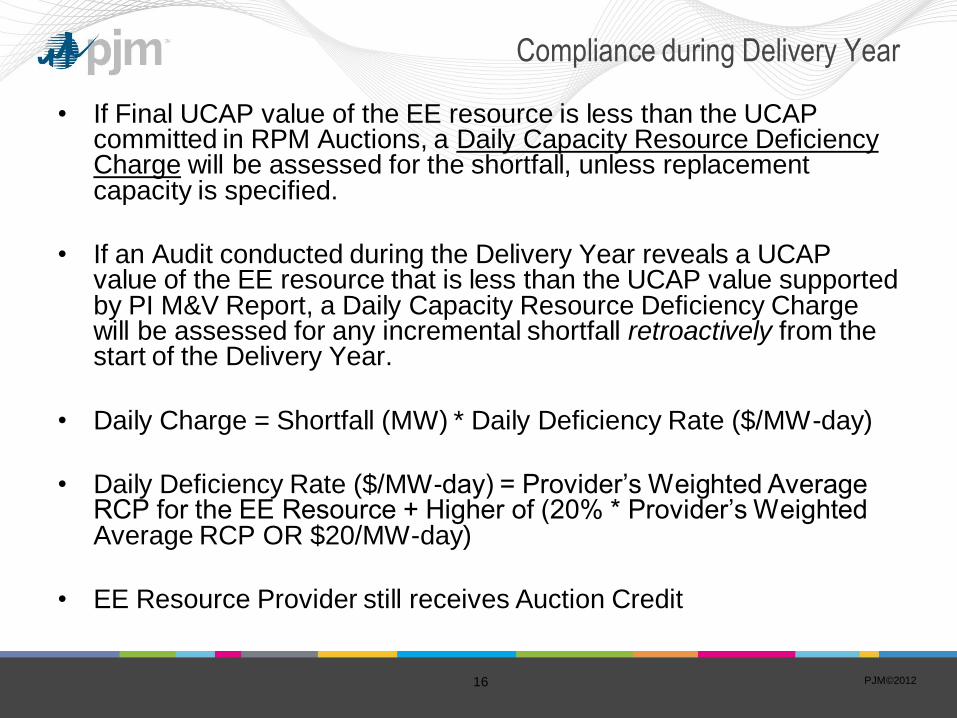
Compliance during Delivery Year
• If Final UCAP value of the EE resource is less than the UCAP committed in RPM Auctions, a Daily Capacity Resource Deficiency Charge will be assessed for the shortfall, unless replacement capacity is specified.
• If an Audit conducted during the Delivery Year reveals a UCAP value of the EE resource that is less than the UCAP value supported by PI M&V Report, a Daily Capacity Resource Deficiency Charge will be assessed for any incremental shortfall retroactively from the start of the Delivery Year.
• Daily Charge = Shortfall (MW) * Daily Deficiency Rate ($/MW-day)
• Daily Deficiency Rate ($/MW-day) = Provider’s Weighted Average RCP for the EE Resource + Higher of (20% * Provider’s Weighted Average RCP OR $20/MW-day)
• EE Resource Provider still receives Auction Credit
PJM©2012 16
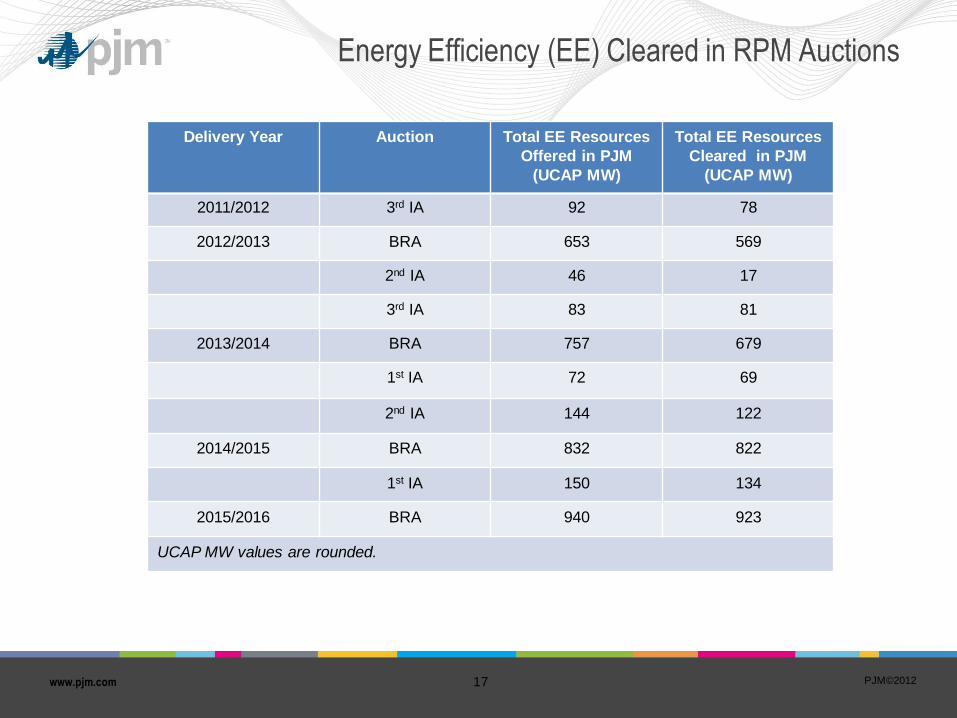
Energy Efficiency (EE) Cleared in RPM Auctions
Delivery Year Auction Total EE Resources
Offered in PJM
(UCAP MW)
Total EE Resources
Cleared in PJM
(UCAP MW)
2011/2012 3rd IA 92 78
2012/2013 BRA 653 569
2nd IA 46 17
3rd IA 83 81
2013/2014 BRA 757 679
1st IA 72 69
2nd IA 144 122
2014/2015 BRA 832 822
1st IA 150 134
2015/2016 BRA 940 923
UCAP MW values are rounded.
PJM©2012 17www.pjm.com
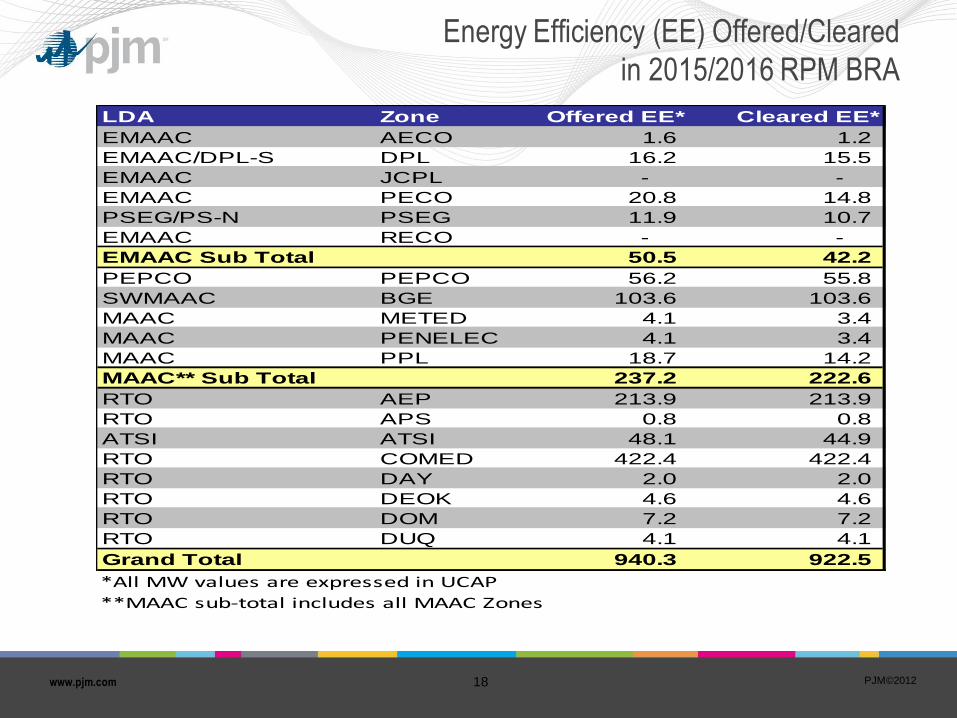
Energy Efficiency (EE) Offered/Cleared
in 2015/2016 RPM BRA
LDA Zone Offered EE* Cleared EE*
EMAAC AECO 1.6 1.2
EMAAC/DPL-S DPL 16.2 15.5
EMAAC JCPL - -
EMAAC PECO 20.8 14.8
PSEG/PS-N PSEG 11.9 10.7
EMAAC RECO - -
50.5 42.2
PEPCO PEPCO 56.2 55.8
SWMAAC BGE 103.6 103.6
MAAC METED 4.1 3.4
MAAC PENELEC 4.1 3.4
MAAC PPL 18.7 14.2
237.2 222.6
RTO AEP 213.9 213.9
RTO APS 0.8 0.8
ATSI ATSI 48.1 44.9
RTO COMED 422.4 422.4
RTO DAY 2.0 2.0
RTO DEOK 4.6 4.6
RTO DOM 7.2 7.2
RTO DUQ 4.1 4.1
940.3 922.5
*All MW values are expressed in UCAP
**MAAC sub-total includes all MAAC Zones
EMAAC Sub Total
MAAC** Sub Total
Grand Total
PJM©2012 18www.pjm.com
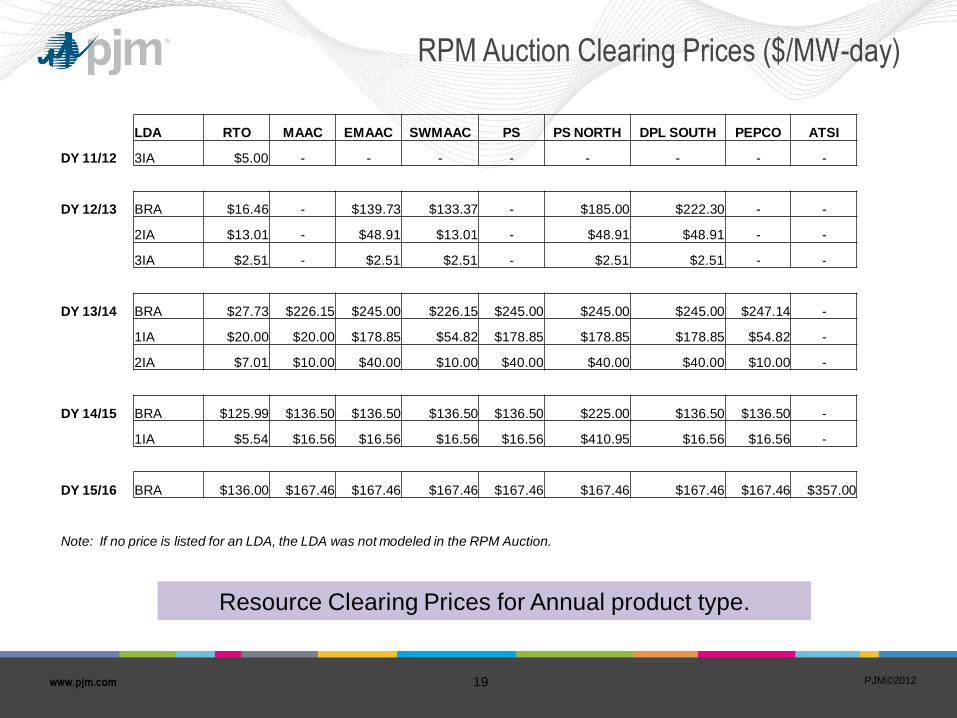
RPM Auction Clearing Prices ($/MW-day)
LDA RTO MAAC EMAAC SWMAAC PS PS NORTH DPL SOUTH PEPCO ATSI
3IA $5.00 - - - - - - - -DY 11/12
BRA $16.46 - $139.73 $133.37 - $185.00 $222.30 - -
2IA $13.01 - $48.91 $13.01 - $48.91 $48.91 - -
3IA $2.51 - $2.51 $2.51 - $2.51 $2.51 - -
DY 12/13
BRA $27.73 $226.15 $245.00 $226.15 $245.00 $245.00 $245.00 $247.14 -
1IA $20.00 $20.00 $178.85 $54.82 $178.85 $178.85 $178.85 $54.82 -
2IA $7.01 $10.00 $40.00 $10.00 $40.00 $40.00 $40.00 $10.00 -
DY 13/14
BRA $125.99 $136.50 $136.50 $136.50 $136.50 $225.00 $136.50 $136.50 -
1IA $5.54 $16.56 $16.56 $16.56 $16.56 $410.95 $16.56 $16.56 -
DY 14/15
DY 15/16 BRA $136.00 $167.46 $167.46 $167.46 $167.46 $167.46 $167.46 $167.46 $357.00
Note: If no price is listed for an LDA, the LDA was not modeled in the RPM Auction.
Resource Clearing Prices for Annual product type.
PJM©2012 19www.pjm.com
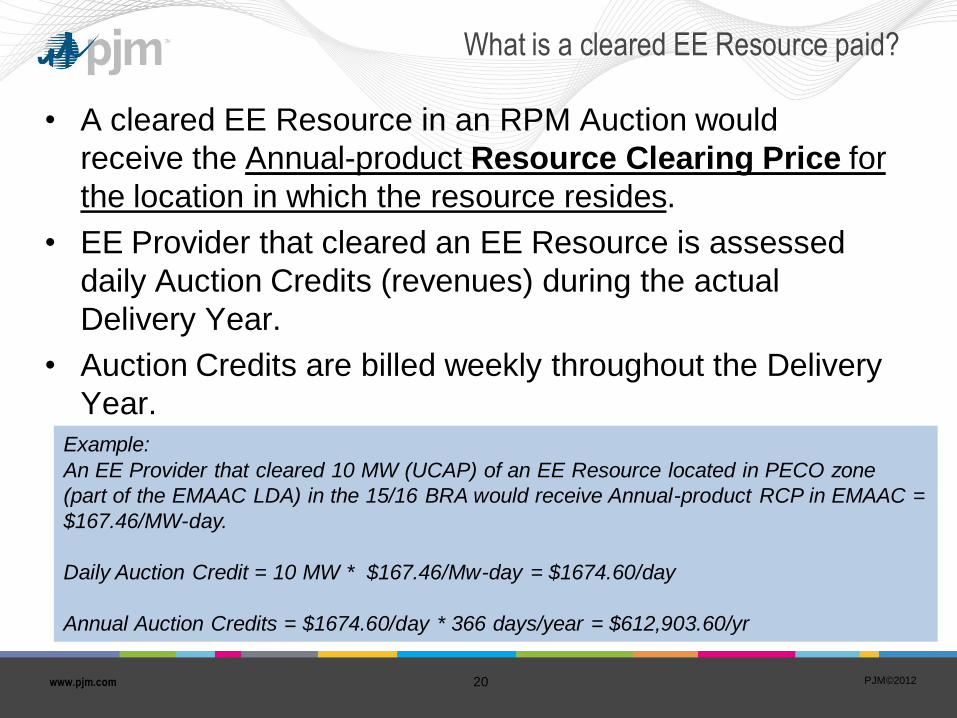
What is a cleared EE Resource paid?
• A cleared EE Resource in an RPM Auction would
receive the Annual-product Resource Clearing Price for
the location in which the resource resides.
• EE Provider that cleared an EE Resource is assessed
daily Auction Credits (revenues) during the actual
Delivery Year.
• Auction Credits are billed weekly throughout the Delivery
Year. Example: An EE Provider that cleared 10 MW (UCAP) of an EE Resource located in PECO zone (part of the EMAAC LDA) in the 15/16 BRA would receive Annual-product RCP in EMAAC = $167.46/MW-day.
Daily Auction Credit = 10 MW * $167.46/Mw-day = $1674.60/day
Annual Auction Credits = $1674.60/day * 366 days/year = $612,903.60/yr
PJM©2012 20www.pjm.com
Challenges & Risks
• Infancy of EE Resources in PJM
• Costs of M&V activities
• Credit Requirements
• Audit Costs
• Exposure to Deficiency Charges
• Expense of Replacement Capacity
• Market Rule Changes
PJM©2012 21www.pjm.com

Energy Efficiency in the
Forward Capacity Market (FCM)
DOE Better Buildings Neighborhood Program Webinar
November 15, 2012
Doug Hurley
www.synapse-energy.com | ©2012 Synapse Energy Economics Inc. All rights reserved.
Synapse Energy Economics, Inc.
Energy System modeling, analysis, expert testimony, and stakeholder representation
for…
•Consumer Advocates and Public Interest Groups
in more than 25 states
•More than 20 PUCs and Attorneys General
•Over 40 Environmental Groups and Foundations
•NEPOOL Representation for Consumer
Advocates, Energy Efficiency, Renewable
Generation, and Environmental Advocates www.synapse-energy.com | ©2012 Synapse Energy Economics Inc. All rights reserved. 23
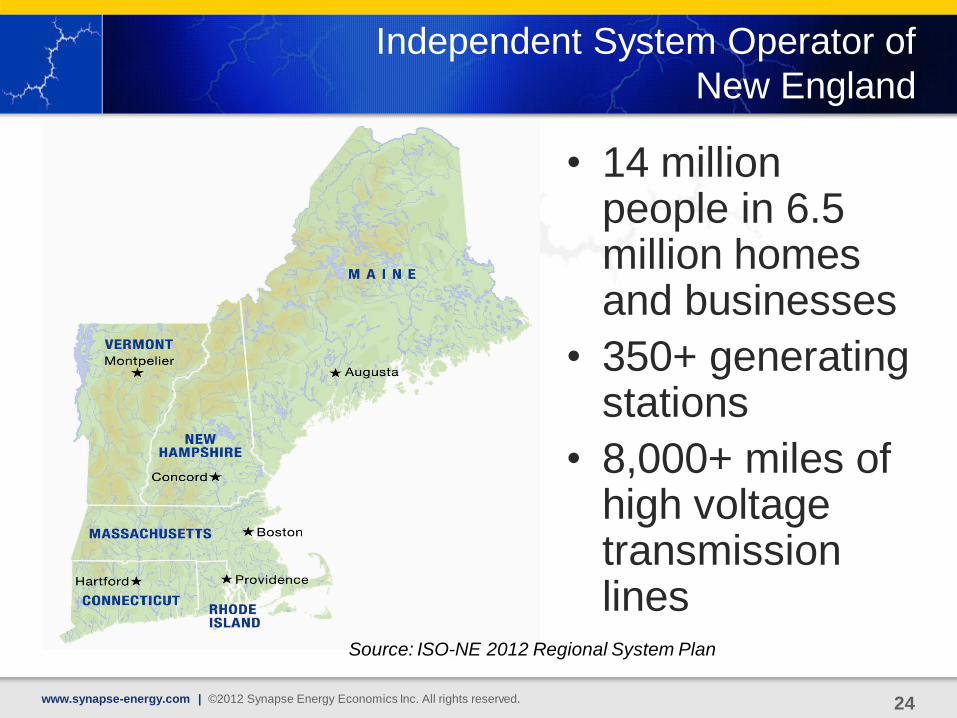
Independent System Operator of
New England
• 14 million people in 6.5 million homes and businesses
• 350+ generating stations
• 8,000+ miles of high voltage transmission lines
24
Source: ISO-NE 2012 Regional System Plan
www.synapse-energy.com | ©2012 Synapse Energy Economics Inc. All rights reserved.
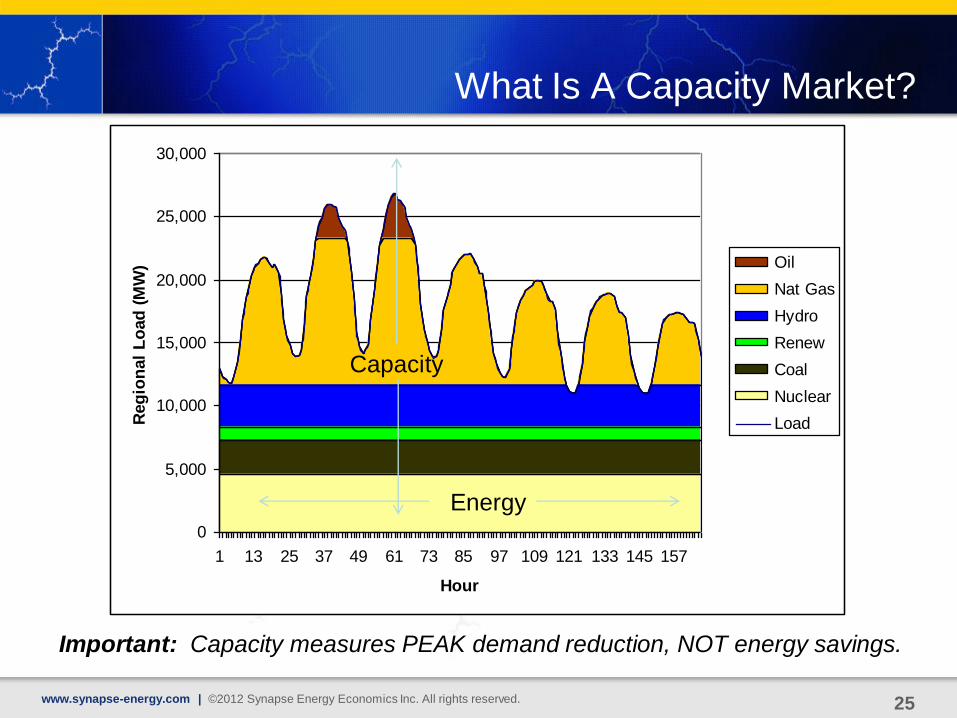
What Is A Capacity Market?
25
0
5,000
10,000
15,000
20,000
25,000
30,000
1 13 25 37 49 61 73 85 97 109 121 133 145 157
Hour
Reg
ion
al
Lo
ad
(M
W) Oil
Nat Gas
Hydro
Renew
Coal
Nuclear
Load
Important: Capacity measures PEAK demand reduction, NOT energy savings.
Energy
Capacity
www.synapse-energy.com | ©2012 Synapse Energy Economics Inc. All rights reserved.
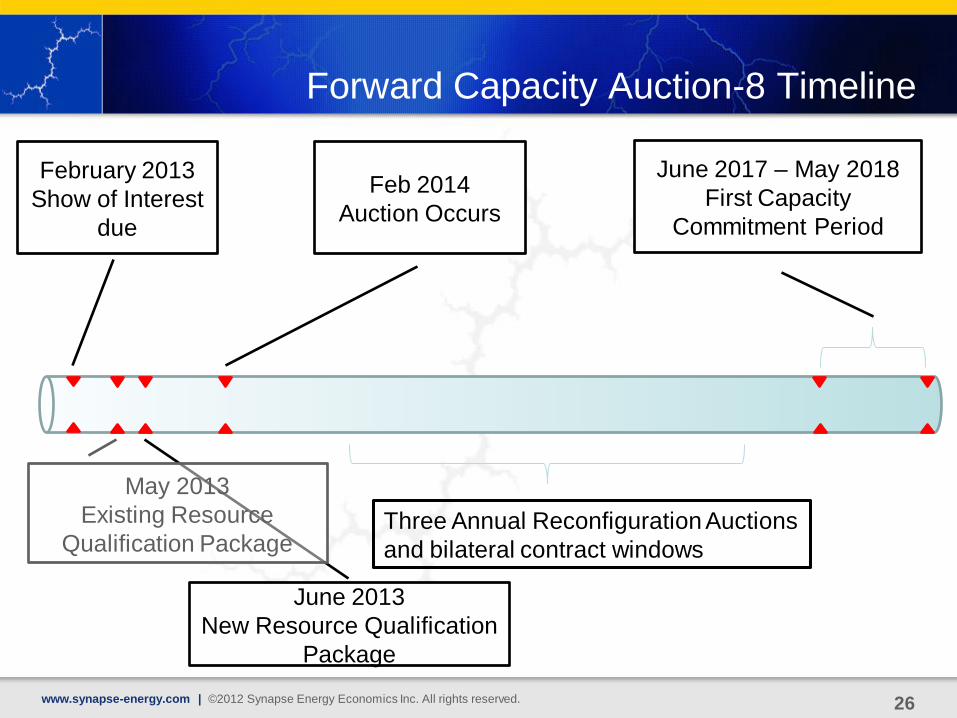
Forward Capacity Auction-8 Timeline
February 2013
Show of Interest
due
June 2013
New Resource Qualification
Package
Feb 2014
Auction Occurs
June 2017 – May 2018
First Capacity
Commitment Period
26www.synapse-energy.com | ©2012 Synapse Energy Economics Inc. All rights reserved.
Three Annual Reconfiguration Auctions
and bilateral contract windows
May 2013
Existing Resource
Qualification Package
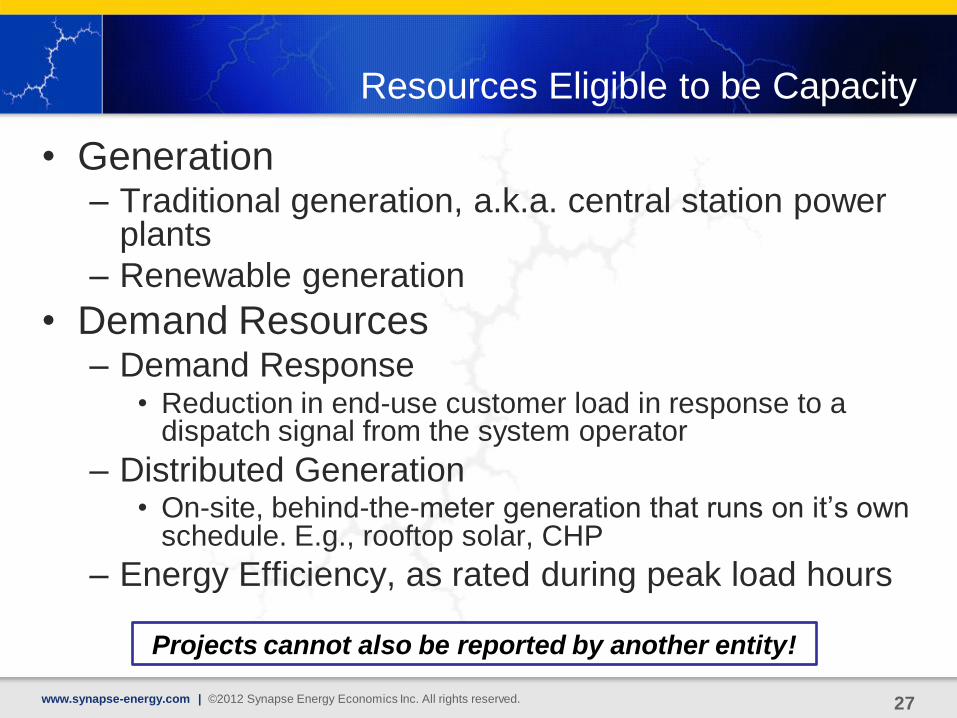
Resources Eligible to be Capacity
• Generation – Traditional generation, a.k.a. central station power
plants
– Renewable generation
• Demand Resources – Demand Response
• Reduction in end-use customer load in response to a dispatch signal from the system operator
– Distributed Generation • On-site, behind-the-meter generation that runs on it’s own
schedule. E.g., rooftop solar, CHP
– Energy Efficiency, as rated during peak load hours
27www.synapse-energy.com | ©2012 Synapse Energy Economics Inc. All rights reserved.
Projects cannot also be reported by another entity!
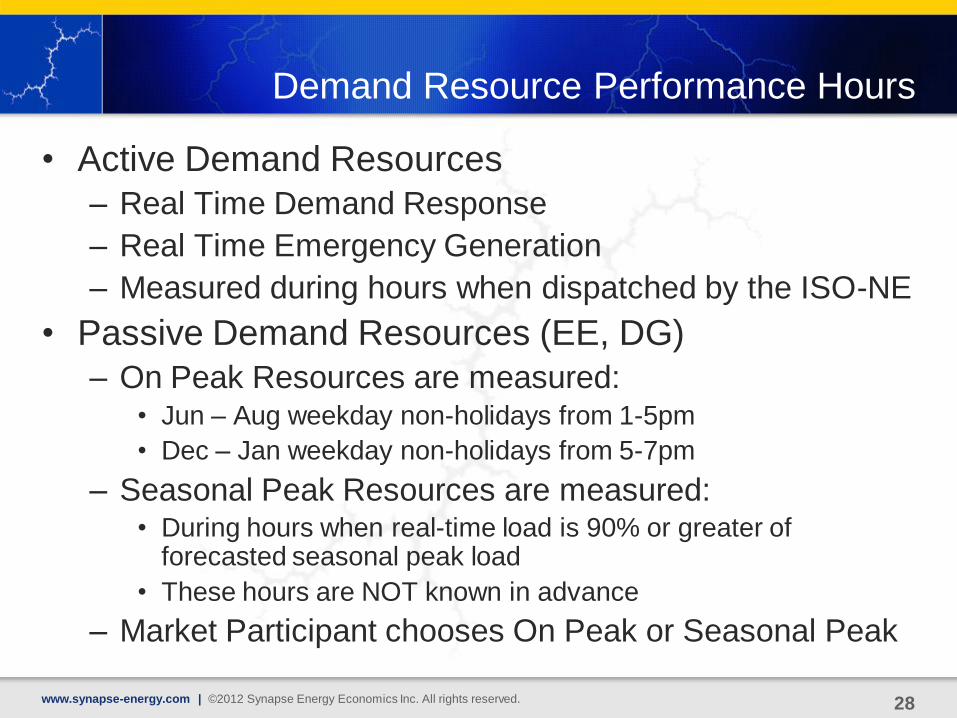
Demand Resource Performance Hours
• Active Demand Resources
–Real Time Demand Response
–Real Time Emergency Generation
–Measured during hours when dispatched by the ISO-NE
• Passive Demand Resources (EE, DG)
–On Peak Resources are measured: •Jun – Aug weekday non-holidays from 1-5pm
•Dec – Jan weekday non-holidays from 5-7pm
–Seasonal Peak Resources are measured: •During hours when real-time load is 90% or greater of
forecasted seasonal peak load
•These hours are NOT known in advance
– Market Participant chooses On Peak or Seasonal Peak
www.synapse-energy.com | ©2012 Synapse Energy Economics Inc. All rights reserved. 28
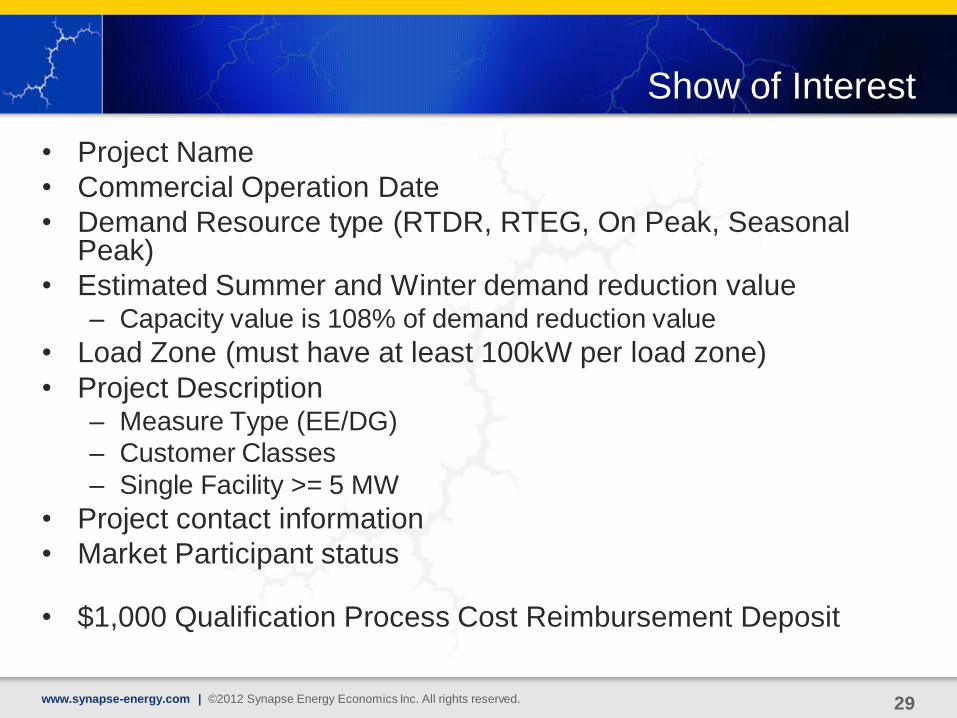
Show of Interest
• Project Name
• Commercial Operation Date
• Demand Resource type (RTDR, RTEG, On Peak, Seasonal Peak)
• Estimated Summer and Winter demand reduction value –Capacity value is 108% of demand reduction value
• Load Zone (must have at least 100kW per load zone)
• Project Description –Measure Type (EE/DG)
–Customer Classes
–Single Facility >= 5 MW
• Project contact information
• Market Participant status
• $1,000 Qualification Process Cost Reimbursement Deposit
www.synapse-energy.com | ©2012 Synapse Energy Economics Inc. All rights reserved. 29
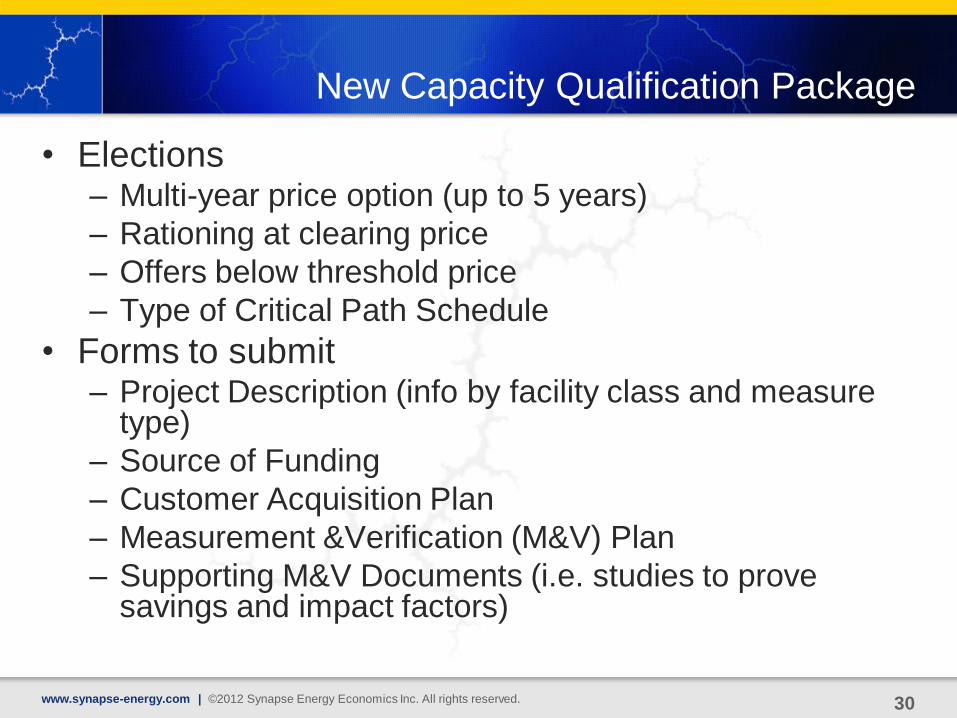
New Capacity Qualification Package
• Elections – Multi-year price option (up to 5 years)
– Rationing at clearing price
– Offers below threshold price
– Type of Critical Path Schedule
• Forms to submit – Project Description (info by facility class and measure
type)
– Source of Funding
– Customer Acquisition Plan
– Measurement &Verification (M&V) Plan
– Supporting M&V Documents (i.e. studies to prove savings and impact factors)
www.synapse-energy.com | ©2012 Synapse Energy Economics Inc. All rights reserved. 30
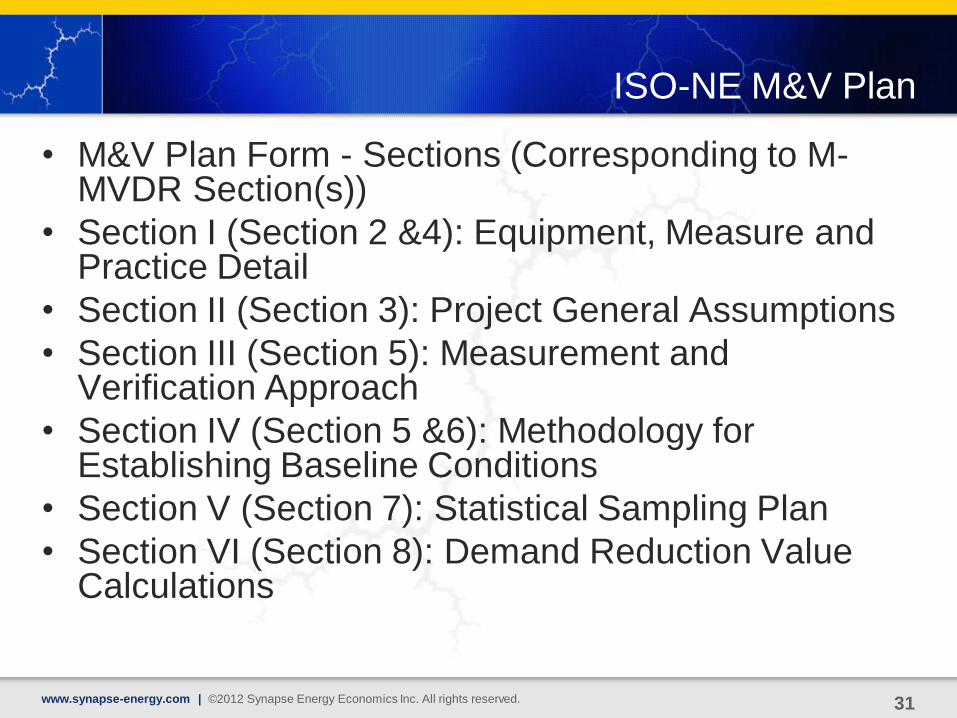
ISO-NE M&V Plan
• M&V Plan Form - Sections (Corresponding to M-MVDR Section(s))
• Section I (Section 2 &4): Equipment, Measure and Practice Detail
• Section II (Section 3): Project General Assumptions • Section III (Section 5): Measurement and
Verification Approach
• Section IV (Section 5 &6): Methodology for Establishing Baseline Conditions
• Section V (Section 7): Statistical Sampling Plan
• Section VI (Section 8): Demand Reduction Value Calculations
www.synapse-energy.com | ©2012 Synapse Energy Economics Inc. All rights reserved. 31
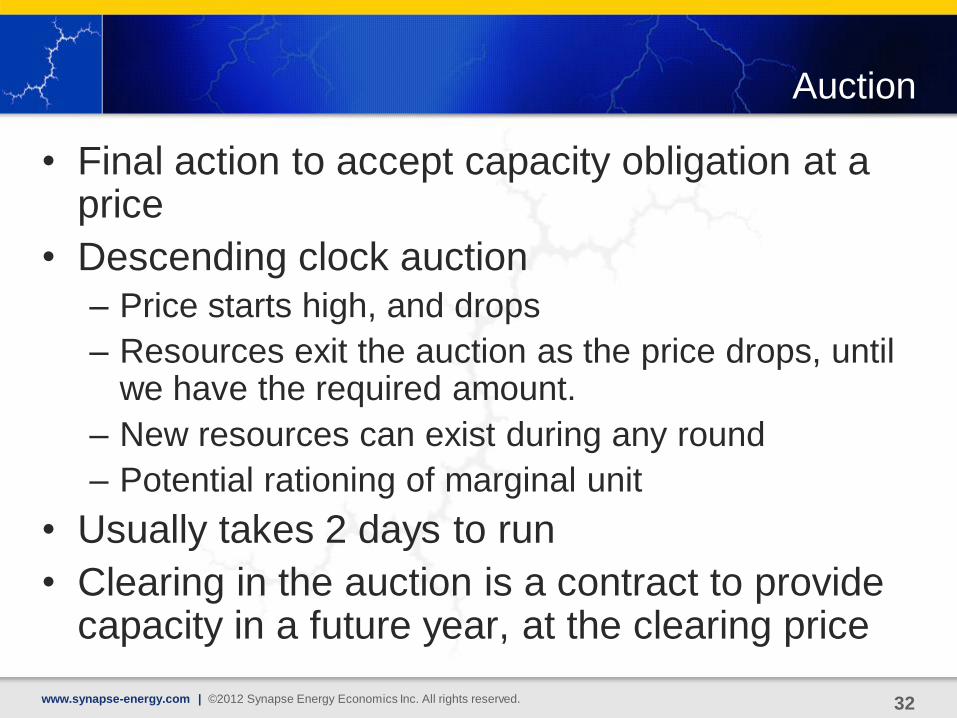
Auction
•Final action to accept capacity obligation at a price
•Descending clock auction
–Price starts high, and drops
– Resources exit the auction as the price drops, until we have the required amount.
–New resources can exist during any round
–Potential rationing of marginal unit
•Usually takes 2 days to run
• Clearing in the auction is a contract to provide capacity in a future year, at the clearing price
www.synapse-energy.com | ©2012 Synapse Energy Economics Inc. All rights reserved. 32
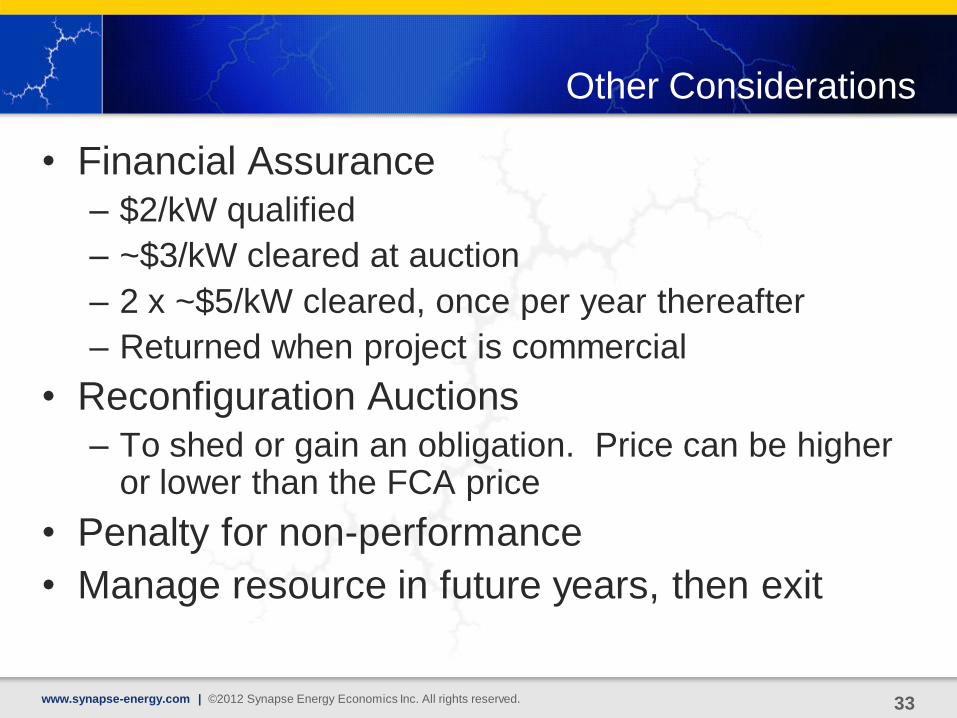
Other Considerations
• Financial Assurance
– $2/kW qualified
– ~$3/kW cleared at auction
– 2 x ~$5/kW cleared, once per year thereafter
– Returned when project is commercial
• Reconfiguration Auctions
– To shed or gain an obligation. Price can be higher or lower than the FCA price
• Penalty for non-performance
• Manage resource in future years, then exit
www.synapse-energy.com | ©2012 Synapse Energy Economics Inc. All rights reserved. 33
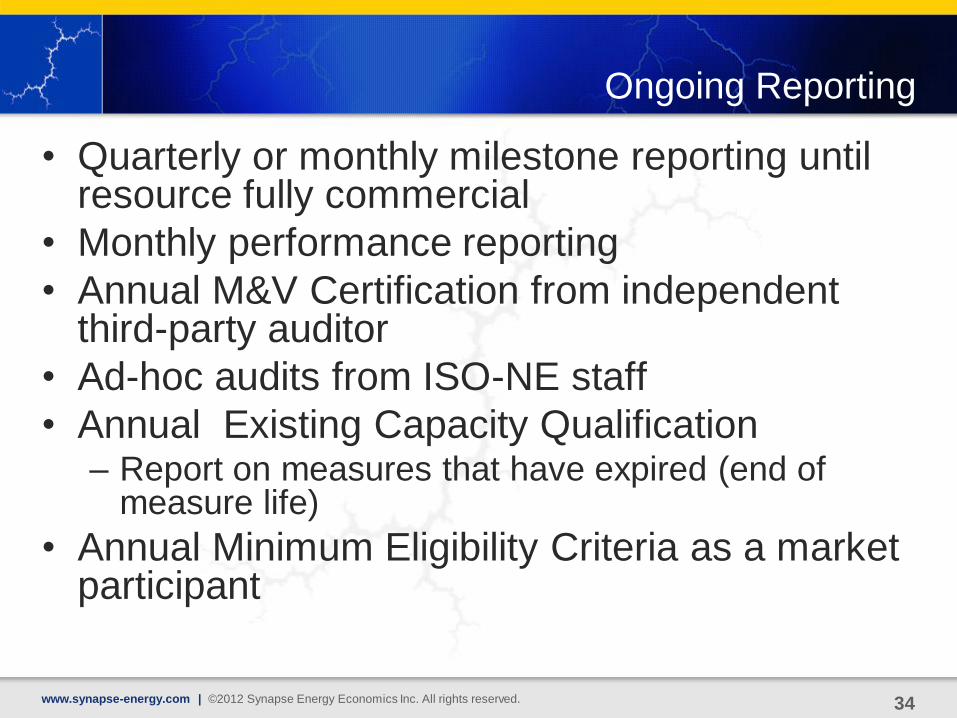
Ongoing Reporting
•Quarterly or monthly milestone reporting until resource fully commercial
•Monthly performance reporting
•Annual M&V Certification from independent third-party auditor
•Ad-hoc audits from ISO-NE staff
•Annual Existing Capacity Qualification – Report on measures that have expired (end of
measure life)
•Annual Minimum Eligibility Criteria as a market participant
www.synapse-energy.com | ©2012 Synapse Energy Economics Inc. All rights reserved. 34
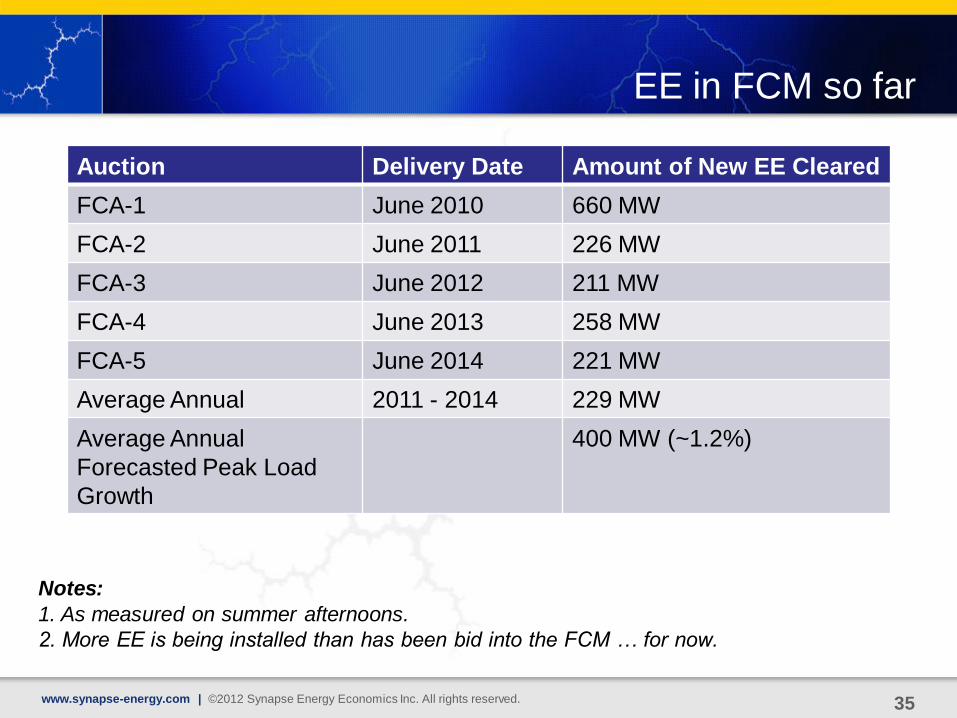
EE in FCM so far
Auction Delivery Date Amount of New EE Cleared
FCA-1 June 2010 660 MW
FCA-2 June 2011 226 MW
FCA-3 June 2012 211 MW
FCA-4 June 2013 258 MW
FCA-5 June 2014 221 MW
Average Annual 2011 - 2014 229 MW
Average Annual
Forecasted Peak Load
Growth
400 MW (~1.2%)
Notes:
1. As measured on summer afternoons.
2. More EE is being installed than has been bid into the FCM … for now.
www.synapse-energy.com | ©2012 Synapse Energy Economics Inc. All rights reserved. 35
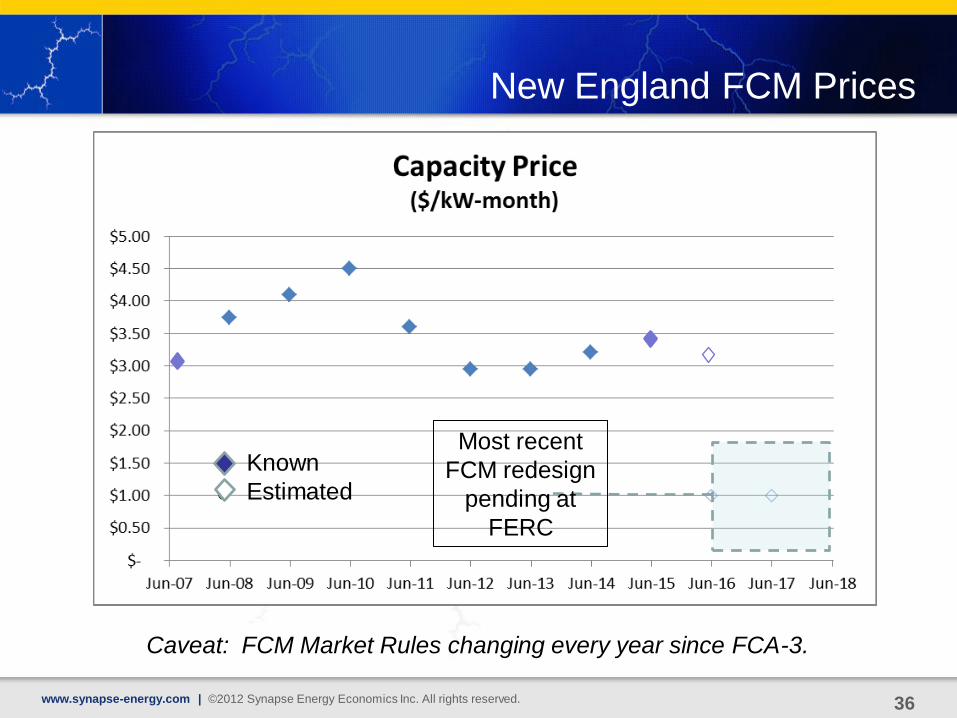
New England FCM Prices
Most recent
FCM redesign
pending at
FERC
o Known
o Estimated
36www.synapse-energy.com | ©2012 Synapse Energy Economics Inc. All rights reserved.
Caveat: FCM Market Rules changing every year since FCA-3.
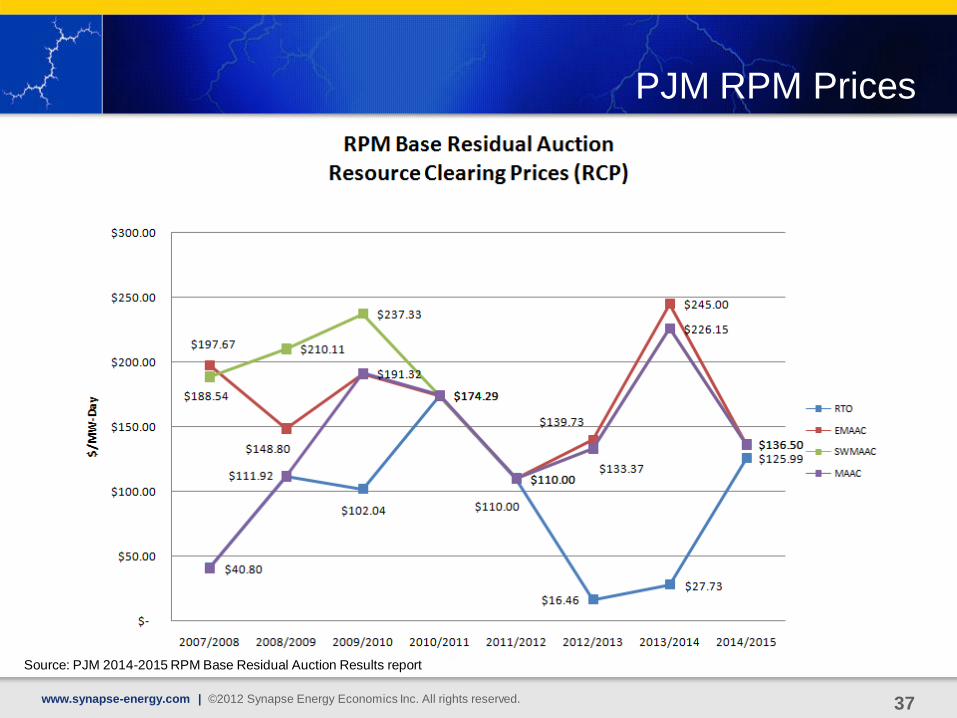
PJM RPM Prices
Source: PJM 2014-2015 RPM Base Residual Auction Results report
www.synapse-energy.com | ©2012 Synapse Energy Economics Inc. All rights reserved. 37
Takeaways
• Think like a Market Participant
– Financial risk, potential rewards, ongoing
process, price fluctuation
– Must plan 4+ years in advance
– Annual costs to report and manage resource
• More stringent and different M&V
– Exact MW, not benefits of MWh
– Statistical accuracy of sampling
– Annual certification
• Changing market rules www.synapse-energy.com | ©2012 Synapse Energy Economics Inc. All rights reserved. 38

Contact Info
www.synapse-energy.com
Doug Hurley
www.synapse-energy.com | ©2012 Synapse Energy Economics Inc. All rights reserved. 39