Embed Size (px)
Citation preview

c©NOTICE: this is the author’s version of a work that was accepted for publication in Computer Networks. Changes resulting from the publishing process,such as peer review, editing, corrections, structural formatting, and other quality control mechanisms may not be reflected in this document. Changes mayhave been made to this work since it was submitted for publication. A definitive version was subsequently published in COMPUTER NETWORKS (2014,In Press) http://dx.doi.org/10.1016/j.comnet.2014.10.037
Energy efficiency analysis of high speed triple-play services in next-generation PONdeployments
S. Lamberta,∗, B. Lannooa, A. Dixita, D. Collea, M. Pickaveta, J. Montalvob, J.A. Torrijosb, P. Vetterc
aGhent University-iMinds, Department of Information Technology, Ghent, BelgiumbTelefonica I+D, Access Network Evolution, Madrid, Spain
cAlcatel-Lucent Bell Labs, Fixed Networks, Murray Hill, NJ, US
Abstract
In this paper, the energy consumption of high speed access services up to 1 Gb/s per customer is estimated for different passiveoptical network (PON) technologies. While other studies on PON power consumption typically assume a fixed split ratio, we alsoconsider a greenfield approach, where the split ratio can be optimized for each technology, taking full advantage of its capacity andreach. The split ratio optimization takes into account Quality of Service (QoS) in terms of bandwidth availability and packet lossfor triple-play services (voice, television and Internet). This paper includes an in-depth discussion of our split ratio dimensioningapproach and our power consumption model for an optical access network in a major city. The obtained results show that statisticalgain provided by dynamic bandwidth allocation as well as power splitting ratio optimization in PONs are key factors for achievingenergy efficiency. For access rates up to 900 Mb/s, XG-PON1 turns out to be the most energy efficient option. For higher accessrates up to 1 Gb/s, the optimal technology depends on split ratio restrictions. If an existing optical distribution network (ODN) withsplit ratio 1:64 is used, XG-PON1 remains the most energy efficient technology. If higher split ratios up to 1:256 can be achieved,TWDM PON becomes the most energy efficient solution for access rates up to 1 Gb/s.
Keywords: energy efficiency, next-generation passive optical network, dynamic bandwidth allocation, network planning, highspeed access
1. Introduction
Fiber-based passive optical networks (PONs) are currentlybeing deployed by operators in several countries, offering muchhigher bandwidths than traditional copper-based access net-works. Deployments of 2.5 Gb/s capable PONs (Gigabit-capable PON or GPON) are currently the most common, while10 Gb/s capable PONs (next-generation PON or NG-PON) areexpected in the next couple of years. In the long term, increas-ing bandwidth demands associated with mobile backhauling,low-latency cloud services and the convergence of residentialand business access will necessitate the deployment of evenfaster next-generation PONs beyond 10 Gb/s, referred to as NG-PON2s by the Telecommunication Standardization Sector ofthe International Telecommunication Union (ITU-T) and FullService Access Network (FSAN) Group [1].
At the same time, there is a growing interest in reducing theenergy consumption and the associated cost of the access net-work. Due to rising energy prices and the growing awarenessof climate change, energy efficiency is becoming an importantfactor when analyzing the operational expenditures and carbonfootprint of communication networks such as NG-PON(2) sys-tems.
∗Corresponding author. Tel.:+32 933 14977.Email addresses: [email protected] (S. Lambert),
[email protected] (J. Montalvo), [email protected](P. Vetter)
Estimations of energy consumption of NG-PON(2) technolo-gies have already been reported, providing the total energy con-sumption per customer considering both network operator andcustomer premises contributions [2, 3]. Some proposals haverecently shown the potential for reduction of the energy con-sumption in customer premises equipment (CPE), for exampleusing a bit-interleaving protocol at the optical networking unit(ONU) in time-division multiplexing PONs [4] or a network-enhanced residential gateway approach [5]. Regarding the en-ergy consumption associated with the network operator, energyefficiency scenarios for long-reach GPON technologies with anoptimized number of central offices (COs), have been reportedin [6].
Nevertheless, previous works have paid little attention to theprovided services, the statistical gain of dynamic bandwidth al-location and the quality of service (QoS) achieved by each PONtechnology, and only considered the maximum speed capacitiesof both optical line terminal (OLT) and ONU. The contributionof this work is a network dimensioning approach that can beadapted to the specific qualities of various PON technologies.The split ratio (number of homes passed by fiber from a singleOLT PON interface) is optimized to use the PON capacity ofeach technology as effectively as possible, taking into accountuser demands. Moreover, we model the optimal deployment ofCOs in a major city, taking into account technology-dependentreach constraints, as the geographic spread of the locationsmay impact the filling ratio of OLT racks. Our user demand
Preprint submitted to Computer Networks September 2014

model considers triple-play services, consisting of (1) fixedvoice, (2) high definition Internet protocol television (IPTV),and (3) best-effort Internet and over the top (OTT) media ac-cess with up to 1 Gb/s download speed per customer. Themodel presented in this paper builds on our earlier work [7, 8];the main differences are the inclusion of IPTV services, gen-eral OLT functions now include packet processing and trafficmanagement, updated estimates for OLT and ONU power con-sumption and an in-depth sensitivity analysis.
Concretely, the energy efficiency analysis is implemented asfollows (Fig. 1). We start by choosing a number of interestingcases to study. Each case consists of a specific user demand (ac-cess speed, number of subscribers,...), deployment strategy (oneof two options: fixed or optimized split ratio) and PON techno-logy (one of seven options introduced in Section 3). Next, athree-stage power consumption analysis is performed for eachcase. In the first stage, the PON is dimensioned, based on thetechnology-dependent reach and capacity, user demands andQoS requirements. The PON dimensioning approach is de-scribed in Section 4. It produces the requirements for uplinkand general OLT functions (switching, packet processing, traf-fic management), which are used further on for the power con-sumption calculation. It also produces the split ratio, which isused as an input for the second stage: the city deployment al-gorithm, which is covered in Section 5. The algorithm containsa model of the geographical distribution of homes in a majorEuropean city, and calculates how much equipment needs tobe installed, given the takerate (i.e., the number of fiber sub-scriptions divided by the number of homes passed by fiber), thetechnology-dependent reach and the split ratio (depending onthe case under study). This stage returns the equipment count(number of ports, racks,...), which is an input for the third andlast stage: the power consumption calculation. The power con-sumption calculation is introduced first in this paper, in Section2, because it provides a good overview of the access networkand its components, and it drives the calculations in the previ-ous stages.
Section 6 presents the results for a number of selected casesand compares the energy efficiency of the various PON tech-nologies. Section 7 contains a sensitivity analysis, to deter-mine which parameters are most critical to the energy efficiencymodel. Finally, a summary of the results and the conclusions ofthe work are reported in Section 8.
2. Power consumption model for the access network
Figure 2 gives a schematic overview of the considered opticalaccess network. It comprises the optical network unit (ONU) atthe customer premises, the optical line terminal (OLT) and up-link to the aggregation network at the network operator’s COand the fibers and splitters between them (optical distributionnetwork or ODN). Since we evaluate passive optical networksin this paper, no active equipment is needed in the ODN. More-over, only technologies over an ODN with optical power split-ters will be considered (no wavelength-selective components),thus ensuring full coexistence between several PON genera-tions using the same passive technology, without the need for
modifying or replacing the already existing components in theoutside plant.
Our power consumption model is mostly based on modelsand values that are (were) available within the projects Green-Touch and Trend, combined with values reported by Skubic etal. in [2].
2.1. Power per userWe consider a deployment in a city where H homes are sub-
scribing to the PON. The total power consumption of the city-wide access network is the sum of the consumption of all ONUsand all OLTs, PONUs and POLT s respectively. To obtain thepower per user, we simply divide the total power by the numberof subscribers.
Total power [W/user] =PONUs + POLT s
H(1)
2.2. City-wide power consumption by ONUsBecause we consider a fiber to the home (FTTH) scenario,
each subscribing home has its dedicated ONU. All ONUs havea common baseline power dissipation Pbaseline of 3.65 W. Thisbaseline power consists of contributions from the embeddedprocessor, gigabit Ethernet interface, dual subscriber line inter-face circuit (SLIC), memory, and other miscellaneous compo-nents [2]. The technology-dependent ONU transceiver powerPONU,tech (see Table 1) is added to this baseline, and the totalis multiplied by a factor 1.25 to account for AC/DC (Alternat-ing Current/Direct Current) rectifier and DC/DC (Direct Cur-rent/Direct Current) voltage conversion efficiencies (ηAC/DC =
ηDC/DC = 90%).
PONUs = H ×(Pbaseline + PONU,tech
)×
1ηAC/DC
×1
ηDC/DC(2)
2.3. City-wide power consumption by OLTsOn the OLT side, the power consumption is the sum of
the contributions from OLT PON ports, general OLT functions(switching, packet processing and traffic management), and theuplinks to the aggregation network. On top of a factor 1.11for DC/DC conversion inefficiency, we multiply by a site fac-tor 1.6 at the CO to account for auxiliary equipment such asAC/DC rectifiers (ηAC/DC = 90%), ventilation and air condi-tioning, auxiliary power units and batteries [2].
POLT s =[Pports + Pgen. f unc. + Puplinks
]×
1ηDC/DC
× CO site factor
(3)
The power consumption of the OLT PON ports istechnology-dependent and consists of a power per PON portPport,tech and, for some technologies, an added power per userPuser,tech (see Table 1). The power per port is multiplied by thenumber of ports in the city-wide deployment (obtained in Sec-tion 5), and the power per user is multiplied by the number ofsubscribers.
Pports = #ports × Pport,tech + H × Puser,tech (4)
2

Puplink , COLT , LOLT .
Cases defined by PON technology
(Section III),user demand and
fixed / optimized split(Section IV) PON dimensioning to satisfy
Quality of Service defined
by pavail,min and Ploss, max
(Section IV)
City deployment algorithm (Section V)
Split ratio
Power consumption calculation (Section II)
H, #ports, #racks
Results power per user for
various cases (Section VI)
sensitivity analysis (Section VII)
Pport,tech , Puser,tech , PONU,tech (Table 1)
Technology properties (Table 1),takerate
Technology properties(Table 1),
user demand
Figure 1: Overview of methodology and paper contents (symbols introduced in Section 2).
3
OLT shelf
OLT shelf
OLT shelf
Passive power splitters
Split ratio 1:S
…
OLT PON
ports
OLT shelf
…
OLT rack
OLT Uplink
General OLT functions: L2 switching, packet
processing and traffic management Customer premises Central Office (CO)
Home
network
Optical Distribution
Network (ODN)
ONU
Aggregation
network
…
… F1 F2 F3
S homes passed by fiber
from one OLT PON port
Figure 2: Schematic overview of the access network and its power consumption components. F1, F2, F3 = optical fiber sections.
3

The city-wide power consumption of the general OLT func-tions and uplinks is obtained by multiplying the total number ofracks in the city (obtained in the city deployment model, Sec-tion 5) by the power per rack, which depends on the capacityand traffic load per rack. The average traffic load LOLT and therequired capacity COLT (Gb/s) are dimensioned for a single rackin Section 4.3.
For the general OLT functions, a unidirectional power of1 W/Gb/s is assumed, consisting of 0.5 W/Gb/s for Layer 2switching [9] and 0.5 W/Gb/s for packet processing and trafficmanagement. 30% of this power scales with the required capac-ity, the other 70% scales with the actual traffic load (for details,see Section 4.3.2).
Pgen. f unc. = #racks × (0.3 ×COLT + 0.7 × LOLT ) × 1 W/Gb/s(5)
The uplink of a rack is formed by a combination of Ethernetports (with corresponding power consumption values given inSection 4.3.1), dimensioned such that for a given user traffic,the packet loss in the uplink remains acceptable.
Puplinks = #racks × Puplink = #racks ×∑
PEthernet port,i (6)
In the following section, we will take a closer look at thePON technologies and their specific parameters. Further onwe will discuss the PON dimensioning approach that producesthe split ratio and OLT requirements, and the city deploymentmodel that produces the equipment inventory.
3. Overview of the considered PON technologies
In this section, we start by giving a brief description of theseven technologies included in our power consumption compar-ison. Next, we expand on the technology-specific physical limi-tations (optical budget and bandwidth) and power consumptionvalues.
3.1. Technologies considered in this paper
The commercially available Gigabit PON (GPON) systemwith B+ optics is used as reference technology in this work.Next-generation PON technologies are considered, including10 Gb/s PON (XG-PON1 E2 class) as well as several can-didates of the second generation systems (NG-PON2) with atleast 40 Gb/s capacity per PON. The technological frameworkof NG-PON2 systems has been described by the FSAN (FullServices Access Network) group [1]. In this paper, we focus onthe following NG-PON2 technologies:
• 40Gbit/s capable (XLG) PON, which consists of a time di-vision multiplexed (TDM) PON using a single wavelengthin downstream (DS) with 40 Gb/s line rate and a singlewavelength in upstream (US) for all ONUs with 10 Gb/sline rate. O-band DS transmission is assumed to avoiddispersion compensation. We consider two varieties ofthis technology, with different protocols for DS transmis-sion. XLG:GEM uses the GPON Encapsulation Method
(GEM) to package user traffic. The payload is groupedinto frames, which are filtered at the ONU based upon theGEM header. This requires electronic processing of theincoming traffic bursts in the ONU at 40 Gb/s. XLG:BIuses an alternative bit-interleaving protocol to transmit DStraffic. By interleaving the bits for different ONUs, theelectronic processing speed of the ONU receiver can be re-duced, resulting in a lower ONU energy consumption [10].
• Time-shared Wavelength Division Multiplexing (TWDM)PON consists of four overlaid TDM-PONs in a singlephysical ODN, using different wavelengths both in DS andUS directions, each TDM-PON with a 10 Gb/s line rate inDS and 2.5 Gb/s in US. Tunable ONU transmitters and re-ceivers are assumed, to distribute the subscribers evenlyamong the four wavelengths (in this work, tunability is notused for dynamic bandwidth allocation in response to vari-ations in user activity).
• Orthogonal Frequency Division Multiplexing (OFDM)PON, where multiple orthogonal electrical carriers aremultiplexed. The ONU can flexibly filter and down-convert a band of Ns subcarriers in the analogue domain1,so that subsequent digital signal processing (DSP) and me-dia access control (MAC) functions can be performed at alower rate.
• Coherent Ultra Dense WDM-PON (Co UDWDM), con-sisting of a logical point-to-point dense WDM-PON sys-tem with tunable ONUs and coherent detection [11],which achieves the highest optical power budget. Thoughsystems supporting over a thousand wavelengths in thesame PON have been reported, a maximum of 256 wave-lengths is considered in this paper. In any case, the impacton the power/user of adding more wavelengths would belimited, since the main contribution to the OLT power forCo UDWDM comes from the added power per user (cf.Section 3.3).
FSAN selected TWDM-PON as the main technology for NG-PON2, with an expected practical availability by 2015-2016.The other next-generation technologies that we consider in thispaper should be considered for future evolution beyond NG-PON2.
3.2. System parameters
Table 1 shows the aggregated bandwidth capacity per PONinterface in DS and US directions, the number of PON ports perOLT rack, the maximum optical power budget, and attenuationfor each PON technology. In order to calculate the maximumreach for each technology, 0.6 dB/km propagation losses areassumed for the O band and 0.4 dB/km for the C and L bands,comprising the typical average losses of splices and other penal-ties in the fiber outside plant.
1One orthogonal subcarrier for each of the Ns subscribers in the PON.
4

Table 1: Technology-dependent system and power consumption parameters.
PON technology DS capacity(Gb/s)a
US capacity(Gb/s)a
PON portsper rack
Max.opticalbudget(dB)
Attenua-tion α
(dB/km)
Power per OLTPON port (W)a,b
Pport,tech +
Puser,tech × Ns
Power perONU (W)b
GPON B+ 2.5 1.25 256 28.0 0.6 3.0 2.6
XG-PON1 10 2.5 128 35.0 0.6 22.8 4.5
XLG:GEM 40 10 64 31.0 0.6 36.1 6.1
XLG:BI 40 10 64 31.0 0.6 36.1 4.6
TWDM 4 × 10 4 × 2.5 64 35.0 0.4 54.8 5.0
OFDM 40 10 64 34.5 0.6 42.8 + 0.7 × Ns 9.3
Co UDWDM 1.25 × Ns 1.25 × Ns 64 43.0 0.4 9.3 + 3.5 × Ns 5.7
a Ns = number of subscribers per OLT PON port. Ns scales with the split ratio and takerate.b Power consumption values are system-specific contributions, excluding common baseline for ONUs and not yet taking into
account conversion inefficiencies and site factor.
3.3. Power consumption parametersEstimates of the power consumption for system-specific
electro-optical components per OLT PON port (consisting ofa per-PON and an optional per-user component) and per ONU,are reported for each technology in the last two columns of Ta-ble 1. The power values reflect how much a practical ASICimplementation of the PON system would consume if it weremade today. Future improvements in electronic and opticaldesign will likely result in reduced power consumption, butthese overall improvements will not impact the comparison be-tween technologies. For NG-PON2 technologies, which are notyet commercially available, the power consumption values arebest-effort estimates based on internal data and values from lit-erature [12, 13, 2]. The impact of uncertainty in these estimatesis discussed in the sensitivity analysis (Section 7).
The power consumption per OLT PON port increases as thePON bandwidth increases. For OFDM and Co UDWDM PONtechnologies, a variable part of the OLT port power consump-tion scales with the number of users, considering the addi-tional power contribution of digital processing and transceivergroups required when more users are connected to the PON.2
Except for GPON systems, amplified solutions have been con-sidered for long reach capabilities. An SOA (semiconductoroptical amplifier) for both DS and US direction is included inthe OLT numbers for XG, TWDM, OFDM and Co UDWDMPON. For XLG-PON, we consider DS amplification by meansof an SOA, and electronic dispersion compensation for the USsignal (XLG:GEM and XLG:BI use identical equipment on theOLT side).
Significant differences can be observed for the power con-sumption of the ONU. The technology-specific component typ-ically increases proportionately with the line rate. However, theONU of a XLG:BI PON can consume about the same power
2For Co UDWDM, we assume a pay-as-you-grow concept, where the net-work operator installs additional capacity as needed.
as XG-PON1, despite a four times higher line rate, by usingan energy efficient bit-interleaving protocol in the DS direc-tion [10]. The TWDM PON ONU consumes slightly morepower than XG-PON1 because it is based on the same stan-dard MAC protocol and offers the same line rate, but consumesadditional power for the tuning of the laser and receive filter.OFDM PON is highly inefficient due to the need for DSP andoptical amplification to meet the stringent signal to noise ratioacross a standard ODN. Even though we assumed the possibil-ity to select a subset of carriers and as such reduce the powerconsumption of the DSP and MAC processing, the ONU powerconsumption remains high. The optical front-end of the ONUin a coherent UDWDM PON consumes more power due to thecoherent receiver requiring two balanced receiver pairs and theoptical field modulator for US transmission. On the other hand,the protocol processing is simplified to a 1 Gb/s Ethernet func-tionality, which consumes less power than in an XLG PON orTWDM PON. The total power of a Co UDWDM ONU is thusonly slightly higher than that of an XLG PON or TWDM PONONU.
4. PON dimensioning based on user demand
In this section, we explain how the PON is dimensionedbased on a statistical analysis of the aggregated user demands.This statistical analysis takes into account the potential for dy-namic bandwidth allocation. The extent to which bandwidthcan be shared among users, depends on the chosen PON tech-nology. Therefore, we introduce the concept of a virtual PON,in which bandwidth can be divided arbitrarily between the ac-tive users. For GPON, XG-PON, XLG:GEM, XLG:BI andOFDM PON, the virtual PON corresponds to the physical PON.In the case of TWDM PON, each physical PON consists of fourvirtual PONs on separate wavelengths. In a Co UDWDM PON,users have their own dedicated wavelength channel, resulting inas many virtual PONs as there are users, so there is no dynamic
5

bandwidth allocation between users in this case. We considerline rates for the definition of the access speed per subscriber,assuming a similar level of overhead for all PON technologies.
When dimensioning the PON, there are three types of userdemands we considered: voice traffic, multicast IPTV trafficand best-effort Internet traffic (including OTT Internet video).The dimensioning for IPTV multicast demands and the statis-tical flow analysis for best-effort Internet traffic will be per-formed per virtual PON. In our traffic analysis, we only modelDS bandwidth, assuming US traffic is less than or equal to 25%of DS traffic.
4.1. User demand model for triple play services
Voice traffic is the highest priority traffic in case of conges-tion, so the consumed bandwidth by voice should be subtractedfrom the total bandwidth available for best-effort Internet andIPTV services. The speed rate of VoIP codecs ranges from22 Kb/s to 113 Kb/s [14], which is less than 0.1% of the to-tal access bandwidth values considered in this work, and theaverage minutes of use per user of fixed voice is 10 minutesper day [15], thus the contribution of voice to the traffic load isnegligible and has not been included in the simulations. Nev-ertheless, in real implementations, this VoIP traffic will need tohave the highest priority.
Multicast IPTV traffic also has priority over best-effort In-ternet traffic. Note that we focus on IPTV in the context oftraditional broadcast live TV, as opposed to Video on Demand,which is considered part of the (OTT) best-effort Internet traf-fic. To estimate the number of channels being watched, we baseourselves on IPTV channel popularities from measured weeklyviewing times for a commercial IPTV service in the UnitedKingdom. We assume HD channels with MPEG4 encoding(12 Mb/s per channel). All IPTV channels (127 in total) arebroadcast from the aggregation network to the OLTs throughthe uplinks, but only the channels that are being watched byusers within a (virtual) PON are forwarded via multicast withinthat PON. To guarantee IPTV transmission, we estimate thebandwidth that is required for multicast within a virtual PONduring primetime, and reserve it, making it unavailable for best-effort Internet services. We assume 25% of Internet subscribershave an IPTV subscription, and each TV subscriber has 1.85TVs on average3, of which 60% are switched on during prime-time. We use a Monte Carlo approach to assess the number ofTV channels that need to be distributed per virtual PON, simi-lar to the approach used by van Veen et al. in [17]; we howeveruse the measured channel popularities, whereas van Veen et al.modeled channel popularity with a Zipf function. We reserveenough bandwidth in each PON to ensure IPTV multicast isuninterrupted 99.9% of the time4. In our results, IPTV multi-cast bandwidth per PON is always below 15% of the total PONbandwidth.
340% of TV subscribers have one TV set, 35% have two, and 25% havethree [16].
4We assume the operator does not allow fast channel surfing (mean timebetween channel changes < 4 seconds) as this would result in a much higherload during commercial breaks, up to twice the steady state level [18].
The bulk of the traffic is best-effort Internet traffic. In ourInternet service model, a maximum target bandwidth, namelyBtarget, is offered to each customer with a minimum percent-age of time of availability, namely pavail,min. We adopt the userbehavior model from Segarra et al. [19], where each user hasthe same probability pact to be active and users are indepen-dent.5 In our simulations, pact is fixed at 10% [20]. We extendthe model from Segarra et al. by assuming that users request afixed target bandwidth Btarget when they are active. Fastest av-erage connections offered by operators already reached 1 Gb/sin 2012 [21], thus we consider three possible regular accessspeeds for the majority of users in future broadband scenarios:Btarget = 100 Mb/s, 600 Mb/s and 1 Gb/s.
The service models for IPTV and best-effort Internet de-scribed above, will be used in the next subsections for the splitratio and OLT dimensioning.
4.2. Split ratio dimensioning
Two different deployment strategies are used in this work tocompare the seven PON technologies. The first is a fixed splitratio strategy, in which an existing GPON deployment withsplit ratio 1:64 is re-used by upgrading the ONUs and OLTs,without any changes in the ODN. For each technology, we cal-culate pavail using the method described in subsection 4.2.2below, to check if the QoS requirement is satisfied. The secondstrategy assumes a fully flexible deployment, in which an op-timized split ratio is chosen. We determine the maximal splitratio at which pavail,min can be guaranteed. Note that this opti-mized split ratio may be higher or lower than the legacy valueof 1:64, depending on takerate, user demand, offered bandwidthand PON technology. There is a trade-off between availability(QoS) and power consumption: increasing the split ratio re-duces availability, but it also reduces power consumption as theOLT equipment is shared by more users. We assume a maxi-mum split ratio 1:256, with additional restrictions imposed bythe technology-dependent reach.
4.2.1. Reach restrictionsThe reach of a technology for a given physical split ratio 1:S
is
dmax =
(max. optical budget − Lm − Lc − 3.5 × log2S
)α
(7)
where Lm is a 3 dB margin for fiber patching (based on practicalexperience) and Lc is a 1 dB penalty for a coexistence elementin the COs, used for compatibility with existing GPON deploy-ments (based on ITU-T Rec. G.984.5 Amd. 1). Note that Lc
is zero when calculating the reach for GPON. Splitter lossesscale with the chosen split ratio: the signal incurs a 3.5 dB lossfor each doubling of the split ratio (assumption adopted fromOASE [9], consistent with ITU-T Rec. G.671). The maximum
5Users are not perfectly independent in real networks, as some periods ofthe day will be more busy than others. The assumptions made here are to beinterpreted as estimates for peak hours.
6

optical budget and attenuation factor α for each technology arelisted in Table 1. In our calculations, we limit ourselves to thosesubsets of split ratios that allow a reach dmax that is greater than5 km, to ensure all homes in the city can be connected to theCOs.
4.2.2. Quality of Service (QoS) restrictionsAfter subtracting the IPTV multicast bandwidth (calculated
in Section 4.1) from the total PON bandwidth, the remainingbest-effort Internet bandwidth is to be shared by all subscribersin the (virtual) PON. We assume ideal dynamic bandwidth allo-cation without packet loss in the ODN in both US and DS direc-tion. All users within a virtual PON are treated equally. Whenk active users from N total independent users are demanding ordelivering traffic from/to an OLT interface, the maximum band-width that can be offered to each user is
Bmax =PON bandwidth
k, 1 ≤ k ≤ N (8)
When Bmax is greater than Btarget, all active users get the re-quested Btarget. However, when there are too many active users,Bmax may be smaller than Btarget, so the offered bandwidth maybe lower than the requested bandwidth. The probability pavail
that Btarget is available (Bmax ≥ Btarget), equals the probabilitythat the number of active users k is smaller than or equal to kmax,given by the cumulative binomial probability [19]
pavail =
kmax∑k=0
N!(N − k)!k!
(1 − pact)N−k pkact (9)
kmax =
⌊PON bandwidth
Btarget
⌋(10)
This availability is compared to pavail,min, the minimum percent-age of time that the target bandwidth should be available foreach connected user (pavail,min = 90% in our simulations, basedon the current average for residential fiber services [22]). Incase of the fixed split ratio approach, this may eliminate tech-nologies that cannot meet QoS requirements. In case of splitratio optimization, the split ratio is lowered until QoS require-ments are met.
4.3. OLT dimensioning for a single rackOnce the split ratio has been determined, we can dimen-
sion the general OLT functions and the uplink between theOLT and the aggregation network. The traffic passing throughan OLT6 consists of three contributions: (1) Voice traf-fic: requires negligible bandwidth, (2) IPTV broadcast of allTV channels, for which a combined downstream capacity of127 × 12 Mb/s = 1.5 Gb/s is reserved, and (3) best-effort Inter-net traffic: the dimensioning for this traffic is derived from theuser demands as follows.
In our model, the number of active users in a single PONfollows a binomial distribution (see Section 4.2.2). By mul-tiplying the numbers of active users in this distribution by
6Here, “OLT” refers to a single rack, connecting a number of PONs as listedin Table 1.
Btarget, and capping the values at the available PON capacityfor best-effort Internet services, we obtain the demand distri-bution (DPON ,PPON) for a single (virtual) PON. This distribu-tion is used in a Monte Carlo simulation, where for each PONin the rack, a random number is generated and mapped onto ademand DPON( j) with probability PPON( j), and the demands ofthe PONs in the rack are added up. After running the simulationone million times, we can estimate the combined best-effort In-ternet traffic load of the PONs connected to a rack (DOLT ,POLT )with sufficient precision. Based on this distribution, we dimen-sion the uplink and general OLT functions requirements perrack for best-effort Internet services as described in the follow-ing sections.
4.3.1. UplinkThe uplink capacity should be sufficiently high so as to keep
the packet loss in the uplink (Ploss) unnoticeable for users. Av-erage packet loss in present-day residential fiber access net-works is in the range 0.13% - 0.34% [22], so we decide to keepthe packet loss in the uplink below Ploss,max = 0.1% for thereference scenario. Transmission Control Protocol (TCP) con-nections with high sustainable rates up to 1 Gb/s may requirea lower packet loss rate, in which case a more strict value canbe chosen without impacting the conclusions of this work, asthe sensitivity analysis shows that overall power consumptionis not impacted significantly by varying Ploss,max from 10−3 to10−8.
We calculate the minimal uplink capacity CU for whichPloss < Ploss,max as follows. In the uplink interface of an OLTrack, the packet loss is the ratio of packets discarded over pack-ets offered. We use the flow model from [23] to estimate packetloss: instead of considering individual packets, we look at traf-fic flows. The packet loss is then
Ploss = 1 −mm∗
(11)
where m∗ is the average combined traffic load from all PONsconnected to the rack (traffic offered), and m is the mean trafficload passing through the uplink (traffic passed). For a givenuplink capacity CU for best-effort Internet services, m∗ and mare easily derived from the OLT load distribution as follows
m∗ =∑
i
DOLT (i) × POLT (i) (12)
m =∑
i
min (DOLT (i) ,CU) × POLT (i) (13)
The minimal uplink capacity CU for which the packet loss cal-culated in (11) is below Ploss,max, is chosen. This capacity CU
is then added to the IPTV broadcast bandwidth (1.5 Gb/s) toobtain the total required uplink capacity.
The uplink is realized using a combination of Ethernet portswith capacities and corresponding power consumption valuesadopted from [24]: 1 Gb/s, 10 Gb/s, 40 Gb/s, 100 Gb/s,400 Gb/s and 1 Tb/s ports consume 7 W, 38 W, 105 W, 205 W,560 W and 1100 W respectively. The port combination withminimal energy consumption is chosen to realize the uplink.
7

Note that only downstream traffic is considered in this calcula-tion, since the uplink ports are symmetrical and there is typi-cally more traffic load downstream than upstream.
4.3.2. General OLT functionsThe last contribution to the OLT power consumption comes
from the general OLT functions, which include (1) Layer 2(Ethernet) switching, and (2) packet processing and traffic man-agement. About 30% of this power consumption is static, due toleakage in transistors, and scales with capacity; the other 70%is dynamic and scales with the actual traffic load.
Half of the static power consumption is used for switch-ing, for which the installed capacity is symmetrical and thusscales with the highest traffic capacity direction (downstream);the other half is used for packet processing and traffic manage-ment, for which different upstream and downstream capacitycan be installed. So the OLT capacity COLT in equation (5)should be interpreted as 0.5 × (2 ×CDS ) + 0.5 × (CDS + CUS )to differentiate between these symmetrical and asymmetricalcontributions. The required downstream capacity CDS of thegeneral OLT functions is the sum of IPTV broadcast capac-ity (1.5 Gb/s) and DS best-effort Internet capacity of the OLT.The upstream OLT capacity CUS is 25% of the DS best-effortInternet capacity. The DS best-effort Internet capacity is esti-mated using a similar method as for the uplink capacity, butwith a stricter limitation on the allowable packet loss (10−9).Moreover, this capacity is multiplied by a factor four to over-dimension the equipment to accommodate traffic growth andtraffic peaks (an average factor which we obtained as a rule ofthumb from providers). The assumptions for OLT capacity di-mensioning are more strict than those for the uplink because it ismore difficult to upgrade OLT capacity: for the uplink, capacitycan be increased by simply plugging in additional transceiversand adding capacity in the aggregation switches in the metroaggregation net, whereas an OLT upgrade will likely involve areplacement of the OLT switch and packet processors.
The dynamic power consumption is proportional with thetraffic load, and consumes 0.70 W/Gb/s (unidirectional, con-sisting of 0.35 W/Gb/s for switching and 0.35 W/Gb for packetprocessing and traffic management). This value is multiplied bythe average OLT traffic load LOLT , which is the sum of the av-erage downstream best-effort Internet traffic load, 25% of thisvalue for upstream traffic, and the IPTV broadcast bandwidth.
5. City deployment model
A real city scenario is considered in the PON deploymentalgorithm which – based on the technology-dependent opticalbudget, attenuation, split ratio and number of PON ports perrack – finds the required inventory of active equipment for pro-viding high speed triple play services with the required QoS.7
A greenfield approach is followed for fiber network construc-tion, assuming that no other optical access infrastructure has
7City deployment algorithm developed in the framework of FP7 project Ac-cordance.
Table 2: Summary of city topology.
Centralzone Ring 1 Ring 2 Ring 3
Populationcenters 1 13 19 40
Home units 564,730 434,376 276,217 165,903
Densitythreshold(homes/km2)
4,000 4,000 2,000 500
Fiber lengthF1, F2, F3a
40%,20%,50m
40%,20%,50m
42%,23%,75m
44%,26%,100m
Surface (km2) 67.27 91.80 113.03 178.81
Distance tocentral zone(km)
0 15.55 23.11 29.21
a Values for F1, F2 and F3 are based on a typical real GPONdeployment. F1 and F2 are reported as percentages ofmin(population center radius, physical reach of the PONtechnology) to account for reach differences between PONtechnologies.
been deployed before and if there are existing ducts, they arenot necessarily used. This allows to evaluate the impact of thedifferent PON deployment parameters with total flexibility. Incase of a fixed split ratio approach, we assume the existing de-ployment has been optimized in the past using the same algo-rithm to obtain the equipment count.
5.1. City description
Public source real data from the Spanish National Instituteof Statistics [25] have been employed to create the city topol-ogy model. This work focused on a major city area in Spainwith an aggregate distribution of 1.5 million home units. Aclassification of the 73 population centers of the city was estab-lished using three geotypes depending on population density:(1) Dense urban geotype with ≥ 4,000 home units per km2, (2)Urban geotype with 2,000 - 4,000 home units per km2, and (3)Sub-urban geotype with 500 - 2,000 home units per km2. Asimplified model of the city area was built considering threeconcentric rings with a common central zone. Both the centralzone and Ring 1 correspond to the dense urban geotype, whileRing 2 and 3 correspond to urban and sub-urban geotypes, re-spectively (see Table 2).
5.2. Optical Access Network Deployment
For a given service definition, the number of OLT racks de-pends on the filling ratio of each OLT PON interface, which isbased on two factors: (1) the coverage area of a PON, whichdepends on its maximum physical reach, determined by thesplit ratio, optical budget and attenuation; and (2) the popu-lation density, determined by its location in the city. As a con-
8

2nd CONSOLIDATION
(circular consolidation)
3rd CONSOLIDATION
(between-ringsconsolidation)
1st CONSOLIDATION
(radial consolidation)2nd CONSOLIDATION
(circular consolidation)
3rd CONSOLIDATION
(between-ringsconsolidation)
1st CONSOLIDATION
(radial consolidation)2nd CONSOLIDATION
(circular consolidation)
3rd CONSOLIDATION
(between-ringsconsolidation)
1st CONSOLIDATION
(radial consolidation)
1st consolidation
(radial)
2nd consolidation
(circular)
3rd consolidation
(between-rings)
Figure 3: Graphical representation of the CO consolidation steps.
sequence, the first step for the PON inventory calculation is lo-cating the COs. Initially, one CO is associated to each of the 73population centers. For simplicity, each of the rings’ surfacesis evenly assigned to each of the identified population centers,and all of the COs of each ring are considered to be at the aver-age distance with regards to the central area. Next, a concentricCO consolidation algorithm is used as PON deployment opti-mization criterium, because it allows minimum real estate in-vestment for the network operator, as well as lower operationalcost. Considering two levels of power splitting in the PON fiberoutside plant, the rules for fiber network construction to provideFTTH coverage depending on each type of population centerare shown in Table 2 (fiber sections F1, F2 and F3 as indicatedin Fig. 2). For a given PON technology, the algorithm used tocalculate the number of COs and the ring location of each COconsists of the following three steps (see Fig. 3):
1. Radial consolidation. For each of the three rings, the algo-rithm verifies if an extended feeder fiber from the centralzone to the average ring distance is supported, dependingon the reach of the PON technology. If the verification ispositive, then all the home units of the verified ring areserved from the central zone.
2. Circular consolidation. When radial consolidation is notpossible for a ring, then consolidation of neighboring COsinto a single CO within the same ring zone is verified. Anaverage distance between COs is calculated from the ringarea and the number of centers in the ring. Increasing mul-tiples of this average distance are added to the length offiber section F1 for the corresponding ring and the max-imum circular consolidation is obtained considering thereach of the PON technology.
3. Inter-ring consolidation. After the circular consolidation,the algorithm verifies if the remaining COs in a ring, whichcannot be served from the previously consolidated COs(isolated centers), can serve centers of an outer ring.
Thus, depending on the technology performance and the ser-vice requirements, the number of serving COs in each of therings is calculated and the corresponding equipment inventoryfor the COs (number of OLT racks and OLT PON ports) is re-turned. The rack filling rate – the actual number of PON portsper rack divided by the theoretical number of PON ports perrack – will depend on the location of the COs, and has an im-pact on the total power consumption of the access network.
The number of ONUs is also calculated in this stage, basedon the number of homes in the city, the percentage of real estate
1:6
4
1:6
4
1:6
4
1:6
4
1:6
4
1:6
4 1:6
4
0
5
10
15
20
25
Po
we
r at
CO
+ O
NU
(W
/use
r) ONU
OLT uplinks
OLT general functions
OLT PON ports
(a) fixed split
1:3
2
1:1
28
1:6
4
1:6
4
1:2
56
1:1
28
1:2
56
0
5
10
15
20
25
Po
we
r at
CO
+ O
NU
(W
/use
r) ONU
OLT uplinks
OLT general functions
OLT PON ports
(b) optimized split
Figure 4: Power consumption at CO (OLT) and customer premises (ONU) fora reference scenario (Btarget = 600 Mb/s). Split ratios are indicated inside thebars. Split ratio optimization decreases OLT power consumption for TWDMand OFDM PON the most. GPON B+ must be deployed with a lowered splitratio to meet QoS requirements. Overall, XG-PON1 is the most energy efficienttechnology that can be deployed with a split ratio ≥ 1:64.
units passed by fiber (60%) and the percentage of those realestate units passed that are connected, referred to as takerate(we take 50% as a reference, and vary this value between 10%and 100% in our sensitivity analysis).
6. Results for a reference scenario
All power consumption calculations were implemented inMatlab; except for the city deployment model, which was im-plemented in Visual Basic (Excel). In our analysis of the re-sults, we focus on the power consumption per user to comparedifferent cases. Each case consists of a PON technology, asplit ratio strategy (fixed or optimized, cf. Section 4.2), anda specific combination of the service profile parameters listedin Appendix A, quantifying user demands (numbers of users,user activity and bandwidth requirements per user) and QoSrequirements (availability, packet loss). It must be noted thatwhen the deployment has been optimized for a specific case, theswitchover to another case with higher demands or stricter QoSrequirements could mandate expensive changes in the ODN(e.g. lowering the split ratio). Therefore, when choosing theinput parameters for our model, the cases are defined includinga sufficiently large buffer to enable future growth.
This section will discuss the results for two reference cases:the fixed split and optimized split version of an average user de-mand scenario. The results for other cases will be discussed inthe sensitivity analysis. All results include power conversion in-efficiencies and site overhead where applicable (cf. equation 2-3).
6.1. Total power consumption
The stacked bars in Fig. 4 indicate the joint power consump-tion at the CO and ONU for an average user demand sce-nario (600 Mb/s). The values range from about 8 W/user forGPON to more than 20 W/user for OFDM PON. In general,the ONU is the most important contributor (for a discussionof the technology-dependent ONU power consumption values
9

we refer to Section 3.3). The share of the CO becomes evensmaller when the split ratio is optimized (Fig. 4b, split ratiosindicated inside the bars), due to a more optimal use of the OLTequipment. OFDM has the highest overall power consump-tion, because of the heavy digital signal processing in the ONU.Co UDWDM has the second highest total power consumption,partly due to the need for an increased number of transceiversat the CO, but this also has a number of advantages, which willbe discussed below in the detailed evaluation of the CO powerconsumption.
Which technology is the most energy efficient option overall– For the user demands in the reference scenario, GPON B+ isthe most energy efficient solution, but in case of a fixed splitratio (Fig. 4a), its capacity does not suffice to serve users inan existing ODN: the probability that an active user gets therequested bandwidth drops to 60%, which is below the QoSrequirement of 90% (pavail < pav,min). GPON B+ could be de-ployed with a split ratio 1:32 to meet the requirements, but thiswould not be an attractive option for network operators, due tothe increased costs associated to a higher number of OLT portsand an ODN with a higher number of fibers and ducts. In prac-tice, XG-PON1 would therefore be a more attractive option forthe near future (depending on the split ratio flexibility, it canbe split 1:64 or 1:128). TWDM is an interesting option fornetwork operators who want to increase split ratios further toachieve node consolidation, in a network that is future-proof fordemands up to and beyond 1 Gb/s (see also sensitivity analysisin the next section).
6.2. OLT power consumptionThe lower three parts of the bars in Fig. 4 show the power
consumption of the OLT PON ports, general OLT functions andOLT uplinks at the CO. Note that this power consumption ischarged to the network provider.
Breakdown of the OLT contributions – The power consump-tion at the CO is mostly dominated by the contribution of thePON ports, while power consumption of the general OLT func-tions and uplinks is much lower. For GPON B+ however, gen-eral functions and uplinks are the dominant contributors, dueto its relatively low power per OLT PON port (see also Table1). Similarly, in case of TWDM with an optimized split ra-tio, where the power/user for PON ports is low due to a largenumber of users sharing each port, the contribution of generalOLT functions and uplinks is relatively important. As user de-mands increase (not shown in the graph), the contribution ofthe general OLT functions and uplinks will grow for all tech-nologies, since they scale with the capacity and traffic load. Ifthe bandwidth per user Btarget goes up to 1 Gb/s, general OLTfunctions and uplinks for NG-PON2 technologies will consumeabout 1.3 W/user in a fixed split scenario, and about 1 W/userin an optimized split scenario.
Impact of split ratio optimization – When the split ratio isfixed, NG-PON2 technologies have a much higher energy de-mand at the CO compared to the existing technologies, due tothe high line rates. Evidently, sharing a 40 Gb/s PON capac-ity among 32 connected users (split ratio 1:64, takerate 50%)is a substantial overprovisioning, which comes at a high energy
cost. Optimizing the split ratio reduces power consumption atthe CO for TWDM and OFDM PON the most. Thanks to theirhigh optical budgets and capacities, many users can be con-nected to a single OLT port, thus equipment sharing can makethese technologies more energy efficient. XLG PON8 has alower optical budget, so even though it offers the same per-PONcapacity as TWDM and OFDM, its maximum split ratio is 1:64,resulting in a high energy consumption per subscriber regard-less of split ratio flexibility. Co UDWDM is clearly the mostpower-hungry technology in every scenario. However, it mustbe noted that this solution offers the advantage of 100% band-width availability on the first mile and lowest traffic latency,which may be useful for specific applications such as businessservices or mobile backhauling and fronthauling. Moreover,the link budget is very high, and user demands can always bemet thanks to the dedicated wavelength channels, therefore thistechnology can always be deployed with split ratio 1:256 (oreven higher), even for very high user demands.
Which technology is the most energy sparing for networkoperators – As mentioned before, though GPON B+ has thelowest power consumption, it does not have sufficient capacityto offer user rates up to 600 Mb/s with 90% availability whenthe split ratio is 1:64. Among the other options, XG-PON1 isnot only the most energy efficient solution overall, but also themost energy efficient solution at the CO for user demands up to600 Mb/s.
Effects of statistical multiplexing – It is interesting to notethat for XG-PON1, even though the total PON bandwidth di-vided by the number of connected users is below the targetbandwidth, statistical multiplexing allows for an availability ofmore than 90%, since not all users are active at the same time.The same is true for TWDM PON in case of an optimized splitratio. As demands increase, XLG and OFDM PON could alsotake advantage of this statistical multiplexing effect, but in thisreference scenario, their split ratios are limited by reach restric-tions, so their capacity is not fully exploited.
7. Impact of parameter variations on results (sensitivityanalysis)
Since most of our input parameters are estimates based onliterature rather than experimentally verified values, they comewith some uncertainty. In order to know the impact of this un-certainty on our results, we perform a sensitivity analysis. Wevary fourteen input parameters along the distributions given inAppendix A, and study the variations in the CO power con-sumption as a result of these input variations. We only focus onpower consumption at the CO, since the ONU power consump-tion is assumed constant and therefore a sensitivity analysis forthe ONU is straightforward: if there is 10% deviation in the in-put for ONU power consumption, this results in 10% deviationin the ONU result. The results we show do however includeONU power consumption, as we want to compare the overallenergy efficiency between technologies.
8We do not distinguish between XLG:GEM and XLG:BI on the OLT side,as they require identical OLT equipment.
10
impact on result0 zero0 low0 medium0 high1 very high
Internet takerateBtarget
pact,Internet
pav,min,Internet
Ploss,max
TV takeratepact,TV
PONs per rack
optical budget margin
general OLT functions power
site factorPport,tech
Puser,tech
uplink power
technology GPON B+10G PONXLG PONTWDM PONOFDM PONCo UDWDM PONGPON B+10G PONXLG PONTWDM PONOFDM PONCo UDWDM PON
mean ### ### ### ### ### ### 2.20 1.82 9.66 3.20 6.20 ###
standard deviation ### ### ### ### ### ### 1.11 0.56 3.80 0.81 1.94 2.14
stddev/mean 31% 27% 27% 27% 21% 14% 50% 31% 39% 25% 31% 12%
XLG
TWD
M
OFD
M
Co
UD
WD
M
Fixed split Optimized split
GP
ON
B+
XG
-PO
N1
XLG
TWD
M
OFD
M
Co
UD
WD
M
GP
ON
B+
XG
-PO
N1
Figure 5: Relative importance of the input parameter variations for each techno-logy. The effect of varying some of the most impacting parameters (highlightedin gray) is shown in Fig. 6.
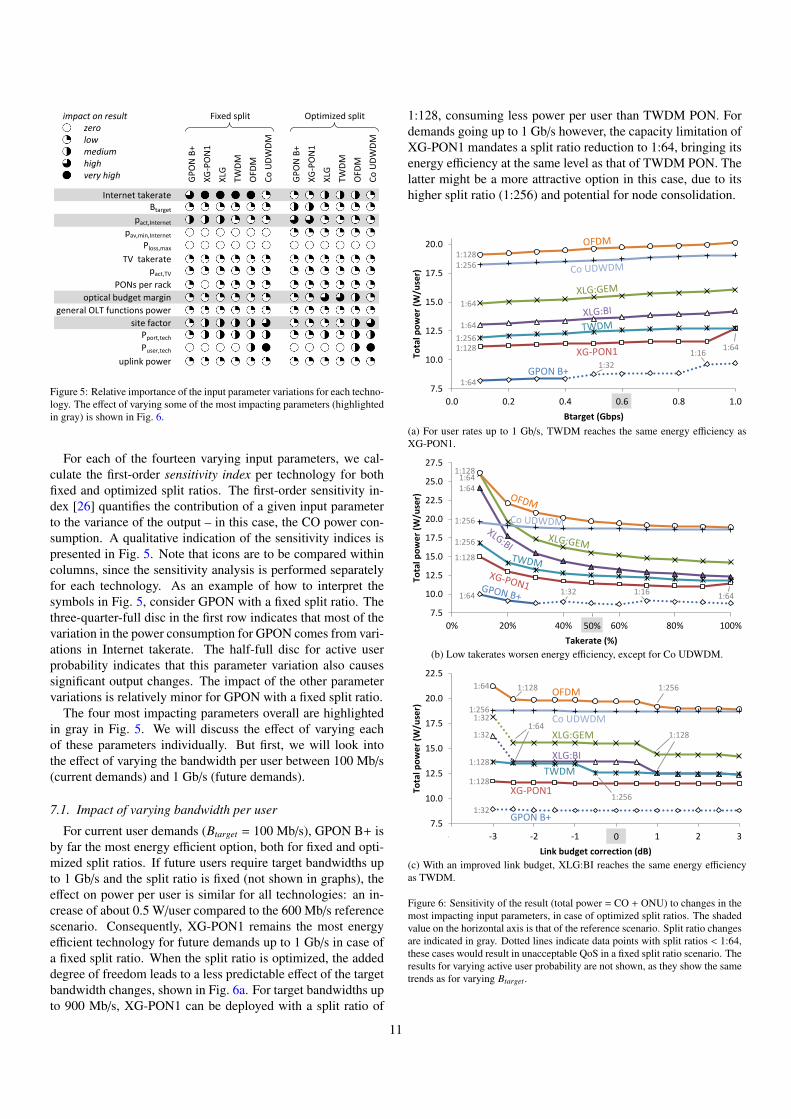
For each of the fourteen varying input parameters, we cal-culate the first-order sensitivity index per technology for bothfixed and optimized split ratios. The first-order sensitivity in-dex [26] quantifies the contribution of a given input parameterto the variance of the output – in this case, the CO power con-sumption. A qualitative indication of the sensitivity indices ispresented in Fig. 5. Note that icons are to be compared withincolumns, since the sensitivity analysis is performed separatelyfor each technology. As an example of how to interpret thesymbols in Fig. 5, consider GPON with a fixed split ratio. Thethree-quarter-full disc in the first row indicates that most of thevariation in the power consumption for GPON comes from vari-ations in Internet takerate. The half-full disc for active userprobability indicates that this parameter variation also causessignificant output changes. The impact of the other parametervariations is relatively minor for GPON with a fixed split ratio.
The four most impacting parameters overall are highlightedin gray in Fig. 5. We will discuss the effect of varying eachof these parameters individually. But first, we will look intothe effect of varying the bandwidth per user between 100 Mb/s(current demands) and 1 Gb/s (future demands).
7.1. Impact of varying bandwidth per user
For current user demands (Btarget = 100 Mb/s), GPON B+ isby far the most energy efficient option, both for fixed and opti-mized split ratios. If future users require target bandwidths upto 1 Gb/s and the split ratio is fixed (not shown in graphs), theeffect on power per user is similar for all technologies: an in-crease of about 0.5 W/user compared to the 600 Mb/s referencescenario. Consequently, XG-PON1 remains the most energyefficient technology for future demands up to 1 Gb/s in case ofa fixed split ratio. When the split ratio is optimized, the addeddegree of freedom leads to a less predictable effect of the targetbandwidth changes, shown in Fig. 6a. For target bandwidths upto 900 Mb/s, XG-PON1 can be deployed with a split ratio of
1:128, consuming less power per user than TWDM PON. Fordemands going up to 1 Gb/s however, the capacity limitation ofXG-PON1 mandates a split ratio reduction to 1:64, bringing itsenergy efficiency at the same level as that of TWDM PON. Thelatter might be a more attractive option in this case, due to itshigher split ratio (1:256) and potential for node consolidation.
7.5
10.0
12.5
15.0
17.5
20.0
22.5
-4 -3 -2 -1 0 1 2 3
Tota
l po
we
r (W
/use
r)
Link budget correction (dB)
GPON B+
XG-PON1
XLG:GEM
XLG:BI
TWDM
OFDM
Co UDWDMGPON B+
Co UDWDM
XG-PON1
TWDM
XLG:BI
XLG:GEM
OFDM 1:64 1:128
1:256 1:32
1:32
1:128
1:128
1:32
1:64 1:128
1:256
1:256
7.5
10.0
12.5
15.0
17.5
20.0
22.5
25.0
27.5
0% 20% 40% 60% 80% 100%
Tota
l po
we
r (W
/use
r)
Takerate (%)
GPON B+
XG-PON1
XLG:GEM
XLG:BI
TWDM
OFDM
Co UDWDM
1:128
1:64
1:256
1:256
1:128
1:64
1:64 1:32 1:16 1:64
50%
0
7.5
10.0
12.5
15.0
17.5
20.0
0.0 0.2 0.4 0.6 0.8 1.0
Tota
l po
we
r (W
/use
r)
Btarget (Gbps)
GPON B+
XG-PON1
XLG:GEM
XLG:BI
TWDM
OFDM
Co UDWDM
1:32 GPON B+
1:128 1:256
1:64
1:64
1:256 1:128
1:64
1:64 1:16
(a) For user rates up to 1 Gb/s, TWDM reaches the same energy efficiency asXG-PON1.
7.5
10.0
12.5
15.0
17.5
20.0
22.5
-4 -3 -2 -1 0 1 2 3
Tota
l po
we
r (W
/use
r)
Link budget correction (dB)
GPON B+
XG-PON1
XLG:GEM
XLG:BI
TWDM
OFDM
Co UDWDMGPON B+
Co UDWDM
XG-PON1
TWDM
XLG:BI
XLG:GEM
OFDM 1:64 1:128
1:256 1:32
1:32
1:128
1:128
1:32
1:64 1:128
1:256
1:256
7.5
10.0
12.5
15.0
17.5
20.0
22.5
25.0
27.5
0% 20% 40% 60% 80% 100%
Tota
l po
we
r (W
/use
r)
Takerate (%)
GPON B+
XG-PON1
XLG:GEM
XLG:BI
TWDM
OFDM
Co UDWDM
1:128
1:64
1:256
1:256
1:128
1:64
1:64 1:32 1:16 1:64
50%
0
7.5
10.0
12.5
15.0
17.5
20.0
0.0 0.2 0.4 0.6 0.8 1.0To
tal p
ow
er
(W/u
ser)
Btarget (Gbps)
GPON B+
XG-PON1
XLG:GEM
XLG:BI
TWDM
OFDM
Co UDWDM
1:32 GPON B+
1:128 1:256
1:64
1:64
1:256 1:128
1:64
1:64 1:16
(b) Low takerates worsen energy efficiency, except for Co UDWDM.
7.5
10.0
12.5
15.0
17.5
20.0
22.5
-4 -3 -2 -1 0 1 2 3
Tota
l po
we
r (W
/use
r)
Link budget correction (dB)
GPON B+
XG-PON1
XLG:GEM
XLG:BI
TWDM
OFDM
Co UDWDMGPON B+
Co UDWDM
XG-PON1
TWDM
XLG:BI
XLG:GEM
OFDM 1:64 1:128
1:256 1:32
1:32
1:128
1:128
1:32
1:64 1:128
1:256
1:256
7.5
10.0
12.5
15.0
17.5
20.0
22.5
25.0
27.5
0% 20% 40% 60% 80% 100%
Tota
l po
we
r (W
/use
r)
Takerate (%)
GPON B+
XG-PON1
XLG:GEM
XLG:BI
TWDM
OFDM
Co UDWDM
1:128
1:64
1:256
1:256
1:128
1:64
1:64 1:32 1:16 1:64
50%
0
7.5
10.0
12.5
15.0
17.5
20.0
0.0 0.2 0.4 0.6 0.8 1.0
Tota
l po
we
r (W
/use
r)
Btarget (Gbps)
GPON B+
XG-PON1
XLG:GEM
XLG:BI
TWDM
OFDM
Co UDWDM
1:32 GPON B+
1:128 1:256
1:64
1:64
1:256 1:128
1:64
1:64 1:16
(c) With an improved link budget, XLG:BI reaches the same energy efficiencyas TWDM.
Figure 6: Sensitivity of the result (total power = CO + ONU) to changes in themost impacting input parameters, in case of optimized split ratios. The shadedvalue on the horizontal axis is that of the reference scenario. Split ratio changesare indicated in gray. Dotted lines indicate data points with split ratios < 1:64,these cases would result in unacceptable QoS in a fixed split ratio scenario. Theresults for varying active user probability are not shown, as they show the sametrends as for varying Btarget .
11

7.2. Impact of varying other input parameters
The Internet takerate is the most impacting input parameterfor all technologies in case of fixed split ratios, because as thetakerate increases, the number of users sharing PON equipmentincreases, resulting in a lower power per user. Takerates be-low 30% result in much higher power per user compared to thereference scenario with 50% takerate (e.g. for 30% takerate,TWDM power per user is 2.6 W higher than for the referencecase). For optimized split ratios (Fig. 6b), the effect is less pro-nounced, but still significant. For takerates below 20%, there isa notable deterioration in energy efficiency for all technologies.Note that the impact for Co UDWDM is limited for both fixedand optimized split ratios, since the installed capacity for thistechnology scales better with the number of connected users.
The results for varying active user probability show similartrends as for varying Btarget (cf. Section 7.1), as they ultimatelyhave the same effect: an increase in the PON traffic load and inthe required OLT capacity.
The site factor is applied to all power consumption valuesat the CO, so it directly impacts power consumption: varyingthe site factor with 10% scales the total CO power consumptionwith 10%, this is the case for both fixed and optimized splitratio scenarios.
Variations in the optical budget margin generally have a lim-ited effect when the split ratio is fixed (not shown in graphs),though a shorter range could result in slightly less equipmentsharing due to less centralized COs. In case of optimized splitratios, the optical budget margin is an important parameter forXLG PON, TWDM PON and OFDM PON, as it can be a lim-iting factor for the split ratio optimization. Due to their highcapacities, reach is typically the limiting factor for these tech-nologies. Figure 6c shows that XLG:BI could achieve the samepower/user if the link budget was improved by 1 dB (for exam-ple by making the margin for fiber patching more strict). But inany case, TWDM keeps the advantage of the highest split ratiopotential.
7.3. Conclusion of the sensitivity analysis
Though changes in the input parameters can result in signi-ficant variations in the CO power consumption for individualtechnologies, the relative proportions between the technologiesare preserved in most cases, so the comparison between thetechnologies still holds. Although our sensitivity analysis fo-cused mainly on the CO, note that changes in the ONU willmost likely have a bigger impact, due to its bigger contributionto the overall power per user.
8. Conclusion
We studied the power consumption of various next-generation PON technologies for a massive residential deploy-ment. The choice for a fixed split ratio or optimized split ratiostrategy will impact which technology is the most energy effi-cient option for future deployments with access bandwidths upto 1 Gb/s: XG-PON1 (with split ratio 1:64) or TWDM PON(with split ratio 1:256). TWDM PON can take advantage of its
high optical power budget, resulting in a long reach that allowsnode consolidation (reducing the number of central offices andOLT ports), which can help reduce both capital expendituresand operational costs for network operators.
We also analyzed the sensitivity of our results to the inputparameters of our model. As it turns out, variations in takerate,active user probability, optical budget margin and site factorhave the biggest impact on our result for the power consump-tion at the central office. Reducing the site factor, for exampleby using energy-efficient cooling systems, can significantly re-duce power consumption. Further, a high takerate significantlyreduces power consumption per user due to improved equip-ment sharing, which brings the actual traffic load closer to theprovisioned capacity. This shows that a scenario where mul-tiple operators each have their own optical access network, isnot desirable from an energy efficiency point of view. An openaccess scenario, where multiple operators share the passive op-tical network infrastructure [27], could be a more energy ef-ficient solution from network operators’ perspective. But thebiggest impact on the overall power consumption can be madeby improving the energy efficiency of ONUs, as they still con-sume the bulk of optical access network energy. The inclusionof energy saving strategies such as sleep modes or energy ef-ficient protocols in the comparison can have a big impact onthe results, as illustrated by the improved energy efficiency ofXLG:BI compared to XLG:GEM.
To conclude, we would like to remark that in the currentwork, our focus has been on energy efficiency with current tech-nology maturity and system performance estimations, and with-out taking into account cost aspects. TWDM PON, which wasselected by FSAN as the main solution for NG-PON2 for itslower expected cost than other candidates and commercial vi-ability by 2015, also turns out to be an energy efficient solu-tion for residential services. For other services with specificrequirements, other characteristics (such as system capacity,bandwidth availability and latency) may be prioritized over en-ergy efficiency or cost.
Appendix A. Input parameters for the sensitivity analysis
Table A.3 contains an overview of the input parameters thatare varied between simulations in the sensitivity analysis. Thefirst column shows the default values of the reference scenario.The other columns show the restrictions for the random varia-tion of the parameters in the sensitivity analysis. The distribu-tion of the parameters for the sensitivity analysis is Gaussian,except when specified otherwise.
Acknowledgment
This research has received funding from the EU FP7 projectsTREND (ICT-257740) and DISCUS (ICT-318137). The firstauthor is funded by the Agency for Innovation by Science andTechnology in Flanders (IWT). Part of this research was per-formed in the context of GreenTouch.
12

Table A.3: Overview of input parameter variations for the sensitivity analysis.
parameter namereferencescenario
(mean)
standarddeviation
lowerbound
upperbound description / remarks
User demand: Internet service profile
Internet takerate 50% 10% 0% 100% Percentage of homes passed by fiber that areconnected.
Btarget 600 Mb/s 200 Mb/s 0 Mb/s 1 Gb/s The sustainable bandwidth requested by users whenthey are active.
pact,Internet 10% 5% 0% 100% Probability that a user is active, requesting Btarget.
pav,min,Internet 90% 10% 0% 100% QoS parameter: minimum probability that a userwill get Btarget when requested.
log10(Ploss,max
)-5.5 - -8 -3
QoS parameter: exponent for maximum allowablepacket loss in the uplink. Distribution is flat, notGaussian.
User demand: TV service profile
TV takerate 25% 10% 0% 100% Percentage of Internet subscribers that have IPTV.
pact,TV 60% 10% 0% 100% Percentage of TV sets switched on during peak hour.
Physical characteristics of technologies
PONs per rack cf. Table 1 10% ofmean
50% ofmean
2×mean
Number of PONs per rack, rounded to the nearestinteger.
Lm 3 dB 1.5 dB 0 dB (none)Margin for fiber patching, subtracted from theoptical link budget to calculate reach, seeequation (7).
Power consumption calculation
general OLTfunctions power 1 W/Gbps 0.1 W/Gbps 0 W/Gbps (none)
Power consumption factor for switching, trafficmanagement and packet processing. Unidirectional,excluding overhead factors.
site factor 1.6 0.16 1 2 CO power consumption is multiplied by the sitefactor (defined in Section 2).
Pport,tech cf. Table 1 10% ofmean 0 W (none) OLT power per port for opto-electronic components,
excluding overhead factors.
Puser,tech cf. Table 1 10% ofmean 0 W (none) OLT power per user for opto-electronic
components, excluding overhead factors.
uplink Ethernetports power cf. page 7 10% of
mean 0 W (none) Power consumption of the uplink Ethernet portsfrom [24].
13

We would like to thank L. Guan and M. Ruffini from TheTelecommunications Research Center (CTVR), Dublin, Ire-land, for providing the IPTV channel popularity information.
References
[1] P. Chanclou, A. Cui, F. Geilhardt, H. Nakamura, D. Nesset, Network oper-ator requirements for the next generation of optical access networks, Net-work, IEEE 26 (2) (2012) 8–14. doi:10.1109/MNET.2012.6172269.
[2] B. Skubic, E. De Betou, T. Ayhan, S. Dahlfort, Energy-efficient next-generation optical access networks, Communications Magazine, IEEE50 (1) (2012) 122–127. doi:10.1109/MCOM.2012.6122542.
[3] K. Grobe, M. Roppelt, A. Autenrieth, J.-P. Elbers, M. Eiselt, Cost andenergy consumption analysis of advanced WDM-PONs, CommunicationsMagazine, IEEE 49 (2) (2011) s25–s32. doi:10.1109/MCOM.2011.
5706310.[4] D. Suvakovic, H. Chow, D. van Veen, J. Galaro, B. Farah, N. An-
thapadmanabhan, P. Vetter, A. Dupas, R. Boislaigue, Low energy bit-interleaving downstream protocol for passive optical networks, in: IEEEOnline Conference on Green Communications (GreenCom), 2012, pp.26–31. doi:10.1109/GreenCom.2012.6519611.
[5] J. Montalvo, J. Torrijos, J. Xia, Y. Ye, Energy efficiency in PON homenetwork scenarios with network enhanced residential gateways, in: 10thIEEE International Conference on Networking, Sensing and Control (IC-NSC), 2013, pp. 141–145. doi:10.1109/ICNSC.2013.6548726.
[6] F. Saliou, P. Chanclou, N. Genay, F. Laurent, F. Bourgart, B. Charbonnier,Energy efficiency scenarios for long reach PON central offices, in: OpticalFiber Communication Conference/National Fiber Optic Engineers Con-ference (OFC/NFOEC), Optical Society of America, 2011, p. OThB2.doi:10.1364/OFC.2011.OThB2.
[7] S. Lambert, J. Montalvo, J. Torrijos, B. Lannoo, D. Colle, M. Pickavet,Energy demand of high-speed connectivity services in NG-PON mas-sive deployments, in: 39th European Conference and Exhibition on Op-tical Communication (ECOC), 2013, p. P.6.5. doi:10.1049/cp.2013.1661.
[8] S. Lambert, J. Montalvo, J. A. Torrijos, B. Lannoo, D. Colle, M. Pick-avet, Energy efficiency analysis of next-generation passive optical net-work (NG-PON) technologies in a major city network, in: 15th Inter-national Conference on Transparent Optical Networks (ICTON), 2013.doi:10.1109/ICTON.2013.6602846.
[9] OASE, Integrated OASE results overview (D8.5) (March 2013).URL http://www.ict-oase.eu/public/files/OASE_D8.5_WP8_
DTAG_15032013_V1.0.pdf
[10] H. Chow, D. Suvakovic, D. van Veen, A. Dupas, R. Boislaigue, R. Farah,M. F. Lau, J. Galaro, G. Qua, N. P. Anthapadmanabhan, G. Torfs, C. V.Praet, X. Yin, P. Vetter, Demonstration of low-power bit-interleavingTDM PON, in: 38th European Conference and Exhibition on OpticalCommunication (ECOC), Optical Society of America, 2012, p. Mo.2.B.1.doi:10.1364/ECEOC.2012.Mo.2.B.1.
[11] S. Smolorz, H. Rohde, E. Gottwald, D. W. Smith, A. Poustie, Demonstra-tion of a Coherent UDWDM-PON with real-time processing, in: OpticalFiber Communication Conference/National Fiber Optic Engineers Con-ference (OFC/NFOEC), Optical Society of America, 2011, p. PDPD4.
[12] A. Dixit, S. Lambert, B. Lannoo, D. Colle, M. Pickavet, P. Demeester,Towards energy efficiency in optical access networks, in: IEEE Interna-tional Conference on Advanced Networks and Telecommunications Sys-tems (ANTS), 2013. doi:10.1109/ANTS.2013.6802896.
[13] A. Dixit, B. Lannoo, D. Colle, M. Pickavet, P. Demeester, ONU powersaving modes in next generation optical access networks: progress, effi-ciency and challenges, Optics Express 20 (26) (2012) B52–B63. doi:
10.1364/OE.20.000B52.[14] Ofcom, Communications market report 2013 (August 2013).
URL http://stakeholders.ofcom.org.uk/
[15] A. Ali, S. Vassilaras, K. Ntagkounakis, A comparative study of band-width requirements of VoIP codecs over WiMAX access networks, in:Third International Conference on Next Generation Mobile Applica-tions, Services and Technologies (NGMAST), 2009, pp. 197–203. doi:10.1109/NGMAST.2009.47.
[16] Analysys Mason, The connected consumer survey 2013: TV and video(May 2013).
URL http://www.analysysmason.com/Research/Content/
Reports/Connected-Consumer-TV-May2013-RDMB0/
[17] D. T. v. Veen, M. K. Weldon, C. C. Bahr, E. E. Harstead, An analysis ofthe technical and economic essentials for providing video over fiber-to-the-premises networks, Bell Labs Technical Journal 10 (1) (2005) 181–200. doi:10.1002/bltj.20088.
[18] D. E. Smith, IP TV Bandwidth Demand: Multicast and Channel Surfing,in: 26th IEEE International Conference on Computer Communications(INFOCOM), 2007, pp. 2546–2550. doi:10.1109/INFCOM.2007.318.
[19] J. Segarra, V. Sales, J. Prat, Access services availability and traffic fore-cast in PON deployment, in: 13th International Conference on Transpar-ent Optical Networks (ICTON), 2011, pp. 1–6. doi:10.1109/ICTON.
2011.5970909.[20] E. Goma, M. Canini, A. Lopez Toledo, N. Laoutaris, D. Kostic, P. Ro-
driguez, R. Stanojevic, P. Yague Valentin, Insomnia in the access: or howto curb access network related energy consumption, in: Special InterestGroup on Data Communication Conference (SIGCOMM), ACM, NewYork, USA, 2011, pp. 338–349. doi:10.1145/2018436.2018475.
[21] OECD, OECD Communications Outlook 2013, ISBN 978-92-64-19459-5.
[22] European Commission, Quality of Broadband Services in the EU (March2012).URL http://ec.europa.eu/digital-agenda/en/news/
quality-broadband-services-eu-march-2012
[23] W. Lautenschlager, W. Frohberg, Bandwidth dimensioning in packet-based aggregation networks, in: The 13th International Telecommunica-tions Network Strategy and Planning Symposium (Networks), 2008, pp.1–8. doi:10.1109/NETWKS.2008.4763737.
[24] W. Van Heddeghem, F. Idzikowski, W. Vereecken, D. Colle, M. Pick-avet, P. Demeester, Power consumption modeling in optical multilayernetworks, Photonic Network Communications 24 (2) (2012) 86–102.doi:10.1007/s11107-011-0370-7.
[25] Spanish National Institute of Statistics, Population of the continuous mu-nicipal register by population unit, http://www.ine.es.
[26] A. Saltelli, M. Ratto, T. Andres, F. Campolongo, J. Cariboni, D. Gatelli,M. Saisana, S. Tarantola, Variance-Based Methods, John Wiley & Sons,Ltd, 2008, pp. 155–182. doi:10.1002/9780470725184.ch4.
[27] A. Banerjee, G. Kramer, B. Mukherjee, Fair sharing using dual service-level agreements to achieve open access in a passive optical network, Se-lected Areas in Communications, IEEE Journal on 24 (8) (2006) 32–44.doi:10.1109/JSAC.2006.1677253.
Sofie Lambert is a Ph.D. candidate atGhent University (Belgium). She receivedher M.Sc. degree in Photonics fromGhent University in 2011, and joined theGreen ICT research team of the Informa-tion Technology department (INTEC) ofGhent University in 2012. She studies theelectricity consumption of ICT infrastruc-tures, specifically in communication net-
works. Her current research is focused on the energy efficiencyof future access network architectures, both optical and wire-less, and the impact of energy saving strategies such as sleepmodes on these networks.
14

Bart Lannoo received a M.Sc. degree inElectrotechnical engineering and a Ph.D.degree from Ghent University (Belgium)in July 2002 and May 2008, respectively.Since August 2002, he has been workingat the Internet Based Communication Net-works and Services (IBCN) research groupof the Department of Information Techno-logy (INTEC) of Ghent University. He is
also affiliated with the research institute iMinds. His main re-search interests are fixed and wireless access networks, and hecoordinates the GreenICT research at IBCN. He is author orco-author of more than 100 international publications, both injournals and in proceedings of conferences.
Abhishek Dixit received the M.Tech. de-gree in Optical Electronics and OpticalCommunication from the Indian Instituteof Technology, Delhi (India) in 2010. Heis currently working towards the Ph.D. de-gree from Ghent University, Belgium. Hewas active in the European project ICT-OASE and has more than 20 scientific pub-lications in international conferences and
journals. His research interests include broadband optical ac-cess networks and Internet of things (IoT).
Didier Colle received a M. Sc. degreein Electrotechnical engineering (option:communications) from Ghent Universityin 1997. Since then, he has been work-ing at the same university as researcher inthe department of Information Technology(INTEC). He is part of the research groupInternet Based Communication Networksand Services (IBCN) headed by prof. Piet
Demeester. His research lead to a Ph.D. degree in February2002. He became professor at Ghent University in October2011. Currently, he is co-responsible for the research clusteron network modelling, design and evaluation and is coordinat-ing the research on fixed internet architectures and optical net-works.
Mario Pickavet is full professor at GhentUniversity where he is teaching courseson discrete mathematics, broadband net-works and network modeling. He is lead-ing research tracks on fixed internet archi-tectures and optical networks, green ICTand design of network algorithms. He haspublished about 300 international publica-tions, both in journals (IEEE JSAC, IEEE
Comm. Mag., Journal of Lightwave Technology, Proceedingsof the IEEE, ...) and in proceedings of conferences. He is co-author of the book ’Network Recovery: Protection and Restora-
tion of Optical, SONET-SDH, IP, and MPLS’.
Julio Montalvo holds an M.Sc. degreein telecommunication engineering (2003)from the Technical University of Madridand a Ph.D. degree in electrical, electron-ics and robotics engineering (2008) fromCarlos III University of Madrid. He isthe author of more than 30 papers in re-search journals and conferences, one bookchapter and one granted patent. He has
been involved in several European research projects. He joinedTelefonica I+D in 2011 as project manager in fixed access andhome networks. He is also Telefonicas delegate in the Broad-band Forum and Full Service Access Networks.
Jose Alfonso Torrijos Gijon has a Com-puter Science degree from the PolytechnicUniversity of Madrid in 1992. In 1994 hejoined Telefnica I+D working in differentprojects for Telefonica regarding IP, DTV,xDSL and Satellite technologies. In 2004he joined the Broadband Access Technolo-gies Division managing ARTES-1 and FP6
projects such as SATLIFE and SATSIX. In 2008 he startedto work in fibre optic projects for Telefonica Spain regardingFTTH access and photonic networks where he is currently in-volved.
Peter Vetter is Head of the Fixed Net-works Program in Bell Labs. He is glob-ally responsible for research on copper andoptical access, access hardware platforms,and access architectures. He received thedegree of Physics Engineer from GhentUniversity (Belgium) in 1986 and a Ph.D.in 1991. After a post-doctoral fellowshipat Tohoku University (Japan), he joined the
research center of Alcatel (now Alcatel-Lucent) in Antwerp,Belgium, in 1993. Since 2009, he is with Bell Labs in MurrayHill, New Jersey. During his career, he subsequently workedon liquid crystal displays, optical interconnections, optical ac-cess, access platforms, access network architectures, and greenaccess networks.
15