Embed Size (px)
Citation preview
Energy diagnosis of a historic building and building simulation Diagnosi energetica e simulazione di un edificio storico FRANCESCA ROBERTI1,2 – DAGMAR EXNER1 – ULRICH FILIPPI OBEREGGER1 – ANDREA GASPARELLA2 1 Institute for Renewable Energy, EURAC research, Bolzano/Bozen, Italy 2 Faculty of Science and Technology, Free University of Bolzano/Bozen, Bolzano/Bozen, Italy
SUMMARY
The energy diagnosis and the energy refurbishment of a historic building are in most of the cases difficult. Not only there are seldom drawings with any constructive indica-tions, but often there are also limited possibilities to investigate the properties of the build-ing envelope because invasive measurements are not allowed. Dynamic simulation mod-els may be used not only to investigate the possible retrofit interventions and to optimize them, but also to improve the energy diagnosis by simulation model calibration and vali-dation from the measured performance.
In this work, we analyzed the “Waaghaus” (weigh house), a historic building located in Bolzano/Bozen (Northern Italy), one of the eight case-studies within the FP7 project 3encult. It is a four storeys XIII century building with thick stone walls and a wooden roof located in the center of the city. The former use during the middle age was to weigh the products before they could go to the market. Today it is unused and without any heating and cooling system, waiting for a complete architectural and energy refurbishment to be-come a photography museum.
This work focuses on the diagnosis of the building’s thermal behavior and on the sensitivity analysis of the simulation model’s parameters. We investigated the properties of the thermal envelope, measured the infiltration rates and equipped the building with a monitoring system measuring the air temperature and relative humidity of some rooms and of some outdoor and indoor surfaces. Then, with all the collected information, we built the energy simulation model of the building with the software EnergyPlus 7.2. After some tuning of the model parameters by graphically comparing the monitored and simu-lated data, we did a sensitivity analysis in order to explore the impact of the model pa-rameters on the errors between monitored and simulated data. The sensitivity analysis has shown that at a building level the thickness of the exterior wall, the constant term coeffi-cient in the infiltration model and the solar transmittance of the windows are the most in-fluencing factors. Other important factors are the material properties of the external wall, the infiltration rates, the window dirt correction factor and the temperature term coeffi-cient in the infiltration model.
683
Edifici di valore storico: progettare la riqualificazioneUna panoramica, dalle prestazioni energetiche alla qualità dell’aria internaHistorical and existing buildings: designing the retrofitAn overview from energy performances to indoor air quality
Roma, 26-27-28 febbraio 2014Rome, 26th-27th-28th February 2014
047_Roberti ok1 19/02/14 17:56 Pagina 683

RIASSUNTO
La diagnosi e la riqualificazione energetica di un edificio storico presentano spesso molte difficoltà dovute non solo alla mancanza di disegni costruttivi o progettuali che dia-no indicazioni sui materiali e sui metodi costruttivi utilizzati, ma anche all´impossibilità di usare tecniche di diagnosi invasive che possano alterare la costruzione originale. I modelli di simulazione energetica possono essere validi strumenti sia per valutare gli effetti di di-versi interventi di riqualificazione e individuarne i migliori, sia per accompagnare e assi-stere la fase di diagnosi attraverso la calibrazione e la validazione del modello partendo delle grandezze misurate.
In questo lavoro è stato analizzato uno degli otto casi studio del progetto FP7 3encult.. Si tratta del “Waaghaus” (Casa della pesa), un edificio di quattro piani situato nel centro storico di Bolzano (Nord Italia) risalente al XIII secolo e costituito da pareti in mu-ratura e tetto in legno. L´edificio era originariamente destinato alla pesa dei prodotti prima del loro accesso al mercato della città. Al momento l´edificio è disabitato, sprovvisto di impianto di riscaldamento e raffrescamento ed in attesa di essere convertito a museo della fotografia dopo una sua completa ristrutturazione.
Questo lavoro si concentra sulla diagnosi delle caratteristiche termiche dell´involucro e sull´ analisi di sensibilità dei parametri di input del modello di simulazio-ne dinamica dell´edificio. Dapprima sono state analizzate le proprietà termiche dell´involucro, sono state misurate le infiltrazioni d´aria esterna ed è stato installato un sistema di monitoraggio che misura la temperatura e l´umidità relativa dell´aria interna di alcune stanze e di alcune superfici. In seguito, sulla base delle informazioni ottenute dalle misurazioni, è stato realizzato il modello dell´edificio utilizzando il software Energyplus 7.2. Dopo un primo confronto grafico tra i dati di monitoraggio e i dati di simulazione è stata fatta una analisi di sensibilità per quantificare l´influenza di diversi parametri sull´errore tra temperature monitorate e misurate. L´analisi di sensibilità ha mostrato come i parametri principali a livello di intero edificio siano lo spessore del muro esterno, il coef-ficiente utilizzato nel modello delle infiltrazioni e la trasmittanza solare delle finestre. Al-tri importanti parametri sono risultati le proprietà dei materiali del muro esterno, la quanti-tà di infiltrazione d´aria esterna, il fattore di correzione dovuto allo sporco sulle finestre ed il coefficiente di temperatura nel modello usato per le infiltrazioni.
Key words: Historic buildings, energy diagnosis, sensitivity analysis
Parole chiave: edifici storici, diagnosi energetica, analisi di sensibilità
1. INTRODUCTION
Energy simulation models are very effective tools to describe the energy behaviour of an existing building and to propose solutions for energy conservation measures. How-ever, the discrepancy between simulated and monitored data can be high due to the large uncertainties of the input data used in the model. For this reason, a more detailed energy diagnosis of an existing building can improve the simulation model. Nevertheless, espe-cially in the case of a historic building, even after the most accurate energy diagnosis there
Energy diagnosis of a historic building and building simulation684
047_Roberti ok1 19/02/14 17:56 Pagina 684

are many uncertainties due to the complexity of the construction (for instance, uncertain-ties in the changing thickness of the external wall along the perimeter). In our work on the Waaghaus, a sensitivity analysis of the model was therefore necessary after the monitor-ing to identify the most important factors affecting errors between monitored and simulat-ed data. By means of a sensitivity analysis, we could rank the parameters according to their effects on the errors. This information can guide either further diagnostic efforts or model calibration steps, adjusting parameter ranges and performing a targeted optimiza-tion on a reduced number of model input parameters.
2. CASE STUDY
The Waaghaus (weigh house), a XIII century building in the historic center of Bol-zano/Bozen (Northern Italy), consists of three full floors, an attic and a basement. All full stores and the basement are built in stone (about 60 to 80 cm thick walls). The top floor has wooden walls and a wooden roof. Until 1780 the building was official seat of the town scales. In the first half of the 20th century, the building was converted into a dwelling house. Only the ground floor was still used for business. All original windows were re-placed during the 1950s/60s by coupled windows. Since the 1990s, the house is vacant. In 2009, it was sold by the municipality of Bolzano to the Foundation “Sparkasse - Cassa di risparmio”. It is going to become a photography museum after its complete architectural and energy refurbishment.
Figure 1 – The "Waaghaus"
3. ENERGY DIAGNOSIS
The energy diagnosis was the starting point for the definition of the simulation pa-rameters of the base model. First, we carried out visual inspections, sampling of materials and an analysis of the stratigraphy of construction elements such as walls, roof and ceil-ings. Then we measured the thermal conductance of the opaque exterior envelope. Both at whole building and at room level, we measured the air change rates by means of the
685
047_Roberti ok1 19/02/14 17:56 Pagina 685

blower door test and did a gas tracing analysis to locate the infiltration losses. In summer 2012, we installed a monitoring system that records the internal air temperatures of repre-sentative rooms and the surface temperatures of representative exterior walls.
3.1. Thermal conductance measurements The conductance of the exterior wall and the ceiling over the porticos was measured
according the technical standard ISO 9869 in two different periods. The results are report-ed in Table I and Table II. In particular, we calculated the thermal conductance of the components with the average method. The required duration of the test depends on the material’s heaviness. We treated the external wall as a heavy construction element and analysed the results with and without the storage effect (see paragraph 7.2 of ISO 9869). The difference between the two has been lower than 5% which is the maximum value al-lowed by the standard.
Table I – Thermal conductance of the exterior wall
Figure 2 – External wall
Table II – Thermal conductance of ceiling above porticos
Figure 3 – Ceiling above porticos
3.2. Measurement of the airtightness The air infiltration rates have a strong impact on the heat exchange of the building.
The standards UNI EN 13289, ASTM E779-10 and ASM 1827-11 describe how to quanti-fy the infiltration rate by using a fan that creates a pressure difference between the interior and the exterior (blower door test). The infiltration rate of the whole building (Table III) and of representative rooms (
Orientation North
Material Solid natural stone Measure-ment period
Dura-tion
Conductance (no storage effects)
Conductance (with storage effects)
29.12.2012-02.01.2013 96 h 1.355 W m-2 K-1 1.371 W m-2 K-1
23.01.2012-28.01-2012 120 h 1.375 W m-2 K-1 1.399 W m-2 K-1
Measurement point
First storey, floor (ceiling over the porticos)
Type Wooden beams filled with earth, sand, wooden boards
Measurement period
Duration Conductance (no storage effect)
23.01.2013-28.01.2013 120 h 0.480 W m-2 K-1
Energy diagnosis of a historic building and building simulation686
047_Roberti ok1 19/02/14 17:56 Pagina 686

Table IV) were measured. The main difficulty in measuring the airtightness of the
whole building was reaching a sufficiently high pressure difference and reaching the sta-bility in the low pressure differences. As the maximum pressure difference obtained was of about 30 Pa (Figure 4and Figure 5), the blower door test was repeated considering only some single rooms, easily reaching the 50 Pa pressure difference required by the EN standard. At room level, gas-tracing analysis was also performed. We saw that the gas leakage occurs mainly through the windows.
Figure 4 – Reading pressures and air changes with overpressure
Figure 5 – Reading pressures and air changes with underpressure
Table III – Airtightness test results with overpressure and underpressure
TEST TYPE Enclosure volume [m³] Air change rate ∼ 50 Pa (EN) [1/h]
Total building without top floor overpressure
1747 9.92 (+-4%)
Total building without top floor underpressure
1747 9.51 (+-3%)
687
047_Roberti ok1 19/02/14 17:56 Pagina 687

Table IV – Airtightness test results for a room on the second floor
Case study room on the second floor Enclosure volume [m³] 52.61
Air change rate @ 50 Pa (ASTM) 6.00 (+-1.5%) Air change rate @ 50 Pa (EN) 6.01 (+-3.0%) Equivalent Leakage Area [cm² @ 10 Pa] 113.23 (+-2.2%) Effective Leakage Area [cm² @ 4 Pa] 59.032 (+-3.8%) C env [m3/hPan] 20.7 n 0.6837
3.3. Monitoring system The indoor air temperatures of representative rooms, the indoor and outdoor surface
temperatures of representative walls, and the outdoor temperature and humidity were rec-orded at timesteps of 1 min. The energy consumption in the Waaghaus is zero as it is va-cant and without any heating or cooling system. The temperatures monitored in summer 2012 by 18 sensors on different floors and with different orientations have been used in this paper for the sensitivity analysis of the simulation model. We could consider only the summer period because the winter data were not available.
4. SIMULATION MODEL AND SENSITIVITY ANALYSIS (SA)
4.1. Sensitivity analysis with the Elementary Effect method The whole building was modelled with the software EnergyPlus 7.2. As outdoor
boundary conditions, on-site measured temperatures and humidities and satellite data of global horizontal and diffuse radiation were used. Further input values were the measured conductance of the exterior wall and of the ceiling over the porticos and the measured air
Energy diagnosis of a historic building and building simulation688
047_Roberti ok1 19/02/14 17:56 Pagina 688
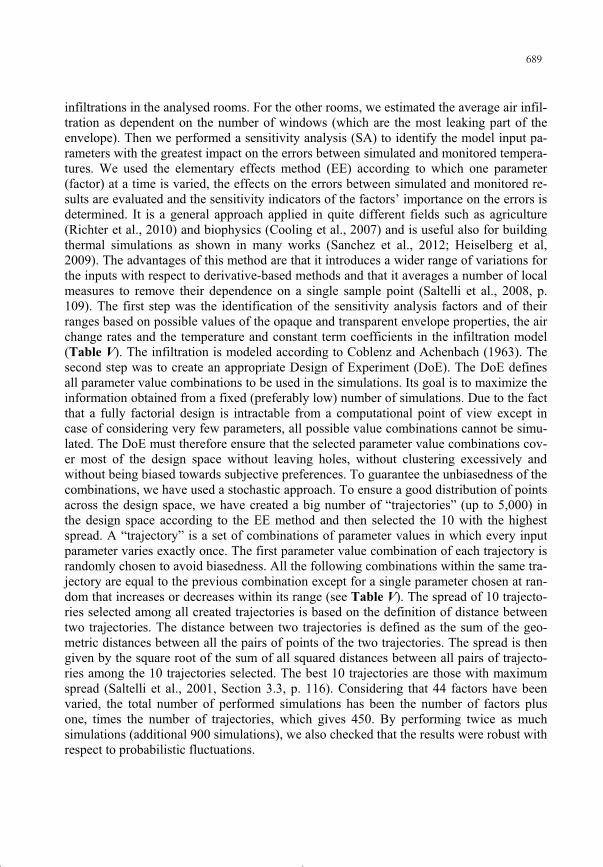
infiltrations in the analysed rooms. For the other rooms, we estimated the average air infil-tration as dependent on the number of windows (which are the most leaking part of the envelope). Then we performed a sensitivity analysis (SA) to identify the model input pa-rameters with the greatest impact on the errors between simulated and monitored tempera-tures. We used the elementary effects method (EE) according to which one parameter (factor) at a time is varied, the effects on the errors between simulated and monitored re-sults are evaluated and the sensitivity indicators of the factors’ importance on the errors is determined. It is a general approach applied in quite different fields such as agriculture (Richter et al., 2010) and biophysics (Cooling et al., 2007) and is useful also for building thermal simulations as shown in many works (Sanchez et al., 2012; Heiselberg et al, 2009). The advantages of this method are that it introduces a wider range of variations for the inputs with respect to derivative-based methods and that it averages a number of local measures to remove their dependence on a single sample point (Saltelli et al., 2008, p. 109). The first step was the identification of the sensitivity analysis factors and of their ranges based on possible values of the opaque and transparent envelope properties, the air change rates and the temperature and constant term coefficients in the infiltration model (Table V). The infiltration is modeled according to Coblenz and Achenbach (1963). The second step was to create an appropriate Design of Experiment (DoE). The DoE defines all parameter value combinations to be used in the simulations. Its goal is to maximize the information obtained from a fixed (preferably low) number of simulations. Due to the fact that a fully factorial design is intractable from a computational point of view except in case of considering very few parameters, all possible value combinations cannot be simu-lated. The DoE must therefore ensure that the selected parameter value combinations cov-er most of the design space without leaving holes, without clustering excessively and without being biased towards subjective preferences. To guarantee the unbiasedness of the combinations, we have used a stochastic approach. To ensure a good distribution of points across the design space, we have created a big number of “trajectories” (up to 5,000) in the design space according to the EE method and then selected the 10 with the highest spread. A “trajectory” is a set of combinations of parameter values in which every input parameter varies exactly once. The first parameter value combination of each trajectory is randomly chosen to avoid biasedness. All the following combinations within the same tra-jectory are equal to the previous combination except for a single parameter chosen at ran-dom that increases or decreases within its range (see Table V). The spread of 10 trajecto-ries selected among all created trajectories is based on the definition of distance between two trajectories. The distance between two trajectories is defined as the sum of the geo-metric distances between all the pairs of points of the two trajectories. The spread is then given by the square root of the sum of all squared distances between all pairs of trajecto-ries among the 10 trajectories selected. The best 10 trajectories are those with maximum spread (Saltelli et al., 2001, Section 3.3, p. 116). Considering that 44 factors have been varied, the total number of performed simulations has been the number of factors plus one, times the number of trajectories, which gives 450. By performing twice as much simulations (additional 900 simulations), we also checked that the results were robust with respect to probabilistic fluctuations.
689
047_Roberti ok1 19/02/14 17:56 Pagina 689

Table V – Factors used for the SA
Factors Range External wall thickness: thickn_ext_wall (m) 0.4 – 0.8 External wall conductivity: cond_ext_wall (W/mK) 0.75 – 1.1 Exterior wall density: dens_ext_wall (kg/m3) 1500 – 1200 Exterior wall specific heat: spec_heat_ext_wall (J/kgK) 700 – 1000 Roof insulation conductivity: cond_min_wool (W/mK) 0.75 – 1.1 Partition wall thickness: thickn_part_wall (m) 0.2 – 0.4 Partition wall conductivity: cond_part_wall (W/mK) 0.75 – 1.1 Partition wall specific heat: spec_heat_part_wall (J/kgK) 700 – 1000 Roof insulation density: dens_min_wool (kg/m3) 12 –100 Roof insulation specific heat: spec_heat_min_wool (J/kgK) 700 – 1000 Air infiltrations for each zone: ainf_zonename (m3/s) +-30% from the measured values Constant term coefficient for the air changes: const_coeff 0.606 – 1 Temperature coefficient for the air changes: temp_coeff 0 – 0.03636 Window glass solar transmittance: sol_trans_glass 0.6 – 0.95 Window glass dirty correction factor: dirt_corr 0.5 – 1 Window frames conductance: frame_cond (W/m2K) 2.0 – 3.0 Window divider conductance: div_cond (W/m2K) 2.0 – 4.0
As an example, we reported in Table VI the first three combinations of the first trajec-
tory of our DoE. The first combination is randomly generated, the second combination is equal to the first one except for the air infiltrations in room f2NW (second floor, north-west-oriented), the third combination is equal to the second one except for the air infiltra-tions in room f0E (ground floor, east-oriented).
Table VI – Combinations of the 1st and 2nd trajectory
Traj Comb. Factor values 1 1 cond_min_wool = 0.6766 ainf_f2NW=0.0383 ainf_f0E=0.1651… 1 2 cond_min_wool = 0.6766 ainf_f2NW=0.0265 ainf_f0E=0.1651… 1 3 cond_min_wool = 0.6766 ainf_f2NW=0.0265 ainf_f0E=0.1143… 2 1 cond_min_wool = 0.6766 ainf_f2NW=0.0324 ainf_f0E=0.0889…
The elementary effect (EE) of a factor on the simulation model calibration is defined
as:
where is the error between simulated and monitored data as quantified by a metric (see the following paragraph) and and are two consecutive parameter value combina-tions contained in the DoE that differ only by the -th factor value. Such a single elemen-tary effect associated with a factor is obtained for each trajectory . The mean elemen-tary effect associated with a factor is then given by the average of the single elementary effects associated with that factor:
Energy diagnosis of a historic building and building simulation690
047_Roberti ok1 19/02/14 17:56 Pagina 690

where indicates the number of trajectories (10 in our case). In addition to the sensitivity indicator it is interesting to calculate also which is the absolute mean of the single elementary effects associated with factor , and , the variance of the elementary effects associated with factor .
4.2. Metric used to evaluate the errors between monitored and simulated data The SA was carried out considering the effects of the parameters on the difference
between simulated and monitored data. To evaluate this difference, metrics are needed. To assess systematic errors such as vertical offsets between simulated and measured data, we have computed the mean absolute error (MAE):
denotes the monitored quantity and the simulated quantity at time .
We computed the MAE for each sensor in the building. We also computed this met-ric for the whole building, where the temperature in the building has been calculated as average of the temperatures in the single monitored zones weighted on the surfaces.
4.3. Sensitivity (SA) analysis results Figure 6 illustrates the influence of the different factors on the MAE as measured by
the mean absolute effect . The light grey columns are related to the air temperature of the sensor AT f1SE located southeast on the 1st floor, the dark grey ones are related to the surface temperature sensor ST f2pNEoS located northeast on the 2nd floor and south-oriented. For the AT f1SE, we can observe that, by varying the air infiltrations of the zone within the range described in Table V, the MAE changes by an absolute mean of 0.23 K. Other important parameters impacting the air temperature are the window properties, the coefficients related to the air infiltrations and the properties of the external wall. On the other hand, we can see that for the ST f2pNEoS the most influencing factors are the win-dow and external wall properties, while the air infiltrations are less influencing.
691
047_Roberti ok1 19/02/14 17:56 Pagina 691

Figure 6 – star values for a surface temperature (ST) and an air temperature (AT) sensor
To evaluate the simulation model at building level, we analyzed the influence of the
factors on the MAE of the mean air temperature across all monitored zones (Figure 7). We can see that the most influencing factors are the thickness of the exterior wall, followed by the material properties of the exterior wall and the window properties. The air infiltrations of the zones that have not been monitored show up as less influencing than those of the monitored zones because they don´t act directly on the temperature sensors.
Figure 7 – star values for all monitored zones
Energy diagnosis of a historic building and building simulation692
047_Roberti ok1 19/02/14 17:56 Pagina 692

To better understand how the MAE varies, we also calculated the mean effect and the standard deviation across all monitored zones (Figure 8). The thickness of the exter-nal wall, the constant term coefficient and the solar transmittance are the most influencing factors and have a positive mean effect on the MAE. This means that an increase in one of these parameters corresponds to an increase in the MAE (that is, an increase of the mean absolute difference between simulated and monitored data; in other words, the calibration gets worse). Instead, the conductivity of the exterior wall has a negative mean effect on the MAE. This means that the MAE decreases if the conductivity of the exterior wall in-creases (that is, the mean difference between simulated and monitored data decreases and the calibration gets better). The standard deviation describes the interaction between the different factors and/or nonlinearities in the behavior of the factor itself. To a higher standard deviation corresponds a higher dependence of the factor on the other factors and/or a higher nonlinearity in its behavior. For instance, the effect of the constant term coefficient on the calibration strongly depends on the values of the other parameters. This can be expected as the constant term coefficient is a multiplier in the infiltration model and thus depends on the air infiltration rates of all zones.
Figure 8 – Mean effect and standard deviation of effects that the simulation model input parameters have
on the MAE across all monitored zones
CONCLUSIONS
We performed an energy diagnosis following a monitoring survey to investigate the free floating behavior of an existing historic building. We developed a simulation model with the software EnergyPlus 7.2 to assess the proposed refurbishment solutions. To iden-tify the key parameters governing the distance between monitoring and simulation, we did a sensitivity analysis according to the Elementary Effects method. We varied 44 parame-ters 10 times (10 trajectories), for a total number of 450 simulations. Calculating the mean absolute effect of the single factor on the mean absolute error between monitoring and
693
047_Roberti ok1 19/02/14 17:56 Pagina 693

simulation, we identified the parameters with the greatest impact on single monitored zones as well as on all monitored zones. Important parameters were the external wall thickness and material properties, the air infiltration rates, the infiltration model coeffi-cients and the window properties. Through the analysis of the mean effect on the MAE and the effects’ standard deviation , we were able to deduce informed decisions on how to improve the calibration of the simulation model. As an example, by shifting the range for the thickness of the external wall towards lower values and by shifting the range for the thermal conductivity of the external wall towards higher values there is a good chance that the MAE will increase and hence the calibration will improve. Furthermore, the con-stant term coefficient in the infiltration model, the solar transmittance of the glass and the thickness of the exterior wall are strongly related to the other parameters of the sensitivity analysis regarding their effects on the calibration. This also means that separately optimiz-ing the range of each parameter will not be enough to obtain a satisfying calibration. The information obtained through the SA will be advantageously used in the further work of optimization to find the best values for the simulation model parameters.
ACKNOLEDGEMENTS
The research leading to these results has received funding from the European Union Seventh Framework Program (FP7/2007-2013) under GA n° 260162, project 3encult.
REFERENCES
Coblenz, C. W. and Achenbach, P. R. 1963. Field Measurement of Ten Electrically-Heated Houses. ASHRAE Transactions, 358-365.
Cooling M., Hunter P., Crampin E.J.. 2007. Modeling hypertrophic ip3 transients in the cardiac myocyte. Biophysical Journal 93 3421-3433.
Heiselberg P., Brohus H., Hesselholt A., Rasmussen H., Seine E., Thomas S. 2009. Application of sensitivity analysis in design of sustainable buildings. Building and Urban Sustainability, 34, (9), 2030-2036.
Richter G., Acutis M., Trevisiol P., Latiri K., Confalonieri R. 2010. Sensitivity analysis for a complex crop model applied to durum wheat in the Mediterranean. European Journal of Agronomy, 32, (2), 127-136.
Sanchez Garcia D., Lacarriére B., Musy M., Bourges B. 2012. Application of sensitivity analysis in building energy simulations: Combining firstand second-order elementary effects methods. Energy and Buildings. http://dx.doi.org/10.1016/j.enbuild.2012.08.048.
Saltelli, A., Ratto, M., Andres, T., Campolongo, F., Cariboni, J., Gatelli, D., Saisana, M. and Tarantola, S. 2008. Global Sensitivity Analysis. The Primer. John Wiley & Sons, Ltd, UK, 116.
ISO. 1994 ISO 9869:1994 “Thermal insulation – Building elements – In-situ meas-urement of thermal resistance and thermal transmittance”.
UNI. 2002. UNI EN 13289:2002 “Prestazione termica degli edifici – determinazio-ne della permeabilità all´aria degli edifici. Metodo di pressurizzazione mediante ventila-
Energy diagnosis of a historic building and building simulation694
047_Roberti ok1 19/02/14 17:56 Pagina 694

tore”, from the EN 13829:2000 “Thermal performance of buildings. Determination of air permeability of buildings. Fan pressurization method”.
ASTM. 2010. ASTM E779 – 10 “Standard test method for determining air leakage rate by fan pressurization”.
ASTM. 2011. ASTM E1827 – 11 “Standard test methods for determining airtight-ness of buildings using an orifice blower door”.
695
047_Roberti ok1 19/02/14 17:56 Pagina 695