Embed Size (px)
Citation preview
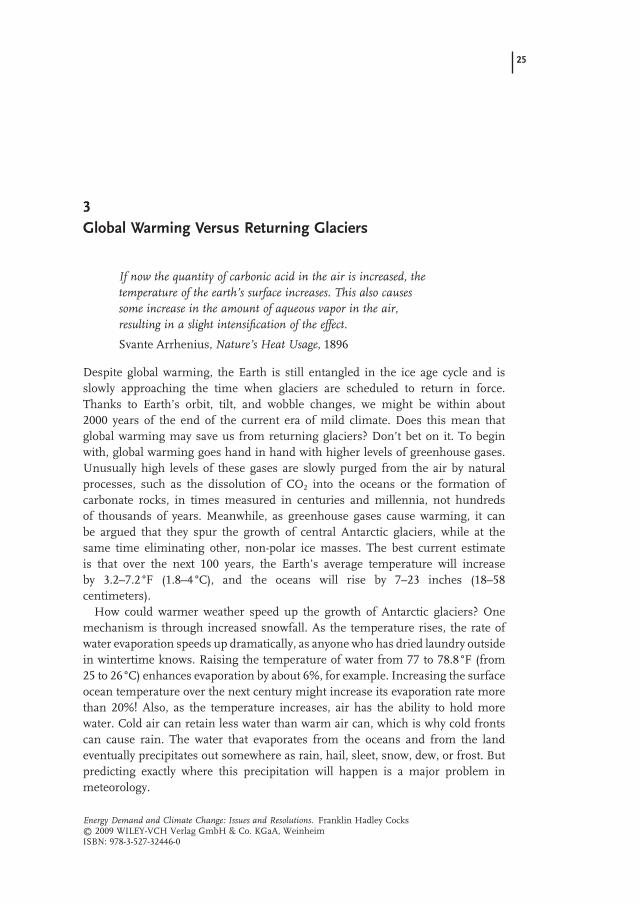
Global Warming Versus Returning Glaciers
25
Energy Demand and Climate Change: Issues and Resolutions. Franklin Hadley Cocks© 2009 WILEY-VCH Verlag GmbH & Co. KGaA, WeinheimISBN: 978-3-527-32446-0
3
If now the quantity of carbonic acid in the air is increased, the temperature of the earth ’ s surface increases. This also causes some increase in the amount of aqueous vapor in the air, resulting in a slight intensifi cation of the effect.
Svante Arrhenius, Nature ’ s Heat Usage , 1896
Despite global warming, the Earth is still entangled in the ice age cycle and is slowly approaching the time when glaciers are scheduled to return in force. Thanks to Earth ’ s orbit, tilt, and wobble changes, we might be within about 2000 years of the end of the current era of mild climate. Does this mean that global warming may save us from returning glaciers? Don ’ t bet on it. To begin with, global warming goes hand in hand with higher levels of greenhouse gases. Unusually high levels of these gases are slowly purged from the air by natural processes, such as the dissolution of CO 2 into the oceans or the formation of carbonate rocks, in times measured in centuries and millennia, not hundreds of thousands of years. Meanwhile, as greenhouse gases cause warming, it can be argued that they spur the growth of central Antarctic glaciers, while at the same time eliminating other, non - polar ice masses. The best current estimate is that over the next 100 years, the Earth ’ s average temperature will increase by 3.2 – 7.2 ° F (1.8 – 4 ° C), and the oceans will rise by 7 – 23 inches (18 – 58 centimeters).
How could warmer weather speed up the growth of Antarctic glaciers? One mechanism is through increased snowfall. As the temperature rises, the rate of water evaporation speeds up dramatically, as anyone who has dried laundry outside in wintertime knows. Raising the temperature of water from 77 to 78.8 ° F (from 25 to 26 ° C) enhances evaporation by about 6%, for example. Increasing the surface ocean temperature over the next century might increase its evaporation rate more than 20%! Also, as the temperature increases, air has the ability to hold more water. Cold air can retain less water than warm air can, which is why cold fronts can cause rain. The water that evaporates from the oceans and from the land eventually precipitates out somewhere as rain, hail, sleet, snow, dew, or frost. But predicting exactly where this precipitation will happen is a major problem in meteorology.
26 3 Global Warming Versus Returning Glaciers
Nobody suggests that global warming will raise the temperature in Antarctica above freezing in winter. Increased atmospheric humidity due to enhanced evapo-ration from the oceans has already led to higher snowfall across central Antarctica. Normally, Antarctic air is extremely dry, drier even than desert air in Arabia. What little snow falls in Antarctica, however, is mostly retained from one season to the next. A little snow sublimes, turning directly from solid ice into vapor without melting, just as the ice cubes left in a freezer tray slowly decrease in size over a long time due to the same solid - to - vapor process, but this effect is small compared to increased snowfall. As ocean temperatures rise, more water evaporates, and in Antarctica snowfalls could reach levels higher than they are now. Growth of the central glaciers in Antarctica counteracts the increase in the volume of ocean water resulting from higher water temperatures and the melting of non - Antarctic ice. Currently, the total mass of Antarctic ice is actually growing larger due to increased snowfall, even as big icebergs keep breaking off, especially from the West Antarctic ice sheet, which extends below sea level and shows signs of breaking up. At the same time, Arctic ice is decreasing, and the snows of Mt. Kilimanjaro and most of the non - polar glaciers in the Alps, New Zealand, Canada, South America, and Alaska are visibly receding as year - round temperatures increase. The accumulation of more ice and snow in central Antarctica, at least for the next 100 years, is not expected to outdo the melting of Arctic ice and non - polar glaciers or the expansion of warming ocean water, so the ocean level will keep rising.
Most Arctic ice is fl oating on water. When fl oating ice melts, the ocean level does not increase, because fl oating ice displaces as much water as it produces by melting. The warming of the air and oceans appears to be melting fl oating Arctic ice during summer from both the top and bottom. The decrease in fl oating Arctic ice exposes increasing areas of the Arctic Ocean to sunlight. Water absorbs much more sunlight than snow and ice do, and the higher evaporation rate from ice - free seawater might cause greater snowfall across the northern polar regions, produc-ing larger snowfi elds that refl ect more sunlight. Could the snowfall become so great that ground snow cover could persist through the brief northern summer at lower latitudes? Nobody knows for sure.
Higher planetary temperatures and melting ice might alter major ocean cur-rents, especially the Gulf Stream. The infl ux of large quantities of fresh water from melting glaciers in Greenland would lower the salinity of northern oceans, espe-cially in the North Atlantic, which in turn could change the northward fl ow pattern of salty, tropical water and reroute its return path through the deep ocean back toward the equator. The disappearance of the Gulf Stream would make large parts of Europe much colder, even though the west - to - east wind pattern helps in keeping the weather in northern Europe milder than in similar latitudes in eastern North America. Whether global warming will fi nally end up increasing or decreasing glaciers in Antarctica, there is little consensus as to exactly what changes at the South Pole might mean for the global climate.
There is no denying the fact that the Earth is warming up. Since 1900, global temperature data show convincingly that the Earth ’ s average temperature has risen at least 1.3 ° F (0.7 ° C) over the 20 th century, and temperature increases over the 21 st
27
century will likely be from 2.5 to about 5 times higher. Why is this change in global climate happening? Let ’ s take a look fi rst at the basic scientifi c question of the rate of energy leaving the Earth and how the composition of the atmosphere affects it. It turns out that the transparency of the atmosphere to infrared radiation is a critical factor.
Infrared Radiation and Absolute Temperature
The Austrian physicist Ludwig Boltzmann (1844 – 1906) was an outstanding but tragic fi gure in the science of thermodynamics. He was able to prove, by mathe-matical reasoning alone, that the rate at which energy radiates from the surface of anything increases as the fourth power of its absolute temperature. This result turns out to be of great importance in understanding global warming. Boltzmann combined statistical mechanics with probability theory to deduce the fundamental thermodynamic laws. Unfortunately, his hidebound thermodynamic contempo-raries disparaged his pioneering work, so that, suffering from illness and depres-sion, he took his own life. His tombstone in Vienna is engraved with the equation S = k log W , which he deduced in 1896 for the relation between the logarithm of probability, W , and entropy, S , a fundamental factor relating to the unavailable energy in a thermodynamic system. In this equation, the proportionality factor, k , between these two is now known as the Boltzmann constant.
The absolute temperature scale that Boltzmann used in determining the tem-perature dependence of emitted radiation is based on the fact that the temperature of anything can never be less than − 459.67 ° F ( − 273.15 ° C). This lowest possible temperature is defi ned as absolute zero, or the temperature at which molecular motion ceases. Above absolute zero, Boltzmann showed that everything, including people, the Earth, and all else, emits radiation in rapidly increasing amounts as the temperature rises.
We have already mentioned in Chapter 2 how the very strong dependence of radiated energy on absolute temperature affects the output of the sun during the sunspot cycle. For things that have a temperature of less than about 1000 ° F (538 ° C), the energy that is radiated away is almost entirely invisible infrared heat. Electric heating coils on a stove appear dark even though they can still burn you. The current average temperature of the Earth is about 59 ° F (15 ° C). At this tem-perature the infrared wavelength it emits at the greatest rate is about 10,000 nanometers (0.00001 meters), approximately 20 times the wavelength of visible light and far beyond the range of human vision. The wavelength the sun emits at its maximum rate is about 460 nanometers, near the maximum sensitivity portion of the human vision range (green light), which is not surprising because our eyes have evolved over millions of years to utilize sunlight effi ciently.
The vast bulk of the sun ’ s energy is delivered at wavelengths within the range of 100 to 1000 nanometers. This range includes both ultraviolet light (about 400 nanometers or less) and infrared light (about 700 nanometers or more). The human eye can only see light in between these two limits, 400 to 700 nanometers,
Infrared Radiation and Absolute Temperature
28 3 Global Warming Versus Returning Glaciers
so a large part of the light from the sun is invisible to us. How was this invisible light discovered? Two developments made this discovery possible. Newton observed that a prism could separate sunlight into a rainbow of colors and that a second prism could restore these colors again to normal white light, as described in his book on optics (published in 1704 when he was 62). Galileo is credited with inventing the thermometer in 1592 when he was 27 years old (it was not until 17 years later that he turned a telescope toward the heavens). Combining Newton ’ s prism with Galileo ’ s thermometer, others attempted to measure the temperatures generated by the different colors of light. Surprisingly, it was discovered that the temperature in the rainbow spectrum produced by a prism kept going up even beyond the last visible red light of the solar spectrum. There is a lot of energy in the invisible, infrared portion of the solar spectrum, and this invisible part of sunlight helps to warm the Earth (and old men sleeping in the sun), even though it cannot be seen. In a similar fashion, the invisible long - wavelength (around and above 10,000 nanometers) infrared radiation given off by the Earth carries energy away from the Earth. To do this, however, it must fi rst pass through the atmo-sphere, which itself radiates infrared heat. This is where carbon dioxide (CO 2 ), water vapor (H 2 O), and methane (CH 4 ) affect the Earth ’ s temperature. All of these gases, as well as some others, such as the chlorofl uorocarbons used as refrigerants and nitrous oxide from automobile exhaust, strongly absorb portions of the infra-red radiation emitted from the Earth and prevent its escaping into space. As we shall see, the fact that these gases absorb somewhat different portions of infrared light turns out to be critically important.
Greenhouse Gases and Global Warming: Fourier, Tyndall, and Arrhenius
Jean - Baptiste Fourier (1768 – 1830), French physicist and mathematician, began life as the orphaned son of a tailor. His low social standing prevented him from joining the artillery corps, so he turned his attention to mathematics and was eventually appointed to the Chair of Analysis at the É cole Polytechnique in Paris. In 1798 he accompanied Napoleon to Egypt and for a time was the governor of Lower Egypt. He is best known for the analytical method that bears his name. By means of Fourier analysis, mathematical functions may be represented, to any desired degree of accuracy, by series of sine and cosine functions – the longer the series, the greater the accuracy. Fourier ’ s interest in physics, especially the tem-perature of the Earth, led him to propose, correctly, that the atmosphere acts to increase the Earth ’ s temperature. He recognized that air is more transparent to the sun ’ s rays than to the “ non - luminous heat ” radiated by the Earth.
The instruments of Fourier ’ s day were not suffi cient for him to progress much further in this concept, so it wasn ’ t until decades later that the Irish physicist John Tyndall (1820 – 1893) began to quantify Fourier ’ s concept. Tyndall showed experi-mentally that water vapor and carbon dioxide absorb infrared radiation far more strongly than do the oxygen and nitrogen in our atmosphere. This is why tempera-ture usually drops faster on clear nights than on cloudy ones and why water vapor
29
can freeze as frost on grass during clear nights, even when the temperature of the air a meter or two (a few feet) over the ground is above freezing. Radiation cooling can produce a big drop in air temperature near the ground, if the air is still.
The fact that the absorption of infrared radiation by water vapor and carbon dioxide strongly affects different regions of the long - wave infrared spectrum was not known in Tyndall ’ s day. Decades later the Swedish scientist Svante Arrhenius (1859 – 1927) suggested that a higher level of CO 2 in the atmosphere could raise the temperature of the Earth by absorbing a portion of the long - wave infrared radiation emitted by the Earth, preventing part of this radiation from escaping into space. He viewed the resulting global warming as a good thing that would very likely make the Swedish climate milder.
Arrhenius ’ suggestion at fi rst elicited an enthusiastic response because of his scientifi c renown and the interest in ice ages, which was very high at that time. In those days, however, measurements of the infrared absorption spectra of H 2 O and CO 2 seemed to show that these spectra completely overlapped each other. Because there is vastly more H 2 O than CO 2 in the atmosphere, it was decided that the effect of more carbon dioxide would be very small compared to that of water vapor.
CO 2 and Methane
Not until the 20 th century did long - wave infrared measurements become refi ned enough to show that the infrared absorption maxima of CO 2 and CH 4 actually included different ranges of the infrared than did that of H 2 O. As a result, the effect of carbon dioxide and methane is not overwhelmed by water vapor, and both are important absorbers of the Earth ’ s infrared radiation all by themselves. Methane, which molecule for molecule is a much stronger absorber of infrared radiation than is water vapor or carbon dioxide, does not last for extended times in the atmosphere because it is chemically very active. Carbon dioxide lasts a lot longer because it is much more chemically inert than methane. This is why CO 2 is used in fi re extinguishers and why methane, the main component of natural gas, is burned to heat homes and offi ces. Methane reacts in the air with oxygen over times measured in years to produce CO 2 and water vapor. Carbon dioxide is removed from the atmosphere by plants or dissolves into the oceans in times measured in years, decades, and centuries, or even millennia in the case of its reaction with rocks. The study of the life cycle of planetary CO 2 is not a settled matter, but there is no doubt that it lasts a lot longer in the air than methane does.
Carbon dioxide dissolves in water and seawater to form carbonic acid and other carbon - containing chemical species. Such waterborne carbon compounds can be preserved for very long periods of time when they react to form carbonate miner-als, such as limestone, or are used by mollusks to form seashells. Water vapor, which is also a greenhouse gas, comes and goes as rain, snow, etc., but is con-stantly replenished by evaporation. Increasing atmospheric water vapor, carbon dioxide, and methane all act to keep the Earth warm by slowing up the loss of energy as infrared radiation. These gases are called “ greenhouse gases ” because
CO2 and Methane
30 3 Global Warming Versus Returning Glaciers
they increase the temperature of the Earth by preventing some of the Earth ’ s infrared radiation from escaping, in a way somewhat analogous to the glass in a greenhouse blocking infrared radiation from warm plants and soil from escaping but letting in sunlight. Carbon dioxide increases the temperature by transmitting sunlight while at the same time absorbing infrared radiation on its way out from the Earth into space. When CO 2 molecules themselves emit infrared radiation, they do so in all directions, downward toward the Earth as well as upward into space. The infrared radiation they absorb, however, is mostly headed upward. Also, the temperature of the upper air is lower than air near the surface, so the infrared radiation that the upper air emits is reduced in proportion to the fourth power of its temperature, as Boltzmann proved is the case for all things. The warming effect of CO 2 has been calculated in detail, and there can be no doubt about its critical infl uence on global temperature. Diffi culties arise mainly in predicting the exact extent of this warming and what it means for future global weather patterns. After all, the weather predictions for even next week are not all that accurate.
It may be conceptually useful to consider that the CO 2 added to our air by the combustion of fossil fuel yields the same warming (other things like cloud cover staying the same) that would happen if the Earth ’ s orbit were somehow magically moved closer to the sun. If the CO 2 level in the air is considered by itself, and if this CO 2 level doubles from where it is now to about 800 parts per million by volume (ppmv), its warming effect would be equivalent to about a 2% increase in incident sunlight energy, assuming the Earth ’ s average albedo stays constant. Because the rate of increase in CO 2 is itself rising, it may take only about 50 years to double the amount of CO 2 in the air. Doubling present CO 2 levels can increase the Earth ’ s temperature about the same amount as magically moving the Earth ’ s orbit about 1,400,000 miles (2,250,000 kilometers) closer to the sun. Thinking about the global warming effect of CO 2 in terms of moving closer toward the sun gives the global warming effect of CO 2 a physical perspective that may be easier to envision than its effect on infrared absorption.
A very large body of literature has developed concerning global warming. The result of this warming will affect everyone. The melting of non - polar glaciers will increase sea levels, as will the expansion of ocean water as it warms and its density becomes lower. On the other hand, an increase in the amount of ice in central Antarctica will decrease the size of the oceans. Storms, especially hurricanes, which derive their enormous energy from warm ocean water, can become more numerous and more severe as ocean temperatures increase. On the other hand, changing upper atmosphere wind shear might decrease hurricane activity, as it did in the 2006 hurricane season, by cutting the tops off developing storms. Patterns of rainfall may shift and change. Determining what will happen in detail is beyond the limit of our current ability. But it is certain that something will happen, and this something might be very bad.
Most threatening is the potential for runaway effects that lead to uncontrollable global warming. For example, the release of methane from the ground increases when permafrost melts, and rising temperature thaws ever - deeper permafrost layers, releasing more methane. This new methane enhances warming, leading
31
to more methane release, and so on, and so on. Methane also exists in a solid, hydrated form under parts of the seabed. Because solid hydrated methane is actu-ally less dense than seawater, it will fl oat to the surface if dislodged. Once at the surface, and no longer under the pressure of the ocean, it sublimes, forming methane gas plus water. If the temperature of the water in the deep ocean increases, methane hydrates can also decompose under water, and the resulting methane gas will bubble to the surface. Methane plumes have been reported in the East Siberian Sea. If solid methane hydrates begin to decompose, the resulting uncon-trolled and massive methane release could be very bad indeed. Some have specu-lated that sudden increases in atmospheric methane may have contributed to mass extinctions in the past. A meteor impacting the deep seabed could cause the release of massive amounts of methane.
In addition to methane, higher humidity also boosts absorption of infrared radiation by the atmosphere, generating greater warming and more water evapora-tion, which leads to still more warming. As the oceans warm up, they also evapo-rate water faster, leading to increased global warming. Warm ocean water holds less carbon dioxide than cold water, as anyone who has opened a carbonated soda bottle warmed in the sun knows. Release of even a small fraction of the CO 2 in the oceans would lead to dramatically increased global temperatures and the release of even more dissolved CO 2 . The mass of water in the oceans is more than 250 times the mass of air in the atmosphere. Estimates vary, but there is probably more than 30 times as much carbon stored in ocean water as there is in the atmo-sphere. If this carbon begins to be released as CO 2 as the oceans warm up, things could get out of hand. Self - amplifying (so - called positive feedback) effects might easily develop beyond human ability to stop them. The planet Venus illustrates just how far out of hand global warming can get. Its dense atmosphere is 96% CO 2 , producing a surface temperature so high it can melt lead. That ’ s global warming in spades. The temperature on Venus can be higher than on Mercury, which is about twice as close to the sun, but its atmosphere is very thin and con-tains only a trace of CO 2 .
On Earth, higher CO 2 levels and diminished snowfi eld and glacier sizes reduce the sunlight refl ected back into space and the energy radiated away from the Earth, thereby boosting planetary temperature. On the other hand, some effects induced by global warming might act to decrease warming (so - called negative feedback). Greater snowfall in Antarctica tends to lower the level of the oceans. The increased formation of large, white, puffy water vapor clouds that refl ect lots of sunlight could lower the global temperature. Feedback effects, whether positive or negative, can be subtle, complicated, and diffi cult to calculate, much less control. This is what makes them treacherous.
The Big Picture
Fire, the gift of Prometheus, may indeed prove to be deadly by relentlessly driving upward the CO 2 level in our atmosphere via the ever - increasing combustion of
The Big Picture
32 3 Global Warming Versus Returning Glaciers
fossil fuel to power the world ’ s growing economy. From the years 1000 to 1800, the level of CO 2 in the air remained relatively constant, at about 280 ppmv (parts per million by volume of dry air). Analysis of air trapped in glacial ice has proven that there is a fundamental correlation between the level of CO 2 and global tem-perature over hundreds of thousands of years. During the past 1000 millennia, CO 2 varied from just under 200 to about 300 ppmv. At the same time, the average temperature varied by about 18 ° F (10 ° C), with the low temperatures correspond-ing very closely with CO 2 levels below 200 ppmv and the highest temperatures corresponding to CO 2 levels of just about 300 ppmv. The question is, did the chang-ing CO 2 level drive the temperature, or did the changing temperature drive the CO 2 level?
One clue to the answer is the cyclic nature of ice ages and the concomitant changes in the Earth ’ s tilt, wobble, and elliptical orbit discussed in the previous chapter. The Earth ’ s geological temperature matches well with the warming – cooling cycles predicted by Croll and Milankovi . The higher CO 2 levels found in ice cores correlate with global temperature increases. It is very likely that these CO 2 increases result from the planetary temperature variations caused by chang-ing planetary tilt, wobble, and orbit effects. Of course, an ice age will affect plant growth, and plants consume CO 2 , but dead plants yield most of their stored carbon back to the atmosphere as CO 2 when they rot. If dead vegetation turns into coal, oil, or natural gas, then the carbon in plants is sequestered and stored for eons. In the normal cycle of plant growth, death, and decay, the carbon that plants contain is continually recycled. Seashells, because of their calcium carbonate content, can also sequester carbon dioxide for eons. Carbonic acid in rain interact-ing with rocks also sequesters carbon for a very long time.
The geological processes that produce fossil fuels take millions of years to develop, far longer than the 100,000 - year ice age cycle. A rapidly acting (geologi-cally speaking) carbon cycle that depends on temperature is needed to explain how global CO 2 levels can closely track ice ages. The most obvious answer is the fact that CO 2 dissolves better in cold water than in hot water. The colder seawater that existed during global ice ages would have more capacity to take up CO 2 from the atmosphere than the warmer ocean water that accompanies global warming. Because atmospheric CO 2 can grow by the warming of the oceans as global tem-perature goes up, what can we expect now that the massive burning of fossil fuels is boosting the level of CO 2 in our atmosphere all by itself and the temperature of the oceans is also rising? Let ’ s look at recent atmospheric CO 2 numbers and see if we can draw some conclusions.
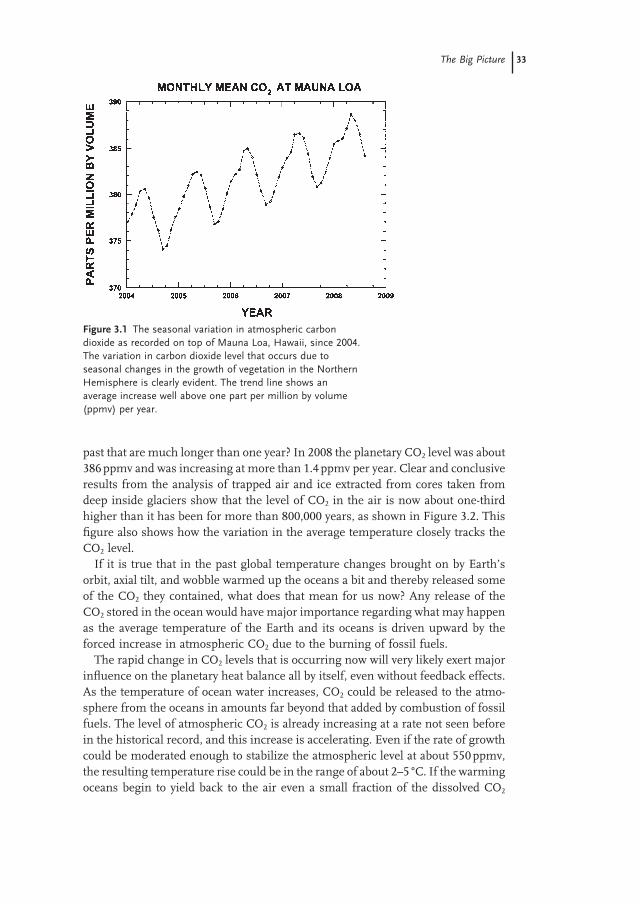
Figure 3.1 shows just how dramatic the current rate of increase in atmospheric carbon dioxide really is.
The annual fl uctuation of atmospheric carbon dioxide can be seen from data measured at the monitoring station on top of Mauna Loa. This very evident sea-sonal variation occurs due to seasonal changes in the Northern Hemisphere, when trees are either growing or dormant. When trees and plants stop growing in winter months, carbon dioxide in the atmosphere increases, and when spring comes it fl uctuates downward again. The upward trend is obvious. What about times in the
33
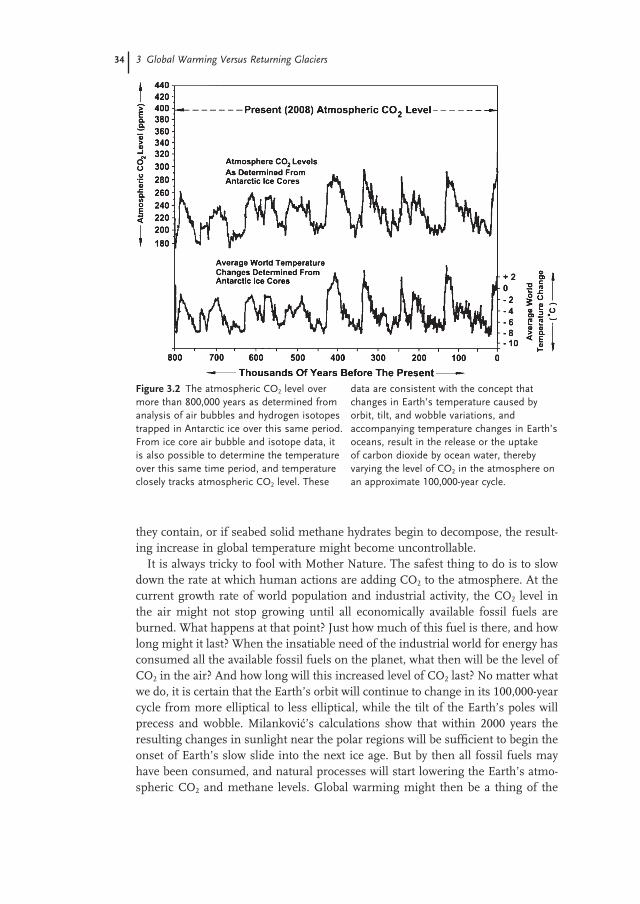
past that are much longer than one year? In 2008 the planetary CO 2 level was about 386 ppmv and was increasing at more than 1.4 ppmv per year. Clear and conclusive results from the analysis of trapped air and ice extracted from cores taken from deep inside glaciers show that the level of CO 2 in the air is now about one - third higher than it has been for more than 800,000 years, as shown in Figure 3.2 . This fi gure also shows how the variation in the average temperature closely tracks the CO 2 level.
If it is true that in the past global temperature changes brought on by Earth ’ s orbit, axial tilt, and wobble warmed up the oceans a bit and thereby released some of the CO 2 they contained, what does that mean for us now? Any release of the CO 2 stored in the ocean would have major importance regarding what may happen as the average temperature of the Earth and its oceans is driven upward by the forced increase in atmospheric CO 2 due to the burning of fossil fuels.
The rapid change in CO 2 levels that is occurring now will very likely exert major infl uence on the planetary heat balance all by itself, even without feedback effects. As the temperature of ocean water increases, CO 2 could be released to the atmo-sphere from the oceans in amounts far beyond that added by combustion of fossil fuels. The level of atmospheric CO 2 is already increasing at a rate not seen before in the historical record, and this increase is accelerating. Even if the rate of growth could be moderated enough to stabilize the atmospheric level at about 550 ppmv, the resulting temperature rise could be in the range of about 2 – 5 ° C. If the warming oceans begin to yield back to the air even a small fraction of the dissolved CO 2
Figure 3.1 The seasonal variation in atmospheric carbon dioxide as recorded on top of Mauna Loa, Hawaii, since 2004. The variation in carbon dioxide level that occurs due to seasonal changes in the growth of vegetation in the Northern Hemisphere is clearly evident. The trend line shows an average increase well above one part per million by volume (ppmv) per year.
The Big Picture
34 3 Global Warming Versus Returning Glaciers
they contain, or if seabed solid methane hydrates begin to decompose, the result-ing increase in global temperature might become uncontrollable.
It is always tricky to fool with Mother Nature. The safest thing to do is to slow down the rate at which human actions are adding CO 2 to the atmosphere. At the current growth rate of world population and industrial activity, the CO 2 level in the air might not stop growing until all economically available fossil fuels are burned. What happens at that point? Just how much of this fuel is there, and how long might it last? When the insatiable need of the industrial world for energy has consumed all the available fossil fuels on the planet, what then will be the level of CO 2 in the air? And how long will this increased level of CO 2 last? No matter what we do, it is certain that the Earth ’ s orbit will continue to change in its 100,000 - year cycle from more elliptical to less elliptical, while the tilt of the Earth ’ s poles will precess and wobble. Milankovi ’ s calculations show that within 2000 years the resulting changes in sunlight near the polar regions will be suffi cient to begin the onset of Earth ’ s slow slide into the next ice age. But by then all fossil fuels may have been consumed, and natural processes will start lowering the Earth ’ s atmo-spheric CO 2 and methane levels. Global warming might then be a thing of the
Figure 3.2 The atmospheric CO 2 level over more than 800,000 years as determined from analysis of air bubbles and hydrogen isotopes trapped in Antarctic ice over this same period. From ice core air bubble and isotope data, it is also possible to determine the temperature over this same time period, and temperature closely tracks atmospheric CO 2 level. These
data are consistent with the concept that changes in Earth ’ s temperature caused by orbit, tilt, and wobble variations, and accompanying temperature changes in Earth ’ s oceans, result in the release or the uptake of carbon dioxide by ocean water, thereby varying the level of CO 2 in the atmosphere on an approximate 100,000 - year cycle.
Recommended Reading 35
past. In the long run, in the contest of global warming versus ice ages, ice ages are very likely going to win and glaciers will start returning again, just as they have many times in the past. Is it possible that humanity would have to endure another ice age with only wood fi res for heat as we did before? The next chapter looks at the important question of the total quantity of the Earth ’ s supply of fossil fuels and how long these fuels might last.
Recommended Reading
Arrhenius , Svante . “ Nature ’ s Heat Usage . ” Lecture given at Stockholm University, 3 February 1896 and printed in Swedish in Nordisk Tidskrift 14 (1896): 121 – 130. Translated in The Legacy of Svante Arrhenius, Understanding the Greenhouse Effect , eds. Henning Rodhe and Robert Charlson . Stockholm : Royal Swedish Academy of Sciences and Stockholm University , 1998 .
Batterbee , Rick and Heather Binney , eds. Natural Climate Variability and Global Warming . New York : Wiley - Blackwell , 2008 .
Bowen , Mark . Thin Ice – Unlocking the Secrets of Climate in the World ’ s Highest Mountains . New York : Henry Holt , 2005 .
Houghton , John . Global Warming: The Complete Briefi ng , 3rd ed . Cambridge and New York : Cambridge University Press , 2004 .
Lovelock , James . The Revenge of Gaia: Earth ’ s Climate Crisis and the Fate of Humanity . New York : Basic Books , 2006 .
Solomon , S ., et al., eds. Climate Change 2007: The Physical Science Basis. Contributions of Working Group 1 to the Fourth Assessment Report to the Intergovernmental Panel on Climate Change . Cambridge and New York : Cambridge University Press , 2007 . See also: http://ipcc-wg1.ucar.edu/wg1/wg1-report.html
Weart , Spencer . The Discovery of Global Warming . Cambridge, Massachusetts : Harvard University Press , 2003 .