Embed Size (px)
Citation preview

Design the Strategy | Deliver Efficiency | Sustain Results
Energy, Data Management, Reporting

– –
Agenda
● About Schneider Electric ● Enterprise wide Data Management ● Outputs ● Foundation and results ● Part of a complete energy management solution
Schneider Electric Sustainability Services 2014 2

– –
Schneider Electric Sustainability Services 2014 3
Schneider Electric – the global specialist in energy management
billion € sales (last twelve months)
of sales in new economies (last twelve months)
people in 100+ countries
of sales devoted to R&D Residential 9%
Utilities & Infrastructure
24% Industrial & machines 22% Data centres 16%
Non-residential buildings 29%
Balanced geographies – FY 2011sales
Diversified end markets – FY 2011 sales
North America 23% Asia
Pacific 27% Rest of
World 18%
Western Europe 32%

– –
Enterprise-wide Facility Management
4 Demographics
72 buildings 55 locations 12 M ft2
105 people 7 Regional managers 26 facility managers 79 techs Across North America Across all Businesses
Schneider Electric Sustainability Services 2014 4
– –
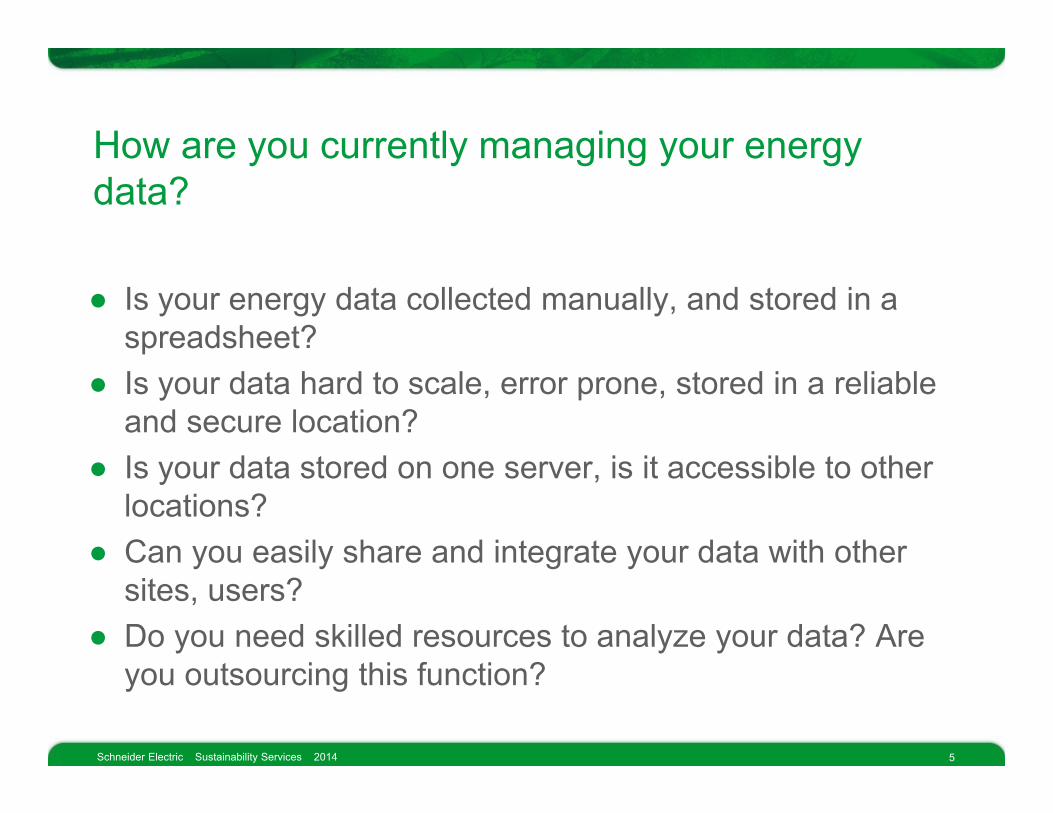
How are you currently managing your energy data?
● Is your energy data collected manually, and stored in a spreadsheet?
● Is your data hard to scale, error prone, stored in a reliable and secure location?
● Is your data stored on one server, is it accessible to other locations?
● Can you easily share and integrate your data with other sites, users?
● Do you need skilled resources to analyze your data? Are you outsourcing this function?
Schneider Electric Sustainability Services 2014 5

Schneider Electric – Sustainability Services – 2014 6
Too much energy data?
– –
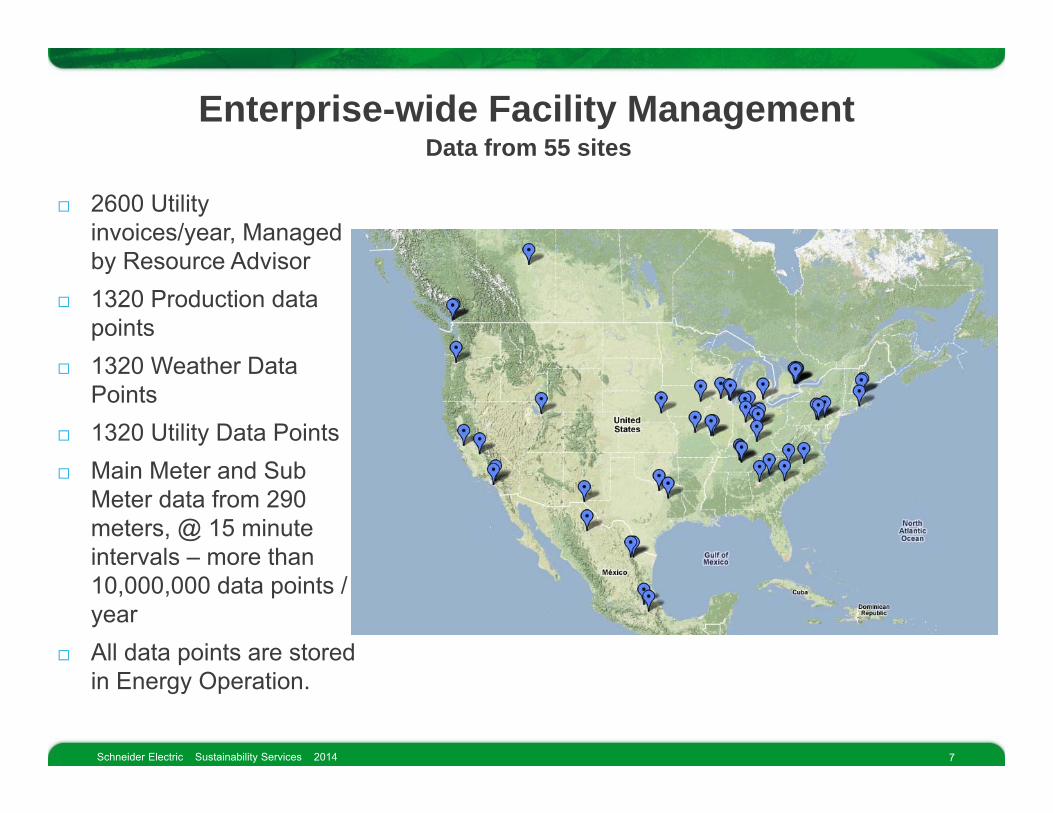
Enterprise-wide Facility Management Data from 55 sites
2600 Utility invoices/year, Managed by Resource Advisor
1320 Production data points
1320 Weather Data Points
1320 Utility Data Points Main Meter and Sub
Meter data from 290 meters, @ 15 minute intervals – more than 10,000,000 data points / year
All data points are stored in Energy Operation.
Schneider Electric Sustainability Services 2014 7

– –
Schneider Electric North America Monthly Outputs
Utility invoice Verification
Internal and External Sustainability Reporting
Invoice Processing and Payment
Schneider Internal Reporting – Monthly Model
SEP / ISO 50001 Data Reporting
M & V for Demand Management
And Improvement
Active Energy Management of individual sites
Schneider Electric Sustainability Services 2014 8

– –Schneider Electric Sustainability Services 2014 9
Monthly data is just the tip of the iceberg
Tariff Optimization
Supplier Choice Risk Management
Peak/off peak consumption
analysis
Consumption during unoccupied
hours (nights, weekends)
Under optimized scheduling of equipment (HVAC, Chillers, lighting)
Equipment consumption not correlated with
influencing factors (weather, production volume…)
Mon
thly
data
In
terv
al d
ata
– –Schneider Electric Sustainability Services 2014 10
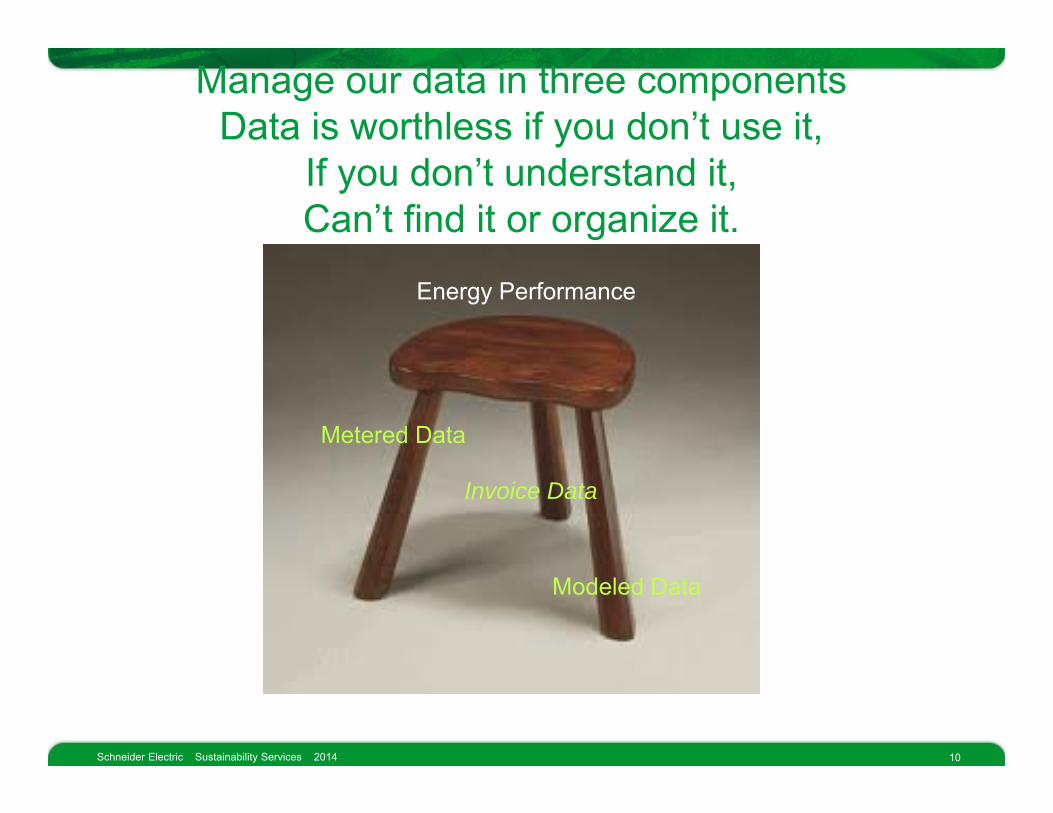
Manage our data in three components Data is worthless if you don’t use it,
If you don’t understand it, Can’t find it or organize it.
Energy Performance
Modeled Data
Metered Data
Invoice Data

Reduce Energy Consumption Modeled Performance EnPi Tool Site Jan-13 Feb-13 Mar-13 Apr-13 May-13 Jun-13 Jul-13 Aug-13 Sep-13 Oct-13 Nov-13 Dec-13 '13 vs '12
Baseline Elec Gas
Cedar Rapids -3% -4% 3% 10% -1% -10% -5% -7% -11% 4% 4% -12% -3% -3% -3% Des Plaines 1% -5% 10% 22% 20% -1% 12% 23% 6% 6% -13% -11% 3% 4% 0% Lincoln -16% -14% -6% -9% -1% -1% 2% 3% 1% 4% 1% 2% -3% 3% -17% Missouri -2% -22% -17% -7% -7% -4% -10% -29% -8% -5% -12% 9% -10% -12% 63% Palatine 4% 4% 0% 1% 1% 7% -2% -2% 5% 1% 4% 2% 2% 2% 2% Rockford 3% -5% -7% 4% -26% -13% -5% -17% -14% -17% -4% 2% -6% -4% -8% St. Louis -12% -10% -19% -21% -18% -16% -14% -15% -13% -17% -18% -20% -16% -17% 610%
-5% -8% -4% 0% -5% -5% -1% -5% -4% -2% -2% -2% -4% -2% -9% Dayton -6% -15% -8% -5% -11% -26% -30% 6% 31% 35% 19% 25% 1% 3% 0% Fishers -8% -6% -3% -8% 1% -1% 9% 6% -1% -13% -9% -9% -5% 2% -14% Huntington 1% -6% -3% -5% -4% 0% 4% 4% 11% 0% -6% -5% -1% 2% -5% Lexington -1% -6% -1% -6% 2% -3% 8% 5% 4% -2% -2% -7% -1% 3% -4% Oxford -7% -4% 13% -2% 5% 5% 9% 4% 6% -8% 0% 8% 2% -3% 5% Peru 3% 2% 6% 7% 3% 1% 9% 8% 8% 9% 13% 28% 8% 5% 11% West Chester -4% -8% -10% 2% 6% -1% 5% -4% -15% -20% 3% 18% -2% -7% 7%
-2% -4% 3% -2% 2% -1% 7% 5% 5% -1% 1% 5% 1% 2% 1% Billerica -12% -14% 4% 9% 5% 2% 16% 38% 48% 50% 35% 17% 13% 18% 2% Brossard -21% -17% -9% -1% 10% 14% 17% 20% 7% 50% 22% -16% -2% 13% -15% Leesport -2% -3% -4% -5% 2% 14% 5% -3% -17% -15% -11% -14% -5% -8% -2% Marlborough 3% -10% 0% 6% 4% 2% -8% 1% 2% 7% -2% -8% 0% 0% McLaughlin -10% -17% -15% -3% 8% 7% 29% 18% 8% -2% -16% -20% -8% -8% -6% Mechanicsburg -4% -9% -10% 5% -8% 2% 11% -3% -3% -2% -1% -1% -4% -2% -6% Middletown 8% -3% 8% 13% 0% -4% 0% 3% 1% 5% -21% -6% 0% 1% -2% North Andover -13% -11% -2% 3% 0% 0% 2% 0% -6% -4% 5% -14% -5% -4% -6% West Kingston 1% -6% 1% 5% 6% 4% 1% -3% -9% 2% 6% 10% 1% 1% 3%
-4% -8% -3% 2% 2% 5% 5% 2% -5% 0% -3% -6% -2% -1% -3% Centro Logistico -12% -15% -1% 10% -14% -11% -16% -15% 0% -13% -11% -6% -9% -9% Monterrey P2 -6% -4% -12% 5% 1% -4% 3% -5% -6% 8% -8% -15% -3% 0% -7% Monterrey P3 1% -13% -17% -11% -14% -15% -7% -11% -6% 2% -5% 1% -9% -9% Monterrey P4 10% -8% -12% -3% -7% -12% -17% -22% -24% -20% -39% -42% -17% -17% Monterrey P5 -4% 47% 14% 30% -8% -22% -19% -12% 9% 8% 8% -4% -1% -1% Pacifico -8% -8% 0% -2% 5% 3% 1% 1% 1% -2% -2% -8% -1% -1% Rojo Gomez -2% -11% -9% -6% -8% -7% -2% 1% -6% -8% -10% -13% -7% -7% Tlaxcala 0% -4% -4% 0% 3% 7% 10% 13% 12% 20% 24% 1% 6% 11% -2%
-2% -6% -7% -1% -4% -7% -3% -3% -2% 2% -2% -8% -3% -3% -4% Columbia 5% -1% 0% 7% 8% 8% 6% 10% 5% 8% -4% -12% 3% 0% 10% Greensboro 5% 2% 14% -2% -10% -16% -11% -9% -14% -10% -8% -1% -5% -5% 2% LaVergne LifeSpace 0% 5% 14% 14% -3% -2% 5% 2% 0% 0% -16% -17% -1% 0% -3% LaVergne PMO -14% -19% -13% 2% 8% 2% 3% -3% 5% 1% -21% -9% -6% -2% -20% Nashville -10% -13% -7% 6% 1% 4% 5% -8% -3% -4% -12% -15% -5% 1% -24% Raleigh -2% -2% 8% 5% -6% -10% -8% -7% -17% -18% -13% -1% -5% -8% 4% Salisbury 6% 2% 5% 39% 14% 8% 11% 13% 11% 22% -7% 8% 8% 8% 8% Seneca -5% -13% -6% 1% 2% -3% -5% -8% -10% -7% -15% -11% -7% -7% -7% Smyrna -10% -16% -10% 5% -5% -6% -3% -8% -17% -24% -23% -16% -11% -10% -12%
-3% -8% -3% 5% 2% -1% -1% -3% -7% -7% -13% -10% -4.3% -4.5% -4% Athens -15% 3% -11% 0% -3% 7% 8% 17% 13% 18% -7% 0% 2% 9% -19% Burnaby 18% 21% 12% -8% -7% -3% -9% -8% -8% -12% -10% 11% 1% 1% 2% Carrollton -5% -2% 4% -4% 2% -3% 3% -2% -1% 1% -7% -13% -3% -2% -17% Chino -9% -11% -10% -4% 19% 24% 19% 14% 20% 19% 21% 22% 10% 10% Clovis -10% -19% -11% -10% -5% -5% -5% -1% 3% 10% -5% -3% -5% -8% 1% Edmonton -13% 14% -15% -12% 4% -6% -1% 8% 20% 19% -3% -4% -2% -3% -2% El Paso -1% -21% -29% 6% -1% 3% 23% 5% 16% 55% -20% -9% -2% 4% -12% Portland -13% -5% -2% -11% -8% -6% 9% 15% 12% -12% -12% -27% -7% 2% -28% Richmond -5% 8% 1% 10% 10% 3% 8% 5% 24% 12% 23% -1% 6% 5% 7% Salt Lake City -5% -12% -2% -6% -12% -16% -17% -19% 0% 5% 18% 5% -4% -14% 4% Victoria 4% -6% 4% -3% 0% 2% 10% 8% 2% -5% -7% 5% 1% 2% -1%
-5% -8% -6% -8% -3% -3% -1% 1% 4% 6% -5% -3% -3% -3% -2% -4% -7% -2% -1% -1% -2% 1% 0% -1% -1% -3% -3% -2% -2% -3%
-4% -7% -2% -1% -1% -2% 2% 0% -1% -1% -4% -2% -2% -2% -3% 0% 2% -1% -5% -1% 1% 3% 2% 0% -1% -4% -2% -1% 0% -2% -2% -6% -7% -1% -4% -7% -3% -3% -2% 2% -2% -8% -3% -3% -4%
Schneider Electric – Sustainability Services – 2014 11

– –
Reduce Energy Consumption Reduce Enery Consumption Modeled Performance EnPi Tool Past Tense
Region Site Dec-13 '13 vs '12 Baseline Elec Gas
South Total -8% -3% -3% -4% Southeast Southeast Southeast Southeast Southeast Southeast Southeast Southeast Southeast
Columbia -12% 3% 0% 10% Greensboro -1% -5% -5% 2% LaVergne LifeSpace -17% -1% 0% -3% LaVergne PMO -9% -6% -2% -20% Nashville -15% -5% 1% -24% Raleigh -1% -5% -8% 4% Salisbury 8% 8% 8% 8% Seneca -11% -7% -7% -7% Smyrna -16% -11% -10% -12%
Southeast Total -10% -4.3% -4.5% -4%
Schneider Electric Sustainability Services 2014 12

285,102 13,501,283 642,915 532,370 702,374 ,369,925 178,599 710,461
046,412 299,078 ,597,854 153,193 671,756 546,692 414,157
2,872,772 ,844,217 394,799
293,236 698,056 242,337 292,219
1,068,269 ,178,261 420,149 ,574,149 451,332 ,229,327
748,011 2,475,323 ,114,822
386,381 545,582
201,082 914,125 240,114 720,747 377,534
117,362 904,277 243,923 294,109
1,099,874 411,362 1,856,691 ,794,230
575,505 687,374 993,290 960,024
207,311 143,138 287,236 758,608 511,996 145,164 691,629 122,942
1,892,839 ,386,045 1,073,765 ,649,517
559,886 737,744 950,107 575,840
974,763 834,079 206,095 252,991
2,064,116 ,536,193 2,508,783 658,729 6,861,184 ,755,087
971,550 228,439 862,644 346,102
1,469,259 ,276,351 757,764 107,514 716,461 906,388
103,583 865,828 504,028
869,161 181,343 2,636,626 ,724,409
18,595,435 ,618,810
– –
6, 144,318 787,233 25 7, 150,943 544,010
64,820 3, 299,267 449,630 18 1, 17,640 275,143 7, 193,737 5,296 745,725 83 1, 94,541 1, 331,308 3,732 628,276 3, 99,931 - 357,356 39 334,078 14 419,988 15 423,551 1, 73,574 200,408 77 1,
68,524 1, 22,096 90,620 9, 467,382 - 738,457 -
35,633 1, 333,191 414,378 90,294 3, 188,783 400,829
4, 33,200 - 467,997 8, 104,581 348,504 9, 252,839 40
75,366 53,968 152,544 28,747 3, 586,413 752,162 86,297 6, 152,186 434,780 4,256 1, 119,087 254,222
6, 108,801 768,303 4, 64,464 432,797 7, 349,149 8, 452,251 39 13 831,431
7,985 1, 114,392 179,854 907 - 907
3,487 2, 3,487 21,283 1, 21,283
5, 156,684 1, 43,320 4,114 253,528 17 897,585 9, 412,979 54
66,356 1, 767 - 92,941 5,
54,726 1, 10,670 8,145 - 73,541 1,427 1, 4,016 - 58 5,500
26 821,851 - 27,924 6, 7,239 8,284 1, 2,126 10,409
35,905 1, 19,226 111,143 2, 27,288 329 131,200 1, 4, 869,161 55 893,183 351 3
Reduce Energy Consumption Modeled and Project Performance Future Tense
2012 2013 2014 3-year total
Location Region Projected Savings (kWh)
2011 Total Energy Usage
(kWh)
Projected % Difference
Actual % Difference
(Model)
Projected Savings (kWh)
2012 Total Energy Usage
(kWh)
Projected %
Difference
Actual % Difference
(Model)
Projected Savings (kWh)
2013 Total Energy Usage
(kWh)
Projected %
Difference
Actual % Difference
(Model)
Projected Savings (kWh)
% Diff. vs. 2011
Cedar Rapids Central 1 -2.1% -2.5% 354,256 12,801,926 -2.8% -2.9% 548,348 13,061,585 -4.2% -7.0% 1,187,706 -8.8% Des Plaines Central 1 -9.8% -10.6% 5,801,735 -2.5% 2.8% - 7,027,424 0.0% -20.0% -12.1% Lincoln Central 1 -2.8% -1.4% 1,562,751 24,867,561 -6.3% -3.4% 264,540 25,875,101 -1.0% -7.7% 2,529,664 -10.0% Missouri Central 1 -2.3% -8.5% 6,001,692 -2.5% -9.7% 214,468 5,186,295 -4.1% -8.0% -7.1% Palatine Central 1 -2.1% -17.3% 2,674,738 -11.2% 2.2% 85,543 3,086,086 -2.8% 10.0% -14.8% Rockford Central 1 -1.6% -14.9% 1,174,458 15,339,182 -7.7% -6.1% 578,727 15,326,060 -3.8% -19.4% 2,052,263 -11.0% St. Louis Central 1 -9.2% -16.7% 1,346,677 -1.3% -15.7% 104,310 1,197,925 -8.7% -2.7% -16.5% St. Louis SETC Central 1
Central 1 Total -7.4% -3.4% -7.3% 3,897,369
7,502,771 -2.6% 76,336,281 -5.1% -3.8% 1,801,232
7,359,507 -0.1% 78,119,982 -2.3% -11.4%
-10.1% 8,571,373 -10.2%
Dayton Central 2 - 0.0% 7.6% - 1,455,126 0.0% 1.1% 94,541 1,504,000 -6.3% 18.0% -6.8% Fishers Central 2 -17.3% -6.8% 1,524,550 -21.7% -4.8% 1,702,316 -0.2% -2.3% -37.0% Huntington Central 2 -7.4% -6.1% 3,038,067 -3.3% -1.0% 15,088 2,919,059 0.5% 2.0% -10.9% Lexington Central 2 -2.7% -7.6% 38,689,589 -0.9% -1.0% 3,813,085 40,005,869 -9.5% -5.6% 5,215,431 -13.3% Oxford Central 2 -2.9% 0.7% 14,919,691 -2.8% 2.0% 1,465,059 16,413,543 -8.9% -11.1% 2,305,196 -15.8% Peru Central 2 -3.0% 1.8% 14,966,065 -2.8% 8.5% 308,353 16,780,919 -1.8% -6.2% 1,183,236 -7.8% West Chester Central 2
Central 2 Total - 0.0%
-3.2% -9.5% -4.0% 1,682,430
1,578,220 -4.7% 76,171,307 -2.2%
-1.8% 1.4%
126,833 5,826,691
1,692,409 -7.5%
81,018,115
-7.2% -9.5% -6.4%
-11.5% 9,984,444 -12.9%
Billerica Northeast - 0.0% 9.5% - 1,412,415 0.0% 13.0% - 1,783,196 0.0% -2.2% - 0.0% Brossard Northeast -4.4% -17.8% 1,243,336 -1.8% -2.3% - 1,286,026 0.0% -2.2% -5.9% Leesport Northeast -2.0% -2.4% 9,168,030 -5.1% -4.7% 69,993 9,294,301 0.8% 0.0% -7.4% Marlborough Northeast - 0.0% 6.5% - 255,354 0.0% 0.5% - 254,242 0.0% -3.3% - 0.0% McLaughlin Northeast -2.1% 2,046,468 -16.3% -7.6% 45,553 2,133,198 -2.1% -1.6% -24.1% Mechanicsburg Northeast -2.7% -0.1% 2,951,603 -6.4% -3.5% 121,752 3,355,742 -3.6% -13.8% -11.9% Middletown Northeast -2.4% -2.5% 3,998,669 0.8% 0.0% 317,435 4,555,947 -7.0% -7.6% -9.5% North Andover Northeast -2.9% 0.5% 7,752,229 -1.3% -4.6% - 4,427,470 0.0% -1.2% -4.2% West Kingston Northeast
Northeast Total -11.7%
-4.6% -16.7%
-5.4% 1,402,072 7,774,147 -3.3%
36,602,252 -3.8% 1.4%
-1.9% 669,243
1,223,9778,295,827 -8.1%
35,385,949
-3.5% -6.8% -4.9%
2,021,955 -21.5% 4,482,739 -11.0%
Centro Logistico South -13.1% -14.6% 493,366 -10.9% -9.4% 23,211 447,195 -5.2% -12.5% -26.5% Monterrey P2 South -0.8% -6.2% 3,654,149 -16.0% -3.2% 137,002 3,901,010 -3.5% 3.4% -20.4% Monterrey P3 South -1.2% -4.1% 6,908,853 -2.2% -8.7% 196,297 5,398,930 -3.6% -1.8% -6.2% Monterrey P4 South -0.2% -3.9% 2,159,930 -5.5% -17.2% 130,879 2,007,397 -6.5% -24.3% -13.0% Monterrey P5 South -3.4% -13.5% 2,633,762 -4.1% -1.4% 452,190 2,895,154 -15.6% 12.6% -12.5% Pacifico South -6.0% -7.1% 4,709,721 -1.4% -1.4% 81,097 5,091,541 -1.6% -4.1% -9.1% Rojo Gomez South -7.2% -7.9% 18,286,878 -1.9% -6.7% 224,705 19,834,945 -1.1% -19.8% 1,085,850 -15.2% Tlaxcala South
South Total -8.5% -4.8%
-13.7% -8.5% 1,886,318
7,685,753 -5.9% 46,532,413 -4.1%
6.5% -3.5%
82,055 1,327,437
7,986,787 -1.0%
47,562,960
-2.8% 8.4%
-8.3% 1,225,935 -15.1% 5,106,593 -13.0%
Columbia Southeast -7.9% -5.5% 12,867,554 -6.5% 3.2% 970,597 13,571,923 -7.2% -12.7% 2,875,793 -21.1% Greensboro Southeast -0.5% -3.0% 1,486,695 -7.7% -4.6% 57,477 1,534,710 -3.7% -8.1% -11.5% LaVergne LifeSpace Southeast -0.1% -3.1% - 775,063 0.0% 0.8% - 861,028 0.0% -10.7% -0.1% LaVergne PMO Southeast -0.1% -16.5% - 2,394,750 0.0% -6.1% - 2,302,164 0.0% 10.8% -0.1% Nashville Southeast -1.4% 1.4% - 1,546,562 0.0% -5.3% - 1,587,509 0.0% -14.1% -1.4% Raleigh Southeast -16.7% -1.4% 5,563,471 -2.8% -5.3% 48,179 5,511,077 -0.9% -20.3% 1,179,626 -20.2% Salisbury Southeast -16.4% -6.6% 1,074,221 -4.0% 8.0% 1,316,392 -0.3% -6.6% -20.2% Seneca Southeast -11.8% -11.0% 15,172,337 -5.9% -7.0% 619,689 14,957,818 -4.1% -15.6% 3,581,390 -20.4% Smyrna Southeast
Southeast Total -26.0% -12.5%
-25.7% -9.1% 2,456,391
8,802,758 -4.7% 49,683,411 -4.9%
-11.2% -4.3%
1,058,459 2,758,515
8,007,993 -13.2%
49,650,613
-5.6% -15.8% -13.7%
3,980,222 -41.2% 12,076,090 -22.1%
Athens West -3.4% -12.2% 1,487,982 0.1% 1.7% 25,818 1,783,165 -1.4% 22.5% -4.7% Burnaby West - 0.0% 11.3% - 5,334,828 0.0% 1.4% - 5,428,288 0.0% -7.7% - 0.0% Carrollton West -2.9% 2.1% 1,796,837 -0.6% -2.6% 1,798,211 0.5% 0.6% -3.9% Chino West -0.1% -10.3% 1,230,512 0.3% 10.2% 1,356,087 0.0% 1.2% -0.4% Clovis West -5.6% -6.6% 23,978,802 -3.4% -5.1% 145,063 21,889,838 0.7% 6.0% 2,436,174 -9.3% Costa Mesa West -0.4% 5,490,573 -0.1% 1,929,699 7,387,627 -26.1% 1,964,862 -29.1% Edmonton West -0.7% 1,094,510 -0.2% -2.4% - 1,162,618 0.0% 1.9% -0.9% El Paso West -2.1% -1.8% 1,541,448 -1.2% -1.9% 56,011 1,855,867 -3.0% 1.0% -6.5% Portland West - 0.0% 2.7% - 3,260,225 0.0% -6.6% - 3,505,897 0.0% -9.0% - 0.0% Richmond West -12.0% -14.6% 775,982 -3.5% 6.1% 841,328 0.0% 1.2% -15.2% Salt Lake City West - 0.0% -15.2% - 1,120,073 0.0% -3.5% - 1,371,528 0.0% 2.4% - 0.0% Victoria West
West Total Grand Total
-20.8% -4.7% -5.3%
-39.9% -7.5% -7.1%
-
12,217,762
2,612,327 0.0% 49,724,099 -1.8%
335,049,764 -3.6%
1.2% -2.8% -2.2%
-2,165,123
15,102,974
2,637,589 0.0% 51,018,044 -4.2% 42,755,663 -4.4%
-9.0% 1.9%
-7.7%
-20.8% 5,694,931 -10.2%
45,916,171 -13.1%
Schneider Electric Sustainability Services 2014 13

– –
13 831,431 7,985 1, 114,392 179,854
907 - 907 3,487 2, 3,487
21,283 1, 21,283 5, 156,684 1, 43,320 4,114 253,528 17 897,585 9, 412,979 54 55 893,183 351 3
Reduce Energy Consumption Modeled and Project Performance Future Tense
2012 2013 2014 3-year total
Location Region Projected Savings (kWh)
2011 Total Energy Usage
(kWh)
Projected % Difference
Actual % Difference
(Model)
Projected Savings (kWh)
2012 Total Energy Usage
(kWh)
Projected %
Difference
Actual % Difference
(Model)
Projected Savings (kWh)
2013 Total Energy Usage
(kWh)
Projected %
Difference
Actual % Difference
(Model)
Projected Savings (kWh)
% Diff. vs. 2011
Columbia Southeast 1,073,765 ,649,517 559,886
-7.9% -0.5%
-5.5% -3.0%
--
12,867,554 1,486,695
775,063 2,394,750
-6.5% -7.7% 0.0% 0.0%
3.2% -4.6% 0.8%
-6.1%
970,597 57,477
13,571,923 1,534,710
-7.2% -3.7%
-12.7% -8.1%
2,875,793 -21.1% -11.5%Greensboro Southeast
LaVergne LifeSpace Southeast 737,744 -0.1% -3.1% - 861,028 0.0% -10.7% -0.1% LaVergne PMO Southeast 950,107 -0.1% -16.5% -
-2,302,164 1,587,509
0.0% 0.0%
10.8% -14.1%
-0.1% Nashville Southeast 575,840 -1.4% 1.4% - 1,546,562 0.0% -5.3% -1.4% Raleigh Salisbury Seneca Smyrna
Southeast Southeast Southeast Southeast Southeast Total
974,763 206,095
2,064,116 2,508,783 6,861,184
834,079 252,991
,536,193 658,729 ,755,087
-16.7% -16.4% -11.8% -26.0% -12.5%
-1.4% -6.6%
-11.0% -25.7%
-9.1% 2,456,391
5,563,471 1,074,221
15,172,337 8,802,758
49,683,411 49,724,099
-2.8% -4.0% -5.9% -4.7% -4.9% -1.8%
-5.3% 8.0%
-7.0% -11.2%
-4.3% -2.8%
48,179
619,689 1,058,459 2,758,515
5,511,077 1,316,392
14,957,818 8,007,993
49,650,613
-0.9% -0.3% -4.1%
-13.2% -5.6%
-20.3% -6.6%
-15.6% -15.8% -13.7%
1,179,626 -20.2% -20.2%
3,581,390 -20.4% 3,980,222 -41.2%
12,076,090 -22.1% West Total 2,636,626 ,724,409 -4.7% -7.5% 2,165,123 51,018,044 -4.2% 1.9% 5,694,931 -10.2% Grand Total 18,595,435 ,618,810 -5.3% -7.1% 12,217,762 335,049,764 -3.6% -2.2% 15,102,974 42,755,663 -4.4% -7.7% 45,916,171 -13.1%
Schneider Electric Sustainability Services 2014 14

– –
4,000
3,500
3,000
2,500
2,000
1,500
1,000
500
0
Inv. Gas
Paintline Meter
Space Heat Meter
01-Jan 01-Feb 01-Mar 01-Apr 01-May 01-Jun 01-Jul 01-Aug 01-Sep 01-Oct 01-Nov 01-Dec 01-Jan 01-Feb 01-Mar
Invoice Analysis – Meter Data vs Invoice Data
Schneider Electric Sustainability Services 2014 15

– –Schneider Electric Sustainability Services 2014 16
Weekend Analysis – Plugs Vs HVAC & Lighting
Anomalies
Anomalies
Anomalies Anomalies
Anomalies Anomalies
> Plug load best way to show occupancy > When lighting and HVAC are added, shows HVAC and Lighting not correlated to occupancy, this requires further investigation

– –
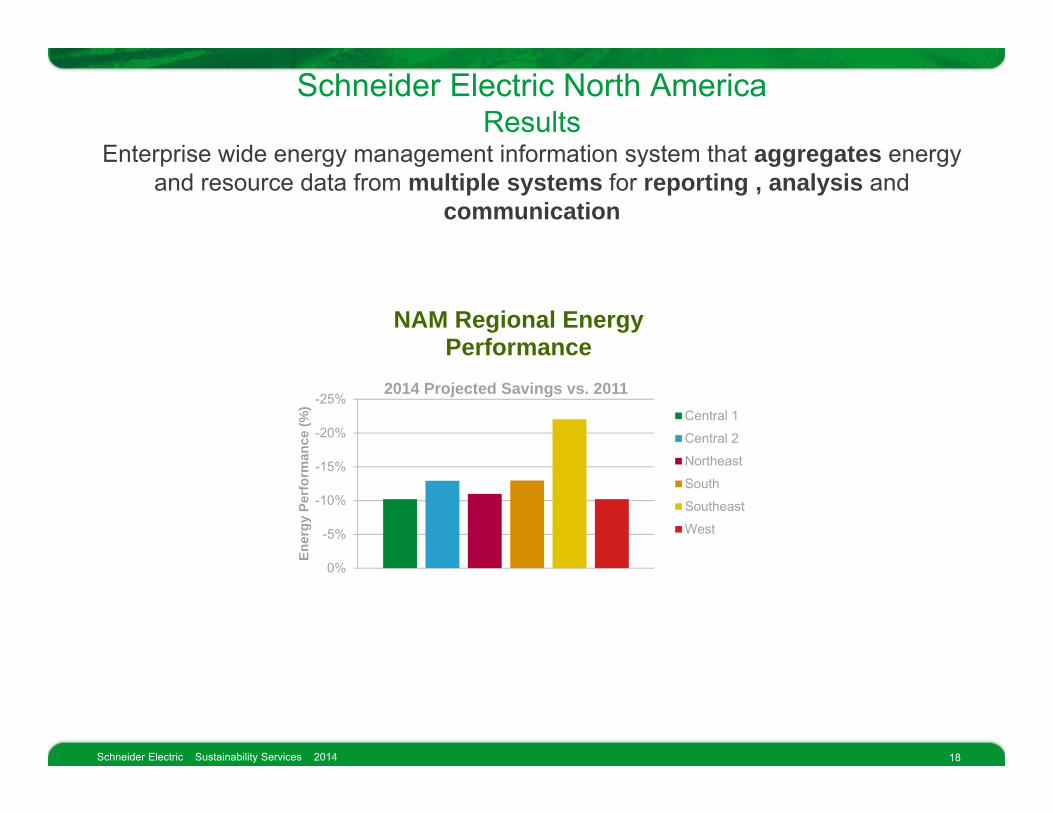
Schneider Electric North America Results
Enterprise wide energy management information system that aggregates energy and resource data from multiple systems for reporting , analysis and
communication
NAM Regional Energy NAM Regional Energy Performance Performance [2013 vs. 2011]
2014 YTD vs. 2013 2013 YTD vs. 2011 -14% -14%
-8%
-6%
-4%
-2%
0%
2%
4%
Ener
gy P
erfo
rman
ce (%
) -12% Central 1
Central 2
Northeast
South
Southeast
West
Ener
gy P
erfo
rman
ce (%
)
-12% Central 1
-10% -10% Northeast
-8%
Central 2
South -6%
Southeast -4%
West -2%
0%
Schneider Electric Sustainability Services 2014 17
– –
Schneider Electric North America Results
Enterprise wide energy management information system that aggregates energy and resource data from multiple systems for reporting , analysis and
Ener
gy P
erfo
rman
ce (%
) -25%
-20%
-15%
-10%
-5%
0%
communication
NAM Regional Energy Performance
2014 Projected Savings vs. 2011 Central 1
Central 2
Northeast
South
Southeast
West
Schneider Electric Sustainability Services 2014 18

– –
-
Schneider Electric North America Results
Enterprise wide energy management information system that aggregates energy and resource data from multiple systems for reporting , analysis and
communication
Internal energy savings Reporting. The 55 sites Are at a -7% vs. 2014 and -8% (goal 7%) against our Company program
Internal and External Sustainability Reporting
Reconciles invoice and utility
data
Provides Baseline Data For SEP, i.e. Smyrna, TN is performing At a -20% vs the 2011 baseline
Provides data for Better Buildings / Better Plants Schneider Electric performance is 17.8%
Project planning and predicative tools to anticipate current and future savings. In 2014 we plan about 4.5% savings to bring our three year savings to over 13%
Information for Annual Energy Reviews
required by ISO50001
Foundation of Energy Program
Reconciles invoice and utility
data
Tool to use with our Management for Capital and Expense Planning
Schneider Electric Sustainability Services 2014 19

– –
Energy Operation Enterprise wide energy management information system that aggregates energy and resource data from multiple systems for reporting , analysis and communication
Our
The Customer Dilemma
Companies are increasingly challenged to aggregate disparate pieces of information in a heterogeneous environment across the entire enterprise
Automates the data collection process through the use of an open, scalable and secure Energy Management Information System.
Collects large volumes of device data from control systems or meters and enables analytics to find hidden inefficiency opportunities
Serves as a tool to communicate the results and performance in a meaningful manner for a shared understanding across your organization
Schneider Electric Sustainability Services 2014 20

Schneider Electric – Sustainability Services – 2014 21
1. Design a Strategy A strategy ensures
projects get buy-in,
provides process to
measure success, and
ensures goals are met.
2. Deliver Efficiency From delivering sustainability services, energy
procurement, demand response programs and
reducing your resource consumption - we do it
all.
3. Sustain Results We don’t walk away after we deploy a solution, we stay on the
project to continuously improve and communicate success.
An energy plan
isn’t complete unless it
optimizes how you buy
energy and how you use it
Maximize
Results
Sustainability measures far
more than just energy, and can be
a powerful tool to broaden positive
perception and long-term impact
Schneider Electric understands both sustainability and energy management, and delivers on three parts of a successful program