Embed Size (px)
Citation preview

Energy Consumption Modeling
in Wireless Sensor Networked Smart Homes
by
Wang Xie
Thesis submitted to the Faculty of Graduate and Postgraduate Studies
In partial fulfillment of the requirements For Master’s degree in
Electrical and Computer Engineering
School of Electrical Engineering & Computer Science Faculty of Engineering University of Ottawa
© WANG XIE, OTTAWA, CANADA, 2015

Acknowledgements
Foremost, I would like to express my sincere thank to my supervisor, Prof. Hussein
T. Mouftah, his patience, encourgement, and immense knowledge were my key
inspiration throughout my master study. I am truly thankful for his selfless dedication
to both my personal and academic development. I cannot think of a better supervisor
to have.
Many thanks to Dr. Irfan S. Al-Anbagi for the guidance and support, his extensive
knowledge in this field has always pushed me to achieve more in my study.
Special thanks to my best lab mate Naouar Yaagoubi for her help and many jokes we
laughed together.
Finally, I want to thank my parents for their love and understanding through
everything and always embrace me as who I am all the time.

Abstract
Smart home automation is the dwelling bridge of smart grid technology, as it
integrates the modern home appliances power consumption information over
communication networks in the smart grid system. Among all the appliances,
Heating, Ventilation and Cooling (HVAC) systems is one of the most primary
concerns. Since a great amount of power consumption is contributed by these HVAC
systems. Traditionally, HVAC systems run at a fixed schedule without automatic
monitoring and control systems, which causes load variation, fluctuations in the
electricity demand and inefficient utility operation. In this thesis, we propose a Finite
State Machine (FSM) system to model the air condition working status to acquire the
relationship between temperature changing and cooling/heating duration. Finally, we
introduce the Zigbee communciation protocol into the model, the performance
analysis of the impact of end-to-end delay over HVAC systems is presented.

I am dedicating this thesis to my beloved parents.

v
Contents
Abstract ………………………………………………………………………………………iii
Contents ………………………………………..………………………………..………………v
List of Figures ………………………….……………………………………………………..viii
List of Tables ……………………………………….…………………………………………...x
List of Acronyms ……………………………….………………………….…………………..xi
List of Symbols ……………...………………………….……………………………………..xii
1 Introduction ……………………………………………………….………………………..1
1.1 Background …………………………………………………….………………………..1
1.2 Motivation ………………………………………………………………………………4
1.3 Contributions ……………………………………………………………………………5
1.4 Thesis outline ……………………………………………….…………………………...6
1.5 Related publications …………………………………………………………………….7
2 Literature review …………………………………………………………………………..8
2.1 Introduction ……………………………………………………………………………..8
2.2 An introduction to the smart grid ……………………………………………………….9
2.2.1 Demand and Response (D&R) optimization …………………………………18
2.2.2 Smart meter ………………………………………….………………………...20
2.2.3 Load control …………………………………………………………………...22
2.2.4 Power demand prediction ……………………………………………………..22
2.3 Review of smart home …………………………………………………………………24

vi
2.3.1 Communication architecture for smart home …………………………………26
2.3.2 Management of renewable energy resources …………….……………………28
2.3.3 Power consumption in residential and commercial buildings ………………...30
2.3.4 Smart operation of home appliances ………….……………………………….30
2.3.5 Smart home energy management system ……………….……………………..31
2.4 Review of HVAC systems ……………………………………...………………..…….32
2.4.1 Power consumption in HVAC systems ……………………………………….33
2.4.2 Thermal control in HVAC systems …………………………………………...34
2.4.3 Energy cost management in HVAC systems ………………………………….36
2.5 Summary ………………………………………….……………………………………37
3 System analysis of HVAC systems ………………………………………………………38
3.1 Introduction ……………………………………………………………………………38
3.2 Residential home power consumption model ………………………….………………39
3.2.1 Transmission load ……………………………………………………………..42
3.2.2 Infiltration load ………………………………………………………………..42
3.2.3 Solar load ……………………………………………………………………...43
3.2.4 Internal load …………………………………………………………………...44
3.2.5 Power consumption calculation ……………………………………………….44
3.3 Commercial building power consumption model ………………………..……………46
3.4 Finite State Machine (FSM) based simulation model …………………………………48
3.5 Zigbee-based smart HVAC systems ………………………….………………………..49
3.6 Summary …………………………………………….…………………………………52
4 Performance evaluation and results ……………………….…………………………….55
4.1 Introduction ……………………………………………………………………………55
4.2 Power consumption in residential home ……………………….………………………55

vii
4.3 Zigbee-based communication system results ………………………………………….64
4.4 Summary ………………………………………………………….……………………69
5 Conclusions and future work …………………………….………………………………71
5.1 Conclusions ……………………………………………………………………………71
5.2 Future work ………………………………….…………………………………………72
References ……………………………………………………………………………………..74
Appendix A: Confidence Interval …………..………………………………………………..82
viii
List of Figures
2.1 A basic power generation diagram …………………..……………….............10
2.2 Smart grid conceptual scheme …………………………..…............................11
2.3 General smart grid architecture ……………………….……….......................14
2.4 General smart grid communication architecture ………………………..........15
2.5 Top-down and bottom-up modeling techniques for estimating the regional or
national residential energy consumption …...……………………….……………24
2.6 An example of smart home automation ……………………………...………...25
2.7 A typical residential energy resource system [CHE09] ………………...…..29
2.8 Adjustment of the execution mode based on price notification …......……….31
3.1 Component of energy consumption in percentage …………………….……..38
3.2 Floor plan for residential building suggested appliance wattage ……….……40
3.3 The components of cooling load ……………….…………………………….41
3.4 A single floor of a typical commercial building ……………..……………….48
3.5 FSM-based air conditioner modeler …………….……………………………49
3.6 Overview of Zigbee-based communication system ……………..…………...51
3.7 Zigbee-based communication system simulation in OPNET ………..……….52
3.8 Simulation process of the thesis ………………………………….…………..53
4.1 Daily power consumption in residential house at different months in 2013,
Ottawa ……………….……………………………………………………………56
4.2 HVAC system power consumption at T0=22 °C ……………………………..59
4.3 Initial Temp =26 °C, set point =24 °C with various heating rates ………...…60
4.4 Initial Temp =26 °C, set point =20 °C with various cooling rates …………...61
4.5 The hearing rate vserses air conditioner heating Time …………………..…...63
4.6 The cooling rate vserses air conditioner cooling Time ……………..………...63
4.7 Physical dimension of the Zigbee-based communication system ………...….65
4.8 End-to-end delay in coordinator simulation results from OPNET ……...…....66
4.9 Packet inter-arrival time verses the end-to-end delay ………………...……...67
ix
4.10 A simple case of etimation of the energy waste ………………………….....69
A.1 Normal distribution ………………………..………….……………………84

x
List of Tables
3.1 Home Appliances with Suggest Wattage [TORHY] ……………………..…..41
3.2 Comparison between Wi-Fi, Bluetooth and Zigbee protocols….….…....…......52

xi
List of Acronyms
AMI Advanced Metering Infrastructure
AMR Automated Metering Reading
ANN Artificial Neural Network
ASHRAE American Society of Heating, Refrigerating and Air-Conditioning Engineers
CCHP Cooling, Heating and Power
D&R Demand and Response
EM Engineering Methods
EMU Energy Management Unit
FFD Full Function Device
FSM Finite State Machine
GHG Green House Gas
HEM Home Energy Management
HVAC Heating, Ventilation and Air Conditioning
ICT Information and Communications Technologies
PHEV Plug-in Hybrid Electrical Vehicle
PLC Power Line Communication
PUC Personal Universal Controller
RFD Reduced Function Device
SHGC Solar Heat Gain Co-efficient
SM Statistical Methods
TOU Time-of-Use
Wi-Fi Wireless Fidelity

xii
WSN Wireless Sensor Network

xiii
List of Symbols
Q! transmission load
T! indoor temporary temperature
T! indoor temporary temperature
U heat transfer constant
S air-conditioned area
Q!"# Infiltration load
q! air flow rate
c! real time heat of air
ρ air density
h heights of a single story building
V volume of the entire building
W! current atmosphere humidity
W!" indoor humidity
Q! solar load
A! area of total windows in the building
E irradiance of solar beam
S t Solar Heat Gain Co-efficient function (SHGC)
Q!"# internal load
G!"# total light wattage
F(t) lighting use factor
E HVAC system power consumption

xiv
E!"## energy loss
E!"!# HVAC systems power consumption at initial temperature
E!"##$%& HVAC systems power consumption at setting temperature

1
Chapter 1
Introduction
1.1 Background
Smart grid technologies and the up-to-date electrical power grids are currently
undergoing fast pacing innovation, making the effort to develop a newly styled
power grid system to deal with the higher requirement of power consumption in the
near future. The great convenient features of smart grid help improving the
performance of energy utilization in terms of different applications, such as real time
supervision of power distribution, individual smart home monitoring and the load
management of energy consumption.
Smart grid integrated Information and Communication Technologies (ICTs) in its
operation that work on the behavior of all the power suppliers and consumers, aiming
at improving the efficiency, importance, reliability, security, economics and
sustainability of the entire power system. Right now an exigent set of circumstances
in traditional power grid still need to be solved. In fact, the most basic factor that
triggers the development of smart grid is the Green House Gas (GHG) emission
issue, rather than the well known coal burning approach of power generation, an
alternative trending solution provides a better way of reducing the GHG pollution,
some renewable energy resources such as sunlight, wind, ocean tide and nuclear

2
power gives a cleaner and safer environment, however it is estimated that more that
half of the energy generated is wasted along the way of its generation and
transmission due to the electricity natural physical feature [LUI10]. Therefore, this
fact has been proving the inefficiency of operation over the traditional power grid,
more accurate measurement needs to be taken to minus the gap between the power
suppliers and consumers in order to avoid the possible energy waste.
As the current popular trend in smart grid, wireless sensor networks provides the
intelligent sensors carrying the electricity information collected that can
automatically build up the networks itself and communicate through the wireless
channels, thus making it more flexibility and more possibility to scale. And without
the higher cost of installation and maintenance of the physically attached sensor
nodes, WSNs also offers the much cheaper way of deployment [MEL11]. In
addition, however, as most of the sensors are deployed in an unmanned area, weather
condition, electrical faults and other unexpected ambient situation can lead to the
failure of sensors which may cause the whole area uncovered [HAB10], as a result,
the restoration and back up scheme is also necessary to keep the network work well.
One of the heated studied applications over smart grid system is smart home,
which is elaborated as a comprehensive system, deployed by a vast scope of
technology such as wireless communication, intelligent computing and the real
physical wiring to integrate all the indoor sub-systems. [CHJ09] These sub-systems
control the home appliances and devices such as lightings, air conditioners, furnace,
stove and washing machine. Through this manner, residents in both residential and

3
commercial buildings are able to simplify and unify the management within the
living area, as well as offering the data and information interaction between different
appliances. Smart home at the same time provides a more convenient, secured and
power efficient environment, especially for seniors and people who need special help.
Home automation as one important technique of smart home system can be
created through a great range of methods. System can take advantages from basic
remote control to built-in computer controllers, which are connected to a small area
of networks. With the increasing demand of multi-functional home appliances,
interaction and communication between these devices become more vital than ever
before, higher level of computing algorithm needs to be studied to reduce the burden
of energy usage. For example, HVAC systems (Heating, ventilation and air
conditioning) requires not only manual operation in terms of humidity and
temperature, but also a more accurate comfort level to create a better indoor
environment, and saving the energy bill in addition. Consequently, home automation
indirectly has become an efficient approach to control the energy utilization and
rendering the surveillance of home appliances to be better understood.
Space heating and cooling accounts for more than half of the entire residential
energy consumption, researches carried out recently shows that there is an estimation
of 48% of energy consumption in U.S. homes [USE09]. Therefore, HVAC
contributes the most in energy consumption in residential and commercial buildings,
necessary research on all perspectives of HVAC systems should be studied in order

4
to possibly rendering energy savings, as well as to improve humidity and
temperature comfort level in the buildings.
Researchers all over the world are still dedicating to innovate the newer
generation of wireless sensor network in smart grid which targets at the different
sections of power system, and newer approaches will continuous its impetus to the
efficiency, utilization and multi-functional of power grid.
1.2 Motivation
The increasing demand of energy need and the dwindling oil reserves are the two
main factors bringing about the fast rising hydro price and the rigorous social debate
regarding the green energy evolution. The global worsen climate and the fast
growing population over the last century have been contributing to the greater desire
of more energy utilization as well. It has been proven that for example, there is an
annual increase of 2.5% power demand during the last two decades according to the
U.S. Department of Energy report [USE09], and the residential power need is
forecasted to rise by 24% in the coming-up 30 years according to the recent Annual
Energy Outlook report of the U.S. Information Administration [USE09], and this
number does not only apply to U.S., the global power demand is also on the
increasing trend ever since. While such higher demand is stimulating the economics
and bringing a lot of working opportunities, the negative sequences also caused
controversy considering the declining fuels and the continuous emitted GHG
5
polluting the global atmosphere. In addition, the increasing power demand is putting
unprecedented burden on the existed power system infrastructure, which had already
been facing the same questions for years. Therefore, with the minor innovation and
re-construction of the current power facilities, how to scientifically and intelligently
distribute and utilize the power has become a popular topic today and also is facing
lots of challenges.
According to [USE09], the number of housing units in U.S. was increasing on a
fixed linear speed over the last 30 years, however, the total residential energy
consumption was not on the same trend but on the contrary, has downsized at a
stable rate. This would largely attribute to the improved energy efficiency that
compensates the growing number of residential units. Among all the attempts of how
to utilize the energy more efficiently, HVAC system accounts for most of the
endeavor [YAH10]. Nevertheless, there is still a large margin to be filled for higher
energy utilization inside the HVAC system.
1.3 Contributions
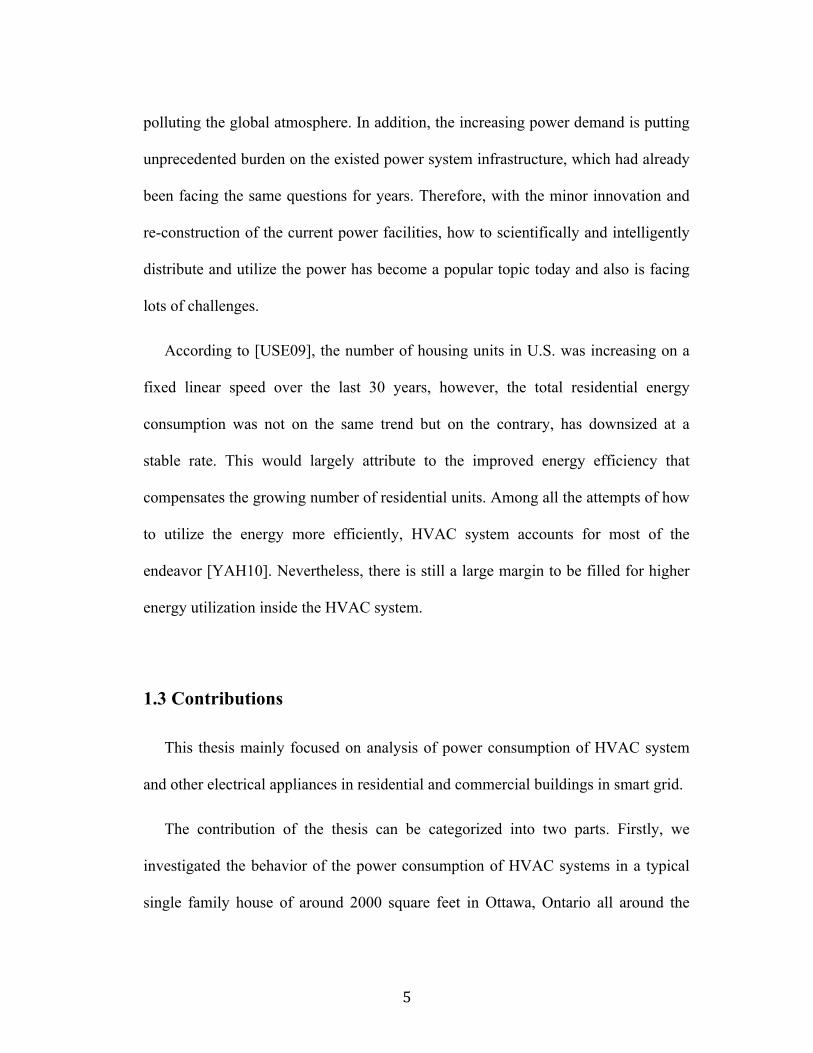
This thesis mainly focused on analysis of power consumption of HVAC system
and other electrical appliances in residential and commercial buildings in smart grid.
The contribution of the thesis can be categorized into two parts. Firstly, we
investigated the behavior of the power consumption of HVAC systems in a typical
single family house of around 2000 square feet in Ottawa, Ontario all around the

6
year at different temperature set points, in addition, we did the analysis of optimizing
the temperature gradients of HVAC systems to maximize the energy efficiency.
Secondly, we introduced Zigbee wireless communication protocol into the model of
a typical commercial office building; we allow each and every room to be equipped
with an air conditioner, and these air conditioners are attached and controlled by the
sensor nodes, which could not only enable the working status of the machines, but
also collects the information to be transferred within the system. By doing this, we
looked into how the end-to-end delay in Zigbee communication system would
impact the power consumption of HAVC system.
We have proposed a Finite State Machine (FSM) system to model the air
conditioner working status using Ptolemy software, and for the specific power
consumption by HVAC systems, we used Matlab to train the real time data into our
model and acquire the accurate power consumption data. Finally, we used OPNET to
model the Zigbee communication in the model, in order to study the impact of end-
to-end delay over power consumption of HVAC systems.
1.4 Thesis Outline
The rest of the thesis is organized as follows. Chapter 2 gives a literature review
regarding the previous content of smart grid, smart home and different approaches to
optimize the power consumption in HVAC systems. Then in Chapter 3 we present
our model of residential and commercial buildings, and introduce the thermal

7
functions into the model; in addition, we present the integration of Zigbee and the
HVAC systems. This is followed by Chapter 4, which we are presenting the
simulation results and giving out the performance analysis. The whole thesis is
concluded in Chapter 5 where we are introducing some future research works as
well.
1.5 Related Publications
W. Xie, I. Al-Anbagi and H. T. Mouftah, "Finite State Machine Performance
Analysis of Power Consumption in Residential and Commercial Buildings", in the
IEEE International Conference on Smart Energy Grid Engineering (SEGE'14), 11-13
August, 2014, Oshawa, ON, Canada.
W. Xie, I. Al-Anbagi and H. T. Mouftah, "Impact of End-to-End Delay in Zigbee-
based Communication Systems on Power Consumption in Smart Homes",
Proceedings of the 6th Annual WiSense Workshop, University of Ottawa, Aug.
2014.

8
Chapter 2
Literature Review
2.1 Introduction
Proper measurement needs to be taken on renovating the existing power grid
system into the next generation of smart grid due to the problems of global
increasing power demand and the air pollution brought by fuel burning. Smart grid
targets to co-operate the advanced ICT into power grid and thus initiate the operation
over the grid. Smart grid is considered as the new solution for the connection of
sensors, which could collect information and possibly analyze the data to be shared
within the auto-build or pre-defined network. Therefore, a great group of
applications have been studied over the past decades, such as environmental
monitoring, energy management in smart home and communities [MAG10]. Smart
grid has drawn an unprecedented attention in the last few years [QIU11]. Current
power system has been criticized as of incapability to take on the burden for daily
increasing demand, for example, unsound quality of monitoring over the aged power
grid would be able to cause the serious blackouts and large financial losses, the
concurrent imbalance between the growing demands and lack of enough power
supplied is being enlarged continuously in the future, appropriate maintenance over
the power grid system is urgently necessary [MEL11]. Finally, power system also
needs to be protected from being hacked by malicious attacks and misbehavior, a

9
more comprehensive multi-function system has to be applied to create the real safe
power grid environment.
In addition, in order to comprehend the concept of smart grid and how it is
achieving energy savings, we have to understand the physical power infrastructure
that backs up all of these cutting edge innovations, as well as at what point does the
savings come from. That is the exploration of power utilization in the residential and
commercial buildings, the particular methods to configure and manage the electrical
devices, and the renewable power resources along with the energy storage
mechanism.
This chapter is outlined into two parts. First part presents the overview of the
literature on smart grid and different applications along with their technical points.
From fundamental wireless sensor network techniques to specific approaches taken
in the studies are surveyed in this part. The second part is all about detailed smart
home technology, especially the research on HVAC systems. Therefore, this chapter
is listed as follows. Section 2.2 briefly introduces the importance of smart grid and
its basic architecture. In Section 2.3, the survey of technical design of smart home is
given here. Section 2.4 describes the studies of HVAC systems and the its detailed
energy consumption.
2.2 An Introduction to the Smart Grid

10
At the beginning of this century, two major electricity blackouts hit the North
America which caused sever financial losses of almost 10 billions U.S. dollars and
impacted about 55 millions of customers, this event aroused the discussions over the
reliability of the traditional power grid and urges the system to be renovated.
The increasing power plants and the mounting up renewable resources are giving
more pressure on the current power system in terms of power load shifting and GHG
emission. And a basic diagram illustrated the power generation is give as Figure 2.1.
Some latest techniques integrated into the old power system and the requirement of
customers nowadays demand to get involved in this process also give promote the
upgrading of the power grid system.
Figure 2.1 A basic power generation diagram1
Re-building the whole power grid system can be expensive, however, either
power supplier or customers would benefit a lot in terms of avoiding power
transmission, in another word, power generation and consumption can be
implemented at the same location, rendering the power supplier to produce more
1 Author: US Department of Energy, under GNU Licence

11
electricity according to the local need dynamically and avoid the transmission waste.
Moreover, prominent innovation of energy conservation has been proposed for a
while and the according research is still undergoing, hence more infrastructure of
power grid needs to be developed in order to lift up the whole system into a new era.
Smart grid is a highly integrated power grid based on the physical grid [MIL12]
as shown in Figure. 2.2. Smart grid is defined as “an electric network that can
intelligently integrate the actions of all users connected to it: generators, consumers
and those that do both, in order to efficiently deliver sustainable, economic and
secure electricity supplies".2
Figure 2.2 Smart grid conceptual scheme3
2 By European Technology Platform Smart Grid (ETPSG) definition 3 By Schneider & Electric company

12
As the extension of the existed power grid, it cooperated the renewable energy
generation as power plants into the system, combining the intellectual sensors
detecting the ambient information and sending these data to the analysis center for
the proceeded steps, eventually feedback into the system.
From the perspective of information sharing, the process of information and data
is implemented by the communication infrastructure that builds up the connection in
the grid. Plus, a controlling scheme is also a must taking responsibility of making
sure the interoperability of communication into the power grid works effectively and
efficiently [COS12].
To conclude the main features of smart grid, [MCD10] defined that it should
posses the following capabilities:
• Power efficiency: with the simplified power system and transmission losses to
improve the performance of load control, peak load shifting along with the
governmental policies for power reservation;
• Operational efficiency: enhance the power generation efficiency, communication
infrastructure optimization, improve the remote monitoring ability, power facilities
utilization and reduce the labor maintenance;
• Customer satisfaction: to consolidate the original state of customers’ operation
level and improve the customers’ self-service ability;

13
• GHG emission control: based on the load management to reduce the amount of
power needed and to fully utilize the renewable energy as well as the improvement
of the energy conservation, therefore enable the reduction of GHG emission.
There are two main challenges that needs to be solved when a concrete smart grid
system is being built: first is the interoperability between different power grid
infrastructures and the communication systems working on various protocols, and the
second is the scalability with lots of different power supply organizations and the
consumer environment where hundreds of appliances and cutting edge techniques will
be applied. Therefore, it is crucial to address these two challenges to further
implement the merging of both electrical and communication system into one unified
model. Smart grid system with correctly designed communication mechanism will
benefit its precise and efficiency energy consumption; in addition, a complete smart
grid system should also be functioned as information collector such as the amount of
power produced, transmitted, wasted, stored and consumed, as well as the
performance of its distribution into the communication part. [CHE10]
We are now taking an overview of the smart grid architecture in terms of the
internal components before the review of smart grid communication architecture. In
the smart grid system, several energy resources plants with its intermittent nature are
all associated into the electrical system as a complete entirety. As mentioned before,
traditional renewable energy resources such as sunlight, wind and tide will be
producing extra energy to supplement the shortage of the mainstream power
generation method such as fuel and nuclear power, that is to say, the surplus will be

14
flowing back to the backbone of power system when the extra energy generated by
the renewable power plants exceeds the real needs. [WAN11]
Under the guarantee of additional small-distributed energy resources, multi-
direction energy transmission can be realized in the power grid dynamically. As in
Figure 2.3 the smart grid architecture is built up, several devices with different
functionalities are included in order to achieve better management upon the system.
And these devices are A. Service provider, B. Market, C. Operation, D. Bulk
generation, E. Transmission, F. Distribution and G. Customers, blue arrows are
electrical flows and red dot arrows represent communications. Meanwhile,
communication infrastructures among different devices are responsible for
coordinating the diversified power bases throughout the whole system. The reference
smart grid framework proposed in NIST4 usually includes customers, markets, service
providers, management, bulk generation, transmission and distribution as well as
communication devices.
Figure 2.3 General Smart grid architecture
4 By National Institute of Standards and Technology
15
After taking a review on the traditional smart grid architecture, the smart grid can
be concluded as the system possessing the ability of the following key points
[CHE09]: (1) information transmission over the various agents; (2) data acquisition
and analysis at the fast pace; (3) always adapting to the industrial changes; (4)
scalability to more devices and various types of power systems while keep its
reliability and security.
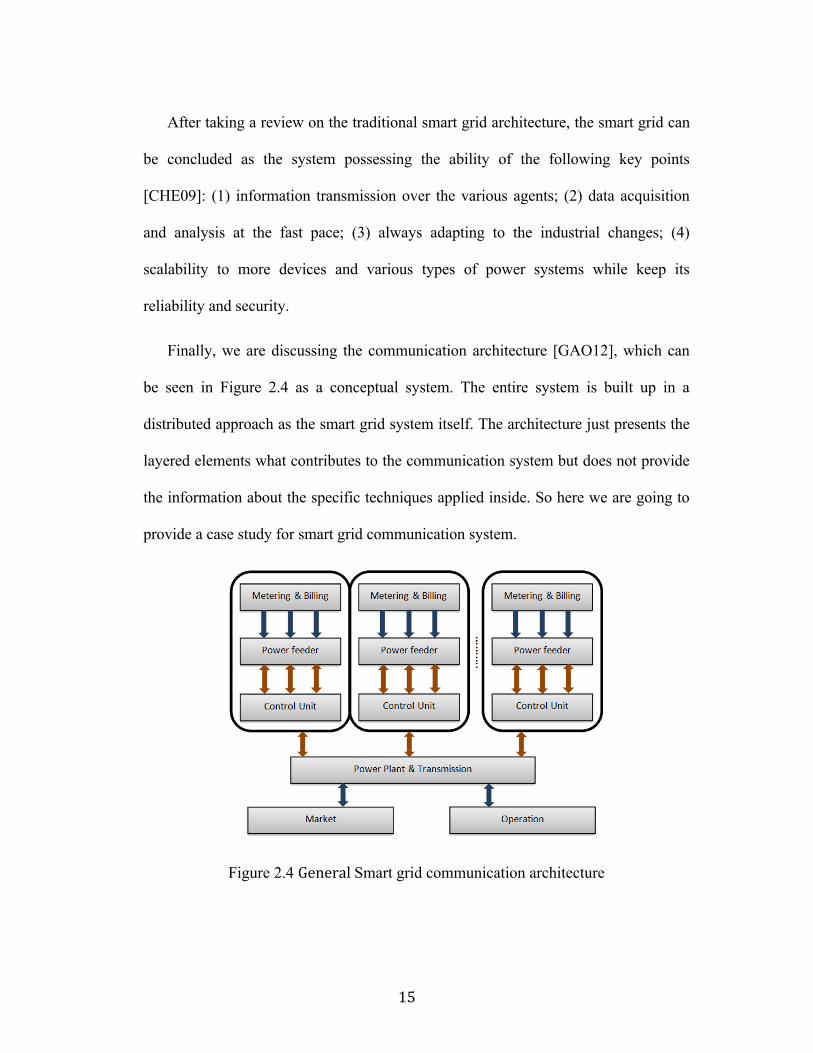
Finally, we are discussing the communication architecture [GAO12], which can
be seen in Figure 2.4 as a conceptual system. The entire system is built up in a
distributed approach as the smart grid system itself. The architecture just presents the
layered elements what contributes to the communication system but does not provide
the information about the specific techniques applied inside. So here we are going to
provide a case study for smart grid communication system.
Figure 2.4 General Smart grid communication architecture

16
Different communication techniques can be employed into smart grid networks
and both wired and wireless communication which establishes the connection
between power generator plants and the consumers are deployed largely for
supporting massive amount of applications such as demand response and distribution.
[MED10] The coverage area of the networks varies depending on different system
requirements and therefore diversified wireless communication techniques such as
cellular, radio frequency, 802.11 and the Zigbee that was adopted in our projects can
be applied inside of the smart grid communication systems.
In [PAP14] the author introduced a smart grid architecture of sensor platforms
based on a hierarchical structure, it is distributional platform which reduces the
possible environmental impact on the energy distribution and transmission side,
resulted from the reason that wireless sensor network possesses the disadvantages of
easily out-of-energy sensors, surrounding interferences and shadow fading.
Erol-Kantarci and Mouftah [MEL10] presented a mechanism called Appliance
Coordination (ACORD) which deploys in-home Wireless Sensor Network (WSN) in
order to improve the efficiency of energy consumption at the house-range level.
Time-Of-Use (TOU) rates and Energy Management Units (EMU) are also introduced
in this scheme to make it more reliable. TOU rates make the customers get billed in a
flexible way and the rates varies at different time period. EMU can coordinate the
requirements from customers and make rapid changes to the way of using power to
get further less billed. The challenges, however, still exists in the difficulty to change
people's choice on energy usage; secondly, energy waste for power oscillation when

17
load changes does exist and is unpredictable; and lastly, the potential communication
interference might impact the data transmission when different home appliances are
trying to communicate.
Authors in [BIS09] stated that power monitoring is incurring more attention due
to the power quality requirements. And they present a complete scattered power
supervision architecture, which focuses more on voltage monitoring based on the self-
organizing wireless sensor networks. In this project, every sensor node has the ability
to analyze the performance and take rapid actions based on the data collected locally
or transmitted from other sensor nodes.
Authors in [SCH12] presented a method called mosaic for merging the existed,
different kinds of simulation models into the smart grid simulation. It provides the
capability of system monitoring, specification of scenarios and the simulation model
establishment and a prototype has been validated over the approach proposed.
However, the simulation model is carried under a hierarchical structure which is
impossible in real life, additionally, the data communication between nodes in the
smart grid relies on the power transmission first which makes it constrained under the
requirement that communication should be among all nodes and power resources.
Communication system eventually has to be scalable for the potential use in the
future and they should also provide the support for the access network that connects
the backbone nodes to the attached extra nodes. Therefore in order to meet the
previous requirements, our simulator will be using wireless sensor network along with

18
Zigbee communication protocol. Zigbee WSNs are of lower cost, energy consumption
and the better performance in its scalability.
As mentioned previously, the study of smart grid can be penetrated into every
aspect but some trending topics are currently drawing the public’s attention in order
to realize the power utilization improvement, and these fields are list as below:
• Delivery Optimization
• Demand Optimization
• Asset Optimization
And under each category, some more specific applications are included, for
example, within the demand optimization scope, the idea of smart home automation,
load management, operation of renewable energy and TOU billings are proposed,
while smart metering is defined and carried out under asset optimization [COS12].
2.2.1 Demand and Response (D&R) optimization
By reconsidering the actual power demand and adjusting the load requirement
especially during the peak hours afterwards can largely improve the performance of
energy utilization both financially and efficiently. Demand and response as the vital
method through which the energy usage control can be covering the whole area from
physical grid to residential location is considered to be an effective way to enable the
customers dynamical shifting of the power need based on their using habit.
To help realizing improving the performance of power utilization through the
D&R method, a lot of according framework has been studied over the past decade.

19
[FAN10] proposed architecture for the distributed demand response and user
adaptation in smart grid networks, as well as he applied the idea of congestion
pricing in network traffic control and made the demonstration of how the billing data
can affect the customer demand by leveraging the network load, therefore, it is the
billing rate dominating the whole system to make the simulation and analysis.
Meanwhile, in [WAN10], end user preferences along with the idea of discomfort
level are aggregated and managed to maximize both energy efficiency and user
satisfaction. A distributed algorithm is also given to balance the power load and
eventually optimized the results using selfish load balancing approach.
A similar study was carried out by [MOH10], in their research, Energy
consumption scheduling devices are deployed into the smart meters within the local
area where a one and only energy source is provided. Distributed algorithm is
running automatically inside these devices to find the best solution to minimize the
overall power consumption. Two-way communication between smart meters and the
power grid via local area network was built to share the power usage data.
For the previous study, user preferences are taken into consideration right before the
optimization can be done. Two-way communication between the users and the power
providers is also required.
Overall, governments are still taking some measures to regulate the power market
along with the infrastructure of communication to be re-designed and built in order
to be interoperable with the physical power architecture.

20
2.2.2 Smart meter
A smart meter is an electronic device that reads and collects the real time power
consumption data in a certain fixed time intervals and sends it back to the power
utility company for supervision and billing purposes [MCK12]. This kind of device
usually supports a bi-directional communication between the device itself and the
monitor of the power system. Compared to Automated Metering Reading (AMR)
services, smart meter offers an unbroken chain of functions such as quality control,
dynamic billing query and unique customized user preferences. Integrating these
features into the Advanced Metering Infrastructure (AMI), power providers and
customers all can be benefitted with more diversified services and more accessible
information.
Apart from the advantages that smart metering might bring to both side, it
meanwhile offers a bunch of benefits to the customers on economical, social and eve
environmental protection level from their perspective. First, smart metering would
help customers better manage their billing queries and make the predication and
estimation for the future bills; secondly, smart metering at the same time is able to
provide the better management over their power usage, pointedly, smart meter
usually is commonly equipped outside every residential home so the customers can
directly read their real time data, by doing so customers can adjust their power
consumption in order to not only reduce tariff but also contributing to the GHG
emission endeavor.

21
The authors in [KAR11] elaborated the generic survey on smart metering
techniques and the specific role it should be playing in the smart grid architecture
along with the analysis of implementing approaches, some of the potential feature
that might be developed in the future was also discussed. Smart meters should serve
both residential and commercial customers, therefore, the connection between meters
and users gateway is of great importance here. Commonly, when people refer to
smart meters, not only power consumption should be supported, some other utilities
such as gas and water is also indispensible, thus, a multi-utilities smart meter that can
provide all the comprehensive information regarding the different daily utilities is the
future trending for the market. In addition, smart meters is better to be designed to be
embedded system so that utility company can program on its platform to have all
kinds of features implemented, and based on this point, a layered architecture should
be built up inside of smart meters. Finally, the model consisted of physical power
grid, utility company and the customers as end-users of smart meters are proposed at
the end of the survey.
Some of the techniques that are necessary for smart meters are widely studied.
[LUA09] proposed the wireless communication technologies design to implement
the smart power meters. The Zigbee system is given and integrated into the smart
meters to send the power consumption data to the end processor for the future
analysis and the possible feedback. Similarly, [CAO08] proposed the remote wireless
AMR system using Ethernet transmit data from the gateway set at the end-users to

22
the serve as the power utility company, wireless mesh network was deployed as the
topology structure and the routing protocol is designed and verified as well.
2.2.3 Load control
Load Control is under study since 1990s, according to the [LIU11], it is the
process of leveraging the supply of power with the load required from the end users
by shifting or taking the direct control over the load rather than the power delivered
as the fixed to the destined location. The whole idea can be implemented by the
manual or automatic interference over the power utilities at any time, either software
or hardware approach is applicable, for example, by the use of time clocks, or by the
pre-programmed billing system to affect the user’s power using habit. By taking load
control, the demand of power at peak hours might be alleviated and continuous to
reduce the total power consumption, as well as the cost of support and maintenance
upon delivery of extra power amount. Conceptually, load control can be
implemented using the following three types of control: direct control, local control
and decentralized control [COS12].
2.2.4 Power demand prediction
There is the central monitor taking control of all the home appliances, this central
monitor as we know for Home Energy Management (HEM) can provide various
functions benefiting both customers and power utility companies, and one of the
functions HEM can bring is the customer’s energy consumption profiling [KHA13],
and this information would help customers better schedule their power usage plan,

23
plus the power delivery burden would be largely reduced and maintenance cost is
expected to be reduced too.
Lots of endeavors have been spared by hundreds of researchers on modeling the
home power management through different approaches. [KAI11] gave a complete
and comprehensive review on these modeling techniques upon the end-use power
consumption in the residential area. The process of estimation of power usage made
based on the modeling and simulation can deploy either top-down or bottom-up
methods, for the previous approach, all the individual consumers as an entity in the
certain residential area is treated as the energy sink and there is no gap between
different power users; the latter bottom-up approach mainly concentrates on
collecting customer’s usage data and try to fit into the accumulated data model
provided by utility companies. Under the scope of top-down method, it seems
impossible to tell the difference between the users, that is to say, to decentralize the
prediction upon individual customer, its results may only in favor of a certain area of
community, and as it takes the raw collected data as a whole, the software design
might be easier to implement. However, on the contrary, bottom-up technique seems
have better performance in terms of customer’s perspectives; data regarding each end
user is collected individually in order to be extrapolated to represent the region based
on the representative weight of the modeled sample [BON11]. Moreover, what
makes bottom-up method stand out is that it consists of both statistics and
engineering approaches. Statistical Methods (SM) largely depends on historical data
and the regression analysis and to deploy this information to the specified end-user,

24
and the model can be deployed to predict the power consumption in the future. The
Engineering Methods (EM) as its name explained already, is taking consideration of
the empirical mathematical data model such as thermal characteristics of the house,
power consumption of the specified appliances and the energy using habits of
customers [FUM10].
The components of both top-down and bottom-up techniques for modeling power
consumption in the residential home area are illustrated in Figure 2.5.
Figure 2.5 Top-down and bottom-up modeling techniques for estimating the regional
or national residential energy consumption
Overall, energy consumption data aggregation is critical for the HEM, it provides
not only the power usage prediction under the optimization scheme, and also some
other services can be benefited too.

25
2.3 Review of smart home
Smart grid as presented in the previous content, integrates the communication and
monitoring technology into the traditional power grid system in terms of power
generation, delivery and distribution. These sections all targets to create the more
effective and efficient power grid environment, one important application that cannot
be ignored is the smart home, which usually contains a smart meters, smart
appliances and smart HEM as previously introduced. Figure 2.6 shows the
components of a typical smart home.
Figure 2.6 An example of Smart home automation
Smart home automation is the dwelling bridge of smart grid automation, which
mainly concentrates on the residential home activities. Central monitor may take
control over almost all the home appliances and secure the locks of the entrances, in

26
order to provide the living environment with better comfort, security and the most
important is the power utilization efficiency.
A home automation system consists of various electrical appliances within a
residential area. Local control is a critical issue for implementing home automation;
it takes responsibility to change the ambient environment for different activities, and
changes the working status of each device at home. All the devices can be connected
to a local area network or they can build up the network automatically and eventually
get communicated with a central monitor, which gives the permission to the
customers either locally or remotely. By integrating the information technology and
home automation, home appliances can work in an innovated method, creating a
more convenient, power utilization efficient and secured living environment.
2.3.1 Communication architecture for smart home
It has become the prevalence to for smart home marketing in the recent years
thanks to great changes taken place on the development of smartphone and wireless
communication technology. Home communication network can be built up via
different communication technologies such as wired Internet, wireless
communication and Power Line Communication (PLC), and therefore, gateway
between power grid and communication infrastructure has become an issue too.
Regarding to communication system in smart home, a wide range of selections as
well as the communication devices are very important as they are responsible for the
considerable data to be shared among power utility companies and customers, plus,
these data should be secured and only accessible to restricted group of people only.

27
In [KOA03], authors designed and implemented the Bluetooth enabled energy
meter, which sends the power consumption readings to the central processing unit
wirelessly. Meanwhile, [HWA14] proposed the HEM system based on PLC, which
takes usage of the existing power grid, network infrastructure, wireless
communication devices and internet connection to implement the power
consumption related data sharing. [HUC06] made a brief review over the
development of PLC, he stated in the paper that all the electrical devices with the
plug onto the wall are able to deploy the power line as their Internet service medium,
however, there are still some open issues: 1) High frequency signals transmitted on
the power line would cause higher interference due to the attenuation and noise to the
data that needs to be sent; 2) Topology deployment largely depends on the already
existed power line, modification or maintenance is hard to implement; 3) Different
power lines would increase the possibility of more interference to the ambient lines;
4) The data acquired at one single node of the local network, pointedly, at a home
appliances for example, are exposed to all the nodes in the connection and thus
increase the risk of attacks. [LIP11] designed the smart home devices based on D/R
scheme within the residential home, where the central control from the devices upon
the billing rate takes charges over the whole area. Zigbee devices are deployed here
enabling the interoperability between the home appliances and the interfaces through
out to the network.
After the issue of communicating with home appliances and the network
infrastructure has been built up, an interface between the control and the network

28
over the appliances become a new issue to be solved. [NIC02] introduced such kind
of generic interface covering a wide selection of appliances. In his paper, a self-
programming interface was developed for Personal Universal Controller (PUC) that
provided the complete appliance interface in only one device [COS12]. And based
on the first transmission of data through the interface, the PUC can inquire and adapt
to the scheme through the machine learning similar approach.
2.3.2 Management of renewable energy resources
Energy management is necessary in designing the architecture of smart grid. The
initial and essence purpose of deploying smart grid is to shrink the energy
consumption especially during peak times, thus to reduce the burden of entire power
infrastructure. By dynamic allocating the power load into different slots of time
rather than condensing in one could lend support to the purpose of achieving lower
power usage, in addition, by applying time-based pricing notification toward
residents could also done this [CHE09]. AMI and HEM are two main approaches to
create such automatic power distributing system.
One of the promising research directions in smart home is to introduce the
renewable energy resources into the environment, which could alleviate the sudden
power outages [CHE09]. As is known, solar and wind are the most talked about
methods of creating additional power, meanwhile, a Plug-in Hybrid Electrical
Vehicle (PHEV) is the latest innovation whose battery could be plugged into the
socket for power feeding [FER11]. Moreover, PHEV is able to offer the temporary
energy storage function for residential use. [OVI14] has implemented a model

29
simulating the aggregation of renewable power resources with traditional residential
power usage, and the PHEV has proven to not only reducing the energy bills but also
shifting the high power demand off peak hours.
Figure 2.7 A typical residential energy resource system [CHE09]
A brief illustration of residential renewable energy resource system is given as
Figure 2.7 shows. As can be seen, this ecosystem is able to take advantage of the
energy generated by solar and wind for the purpose of home appliances usage,
meanwhile, feeding power into the PHEV as the back up energy reservoir. The
central controller administrates the energy management and coordination. System is
able to take immediate reaction based on resident’s choice of energy use, scheduling
the utilization of energy for different appliances, making decisions on whether to use
the renewable energy into the house. Residents could easily access and control the
use of these devices and take actions remotely through web or mobile portals.
2.3.3 Power consumption in residential and commercial buildings

30
Based on the typical smart home model in Figure 2.7, sensors and control system
need to be installed in the buildings. Any home appliances related with heating and
cooling functions consumes much more energy than any other devices, such as
HAVC system and water tank, which account for around 56% of the entire
residential power consumption [PER08]. Authors in [WIL07] have discovered that
there is significant power wasted on inappropriate operation manner on the
appliances, for example, 24 hours switched-on air conditioners in unoccupied space,
extra power usage to countervail the unbalanced temperature in different rooms due
to the thermostat settings, and the possibility of appliances in off or standby mode.
Overall, the inappropriate operation on these appliances without HEM could lead
to a great amount of power loss.
2.3.4 Smart operation of home appliances
Rather than simply turn on and turn off the appliances, the operation over the
home appliances has to be smarter than before. Smart operation is proposed for home
appliances and the renewable energy resources, and based on different characteristics
of appliances; the authors in [CHE09] proposed the following approach. Each
appliance can be operated in four modes: device registration, switching on and off,
standby and auto-adjustment according to ambient environment.
31
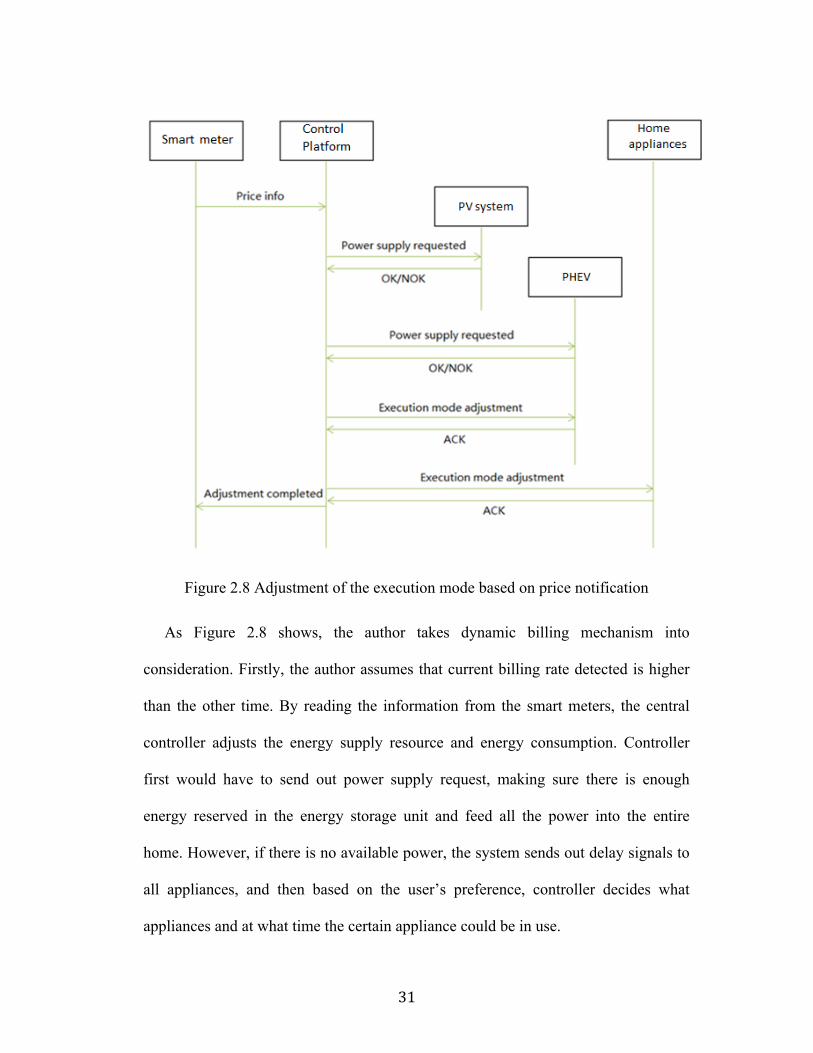
Figure 2.8 Adjustment of the execution mode based on price notification
As Figure 2.8 shows, the author takes dynamic billing mechanism into
consideration. Firstly, the author assumes that current billing rate detected is higher
than the other time. By reading the information from the smart meters, the central
controller adjusts the energy supply resource and energy consumption. Controller
first would have to send out power supply request, making sure there is enough
energy reserved in the energy storage unit and feed all the power into the entire
home. However, if there is no available power, the system sends out delay signals to
all appliances, and then based on the user’s preference, controller decides what
appliances and at what time the certain appliance could be in use.

32
2.3.5 Smart home energy management system
In this section, we briefly investigate the related work on smart home energy
management system.
Some researches showed the home network with efficient decision-making can
achieve significant energy savings. Authors in [WAN09] proposed an intelligent
agent-based middleware for context aware systems, which offered the users with
multiple services in different environment securely, and finally, they applied the
framework for a location-aware message system as the validation and application
example.
Another example of smart aware home system is proposed in [DAS02], by
acquiring the information from multi-camera tracking and audio sensors, the system
is able to acknowledge the location of residents and based on which, making the
right decisions. [HAN10] proposed a universal active sensor network-based control
system in residents, which distributes the home daily tasks to the pre-defined
component and activate the according home appliances with the smart sensors or
actuators attached on.
2.4 Review of HVAC Systems
The Heating, Ventilation and Air conditioning (HVAC) system is an integration
of infrastructures, devices and actuators that contribute to the indoor air exchanging,
providing the thermal comfort and improve the air quality [NIX06]. Tones of

33
research on HVAC systems have been carried out since last century, and the
devotion to improve the efficiency of the systems has never been stopped. HVAC
systems relate very closely with power consumption and environmental problems
and thus making it gathers a lot of attention. This section describes a survey on
different techniques and approaches studied in various literatures.
2.4.1 Power consumption in HVAC systems
In recent years, there are numerous studies that discuss methods to optimize
energy consumption in HVAC systems, current approaches mainly concentrate on
innovating advanced power efficient appliances, applying renewable energy as the
power supply, and investigating control strategies. In [LIN07] a feedback controller
for air conditioners is proposed and the results show that the air conditioner is more
efficiency by using this controller.
In [ZHA11], the authors have proposed an approach to independently control the
temperature and humidity, attempting to reduce the energy consumption of air
conditioner in an office building. In [MAZ09] and [HAS95], power efficient control
methods have been presented to adjusting the speed pumps in the central air
conditioner. In [ZAH93], authors have studied the power saving of air conditioner at
the temperature of 23 oC and a model has been presented to predict the power
consumption of air conditioners by studying the cooling load. Fuzzy control
approach has been utilized onto multiple air conditioners to improve the power
efficiency in [WAF09]. In [MOO11], the impact of power consumption of air

34
conditioner at different set temperature points has been tested in a single residential
house in Miami, Florida, USA.
In [WAN06] and [ING03], thermostat strategy as a primary control method has
been applied in the residential buildings. The results show that people’s comfort
level can be improved and significant power saving varies from 20% to 30%. In
addition, apart from residential houses, commercial buildings, office buildings and
the public architectures also can benefit from power savings by the deployment of
thermostat.
Renewable energy such as solar has been studied through past years onto air
conditioners, with which solar-assisted air conditioner is able to save significant
amount of power annually [BEC81].
In [WAN13], the authors have presented an energy consumption calculation
model for the estimation of energy consumption of air conditioners in a local data
center in South Africa at different temperature set points, the results show that the
root mean square between measured energy consumption data and the calculated
data is 9%.
2.4.2 Thermal control in HVAC systems
Investigation over the thermal control and energy management in HVAC systems
through out recent years mainly deployed optimization techniques, and most of them
model the systems in nonlinear optimization way [SAM11].

35
Authors in [WAJ09] proposed a model of Cooling, Heating and Power (CCHP) to
improve the efficiency of the system and alleviate the animal waste impact over the
natural environment, they targets at the suburb area with multiple objective
functions. A energy management strategy for residential electro-thermal micro-grid
based on renewable energy resources was introduced in [PAS14], this strategy
optimize the process in which power can be shifted to reduce the peaks and
fluctuations, and lend the power in the storage system when needed, they have tested
this strategy in a single family house with central HVAC systems, and the results
showed this mechanism could reduce the positive and negative peak by 52% and
72% respectively. In [MAR14], authors proposed smart home task and energy
resource utilization scheduling by using nonlinear programming function, which
solves the problem of nonlinearities from the residential temperature limitation, and
the results showed that the power consumption can be reduced while keeping the
same comfort level for the residents.
Considering nowadays, HVAC systems should be smart enough to meet different
thermal requirement among different residents in the same building, thus to
formulate the problem of multi-room control over HVAC systems. Various studies
have been carried out for the purpose of energy savings and peak load reduction
[MOR94][BRA02][BRA03][FAR07]. [YAN14] introduced an approach on pre-
cooling optimization to reduce the peak demand and energy cost. Authors in
[CHA02] proposed the inverse model on HVAC systems in a multi-room building
using short-term data for machine learning in order to let the system acquire the

36
optimal thermal settings. [MOS09] presented two optimal control strategies, the first
one adjusts the fresh air flowing rate and air temperature while keeping the same
level of air quality, and the second strategy adjusts the same conditions while
keeping the same level of comfort. Both strategies are established on the power
consumption cost but limited to the system and architecture constructional thermal
properties. [HUA13] presented the Artificial neural networks (ANNs) modeling for
thermal prediction in multi-room architecture.
2.4.3 Energy cost management in HVAC systems
The energy cost management of HVAC systems is receiving more attention
during the last few decades. Authors in [HAD07] presented an auto-adjusting energy
consumption threshold according to resident’s preference based on a thermal model.
[FON06] takes energy cost as a function into programming; this function contains
the parameters that could directly control air condition systems. In [NOH11] authors
takes consideration of dynamic billing into the simulation in addition to the energy
saving optimization, while in [NGU12][AVC12], not only dynamic billing is
included in the system, authors also includes residents comfort level as a very
important factor. Authors in [NGU12] created the simulation model of home energy
scheduling according to the general thermal dynamics, which is done by a look-up
table. A two-stage cost HVAC systems load control strategy is created for residential
buildings. In the first stage, the system finds out the relationship between electricity
bills and thermal settings throughout the whole day with the pre-defined
temperature-setting intervals, and in the second stage, system takes on the

37
mechanism of pre-cooling between random two consecutive time slots with different
billing prices. The results showed that the proposed strategy could achieve energy
saving while assuring comfort. In [JOR14], authors collected the comfort and
thermal data at different rooms in a commercial building, by applying different
sensor nodes within a WSN, and by doing so does the system offer a more precise
factor for the system to make decisions and achieves higher level of comfort.
2.5 Summary
A wide range of survey was covered in this chapter from smart grid technology to
one of its most important application, smart home, as well as some studies of HVAC
systems. Lots of challenges still exist not only over the level of smart grid
technology concept, but the whole world is still waiting for a delivery of a standard
and regulated smart grid formats. Overall, power utility companies, customers and
government shall all be participating in this process of increasing the performance of
energy utilization and make a better performance for the next generation of power
grid.

38
Chapter 3
System Analysis of HVAC Systems
3.1 Introduction
For power consumption in the residential building, HVAC system occupies a
large portion of the total energy utilization. [MOO11] carried out an investigation
over the components of annual energy consumption which can be seen from Figure
3.1, space heating and cooling (49%) is the biggest part of total power consumption
for a typical single residential home, compared to the relatively smaller portion
(10%) of water heating system, lighting (10%), computer and electronics (9%),
refrigerator (8%), etc., accumulated to 51% of the entire area. Thus the better
understanding of how HVAC system works would largely alleviate its impact over
the energy consumption.
Figure 3.1 Components of energy consumption in percentage

39
Both commercial and residential HVAC systems provide the environment inside
the buildings with “processed” air; the system also provides the relative comfort
level for human in terms of the cleanliness, temperature, humidity and the flowing
velocity of air. Air quality as the comprehensive index of healthy life greatly affects
our living environment. The American Society of Heating, Refrigerating and Air-
Conditioning Engineers (ASHRAE) has issued the standards which summarize air
quality for indoor comfort conditions that are acceptable to 80% or more of a
commercial building's occupants [4]. According to the standards, the temperature in
the air conditioned area is suggested to range from 20 °C to 24 °C in winter and 22
°C to 24 °C during summer. Depending on the air flowing rate and the ambient
temperature, indoor humidity is suggested to set around 50%.
In our research, we assume the models of single family home and commercial
building to be presented in Sections 3.3 and 3.4 all belong to the category of smart
homes.
The remainder of this chapter is outlined as follows. Section 3.2 introduces the
residential home power consumption model, Section 3.3 introduces the power
consumption model in commercial buildings, followed by Section 3.4, an Finite State
Machine (FSM) based model is presented in this chapter, and finally in Section 3.5,
wireless sensor networked HVAC system is presented here.
3.2 Residential home power consumption model

40
Power consumption of daily used home appliances was modeled in a typical
North American single family house as Figure 3.2 shows the two story single home
floor plan of around 250 square meters. Typical daily used home appliances included
in house are central air conditioner, space heater, refrigerator, water heater, lighting,
furnace, humidifier, television, electric oven, computer and other electronics, Table
3.1 is the suggested wattage of different appliances by Toronto Hydro [TORHY].
Here we do not consider non-daily-used appliances such as dishwasher, laundry and
vacuum, etc. although they consume a certain amount of power. The residential
house to be considered in our study has two story of the same height which means
the humidity and air is evenly distributed throughout the entire house. We assume
that there is no chimney and the heat storage impact can be ignored. Central air
conditioner is installed in order to leverage the temperature to the settings; in
addition to that, we assume the air conditioner is switched on 24 hours a day.
Figure 3.2 Floor plan for residential building suggested appliance wattage5
5 Floor plan by Monarch Group

41
Table 3.1 Home Appliances with Suggest Wattage [TORHY]
Appliances Wattage
Air conditioner (2.5 tons) 3500
Space heater 800
Refrigerator 500
Water heater 3000
Lighting 1000
Television & Computer 400
Electric oven 1000
In order to calculate the cooling load for which air conditioner has to work to
compensate, in order to keep the indoor temperature at a pre-set level, we present the
model of cooling load for air conditioner in Figure 3.3. As we can see, cooling load
usually consists four parts, which are transmission load, infiltration load, solar load and
internal load [ASHRA]. These four parts will be explained later in this section.
Figure 3.3 The components of cooling load

42
We apply the analytical model of [WAN13] into our scenario; total energy
consumed by air conditioner at the set pointer is calculated as (1). In [WAN13], the
authors have presented an effective thermal investigation and control approach on
reducing the energy consumption by air conditioners, by adjusting the temperature
set point. The results prove that every 1 °C increase of temperature is capable of
saving approximate 9% of power consumption. There are some important parameters
need to be explained here.
3.2.1 Transmission load
Transmission load is the heat-gain from the periphery of the building because of
the temperature difference between indoor and outdoor. It can be calculated as (3.1)
[ASHRA],
𝑄! = 𝑈𝑆 𝑇! − 𝑇! , (3.1)
where 𝑄! is the transmission load in watt, 𝑇! and 𝑇! are the indoor and outdoor
temperature respectively. 𝑈 is the heat transfer constant in W/m2K, and 𝑆 is the air-
conditioned area in m2.
3.2.2 Infiltration load
Infiltration load in the penetration of outside air into the building, which exists
mainly because of the wind and negative pressure against the air. The infiltration
load is calculated as (3.2) [DIA92],
𝑄!"# = 𝑞!𝑐!𝜌 𝑇! − 𝑇! + ℎ𝑞!𝜌 𝑊! −𝑊!" 𝑒𝑥𝑝 − !!!𝑡 , (3.2)

43
where 𝑞! is the air flow rate, 𝑐! is the real time heat of air, ρ is the air density, 𝑇! and
𝑇! are the outdoor and indoor temperature, h represents the heights of a single story
in the building, V is the volume of the entire building, 𝑊! is the current atmosphere
specific humidity and 𝑊!" is the indoor specific humidity, which can be largely
impacted by air flow and temperature. It is proved that relatively dry air (humidity
under 30%) would benefit the electricity to be more stable, thus avoiding the
potential power surplus situation. However, humans are quite sensitive to the
humidity [WAF08] due to the skin respiration mechanism; low humidity levels can
increase the risk of bacteria invading into our body, leading to dry skin, irritated
sinuses and throat, etc. Moreover, the same temperature environment with different
humidity level would let us feel different about the actual temperature, according to
American Environment Protection Agency; the ideal humidity level should be set
between 40% - 50% [USEPA]. In our study, the energy consumed by the humidifier
is assumed to be small and hence can be neglected; the air conditioner is also
regarded to function as air exchanging thus causing the humidity fluctuation within
the comfort range.
3.2.3 Solar load
The solar load is the temperature increase due to the solar radiation, windows is
the main concern in architecture that transmit the radiation. Solar load can be
calculated as (3.3) [ASHRA],
𝑄! 𝑡 = 𝐴!𝑆 𝑡 𝐸, (3.3)

44
where 𝐴! is the area of total windows in the building, E is the irradiance of solar
beam, and 𝑆 𝑡 is the Solar Heat Gain Co-efficient function (SHGC) which can also
be considered as overall energy performance of windows. Because the mix climate in
Ottawa determines that heating is used more extensive annually than cooling, the
windows with the SHGC vary between 0.3 and 0.4 are the best. In our model, we
choose a deterministic value of SHGC as 0.35. The transmission load is defined as
the heat gain results from the temperature difference of indoor and outdoor through
the wall and windows.
3.2.4 Internal load
Internal load is the heat-gain due to the heat generated by the indoor lighting and
other electric equipment, and lighting is the primary heat source, therefore internal
load can be calculated as (3.4) [ASHRA],
𝑄!"# = 𝐺!"#𝐹(𝑡), (3.4)
where 𝐺!"# is the total light wattage, 𝐹(𝑡) is the lighting use factor which is set to be
1 when light is on and 0 when its off.
3.2.5 Power consumption calculation
Based on the previous analysis, the total load air conditioner needs to work on is
the sum of the four parts of load as (3.5):
𝑄!"!#$ = 𝑄! + 𝑄!"# + 𝑄! + 𝑄!"#, (3.5)
And after further calculation, the power consumed by HVAC system can be
interpreted as (3.6),

45
𝐸 = !!!!!!!!!"#
!!!! 4 𝐴 𝑏!∆𝑇! + 𝑏! ∆𝑇! ∆𝑇! + 𝑏!∆𝑊𝑒𝑥𝑝 − !!!
!−
!!! ∆!!!
+
𝑏! ∆𝑇! ∆𝑊𝑒𝑥𝑝 − !!!!−
!!! ∆!!!
+ 𝑏!𝑆 𝑡 + 𝑏!𝐴 + 𝐺!"#𝐹 𝑡 + 4 𝐴 𝑏!∆𝑇! +
𝑏! ∆𝑇! ∆𝑇! + 𝑏!∆𝑊𝑒𝑥𝑝 − !!!!−
!!! ∆!!!
+ 𝑏! ∆𝑇! ∆𝑊𝑒𝑥𝑝 − !!!!−
!!! ∆!!!
+
𝑏!𝑆 𝑡 + 𝑏!𝐴 + 𝐺!"#𝐹 𝑡 , (3.6)
where 𝐸 is the total energy consumed by air conditioner at certain set temperature
point. The time period [𝑡! ,𝑡!!! ] is the duty cycle of measuring the total air
conditioner power consumption, A represents the area of the building in m2 to be
calculated. 𝑏! to 𝑏! are the coefficients that has been simulated by existing data in
[WAN13]. In equation (1), 𝐶𝑂𝑃 is the coefficient of performance of the air
conditioner cooling capacity [ASHRA], which is proportional to the sum of ambient
temperature and the temperature at the set point. Between certain period of time
[𝑡!,𝑡!!!], power consumption of air condition is calculated, in this paper, we choose
the time range to be an hour so that the power consumption of air conditioner at the
unit of time is easier to read. The energy consumption of HVAC system at the
temperature point of, for example, 23 °C, can be calculated as 𝐸!" , and humidity is
set accordingly as well. ∆𝑇! and ∆𝑇! in this example can be calculated by where
∆𝑇! = 𝑇! − 23− ∆, ∆𝑇! = 𝑇! − 23+ ∆, where ∆ represent the temperature interval
to control the air conditioner to be switched on and off, for example, when the
ambient temperature is 25 °C while 22 °C is the needed indoor temperature, air
conditioner will be switched on when compressor detects the temperature 𝑇 = 22+
1.5 = 23.5℃ while switched off at 𝑇 = 22− 1.5 = 20.5℃.

46
Power consumption calculated in (3.6) is the integration of the above four kinds
of load. We use equation (3.6) as the model to calculate the power consumption of
central air conditioner, but for the other home appliances, deterministic power
consumption is calculated by the time of running, we assume that the air conditioner
and the refrigerator are running continuously 24 hours a day, electrical heater works
24 hours only in winter, lights are switched on 6 hours per day, television and
computer are working 6 hours per day as well, water heater works different in
different seasons, also depending on the frequency of using hot water, water heater
could run for 20 minutes to an hour which summed up to around 3 hours a day in the
winter, and in the summer, most of the time it is in the standby mode, thus 2 hours is
the ideal time.
By using the model to calculate power consumption at different temperature set
points, we can find out the energy savings by the difference between the two power
consumption figures.
3.3 Commercial building power consumption model
Building structure and residing characters for commercial building are different
from those of residential buildings. First, the power consumption peak hours are
different, commercial building, taking shopping mall for example, opens from 9am
to 9pm on weekdays, while at the same time, residential buildings are almost vacant
of using power. Secondly, building material and its appliance patterns are different as

47
well. Lighting and air conditioners occupy almost 80% of the total power
consumption of the commercial buildings [LAM03]. With a much powerful central
air conditioner, different rooms are equipped with a sub-appliance, meaning there is
only one compressor working while different thermal settings can be achieved at
different locations. This giant system altogether serves a single big building to
maintain the comfort level. Moreover, the internal load generated mainly by lightings
should be proportional to the residential buildings in terms of the area.
In the last section, power consumption model on HVAC system has been well
applied into the residential buildings, we may also taking the system and expand it to
the volume of a commercial building, that is, a tall building with several small
residential house inside, and by doing so can we apply the same power calculation
model into commercial building too.
For a single unit of air conditioner, it is impossible to control the rate of the
changing of temperature, however, with multiple units of sub-air-conditioner, the
rate of heating or cooling becomes tangible.
We take a ten-story office building as research example in this thesis. As Figure
3.4 shows, each floor has four sections of area, and each area is equipped with five
sub-air-conditioners with a micro-controller. For the simplicity of study, we also take
the same parameters from the model of residential buildings and apply them here.

48
Figure 3.4 A single floor of a typical commercial building
What differs from residential building is the power consumption on electrical
devices, rather than regular daily task needs to be done in the residential, commercial
building operates in a different mode, and thus in the thesis, only HVAC system is
under study here.
3.4 Finite State Machine based simulation model
Finite State Machine (FSM) is a mathematical model of computation used to
design the computer program or system. It basically starts at the initial state at a
given time and can take actions based on the input into this state, and then jumps into
other state at the pre-defined time.
We developed a FSM based scenario to monitor the air conditioner working
process using open source software Ptolemy [DAV03]. As Figure 3.5 shows, there
are three states simulating the working status of HVAC system, initial, heating and
cooling respectively. Initial state represents the standby mode of air conditioner,
meaning it does not consume any power. Transitions between the heating and
cooling state depend on the current temperature, it is of the same approach when we

49
calculate the power consumption of a single residential house. For example, we set
the coolingpoint=25 °C and heatingpoint=22 °C, when the temperature as input starts
at 23 °C, the air conditioner keeps heating up the air until it reaches the temperature
of 25 °C then begins to cool down the air. There are four parameters here, which are
cooling point, heating point, cooling rate and heating rate. The rate of how fast the
air conditioner is controlling the air can be interpreted as the interval introduced in
(3.6), and it is proportional with the number of sub-air-conditioners working at the
same time. The FSM-based HVAC system simulation is carried out in the same
environment of residential and commercial buildings.
Figure 3.5 FSM-based air conditioner modeler
3.5 Zigbee-based smart HVAC systems

50
With the sensor nodes attached to each and every sub-air-conditioner, the HVAC
system is able to collect the data and send out the command signal to configure the
thermal settings for every unit.
Specifically, for the entire building there is one Full Function Device (FFD) node
that coordinates the whole system, all the remaining sensor nodes are Reduced
Function Device (RFD). Every floor has four sections, each installed with five sub-
air-conditioners, and for every five sub-units, there is a router controls their working
status. The network is established in a cluster tree manner. Vertically throughout the
building, these RFDs are only allowed to transceiver the signal from the RFD close
to it. Therefore, the network model on HVAC system can be illustrated as Figure 3.6.
The red bolt line represents the command signal sending to every RFD, and the green
thin line represents the data collected by different sub-air-conditioners at different
locations.
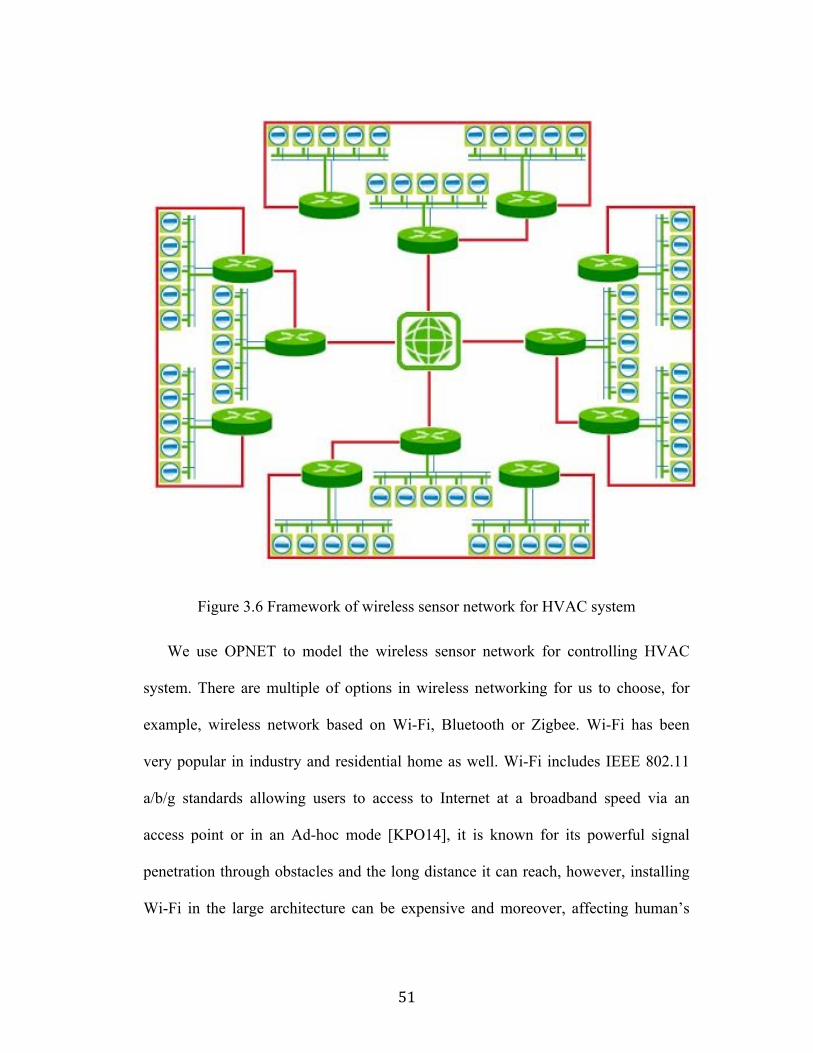
51
Figure 3.6 Framework of wireless sensor network for HVAC system
We use OPNET to model the wireless sensor network for controlling HVAC
system. There are multiple of options in wireless networking for us to choose, for
example, wireless network based on Wi-Fi, Bluetooth or Zigbee. Wi-Fi has been
very popular in industry and residential home as well. Wi-Fi includes IEEE 802.11
a/b/g standards allowing users to access to Internet at a broadband speed via an
access point or in an Ad-hoc mode [KPO14], it is known for its powerful signal
penetration through obstacles and the long distance it can reach, however, installing
Wi-Fi in the large architecture can be expensive and moreover, affecting human’s

52
health due to its electromagnetic radiation, thus making us eliminating this choice.
Bluetooth is not advised for long distance and long duration applications because of
its power consumption constraints. Therefore, for small scale of devices which need
long time running, far enough communication distance and limited power
consumption, Zigbee stands out among the wireless communication technologies as
a compromise of distance and power consumption. Table 3.2 summarizes the main
differences that need to well fit into our model among the three protocols.
Table 3.2 Comparison between Wi-Fi, Bluetooth and Zigbee protocols
Standard Wi-Fi Bluetooth Zigbee
IEEE Standard 802.11 a/b/g 802.15.1 802.15.4
Channel Bandwidth 2.4 GHz/5 GHz 2.4 GHz 868/915 MHz/2.4 GHz
Data Transfer Rate 54 Mb/s 1 Mb/s 250 kb/s
Power Consumption 15 - 20 dBm 0 - 10 dBm -25 - 0 dBm
Max Cell Nodes 2007 8 65000
Security 32-bit CRC 16-bit CRC 16-bit CRC
Self-healing Ability Medium Low High
Range 100 meters 10 meters 10 – 100 meters
Figure 3.7 is the overview of the simulation scheme. Every small group in the
overview has ten individual sensor nodes representing sub-air-conditioners, each one
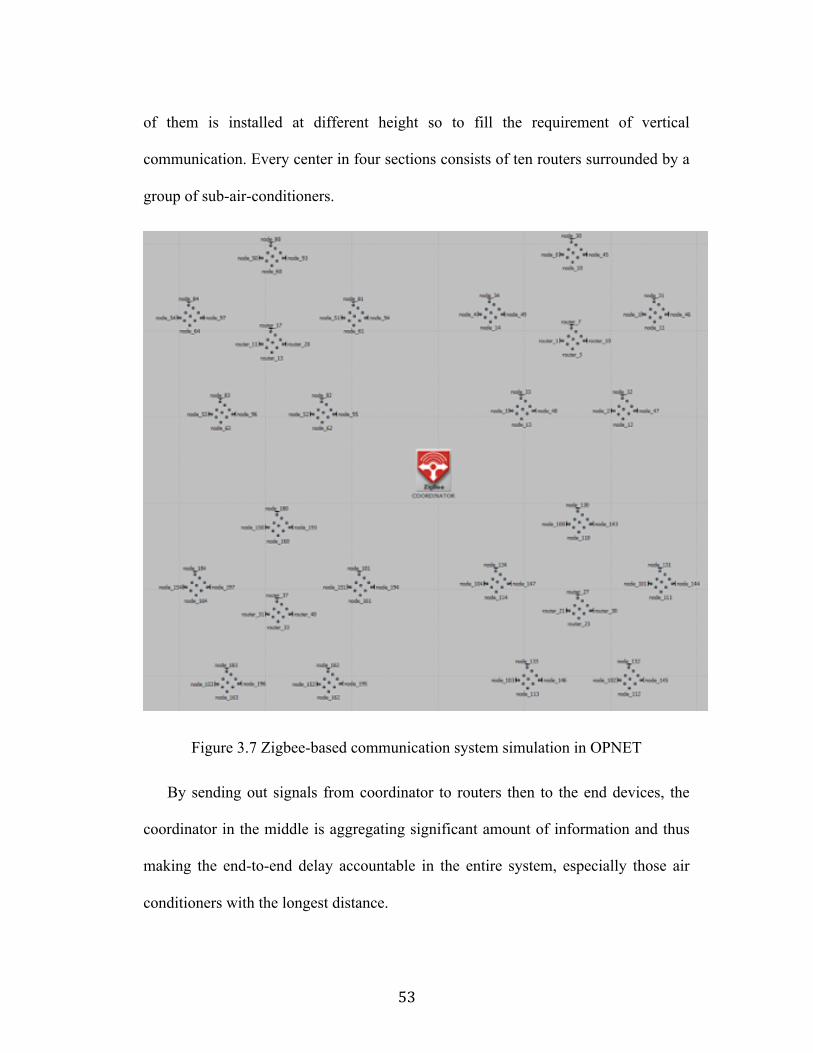
53
of them is installed at different height so to fill the requirement of vertical
communication. Every center in four sections consists of ten routers surrounded by a
group of sub-air-conditioners.
Figure 3.7 Zigbee-based communication system simulation in OPNET
By sending out signals from coordinator to routers then to the end devices, the
coordinator in the middle is aggregating significant amount of information and thus
making the end-to-end delay accountable in the entire system, especially those air
conditioners with the longest distance.

54
3.6 Summary
This chapter presents the model of residential home and commercial buildings
power consumption, we applied cooling load function into our model, and get the
specific power consumption at different time of the day. A FSM based analysis
model in designed to simulate the HVAC system working status, by setting the
parameters we can acquire the relationship between the time that HVAC system
needs to take to reach the configured temperature and the temperature itself. Finally,
we introduce Zigbee into the system in order to study the impact to end-to-end delay
over the HVAC system in terms of power consumption. The entire process can be
concluded as Figure 3.8.
Figure 3.8 Simulation process of the thesis
HVAC system power consumption calculation
FSM-based HVAC system simulation
Zigbee-based communication
simulation
End-to-end delay impact over HVAC
system

55
Chapter 4
Performance Evaluation and Results
4.1 Introduction
In this chapter, we evaluate the performance of power consumption of HVAC
systems in residential and commercial buildings based on the mathematical functions
formulated in Chapter 3. As for Section 4.2, the power consumption of residential
building is simulated and the results are shown here, as well as the performance
analysis. In Section 4.3, the simulation result of end-to-end delay in Zigbee
communication system is given, as well as its impact over the HVAC system.
Finally, Section 4.4 summarizes this chapter.
4.2 Power consumption in residential home
Considered the model established in Chapter 3, we consider a single family home
located in Ottawa as the example under our study. The floor area of the house is
around 250 square meters as Figure 3.2 shows. The total lighting wattage is 3.56
kWh, the relative humidity is calculated accordingly. For a better understanding of
how much power is consumed hourly, we set the time to be an hour for every
calculation. We select a typical month in all four seasons that are January, April, July
and October. Among which central air conditioner is only used in July and Electrical

56
heater is used in January, but for the other months, air conditioner is needed to work
to modulate the temperature and the ventilation has to work to evacuate the humidity
out. We assume the schedule for people to occupy the house is as follows, 7am –
8am is the wake up time, 8am – 5pm is the leave for work time, 5pm – 10pm is the
return from work time and 10pm – 7am is the sleeping time. We also choose the
most comfort level temperature at different sections of time according to Statistics
Canada [STACA] that 22, 25, 22 and 24 °C are considered the optimal temperature
in the previous four sections of the day. Yahoo weather provides the archived daily
temperature of 2013 in Ottawa, Ontario [YAWEA], and we chose the average data
for every hour throughout the whole day. In addition, for the other home appliances,
we assume them to be turn on for an hour every day, but water heating for two hours
in January. Figure 4.1 shows the power consumption under different temperatures of
the day to maintain the comfort level at certain temperature points, we chose to show
the results in these four months, and especially power consumption of HVAC system
in July because according to last year archive, July has the highest average
temperature.

57
Figure 4.1 Daily pow
er consumption in residential house at different m
onths in 2013, Ottaw
a

58
As shown from Figure 4.1, air conditioner consumes the most power from 7am to
11am and from 6pm to 10pm, as people are more active during these two periods of
time when the indoor temperature has to be set to 22 °C, which is relatively lower
than other temperature settings. Additionally, we noticed that during 8am to 5pm at
the temperature setting of 25 °C, the power consumption fluctuates around a stable
value, which mainly is contributed by the difference of the indoor and outdoor
temperature/humidity. From 11pm till 6am when 24 °C is the best temperature for
sleeping, air condition does not have to take that much burden to keep the
temperature low, therefore, consuming less power throughout the day. However,
January is an exception as the ambient temperature keeps going down at night so the
electric heater would have to consume more to maintain the temperature level. We
also noticed that, even October and April share very similar ambient temperature, the
power consumption of October is still relatively higher than that in April, that is due
to the higher humidity level in October, which results from the fact that air
conditioner usually consumes more power to cool down and dehumidifies the air
leakage into the house.

59
Figure 4.2 HVAC system power consumption at T0=22 °C
Since power consumption at selected temperature set point has been calculated, we
may also apply this model into a single unit of air condition in the commercial building
then the total HVAC system power consumption is relatively proportional to the
number of running air conditions. Figure 4.2 shows that as the ambient temperature
goes up, the energy HVAC system needs to maintain the indoor temperature at 22 °C
goes up accordingly, this is because of the HVAC system needs more power to
compensate the higher cooling load caused by ambient temperature.
3.8
3.9
4
4.1
4.2
4.3
4.4
4.5
4.6
23 24 25 26 27 28 29 30 31
Pow
er C
onsu
mpt
ion
(k/W
h)
Temperature (oC)

60
Figure 4.3 Initial Temp =20 °C, set point =24 °C with various heating rates
(0.1~1)

61
Figure 4.4 Initial Temp =26 °C, set point =20 °C with various cooling rates
(-1~-0.1)

62
Based on the model in Figure 4.3 and 4.4, we tried two scenarios, first one, the
initial temperature is set to 20 °C, and the cooling point is 19 °C, we change the
heating rate from 0.1 until 1 while cooling rate keeps the same; the second scenario
is just the opposite, start at 26 °C, the cooling rate differs from 0.06 to 3 while
heating rate keeps stable, these numbers here is just a quantified value representing
the unit of working air conditioners. We assume the initial ambient temperature is 26
°C, and the setting temperature at people’s need is 22 °C, the difference of power
consumption at 26 °C and 22 °C is around 4.15 kWh from Figure 4.5, moreover, we
can find out that the time that air conditioners need to lower the temperature is
shrinking when the cooling rate keeps getting fast.

63
Fig 4.5 The heating rate verses air conditioner heating Time
Fig 4.6 The cooling rate verses air conditioner cooling Time
However, from Figure 4.5 and 4.6, we can tell cooling/heating rate is infinitely
close to 0 but rather no less than 0, the time the air conditioners need to take the
temperature down tends to be infinite large. That is to say, the larger the rate is the
short time the HVAC system needs to achieve the temperature set point. Finally,
0 0.2 0.4 0.6 0.8 1
1.2 1.4 1.6 1.8 2
0.1 0.2 0.3 0.4 0.5 0.6 0.7 0.8 0.9 1
Time (s)
Hea+ng rate
0
0.5
1
1.5
2
2.5
3
-‐1 -‐0.9 -‐0.8 -‐0.7 -‐0.6 -‐0.5 -‐0.4 -‐0.3 -‐0.2 -‐0.1
Time (s)
Cooling rate
64
consuming this amount (4.15 k/Wh) of power per unit of air condition takes more
time than multiple air conditioners running at the same time, as the temperature can
be lower down to the set point faster.
4.3 Zigbee-based communication system results
We established the Zigbee communication model and introduce the system to
HVAC systems, so that every sub-air-conditioner could be remotely controlled, not
only to set the temperature but also to achieve the optimal power savings.
We place the coordinator at the first floor of the building. It offers the service for
local synchronization of the sensor nodes in its range, in this case, connects to all the
routers. All the other nodes are placed onto the sub-air-conditioner as the RFD. The
system deployed the cluster tree topology for better management within the HVAC
system. Coordinator initialize the wireless network as the root, through routers to
relay messages to the air conditioners, and sensor nodes can meanwhile collects the
data either as pre-defined or according to resident’s preference and send it over to the
coordinator. The parameters used in this system are listed as follows:
Destination: 1) Coordinator connects to all the routers;
2) First router in all four sections connect to coordinator, the rest of the
routers only connect to its previous ones respectively;
3) end-devices (sub-air-conditioners) are connected to the according

65
router
Packet Size: constant size packet of 2014 bytes
Packet inter-arrival time: constant with the index range from 0.05 to 10s
Height: we assume every floor is of 3.6 meters high and therefore every group of
devices are in an escalating order
Location: every group of device is of 20 meters spread apart
Start time: random passion distribution
Simulation time: 1 hour
Fig 4.7 Physical dimension of the Zigbee-based communication system

66
End-to-end delay in this system detects the delay between the coordinator and the
end devices by measuring the time interval when a message is queued for
transmission at the physical layer until the last bit is received [MIH11].
Fig 4.8 End-to-end delay in coordinator simulation results from OPNET
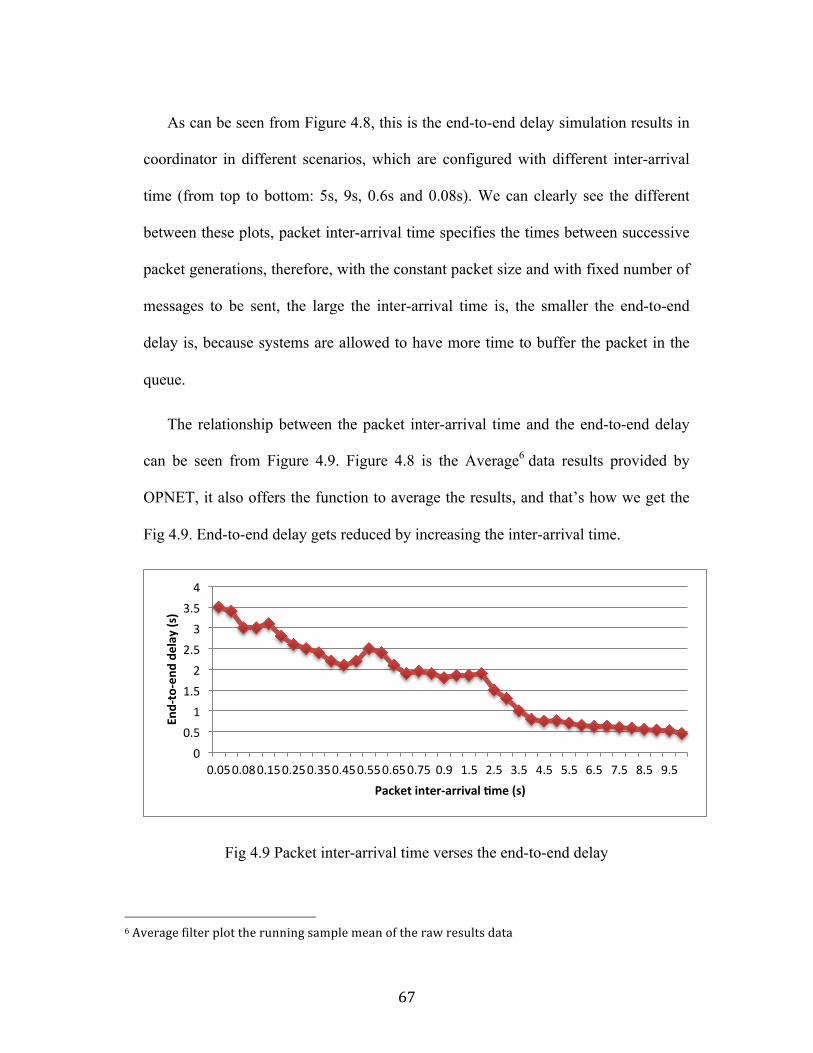
67
As can be seen from Figure 4.8, this is the end-to-end delay simulation results in
coordinator in different scenarios, which are configured with different inter-arrival
time (from top to bottom: 5s, 9s, 0.6s and 0.08s). We can clearly see the different
between these plots, packet inter-arrival time specifies the times between successive
packet generations, therefore, with the constant packet size and with fixed number of
messages to be sent, the large the inter-arrival time is, the smaller the end-to-end
delay is, because systems are allowed to have more time to buffer the packet in the
queue.
The relationship between the packet inter-arrival time and the end-to-end delay
can be seen from Figure 4.9. Figure 4.8 is the Average6 data results provided by
OPNET, it also offers the function to average the results, and that’s how we get the
Fig 4.9. End-to-end delay gets reduced by increasing the inter-arrival time.
Fig 4.9 Packet inter-arrival time verses the end-to-end delay
6 Average filter plot the running sample mean of the raw results data
0 0.5 1
1.5 2
2.5 3
3.5 4
0.05 0.08 0.15 0.25 0.35 0.45 0.55 0.65 0.75 0.9 1.5 2.5 3.5 4.5 5.5 6.5 7.5 8.5 9.5
End-‐to-‐end
delay (s)
Packet inter-‐arrival +me (s)

68
Taking into consideration of Fig 4.3 and 4.4, the HVAC system is time-sensitive,
by introducing the Zigbee wireless communication mechanism into the system could
bring power wasting or impact the comfort level, the HAVC system should have
reached the temperature set point ahead of time if not for the delay brought by the
WSN, the system would be waiting for the instructions to arrive, and within this
period of time, the temperature is changing at every second and thus cause the
unnecessary energy loss, or either the system just keeps in stand-by mode until the
instruction comes, causing the HVAC system consume more energy to reach the
target thermal settings. Because HVAC system works in a dynamic fluctuation
process in terms of temperature changing, thus when every period of delay
accumulated, the total impact is significant.
Such energy loss can be generalized as the (4.1) by using the model introduced in
Chapter 3, since the temperature is not immediate changed due to the delay of time.
𝐸!"## = 𝐸!"!# + ∆𝐸! − 𝐸!"##$%&∆𝐸! = ∆𝐸!!"#$%
!!∆𝐸 = 𝐸!"!# − 𝐸!"##$%&
(4.1)
Therefore within unit time, the system would be able to calculate the amount of
energy lost that HVAC system has to compensate originally, it should be
proportional to the time intervals, as we set 1 hour in Chapter 3.
Figure 4.10 presents a simple case of estimating the energy waste under the
impact of end-to-end delay in the same model as Fig 3.2, it illustrates the relationship
between delay and energy loss. The data of delay come from the OPNET simulation
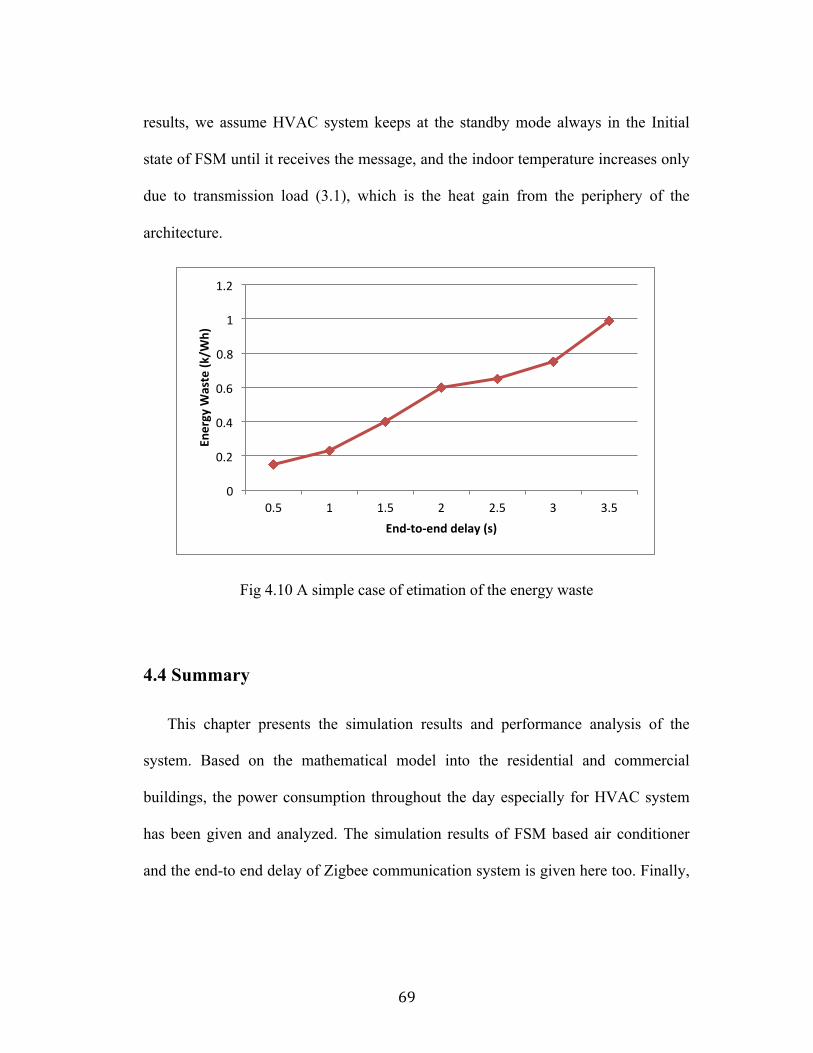
69
results, we assume HVAC system keeps at the standby mode always in the Initial
state of FSM until it receives the message, and the indoor temperature increases only
due to transmission load (3.1), which is the heat gain from the periphery of the
architecture.
Fig 4.10 A simple case of etimation of the energy waste
4.4 Summary
This chapter presents the simulation results and performance analysis of the
system. Based on the mathematical model into the residential and commercial
buildings, the power consumption throughout the day especially for HVAC system
has been given and analyzed. The simulation results of FSM based air conditioner
and the end-to end delay of Zigbee communication system is given here too. Finally,
0
0.2
0.4
0.6
0.8
1
1.2
0.5 1 1.5 2 2.5 3 3.5
Energy W
aste (k
/Wh)
End-‐to-‐end delay (s)

70
the impact of end-to-end delay over the power consumption of HVAC system is
analyzed too.

71
Chapter 5
Conclusions and Future Work
5.1 Conclusions
This thesis has focused on power consumption of HVAC system, and gives
performance analysis on the impact of end-to-end delay in Zigbee-based
communication system on power consumption in smart home. In order to understand
better of how this system works, we firstly investigated the wireless sensor networks
and smart grid technology, and then a wide range of survey on smart home, as well
as some studies of HVAC systems were presented. Great amount of challenges and
weakness of the system still exist not only on smart grid technology concept, but the
whole world is still waiting for the delivery of a standard and regulated smart grid
formats.
HVAC system occupies an important part as an electrical appliance in both
residential and commercial buildings, understanding its working behavior and
applies it to the real environment would greatly enhance the performance of the
entire power utilization. And therefore, we modeled the power consumption in the
scenarios of both singled family home and commercial building, especially the
power HVAC system consumes. A Mathematical model on power consumption of

72
HVAC system is introduced in our model to calculate the specific power
consumption at different indoor temperature set points.
Moreover, an FSM based analysis model was established to simulate the HVAC
system working status, by setting the parameters we can acquire the relationship
between the time that HVAC system needs to penetrate the cooling load out and the
temperature, and we give the initial effort of showing the relationship between the
cooling/heating rate and the power consumptions. Finally, we introduce Zigbee-
based communication system into the model in order to study the impact of end-to-
end delay over the HVAC system in terms of power consumption. And the results
prove that the delay does impact the power consumption of HVAC system, causing
unnecessary energy waste and affect the comfort level.
5.2 Future work
The mathematical model we introduced into our system has the coefficient
variant of the root mean square error of 9.7% between training data and the results,
which could be improved and the model ignored the cooling load caused by
evaporation could be studied more in the future.
The finite state machine used in the simulation model could be extended with
more states such as system idle and system complete. As the real HVAC system
works in a sophisticated way, more than just “heating” and “cooling” states, adding

73
more states into the model could considerably increase the practicality of the
simulation results.
Typical North American residential and commercial buildings are the topic of
this thesis, however, more types of architectures can be studied where different
factors such as height, area, location, and other infrastructural parameters may be
considered as well.
Zigbee communication protocol simulated in our system considers the physical
and MAC layer, more application layer development could be carried out here. As
well as the end-to-end delay affecting the power consumption of HAVC system
could be enriched. How the end-to-end delay impacts the HVAC system may not
only targets at the infiltration load section, but more ambient circumstances could be
taken into consideration.
There is still a lot in Zigbee communication system to be exploited, apart from
making effort to reduce end-to-end delay, how to securely transfer the message to
end devices while collecting the according data, avoiding the malicious attack into
the system could be discussed.
Great amount of research has been focused on incorporating power shifting and
dynamic billing mechanism together; therefore, considering these may lead to reduce
the burden of the power grid as well as the energy cost.

74
References
[ASHRA] ASHRAE Handbook-Fundamentals, American Society of Heating, Refrigerating and Air-Conditioning Enginners, Inc., Atlanta GA, USA (2009). [AVC12] M. Avci, M. Erkoc and S. S. Asfour, “Residential HVAC load control strategy in real-time electricity pricing environment,” proceedings of the IEEE Energytech, vol. 29, no. 31, May 2012, pp. 1–6. [BEC81] T. Beckey and L.W. Nelson, “Field test of energy savings with thermostat setback”, ASHRAE Journal, vol. 1, Jan 1981, pp. 67–70.
[BIS09] M. Bisceglie, C. Galdi, A. Vaccaro, and D. Villacci, “Cooperative sensor networks for voltage quality monitoring in smart grids,” Proceedings of IEEE Powertech, Bucharest, Romania, Jun 2009, pp. 1–6. [BON11] D. Bonino, F. Corno and L. De Russis, “energy consumption feedback: a user survey”, Energy and Buildings, Dec 2011, pp. 383–393. [BRA02] J. E. Braun, T. M. Lawrence, C. J. Klaassen, and J. M. House, “Demonstration of Load Shifting and Peak Load Reduction with Control of Building Thermal Mass”, proceedings of 2002 ACEEE Conference on Energy Efficiency in Buildings, Aug 2002, pp. 55-68. [BRA03] J. E. Braun, “Load Control Using Building Thermal Mass”, Journal of Solar Energy Engineering, vol. 125, Aug 2003, pp. 292-301.
[CAO08] L. Cao, J. Tian and Y. Liu, "Remote Wireless Automatic Meter Reading System Based on Wireless Mesh Networks and Embedded Technology," Fifth IEEE International Symposium on Embedded Computing, vol. 6, no. 8, Oct 2008, pp.192-197. [CHA02] N. Chaturvedi and J. E. Braun, “An Inverse Gray-Box Model for Transient Building Load Prediction”, International Journal of Heating, Ventilating, Air-Conditioning and Refrigeration Research, vol. 8, no. 1, Aug 2002, pp. 73-100. [CHE09] S. Chen, S. Song, L. Li and J. Shen, “Survey on smart grid technology”, Power System Technology, vol. 33, no. (8), April, 2009, pp. 1-7.

75
[CHE10] K. C. Chen, P. C. Yeh, H. Y. Hsieh and S. C. Chang, "Communication infrastructure of smart grid," 4th International Symposium on Communications, Control and Signal Processing (ISCCSP), vol. 2, no. 10, March 2010, pp.1-5. [CHJ09] J. Cheng and T. Kunz, “A Survey on Smart Home Networking”, Carleton University, Systems and Computer Engineering, Technical Report SCE-09-10, September 2009, pp. 1-62. [COS12] G. T. Costanzo , G. Zhu , M. F. Anjos and G. Savard, "A system architecture for autonomous demand side load management in smart buildings", IEEE Transactions on Smart Grid, vol. 3, no. 4,Aug 2012,pp. 2157-2166.
[DAS02] S. K. Das, D. Cook, A. Bhattacharya, E. O. Heierman and T. Y. Lin, “The Role of Prediction Algorithms in the MavHome Smart Home Architecture,” IEEE Wireless Communications Magazine, vol. 9, no. 6, Mar 2002, pp. 77-84. [DAV03] J. Davis, M. Goel, C. Hylands, B. Kienhuis, E. A. Lee and J. Liu, “Overview of the Ptolemy project”, Technical Memorandum UCB/ERL M03/25, Jul 2003. [DIA92] R. Diasty, P. Fazio and I. Budaiwi, “Modelling of indoor air humidity: the dynamic behaviour within an enclosure”, Energy and Buildings, vol. 19, Aug 1992, pp. 61–73. [FAN10] Z. Fan, “Distributed demand response and user adaptation in smart grids”, IEEEIIFIP 1M, Jan 2011, pp. 1-6. [FAR07] R. Faranda, A. Pievatolo and E. Tironi, “Load shedding: a new proposal”, IEEE Transaction on Power System, vol. 22, no.4, Oct 2007, pp. 2086-2093. [FER11] L. P. Fernandez, R. San, T. G. Cossent, R. Domingo and P. Frıas, “Assessment of the Impact of Plug-in Electric Vehicles on Distribution Networks”, IEEE Transactions on Power Systems, vol. 26, Oct 2011, pp. 206–213. [FON06] K. F. Fong, V. I. Hanby and T. T. Chow, “HVAC system optimization for energy management by evolutionary programming”, Energy and Buildings, vol. 38, no. 3, Mar 2006, pp. 220–231. [FUM10] N. Fumo, P. Mago and R. Luck, “Methodology to estimate building energy consumption using energy plus benchmark models”, Energy and Buildings, Jan 2010, pp. 2331–2337.
76
[GAO12] J. Gao, Y. Xiao, J. Liu, W. Liang and P. Chen, “A survey of communication/networking in Smart Grids,” Future Generation Computer Systems (Elsevier), vol. 28, no 2, Mar 2012, pp. 391-404. [HAB10] S. J. Habib and P. N. Marimuthu, “A coverage restoration scheme for wireless sensor networks within simulated annealing”, Proceedings of Seventh International Conference on Wireless and Optical Communications Networks, Colombo, Sri Lanka, 6-‐8 Septembe 2010, pp. 1-‐5. [HAD07] D. L. Ha, F. F. de Lamotte, and Q. H. Huynh, “Real-time dynamic multilevel optimization for demand-side load management,” proceedings of the IEEE International Conference on Industrial Engineering and Engineering Management (IEEM'07), December 2007, vol. 2, no. 4, pp. 945–949. [HAN10] D. M. Han and J. H. Lim, "Design and implementation of smart home energy management systems based on Zigbee", IEEE Transactions on Consumer Electronics, vol. 56, no. 3, Aug 2010, pp. 1417-1425. [HAS95] E.G. Hansen, “operation of variable speed pumps in chilled water system”, ASHRAE Journal, vol. 37, no. 10, Aug 1995, pp. 34–38. [HUA13] H. Huang, L. Chen, M. Mohammadzaheri, E. Hu and M. Chen, "Multi-zone temperature prediction in a commercial building using artificial neural network model", 10th IEEE International Conference on Control and Automation (ICCA), vol. 18, no. 24, June 2013, pp. 1896-1901. [HUC06] M. Huczala, T. Lukl, J. Misurec, “Capturing energy meter data over secured power line” proceedings of International Conference on Communication Technology, Oct 2006, pp. 1-4. [HWA14] K. Hwang and H. Kim, “Adaptive Home Power Management for Real Time Home Management Systems”, Life Science Journal, vol. 11, no. 7, Aug 2014, pp. 637-641. [ING03] J. Ingersoll and J. Huang, “Heating energy use management in residential buildings by temperature control”, Energy and Buildings, vol. 8, no. 1, Feb 2003, pp. 27–35. [JOR14] J. Serra, D. Pubill, A. Antonopoulos and C. Verikoukis, “Smart HVAC Control in IoT: Energy Consumption Minimization with User Comfort Constraints”, The Scientific World Journal, Vol. 2014, Jun 2014, pp. 32-42. [KAI11] A. Kailas, V. Cecchi, A. Mukherjee, “A survey of communications and networking technologies for energy management in buildings and home automation”, Journal on Computer Network Communication, Dec 2012, pp. 1-12.

77
[KAR11] S.Karnouskos, P. G. da Silva and D. Ilic, “Performance Evaluation of a Web Service Enabled Smart Metering Platform”, Energy-Efficient Computing and Networking, Springer Berlin Heidelberg, Berlin, Jan 2011, pp. 54-63. [KHA13] I. Khan, N. Javaid, M. Ullah, A. Mahmood, and M. Farooq, "A survey of home energy management systems in future smart grid communications", preprint arXiv:1307.7057, Jul 2013, pp. 1-6. [KOA03] B. S. Koay, S. S. Cheah, Y. H. Sng, P. H. J. Chong, P. Shum, Y. C. Tong, X. Y.Wang, Y. X. Zuo and H. W. Kuek, "Design and implementation of Bluetooth energy meter", Proceedings of the 2003 Joint Conference of the Fourth International Conference on Communications and Signal Processing, vol. 3, Dec 2003, pp. 1474-1477. [KPO14] K. Pothuganti and A. Chitneni, “A comparative study of wireless protocols: Bluetooth, UWB, Zigbee and Wi-Fi”, Advance in Electronic and Electrical Engineering, vol. 4, no. 6, Mar 2014, pp. 655-662. [LAM03] J. C. Lam and D. H. W. Li, “Electricity consumption characteristics in shopping Malls in subtropical climates”, Energy Conversion and Management, vol. 44, Jan 2003, pp. 1391–1398. [LIP11] M. Lipski, “Demand Response—Technology for the Smart Grid”, Electricity Today, May 2011, pp. 1-4. [LIN07] J. Lin and T. Yeh, “Modeling, identification and control of air-conditioning systems”, International Journal of Refrigeration, vol. 30, Sep 2007, pp. 209–220. [LIU11] C. Liu, Q. Zeng and Y. Liu, "A Dynamic Load Control Scheme for Smart Grid Systems", Eenregry Procedia, Nov 2011, pp. 200-205.
[LUA09] S. W. Luan, J. H. Teng, S. Y. Chan and L. C. Hwang, “Development of a smart power meter for AMI based on ZigBee communication”, International Conference on Power Electronics and Drive Systems, Nov. 2009, pp. 661-665.
[LUI10] T. J. Lui, W. Stirling, and H. O. Marcy, “Get Smart”, IEEE Power and Energy Magazine, vol.8, May-June 2010, pp. 66-78. [MAG10] S. Magazine, P. Policy, S. Grid, “NIST interoperability framework and action plans”, IEEE Power and Energy Society General Meeting, Sep 2010, pp. 1–4. [MAR14] S. Marco, S. Squartini, G. P. Surace and Francesco Piazza, “Smart Home Task and Energy Resource Scheduling Based on Nonlinear Programming”, proceedings of the 23rd Workshop of the Italian Neural Networks Society (SIREN), vol. 26, Feb 2014, pp. 175-185.

78
[MAZ09] Z. Ma and S. Wang, “Energy efficient control of variable speed pumps in complex building central air-conditioning systems”, Energy and Buildings, vol. 41, Nov 2009, pp. 197–205. [MCD10] J. Mcdonald, “The smart grid”, Paris energy summit, 2010. [MCK12] E. McKenna, I. Richardson and M. Thomson, “Smart meter data: Balancing consumer privacy concerns with legitimate applications”, Energy Policy, vol. 41, Feb 2012, pp. 807-814. [MED10] J. Medina, N. Muller and I. Roytelman, “Demand Response and Distribution Grid Operations: Opportunities and Challenges”, IEEE Transactions on Smart Grid, vol. 1, no. 2, Sept 2010, pp. 193-98. [MEL10] M. Erol-Kantarci and H. T. Mouftah, "Wireless Sensor Networks for Domestic Energy Management in Smart Grids", Proceedings of 25th Biennial Symposium on Communications, May 2010, pp. 63-66. [MEL11] M. Erol-Kantarci and H. T. Mouftah, "Wireless multimedia sensor and actor networks for the next generation power grid", ELSEVIER Journal of Ad Hoc Networks, vol. 9, no. 4, June 2011, pp. 542-551. [MIH11] B. Mihajlov and M. Bogdanoski, “Overview and Analysis of the Performances of ZigBeebased Wireless Sensor Networks”, International Journal of Computer Applications, vol. 29, no. 12, Sep 2011, pp. 28-35. [MIL12] L. Mi, “Analysis on Energy Balance for a Smart Grid in Stadshavens Area, Rotterdam”, Master Thesis. Delft University of Technology, Netherlands, Jan 2012. [MOH10] A. Mohsenian-Rad, V. Wong, J. Jatskevich and R. Schober, “Optimal and autonomous incentive-based energy consumption scheduling algorithm for smart grid”, IEEE PES Conference on Innovative Smart Grid Technologies, Jan 2010, pp. 1-6. [MOO11] J.W. Moon and S.H. Han, “Thermostat strategies impact on energy consumption in residential buildings”, Energy and Buildings, vol. 43, Oct 2011, pp. 338–346. [MOR94] F. B. Morris, J. E. Braun and S. J. Treado, “Experimental and Simulated Performance of Optimal Control of Building Thermal Storage”, ASHRAE transactions, vol. 100, no. 1, Oct 1994, pp. 402-414. [MOS09] M. Mossoll, K. Ghali and N. Ghaddar, “Optimal control strategy for a multi-zone air conditioning system using a genetic algorithm”, Energy, VOL. 24, Sep 2009, pp. 58-66.

79
[NGU12] H. T. Nguyen, D. Nguyen and L. B. Le, “Home energy management with generic thermal dynamics and user temperature preference,” proceedings of the IEEE International Conference on Smart Grid Communications (SmartGridComm'13), vol. 2, Oct 2013, pp. 552-557.
[NIC02] J. Nichols, B. Myers, T. K. Harris, R. Rosenfeld, S. Shriver, M. Higgins and J. Hughes, "Requirements for Automatically Generating Multi-Modal Interfaces for Complex Appliances", proceedings of the Fourth IEEE International Conference on Multimodal Interfaces, October 2002, pp. 377-382. [NIX06] X. Ni, W. Hu, Y. Sun, G. He, Q. Lu, "The Design and Implementation of HAVC System”, International Conference on Power System Technology, vol. 1, no. 6, Oct 2006, pp. 22-26. [NOH11] S. Noh, J. Yun and K. Kim, “An efficient building air conditioning system control under real-time pricing”, proceedings of the International Conference on Advanced Power System Automation and Protection (APAP '11), vol. 2, Oct 2011, pp. 1283–1286. [OVI14] R. M. Oviedo, Z. Fan, S. Gormus and P. Kulkarni, “A residential PHEV load coordination mechanism with renewable sources in smart grids”, International Journal of Electrical Power & Energy Systems, vol. 55, Feb 2014, pp. 511-521. [PAP14] P. Papageorgasa, D. Piromalisb, T. Iliopouloua, K. Agavanakisa, M. Barbarosoua, K. Prekasa and K. ntonakogloua, “Wireless Sensor Networking Architecture of Polytropon: An Open Source Scalable Platform for the Smart Grid”, Energy Procedia, Vol. 50, Jul 2014, Pages 270–276. [PAS14] J. Pascual, P. Sanchis and L. Marroyo, “Implementation and Control of a Residential Electrothermal Microgrid Based on Renewable Energies, a Hybrid Storage System and Demand Side Management”, Energies, vol. 7, no. 1, Jan 2014, pp. 210-237. [PER08] L. Perez-Lombard, J. Ortiz and C. Pout, “A review on buildings energy consumption information”, Energy and Buildings, vol. 40, no. 3, Jun 2008, pp. 394–398. [QIU11] M. Qiu, W. Gao, M. Chen, J. Niu, L. Zhang, “Energy efficient security algorithm for power grid wide area monitoring system”, IEEE Transactions on Smart Grid, vol. 2, no. 4, Aug 2011, pp. 715–723. [SMARH] Smart Home Energy, http://smarthomeenergy.co.uk/what-smart-home.

80
[SAM11] T. Samad and A. Annaswamy, “The Impact of Control Technology Overview, Success Stories, and Research Challenges”, IEEE Control Systems Society, Feb 2011.
[SCH12] S. Schutte, S. Scherfke and M. Sonnenschein, “Mosaik – Smart Grid Simulation API Toward a Semantic based Standard for Interchanging Smart Grid Simulations”, Smartgreens 2012 Conference, Sep 2012, pp. 14-24. [STACA] Statistics Canada, Controlling the Temperature in Canadian Homes, http://www.statcan.gc.ca. [TORHY] Toronto Hydro, Appliance Usage Chart, http://www.torontohydro.com/s ites/electricsystem/residential/yourbilloverview/Pages/ApplianceChart.aspx. [USE09] U.S. Energy Information Administration, “Residential energy consumption survey (recs)”. http://www.eia.gov/todayinenergy/detail.cfm?id=6570. [USEPA] United States Environment Protection Agency, Mold Resources, http://www.epa.gov/mold/moldresources.html. [WAF08] S. Wafi and M. Ismail, “The Relationship Between Thermal Performance, Thermal Comfort and Occupants”, 2nd International Cconference on Built Environment in Developing Countries, vol. 18, Aug 2008, pp. 56-70. [WAF09] F. Wang, H. Yoshida, B. Li, N. Umemiya, S. Hashimoto, T. Matsuda and H. Shinbayashi, “Evaluation and optimization of air-conditioner energy saving control considering indoor thermal comfort”, Building Simulation, July 2009, pp. 27-30. [WAJ09] J. Wang, Y. Jing and C. Zhang, “Optimization of capacity and operation for CCHP system by genetic algorithm”, Applied Energy, vol. 87, iss. 4, Apr 2010, pp. 1325–1335. [WAN06] F. Wang and H. Yoishida, K. Matsumoto, “Energy consumption estimation for room air-conditioners using room temperature simulation with one-minute intervals”, International Conference for Enhanced Building Operations 2006, Nov 2006, pp. 6-9. [WAN09] C. D. Wang, X. Q. Liu and H. B. Wang, “A Framework of Intelligent Agent Based Middleware for Context Aware Computing”, Fifth International Conference on Natural Computation, vol. 6, Aug 2009, pp.107-110. [WAN10] C. Wang and M. Groot, “Managing end-user preferences in the smart grid,” ACM e-Energy, Apr 2010, PP.105-114.

81
[WAN11] W. Wang, Y. Xu and M. Khanna, “A survey on the communication architectures in smart grid”, Computer Networks, vol. 55, Jun 2011, pp. 3604-3629. [WAN13] N. Wang, J. Zhang and X. Xia, “Energy consumption of air conditioners at different temperature set points”, Journal of Energy and Buildings, vol. 65, Jun 2013, pp. 412–418.
[WIL07] E. D. Williams and H. S. Matthews, “Scoping the Potential of Monitoring and Control Technologies to Reduce Energy Use in Homes”, proceedings of the 2007 IEEE International Symposium on Electronics & the Environment, May 2007, pp. 239-244.
[YAH10] F. Tahersima, J. Stoustrup, H. Rasmussen and P. G. Nielsen, "Thermal analysis of an HVAC system with TRV controlled hydronic radiator," Automation Science and Engineering (CASE), 2010 IEEE Conference, Aug 2010, pp.756-761. [YAN14] S. Yang, S. Rong and P. Kameshwar, “Distributed Scheduling for Efficient HVAC Pre-cooling Operations”, proceedings of the 19th IFAC World Congress, vol.19, no. 1, Aug 2014, pp. 10451-10456. [YAWEA] Yahoo Weather Canada, https://ca.weather.yahoo.com. [ZAH93] M. Zaheer-Uddin, “Optimal, sub-optimal and adaptive control methods for the design of temperature controllers for intelligent buildings”, Building and Environment, vol. 28, no. 3, Jul 1993, pp. 311–322. [ZHA11] K. Zhao, X. Liu, T. Zhang and Y. Jiang, “Performance of temperature and humidity independent control air-conditioning system in an office building”, Energy and Buildings, vol. 43, Dec 2011, pp. 1895–1903.

82
Appendix A
Confidence Interval
In the engineering field, the correctness of simulation results is opened to be
questionable for their validity, and therefore the Confidence Interval (CI) is
introduced to testify the statistical accuracy. Generally, when the simulation is run
under the same condition, that is, the same group of initial and environmental values
and the same input, the results is still supposed to be different each time because of
the statistical independency of each and every simulation. CI provides us with an
estimated range of values which is likely to include the population parameter of
interest. Here is the definition of CI: assume there exists an unknown parameter 𝜃 of
a set of values 𝑋!,𝑋!,… ,𝑋! , for the given 0 < 𝛼 < 1, if 𝜃 satisfies 𝑃 𝜃! ≤ 𝜃 ≤
𝜃! = 1− 𝛼, we define the range 𝜃!,𝜃! is the confidence interval of 𝜃 when its
confidence is 1− 𝛼, 𝜃! and 𝜃! are the confidence lower bound and upper bound
respectively. 1− 𝛼 is called the confidence, and the selection of confidence is based
on the requirement, for example, we choose 95% as the CI for the results in the
thesis, which means the probability of the simulation results 𝑃 𝜃! ≤ 𝜃 ≤ 𝜃! = 1−
𝛼. Let us assume 𝜇 is the mathematical expectation and 𝜎! is the variance, and
𝑋!,𝑋!,… ,𝑋! is the sample of set 𝑋~𝑁 𝜇,𝜎! , 𝑋 and 𝑆! are the sample average and
sample variance, our job is to find the range based on the set of result values for the
given 𝛼, it contains the expectation 𝜇 of 𝑋 with probability 1− 𝛼.

83
For the given variance 𝜎!, the confidence interval of 𝜇 is calculated as below:
there is 𝑋~𝑁 𝜇,𝜎! , and 𝑋~𝑁 𝜇, !!
!,
𝐸𝑋 = 𝜇, 𝐷𝑋 = !!
!,
random value 𝑍 = !!!
!!!
~𝑁(0,1),
assume 𝑃 !!!
!! !
≤ 𝑧!!= 1− 𝛼,
then 𝑃 −𝑧!!≤ !!!
!! !
≤ 𝑧!!= 1− 𝛼,
𝑃 − !!𝑧!!≤ !!!
!! !
≤ !!𝑧!!= 1− 𝛼,
𝑃 𝑋 − !!𝑧!!≤ 𝜇 ≤ 𝑋 + !
!𝑧!!= 1− 𝛼,
and here we acquire 𝑋 − !!𝑧!!≤ 𝜇 ≤ 𝑋 + !
!𝑧!!
, the confidence interval we need,
𝑋 − !!𝑧!! is the confidence lower bound, and 𝑋 + !
!𝑧!! the upper bound.
and the set of values should follow the normal distribution as Figure A.1.

84
Figure A.1 Normal distribution
As we mentioned before, we choose 95% as the CI for simulation results, then the
value of 𝑍!! is 0.5× 1− 0.95 = 0.025. The CI obtained is referred to as the CI with
probability 1− 𝛼 confidence. In this thesis, 95% confidence interval is obtained.