Embed Size (px)
Citation preview
Energy Consumption in U.S. Agriculture
John A. MiranowskiProfessor of EconomicsIowa State University

Introduction
• Premise that energy consumption is driven by real energy and relative prices
• Agriculture may be more vulnerable to energy disruptions than to price shocks
• Government policies provide incentives and disincentives for energy consumption
Objectives• Establish farm energy consumption baseline
• Evaluate responsiveness of producers to real energy and other relative price changes
• Assess vulnerability to energy supply disruptions
• Consider energy efficiency of farm production and other sectors
• Discuss roles of technology, farm policy, and rural energy security
Current Farm Energy Consumption
• Direct energy – diesel, gasoline, LP gas, natural gas, and electricity
• Indirect energy – fertilizers and pesticides

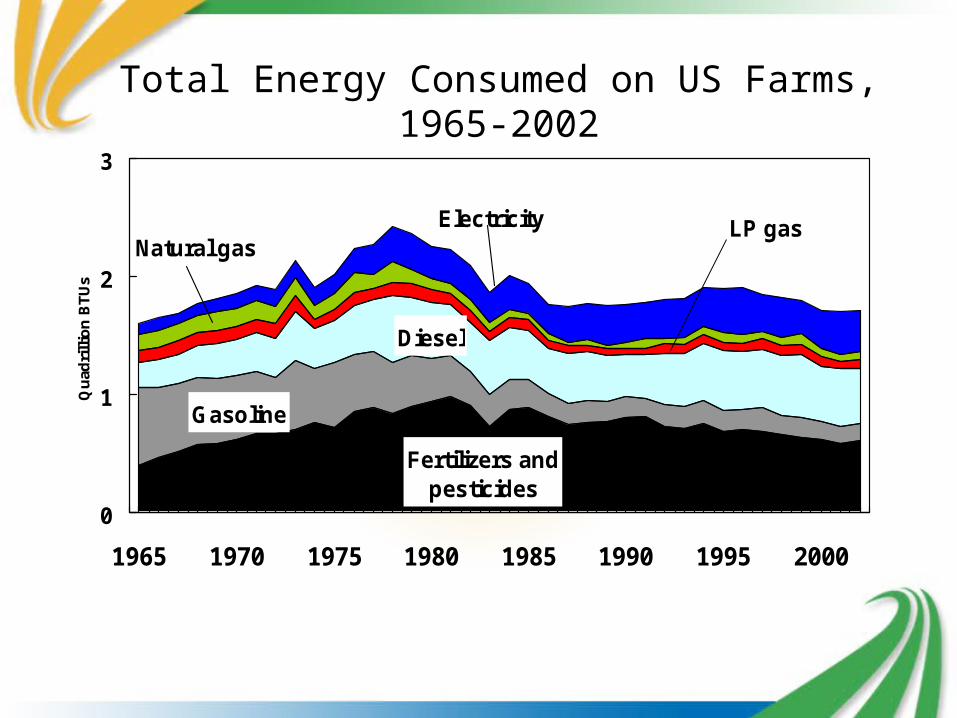
Total Energy Consumed in US Farms in 2002Total = 1.7 Quadrillion BTUs
Fertilizers28%
Diesel27%
Electricity21%
Natural Gas4%
Gasoline9%
Pesticides6%
LP Gas5%
Changes in Farm Energy Consumption over Time
• Diesel fuel and gasoline
• Electricity
• Fertilizers and pesticides
Fertilizers and pesticides
Gasoline
Diesel
LP gasNatural gas
0
1
2
3
1965 1970 1975 1980 1985 1990 1995 2000
Qu
adri
llio
n B
TU
s
Electricity
Total Energy Consumed on US Farms, 1965-2002
Energy Consumption and Farm Production
Expenditures• Direct energy consumes twice as
many BTUs as indirect energy, but
• Direct energy accounts for 5-7% of farm expenditures
• Indirect energy accounts for 9-10% of farm expenditures
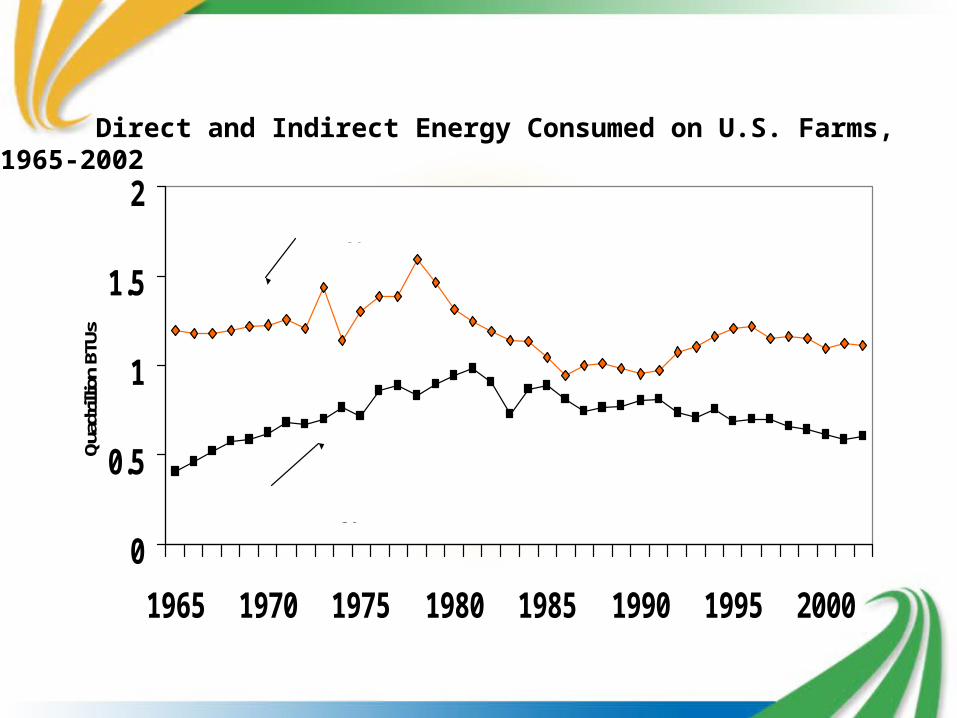
Direct and Indirect Energy Consumed on U.S. Farms, 1965-2002
0
0.5
1
1.5
2
1965 1970 1975 1980 1985 1990 1995 2000
Qua
drill
ion
BTUs
Direct energy
Indirect energy

Energy Expenditures in Crop and Animal Production
• Field crop production
• Animal production
• Specialty crop production
• Irrigation
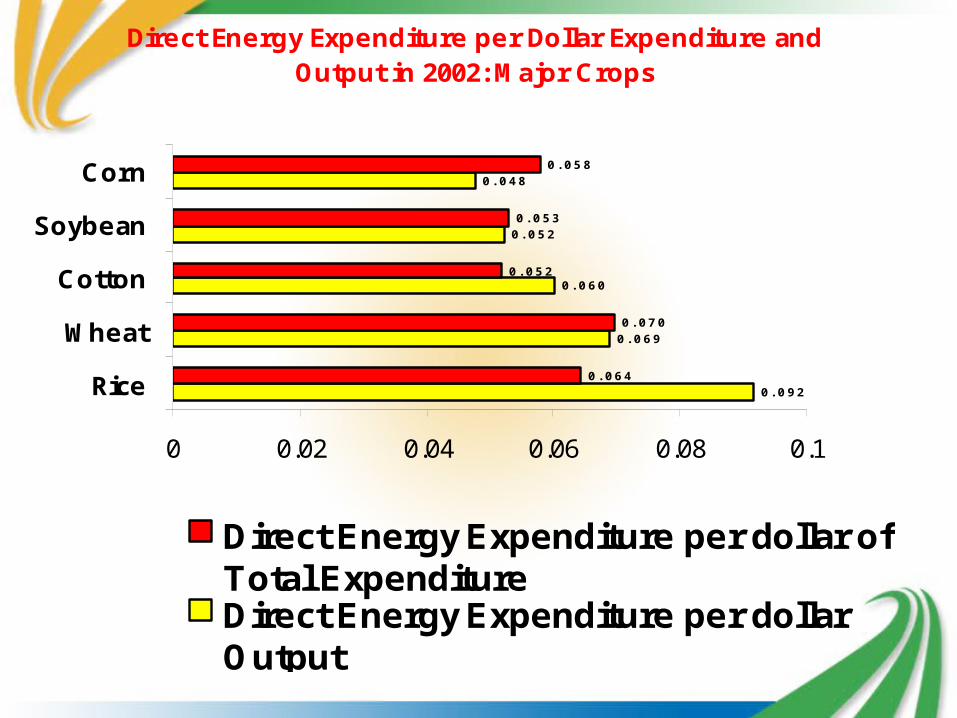
Direct Energy Expenditure per Dollar Expenditure and Output in 2002: Major Crops
0. 092
0. 069
0. 060
0. 052
0. 048
0. 064
0. 070
0. 052
0. 053
0. 058
0 0.02 0.04 0.06 0.08 0.1
Rice
Wheat
Cotton
Soybean
Corn
Direct Energy Expenditure per dollar ofTotal ExpenditureDirect Energy Expenditure per dollarOutput

Direct Energy Expenditure per Dollar Expenditure and Output in 2002: Livestock
0.038
0.023
0.020
0.017
0.040
0.028
0.078
0.032
0.000 0.020 0.040 0.060 0.080 0.100
Beef cattle
Dairy
Poultry
Hogs
Direct Energy Expenditure per dollar of Total ExpenditureDirect Energy Expenditure per dollar Output
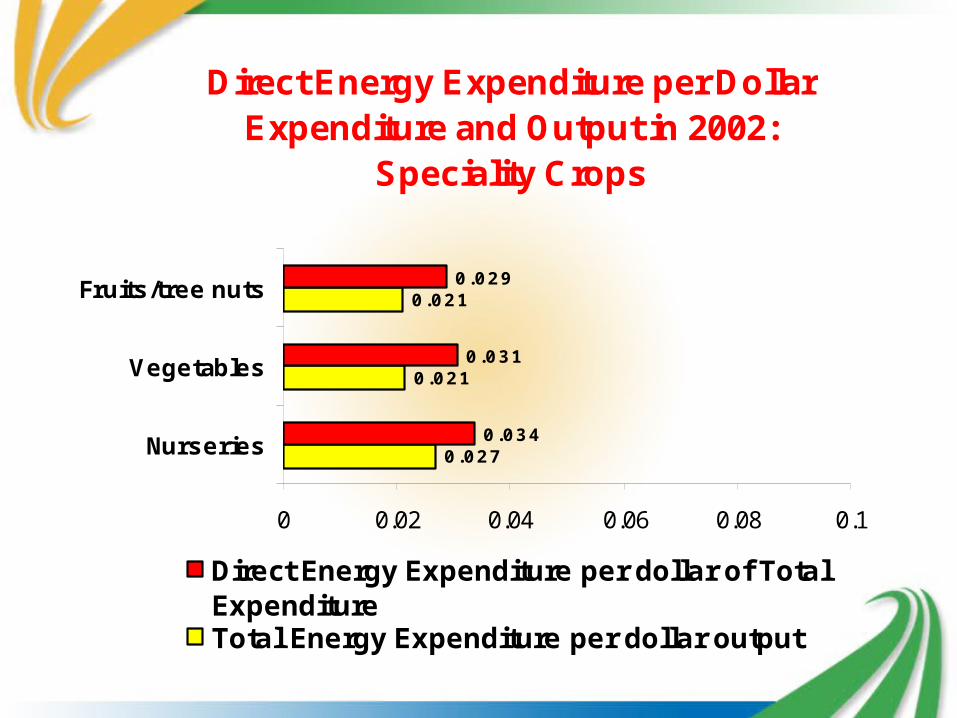
Direct Energy Expenditure per Dollar Expenditure and Output in 2002:
Speciality Crops
0.027
0.021
0.021
0.034
0.031
0.029
0 0.02 0.04 0.06 0.08 0.1
Nurseries
Vegetables
Fruits/tree nuts
Direct Energy Expenditure per dollar of TotalExpenditureTotal Energy Expenditure per dollar output
37
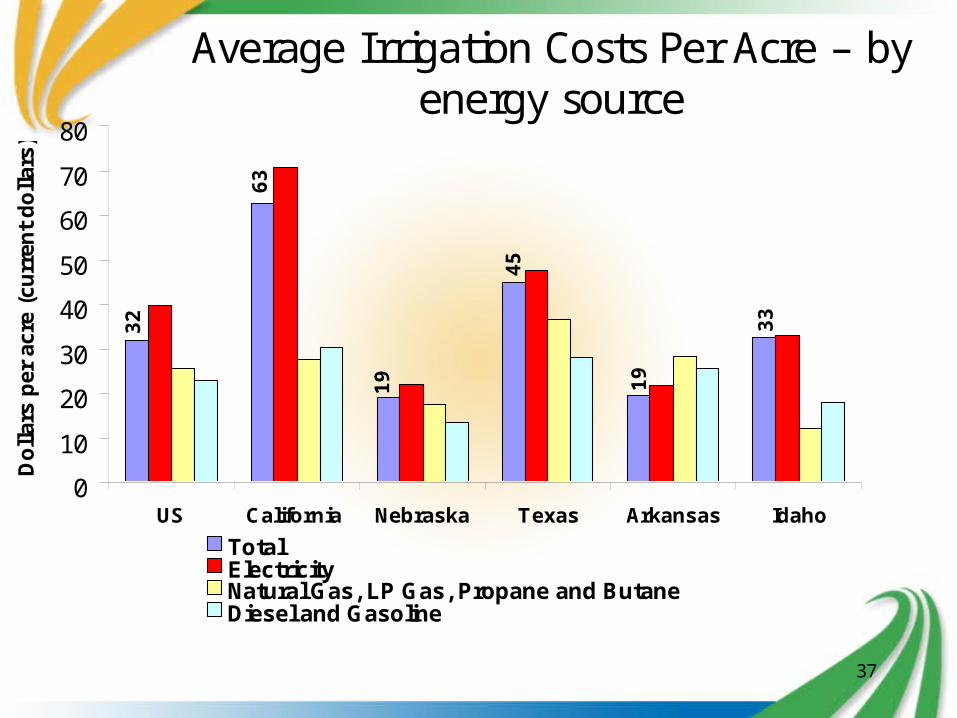
Average Irrigation Costs Per Acre – by energy source
33
19
45
19
63
32
0
10
20
30
40
50
60
70
80
US California Nebraska Texas Arkansas Idaho
Do
llar
s p
er a
cre
(cu
rren
t d
oll
ars)
TotalElectricityNatural Gas, LP Gas, Propane and ButaneDiesel and Gasoline

Energy Consumption by Production Region
• Fuel consumption in field crop producing regions – Corn Belt, Northern Plains, Southern Plains
• Electricity consumption – Pacific
• Fertilizer – Corn Belt
• Potential indicators of vulnerability?

How do Producers Respond to Energy Price Increases?
• What is happening to nominal and real energy prices?
• What aggregate response to a real energy price increase would we anticipate from producers?
• What other substitution opportunities are available to producers?

Real Prices of major fuel sources
1970-2002 (1996 dollars):
0.0
0.5
1.0
1.5
2.0
2.5
1970 1974 1978 1982 1986 1990 1994 1998 2002Diesel (dollars per gallon) Gasoline (dollars per gallon)
Electricity ( *10 cents per kWh) Natural Gas (cents per cubic feet)
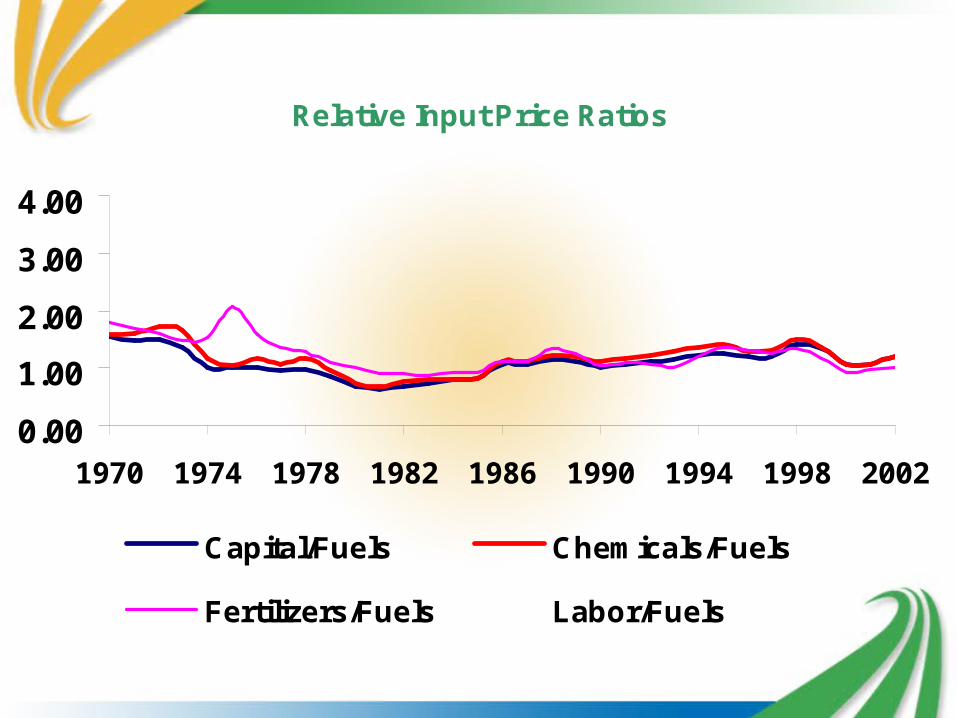
Relative Input Price Ratios
0.00
1.00
2.00
3.00
4.00
1970 1974 1978 1982 1986 1990 1994 1998 2002
Capital/Fuels Chemicals/Fuels
Fertilizers/Fuels Labor/Fuels

Own Price Elasticities and Allen Elasticities of
Substitution• Own price elasticity of energy - -0.60• Own price elasticity of fertilizer - -0.66• Own price elasticity of pesticides - -0.53
• Energy/capital substitution elasticity - 1.13• Energy/fertilizer - 0.60• Energy/pesticides - 0.70• Energy/labor - 0.59

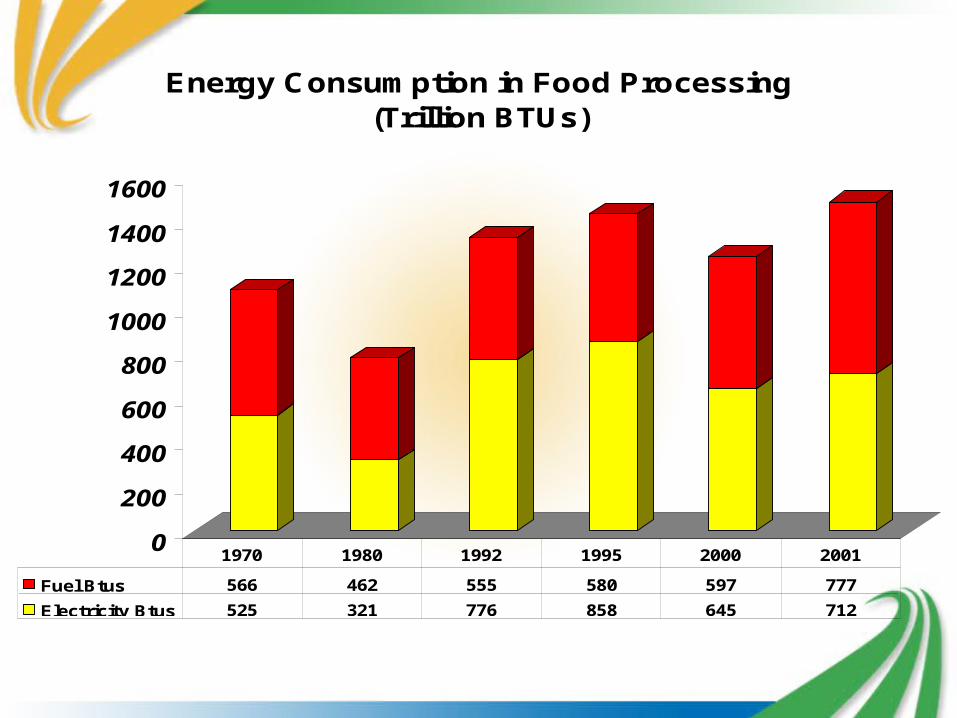
Off-Farm Energy Consumption in Agriculture
Processing• Energy consumed in food processing
– 1.4 Quad BTUs in 2001– 50% fuel and 50% electricity
• Energy consumed per dollar output
• Consumers demanding more processed and convenience foods
• Substituting energy in processing for energy use in households
36
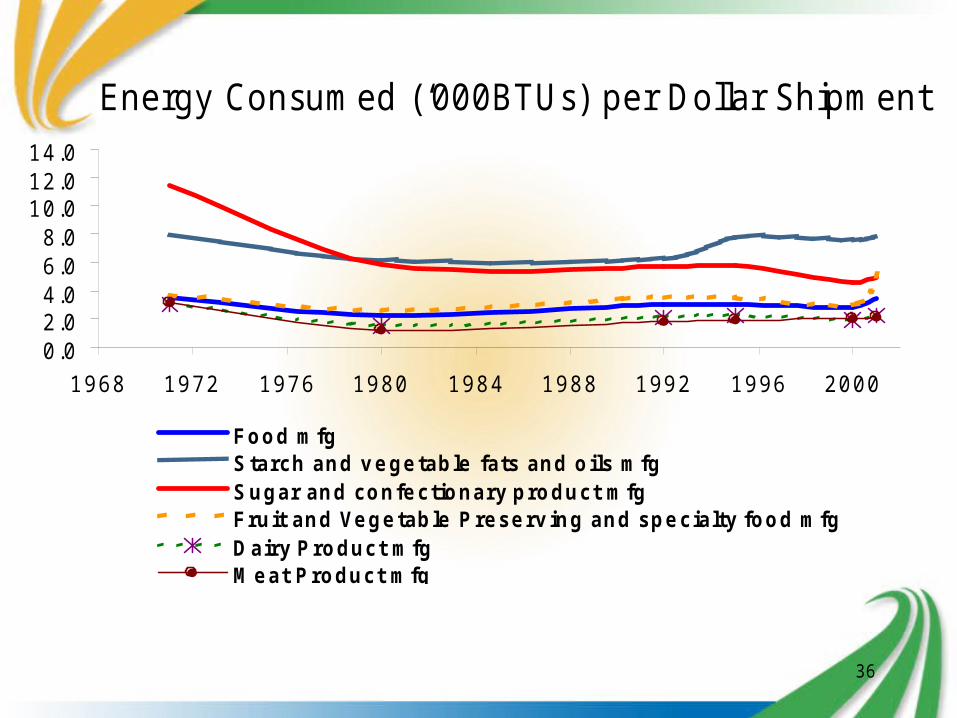
Energy Consumed (‘000BTUs) per Dollar Shipment
0 .02 .04 .06 .08 .0
1 0 .01 2 .01 4 .0
1 9 6 8 1 9 7 2 1 9 7 6 1 9 8 0 1 9 8 4 1 9 8 8 1 9 9 2 1 9 9 6 2 0 0 0
F o o d m fgS ta rch an d v e g e tab le fa ts an d o ils m fgS u g ar an d co n fe c tio n ary p ro d u ct m fgF ru it an d Ve g e tab le P re se rv in g an d sp e c ia lty fo o d m fgD a iry P ro d u c t m fgM e at P ro d u ct m fg

What is Happening to Farm Energy Efficiency?
• Is agriculture a profligate user of energy?
• Are producers improving energy efficiency over time?
• How does energy efficiency in agriculture compare to other sectors?
Farm Productivity and Efficiency
• 2% annual productivity growth in AG
• Total inputs flat, but productivity and output growing
• Major inputs declining except energy and chemicals after early 1990s
• Partial productivity measures all increasing

Energy Intensity (BTUs consumed per dollar) in US Agriculture, Food Manufacturing, Industry, and U.S. Economy
0
5
10
15
20
25
30
1970 1974 1978 1982 1986 1990 1994 1998
('00
0 B
TU
/ 19
96 $
)
AgricultureIndustryUS EconomyFood Manufacturing
Rural Energy Security and Rural Disruption Costs
• Energy disruption costs at points in production and processing– Specialty crop harvesting– Crop processing– Animal production– Animal harvesting– Dairy production– Fertilizer production– Ethanol production
• Lack seasonal energy use data to assess such disruption costs
Information and Biotechnology Impacts on
Energy Efficiency• Continuation of productivity growth
• Substitute information for other inputs
• Substitute biotechnology for fertilizer, pesticides, energy, and pharmaceuticals
• Substitute information and knowledge for traditional breeding and husbandry

Integrating Farm Energy Consumption and Production
• Wind energy offers opportunities for integrated on-farm production and consumption
• Bio-fuels have more limited potential and scale problems
• Solar offers potential power for livestock watering, electric fencing, and lighting in more remote areas
Policy Impacts on Farm Energy Consumption
• Farm policy may impact farm energy use
• Rural energy security policy concerns
• Farm Security and Rural Investment Act of 2002– Renewable Energy Loans and Grants– Energy Audits and Renewable Energy Development– Technical Assistance to Develop Renewable Energy
Resources– Biofuels Research and Development
Conclusions and Implications for Farm Energy Use
• Important consumer of direct and indirect energy in crop and animal production
• Producers do respond to real energy price incentives and do make input and output adjustments
• Vulnerability to energy supply disruptions may be critical in specific time periods
Conclusions and Implications for Farm Energy Use (cont.)
• AG is energy efficient relative to other sectors and improving in response to real price increases
• Farm and rural policies do have an impacton rural energy consumption

Thank You!

Supporting Slides

Energy’s Share of Farm Production Expenses
0%
2%
4%
6%
8%
10%
12%
14%
16%
18%
19
72
19
74
19
76
19
78
19
80
19
82
19
84
19
86
19
88
19
90
19
92
19
94
19
96
19
98
20
00
20
02
Total energy
Indirect energy
Direct energy
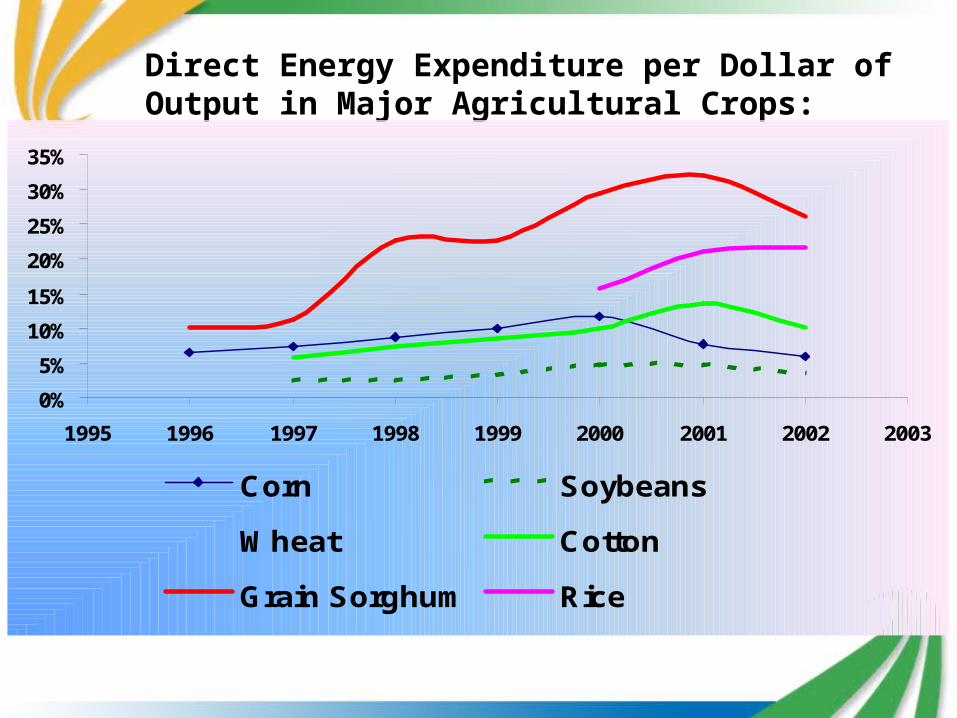
Direct Energy Expenditure per Dollar of Output in Major Agricultural Crops:
0%
5%
10%
15%
20%
25%
30%
35%
1995 1996 1997 1998 1999 2000 2001 2002 2003
Corn Soybeans
Wheat Cotton
Grain Sorghum Rice
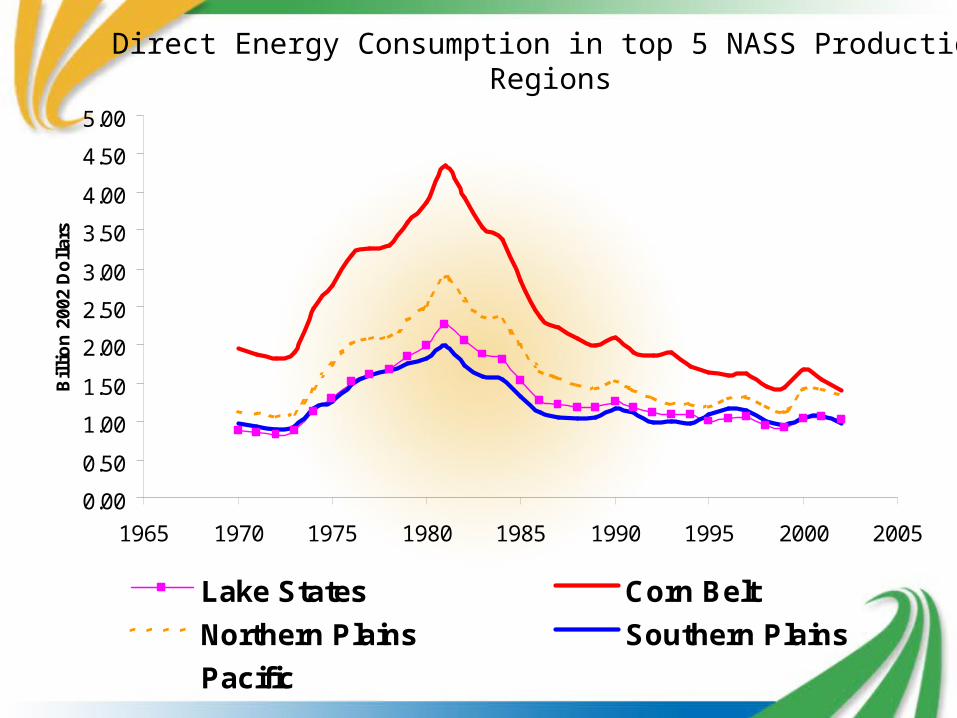
Direct Energy Consumption in top 5 NASS Production Regions
0.00
0.50
1.00
1.50
2.00
2.50
3.00
3.50
4.00
4.50
5.00
1965 1970 1975 1980 1985 1990 1995 2000 2005
Bil
lio
n 2
002
Do
llar
s
Lake States Corn Belt
Northern Plains Southern Plains
Pacific
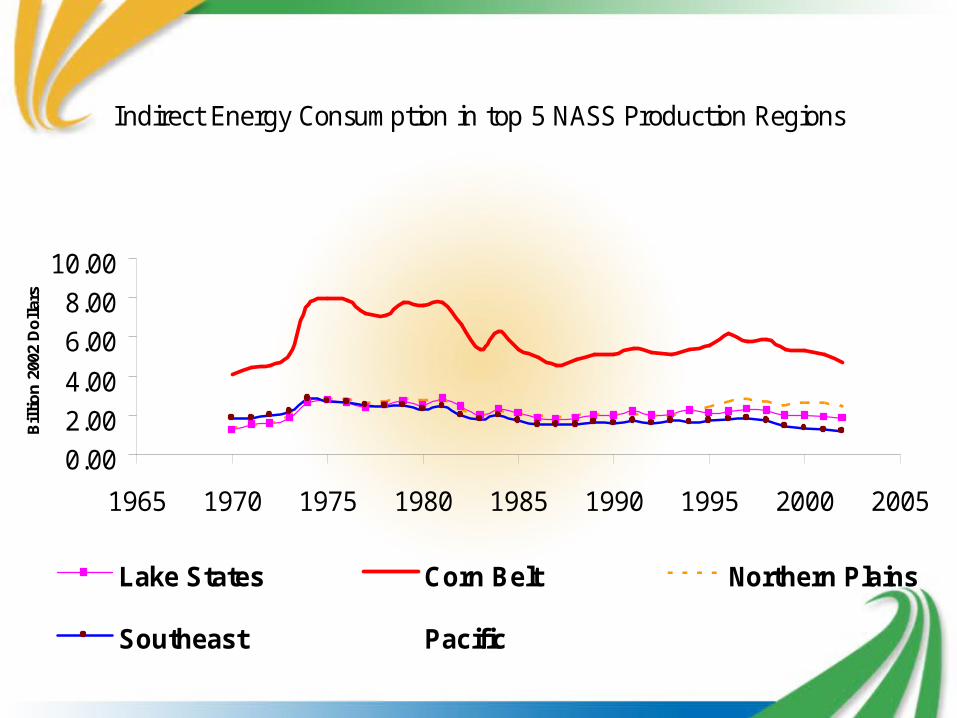
Indirect Energy Consumption in top 5 NASS Production Regions
0.00
2.00
4.00
6.00
8.00
10.00
1965 1970 1975 1980 1985 1990 1995 2000 2005
Bil
lio
n 2
002
Do
llar
s
Lake States Corn Belt Northern Plains
Southeast Pacific
0
200
400
600
800
1000
1200
1400
1600
Energy Consumption in Food Processing (Trillion BTUs)
Fuel Btus 566 462 555 580 597 777
Electricity Btus 525 321 776 858 645 712
1970 1980 1992 1995 2000 2001
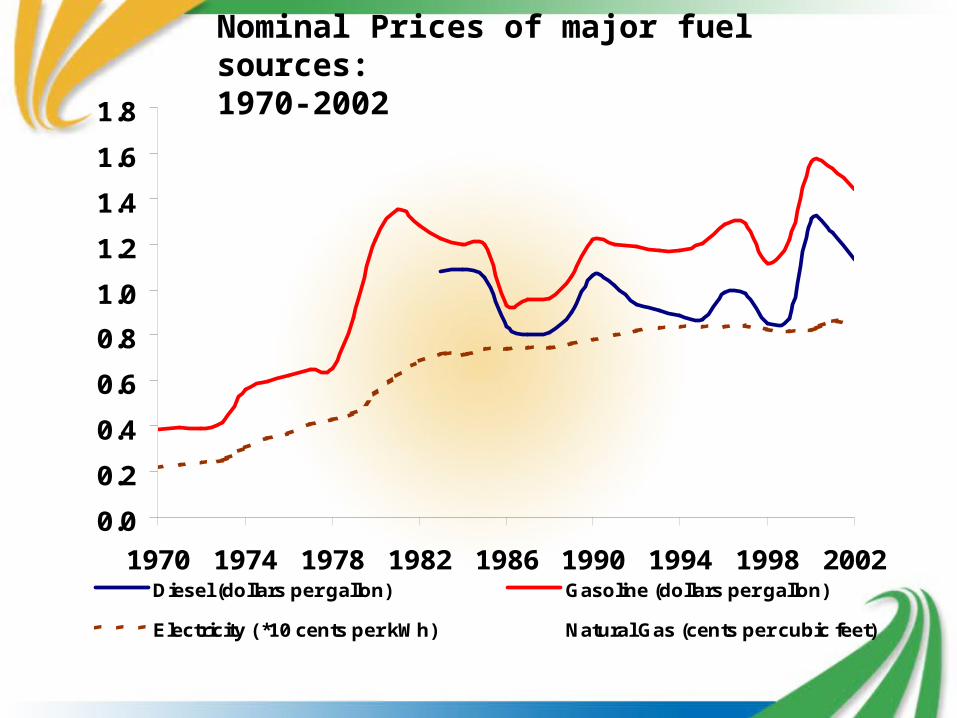
Nominal Prices of major fuel sources: 1970-2002
0.0
0.2
0.4
0.6
0.8
1.0
1.2
1.4
1.6
1.8
1970 1974 1978 1982 1986 1990 1994 1998 2002Diesel (dollars per gallon) Gasoline (dollars per gallon)
Electricity ( *10 cents per kWh) Natural Gas (cents per cubic feet)
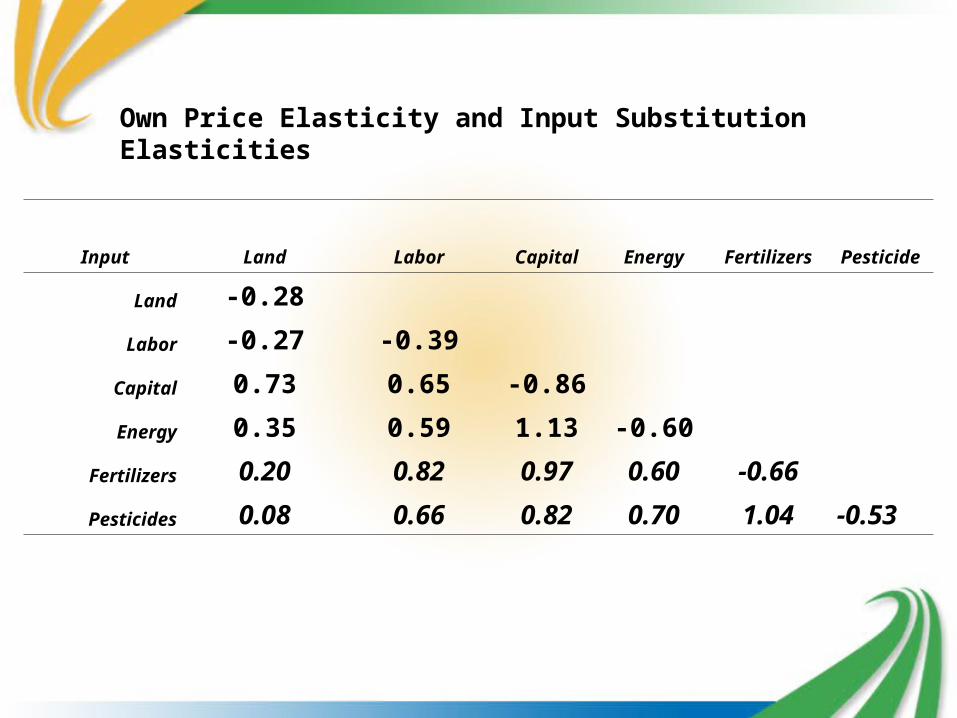
Own Price Elasticity and Input Substitution Elasticities
Input Land Labor Capital Energy Fertilizers Pesticide
Land -0.28
Labor -0.27 -0.39
Capital 0.73 0.65 -0.86
Energy 0.35 0.59 1.13 -0.60
Fertilizers 0.20 0.82 0.97 0.60 -0.66
Pesticides 0.08 0.66 0.82 0.70 1.04 -0.53

Indices of Farm Output, Input Use and Productivity in US Agriculture
0.0
0.2
0.4
0.6
0.8
1.0
1.2
1.4
1968 1972 1976 1980 1984 1988 1992 1996 2000
Inde
x (B
ase
1996
)
Total output Total Farm Input Total Factor Productivity
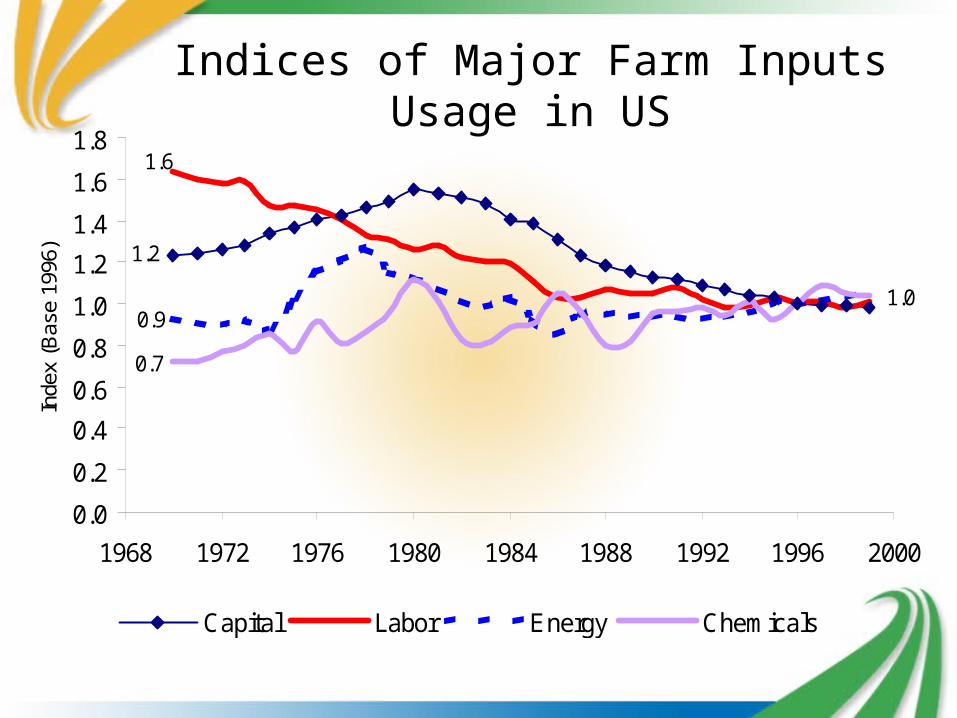
Indices of Major Farm Inputs Usage in US
1.2
1.6
0.9
0.7
1.0
0.0
0.2
0.4
0.6
0.8
1.0
1.2
1.4
1.6
1.8
1968 1972 1976 1980 1984 1988 1992 1996 2000
Inde
x (B
ase
1996
)
Capital Labor Energy Chemicals
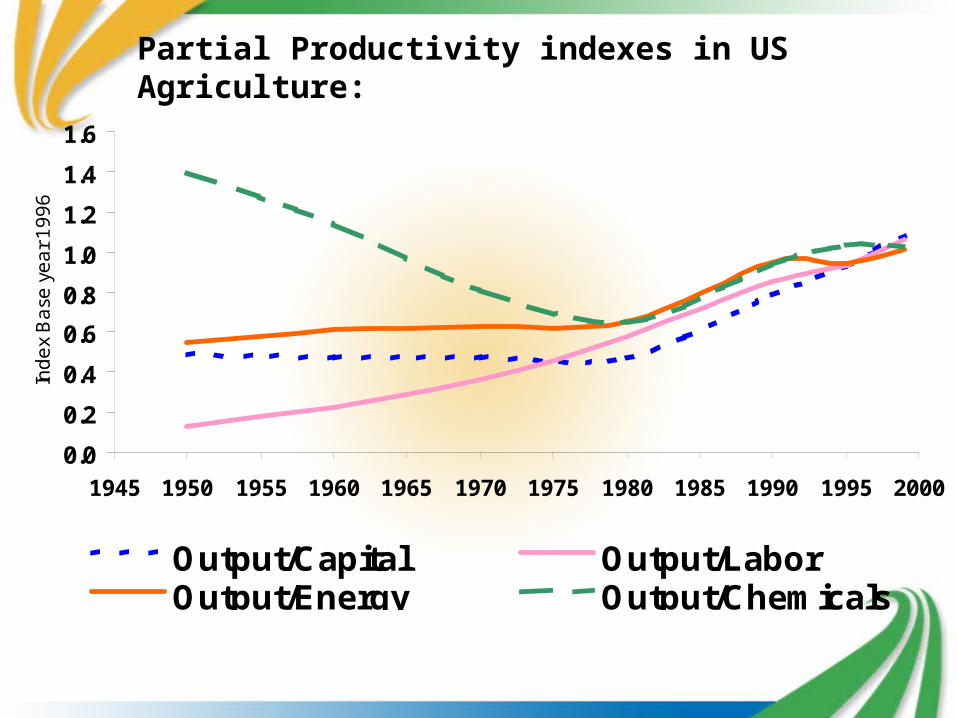
Partial Productivity indexes in US Agriculture:
0.0
0.2
0.4
0.6
0.8
1.0
1.2
1.4
1.6
1945 1950 1955 1960 1965 1970 1975 1980 1985 1990 1995 2000
Ind
ex
Ba
se y
ea
r 1
99
6
Output/Capital Output/LaborOutput/Energy Output/Chemicals