Embed Size (px)
Citation preview
Energy Consumption Data Analysis
Phase I Final Report
Prepared for the
U.S. Department of Energy
Office of Electricity Delivery and Energy Reliability
Under Cooperative Agreement No. DE-FC26-06NT42847
Hawai‘i Distributed Energy Resource Technologies for Energy Security
Subtask 11.3 Deliverable 2
Prepared by
UH Watt Watcher Team (A UH multi-departmental collaboration between Hawai‘i Natural Energy
Institute, School of Architecture, Sea Grant Program, Dept. of Information and
Computer Sciences, Dept. of Economics, Botany Dept., & College of Engineering)
Submitted by
Hawai‘i Natural Energy Institute
School of Ocean and Earth Science and Technology
University of Hawai‘i
February 2012

Acknowledgement: This material is based upon work supported by the United States
Department of Energy under Cooperative Agreement Number DE-FC-06NT42847.
Disclaimer: This report was prepared as an account of work sponsored by an agency of the
United States Government. Neither the United States Government nor any agency thereof, nor
any of their employees, makes any warranty, express or implied, or assumes any legal liability
or responsibility for the accuracy, completeness, or usefulness of any information, apparatus,
product, or process disclosed, or represents that its use would not infringe privately owned
rights. Reference here in to any specific commercial product, process, or service by tradename,
trademark, manufacturer, or otherwise does not necessarily constitute or imply its
endorsement, recommendation, or favoring by the United States Government or any agency
thereof. The views and opinions of authors expressed herein do not necessarily state or reflect
those of the United States Government or any agency thereof.
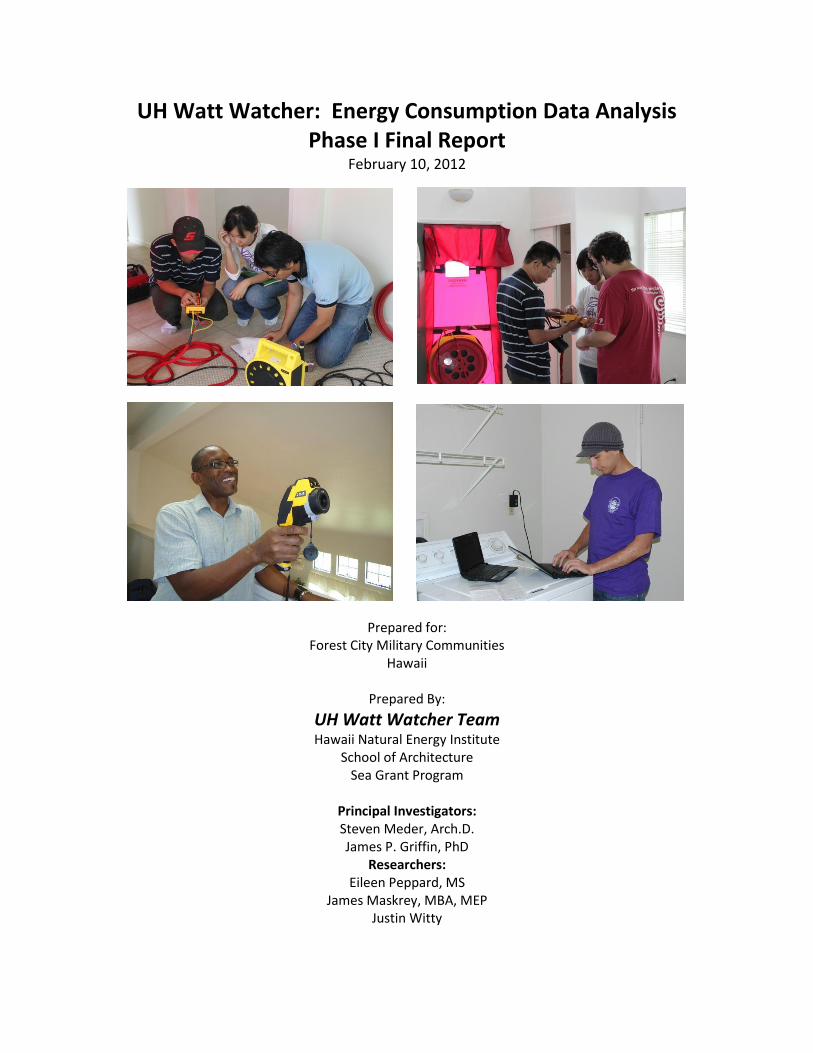
UH Watt Watcher: Energy Consumption Data Analysis Phase I Final Report
February 10, 2012
Prepared for: Forest City Military Communities
Hawaii
Prepared By:
UH Watt Watcher Team Hawaii Natural Energy Institute
School of Architecture Sea Grant Program
Principal Investigators: Steven Meder, Arch.D. James P. Griffin, PhD
Researchers: Eileen Peppard, MS
James Maskrey, MBA, MEP Justin Witty

1
Table of Contents
INTRODUCTION 2
OBJECTIVES 2
RESULTS
Datasets 3
Observed and Estimated Energy Consumption Summary 4
Estimated Average End-Use Disaggregation by Neighborhood 5
End Use: Sensitivity to Low, Medium and High use 6
Air Conditioning Observations 7
Relationship between Temperature and Air Conditioning 8
Relationships between Temperature, Humidity, Comfort,
and Energy Consumption for Air Conditioning 12
Energy Consumed for Water Heating 20
Energy Consumed for Clothes Drying 23
Energy Consumed by Refrigerators 24
RECOMMENDATIONS 26
ADDITIONS TO TURNOVER PUNCH LIST 31
APPENDICES
A. Energy Saving Tips for Residents 32
B. Infrared imaging 34
C. Data sheets 35
D. Hawaii Energy Solar Water Heating Maintenance Checklist 42
2
INTRODUCTION The UH Watt Watcher Program is a collaboration between the Hawaii Natural Energy Institute and the University of Hawaii School of Architecture united in the intent to develop skills and resource capacity within the University for building energy design, evaluation and management. In its first project, the UH Watt Watcher program teamed with Forest City Military Communities-Hawaii to evaluate energy usage in military housing on Oahu. The Watt Watcher Team monitored homes for approximately one month each. In each home, temperature and humidity were recorded, while at the same time energy consumption was recorded on the individual circuits for the air conditioner, the domestic water heater system and the clothes dryer. Other energy consuming equipment, appliances and devices were noted; along with anecdotal self-description of the residents own usage patterns.
The single most compelling observation resulting from this data is the dominance of the air conditioning load in the overall energy consumption. On average, air conditioning accounts for 44% of the energy consumption in the monitored homes and can reach 69% of the monthly consumption.
OBJECTIVES The objective of Phase I was to inform Forest City of key observations they can use to assist in managing the maintenance of houses and its Resident Energy Conservation Program (RECP) LIVE billing program, implemented in January of 2011. The results of Phase I will provide a snapshot of how Forest City residents are using energy in their households.
This report provides data and anecdotal insight into how energy is being consumed in military homes. Specific objectives include:
Quantify energy consumption for air conditioning, clothes drying, water heating and “other” energy end uses
Estimate common energy end-uses in the home
Compare energy end-uses against each other
Compare the energy profiles of homes in different neighborhoods
Observe relationships between temperature, comfort and air conditioning use
Make preliminary recommendations to improve energy consumption o Recommendations to Forest City management o Recommendations to residents of Forest City properties
3
RESULTS
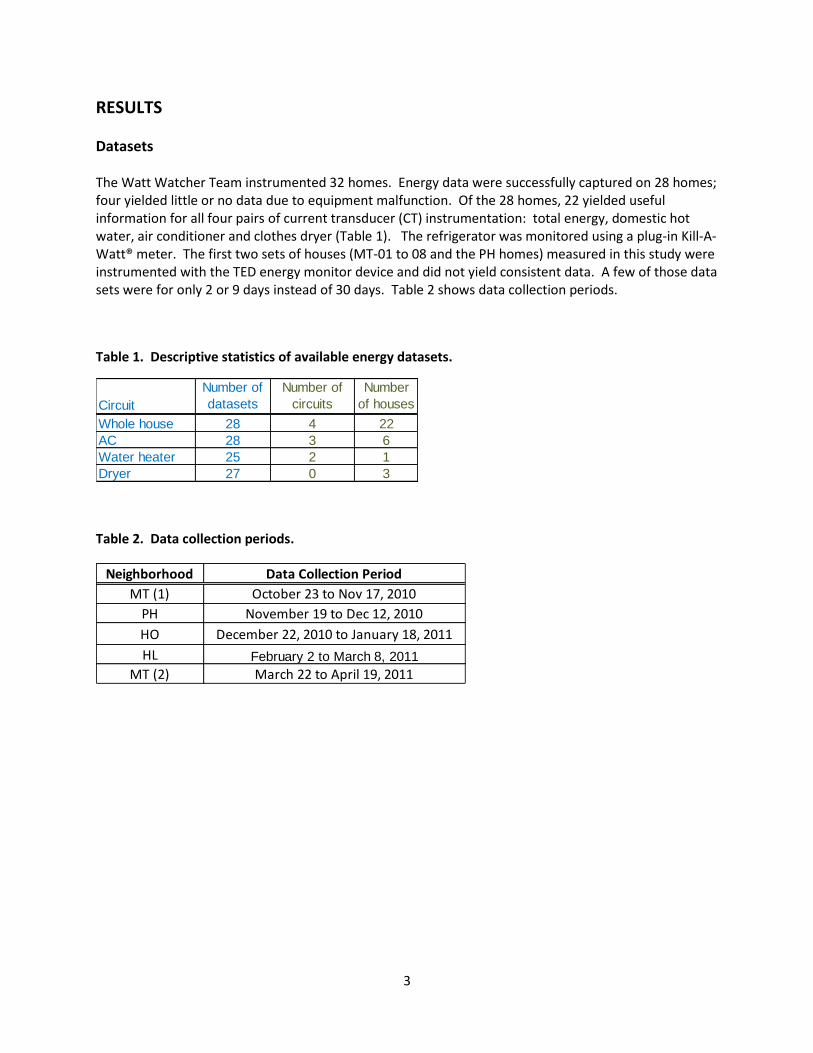
Datasets The Watt Watcher Team instrumented 32 homes. Energy data were successfully captured on 28 homes; four yielded little or no data due to equipment malfunction. Of the 28 homes, 22 yielded useful information for all four pairs of current transducer (CT) instrumentation: total energy, domestic hot water, air conditioner and clothes dryer (Table 1). The refrigerator was monitored using a plug-in Kill-A-Watt® meter. The first two sets of houses (MT-01 to 08 and the PH homes) measured in this study were instrumented with the TED energy monitor device and did not yield consistent data. A few of those data sets were for only 2 or 9 days instead of 30 days. Table 2 shows data collection periods.
Table 1. Descriptive statistics of available energy datasets.
Table 2. Data collection periods.
Circuit
Number of
datasets
Number of
circuits
Number
of houses
Whole house 28 4 22
AC 28 3 6
Water heater 25 2 1
Dryer 27 0 3
Neighborhood Data Collection Period
MT (1) October 23 to Nov 17, 2010
PH November 19 to Dec 12, 2010
HO December 22, 2010 to January 18, 2011
HL February 2 to March 8, 2011
MT (2) March 22 to April 19, 2011
4
Observed and Estimated Energy Consumption Summary
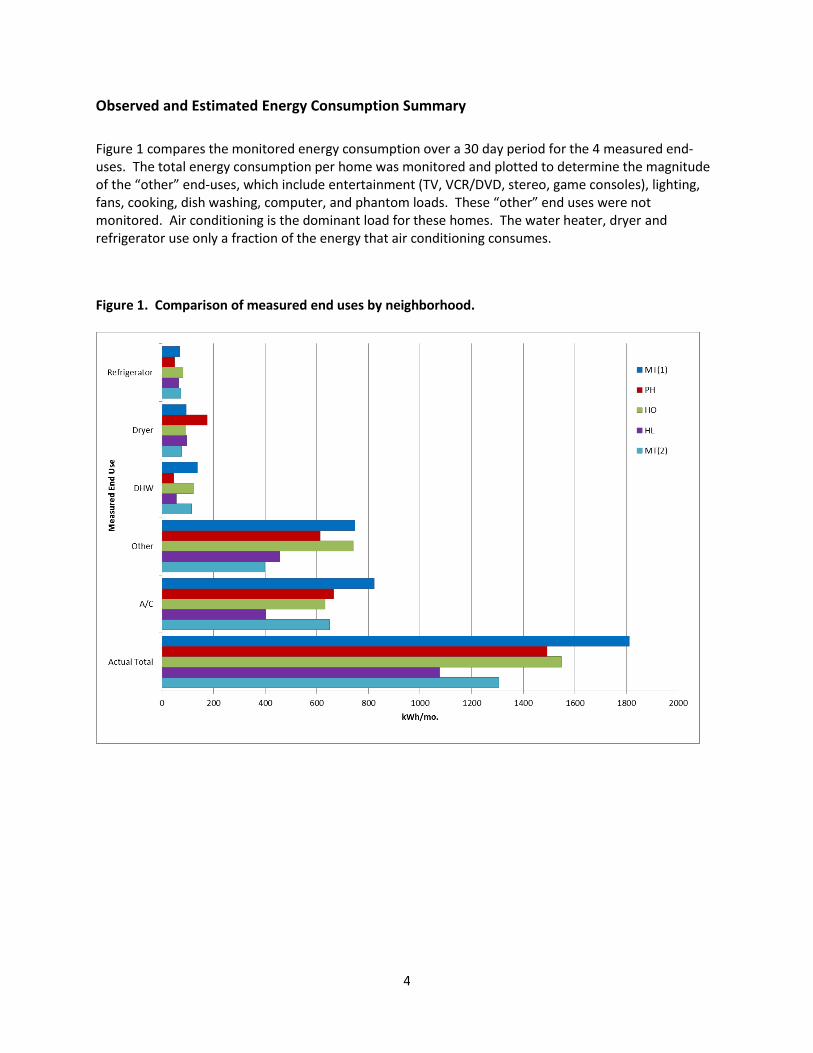
Figure 1 compares the monitored energy consumption over a 30 day period for the 4 measured end-uses. The total energy consumption per home was monitored and plotted to determine the magnitude of the “other” end-uses, which include entertainment (TV, VCR/DVD, stereo, game consoles), lighting, fans, cooking, dish washing, computer, and phantom loads. These “other” end uses were not monitored. Air conditioning is the dominant load for these homes. The water heater, dryer and refrigerator use only a fraction of the energy that air conditioning consumes.
Figure 1. Comparison of measured end uses by neighborhood.
5
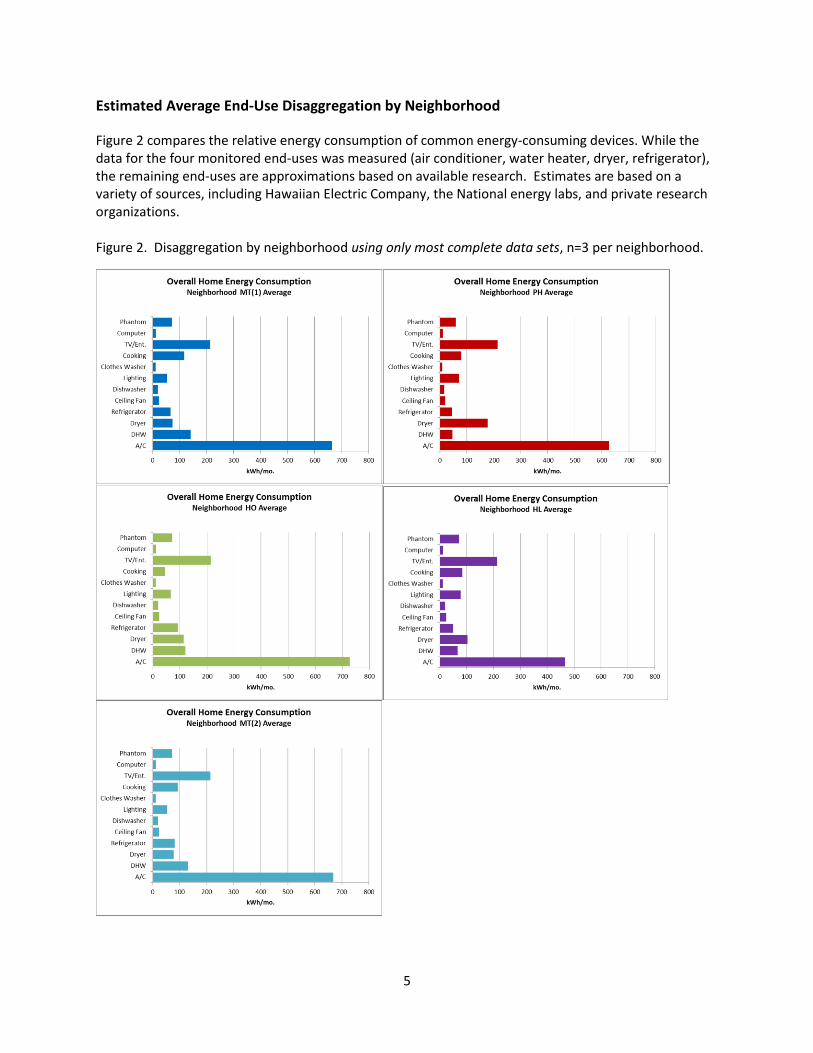
Estimated Average End-Use Disaggregation by Neighborhood
Figure 2 compares the relative energy consumption of common energy-consuming devices. While the data for the four monitored end-uses was measured (air conditioner, water heater, dryer, refrigerator), the remaining end-uses are approximations based on available research. Estimates are based on a variety of sources, including Hawaiian Electric Company, the National energy labs, and private research organizations. Figure 2. Disaggregation by neighborhood using only most complete data sets, n=3 per neighborhood.
6
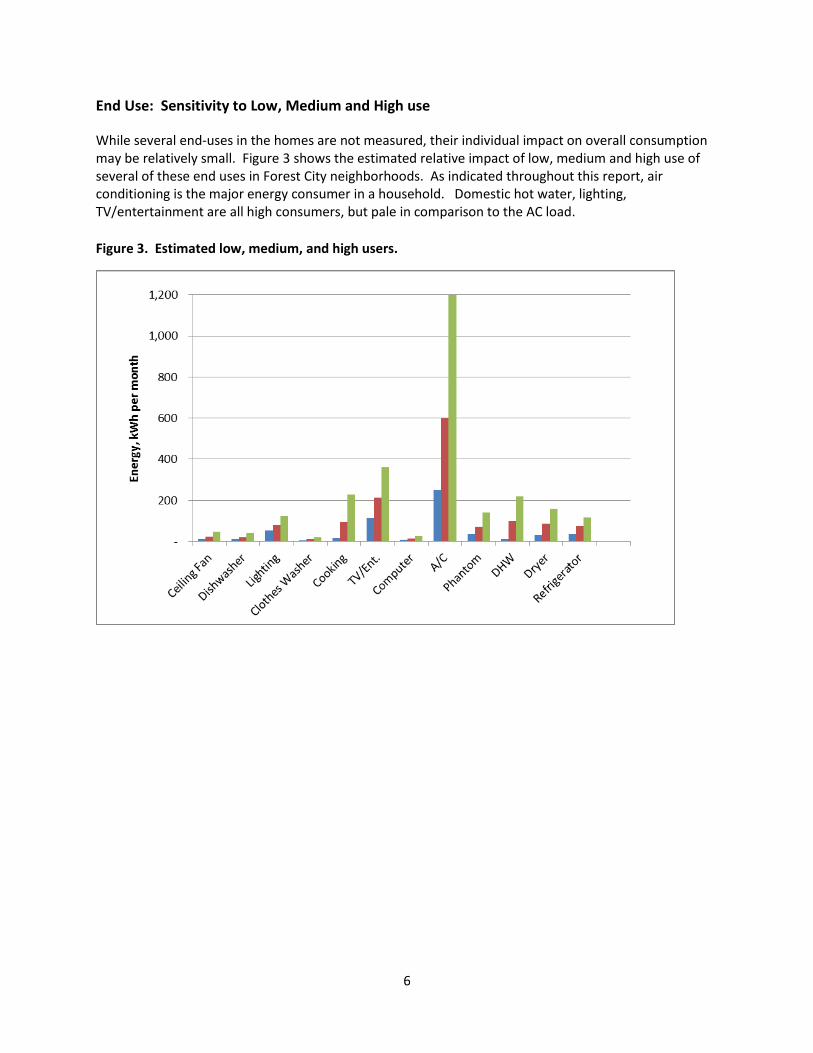
End Use: Sensitivity to Low, Medium and High use
While several end-uses in the homes are not measured, their individual impact on overall consumption may be relatively small. Figure 3 shows the estimated relative impact of low, medium and high use of several of these end uses in Forest City neighborhoods. As indicated throughout this report, air conditioning is the major energy consumer in a household. Domestic hot water, lighting, TV/entertainment are all high consumers, but pale in comparison to the AC load.
Figure 3. Estimated low, medium, and high users.
7
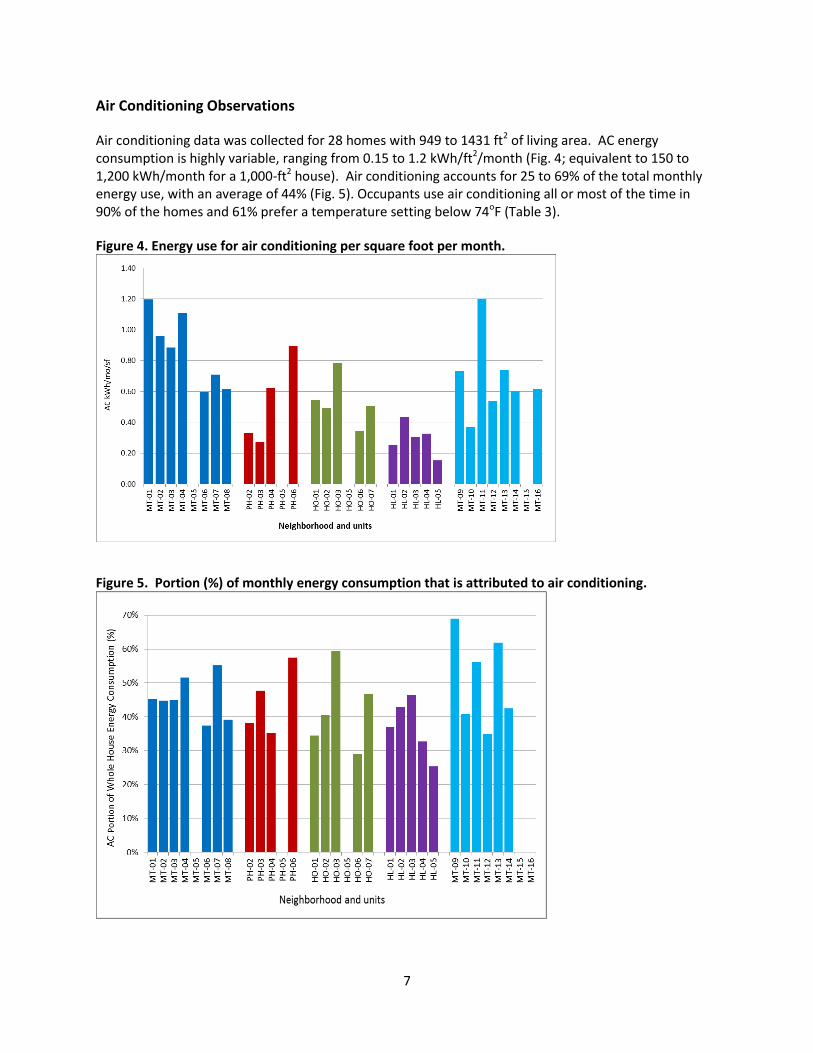
Air Conditioning Observations
Air conditioning data was collected for 28 homes with 949 to 1431 ft2 of living area. AC energy consumption is highly variable, ranging from 0.15 to 1.2 kWh/ft2/month (Fig. 4; equivalent to 150 to 1,200 kWh/month for a 1,000-ft2 house). Air conditioning accounts for 25 to 69% of the total monthly energy use, with an average of 44% (Fig. 5). Occupants use air conditioning all or most of the time in 90% of the homes and 61% prefer a temperature setting below 74oF (Table 3).
Figure 4. Energy use for air conditioning per square foot per month.
Figure 5. Portion (%) of monthly energy consumption that is attributed to air conditioning.
8
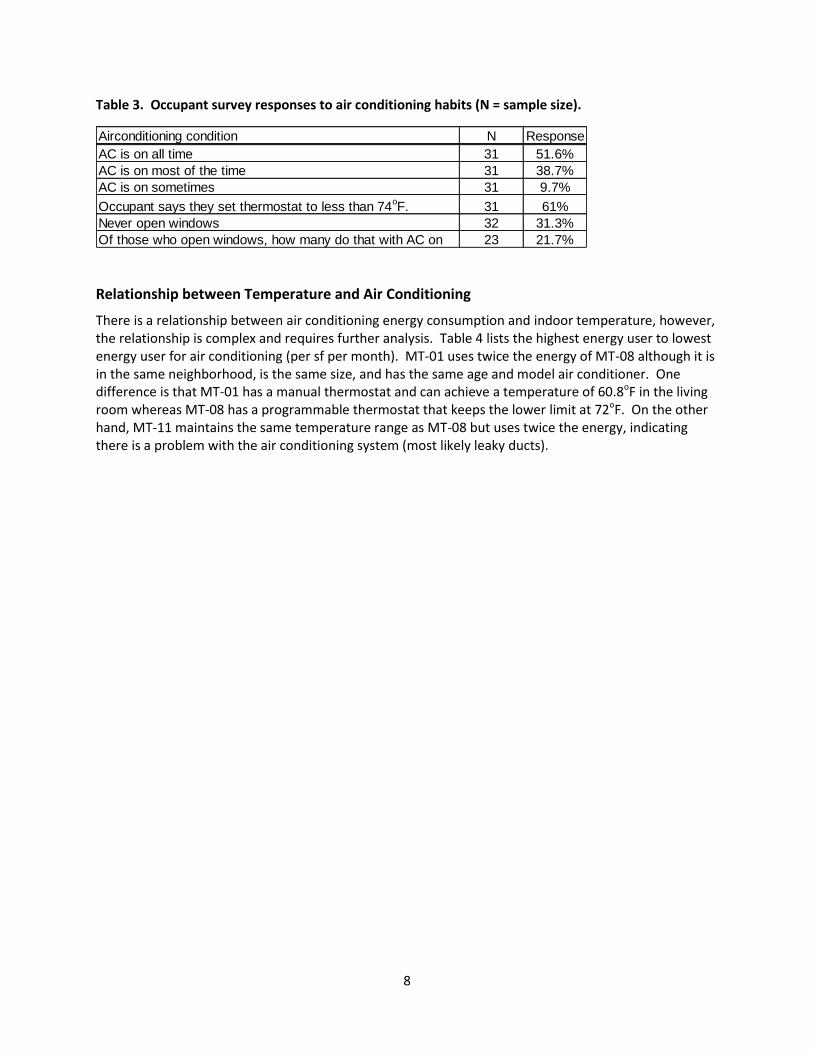
Table 3. Occupant survey responses to air conditioning habits (N = sample size).
Relationship between Temperature and Air Conditioning
There is a relationship between air conditioning energy consumption and indoor temperature, however, the relationship is complex and requires further analysis. Table 4 lists the highest energy user to lowest energy user for air conditioning (per sf per month). MT-01 uses twice the energy of MT-08 although it is in the same neighborhood, is the same size, and has the same age and model air conditioner. One difference is that MT-01 has a manual thermostat and can achieve a temperature of 60.8oF in the living room whereas MT-08 has a programmable thermostat that keeps the lower limit at 72oF. On the other hand, MT-11 maintains the same temperature range as MT-08 but uses twice the energy, indicating there is a problem with the air conditioning system (most likely leaky ducts).
Airconditioning condition N Response
AC is on all time 31 51.6%
AC is on most of the time 31 38.7%
AC is on sometimes 31 9.7%
Occupant says they set thermostat to less than 74oF. 31 61%
Never open windows 32 31.3%
Of those who open windows, how many do that with AC on 23 21.7%
9
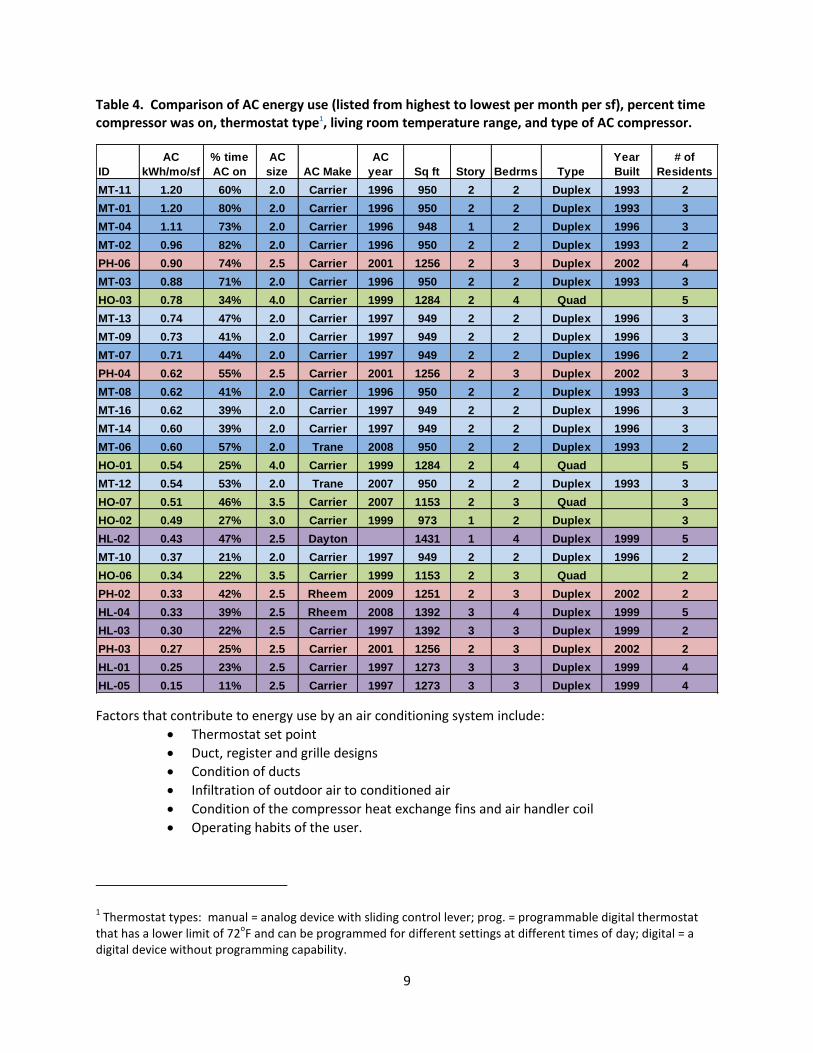
Table 4. Comparison of AC energy use (listed from highest to lowest per month per sf), percent time compressor was on, thermostat type1, living room temperature range, and type of AC compressor.
Factors that contribute to energy use by an air conditioning system include:
Thermostat set point
Duct, register and grille designs
Condition of ducts
Infiltration of outdoor air to conditioned air
Condition of the compressor heat exchange fins and air handler coil
Operating habits of the user.
1 Thermostat types: manual = analog device with sliding control lever; prog. = programmable digital thermostat
that has a lower limit of 72oF and can be programmed for different settings at different times of day; digital = a
digital device without programming capability.
ID
AC
kWh/mo/sf
% time
AC on
AC
size AC Make
AC
year Sq ft Story Bedrms Type
Year
Built
# of
Residents
MT-11 1.20 60% 2.0 Carrier 1996 950 2 2 Duplex 1993 2
MT-01 1.20 80% 2.0 Carrier 1996 950 2 2 Duplex 1993 3
MT-04 1.11 73% 2.0 Carrier 1996 948 1 2 Duplex 1996 3
MT-02 0.96 82% 2.0 Carrier 1996 950 2 2 Duplex 1993 2
PH-06 0.90 74% 2.5 Carrier 2001 1256 2 3 Duplex 2002 4
MT-03 0.88 71% 2.0 Carrier 1996 950 2 2 Duplex 1993 3
HO-03 0.78 34% 4.0 Carrier 1999 1284 2 4 Quad 5
MT-13 0.74 47% 2.0 Carrier 1997 949 2 2 Duplex 1996 3
MT-09 0.73 41% 2.0 Carrier 1997 949 2 2 Duplex 1996 3
MT-07 0.71 44% 2.0 Carrier 1997 949 2 2 Duplex 1996 2
PH-04 0.62 55% 2.5 Carrier 2001 1256 2 3 Duplex 2002 3
MT-08 0.62 41% 2.0 Carrier 1996 950 2 2 Duplex 1993 3
MT-16 0.62 39% 2.0 Carrier 1997 949 2 2 Duplex 1996 3
MT-14 0.60 39% 2.0 Carrier 1997 949 2 2 Duplex 1996 3
MT-06 0.60 57% 2.0 Trane 2008 950 2 2 Duplex 1993 2
HO-01 0.54 25% 4.0 Carrier 1999 1284 2 4 Quad 5
MT-12 0.54 53% 2.0 Trane 2007 950 2 2 Duplex 1993 3
HO-07 0.51 46% 3.5 Carrier 2007 1153 2 3 Quad 3
HO-02 0.49 27% 3.0 Carrier 1999 973 1 2 Duplex 3
HL-02 0.43 47% 2.5 Dayton 1431 1 4 Duplex 1999 5
MT-10 0.37 21% 2.0 Carrier 1997 949 2 2 Duplex 1996 2
HO-06 0.34 22% 3.5 Carrier 1999 1153 2 3 Quad 2
PH-02 0.33 42% 2.5 Rheem 2009 1251 2 3 Duplex 2002 2
HL-04 0.33 39% 2.5 Rheem 2008 1392 3 4 Duplex 1999 5
HL-03 0.30 22% 2.5 Carrier 1997 1392 3 3 Duplex 1999 2
PH-03 0.27 25% 2.5 Carrier 2001 1256 2 3 Duplex 2002 2
HL-01 0.25 23% 2.5 Carrier 1997 1273 3 3 Duplex 1999 4
HL-05 0.15 11% 2.5 Carrier 1997 1273 3 3 Duplex 1999 4
10
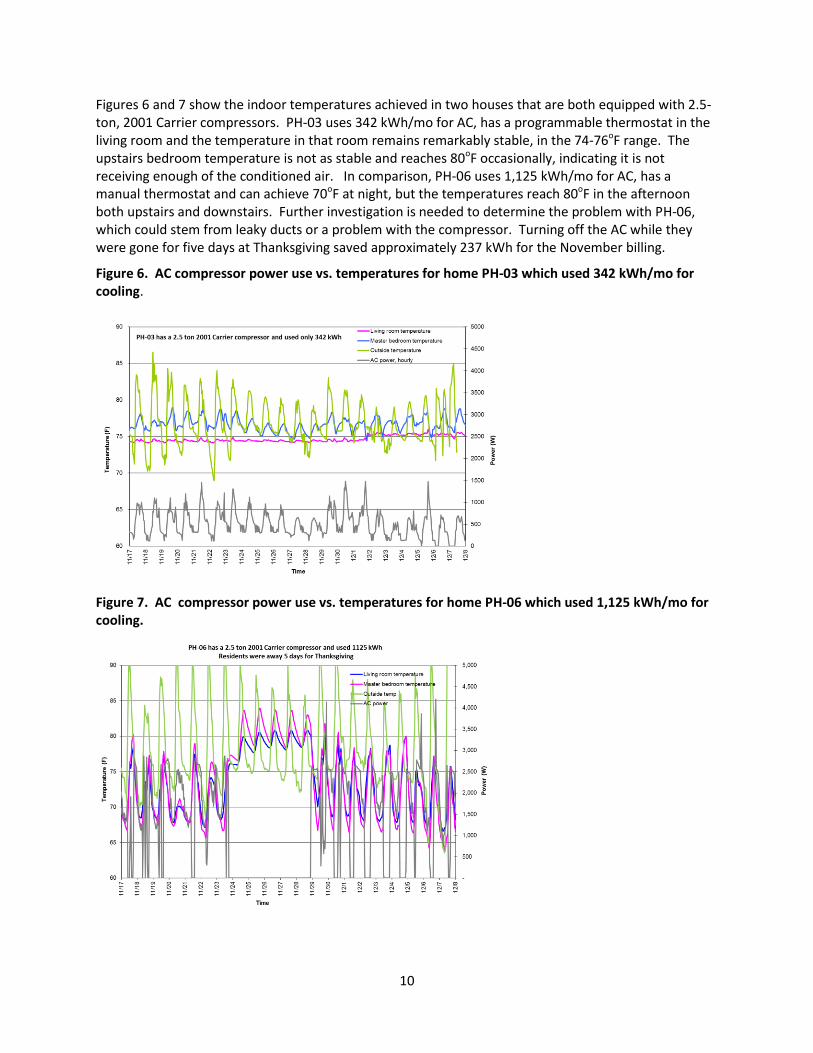
Figures 6 and 7 show the indoor temperatures achieved in two houses that are both equipped with 2.5-ton, 2001 Carrier compressors. PH-03 uses 342 kWh/mo for AC, has a programmable thermostat in the living room and the temperature in that room remains remarkably stable, in the 74-76oF range. The upstairs bedroom temperature is not as stable and reaches 80oF occasionally, indicating it is not receiving enough of the conditioned air. In comparison, PH-06 uses 1,125 kWh/mo for AC, has a manual thermostat and can achieve 70oF at night, but the temperatures reach 80oF in the afternoon both upstairs and downstairs. Further investigation is needed to determine the problem with PH-06, which could stem from leaky ducts or a problem with the compressor. Turning off the AC while they were gone for five days at Thanksgiving saved approximately 237 kWh for the November billing.
Figure 6. AC compressor power use vs. temperatures for home PH-03 which used 342 kWh/mo for cooling.
Figure 7. AC compressor power use vs. temperatures for home PH-06 which used 1,125 kWh/mo for cooling.
11
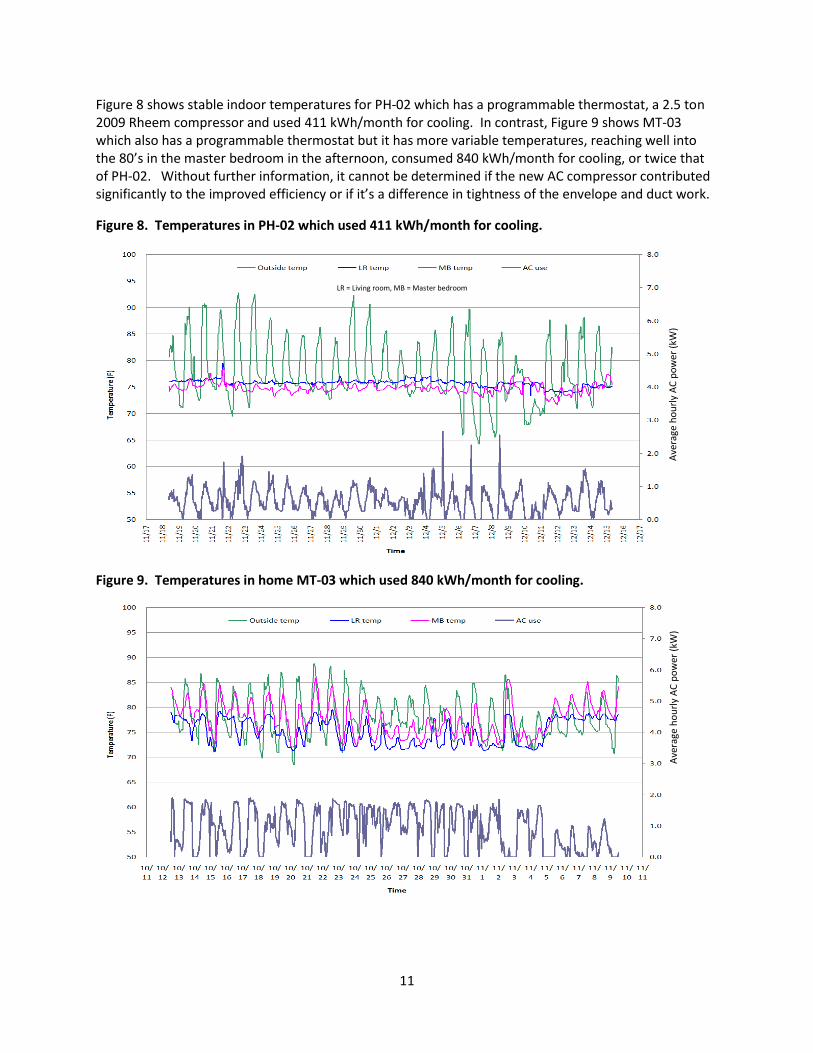
Figure 8 shows stable indoor temperatures for PH-02 which has a programmable thermostat, a 2.5 ton 2009 Rheem compressor and used 411 kWh/month for cooling. In contrast, Figure 9 shows MT-03 which also has a programmable thermostat but it has more variable temperatures, reaching well into the 80’s in the master bedroom in the afternoon, consumed 840 kWh/month for cooling, or twice that of PH-02. Without further information, it cannot be determined if the new AC compressor contributed significantly to the improved efficiency or if it’s a difference in tightness of the envelope and duct work.
Figure 8. Temperatures in PH-02 which used 411 kWh/month for cooling.
Figure 9. Temperatures in home MT-03 which used 840 kWh/month for cooling.
LR = Living room, MB = Master bedroom
Ave
rage
ho
url
y A
C p
ow
er (
kW)
Ave
rage
ho
url
y A
C p
ow
er (
kW)
12
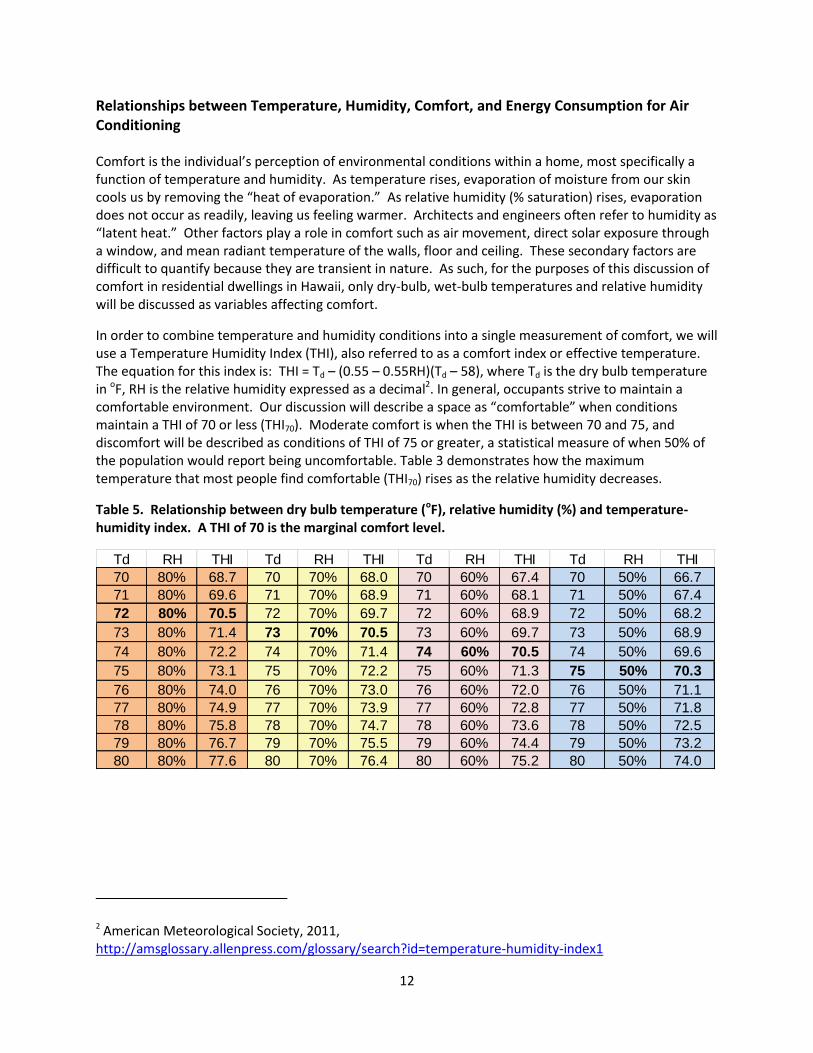
Relationships between Temperature, Humidity, Comfort, and Energy Consumption for Air Conditioning Comfort is the individual’s perception of environmental conditions within a home, most specifically a function of temperature and humidity. As temperature rises, evaporation of moisture from our skin cools us by removing the “heat of evaporation.” As relative humidity (% saturation) rises, evaporation does not occur as readily, leaving us feeling warmer. Architects and engineers often refer to humidity as “latent heat.” Other factors play a role in comfort such as air movement, direct solar exposure through a window, and mean radiant temperature of the walls, floor and ceiling. These secondary factors are difficult to quantify because they are transient in nature. As such, for the purposes of this discussion of comfort in residential dwellings in Hawaii, only dry-bulb, wet-bulb temperatures and relative humidity will be discussed as variables affecting comfort.
In order to combine temperature and humidity conditions into a single measurement of comfort, we will use a Temperature Humidity Index (THI), also referred to as a comfort index or effective temperature. The equation for this index is: THI = Td – (0.55 – 0.55RH)(Td – 58), where Td is the dry bulb temperature in oF, RH is the relative humidity expressed as a decimal2. In general, occupants strive to maintain a comfortable environment. Our discussion will describe a space as “comfortable” when conditions maintain a THI of 70 or less (THI70). Moderate comfort is when the THI is between 70 and 75, and discomfort will be described as conditions of THI of 75 or greater, a statistical measure of when 50% of the population would report being uncomfortable. Table 3 demonstrates how the maximum temperature that most people find comfortable (THI70) rises as the relative humidity decreases.
Table 5. Relationship between dry bulb temperature (oF), relative humidity (%) and temperature-humidity index. A THI of 70 is the marginal comfort level.
2 American Meteorological Society, 2011,
http://amsglossary.allenpress.com/glossary/search?id=temperature-humidity-index1
Td RH THI Td RH THI Td RH THI Td RH THI
70 80% 68.7 70 70% 68.0 70 60% 67.4 70 50% 66.7
71 80% 69.6 71 70% 68.9 71 60% 68.1 71 50% 67.4
72 80% 70.5 72 70% 69.7 72 60% 68.9 72 50% 68.2
73 80% 71.4 73 70% 70.5 73 60% 69.7 73 50% 68.9
74 80% 72.2 74 70% 71.4 74 60% 70.5 74 50% 69.6
75 80% 73.1 75 70% 72.2 75 60% 71.3 75 50% 70.3
76 80% 74.0 76 70% 73.0 76 60% 72.0 76 50% 71.1
77 80% 74.9 77 70% 73.9 77 60% 72.8 77 50% 71.8
78 80% 75.8 78 70% 74.7 78 60% 73.6 78 50% 72.5
79 80% 76.7 79 70% 75.5 79 60% 74.4 79 50% 73.2
80 80% 77.6 80 70% 76.4 80 60% 75.2 80 50% 74.0
13
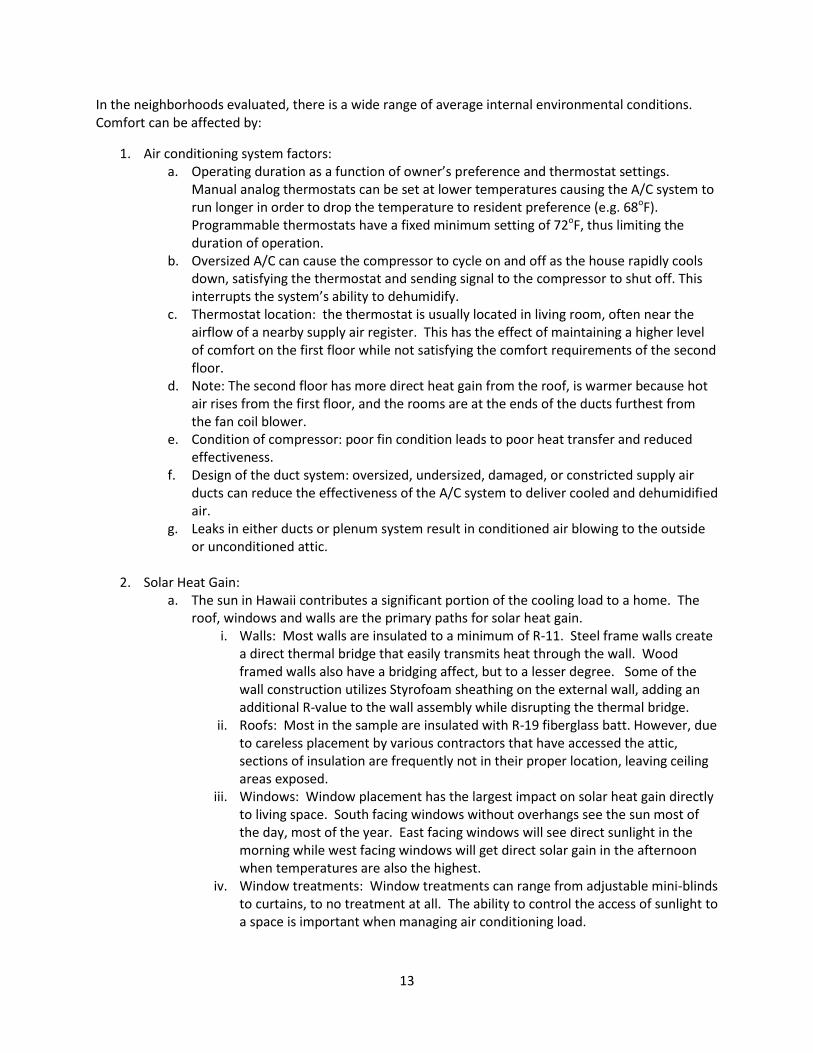
In the neighborhoods evaluated, there is a wide range of average internal environmental conditions. Comfort can be affected by:
1. Air conditioning system factors: a. Operating duration as a function of owner’s preference and thermostat settings.
Manual analog thermostats can be set at lower temperatures causing the A/C system to run longer in order to drop the temperature to resident preference (e.g. 68oF). Programmable thermostats have a fixed minimum setting of 72oF, thus limiting the duration of operation.
b. Oversized A/C can cause the compressor to cycle on and off as the house rapidly cools down, satisfying the thermostat and sending signal to the compressor to shut off. This interrupts the system’s ability to dehumidify.
c. Thermostat location: the thermostat is usually located in living room, often near the airflow of a nearby supply air register. This has the effect of maintaining a higher level of comfort on the first floor while not satisfying the comfort requirements of the second floor.
d. Note: The second floor has more direct heat gain from the roof, is warmer because hot air rises from the first floor, and the rooms are at the ends of the ducts furthest from the fan coil blower.
e. Condition of compressor: poor fin condition leads to poor heat transfer and reduced effectiveness.
f. Design of the duct system: oversized, undersized, damaged, or constricted supply air ducts can reduce the effectiveness of the A/C system to deliver cooled and dehumidified air.
g. Leaks in either ducts or plenum system result in conditioned air blowing to the outside or unconditioned attic.
2. Solar Heat Gain:
a. The sun in Hawaii contributes a significant portion of the cooling load to a home. The roof, windows and walls are the primary paths for solar heat gain.
i. Walls: Most walls are insulated to a minimum of R-11. Steel frame walls create a direct thermal bridge that easily transmits heat through the wall. Wood framed walls also have a bridging affect, but to a lesser degree. Some of the wall construction utilizes Styrofoam sheathing on the external wall, adding an additional R-value to the wall assembly while disrupting the thermal bridge.
ii. Roofs: Most in the sample are insulated with R-19 fiberglass batt. However, due to careless placement by various contractors that have accessed the attic, sections of insulation are frequently not in their proper location, leaving ceiling areas exposed.
iii. Windows: Window placement has the largest impact on solar heat gain directly to living space. South facing windows without overhangs see the sun most of the day, most of the year. East facing windows will see direct sunlight in the morning while west facing windows will get direct solar gain in the afternoon when temperatures are also the highest.
iv. Window treatments: Window treatments can range from adjustable mini-blinds to curtains, to no treatment at all. The ability to control the access of sunlight to a space is important when managing air conditioning load.
14
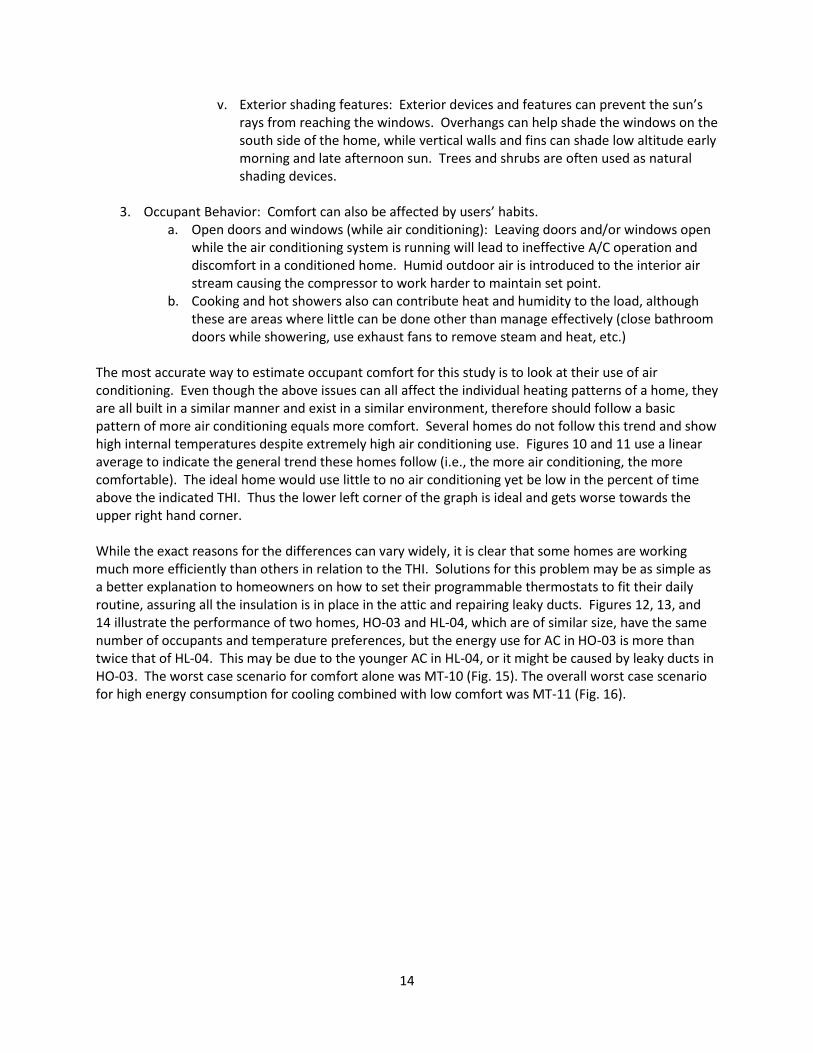
v. Exterior shading features: Exterior devices and features can prevent the sun’s rays from reaching the windows. Overhangs can help shade the windows on the south side of the home, while vertical walls and fins can shade low altitude early morning and late afternoon sun. Trees and shrubs are often used as natural shading devices.
3. Occupant Behavior: Comfort can also be affected by users’ habits. a. Open doors and windows (while air conditioning): Leaving doors and/or windows open
while the air conditioning system is running will lead to ineffective A/C operation and discomfort in a conditioned home. Humid outdoor air is introduced to the interior air stream causing the compressor to work harder to maintain set point.
b. Cooking and hot showers also can contribute heat and humidity to the load, although these are areas where little can be done other than manage effectively (close bathroom doors while showering, use exhaust fans to remove steam and heat, etc.)
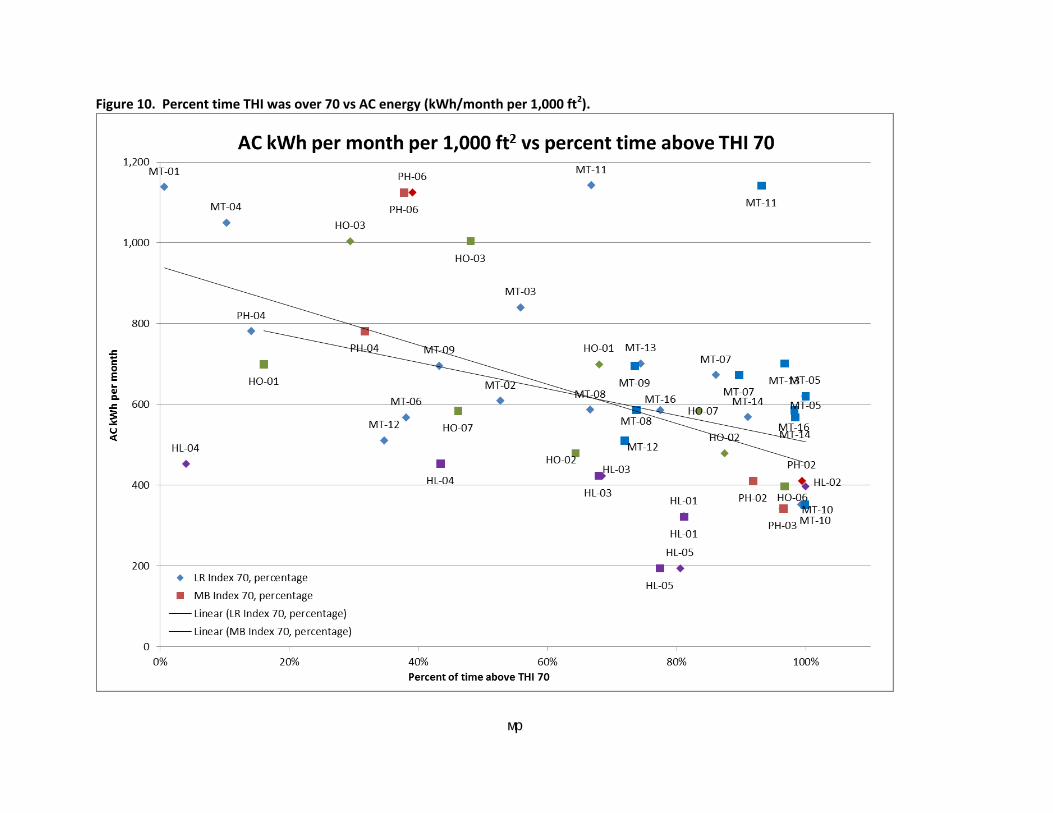
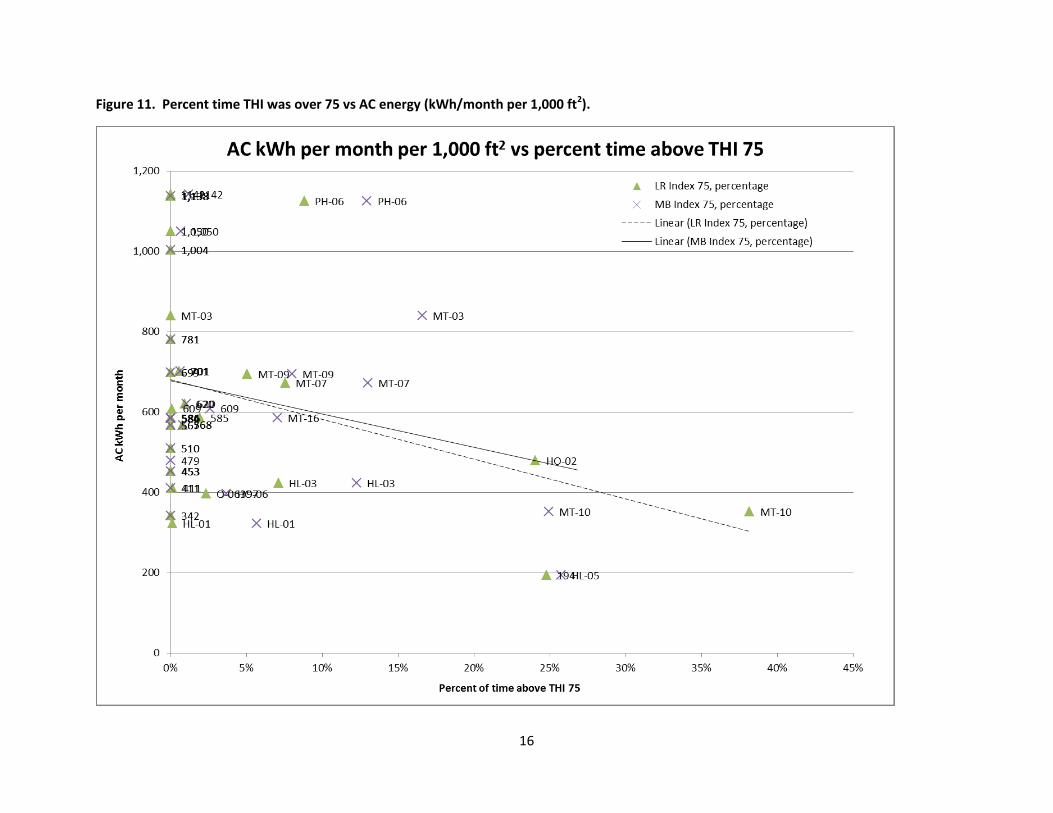
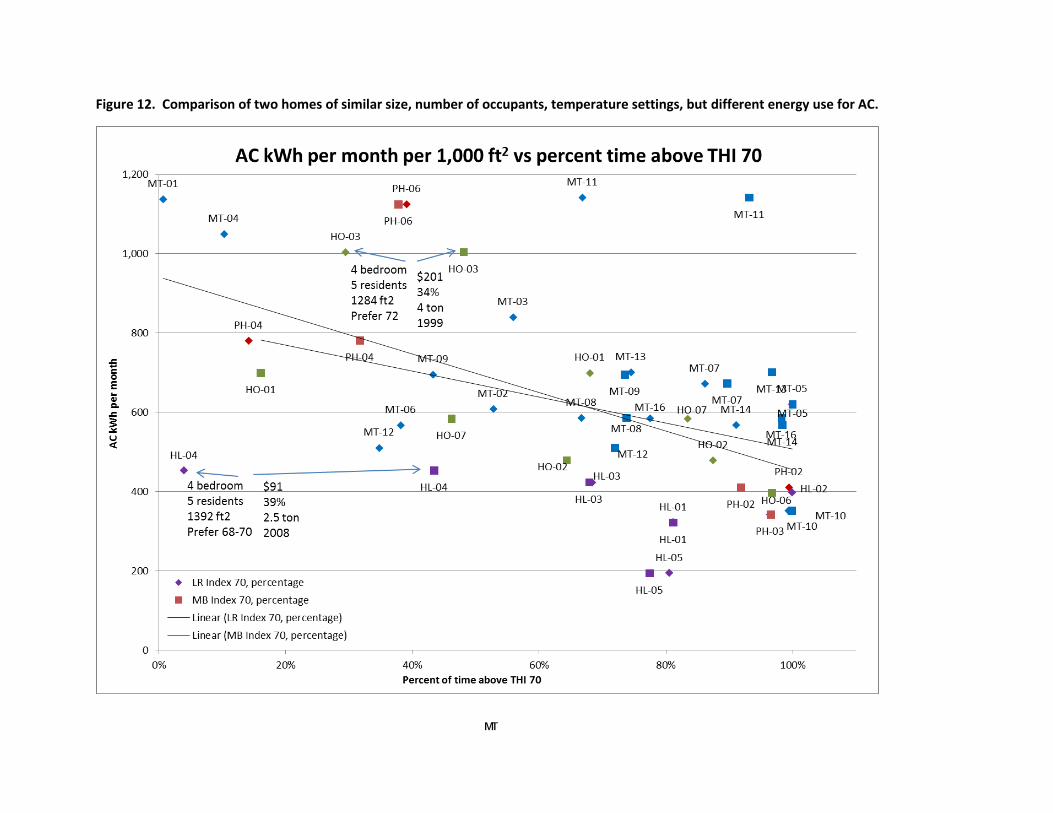
The most accurate way to estimate occupant comfort for this study is to look at their use of air conditioning. Even though the above issues can all affect the individual heating patterns of a home, they are all built in a similar manner and exist in a similar environment, therefore should follow a basic pattern of more air conditioning equals more comfort. Several homes do not follow this trend and show high internal temperatures despite extremely high air conditioning use. Figures 10 and 11 use a linear average to indicate the general trend these homes follow (i.e., the more air conditioning, the more comfortable). The ideal home would use little to no air conditioning yet be low in the percent of time above the indicated THI. Thus the lower left corner of the graph is ideal and gets worse towards the upper right hand corner. While the exact reasons for the differences can vary widely, it is clear that some homes are working much more efficiently than others in relation to the THI. Solutions for this problem may be as simple as a better explanation to homeowners on how to set their programmable thermostats to fit their daily routine, assuring all the insulation is in place in the attic and repairing leaky ducts. Figures 12, 13, and 14 illustrate the performance of two homes, HO-03 and HL-04, which are of similar size, have the same number of occupants and temperature preferences, but the energy use for AC in HO-03 is more than twice that of HL-04. This may be due to the younger AC in HL-04, or it might be caused by leaky ducts in HO-03. The worst case scenario for comfort alone was MT-10 (Fig. 15). The overall worst case scenario for high energy consumption for cooling combined with low comfort was MT-11 (Fig. 16).
мр
Figure 10. Percent time THI was over 70 vs AC energy (kWh/month per 1,000 ft2).
16
Figure 11. Percent time THI was over 75 vs AC energy (kWh/month per 1,000 ft2).
мт
Figure 12. Comparison of two homes of similar size, number of occupants, temperature settings, but different energy use for AC.
18
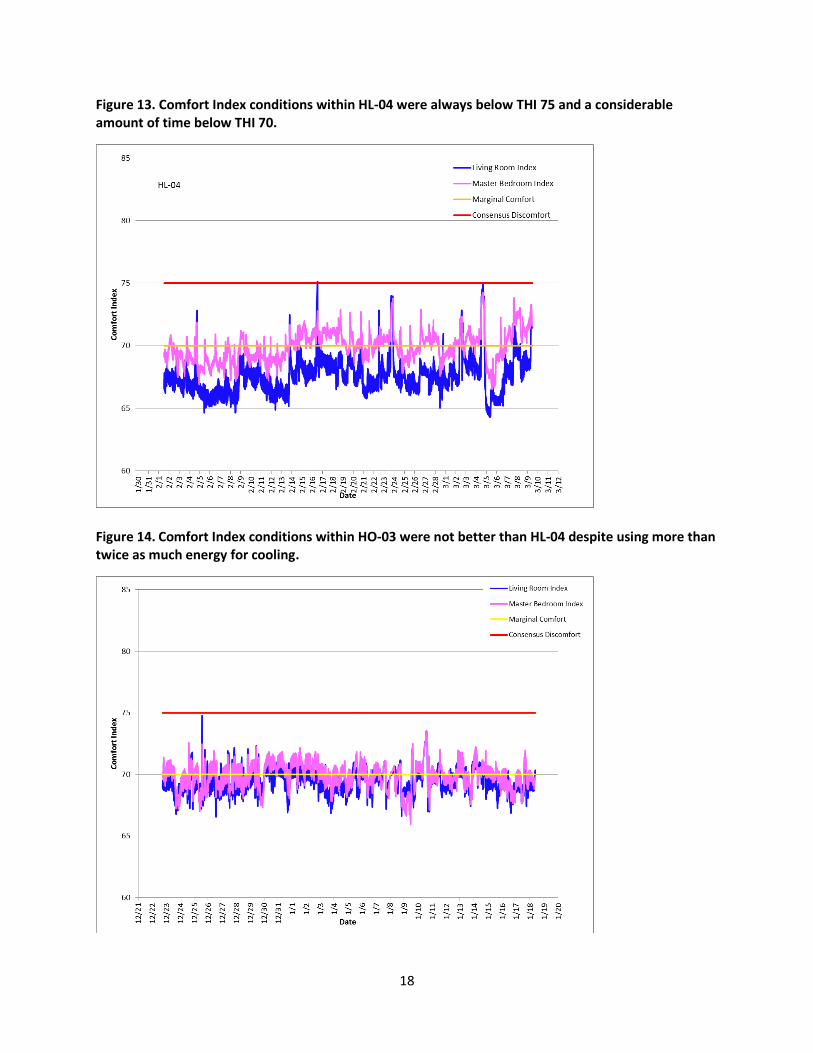
Figure 13. Comfort Index conditions within HL-04 were always below THI 75 and a considerable amount of time below THI 70.
Figure 14. Comfort Index conditions within HO-03 were not better than HL-04 despite using more than twice as much energy for cooling.
19
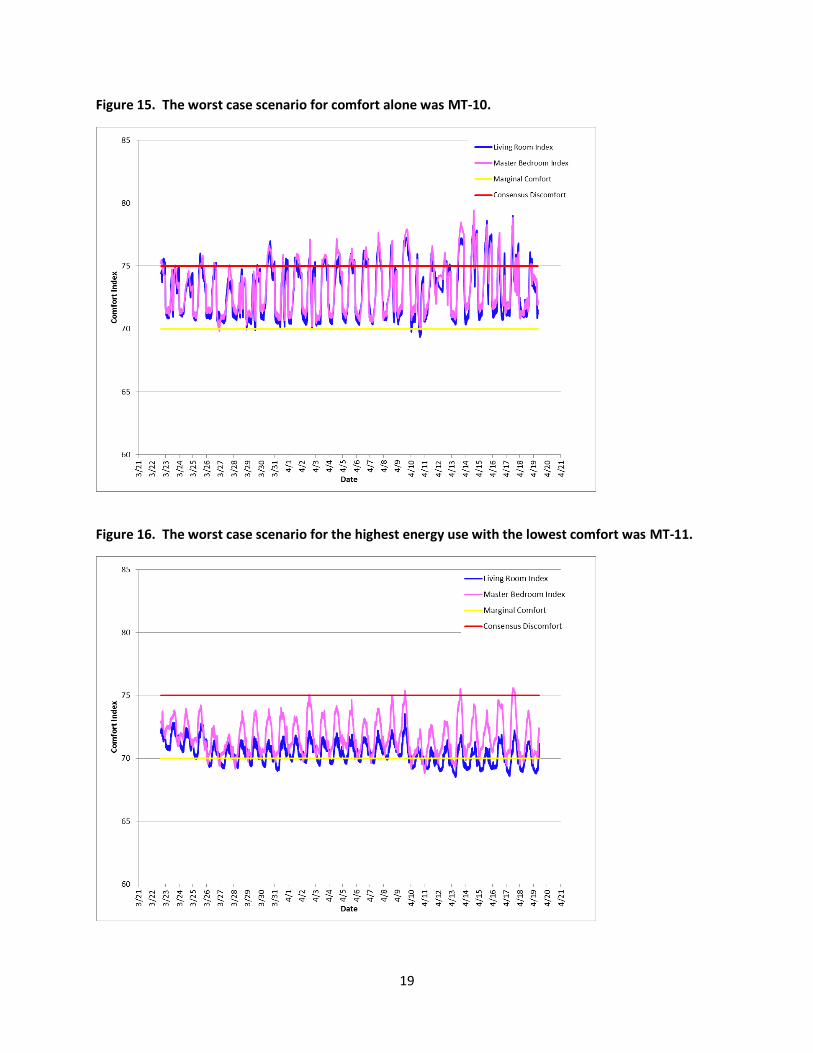
Figure 15. The worst case scenario for comfort alone was MT-10.
Figure 16. The worst case scenario for the highest energy use with the lowest comfort was MT-11.
20
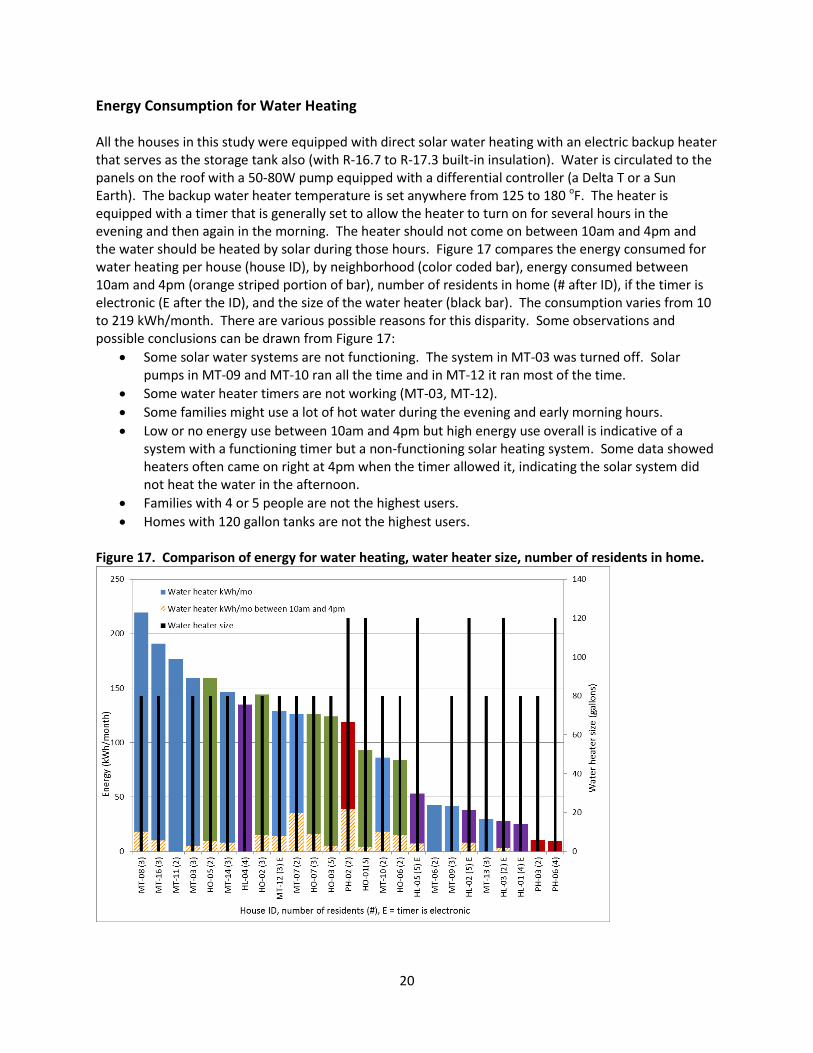
Energy Consumption for Water Heating All the houses in this study were equipped with direct solar water heating with an electric backup heater that serves as the storage tank also (with R-16.7 to R-17.3 built-in insulation). Water is circulated to the panels on the roof with a 50-80W pump equipped with a differential controller (a Delta T or a Sun Earth). The backup water heater temperature is set anywhere from 125 to 180 oF. The heater is equipped with a timer that is generally set to allow the heater to turn on for several hours in the evening and then again in the morning. The heater should not come on between 10am and 4pm and the water should be heated by solar during those hours. Figure 17 compares the energy consumed for water heating per house (house ID), by neighborhood (color coded bar), energy consumed between 10am and 4pm (orange striped portion of bar), number of residents in home (# after ID), if the timer is electronic (E after the ID), and the size of the water heater (black bar). The consumption varies from 10 to 219 kWh/month. There are various possible reasons for this disparity. Some observations and possible conclusions can be drawn from Figure 17:
Some solar water systems are not functioning. The system in MT-03 was turned off. Solar pumps in MT-09 and MT-10 ran all the time and in MT-12 it ran most of the time.
Some water heater timers are not working (MT-03, MT-12).
Some families might use a lot of hot water during the evening and early morning hours.
Low or no energy use between 10am and 4pm but high energy use overall is indicative of a system with a functioning timer but a non-functioning solar heating system. Some data showed heaters often came on right at 4pm when the timer allowed it, indicating the solar system did not heat the water in the afternoon.
Families with 4 or 5 people are not the highest users.
Homes with 120 gallon tanks are not the highest users.
Figure 17. Comparison of energy for water heating, water heater size, number of residents in home.
21
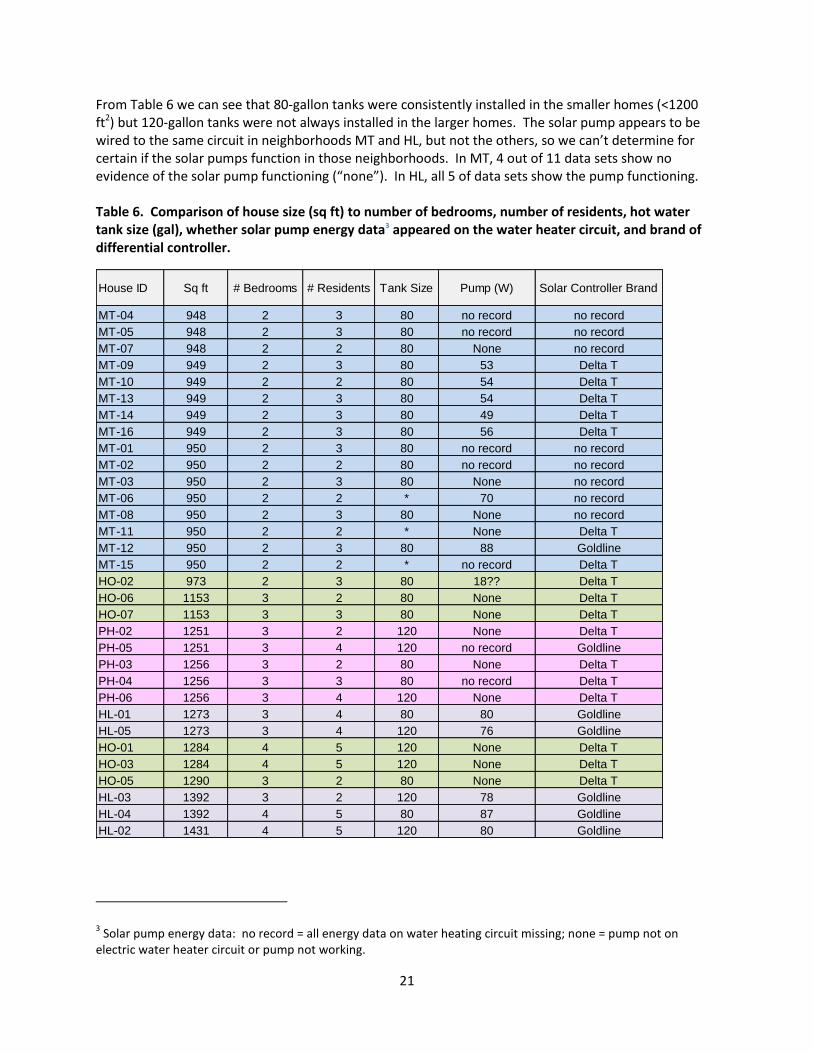
From Table 6 we can see that 80-gallon tanks were consistently installed in the smaller homes (<1200 ft2) but 120-gallon tanks were not always installed in the larger homes. The solar pump appears to be wired to the same circuit in neighborhoods MT and HL, but not the others, so we can’t determine for certain if the solar pumps function in those neighborhoods. In MT, 4 out of 11 data sets show no evidence of the solar pump functioning (“none”). In HL, all 5 of data sets show the pump functioning. Table 6. Comparison of house size (sq ft) to number of bedrooms, number of residents, hot water tank size (gal), whether solar pump energy data3 appeared on the water heater circuit, and brand of differential controller.
3 Solar pump energy data: no record = all energy data on water heating circuit missing; none = pump not on
electric water heater circuit or pump not working.
House ID Sq ft # Bedrooms # Residents Tank Size Pump (W) Solar Controller Brand
MT-04 948 2 3 80 no record no record
MT-05 948 2 3 80 no record no record
MT-07 948 2 2 80 None no record
MT-09 949 2 3 80 53 Delta T
MT-10 949 2 2 80 54 Delta T
MT-13 949 2 3 80 54 Delta T
MT-14 949 2 3 80 49 Delta T
MT-16 949 2 3 80 56 Delta T
MT-01 950 2 3 80 no record no record
MT-02 950 2 2 80 no record no record
MT-03 950 2 3 80 None no record
MT-06 950 2 2 * 70 no record
MT-08 950 2 3 80 None no record
MT-11 950 2 2 * None Delta T
MT-12 950 2 3 80 88 Goldline
MT-15 950 2 2 * no record Delta T
HO-02 973 2 3 80 18?? Delta T
HO-06 1153 3 2 80 None Delta T
HO-07 1153 3 3 80 None Delta T
PH-02 1251 3 2 120 None Delta T
PH-05 1251 3 4 120 no record Goldline
PH-03 1256 3 2 80 None Delta T
PH-04 1256 3 3 80 no record Delta T
PH-06 1256 3 4 120 None Delta T
HL-01 1273 3 4 80 80 Goldline
HL-05 1273 3 4 120 76 Goldline
HO-01 1284 4 5 120 None Delta T
HO-03 1284 4 5 120 None Delta T
HO-05 1290 3 2 80 None Delta T
HL-03 1392 3 2 120 78 Goldline
HL-04 1392 4 5 80 87 Goldline
HL-02 1431 4 5 120 80 Goldline
22
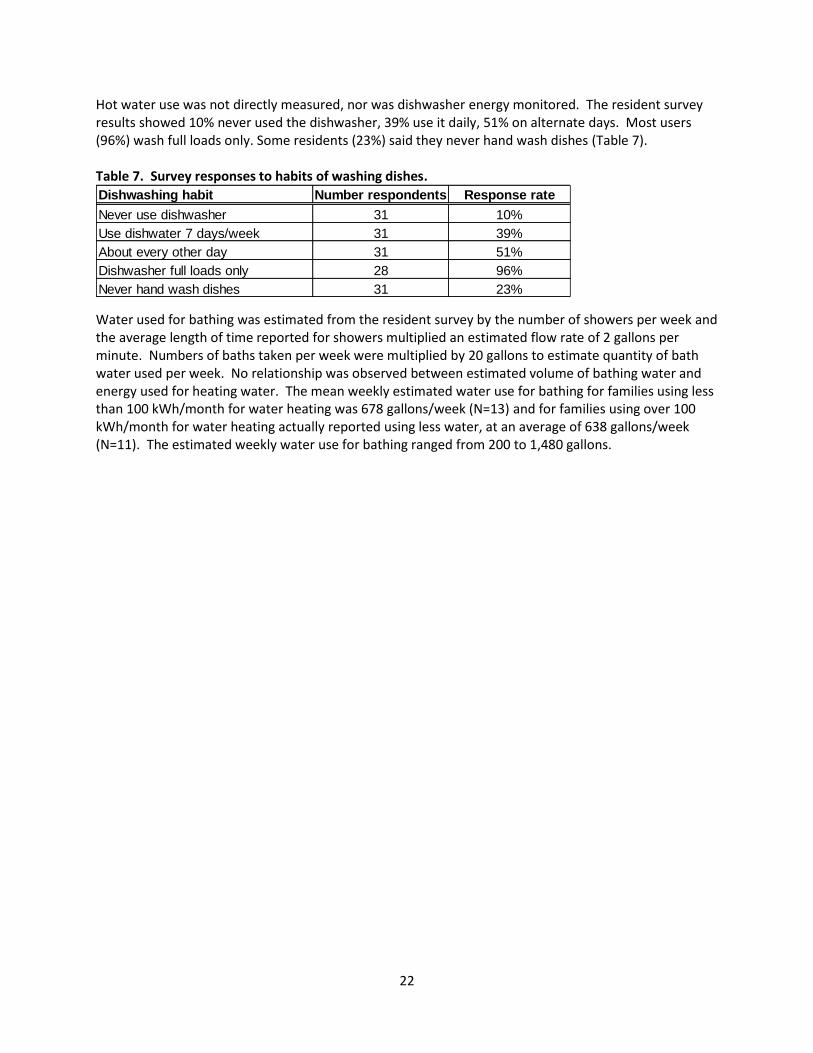
Hot water use was not directly measured, nor was dishwasher energy monitored. The resident survey results showed 10% never used the dishwasher, 39% use it daily, 51% on alternate days. Most users (96%) wash full loads only. Some residents (23%) said they never hand wash dishes (Table 7). Table 7. Survey responses to habits of washing dishes.
Water used for bathing was estimated from the resident survey by the number of showers per week and the average length of time reported for showers multiplied an estimated flow rate of 2 gallons per minute. Numbers of baths taken per week were multiplied by 20 gallons to estimate quantity of bath water used per week. No relationship was observed between estimated volume of bathing water and energy used for heating water. The mean weekly estimated water use for bathing for families using less than 100 kWh/month for water heating was 678 gallons/week (N=13) and for families using over 100 kWh/month for water heating actually reported using less water, at an average of 638 gallons/week (N=11). The estimated weekly water use for bathing ranged from 200 to 1,480 gallons.
Dishwashing habit Number respondents Response rate
Never use dishwasher 31 10%
Use dishwater 7 days/week 31 39%
About every other day 31 51%
Dishwasher full loads only 28 96%
Never hand wash dishes 31 23%
23
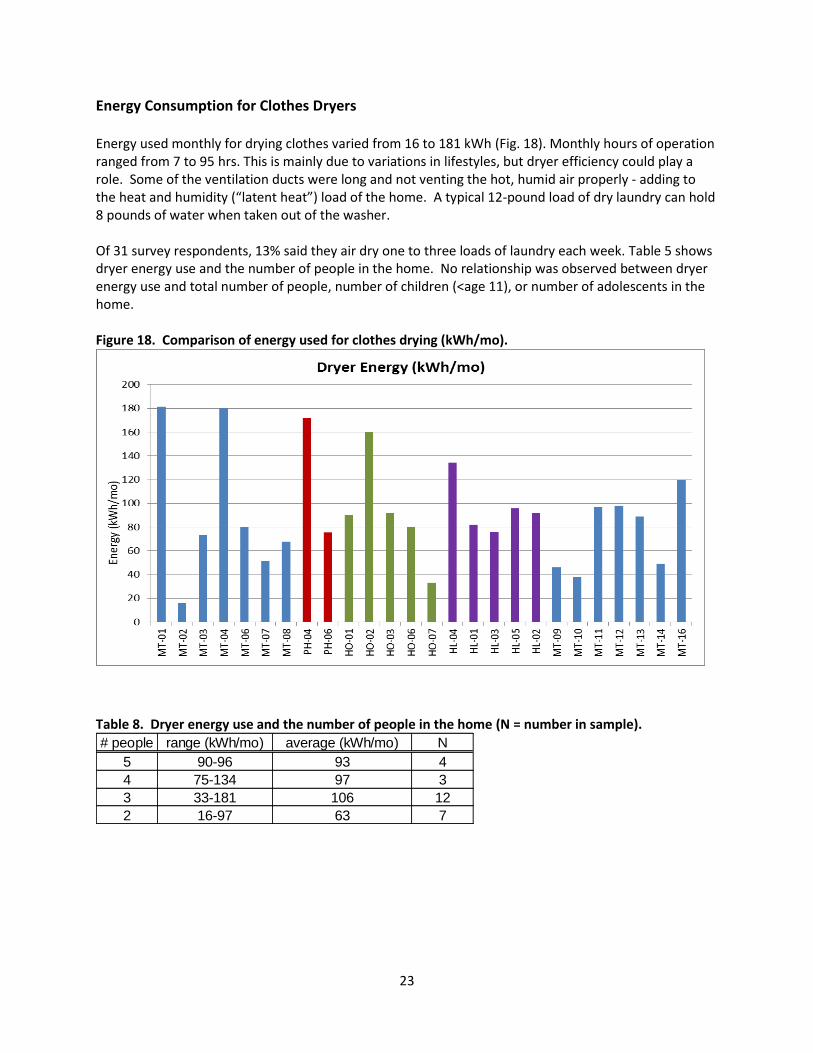
Energy Consumption for Clothes Dryers Energy used monthly for drying clothes varied from 16 to 181 kWh (Fig. 18). Monthly hours of operation ranged from 7 to 95 hrs. This is mainly due to variations in lifestyles, but dryer efficiency could play a role. Some of the ventilation ducts were long and not venting the hot, humid air properly - adding to the heat and humidity (“latent heat”) load of the home. A typical 12-pound load of dry laundry can hold 8 pounds of water when taken out of the washer. Of 31 survey respondents, 13% said they air dry one to three loads of laundry each week. Table 5 shows dryer energy use and the number of people in the home. No relationship was observed between dryer energy use and total number of people, number of children (<age 11), or number of adolescents in the home. Figure 18. Comparison of energy used for clothes drying (kWh/mo).
Table 8. Dryer energy use and the number of people in the home (N = number in sample).
# people range (kWh/mo) average (kWh/mo) N
5 90-96 93 4
4 75-134 97 3
3 33-181 106 12
2 16-97 63 7
24
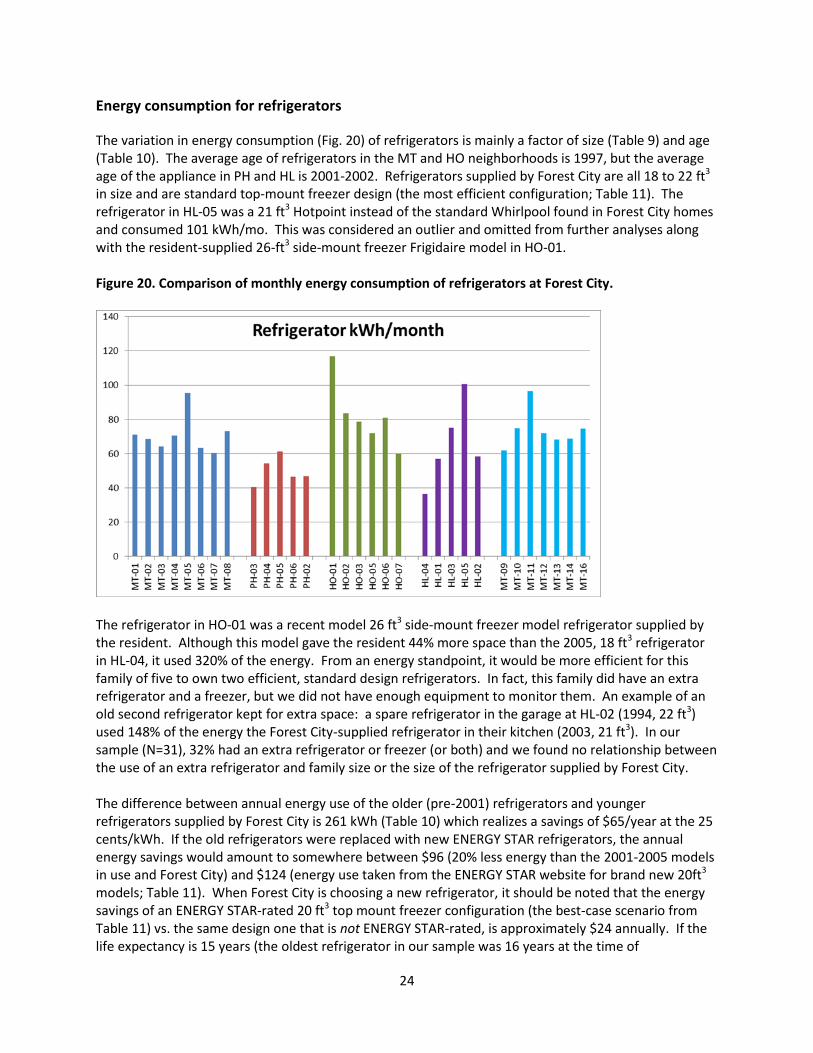
Energy consumption for refrigerators
The variation in energy consumption (Fig. 20) of refrigerators is mainly a factor of size (Table 9) and age (Table 10). The average age of refrigerators in the MT and HO neighborhoods is 1997, but the average age of the appliance in PH and HL is 2001-2002. Refrigerators supplied by Forest City are all 18 to 22 ft3 in size and are standard top-mount freezer design (the most efficient configuration; Table 11). The refrigerator in HL-05 was a 21 ft3 Hotpoint instead of the standard Whirlpool found in Forest City homes and consumed 101 kWh/mo. This was considered an outlier and omitted from further analyses along with the resident-supplied 26-ft3 side-mount freezer Frigidaire model in HO-01. Figure 20. Comparison of monthly energy consumption of refrigerators at Forest City.
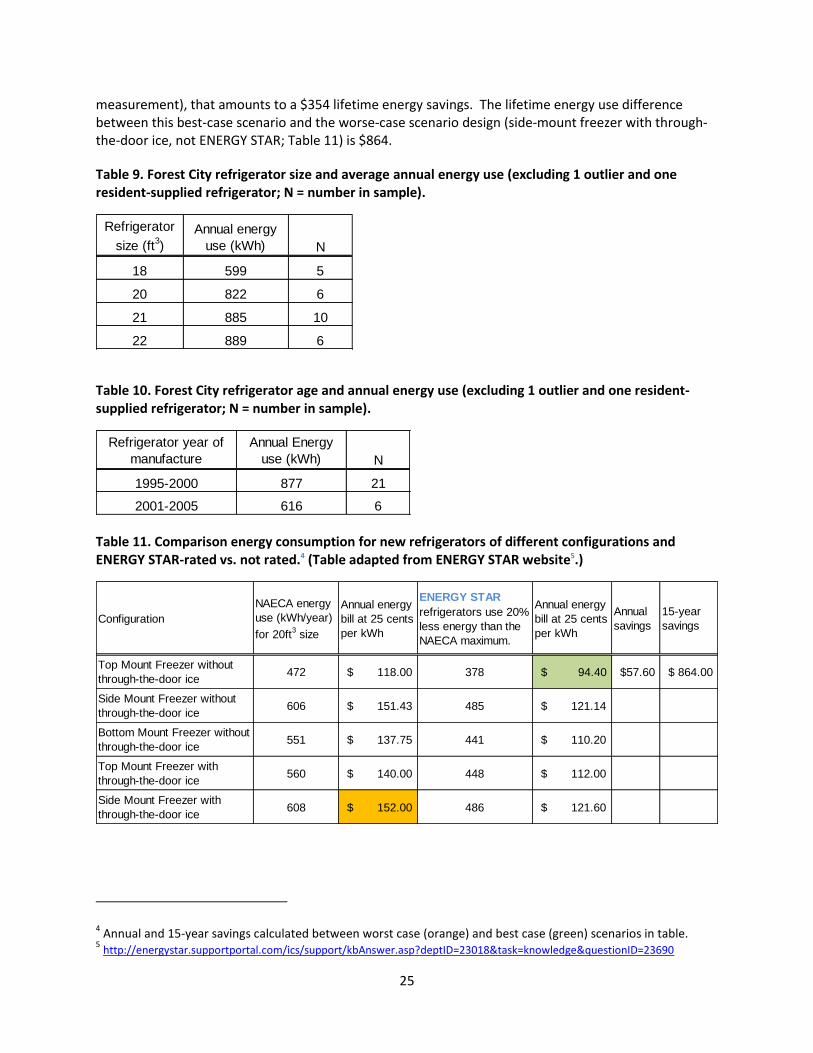
The refrigerator in HO-01 was a recent model 26 ft3 side-mount freezer model refrigerator supplied by the resident. Although this model gave the resident 44% more space than the 2005, 18 ft3 refrigerator in HL-04, it used 320% of the energy. From an energy standpoint, it would be more efficient for this family of five to own two efficient, standard design refrigerators. In fact, this family did have an extra refrigerator and a freezer, but we did not have enough equipment to monitor them. An example of an old second refrigerator kept for extra space: a spare refrigerator in the garage at HL-02 (1994, 22 ft3) used 148% of the energy the Forest City-supplied refrigerator in their kitchen (2003, 21 ft3). In our sample (N=31), 32% had an extra refrigerator or freezer (or both) and we found no relationship between the use of an extra refrigerator and family size or the size of the refrigerator supplied by Forest City. The difference between annual energy use of the older (pre-2001) refrigerators and younger refrigerators supplied by Forest City is 261 kWh (Table 10) which realizes a savings of $65/year at the 25 cents/kWh. If the old refrigerators were replaced with new ENERGY STAR refrigerators, the annual energy savings would amount to somewhere between $96 (20% less energy than the 2001-2005 models in use and Forest City) and $124 (energy use taken from the ENERGY STAR website for brand new 20ft3 models; Table 11). When Forest City is choosing a new refrigerator, it should be noted that the energy savings of an ENERGY STAR-rated 20 ft3 top mount freezer configuration (the best-case scenario from Table 11) vs. the same design one that is not ENERGY STAR-rated, is approximately $24 annually. If the life expectancy is 15 years (the oldest refrigerator in our sample was 16 years at the time of
25
measurement), that amounts to a $354 lifetime energy savings. The lifetime energy use difference between this best-case scenario and the worse-case scenario design (side-mount freezer with through-the-door ice, not ENERGY STAR; Table 11) is $864.
Table 9. Forest City refrigerator size and average annual energy use (excluding 1 outlier and one resident-supplied refrigerator; N = number in sample).
Table 10. Forest City refrigerator age and annual energy use (excluding 1 outlier and one resident-supplied refrigerator; N = number in sample).
Table 11. Comparison energy consumption for new refrigerators of different configurations and ENERGY STAR-rated vs. not rated.4 (Table adapted from ENERGY STAR website5.)
4 Annual and 15-year savings calculated between worst case (orange) and best case (green) scenarios in table.
5 http://energystar.supportportal.com/ics/support/kbAnswer.asp?deptID=23018&task=knowledge&questionID=23690
Refrigerator
size (ft3)
Annual energy
use (kWh) N
18 599 5
20 822 6
21 885 10
22 889 6
Refrigerator year of
manufacture
Annual Energy
use (kWh) N
1995-2000 877 21
2001-2005 616 6
Configuration
NAECA energy
use (kWh/year)
for 20ft3 size
Annual energy
bill at 25 cents
per kWh
ENERGY STAR
refrigerators use 20%
less energy than the
NAECA maximum.
Annual energy
bill at 25 cents
per kWh
Annual
savings
15-year
savings
Top Mount Freezer without
through-the-door ice 472 $ 118.00 378 $ 94.40 $57.60 $ 864.00
Side Mount Freezer without
through-the-door ice606 $ 151.43 485 $ 121.14
Bottom Mount Freezer without
through-the-door ice 551 $ 137.75 441 $ 110.20
Top Mount Freezer with
through-the-door ice 560 $ 140.00 448 $ 112.00
Side Mount Freezer with
through-the-door ice 608 $ 152.00 486 $ 121.60
26
RECOMMENDATIONS As a result of the Watt Watcher team’s data collection, monitoring and site observations, there are a whole host of recommendations. We presume, but do not take for granted, that Forest City has already made similar observations. The Watt Watcher Team has begun to catalog observations and recommendations as follows:
Modifications to Existing Air Conditioning Systems
1. Inspect attics for duct leakage and missing attic insulation. a. We have seen a duct completely disconnected (it was reported and repaired). b. Insulation in the attic of many homes had been pushed aside – presumably for
installation of the security wiring. This was included in the 2009 Sentech report 2009. c. Soffit areas need insulation. d. Seal chase and ducts in attic. e. Seal return plenum under air handler. f. Attic hatch panel should be insulated.
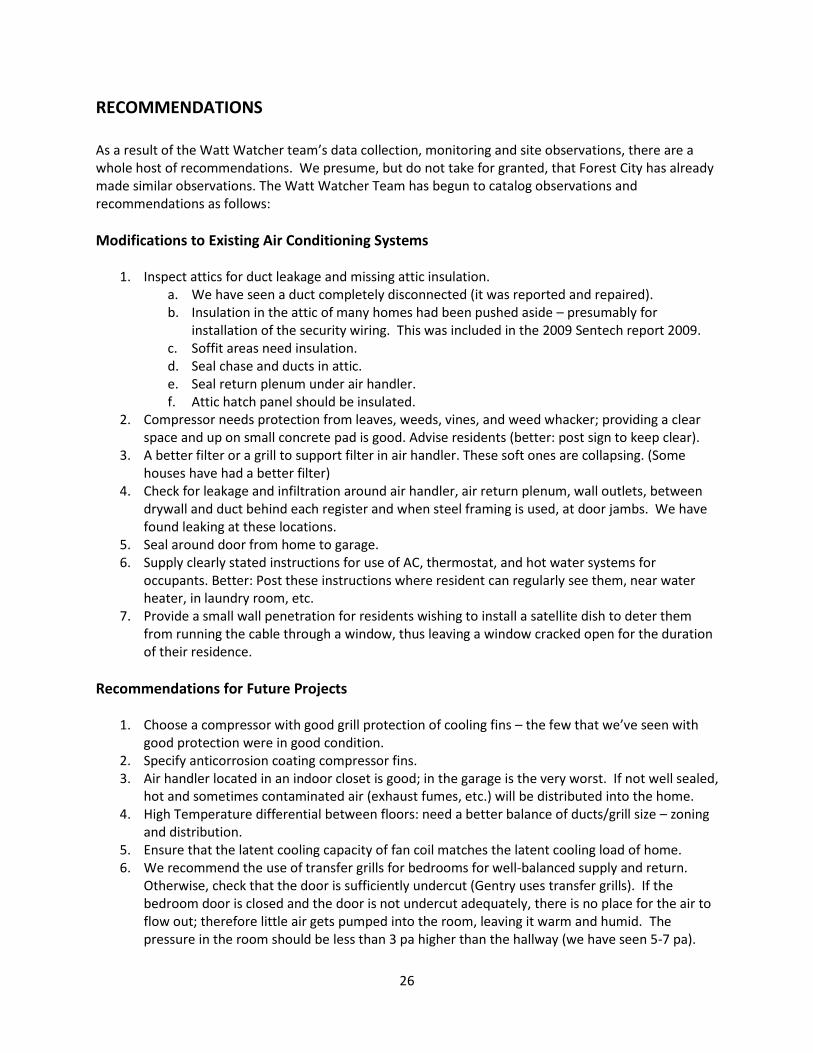
2. Compressor needs protection from leaves, weeds, vines, and weed whacker; providing a clear space and up on small concrete pad is good. Advise residents (better: post sign to keep clear).
3. A better filter or a grill to support filter in air handler. These soft ones are collapsing. (Some houses have had a better filter)
4. Check for leakage and infiltration around air handler, air return plenum, wall outlets, between drywall and duct behind each register and when steel framing is used, at door jambs. We have found leaking at these locations.
5. Seal around door from home to garage. 6. Supply clearly stated instructions for use of AC, thermostat, and hot water systems for
occupants. Better: Post these instructions where resident can regularly see them, near water heater, in laundry room, etc.
7. Provide a small wall penetration for residents wishing to install a satellite dish to deter them from running the cable through a window, thus leaving a window cracked open for the duration of their residence.
Recommendations for Future Projects
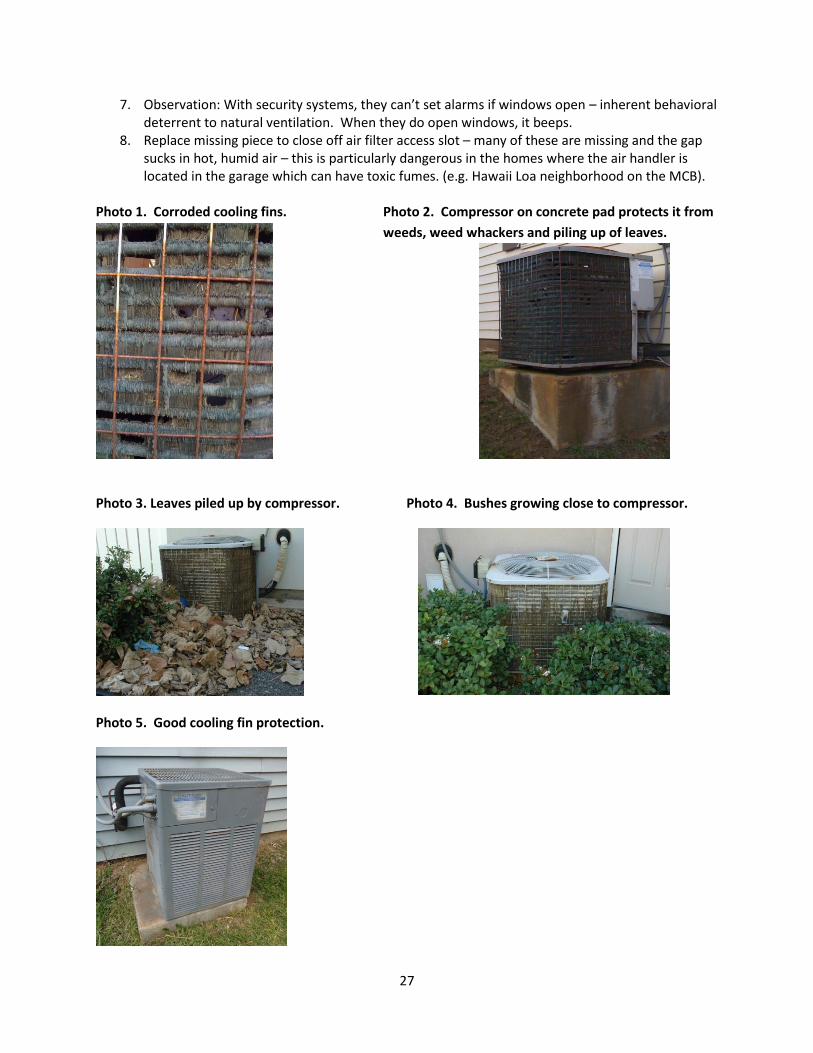
1. Choose a compressor with good grill protection of cooling fins – the few that we’ve seen with good protection were in good condition.
2. Specify anticorrosion coating compressor fins. 3. Air handler located in an indoor closet is good; in the garage is the very worst. If not well sealed,
hot and sometimes contaminated air (exhaust fumes, etc.) will be distributed into the home. 4. High Temperature differential between floors: need a better balance of ducts/grill size – zoning
and distribution. 5. Ensure that the latent cooling capacity of fan coil matches the latent cooling load of home. 6. We recommend the use of transfer grills for bedrooms for well-balanced supply and return.
Otherwise, check that the door is sufficiently undercut (Gentry uses transfer grills). If the bedroom door is closed and the door is not undercut adequately, there is no place for the air to flow out; therefore little air gets pumped into the room, leaving it warm and humid. The pressure in the room should be less than 3 pa higher than the hallway (we have seen 5-7 pa).
27
7. Observation: With security systems, they can’t set alarms if windows open – inherent behavioral deterrent to natural ventilation. When they do open windows, it beeps.
8. Replace missing piece to close off air filter access slot – many of these are missing and the gap sucks in hot, humid air – this is particularly dangerous in the homes where the air handler is located in the garage which can have toxic fumes. (e.g. Hawaii Loa neighborhood on the MCB).
Photo 1. Corroded cooling fins. Photo 2. Compressor on concrete pad protects it from
weeds, weed whackers and piling up of leaves.
Photo 3. Leaves piled up by compressor. Photo 4. Bushes growing close to compressor.
Photo 5. Good cooling fin protection.
28
Lighting
1. Promote CFLs. a. Ceiling fan CFLs are frequently dimmable. Conventional, non-dimming CFLs may
experience shorter life and may hum when dimmed. b. Keep up and advertise the light bulb exchange program, possibly supply them with a few
spare bulbs. There is evidence they replace with incandescent bulbs (we find CFL and incandescent in the same fixture).
c. CFL specification needs to be visually consistent (same color temperature). d. There are performance issues associated with mounting CFL in side and down mounted
configurations. These impact performance and life of the lamps. CFLs that are designed for inverted and side mounting are preferred.
2. 1 or 2-lamp fixtures are better than 4-lamp fixtures – extra light is not necessary. In many fixtures, the resident has unscrewed some of the lamps.
3. The specialty PL fluorescent tubes are a good choice. 4. We recommend use of solar tubes. Some manufacturers have Solar Heat Gain Coefficients
(SHGC) as low as 0.20, and qualify for EPA Energy Star labeling. Low SHGC means that visible light is transmitted with minimal heat transfer to the interior.
5. More ceiling fans – increased air speed means that a higher temperature/humidity condition can still be comfortable.
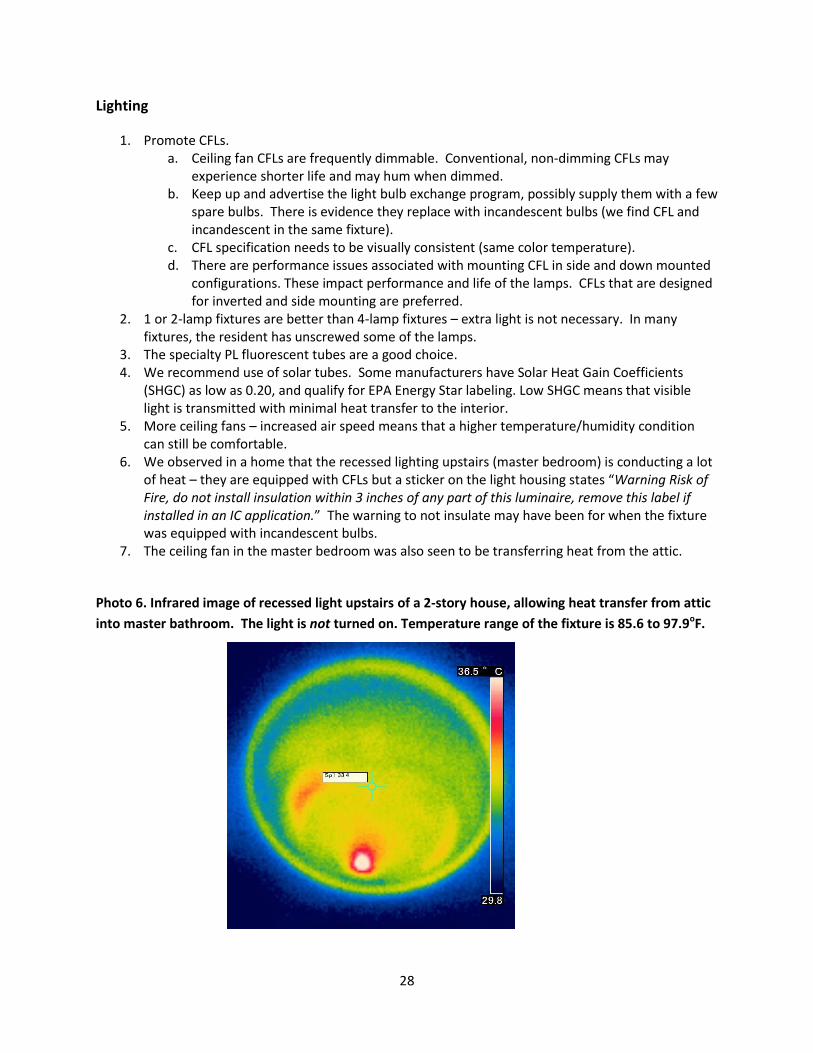
6. We observed in a home that the recessed lighting upstairs (master bedroom) is conducting a lot of heat – they are equipped with CFLs but a sticker on the light housing states “Warning Risk of Fire, do not install insulation within 3 inches of any part of this luminaire, remove this label if installed in an IC application.” The warning to not insulate may have been for when the fixture was equipped with incandescent bulbs.
7. The ceiling fan in the master bedroom was also seen to be transferring heat from the attic.
Photo 6. Infrared image of recessed light upstairs of a 2-story house, allowing heat transfer from attic
into master bathroom. The light is not turned on. Temperature range of the fixture is 85.6 to 97.9oF.
29
Hot water
1. Post clear instructions for the occupant. 2. Four pins set on manual timer – sometimes these are missing and the occupant never touched
it, so FC did not check it on turnover. 3. Digital timer would be better – the time doesn’t drift. Check /replace battery at occupancy
change. Set for occupant upon moving in; they are less likely to tamper with it than the manual timer.
4. Set differential controller (Delta T) on auto (not “on”). 5. Temperature differential settings should be consistent and set to a temperature difference of 12
and high limit of 170 oF6 and checked on turnover. 6. Temperature setting on electric water heater should be set to 120oF.7,8 7. Check that the pump and sensors are functioning. 8. Solar panels NOT in shade and at optimal angle if possible (some panels in the shade in Hokulani
neighborhood). 9. The anode rod should be removed from the water heater tank every 3 years for inspection. If
the rod is more than 50% depleted, the anode rod should be replaced.9 5. It is recommended that the tank be drained, and flushed every 6 months to remove sediment
which may buildup during operation. 5 6. On turnover10, the entire solar hot water system should be given a thorough inspection and
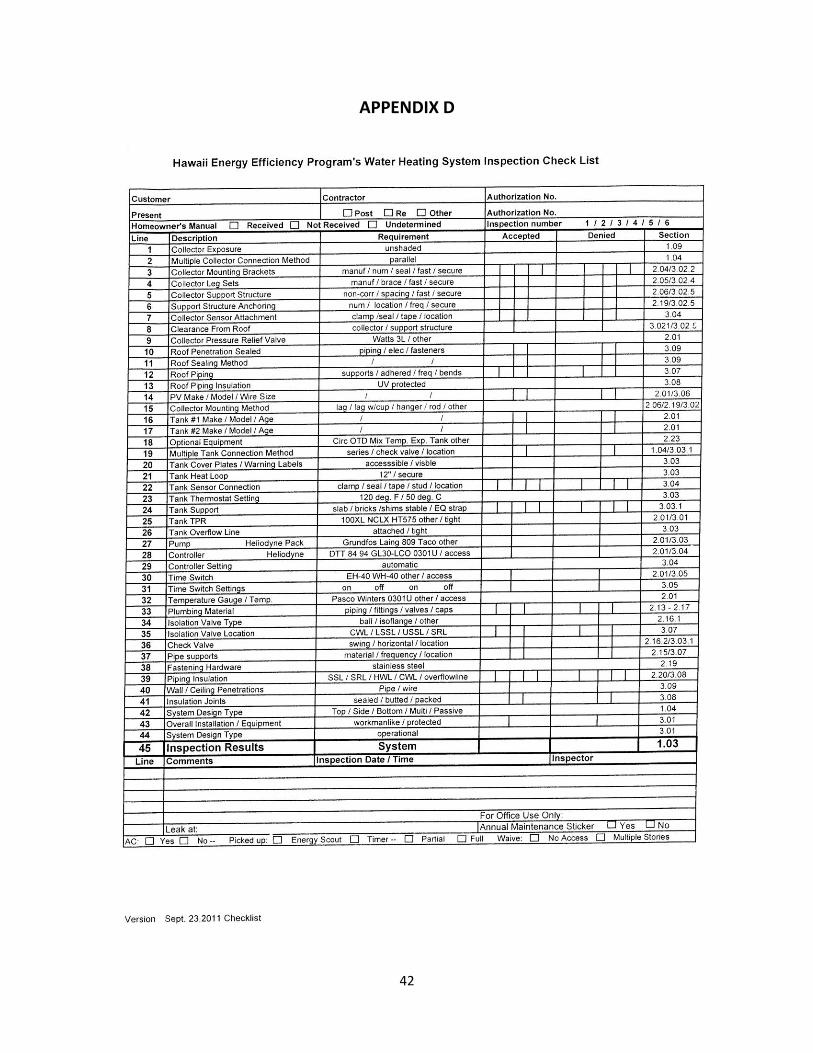
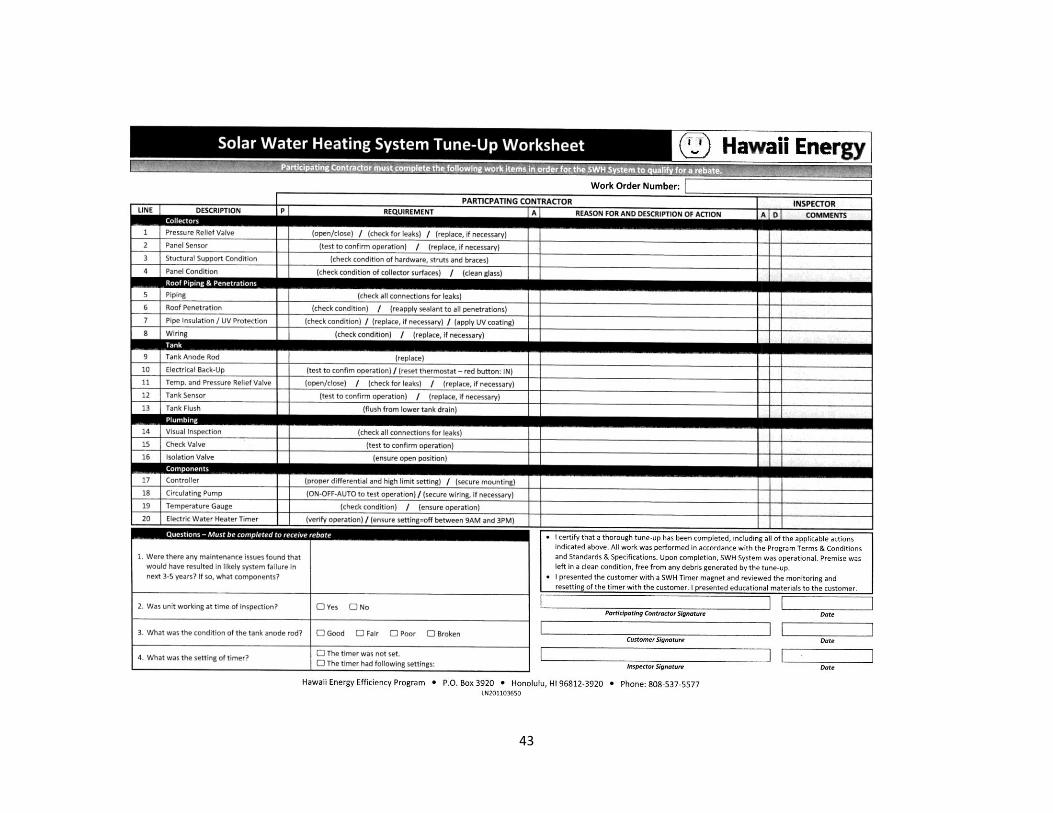
maintained as per the checklist compiled by Hawaii Energy (see Appendix D).
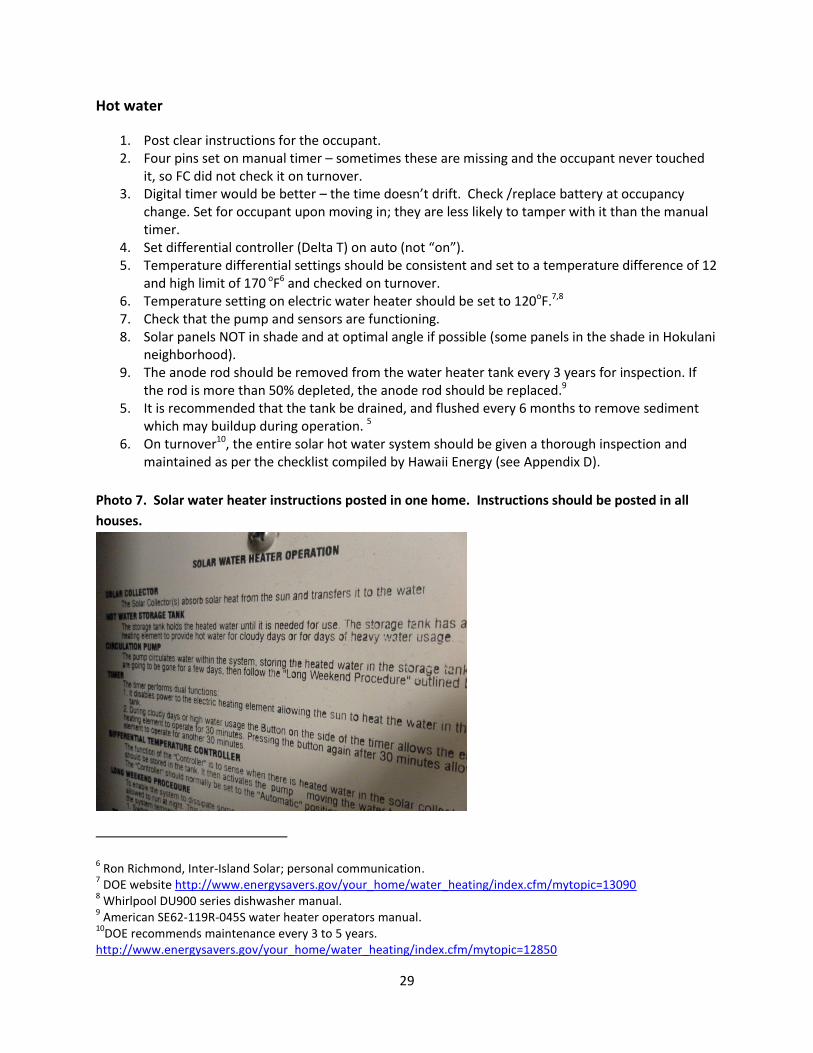
Photo 7. Solar water heater instructions posted in one home. Instructions should be posted in all
houses.
6 Ron Richmond, Inter-Island Solar; personal communication.
7 DOE website http://www.energysavers.gov/your_home/water_heating/index.cfm/mytopic=13090
8 Whirlpool DU900 series dishwasher manual.
9 American SE62-119R-045S water heater operators manual.
10DOE recommends maintenance every 3 to 5 years.
http://www.energysavers.gov/your_home/water_heating/index.cfm/mytopic=12850
30
Dryer
1. Dryer duct lengths are often too long with a couple of 90o elbows. Avoid this in new builds and retrofit existing houses with long duct runs by installing a clean-out access. In one 2-story house we inspected, the dryer duct ran from the first floor up to the attic.
2. Dryer duct needs regular inspection/clean out. 3. Dryer located in the garage is a good idea – it is isolated and will keep heat and humidity out of
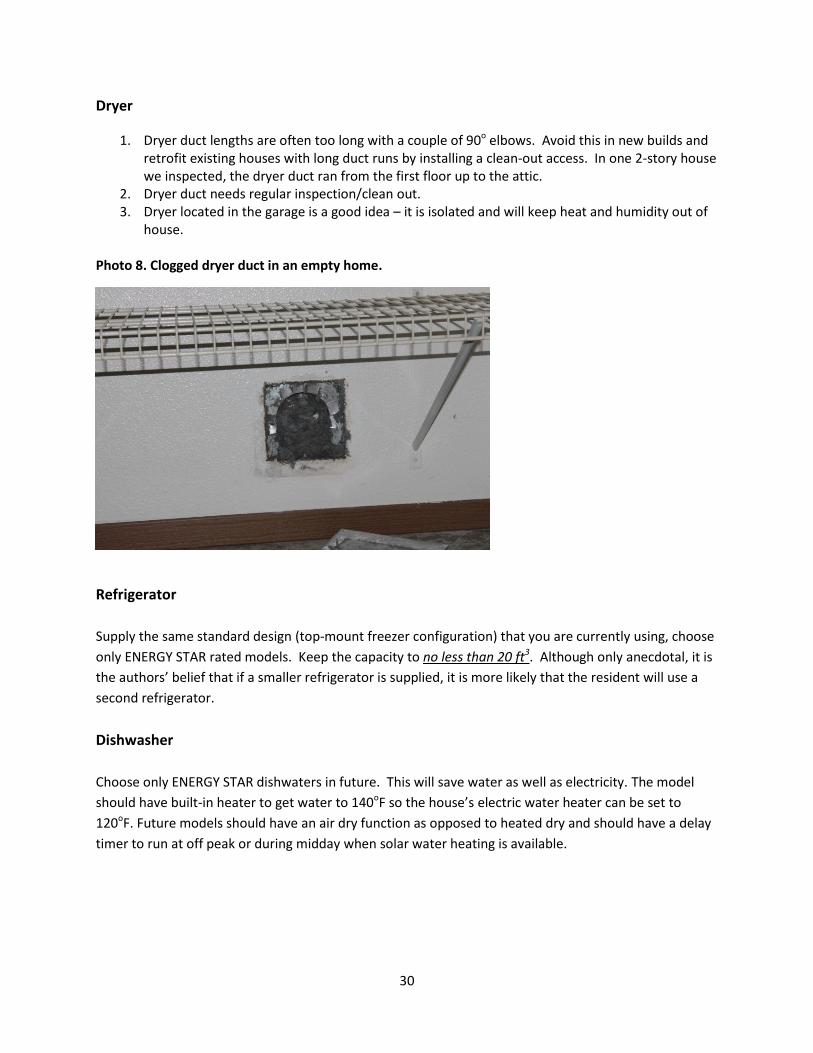
house. Photo 8. Clogged dryer duct in an empty home.
Refrigerator
Supply the same standard design (top-mount freezer configuration) that you are currently using, choose
only ENERGY STAR rated models. Keep the capacity to no less than 20 ft3. Although only anecdotal, it is
the authors’ belief that if a smaller refrigerator is supplied, it is more likely that the resident will use a
second refrigerator.
Dishwasher
Choose only ENERGY STAR dishwaters in future. This will save water as well as electricity. The model
should have built-in heater to get water to 140oF so the house’s electric water heater can be set to
120oF. Future models should have an air dry function as opposed to heated dry and should have a delay
timer to run at off peak or during midday when solar water heating is available.
31
ADDITIONS TO TURNOVER PUNCH LIST These items don’t appear to be checked on a regular basis and we would recommend making a specific section on the turnover punch list to cover them.
Check all sinks, showers, toilets for leaking/dripping (use dye tabs in toilet tank). Check functioning of solar hot water system:
o Visually inspect panels on roof for cracking or water pooling inside. o Confirm the circulation pump is functioning. o Check the temperature sensors are functioning. o There are currently 2 models of differential controllers at Forest City:
Delta T set to “auto.” Goldline Sun Earth settings should be set to temperature differential of 12oF and
at high limit at 170oF – the settings should be written on the checklist. o Set electric heater to a temperature of 120oF (we have seen up to 170oF; the technician
may have accidentally set it to the Goldline Sun Earth settings). o Program digital timer or set pins and time on manual timer. o Flush out water heater tank. o Check water heater tank anode and replace if necessary.
Check AC system: o Check coolant charge. o Check for air leakage around return box and air handler. o Check if the condensate drain is blocked. o Clean air handler coils. o Replace missing cover to filter access area. o Change air filter. o Leave spare filters for occupant.
Post instructions for resident: setting AC thermostat, changing AC filter, setting water heater timer, etc.
Clean out dryer ventilation duct. Check for incandescent light bulbs and switch out for CFL. Check attic for:
o Broken ducts o Insulation that has been moved aside o Evidence of rat infestation.
32
APPENDIX A
University of Hawaii Watt Watcher Program Forest City Resident Energy Saving Tips
Power in Hawaii is, on average, twice as expensive as it is on the mainland. What you consider a “high” bill in dollars here might be charging for the same number of kilowatt hours as a “normal” bill on the mainland. It’s the kWh of use you should look at – but most people only pay attention to the dollar amount of the bill. Hawaii is 92% reliant on fossil fuel to generate electricity vs. 70% for the US average, and 76% reliant on oil specifically vs. 1% for the US average (which uses 45% coal and 24% natural gas). The oil brought into Hawaii is 96% foreign oil shipped in from Southeast Asia and the Middle East. Our remote location adds a high shipping cost to our fuel, adding to our cost of electricity. The price of our electricity rises directly with oil prices. Electricity production from fossil fuels in Hawaii is a concern from several standpoints: economic (trade deficit = we send our dollars offshore), security, and environmental. One thing we can do as individuals is conserve electricity.
Air Conditioning can use up to 69% of the electricity in a military home in Hawaii.
Air Conditioning Tips:
Turn off AC, open windows, and use fans when outdoor temperature is amendable. If running the AC – set thermostat higher and use a fan to aid comfort (turn off fan
when you are not in that room since it does not cool the room, but cools your skin). Turn off AC when leaving the house and close drapes to keep the sun out. Use the ventilation fan in the bathroom when showering and the kitchen when
cooking to remove humidity from the home. Change the AC air filter regularly. Keep personal items away from the AC compressor – it needs air circulation to cool
the fins. Compressors enclosed in a fence are often cluttered with storage of toys, recycling, or trash.
Keep grass, leaves, and debris clear of AC compressor.
Water heaters can consume 10 to 210 kWh/month in a military home in Hawaii.
Hot Water Tips:
Check pins on water heater timer and check time is set correctly - the arrow should point at the correct time. It should be set to come on from 4 to 8 am and 4 to 8 pm. If you don’t feel you need extra water heating, you can remove a pair of pins (a pair is made up of one brass pin and one aluminum pin) and leave electric heater off for that time period or set pins closer together so the heater turns off sooner. The
33
electric element uses 4 kW of energy when it runs. The more hot water you use, the longer it has to stay on to heat the additional water.
If you have a “Delta T” controller, keep it on “auto” (only turn to “on” when you will be away for more than 2 days and then turn it back to “auto” when you return).
Use hot water during the sunny hours of the day when solar water heating is running for free hot water!
Report problems to FC: not getting hot water during a sunny day; any water leakage in the home; if you notice the solar pump (on top of water heater) never comes on.
Take short showers – this uses less water heating and introduces less heat and humidity into the house which will in turn allow AC to work less.
Clothes Dryer Tips
After showering, hang your bath towel to dry and reuse it to save water and electricity. Your clothes dryer uses about 5.5 kW when the heating element comes on – that is like running 4 or 5 hairdryers at the same time.
Hang laundry to dry or run the dryer for the shortest time necessary to dry the clothes. Auto sensors that let you choose “more dry” or “less dry” can be helpful.
Don’t choose a “touch up” feature that runs the dryer for a few minutes several times an hour until you unload it hours later.
And don’t walk away and leave the dryer door open if it has a light inside. Dishwasher Tips
Use your dishwasher and run only full loads. Scrape, don’t pre-rinse before loading dishes. Avoid hand washing dishes to save water. Use the energy saving “no heat” drying mode or air dry your dishes. Use the “delay start timer” to run during peak solar water heating hours (10am to
4pm). Other tips:
Avoid using an extra refrigerator or freezer. If necessary, use an Energy Star model. Turn off lights and televisions when you leave a room. Use Energy Star computers, televisions, etc. Put items on a power strip and turn off
power strip when not using devises – this prevents “ghost loads” (small amount of electricity each electronic device consumes in standby mode).
Fluorescent light bulbs use 75% less energy than incandescent bulbs. Don’t replace compact fluorescent bulbs with incandescent – Forest City will provide replacements if you bring your burned-out bulb to your community center.
See the Energy Star website for other information. http://www.energystar.gov/ References http://www.eia.gov/cneaf/electricity/st_profiles/hawaii.html Table 4. Electric Power Industry Capability by Primary Energy Source, 1990 Through 2008. http://www.eia.doe.gov/cneaf/electricity/epm/table1_1.html Net generation by energy source. http://energy.hawaii.gov/wp-content/uploads/2011/10/erc09.pdf http://www.hawaii.gov/dbedt/info/energy/publications/briefing050120.ppt http://aceee.org/consumer/dishwashing
34
APPENDIX B Infrared Observations
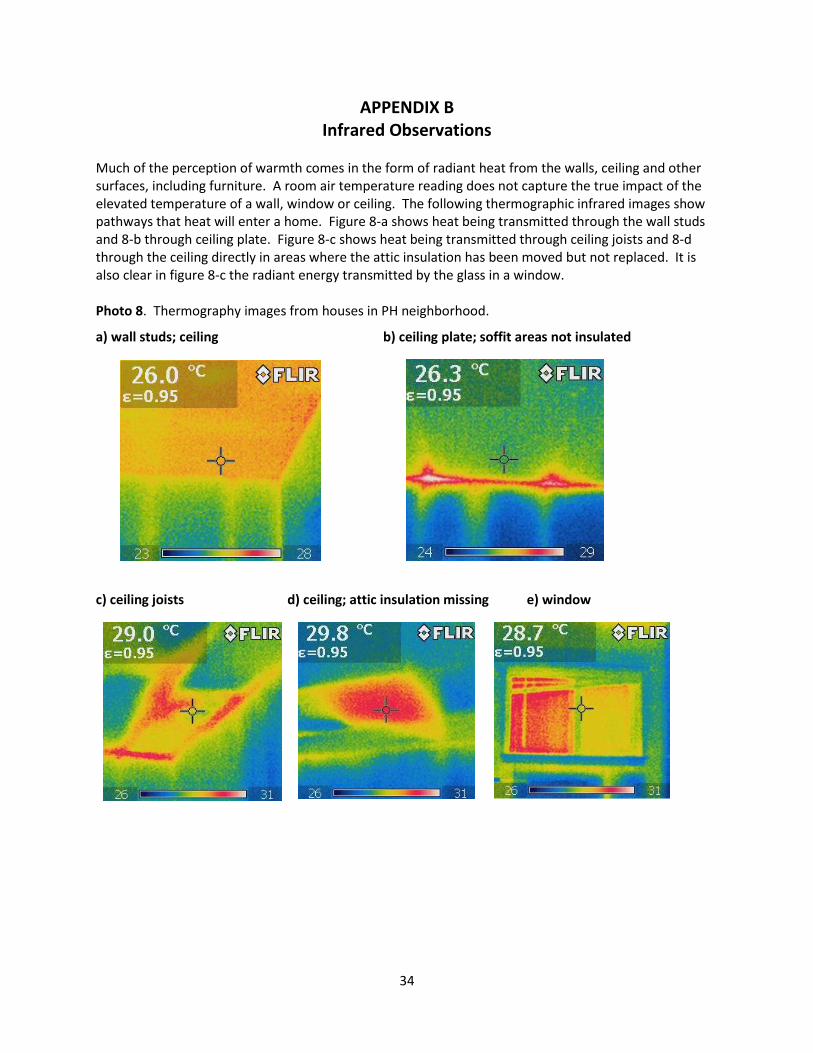
Much of the perception of warmth comes in the form of radiant heat from the walls, ceiling and other surfaces, including furniture. A room air temperature reading does not capture the true impact of the elevated temperature of a wall, window or ceiling. The following thermographic infrared images show pathways that heat will enter a home. Figure 8-a shows heat being transmitted through the wall studs and 8-b through ceiling plate. Figure 8-c shows heat being transmitted through ceiling joists and 8-d through the ceiling directly in areas where the attic insulation has been moved but not replaced. It is also clear in figure 8-c the radiant energy transmitted by the glass in a window. Photo 8. Thermography images from houses in PH neighborhood.
a) wall studs; ceiling b) ceiling plate; soffit areas not insulated
c) ceiling joists d) ceiling; attic insulation missing e) window
35
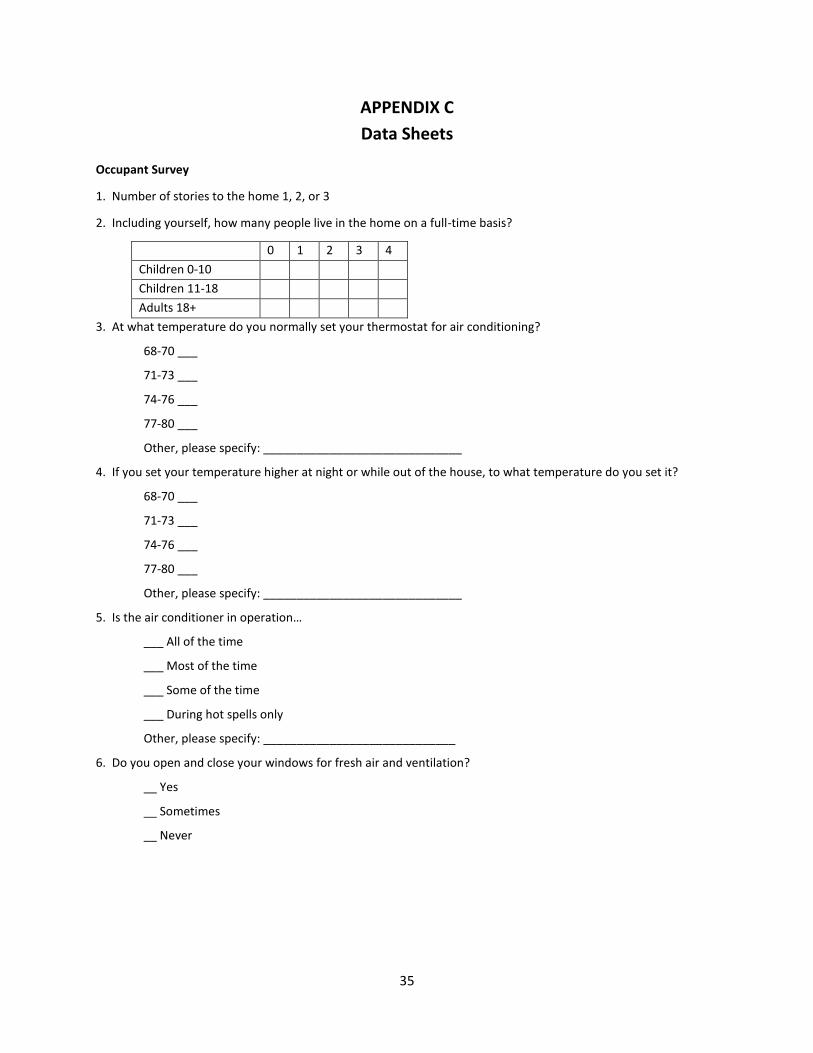
APPENDIX C
Data Sheets
Occupant Survey
1. Number of stories to the home 1, 2, or 3
2. Including yourself, how many people live in the home on a full-time basis?
0 1 2 3 4
Children 0-10
Children 11-18
Adults 18+
3. At what temperature do you normally set your thermostat for air conditioning?
68-70 ___
71-73 ___
74-76 ___
77-80 ___
Other, please specify: ______________________________
4. If you set your temperature higher at night or while out of the house, to what temperature do you set it?
68-70 ___
71-73 ___
74-76 ___
77-80 ___
Other, please specify: ______________________________
5. Is the air conditioner in operation…
___ All of the time
___ Most of the time
___ Some of the time
___ During hot spells only
Other, please specify: _____________________________
6. Do you open and close your windows for fresh air and ventilation?
__ Yes
__ Sometimes
__ Never
36
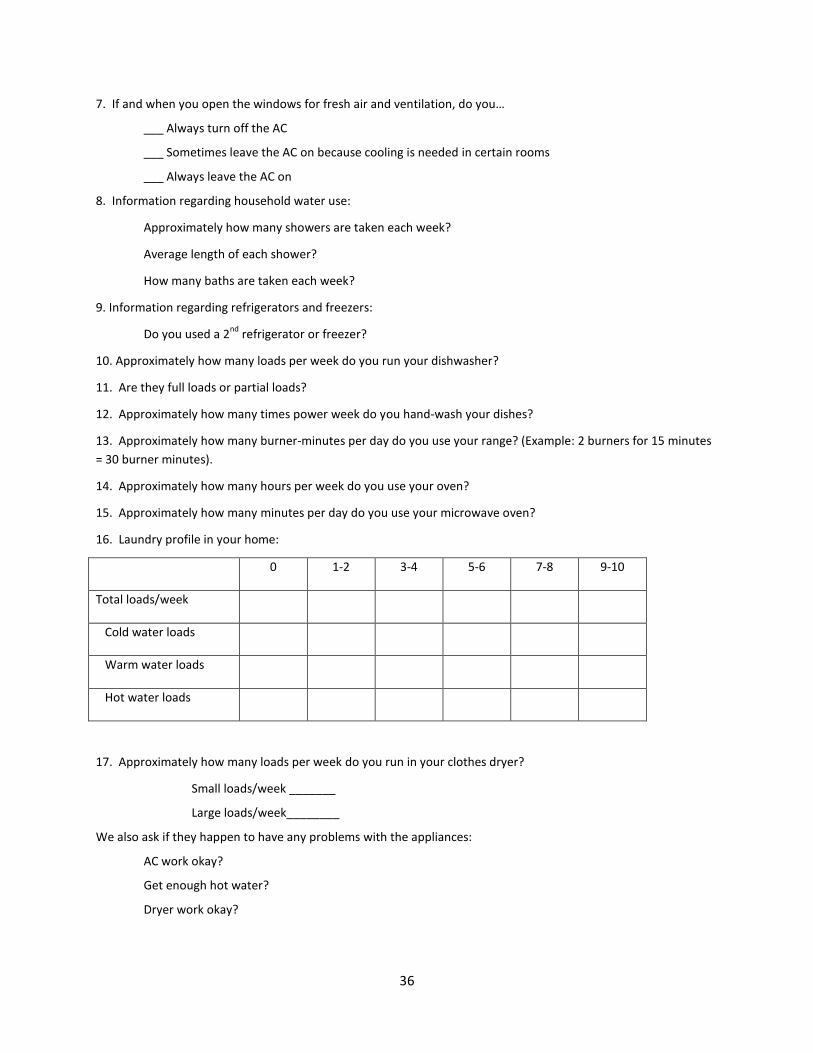
7. If and when you open the windows for fresh air and ventilation, do you…
___ Always turn off the AC
___ Sometimes leave the AC on because cooling is needed in certain rooms
___ Always leave the AC on
8. Information regarding household water use:
Approximately how many showers are taken each week?
Average length of each shower?
How many baths are taken each week?
9. Information regarding refrigerators and freezers:
Do you used a 2nd
refrigerator or freezer?
10. Approximately how many loads per week do you run your dishwasher?
11. Are they full loads or partial loads?
12. Approximately how many times power week do you hand-wash your dishes?
13. Approximately how many burner-minutes per day do you use your range? (Example: 2 burners for 15 minutes
= 30 burner minutes).
14. Approximately how many hours per week do you use your oven?
15. Approximately how many minutes per day do you use your microwave oven?
16. Laundry profile in your home:
0 1-2 3-4 5-6 7-8 9-10
Total loads/week
Cold water loads
Warm water loads
Hot water loads
17. Approximately how many loads per week do you run in your clothes dryer?
Small loads/week _______
Large loads/week________
We also ask if they happen to have any problems with the appliances:
AC work okay?
Get enough hot water?
Dryer work okay?
37
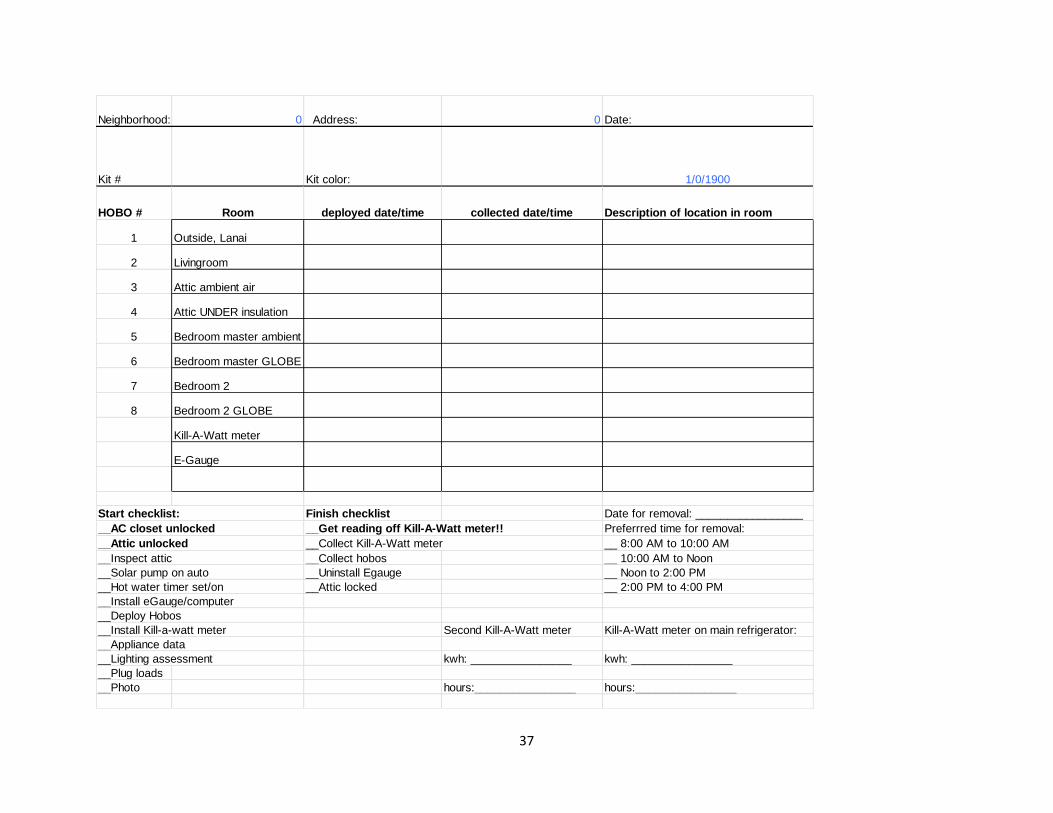
Neighborhood: Date:0 Address: 0 Date:
Kit # Kit color: 1/0/1900
HOBO # Room deployed date/time collected date/time Description of location in room
1 Outside, Lanai
2 Livingroom
3 Attic ambient air
4 Attic UNDER insulation
5 Bedroom master ambient
6 Bedroom master GLOBE
7 Bedroom 2
8 Bedroom 2 GLOBE
Kill-A-Watt meter
E-Gauge
Start checklist: Finish checklist Date for removal: _________________
__AC closet unlocked __Get reading off Kill-A-Watt meter!! Preferrred time for removal:
__Attic unlocked __Collect Kill-A-Watt meter __ 8:00 AM to 10:00 AM
__Inspect attic __Collect hobos __ 10:00 AM to Noon
__Solar pump on auto __Uninstall Egauge __ Noon to 2:00 PM
__Hot water timer set/on __Attic locked __ 2:00 PM to 4:00 PM
__Install eGauge/computer
__Deploy Hobos
__Install Kill-a-watt meter Second Kill-A-Watt meter Kill-A-Watt meter on main refrigerator:
__Appliance data
__Lighting assessment kwh: ________________ kwh: ________________
__Plug loads
__Photo hours:________________ hours:________________
38
39
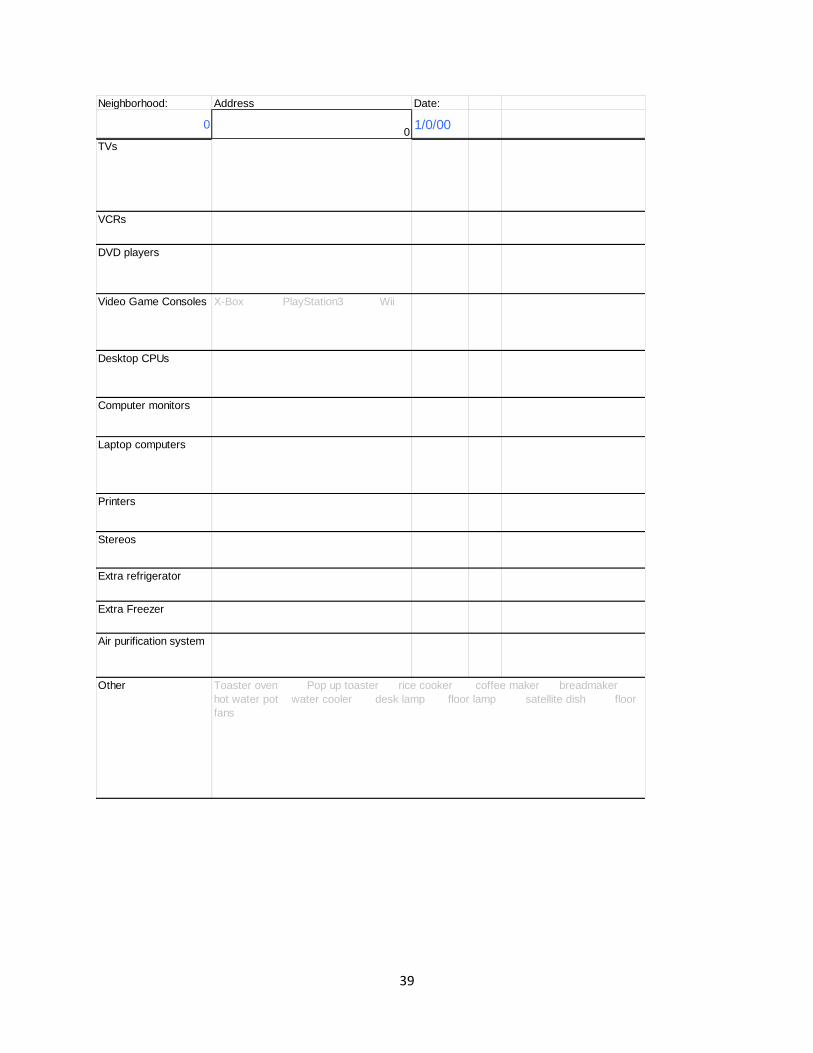
Neighborhood: Address Date:
00
1/0/00
TVs
VCRs
DVD players
Video Game Consoles X-Box PlayStation3 Wii
Desktop CPUs
Computer monitors
Laptop computers
Printers
Stereos
Extra refrigerator
Extra Freezer
Air purification system
Other Toaster oven Pop up toaster rice cooker coffee maker breadmaker
hot water pot water cooler desk lamp floor lamp satellite dish floor
fans
40
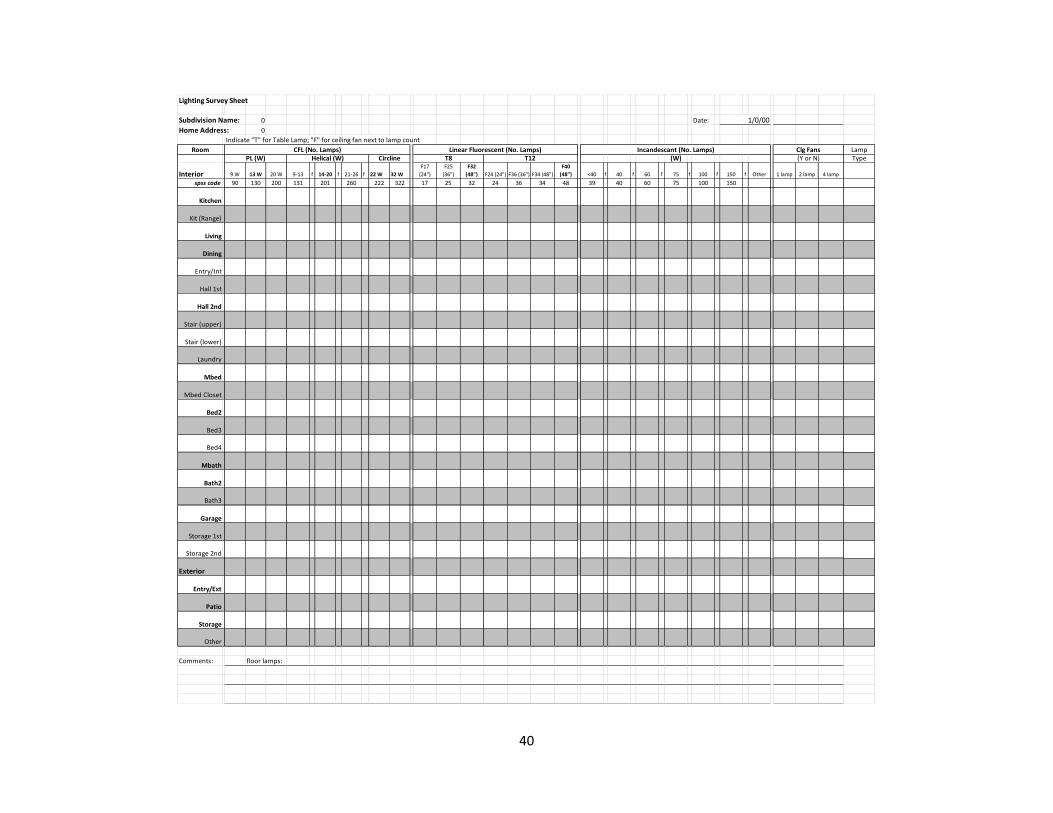
Lighting Survey Sheet
Subdivision Name: 0 Date:
Home Address: 0
Indicate "T" for Table Lamp; "F" for ceiling fan next to lamp count
Room Lamp(W) Type
Interior 9 W 13 W 20 W 9-13 f 14-20 f 21-26 f 22 W 32 W
F17
(24")
F25
(36")
F32
(48") F24 (24") F36 (36") F34 (48")
F40
(48") <40 f 40 f 60 f 75 f 100 f 150 f Other 1 lamp 2 lamp 4 lamp
spss code 90 130 200 131 201 260 222 322 17 25 32 24 36 34 48 39 40 60 75 100 150
Kitchen
Kit (Range)
Living
Dining
Entry/Int
Hall 1st
Hall 2nd
Stair (upper)
Stair (lower)
Laundry
Mbed
Mbed Closet
Bed2
Bed3
Bed4
Mbath
Bath2
Bath3
Garage
Storage 1st
Storage 2nd
Exterior
Entry/Ext
Patio
Storage
Other
Comments: floor lamps:
PL (W) Helical (W) Circline T8CFL (No. Lamps) Linear Fluorescent (No. Lamps) Incandescant (No. Lamps) Clg Fans
1/0/00
T12 (Y or N)
41
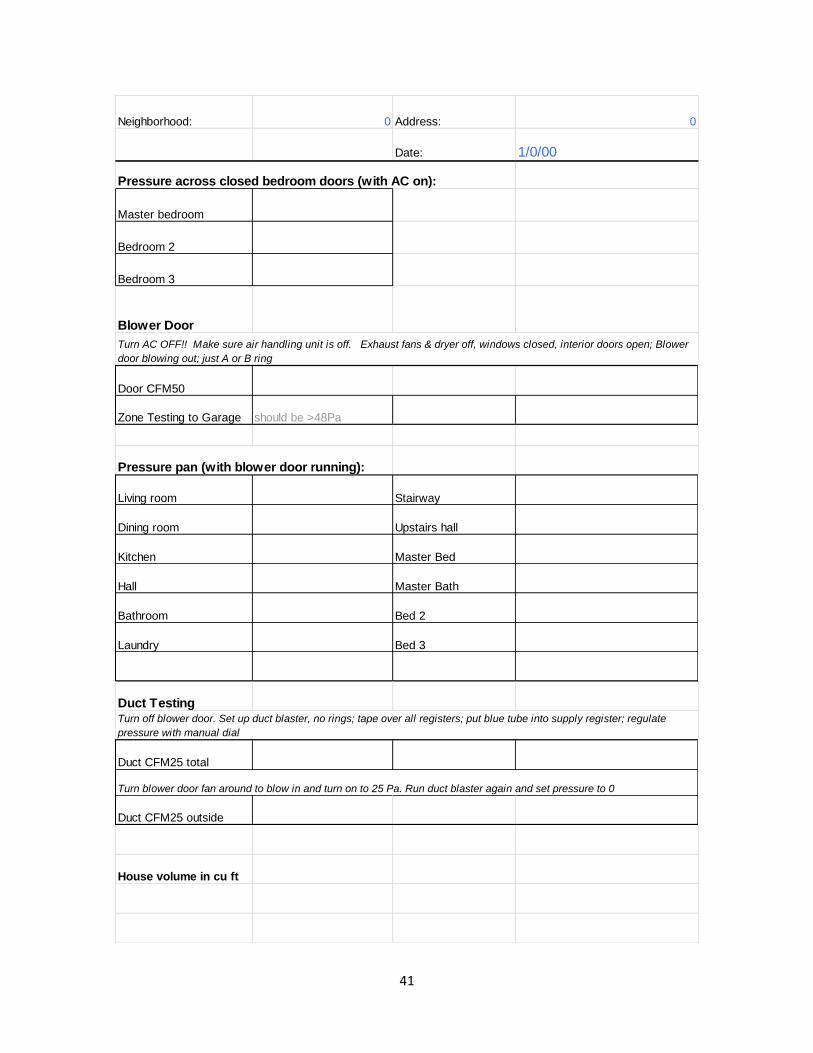
Neighborhood: Date:0 Address: 0
Date: 1/0/00
Pressure across closed bedroom doors (with AC on):
Master bedroom
Bedroom 2
Bedroom 3
Blower Door
Door CFM50
Zone Testing to Garage should be >48Pa
Pressure pan (with blower door running):
Living room Stairway
Dining room Upstairs hall
Kitchen Master Bed
Hall Master Bath
Bathroom Bed 2
Laundry Bed 3
Duct Testing
Duct CFM25 total
Duct CFM25 outside
House volume in cu ft
Turn off blower door. Set up duct blaster, no rings; tape over all registers; put blue tube into supply register; regulate
pressure with manual dial
Turn AC OFF!! Make sure air handling unit is off. Exhaust fans & dryer off, windows closed, interior doors open; Blower
door blowing out; just A or B ring
Turn blower door fan around to blow in and turn on to 25 Pa. Run duct blaster again and set pressure to 0
42
APPENDIX D
43