Embed Size (px)
Citation preview
International Journal of Civil & Environmental Engineering IJCEE-IJENS Vol: 14 No: 06 5
144906-7676-IJCEE-IJENS © December 2014 IJENS
I J E N S
Energy Conservation between Natural Ventilated and
Air-conditioned Classroom in Taiwan Meng-Chieh Lee
1*, Ling-Tim Wong
2, Kwok-Wai Mui
2, Wai-Hou Lam
1, Chia-Feng Chang
1
1 Department of Interior Design, National Taichung University of Science and Technology
2 Department of Building Service, The Hong Kong Polytechnic University
* Corresponding e-mail: [email protected]
The energy consumption of natural ventilated classrooms (NVs)
is less than air-conditioned classrooms (ACs) in hot and humid
Taiwan. Energy conservation is related with the thermal comfort
of occupants in these classrooms. This study proposed an
electronic questionnaire and instruments to facilitate the
continuous monitoring of the physical parameters to investigate
the satisfied level of thermal comfort of students in classrooms.
The investigated results show the average clothing value (clo)
around 0.7. During the hot days (clo<0.7), students’ acceptable
range of temperature range in NVs was between 26.2℃–28.2℃
(neutral temperature=27.3℃, neutral humidity=59.9%) and
24.2℃–27.7℃ (neutral temperature =26.3℃, neutral
humidity=57.2%) in ACs. During the cold days (clo≧0.7),
students’ acceptable range of temperature in NVs was between
20.9℃–25.1℃ (neutral temperature = 23.0℃, neutral
humidity=55.3%) and 22.0℃–25.4℃ (neutral
temperature=23.7℃, neutral humidity=55.6%) in ACs. The
maximum acceptable thermal temperature of students in NVs is
1℃ higher than that in ACs and 2℃ higher than the ASHRAE
Standard 55. The result implies that turn on the ceiling fans in
NVs can be saved 5.0kWh (95%) energy between NVs and ACs
under the occupants’ acceptable temperature range to achieve
the balance between the energy saving and comfortable
environment.
Index Term-- Thermal comfort; Clothing value; Energy
conservation; Natural ventilated classrooms; Air-conditioned
classrooms
NOMENCLATURE
A floor area (m2)
C constant (-)
E energy consumption (kW/h)
EE efficiency of energy saving (%)
EER energy efficiency ratio of split type air-conditioner
(-)
K constant of air-conditioner energy consumption
(kW/h)
N number of samples
T mean temperature(℃)
opT~
operative temperature in each data(℃)
V wind velocity (m/s)
Greek
φ percentile of two occupant groups Gi at the
perceived operative temperature
σ standard deviation
μ mean value
θ occupant‟s sensation (<0 represents “feeling cold”,
>0 represents “feeling hot”)
Subscript
a air temperature
c air-conditioners
n ceiling fans in natural ventilation room
op operative temperature
r radiant temperature
t total
International Journal of Civil & Environmental Engineering IJCEE-IJENS Vol: 14 No: 06 6
144906-7676-IJCEE-IJENS © December 2014 IJENS
I J E N S
1. INTRODUCTION
In order to resist the hot and humid climate, air-conditioner
becomes an essential equipment to maintain a fine learning
environment in Taiwan college classrooms. However,
air-conditioning consumes the most energy in classrooms (the
second is the lighting equipment and fans consume the least)
[1]. For energy saving, schools in Taiwan follow the
recommendation of air-conditioner setting at 26℃-28℃. As
the temperature setting directly influences the thermal comfort
of occupants, the balance between the energy saving and the
comfortable thermal environment is analyzed in this study.
Many scholars around the world have studied thermal comfort
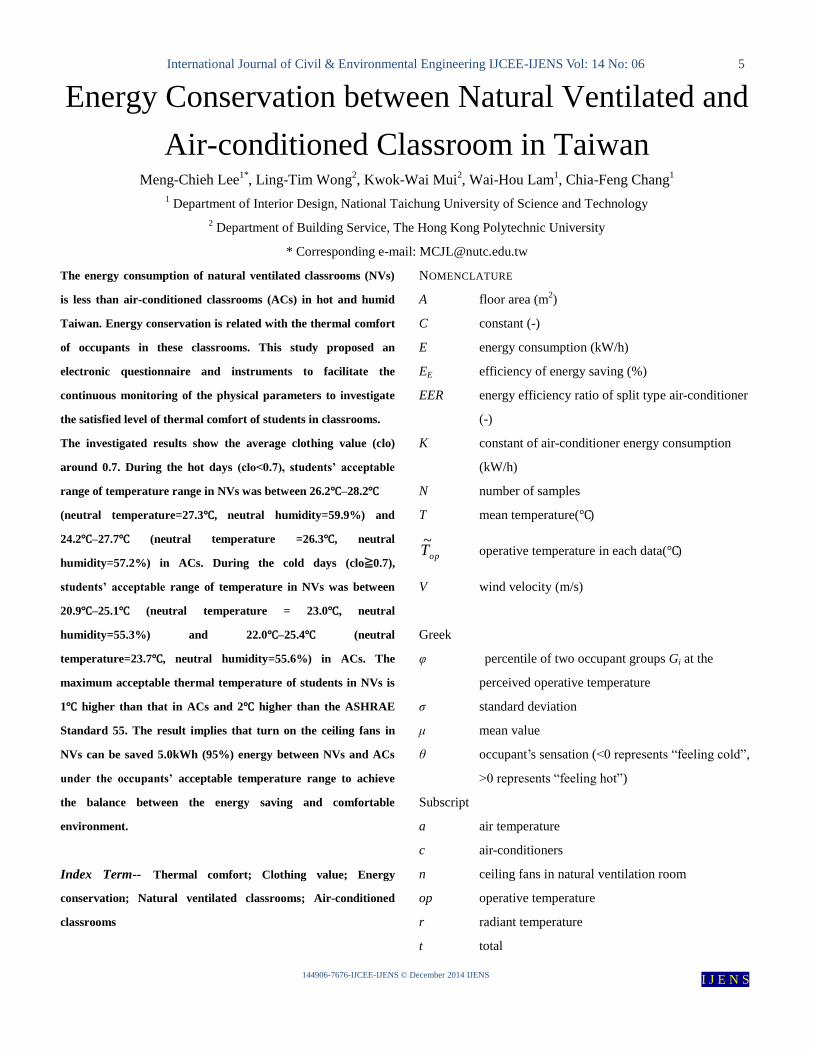
assessment methods and standards. Fanger proposed a
PMV-PPD model to assess the satisfaction of thermal
environment, as shown in Fig. 1[2]
. ASHRAE Standard 55
proposed the summer thermal comfort standard of 23℃-26℃,
while the clothing value is 0.5 and relative humidity is 60% [3]
.
However, people in Taiwan used to the hot and humid climate.
As metabolic rate is influenced by the different living habit,
ASHRAE Standard 55 may not suit a subtropical region. Chen
[4] found that students in Taiwan can accept a higher
temperature environment in a classroom and only a few
students requested for a lower temperature. Kwok [5]
found
that 75% acceptable temperatures of students in Hawaii do not
conform the ASHRAE Standard 55. These researches prove
that thermal comfort is also deeply influenced by the different
environment and living habit [6]
.
Thermal comfort is basically influenced by the four physical
parameters (air temperature, radiant temperature, relative
humidity and air speed) and two personal parameters [7]
(metabolic rate and clothing values). Occupants‟ thermal
comfort is an important parameter to the temperature setting
of air-conditioners [8]
. Students in classroom are in sedentary
activity and the metabolic rate of each student is almost the
same. In condition of irreversibility of the indoor physical
environment, students usually adjust their clothing values or
switch on the air-conditioners or fans in order to satisfy their
thermal comfort. Ceiling fan is always installed in natural
ventilation classroom because of the low energy consumption.
This study discusses the suitable range of thermal comfort in
natural ventilated classrooms (NVs) and air-conditioned
classrooms (ACs) in Taiwan via the different clothing value of
occupants and proposes the optimum energy saving efficiency.
Fig. 1. PMV /PPD relationship
International Journal of Civil & Environmental Engineering IJCEE-IJENS Vol: 14 No: 06 7
144906-7676-IJCEE-IJENS © December 2014 IJENS
I J E N S
2. METHODOLOGY
Thermal comfort measuring instrument
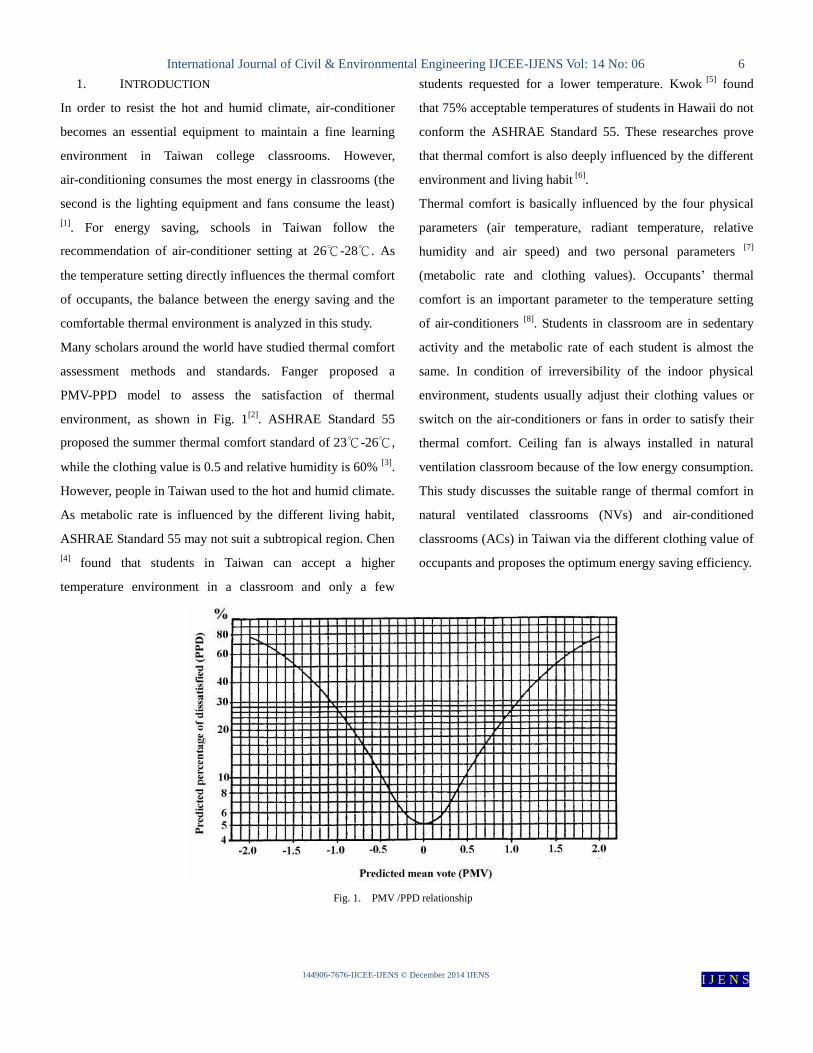
Field surveys were always restricted by the scale of
instruments. This study adopts the IEQ survey instruments,
which consist of a portable IEQ system and a touch tablet PC
for asking the IEQ sensation vote, as shown in Fig. 2 and
Table I. These instruments can automatically measure and
record physical parameters in classrooms. The dimension is
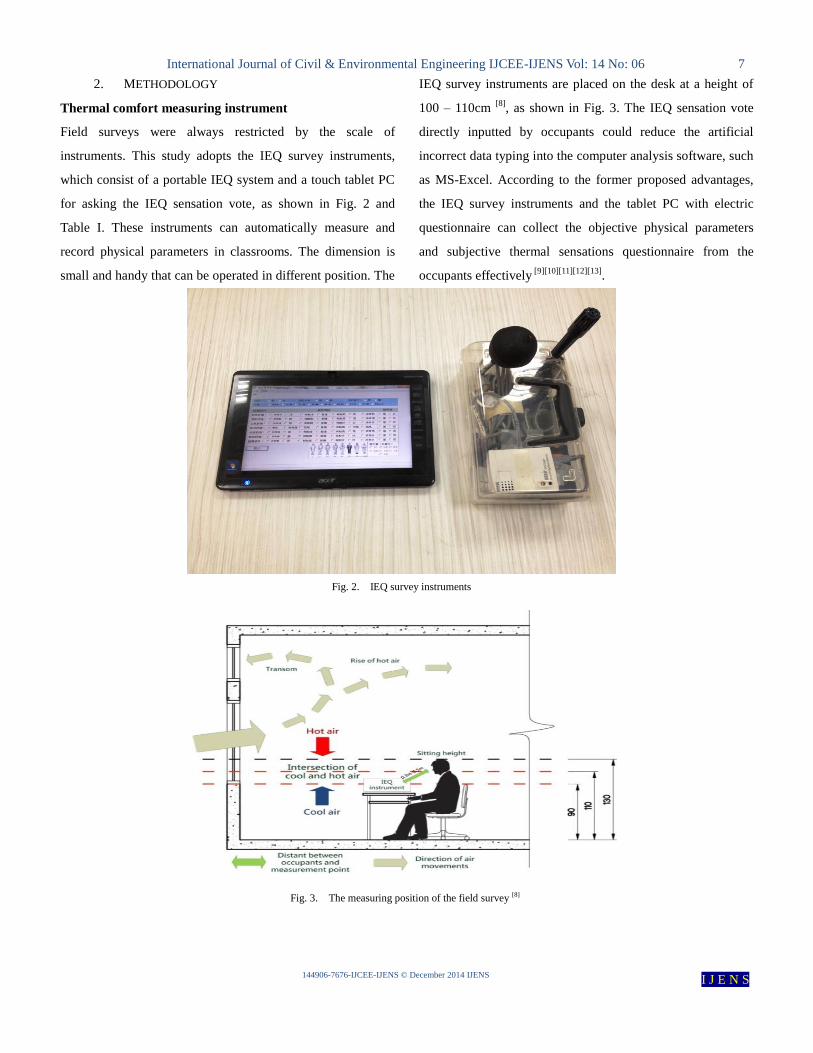
small and handy that can be operated in different position. The
IEQ survey instruments are placed on the desk at a height of
100 – 110cm [8]
, as shown in Fig. 3. The IEQ sensation vote
directly inputted by occupants could reduce the artificial
incorrect data typing into the computer analysis software, such
as MS-Excel. According to the former proposed advantages,
the IEQ survey instruments and the tablet PC with electric
questionnaire can collect the objective physical parameters
and subjective thermal sensations questionnaire from the
occupants effectively [9][10][11][12][13]
.
Fig. 2. IEQ survey instruments
Fig. 3. The measuring position of the field survey [8]
International Journal of Civil & Environmental Engineering IJCEE-IJENS Vol: 14 No: 06 8
144906-7676-IJCEE-IJENS © December 2014 IJENS
I J E N S
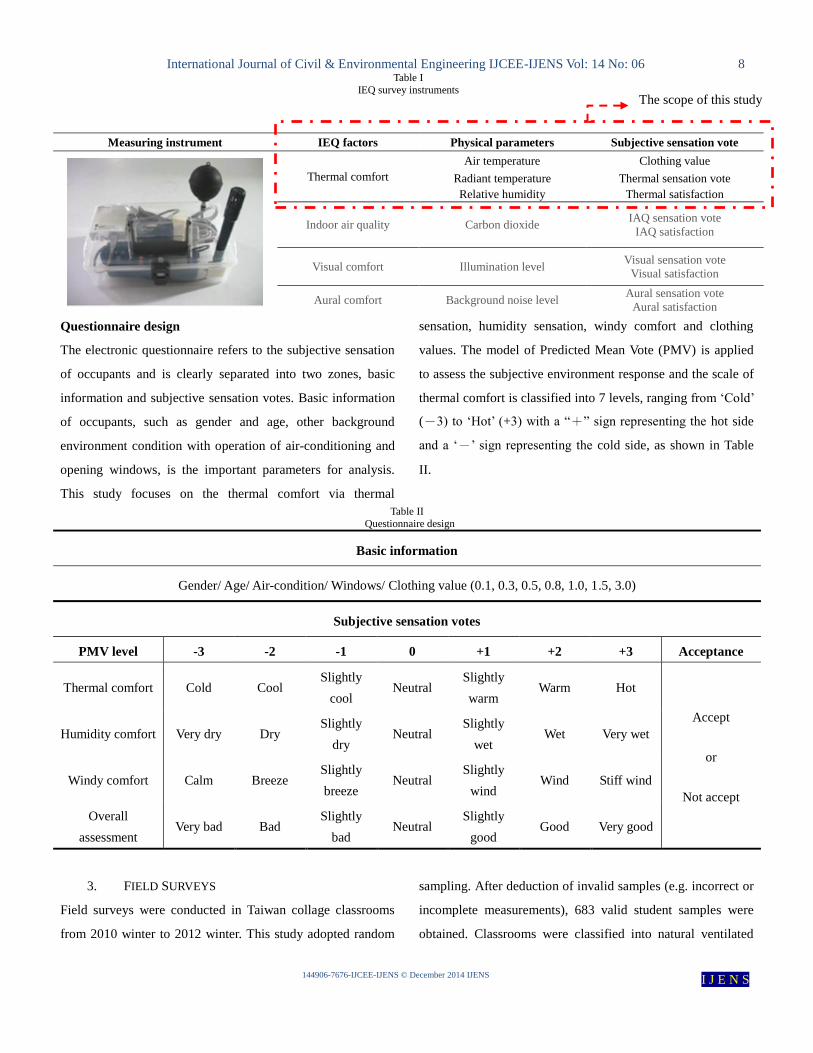
Table I
IEQ survey instruments
Measuring instrument IEQ factors Physical parameters Subjective sensation vote
Thermal comfort
Air temperature Clothing value
Radiant temperature Thermal sensation vote
Relative humidity Thermal satisfaction
Indoor air quality Carbon dioxide IAQ sensation vote
IAQ satisfaction
Visual comfort Illumination level Visual sensation vote
Visual satisfaction
Aural comfort Background noise level Aural sensation vote
Aural satisfaction
Questionnaire design
The electronic questionnaire refers to the subjective sensation
of occupants and is clearly separated into two zones, basic
information and subjective sensation votes. Basic information
of occupants, such as gender and age, other background
environment condition with operation of air-conditioning and
opening windows, is the important parameters for analysis.
This study focuses on the thermal comfort via thermal
sensation, humidity sensation, windy comfort and clothing
values. The model of Predicted Mean Vote (PMV) is applied
to assess the subjective environment response and the scale of
thermal comfort is classified into 7 levels, ranging from „Cold‟
(-3) to „Hot‟ (+3) with a “+” sign representing the hot side
and a „-‟ sign representing the cold side, as shown in Table
II.
Table II
Questionnaire design
Basic information
Gender/ Age/ Air-condition/ Windows/ Clothing value (0.1, 0.3, 0.5, 0.8, 1.0, 1.5, 3.0)
Subjective sensation votes
PMV level -3 -2 -1 0 +1 +2 +3 Acceptance
Thermal comfort Cold Cool Slightly
cool Neutral
Slightly
warm Warm Hot
Accept
or
Not accept
Humidity comfort Very dry Dry Slightly
dry Neutral
Slightly
wet Wet Very wet
Windy comfort Calm Breeze Slightly
breeze Neutral
Slightly
wind Wind Stiff wind
Overall
assessment Very bad Bad
Slightly
bad Neutral
Slightly
good Good Very good
3. FIELD SURVEYS
Field surveys were conducted in Taiwan collage classrooms
from 2010 winter to 2012 winter. This study adopted random
sampling. After deduction of invalid samples (e.g. incorrect or
incomplete measurements), 683 valid student samples were
obtained. Classrooms were classified into natural ventilated
The scope of this study
International Journal of Civil & Environmental Engineering IJCEE-IJENS Vol: 14 No: 06 9
144906-7676-IJCEE-IJENS © December 2014 IJENS
I J E N S
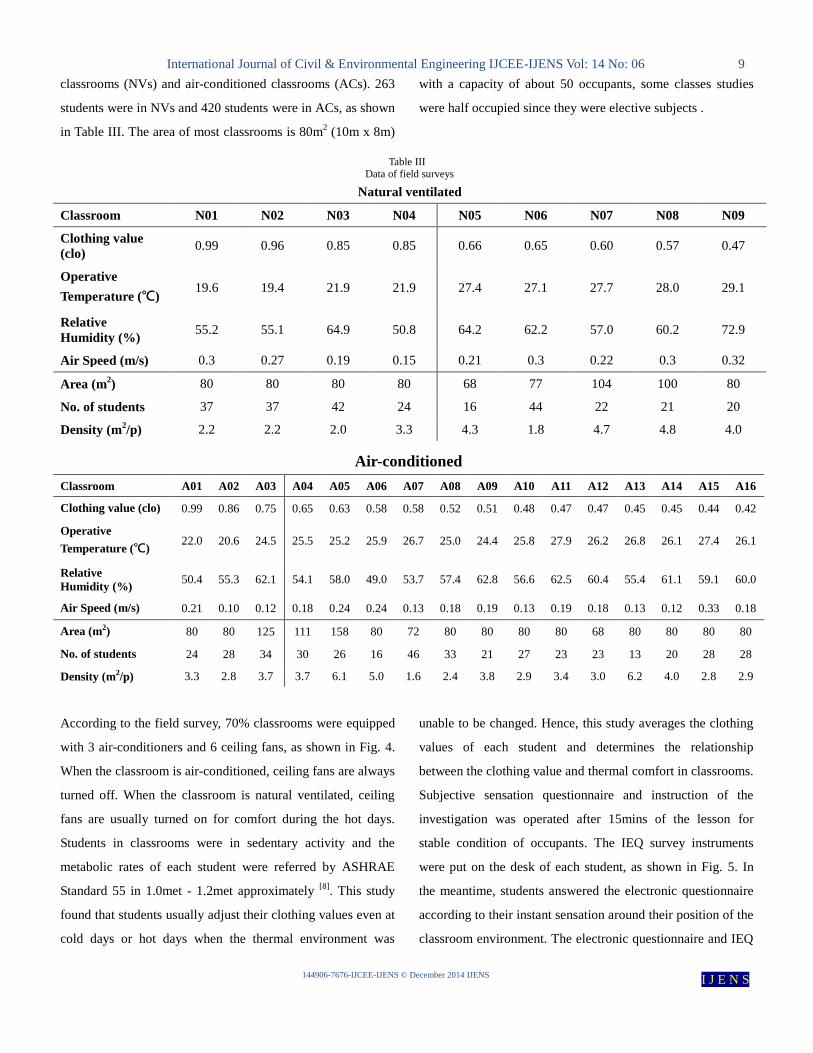
classrooms (NVs) and air-conditioned classrooms (ACs). 263
students were in NVs and 420 students were in ACs, as shown
in Table III. The area of most classrooms is 80m2 (10m x 8m)
with a capacity of about 50 occupants, some classes studies
were half occupied since they were elective subjects .
Table III Data of field surveys
Natural ventilated
Classroom N01 N02 N03 N04 N05 N06 N07 N08 N09
Clothing value
(clo) 0.99 0.96 0.85 0.85 0.66 0.65 0.60 0.57 0.47
Operative
Temperature (℃) 19.6 19.4 21.9 21.9 27.4 27.1 27.7 28.0 29.1
Relative
Humidity (%) 55.2 55.1 64.9 50.8 64.2 62.2 57.0 60.2 72.9
Air Speed (m/s) 0.3 0.27 0.19 0.15 0.21 0.3 0.22 0.3 0.32
Area (m2) 80 80 80 80 68 77 104 100 80
No. of students 37 37 42 24 16 44 22 21 20
Density (m2/p) 2.2 2.2 2.0 3.3 4.3 1.8 4.7 4.8 4.0
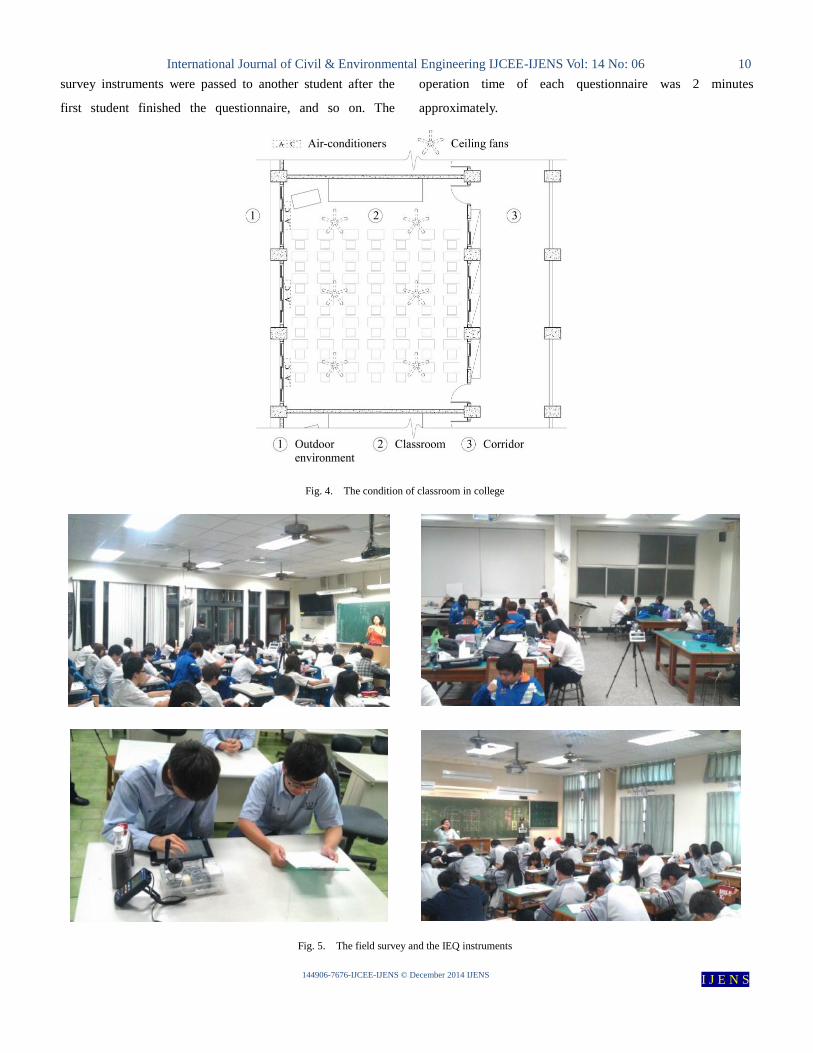
According to the field survey, 70% classrooms were equipped
with 3 air-conditioners and 6 ceiling fans, as shown in Fig. 4.
When the classroom is air-conditioned, ceiling fans are always
turned off. When the classroom is natural ventilated, ceiling
fans are usually turned on for comfort during the hot days.
Students in classrooms were in sedentary activity and the
metabolic rates of each student were referred by ASHRAE
Standard 55 in 1.0met - 1.2met approximately [8]
. This study
found that students usually adjust their clothing values even at
cold days or hot days when the thermal environment was
unable to be changed. Hence, this study averages the clothing
values of each student and determines the relationship
between the clothing value and thermal comfort in classrooms.
Subjective sensation questionnaire and instruction of the
investigation was operated after 15mins of the lesson for
stable condition of occupants. The IEQ survey instruments
were put on the desk of each student, as shown in Fig. 5. In
the meantime, students answered the electronic questionnaire
according to their instant sensation around their position of the
classroom environment. The electronic questionnaire and IEQ
Air-conditioned
Classroom A01 A02 A03 A04 A05 A06 A07 A08 A09 A10 A11 A12 A13 A14 A15 A16
Clothing value (clo) 0.99 0.86 0.75 0.65 0.63 0.58 0.58 0.52 0.51 0.48 0.47 0.47 0.45 0.45 0.44 0.42
Operative
Temperature (℃) 22.0 20.6 24.5 25.5 25.2 25.9 26.7 25.0 24.4 25.8 27.9 26.2 26.8 26.1 27.4 26.1
Relative
Humidity (%) 50.4 55.3 62.1 54.1 58.0 49.0 53.7 57.4 62.8 56.6 62.5 60.4 55.4 61.1 59.1 60.0
Air Speed (m/s) 0.21 0.10 0.12 0.18 0.24 0.24 0.13 0.18 0.19 0.13 0.19 0.18 0.13 0.12 0.33 0.18
Area (m2) 80 80 125 111 158 80 72 80 80 80 80 68 80 80 80 80
No. of students 24 28 34 30 26 16 46 33 21 27 23 23 13 20 28 28
Density (m2/p) 3.3 2.8 3.7 3.7 6.1 5.0 1.6 2.4 3.8 2.9 3.4 3.0 6.2 4.0 2.8 2.9
International Journal of Civil & Environmental Engineering IJCEE-IJENS Vol: 14 No: 06 10
144906-7676-IJCEE-IJENS © December 2014 IJENS
I J E N S
survey instruments were passed to another student after the
first student finished the questionnaire, and so on. The
operation time of each questionnaire was 2 minutes
approximately.
Fig. 4. The condition of classroom in college
Fig. 5. The field survey and the IEQ instruments
International Journal of Civil & Environmental Engineering IJCEE-IJENS Vol: 14 No: 06 11
144906-7676-IJCEE-IJENS © December 2014 IJENS
I J E N S
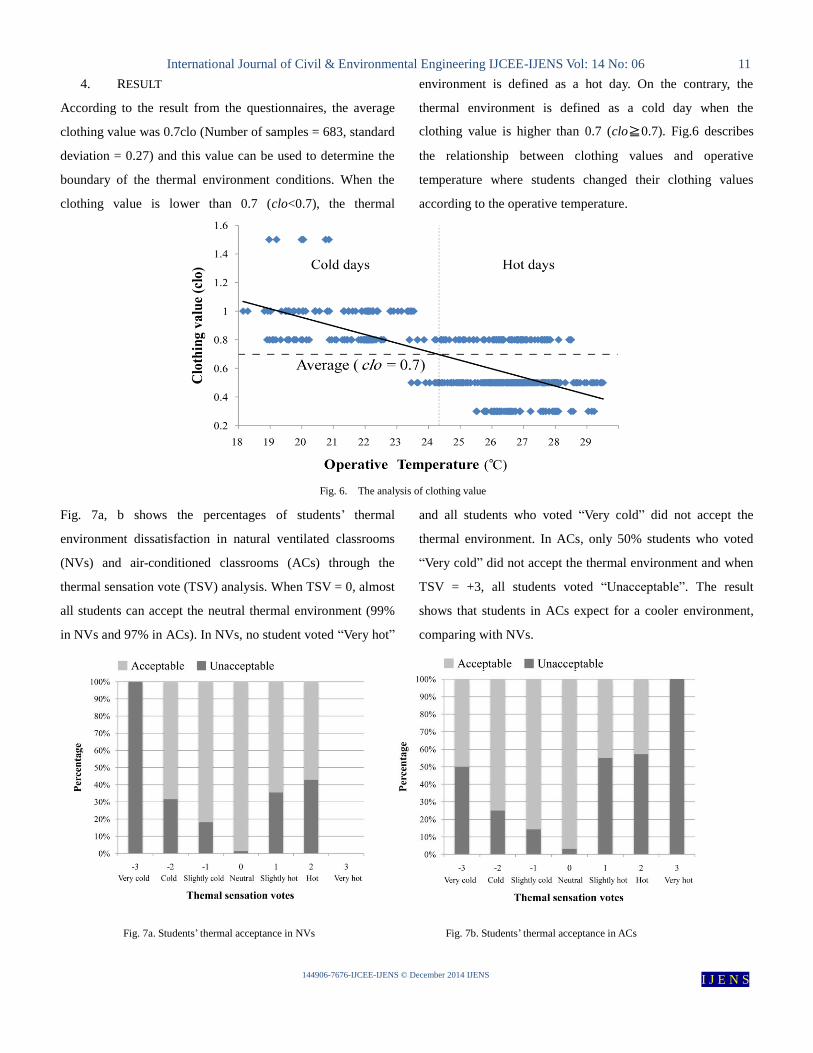
4. RESULT
According to the result from the questionnaires, the average
clothing value was 0.7clo (Number of samples = 683, standard
deviation = 0.27) and this value can be used to determine the
boundary of the thermal environment conditions. When the
clothing value is lower than 0.7 (clo<0.7), the thermal
environment is defined as a hot day. On the contrary, the
thermal environment is defined as a cold day when the
clothing value is higher than 0.7 (clo≧0.7). Fig.6 describes
the relationship between clothing values and operative
temperature where students changed their clothing values
according to the operative temperature.
Fig. 6. The analysis of clothing value
Fig. 7a, b shows the percentages of students‟ thermal
environment dissatisfaction in natural ventilated classrooms
(NVs) and air-conditioned classrooms (ACs) through the
thermal sensation vote (TSV) analysis. When TSV = 0, almost
all students can accept the neutral thermal environment (99%
in NVs and 97% in ACs). In NVs, no student voted “Very hot”
and all students who voted “Very cold” did not accept the
thermal environment. In ACs, only 50% students who voted
“Very cold” did not accept the thermal environment and when
TSV = +3, all students voted “Unacceptable”. The result
shows that students in ACs expect for a cooler environment,
comparing with NVs.
Fig. 7a. Students‟ thermal acceptance in NVs Fig. 7b. Students‟ thermal acceptance in ACs
International Journal of Civil & Environmental Engineering IJCEE-IJENS Vol: 14 No: 06 12
144906-7676-IJCEE-IJENS © December 2014 IJENS
I J E N S
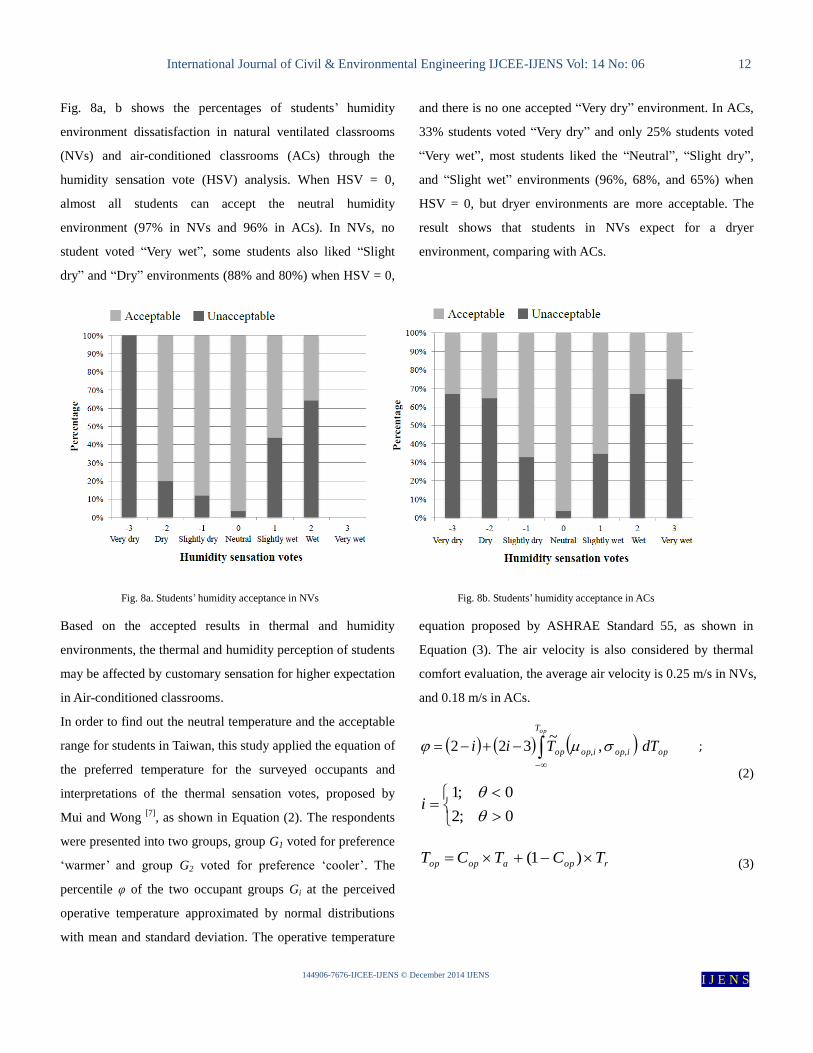
Fig. 8a, b shows the percentages of students‟ humidity
environment dissatisfaction in natural ventilated classrooms
(NVs) and air-conditioned classrooms (ACs) through the
humidity sensation vote (HSV) analysis. When HSV = 0,
almost all students can accept the neutral humidity
environment (97% in NVs and 96% in ACs). In NVs, no
student voted “Very wet”, some students also liked “Slight
dry” and “Dry” environments (88% and 80%) when HSV = 0,
and there is no one accepted “Very dry” environment. In ACs,
33% students voted “Very dry” and only 25% students voted
“Very wet”, most students liked the “Neutral”, “Slight dry”,
and “Slight wet” environments (96%, 68%, and 65%) when
HSV = 0, but dryer environments are more acceptable. The
result shows that students in NVs expect for a dryer
environment, comparing with ACs.
Fig. 8a. Students‟ humidity acceptance in NVs Fig. 8b. Students‟ humidity acceptance in ACs
Based on the accepted results in thermal and humidity
environments, the thermal and humidity perception of students
may be affected by customary sensation for higher expectation
in Air-conditioned classrooms.
In order to find out the neutral temperature and the acceptable
range for students in Taiwan, this study applied the equation of
the preferred temperature for the surveyed occupants and
interpretations of the thermal sensation votes, proposed by
Mui and Wong [7]
, as shown in Equation (2). The respondents
were presented into two groups, group G1 voted for preference
„warmer‟ and group G2 voted for preference „cooler‟. The
percentile φ of the two occupant groups Gi at the perceived
operative temperature approximated by normal distributions
with mean and standard deviation. The operative temperature
equation proposed by ASHRAE Standard 55, as shown in
Equation (3). The air velocity is also considered by thermal
comfort evaluation, the average air velocity is 0.25 m/s in NVs,
and 0.18 m/s in ACs.
opT
opiopiopop dTTii ,, ,~
322 ;
0;2
0;1
i
(2)
ropaopop TCTCT )1(
(3)
International Journal of Civil & Environmental Engineering IJCEE-IJENS Vol: 14 No: 06 13
144906-7676-IJCEE-IJENS © December 2014 IJENS
I J E N S
16.0;7.0
6.02.0;6.0
2.0;5.0
V
V
V
Cop
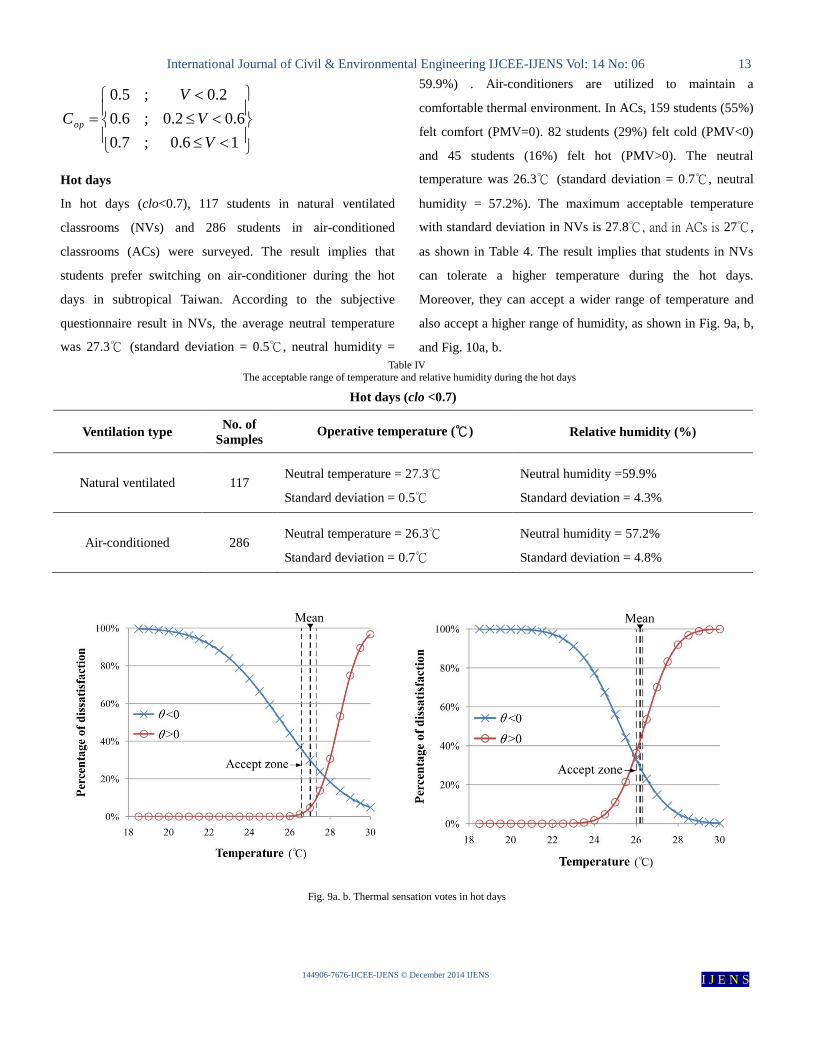
Hot days
In hot days (clo<0.7), 117 students in natural ventilated
classrooms (NVs) and 286 students in air-conditioned
classrooms (ACs) were surveyed. The result implies that
students prefer switching on air-conditioner during the hot
days in subtropical Taiwan. According to the subjective
questionnaire result in NVs, the average neutral temperature
was 27.3℃ (standard deviation = 0.5℃, neutral humidity =
59.9%) . Air-conditioners are utilized to maintain a
comfortable thermal environment. In ACs, 159 students (55%)
felt comfort (PMV=0). 82 students (29%) felt cold (PMV<0)
and 45 students (16%) felt hot (PMV>0). The neutral
temperature was 26.3℃ (standard deviation = 0.7℃, neutral
humidity = 57.2%). The maximum acceptable temperature
with standard deviation in NVs is 27.8℃, and in ACs is 27℃,
as shown in Table 4. The result implies that students in NVs
can tolerate a higher temperature during the hot days.
Moreover, they can accept a wider range of temperature and
also accept a higher range of humidity, as shown in Fig. 9a, b,
and Fig. 10a, b.
Table IV
The acceptable range of temperature and relative humidity during the hot days
Hot days (clo <0.7)
Ventilation type No. of
Samples Operative temperature (℃) Relative humidity (%)
Natural ventilated 117 Neutral temperature = 27.3℃
Standard deviation = 0.5℃
Neutral humidity =59.9%
Standard deviation = 4.3%
Air-conditioned 286 Neutral temperature = 26.3℃
Standard deviation = 0.7℃
Neutral humidity = 57.2%
Standard deviation = 4.8%
Fig. 9a. b. Thermal sensation votes in hot days
International Journal of Civil & Environmental Engineering IJCEE-IJENS Vol: 14 No: 06 14
144906-7676-IJCEE-IJENS © December 2014 IJENS
I J E N S
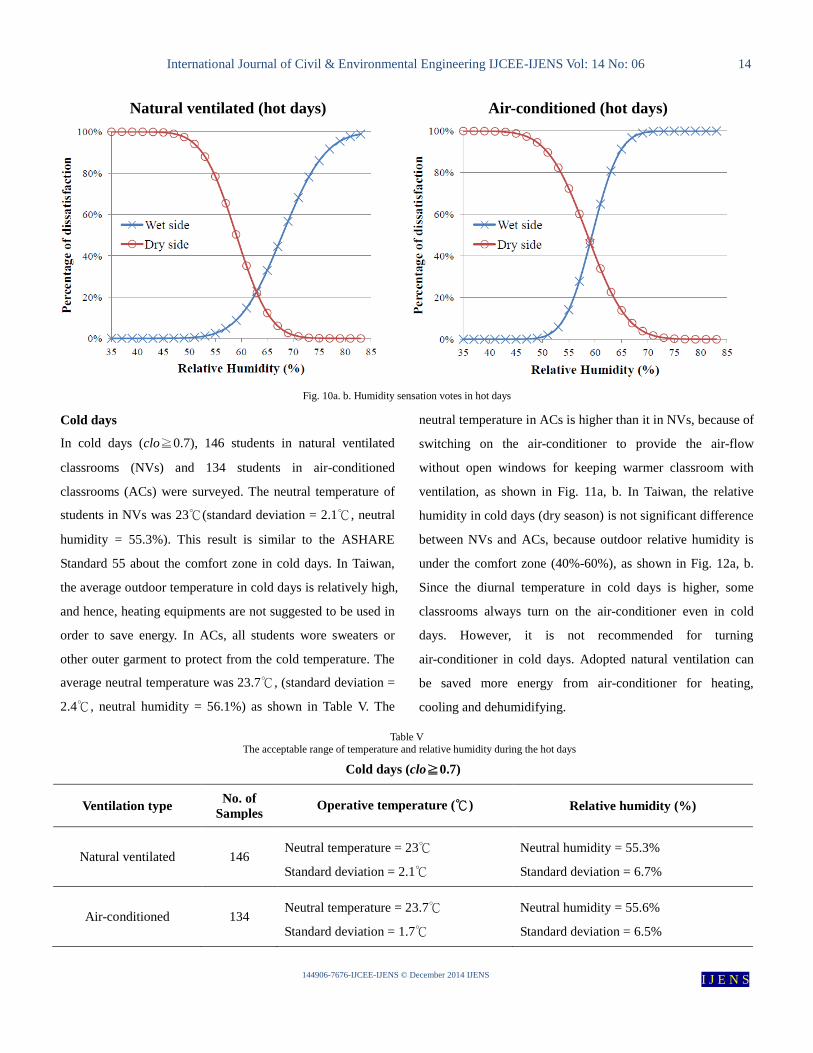
Natural ventilated (hot days) Air-conditioned (hot days)
Fig. 10a. b. Humidity sensation votes in hot days
Cold days
In cold days (clo≧0.7), 146 students in natural ventilated
classrooms (NVs) and 134 students in air-conditioned
classrooms (ACs) were surveyed. The neutral temperature of
students in NVs was 23℃(standard deviation = 2.1℃, neutral
humidity = 55.3%). This result is similar to the ASHARE
Standard 55 about the comfort zone in cold days. In Taiwan,
the average outdoor temperature in cold days is relatively high,
and hence, heating equipments are not suggested to be used in
order to save energy. In ACs, all students wore sweaters or
other outer garment to protect from the cold temperature. The
average neutral temperature was 23.7℃, (standard deviation =
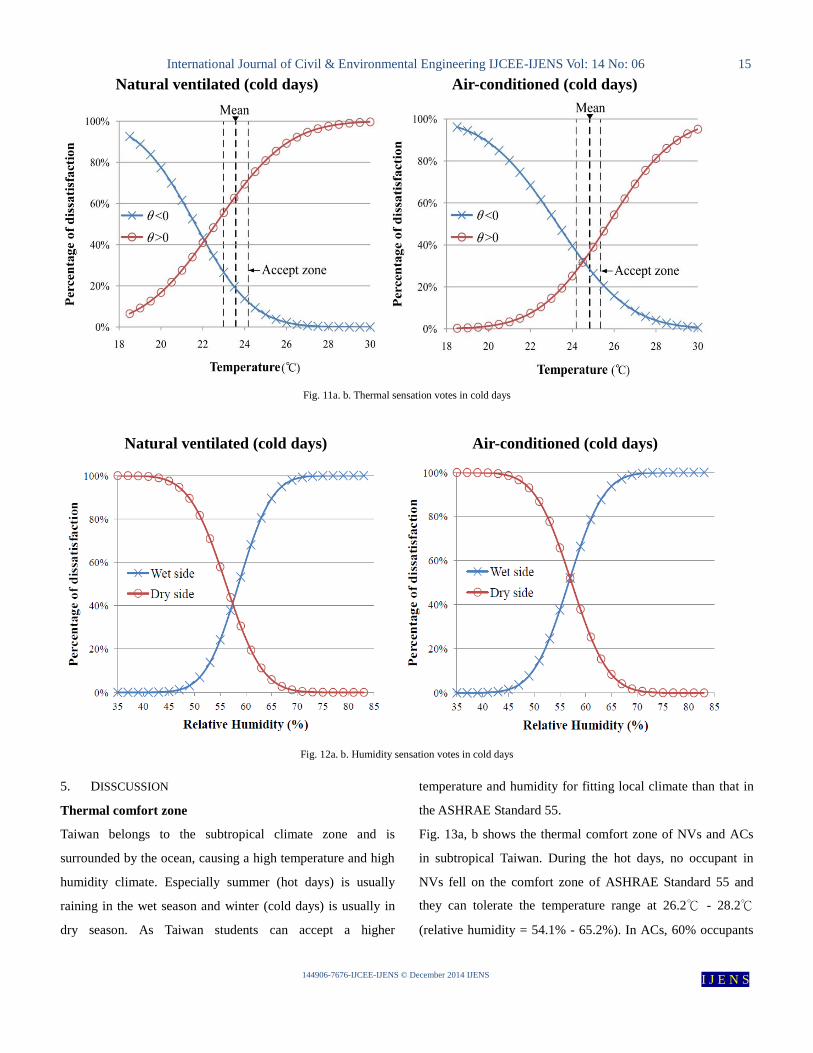
2.4℃, neutral humidity = 56.1%) as shown in Table V. The
neutral temperature in ACs is higher than it in NVs, because of
switching on the air-conditioner to provide the air-flow
without open windows for keeping warmer classroom with
ventilation, as shown in Fig. 11a, b. In Taiwan, the relative
humidity in cold days (dry season) is not significant difference
between NVs and ACs, because outdoor relative humidity is
under the comfort zone (40%-60%), as shown in Fig. 12a, b.
Since the diurnal temperature in cold days is higher, some
classrooms always turn on the air-conditioner even in cold
days. However, it is not recommended for turning
air-conditioner in cold days. Adopted natural ventilation can
be saved more energy from air-conditioner for heating,
cooling and dehumidifying.
Table V
The acceptable range of temperature and relative humidity during the hot days
Cold days (clo≧0.7)
Ventilation type No. of
Samples Operative temperature (℃) Relative humidity (%)
Natural ventilated 146 Neutral temperature = 23℃
Standard deviation = 2.1℃
Neutral humidity = 55.3%
Standard deviation = 6.7%
Air-conditioned 134 Neutral temperature = 23.7℃
Standard deviation = 1.7℃
Neutral humidity = 55.6%
Standard deviation = 6.5%
International Journal of Civil & Environmental Engineering IJCEE-IJENS Vol: 14 No: 06 15
144906-7676-IJCEE-IJENS © December 2014 IJENS
I J E N S
Natural ventilated (cold days) Air-conditioned (cold days)
Fig. 11a. b. Thermal sensation votes in cold days
Natural ventilated (cold days) Air-conditioned (cold days)
Fig. 12a. b. Humidity sensation votes in cold days
5. DISSCUSSION
Thermal comfort zone
Taiwan belongs to the subtropical climate zone and is
surrounded by the ocean, causing a high temperature and high
humidity climate. Especially summer (hot days) is usually
raining in the wet season and winter (cold days) is usually in
dry season. As Taiwan students can accept a higher
temperature and humidity for fitting local climate than that in
the ASHRAE Standard 55.
Fig. 13a, b shows the thermal comfort zone of NVs and ACs
in subtropical Taiwan. During the hot days, no occupant in
NVs fell on the comfort zone of ASHRAE Standard 55 and
they can tolerate the temperature range at 26.2℃ - 28.2℃
(relative humidity = 54.1% - 65.2%). In ACs, 60% occupants
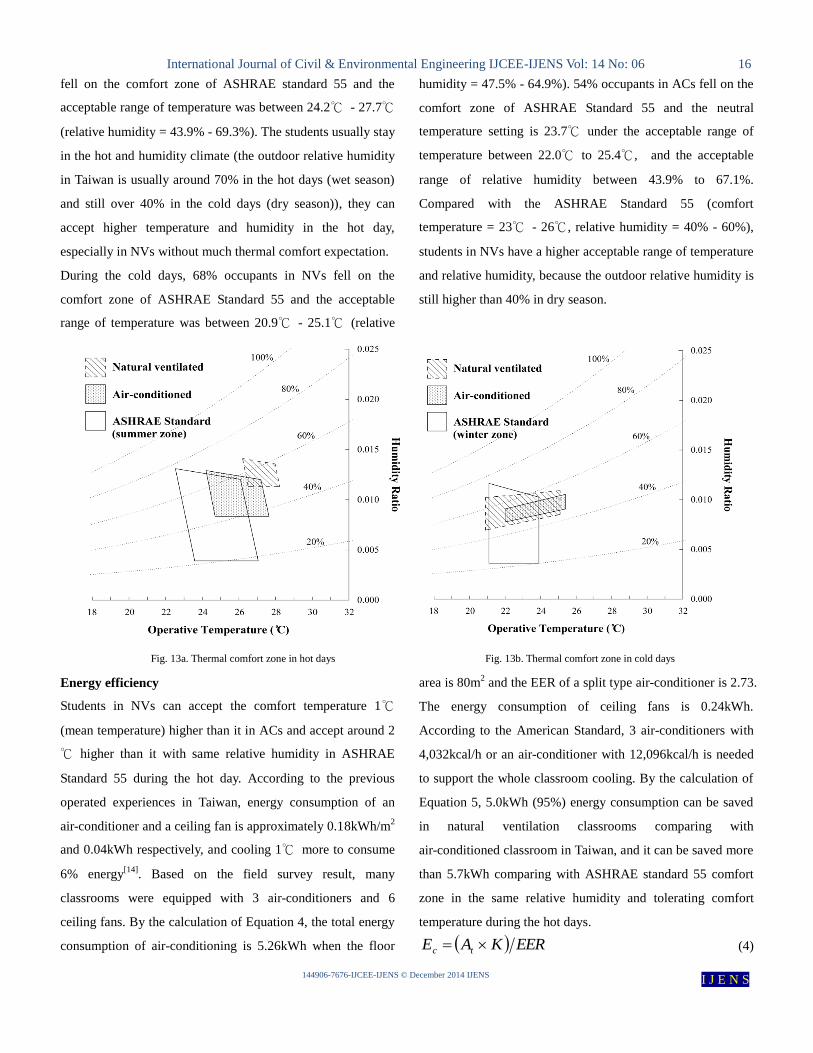
International Journal of Civil & Environmental Engineering IJCEE-IJENS Vol: 14 No: 06 16
144906-7676-IJCEE-IJENS © December 2014 IJENS
I J E N S
fell on the comfort zone of ASHRAE standard 55 and the
acceptable range of temperature was between 24.2℃ - 27.7℃
(relative humidity = 43.9% - 69.3%). The students usually stay
in the hot and humidity climate (the outdoor relative humidity
in Taiwan is usually around 70% in the hot days (wet season)
and still over 40% in the cold days (dry season)), they can
accept higher temperature and humidity in the hot day,
especially in NVs without much thermal comfort expectation.
During the cold days, 68% occupants in NVs fell on the
comfort zone of ASHRAE Standard 55 and the acceptable
range of temperature was between 20.9℃ - 25.1℃ (relative
humidity = 47.5% - 64.9%). 54% occupants in ACs fell on the
comfort zone of ASHRAE Standard 55 and the neutral
temperature setting is 23.7℃ under the acceptable range of
temperature between 22.0℃ to 25.4℃, and the acceptable
range of relative humidity between 43.9% to 67.1%.
Compared with the ASHRAE Standard 55 (comfort
temperature = 23℃ - 26℃, relative humidity = 40% - 60%),
students in NVs have a higher acceptable range of temperature
and relative humidity, because the outdoor relative humidity is
still higher than 40% in dry season.
Fig. 13a. Thermal comfort zone in hot days Fig. 13b. Thermal comfort zone in cold days
Energy efficiency
Students in NVs can accept the comfort temperature 1℃
(mean temperature) higher than it in ACs and accept around 2
℃ higher than it with same relative humidity in ASHRAE
Standard 55 during the hot day. According to the previous
operated experiences in Taiwan, energy consumption of an
air-conditioner and a ceiling fan is approximately 0.18kWh/m2
and 0.04kWh respectively, and cooling 1℃ more to consume
6% energy[14]
. Based on the field survey result, many
classrooms were equipped with 3 air-conditioners and 6
ceiling fans. By the calculation of Equation 4, the total energy
consumption of air-conditioning is 5.26kWh when the floor
area is 80m2 and the EER of a split type air-conditioner is 2.73.
The energy consumption of ceiling fans is 0.24kWh.
According to the American Standard, 3 air-conditioners with
4,032kcal/h or an air-conditioner with 12,096kcal/h is needed
to support the whole classroom cooling. By the calculation of
Equation 5, 5.0kWh (95%) energy consumption can be saved
in natural ventilation classrooms comparing with
air-conditioned classroom in Taiwan, and it can be saved more
than 5.7kWh comparing with ASHRAE standard 55 comfort
zone in the same relative humidity and tolerating comfort
temperature during the hot days.
EERKAE tc (4)
International Journal of Civil & Environmental Engineering IJCEE-IJENS Vol: 14 No: 06 17
144906-7676-IJCEE-IJENS © December 2014 IJENS
I J E N S
%1001
c
nE E
EE (5)
6. CONCLUSION
This study aims at the thermal comfort of students in
subtropical classrooms in Taiwan. 683 samples were received
through field surveys. This study proposes the difference of
thermal temperature range between the natural ventilated
classrooms (NVs) and air-conditioned classrooms (ACs) via
the clothing values and analyzes the efficiency of energy
saving.
According to the result, 0.7clo is the boundary to distinguish
hot days and cold days since students adjust their clothing
value to resist the thermal environment. As students in Taiwan
used to tolerate the hot and humid climate zone, most students
can accept a high temperature and high humidity environment
in a classroom. In hot days, the neutral temperature and
humidity of students in NVs were 27.3 ℃ and 59.9%
respectively. 71% classrooms switched on the air-conditioner
and students in ACs can only accept a lower and smaller range
of temperature by expectation. NVs can save 5.0kWh (95%)
energy compared with ACs and 5.7kWh compared with
ASHRAE Standard 55. Hence, under the acceptable range of
temperature, ceiling fan is recommended in natural ventilation
classrooms to achieve the balance between the energy saving
and comfortable environment. In addition to the passive
strategy, internal or external shading, heat isolation and proper
ventilation would be a fundamental issue of energy saving.
7. ACKNOWLEDGEMENT
The author great thank National Science Council “NSC
100-2221-E-025-012“, “NSC 98-2221-E-025-010“, “NSC
97-2221-E-011-119“, supporting the financial to investigate
the students‟ thermal comfort in the university classrooms.
REFERENCES
[1] C.C. Huang, 2005, A Field Study on Thermal Comfort in University
Classrooms, Master Thesis, Department of Architecture, Feng-Chia
University, Taiwan.
[2] P.O. Fanger, 1970, Thermal Comfort: Analysis and Applications in
Environmental Engineering, McGraw-Hill, New York.
[3] ANSI/ASHRAE 55-2004, 2004, Thermal Environmental Conditions
for Human Occupancy, Atlanta: American Society of Heating,
Refrigerating and Air-Conditioning Engineers, USA.
[4] M. H. Chen, 2005, The study of thermal comfort and energy saving in
the classrooms, Master Thesis, Department of Environment
Engineering and Management, Chao-Yang University, Taiwan
[5] A.G. Kwok, 1989, Thermal comfort in classrooms in tropical,
ASHRAE transactions 104 (1B) 1031-1047
[6] H. Yoshino, Y. Yoshino, Q Zhang, A Mochida, N. Li,Z. Li, H.
Miyasaka, 2006, Indoor thermal environment and energy saving for
urban residential buildings in China, Energy and Buildings 38 (11),
1308-1319
[7] Mui K.W., Wong L.T., 2007, Neutral temperature in subtropical
climates − a field survey in air-conditioned offices, Building and
Environment, Vol. 42(2), p.699-706
[8] ASHRAE, ASHRAE Standard 62.1, 2010, Ventilation for acceptable
air quality, American Society of Heating, Refrigerating and
Air-Conditioning Engineers, Atlanta
[9] M.C. Lee, L.T. Wong, K.W. Mui, 2009 Use of electronic questionnaire
surveys for indoor environment quality assessment in classrooms, 10th
Asia pacific Conference on the Built Environment, Kaohsiung, Taiwan
[10] M.C. Lee, C.F. Chang, L.T. Wong et al.,2011, Thermal comfort
between natural and mechanical ventilation in subtropical classroom.,
11th Asia pacific Conference on the Built Environment, Jakarta,
Indonesia.
[11] M.C.Lee, K.W.Mui, L.T.Wong, E.W.M.Lee and C.T.Cheung, 2012,
Student learning performance and indoor environmental quality (IEQ)
in air-conditioned university teaching rooms, Building and
Environment, 49(1)238-244
[12] C.F.Chang, 2012, The Study of Optimized Temperature Setting of
Air-Conditioned Office in Metropolitans in Subtropical Taiwan,
Master Thesis, Department of Interior Design, National University of
Science and Technology, Taiwan
International Journal of Civil & Environmental Engineering IJCEE-IJENS Vol: 14 No: 06 18
144906-7676-IJCEE-IJENS © December 2014 IJENS
I J E N S
[13] W.H. Lam, M.C. Lee, C. F. Chang, L.T. Wong, K. W. Mui, 2012,
Study of Optimized Temperature Setting in Air-conditioned Office
Buildings in Taiwan, COBEE 2012, p.363-370, Boulder, USA.
[14] Y.M. Chu, Z. M. Lee, H.T. Yu, Discuss the New Electricity
Technology in the Environmental Protection: Take DC Frequency
Conversion Air Conditioning as an Example, ICCITE 2005,
Kaohsiung, Taiwan