Embed Size (px)
Citation preview

Energy Behavior
Carrie Armel Precourt Energy Efficiency Center, Stanford

Engineering
& Economics
Behavioral
Tools
PUBLIC POLICY
SOCIOLOGY
ECONOMICS
EDUCATION
MEDICINE
MARKETING
SOCIAL
COGNTIVE &
PERCEPTUAL
PSYCHOLOGY
COMMUNCATION
Public
Health Behavioral
Epidemiology
Social
Marketing
Community
Based SM
Consumer
Behavior
Communication
Theories
Persuasion
Theories
Behavioral
Economics
Diffusion
Theory
Technology
Design
Anthropology
& Sociology
City
Planning
BEHAVIORAL
TOOLS
Energy saving behaviors or actions:
1. Purchase and use EE technology
2. Eliminate unintended waste
3. Shift settings and install controls
4. Repair items or perform maintenance
5. Adjust patterns of use and habits
6. Etc.


Policy
Physical Env.
Media/Marketing
Community-Based
Individual
• Complementary interventions
• Many tools at each level
Behavioral Interventions
Built Env. Buildings Technology
Based on the socio-ecological
model of health behavior
For a annotated PPT and detailed video presentation, see:
http://peec.stanford.edu/behavior/library.php (last link)
http://med.stanford.edu/media/video/medcast-armel-big.htm

Policy
1. Default options / “Opt-out” instead of “Opt-in” - Organ donation, 401K, car attributes, refrigerators
- Green electricity or carbon credits Picherta et al. (In Press). J of Env Psy.
Policy
Physical Env.
Media/Marketing
Community-Based
Individual
2. Foot in door, small commitment
Infrastructure Safety Promotion
Built Environment
Model City:
Muenster, Germany
• 35% of all vehicle
trips made by bike
• Popul.: 300,000
Policy
Physical Env.
Media/Marketing
Community-Based
Individual

BEHAVIOR IMPACTS
• Purchasing
• Installation
• Proper & persistent use
PROGRAMMABLE THERMOSTATS • 70% of homeowners find them too difficult to
operate and lose out on energy savings
benefits (Honeywell, 2004)
• Designed from engineer’s perspective
of what’s easiest to implement
• Should be designed from user’s
perspective of what’s easiest to use
ELEMENTS OF DESIGN
• Learnability
• Usability
• Motivation, incl. identity signaling
• Aesthetics (Decision Analyst, 2007)
Tom Kelley. (2001). The Art of Innovation.
BJ Fogg BJ. (2003). Persuasive Technology.
Don Norman. (1998). The Design of Everyday Things.
Francis Durso (ed.). (1999). The Handbook of Applied Cognition.
Policy
Physical Env.
Media/Marketing
Community-Based
Individual Technology

Numerous possible places to get stuck
each leading to poor performance!
Minimum Physical Limit
(correct and efficient usage)
Asymptotic
Practice
Phase
Many E
rrors
Few
Slo
w S
peed
Fast
Amount of Time Doing Task (“Practice”)
Accommodate
Bounded
Rationality
Provide
Feedback
Motivate
How the User Thinks
Etc.
Based on Rosenbloom & Newell

Media/Marketing
Entertainment Education
Serial dramas are extremely effective for positive societal change
How do they work?
1. 2/3 Entertainment
2. Modeling
Instruct
Create norms
Build self-efficacy (confidence)
Demonstrate expected outcomes
– Pos., Neg., & transitional chars.
Policy
Physical Env.
Media/Marketing
Community-Based
Individual
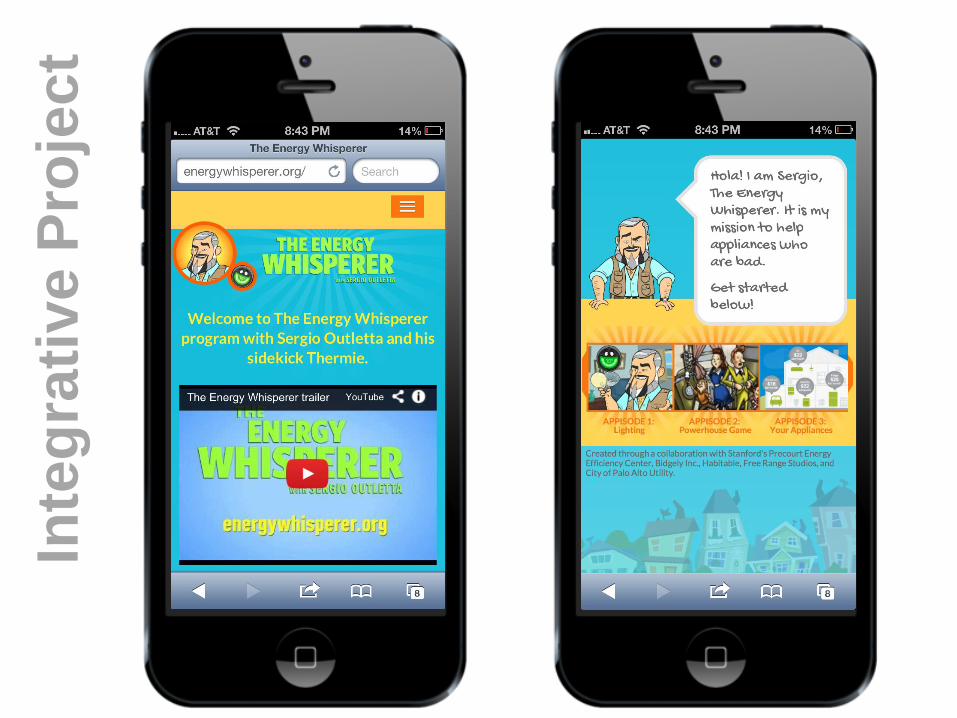
Inte
gra
tiv
e P
roje
ct

Community-Based
SUCCESSFUL PROGRAMS
• Hood River Project
• EnergyMark
• Gore’s 1000 soldiers
• Interfaith Power and Light
ADVANTAGES
• Messages feel personal, not anonymous
• Caters information for people like me
• Enhanced learning - Direct experience
• Additional tools – Goals, Feedback, Barriers, Practice
– Group feedback & competitions
– Commitment
Policy
Physical Env.
Media/Marketing
Community-Based
Individual

Can we expedite the development
of successful interventions?

PUBLIC POLICY
SOCIOLOGY
ECONOMICS
EDUCATION
MEDICINE
MARKETING
SOCIAL
COGNTIVE &
PERCEPTUAL
PSYCHOLOGY
COMMUNCATION
Public
Health Behavioral
Epidemiology
Social
Marketing
Community
Based SM
Consumer
Behavior
Communication
Theories
Persuasion
Theories
Behavioral
Economics
Diffusion
Theory
Technology
Design
Anthropology
& Sociology
City
Planning
BEHAVIORAL
TOOLS
Behavioral Sciences
http://piee.stanford.edu/behavior

Project Timeline
# o
f O
pp
ort
un
itie
s
Design

Diffusion of Innovation
Everett Rogers. (2003). Diffusion
of Innovation.
Malcolm Gladwell.
Bass Diffusion Model.
Huggy Rao. Marc Granovetter.
Bernardo Huberman.
Pe
rce
nt
of
To
tal
Po
pu
lati
on
Adopter Groups Through Time
Hub and Spoke
Characteristics of People Characteristics of Networks
Characteristics of Innovations • Simplicity - Is it easy to understand and use?
• Observability - Are the results of using it visible?
• Trialability - Can it be experimented with?
• Compatibility - Is it consistent with existing values/needs?
• Relative Advantage - Is it better than the prior thing?

It’s a design failure,
not a people failure.

ADDITIONAL SLIDES

? 9 11 7
Typical Approaches
Behavior Change Attitudes ?
Use Standard Marketing Approaches ?
? Provide Monetary (Dis)Incentives
ATTITUDES
Metareviews as early as
the 1960s have shown
that correlations between
attitudes and behavior are
very weak, often near zero
(e.g., Wicker, 1969)
STANDARD MARKETING
•Small changes in market share are
sufficient.
• Target easy behaviors: switch to a
new brand or indulge.
• Messages based primarily on
creative inspiration.
Product, price, placement, &
promotion. concepts are still useful
though.
MONEY
•Other barriers are
not addressed
• Incentives are
expensive, fees unpopular
• Small incentives not very
motivating
•Behavior reverts back or
even boomerangs

Developing an Intervention:
Work Backwards, Establish Constraints
Intervention dev’t materials: http://peec.stanford.edu/behavior/library.php
http://peec.stanford.edu/energybehavior/events_datajam.php
Step 2: Pick energy saving ACTION and
ACTOR.
Identify one or more, and clarify
steps and barriers.
Step 3: Develop
CORE SOLUTION.
Explore, addressing
steps and barriers.
Identify how data can
be leveraged.
Choose one
Solution.

Identify Target Action(s)
Which are worth pursuing?
1. What are their energy saving impacts?
2. How malleable are they? (How much will people be
able to change?)
Examples
– Time shift / avoid congestion
– Rideshare
– Mode shift (to public or non-motorized transit)
– Identify parking spaces with less/no circling
– Work from home (?), live close to work and stores
– Car choice (hybrid EV, etc.)
– Driving patterns etc. (e.g., glide, reduce car weight)

Fuel Efficient Driving:
Where does the energy go?
Source: http://www.fueleconomy.gov/feg/atv.shtml/
1
Elaboration of Specific Driving Action(s)
*Numbers correspond to descriptions in the notes section of the slide.
2
4
3
5 7
8

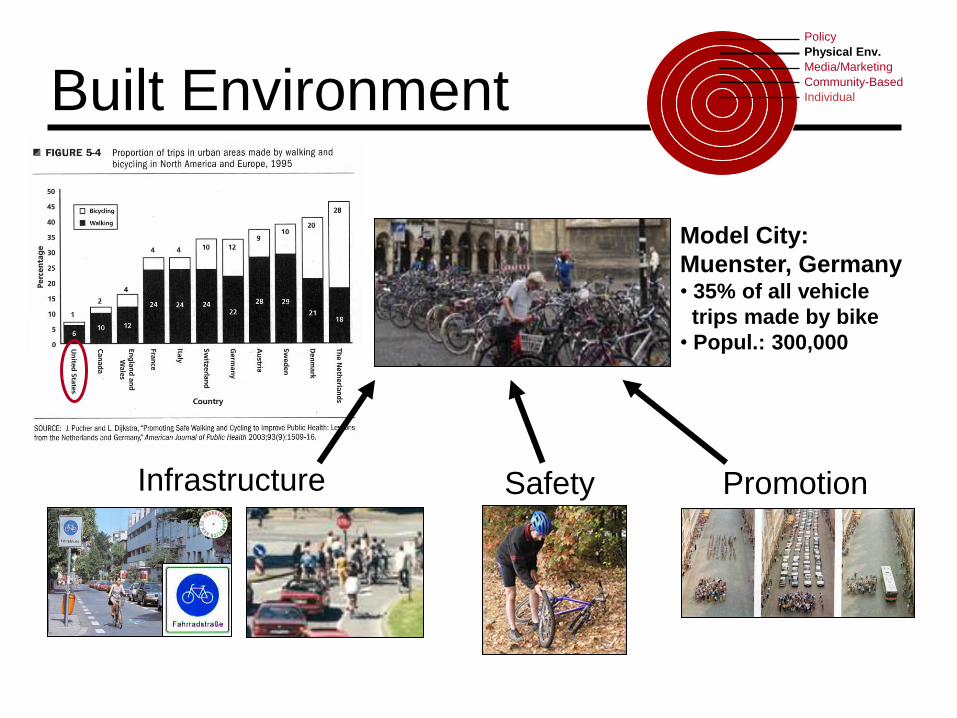
Help People Execute the Action:
Walk Through Steps, Address Barriers
• What are the steps people need to do to execute the action? How will you guide them through these?
• People gravitate to actions with high benefits and few barriers.
• Change behavior by altering the balance of benefits and barriers.
Existing
Behavior:
Drive to work
New Behavior:
Bike to work
Benefits Time Add lights to bike
paths
Barriers Add speed
bumps
Safety
External barriers • Actual difficulty, inconvenience…
• Infrastructure, technology
Internal barriers • Unaware of the activity, its benefits, or how to perform the activity
• Perceived difficulty, inconvenience, unpleasantness
• Myths & cultural habits

Existing Behavior:
Drive to work
New Behavior:
Carpool
New Behavior:
Public transit
New Behavior:
Bike
Benefits -Short travel time
-Delayed & hidden
costs
-Time & route flexibility
-Large cargo capacity
-Privacy
-Enjoyment of driving
-Prestige
-School/work sets up
program and incentives
-Matching service
-Cheaper parking
-Closer parking
-Carpool lanes
-Savings in gas &
wear/tear
-Time savings for
parents
-Get to know their
children’s friends etc.
-Networking with
neighbors
-Time to read
-Making friends
-Guaranteed emergency
ride home
-Advertise routes,
frequency, reliability
guarantee
-Additional shuttle
service and loaner bikes;
bike racks on buses
-Clean, comfortable,
warm transport
-Reduced or free group
rates
-Exercise
-Time outside
-De-stress, time to self
-Parking closer to
destination
-Bike & clothes
lockers/cages
-Showers
-Convenient services for
installing
panniers/baskets
-Sell wind/rain gear
-Safe, convenient bike
routes
-Other incentives (e.g.,
prizes)
Barriers -Traffic congestion
-Gas costs
-Maintenance costs
-Air pollution
-Parking distant from
work; traffic slowing
-Limit # of permits
-Parking more costly
-Commute Calculator
-Time & effort of setting
it up
-Belief others won’t
want to
-Don’t know who to
carpool with
-Different schedules;
individuals running late
-Emergency (sick child)
-Limited route & time
selection
-Unpredictability
-Long travel/walking time
-Discomfort, noise, dirt
-Immediate costs
-Small cargo capacity
-Weather
-Surly personnel,
passengers
-Bike security
-Work clothes
-Small cargo capacity
-Weather
-Safety

Identify Existing Data Sets, and
Analytics that Can Help Address Barriers…
1. Public transit APIs
2. OMDBII data (e.g., Progressive Insurance)
3. FastTrak data... (toll, university or commercial campus sensors)
4. Parking meter sensors
5. Bus/fleet location tracking sensor data
6. DMV records
7. Other? E.g., car manufacturer, car lot, car share company data
Rajagopal and Fischer Kolter and numerous others

Examples of Existing Work
•Balaji Prabhakar – Insinc, etc. https://insinc.sg/
•Streetline http://www.streetline.com/
•Sidecar & other ride sharing apps https://www.side.cr/
•Google etc. buses in SF?
•EV Virtual Test Drive App
http://www.youtube.com/watch?v=u2SNMsJFYaE
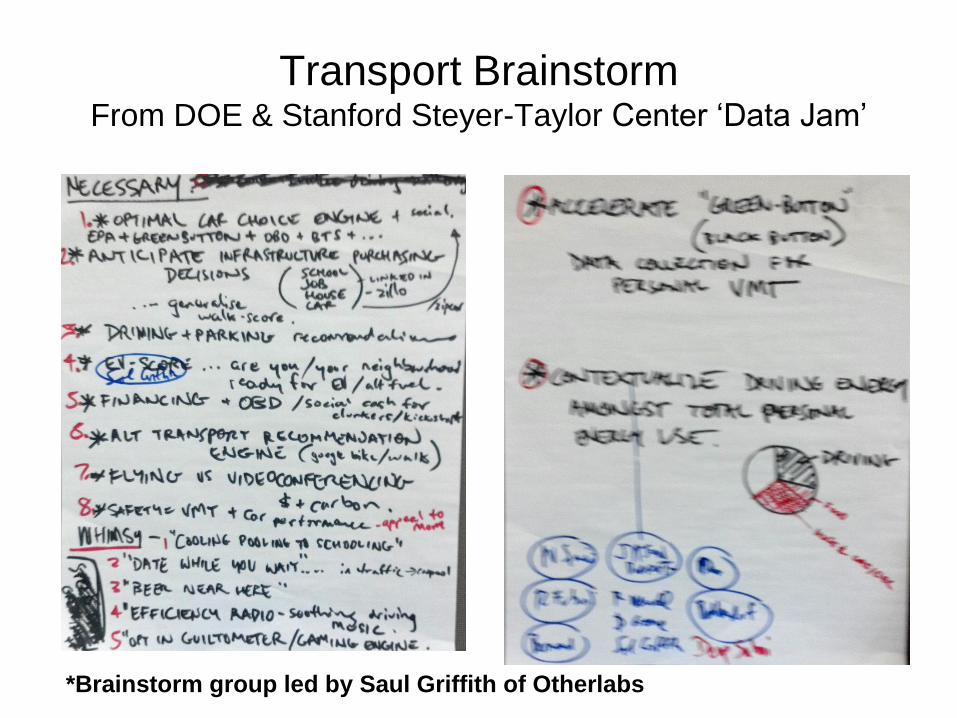
Transport Brainstorm From DOE & Stanford Steyer-Taylor Center ‘Data Jam’
*Brainstorm group led by Saul Griffith of Otherlabs

SOME ADDITIONAL
STANFORD ARPA-E
PROJECTS

Transformation Eco-System
ENERGY
USE
STANFORD
ENGINE
BEHAVIOR
CHANGE
COLLECT
&
CAPTURE
PERVASIVE
SENSORS
COMMUNICATION
NETWORK
ENERGY SERVICES
PLATFORM
ANALYTICS
PROGRAMS
FOUNDATIONAL
WORK
MEDIA
PROGRAMS
POLICY
PROGRAMS
COMMUNITY
PROGRAMS
MODELING
&
EVALUATION
ECONOMETRIC
ESTIMATION
SEGMENTATION
MULTI-AGENT
SIMULATION
TECHNOLOGY
PLATFORM
PRESENT
&
INFORM
WEB ENABLED
DEVICES
SYSTEM
GROUP INDIVIDUAL

visergy
ME
DIA
P
OL
ICY
C
OM
MU
NIT
Y


ChangeLabs PI: Banny Banerjee
Scale: FaceBook
PowerTower
Kidogo

insinc
PI: Balaji Prabhakar
Scale: Major transit companies and
company/college campuses

Energy Calc. PI: Sam McClure
Scale: Google AdWords

Energy Disaggregation
Disaggregation allows us to take a whole building
(aggregate) energy signal, and separate it into appliance
specific data (i.e., plug or end use data). A set of statistical
approaches are applied to accomplish this.

Stanford ARPA-E Team
Principal Investigator
Byron Reeves
Project Director
Carrie Armel
Core Investigators
Banny Banerjee, Tom Robinson, Jim Sweeney, June Flora
Investigators
Hamid Aghajan, Nicole Ardoin, Martin Fischer, Abby King, Phil Levis, Sam McClure,
Andrew Ng, Ram Rajagopal, Balaji Prabhakar, Jeff Shrager, Greg Walton, John
Weyant
Post Docs
Eric Heckler, Zico Kolter, Hilary Schaffer-Boudet, Annika Todd, Gireesh Shrimali
Graduate Students
Adrian Albert, Matt Crowley, James Cummings, David Gar, Sebastien Houde, Amir
Kavousian, Maria Kazandjieva, Amir Khalili, Deepak Merugu, Ansu Sahoo,
James Scarborough, Anant Sudarshan, David Paunesku, Scott White