Embed Size (px)
Citation preview
PEER-REVIEWED ARTICLE bioresources.com
Moya et al. (2013). “Drying energy balance,” BioResources 8(2), 2033-2046. 2033
Energy Balance for Three Lignocellulosic Residues Using Different Drying Techniques
Roger Moya,a* Carolina Tenorio,
a and Brian Bond
b
The main goal of this research was to establish the energy balance from the drying of oil palm empty fruit bunches (EFB), pineapple plant leaves (PL), and sawdust from Gmelina arborea (GAD). Three drying techniques (air, solar, and hot air drying) were tested. The initial moisture content (MCi), drying time, moisture content (MC) variation with time, transformation energy, transportation and drying energy, drying critical point, and the energy balance were measured. MCi was higher for PL (over 79%), followed by EFB (over 47%), and GAD (under 47%). Drying time varied from 27 to 342 hours depending on the technique used. PL presented the longest drying time, followed by GAD, and finally EFB. The transformation energy input was only applied to PL, and the values ranged from 0.041 to 0.09 kWh/kg. Energy used for transportation ranged from 0.051 to 0.090 kWh/kg. Energy consumption ranged from 0.20 to 1.90 kWh/kg, and its mathematical model regarding MC was β1MC
3+β2MC
2+β3MC+β4 (polynomial) or β1ln (MC) +β2 (logarithmic). A
critical value of MC was found, where an inflection of energy consumption occurs during the drying process for all residues. The critical MC for GAD was 10%. For EFB it varied from 11 to 13%. For PL it varied from 4% to 13%. The best energy balance was obtained for GAD and EFB (4.0 to 4.5 kWh/kg) when MC was less than 10%. The best energy balance for PL was obtained when MC varied from 30 to 40%.
Keywords: Energy input; Caloric power; Energy gain; Bioenergy
Contact information: a: Instituto Tecnológico de Costa Rica, Escuela de Ingeniería Forestal, P.O. Box:
159-7050 Cartago-Costa Rica, Phone: (506) 2550-2433 / Fax: (506) 2591-3315; b: Department of
Sustainable Biomaterials, Virginia Tech, Blacksburg, VA USA.
* Corresponding author: [email protected]
INTRODUCTION
It is estimated that around 11,764 tons of waste are produced in Costa Rica daily,
of which 86% (10,122 ton/day) are agro-industrial residues and only a small percentage
of these residues are utilized (GFA Consulting Group 2010). Due to problems associated
with the environment and global warming, many regions of the world have developed
better uses for residues from the lumber industry (sawdust) and agricultural crops (Askew
and Holmes 2001; Offerman et al. 2011; Shuit et al. 2009). Using these lignocellulosic
residues as energy-generating materials is beneficial, since renewable residues are used to
produce energy (Offerman et al. 2011). However, it is often necessary to implement a
pre-treatment step for biomass in order to reduce its high moisture content (Ulloa et al.
2004; McKendry 2002).
Biomass drying has attracted the interest of researchers worldwide (Fagernäsa et
al. 2010). Much of this research has focused on the design of dryers, the development of
mathematical drying models, and kinetic curves (White et al. 2011). However, the actual
PEER-REVIEWED ARTICLE bioresources.com
Moya et al. (2013). “Drying energy balance,” BioResources 8(2), 2033-2046. 2034
process of drying these materials is more complex than what has been modeled. For
example, the energy expenditures for the pretreatment of materials to facilitate drying
have not been considered. Also, it has been mentioned that an increasing drying
temperature increases the drying rate and decreases the drying time (Chen et al. 2012,
Artiaga et al. 2005).
In Costa Rica, the cost of 1 kWh of industrial use is equivalent to 0.16 United
States Dollars (USD) (La Gaceta 2012), and this cost represents a high proportion in the
total cost of drying process. Energy can also be spent to reduce the size of residues for
faster drying (Anttila et al. 2011). The most efficient material for providing energy is one
that has the best energy balance, which can be defined as the difference between energy
gained (energy input) and energy expended during pre-treatment and processing of waste
(energy consumption or energy used). Also, there is the lack of knowledge on the energy
potential and the energy balance when drying residues come from different agricultural
crops. Therefore, the objective of this study was to establish the energy balance for three
types of lignocellulosic residues generated in Costa Rica (empty fruit bunches, pineapple
plant leaves, and Gmelina arborea sawdust) when using three drying techniques: air,
solar, and hot air drying. The optimum moisture content, which represents the highest
energy balance reached, was determined for each drying technique and residue.
MATERIAL AND METHODS
Materials Three different types of lignocellulosic residues from agricultural and forest
industries were investigated: pineapple leaves (PL) from a cropped plantation, fibers from
the empty fruit bunch of oil palm (EFB), and sawdust of Gmelina arborea (GAD). EFB
and GAD did not receive any pre-treatment because they had adequate size, but PL was
processed using several pre-treatment methods to promote faster drying. These pre-
treatments consisted of:
Processing to three different particle sizes: PL were cut into strands of 2 cm, 6 cm, and
10 cm in length. The epidermis and cuticle layer were maintained for all particle sizes,
which were named as follows: 2 cm as 2-strand without grooves, 6 cm as 6-strand
without grooves, and 10 cm as 10-strand without grooves. Also, PL with grooves was
tested again: PL were cut to particle size of 2 cm and grooves were opened in the
underside to break the cuticle (2-strand with grooves). The grooves were drawn 5 mm
apart with nails. The grooves were applied to allow water flow.
Shredded PL: The pineapple plants were pulled up, their roots were removed, and the
material crushed in a shredder commonly used for the extraction of sugar cane juice.
Sawdust was directly extracted from a sawdust evacuation system for a circular
sawing at a sawmill. Empty fruit bunch (EFB) material was taken from the oil extraction
process, in which the oil is extracted from the bunch through a hot water and threshing
process in a mill. This type of residue comes in a fibrous shape. More information about
the preparation these materials can be found in Tenorio and Moya (2012).
PEER-REVIEWED ARTICLE bioresources.com
Moya et al. (2013). “Drying energy balance,” BioResources 8(2), 2033-2046. 2035
Drying Techniques, Residue Stacking, and Moisture Content Control Three drying systems were tested: air (AD), solar (SD), and hot air drying (HAD).
Average temperatures are detailed in Table 2. When stacking the residues for drying,
containers were used that allowed air circulation under and over the materials. Trays were
separated by a space of 25.4 mm to allow airflow. Four dry samples were used to
determine the moisture content (MC) variation in each residue type and drying system. A
textile bag was used to contain the material, avoid material loss, and allow air circulation
both over and under the material. The bags were placed on trays at different heights (top
and lower part in each side of pile) in the drying systems so that the MC in different parts
of the chamber (3 bags in each side of the devices at lower, upper, and middle heights)
could be measured. The samples were weighed at the beginning of each drying process
and twice throughout the day for AD and SD until it reached constant weight. For HAD,
the MC control samples were weighed every 2 h, since the weight loss for the material
studied is faster than other methods evaluated. Tenorio and Moya (2012) describe in
detail the drying systems, stacking methods, and moisture content control used in this
work.
Energy Input for Transformation, Transportation, and Drying The energy used for transformation, transportation, and drying of materials was
measured in kilowatts per hour (kWh) and will henceforth be termed energy input. PL
residue was the only material requiring pre-treatment, since GAD and EFB are residues
from industrial processes. Two different pre-treatments were tested and evaluated for PL,
which consisted of chipping and shredding the material with a grinder. The amount of
diesel fuel used during the process of chipping pineapple plants was measured over an 8-
h period. For both pre-treatments, the energy input was determined by relating the energy
consumption in the processing to the weight of the processed material (Equation 1). For
the process using diesel, a density factor of 0.85876 kg per each liter of fuel and
combustion heat of 42900 kJ per kg was used (Recope 2012). The energy used by the
grinder was measured by placing an electricity consumption gauge, measurements in kWh,
at the main inlet of the control panel during its operation.
Energy input for transportation was then calculated for each of the residues. The
apparent density of the materials and fuel consumption used in transportation was
measured for each kilometer transported. The apparent density of the materials was
determined by weighing 5 samples of known volume (Table 2). With this information,
density parameter (mass/volume) was calculated. The distances the material was
transported was measured to be 150 km for all residues. Fuel consumption was measured
according to the amount of liters used by a truck to carry 33 m3 across the previously
established distances. Then, the energy spent in transportation was calculated using the
density factor of 0.85876 kg per liter of fuel and combustion heat of 42900 kJ per kg
(Recope 2012). Finally, the energy input for transportation was calculated using Eq. 2.
The energy input for solar and conventional drying processes was determined by
measuring the electricity average consumption, kWh, used for drying of each residue. A
Schneider Electric model PM200 digital gauge was used to record electricity
consumption, and it was measured every time the samples were weighed. The electricity
input was determined as (i) the total electrical energy used for drying and (ii) electricity
consumed at each of the different MCs measured. The energy used per drying process
was expressed per kilogram of material. The accumulated consumption was estimated by
PEER-REVIEWED ARTICLE bioresources.com
Moya et al. (2013). “Drying energy balance,” BioResources 8(2), 2033-2046. 2036
relating the consumption in kWh of each of the measurements and material weight (kg) at
the moisture content at the time measures were taken. Besides studying the variation of
energy consumption in relation to MC, the total energy consumption for drying was also
presented.
Energy Gain The energy gained by reducing the moisture content for each material was
determined by measuring the heating value at varying moisture contents. Each residue
was ground green to obtain approximately 100 g of material of less than 600 µm in size.
The samples were then passed simultaneously through 420 µm (#40 mesh) and 600 µm
(#60 mesh) screens, where the particle size used was the one that remained between the
meshes. The samples were then spread out and dried at room temperature for 15 h.
During drying, approximately 8 g of material was extracted every 30 min with a small
spoon, and the heating value was measured to determine the variation in heating value at
varying MC. The samples were then divided into two parts: 2 g for the determination of
MC and three samples of 2 g each for determining the heating value. Heating value was
determined based on the amount of total energy that an organic material emits and was
determined using Parr’s calorimetric test, ASTM D-5865 (ASTM 2003).
Energy Balance The total energy input for different MC was determined for each weight unit of
dried material (Eq. 3). First, the energy consumption per weight unit (kWh/kg) and MC
was modeled. A polynomial model was used (energy input = β1MC3
+ β2MC2
+ β3MC +
β4) for GAD and EFB in the solar and hot air drying processes, as well as PL in hot air
drying. A logarithmic model was used (energy input = β1ln(MC) + β2) for PL that was
solar dried. These models were obtained by STATISTICA (Stat soft Inc). To calculate
the total energy consumption for each MC, the transformation and transportation
expenditures were then added (Eq. 3). These models were selected according to the
determination coefficient (r2). Different models were tested, and those selected had the
highest values of r2. In the residue energy generation calculation, the heating values from
Parr’s calorimetric test were used at different MC (ASTM 2003). This generated a Gain
Energy = ax + d model. Later on, the heat generation at the same MC established by the
energy input was calculated. Finally, the energy balance was calculated for the different
moisture contents through the difference between energy gain and input (Eq. 4),
)kg
kJ(totaloutputEnery)
kg
kJ(inputEnergy)
kg
kJ(balanceEnergy
(3)
)kg
kJ(dryingEC)
kg
kJ(tiontransportaEC)
kg
kJ(tiontransformaEC)
kg
kJ(totalEC
(4)
where EC is energy consumption and MC is moisture content.
Energy input for pre-treatment (kJ/kg) = Diesel consumption (L) * 36840.4 (kJ/L)
Processed material mass (kg)
Energy input for transportation (kJ/kg) =
(1)
Diesel consumption (L) * 36840.4 (kJ/L)
Material apparent density (kg/m3)* Transportation capacity (m
3)
(2)
PEER-REVIEWED ARTICLE bioresources.com
Moya et al. (2013). “Drying energy balance,” BioResources 8(2), 2033-2046. 2037
Statistical Analysis A descriptive analysis was performed (average, standard deviation, maximum,
and minimum values) for all response variables. Normality was verified for each variable
in addition to testing for the presence of outliers. Subsequently, an analysis of variance
(ANOVA) was applied to test differences in initial moisture content (MCi), final
moisture content (MCf), and drying time between the different types of drying techniques
for each residue. A mixed linear model was used in the analysis of variance of wood
properties. The model included the following sources of variation: type of drying (d) in
three levels (AD, SD, and HAD), type of residue (r) in three levels (GAD, EFB, and PL),
and the interactions between the type of drying technique and type of residue. Four dry
samples were used for testing per residue and per type of drying (3 types of residue, 3
types of drying, and 4 dry samples = 36 samples total). The general linear model (GLM)
procedure from SAS (SAS Institute 1997) estimated the significance of sources of
variation. The existence of significant differences between the averages from MCi, MCf,
or drying time was verified through Tukey’s test (P < 0.01).
In order to establish the moisture content where an inflection of energy consump-
tion occurs, a linear regression (y = ax + b) was applied in two segments. The first
segment corresponds to the range of the highest MC, up to a MC where the slope of the
line does not show any change. The second segment corresponds to the MC where the
first segment ended to approximately 4%-6% MC. The point where the two segments
intercept is called the critical point of drying. The total energy input at a determined MC
was established for each weight unit of dried material (Eq. 3).
RESULTS
Energy Consumption, its Variation and Drying Critical Point EFB had the highest transportation energy, with 0.0947 kWh/kg, followed by
shredded and chipped PL, both with 0.0898 kWh/kg, and finally, GAD with 0.0506
kWh/kg (Table 1). The transformation energy for PL varied from 0.0406 kWh/kg to
0.0898 kWh/kg with the lowest value for shredded PL and the highest for chipped PL of
2-strand.
Table 1. Energy Consumption for Transportation and Transformation of Each Type of Residue
Lignocellulosic Residue
Transformation Energy Consumption (kWh/kg)
Transportation Energy Consumption (kWh/kg)
Sawdust - 0.0506
Empty fruit bunch - 0.0947
PL 2-strand with grooves 0.0898 0.0898
PL 2-strand without grooves 0.0898 0.0898
PL 6-strand without grooves 0.0898 0.0891
PL 10-strand without grooves 0.0898 0.0856
PL shredded pineapple leaves 0.0406 0.0898
The values for total energy used for solar and hot air drying are shown in Table 2.
It is notable that the highest energy used for consumption for drying was for 2-strand PL
with grooves in SD (1.87 kWh/kg) and for 10-strand PL without grooves in HAD (1.90
kWh/kg). In addition, other values for high energy consumption in SD were given for
GAD and EFB, 2-strand PL without grooves with values of 0.22 kWh/kg, 0.36 kWh/kg,
PEER-REVIEWED ARTICLE bioresources.com
Moya et al. (2013). “Drying energy balance,” BioResources 8(2), 2033-2046. 2038
and 1.46 kWh/kg, respectively. With HAD, high energy inputs of 1.68 kWh/kg and 0.89
kWh/kg were measured from 6-strand PL without grooves and shredded PL, respectively
(Table 2).
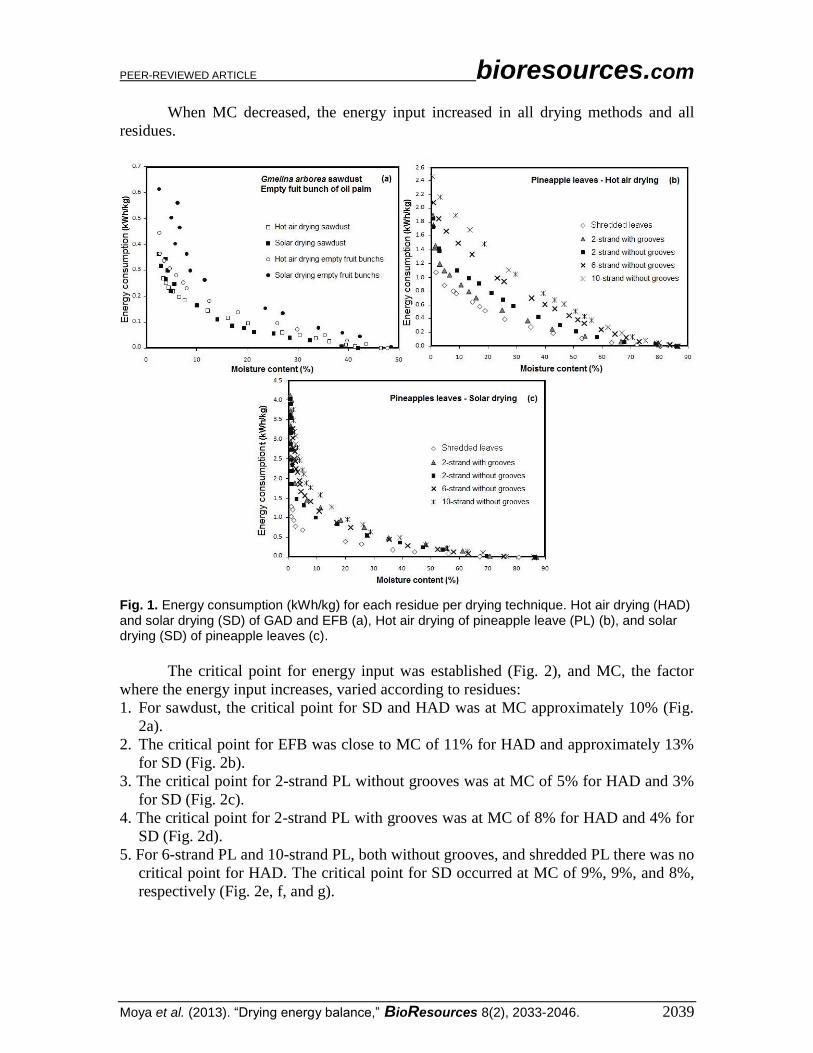
Regarding energy consumption in relation to MC, as would be expected, more
energy was consumed for all drying methods and residues in the course of achieving
lower moisture contents (Fig. 1).
Table 2. Total Energy Consumption for Lignocellulosic Residues Treated by Different Drying Techniques
Lignocellulosic Residue Apparent Density (kg/m
3)
Drying Technique and Average Temperature (°C)
Air 20.5
Solar (SD) 31.0
Hot Air (HAD) 80.0
Total Energy Consumption (kWh/kg)
Gmelina arborea sawdust (GAD) 157.9 - 0.22 0.20
Empty Fruit bunch (EFB) 70.0 - 0.36 0.28
Pineapple leaves (PL)
2 –strand with grooves 98.5 - 1.87 1.10
2 –strand without grooves 98.5 - 1.46 1.37
6–strand without grooves 92.5 - 1.57 1.68
10 –strand without grooves 89.9 - 1.76 1.90
Shredded 87.7 - 0.78 0.89
GAD and EFB energy use values were lower than 0.65 kWh/kg (Fig. 1a). Another
result was that the energy input of SD in GAD was similar to that found for HAD. For
EFB, SD had a slight increase in energy use in relation to HAD in an oven (Fig. 1a). For
PL, 10-strand without grooves had the highest energy input values in HAD, followed by
6-strand without grooves and 2-strand without grooves. Shredded PL had the lowest
values for energy input (Fig. 1b). The energy requirement for pineapple leaves in SD was
close to 4 kWh/kg (Fig. 1c) For SD, 2-strand PL with and without grooves had the
highest drying input values, followed by 10-strand PL without grooves, 6-strand PL
without grooves, and finally shredded PL (Fig. 1c).
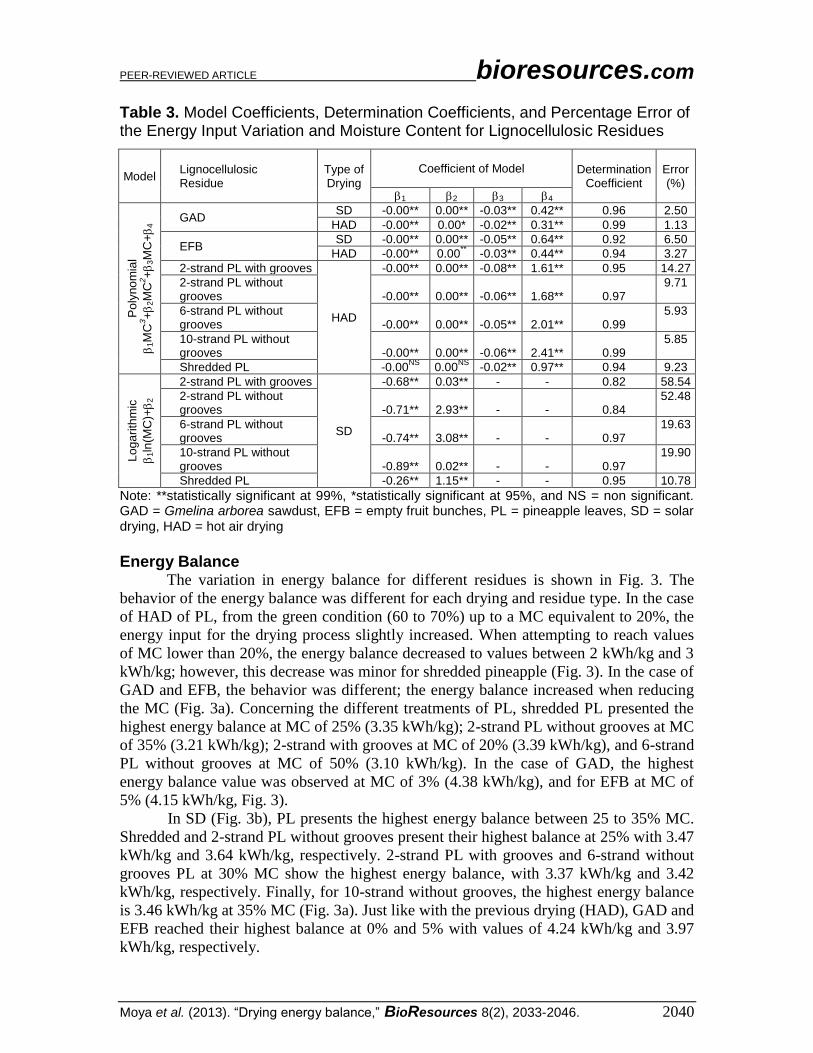
In the model for the energy input with varying MC for the different residues, two
types of relationships were found: one polynomial (energy input = β1MC3
+ β2MC2
+
β3MC + β4) for GAD and EFB in SD and HAD, and PL in HAD, and the other
logarithmic (energy input = β1ln(MC) + β2) for PL in SD. Table 3 shows the different
model coefficients, the determination coefficients (r2), and the percent error in the
different lignocellulosic residues and in the two types of models.
The residues presented high r2 values (higher than 0.92) for both models, with the
exception of 2-strand PL both without grooves (r2= 0.84) and with grooves (r
2= 0.82).
The error percentage was lower in the polynomial models (GAD and EFB in SD, HAD
drying, and PL in HAD) compared to the logarithmic one (PL in SD). In the polynomial
models, the error varied from 1.13% to 14.27% and in the logarithmic model from
10.78% to 58.54%. The highest values were those in 2-strand PL with and without
grooves with an error of 14.27% and 9.71%, respectively, for the polynomial model, and
58.54% and 52.48% for the logarithmic model. However, the lowest error percentages
were from GAD and EFB in HAD, which presented 1.13% and 3.27% for the polynomial
model. The lowest value in the logarithmic model was 10.78%, introduced by the
shredded PL.
PEER-REVIEWED ARTICLE bioresources.com
Moya et al. (2013). “Drying energy balance,” BioResources 8(2), 2033-2046. 2039
When MC decreased, the energy input increased in all drying methods and all
residues.
Fig. 1. Energy consumption (kWh/kg) for each residue per drying technique. Hot air drying (HAD) and solar drying (SD) of GAD and EFB (a), Hot air drying of pineapple leave (PL) (b), and solar drying (SD) of pineapple leaves (c).
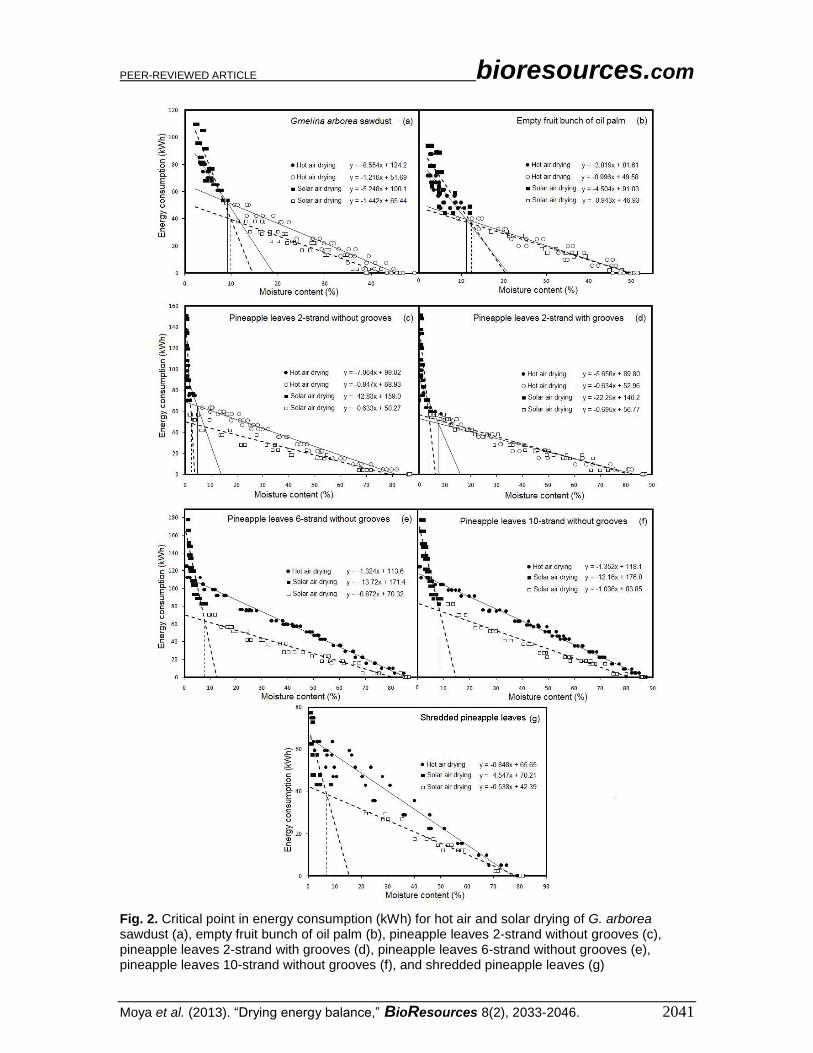
The critical point for energy input was established (Fig. 2), and MC, the factor
where the energy input increases, varied according to residues:
1. For sawdust, the critical point for SD and HAD was at MC approximately 10% (Fig.
2a).
2. The critical point for EFB was close to MC of 11% for HAD and approximately 13%
for SD (Fig. 2b).
3. The critical point for 2-strand PL without grooves was at MC of 5% for HAD and 3%
for SD (Fig. 2c).
4. The critical point for 2-strand PL with grooves was at MC of 8% for HAD and 4% for
SD (Fig. 2d).
5. For 6-strand PL and 10-strand PL, both without grooves, and shredded PL there was no
critical point for HAD. The critical point for SD occurred at MC of 9%, 9%, and 8%,
respectively (Fig. 2e, f, and g).
PEER-REVIEWED ARTICLE bioresources.com
Moya et al. (2013). “Drying energy balance,” BioResources 8(2), 2033-2046. 2040
Table 3. Model Coefficients, Determination Coefficients, and Percentage Error of the Energy Input Variation and Moisture Content for Lignocellulosic Residues
Model Lignocellulosic Residue
Type of Drying
Coefficient of Model Determination Coefficient
Error (%)
1 2 3 4
Po
lyno
mia
l
1M
C3+
2M
C2+
3M
C+
4 GAD
SD -0.00**
0.00** -0.03** 0.42** 0.96 2.50
HAD -0.00** 0.00*
-0.02** 0.31** 0.99 1.13
EFB SD -0.00** 0.00** -0.05** 0.64** 0.92 6.50
HAD -0.00**
0.00** -0.03** 0.44** 0.94 3.27
2-strand PL with grooves
HAD
-0.00** 0.00** -0.08** 1.61** 0.95 14.27
2-strand PL without grooves -0.00**
0.00** -0.06** 1.68** 0.97
9.71
6-strand PL without grooves -0.00** 0.00** -0.05** 2.01** 0.99
5.93
10-strand PL without grooves -0.00** 0.00** -0.06** 2.41** 0.99
5.85
Shredded PL -0.00NS
0.00NS
-0.02** 0.97** 0.94 9.23
Lo
ga
rith
mic
1ln
(MC
)+
2
2-strand PL with grooves
SD
-0.68** 0.03** - - 0.82 58.54
2-strand PL without grooves -0.71** 2.93** - - 0.84
52.48
6-strand PL without grooves -0.74** 3.08** - - 0.97
19.63
10-strand PL without grooves -0.89** 0.02** - - 0.97
19.90
Shredded PL -0.26** 1.15** - - 0.95 10.78
Note: **statistically significant at 99%, *statistically significant at 95%, and NS = non significant. GAD = Gmelina arborea sawdust, EFB = empty fruit bunches, PL = pineapple leaves, SD = solar drying, HAD = hot air drying
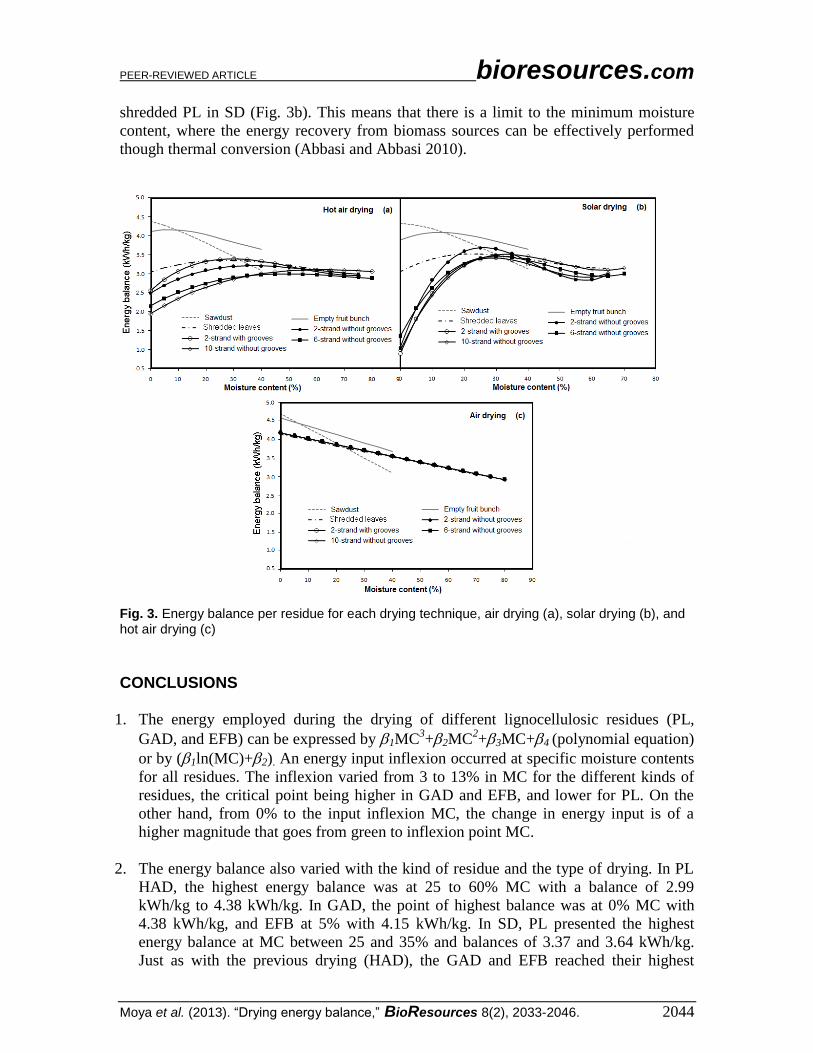
Energy Balance The variation in energy balance for different residues is shown in Fig. 3. The
behavior of the energy balance was different for each drying and residue type. In the case
of HAD of PL, from the green condition (60 to 70%) up to a MC equivalent to 20%, the
energy input for the drying process slightly increased. When attempting to reach values
of MC lower than 20%, the energy balance decreased to values between 2 kWh/kg and 3
kWh/kg; however, this decrease was minor for shredded pineapple (Fig. 3). In the case of
GAD and EFB, the behavior was different; the energy balance increased when reducing
the MC (Fig. 3a). Concerning the different treatments of PL, shredded PL presented the
highest energy balance at MC of 25% (3.35 kWh/kg); 2-strand PL without grooves at MC
of 35% (3.21 kWh/kg); 2-strand with grooves at MC of 20% (3.39 kWh/kg), and 6-strand
PL without grooves at MC of 50% (3.10 kWh/kg). In the case of GAD, the highest
energy balance value was observed at MC of 3% (4.38 kWh/kg), and for EFB at MC of
5% (4.15 kWh/kg, Fig. 3).
In SD (Fig. 3b), PL presents the highest energy balance between 25 to 35% MC.
Shredded and 2-strand PL without grooves present their highest balance at 25% with 3.47
kWh/kg and 3.64 kWh/kg, respectively. 2-strand PL with grooves and 6-strand without
grooves PL at 30% MC show the highest energy balance, with 3.37 kWh/kg and 3.42
kWh/kg, respectively. Finally, for 10-strand without grooves, the highest energy balance
is 3.46 kWh/kg at 35% MC (Fig. 3a). Just like with the previous drying (HAD), GAD and
EFB reached their highest balance at 0% and 5% with values of 4.24 kWh/kg and 3.97
kWh/kg, respectively.
PEER-REVIEWED ARTICLE bioresources.com
Moya et al. (2013). “Drying energy balance,” BioResources 8(2), 2033-2046. 2041
Fig. 2. Critical point in energy consumption (kWh) for hot air and solar drying of G. arborea sawdust (a), empty fruit bunch of oil palm (b), pineapple leaves 2-strand without grooves (c), pineapple leaves 2-strand with grooves (d), pineapple leaves 6-strand without grooves (e), pineapple leaves 10-strand without grooves (f), and shredded pineapple leaves (g)
PEER-REVIEWED ARTICLE bioresources.com
Moya et al. (2013). “Drying energy balance,” BioResources 8(2), 2033-2046. 2042
Regarding air drying (Fig. 3c), all the residues (PL, GAD, and EFB) obtained
their highest energy balance at 3% MC, where the 2-strand with and without grooves, the
6-strand, and 10-strand without grooves have the same energy balance value of 4.18
kWh/kg; shredded PL of 4.15 kWh/kg, GAD of 4.71 kWh/kg, and EFB of 4.59 kWh/kg.
DISCUSSION Energy Consumption, Variation, and Critical Point in Drying
The use of PL can be a high-energy input activity, as the operations of harvesting
and transportation not only demand energy, but can also cause possible pollution
problems (McKendry 2002). Stranded PL consumed twice the energy of shredded PL
(Table 1). This increase can be attributed to the fact that the second process used a
stationary shredder adapted to the processing of sugar cane, and consumes more or less
energy. However, shredded PL presented shorter total drying time and lower energy input
to reach different MC when compared to stranded PL (Table 2 and Fig. 1).
As expected, the energy input for transportation was related to apparent density
and the transportation distance (Hamelinck et al. 2005). The lowest energy input was
observed for the biomass with the highest apparent density, whilst the highest energy
input was for EFB, which presented the lowest apparent density (Table 2).
The drying times were longer for biomass with high MCi (Table 2), which makes
it necessary to rely on increased energy to properly dry it. For example, GAD with the
lowest MCi had the lowest total energy input (Table 2), and the energy input was the
lowest compared to all the residues and drying techniques studied (Fig. 1). The highest
energy input (Table 2 and Fig. 1) occurred for PL, which can be explained by the
specialized tissues (cuticle) that prevent moisture loss (Bartholomew et al. 2003).
However, the energy input can be reduced when PL is treated using a method to break the
cuticle on the leaf’s surface. For example, in this research, when the PL was cut to
smaller pieces and ripped through grooves, the energy input for drying decreased (Table
2, Fig. 1). There was a relevant reduction of 50% in energy input during HAD when PL is
shredded in a mill in comparison with leaves that were not shredded.
Moreover, it was found that the drying time decreased with increasing tempera-
ture, and this decrease was associated with an increased energy input (Table 2).
However, our results disagreed; the reduction of drying time does not occur with the
energy input. SD, with lower temperature than HAD, showed higher energy input (Table
2). This is likely due to the high-energy consumption in ventilation fans. Another aspect
that may affect the high-energy input in SD is the irregular temperature inside the
chamber and the lack of high temperatures available in the process. The highest
temperatures, which were close to 50 ºC, were only produced for short periods of time,
resulting in adequate moisture flow in biomass. The higher energy input required for SD
should be considered when selecting a drying technique, as one of the objectives of SD is
reducing energy input through alternate energy sources such as solar radiation (Sharma et
al. 2009).
The results showed that the polynomial model proposed for Energy input (Y
=β1MC3+β2MC
2+β3MC+β4) provides the best fitting curve for the GAD, EFB, and PL in
HAD, similar to what was found for the MC variation with the time in the same residue
(Tenorio and Moya 2012). As expected, this model shows that the incremental amount of
PEER-REVIEWED ARTICLE bioresources.com
Moya et al. (2013). “Drying energy balance,” BioResources 8(2), 2033-2046. 2043
energy consumption per unit of evaporation increases with the reduction of MC for all
three kinds of lignocellulosic residues. This behavior may be reflective of the fact that
more energy is required for evaporating water from within the lignocellulosic material.
According to the model for energy input variation with MC, it is possible that the
energy input has a turning point where energy input starts to increase in higher proportion
than what had been presented before the turning point (Fig. 3). The water in woody cells
is found in three locations: (i) occupying free cell spaces and lumens, (ii) in the cell wall,
and (iii) as part of the fiber cell wall (Berry and Roderick 2005). The turning point found
can be explained by the fact that as MC diminished, the water came out of the cell wall,
thus requiring higher energy input (Berry and Roderick 2005). However, the turning
point differs for the different biomass studied. GAD and EFB showed similar critical MC
for the different drying technique. However, it was different for PL.
Another important result related to the input tendency was that the change in
energy input for PL was of higher intensity (higher slope) compared to the other
biomasses. This behavior can again be explained by the fact that PL has a water resistant
cuticle that prevents adequate diffusion of water (Bartholomew et al. 2003).
Knowledge of the critical point allows for the establishment of a higher energy
efficiency point. For example, if it is necessary to dry this biomass to a MC lower than
the critical point, it should be considered that the energy input is very high. Also, if the
MC must be under the value, the change of 1% in moisture will lead to a high-energy
input.
Energy Balance The energy balance was different for each kind of residue. GAD and EFB
presented a similar behavior regarding the different drying techniques, as those materials
showed similar MC (Table 2). Also, the water elimination process for both kinds of
residues involves similar behavior, contrary to PL, which presents a natural barrier
(cuticle) for the elimination of water from the inner part of the leaf. On the other hand,
the energy balance (Fig. 3) does not reflect the critical point found when measuring the
energy input (Fig. 1). In the case of energy input, the input values increased greatly when
MC changed from 4 to 13%, called the critical point, while the energy balance tendencies
showed that between 20% and 30% of MC for PL there was an inflection of the tendency
(accelerated decrease) in HAD and SD (Fig. 3a, b). This is contrary to the other residues
and AD, which did not show these inflexions. The energy balance was linear with MC
reduction (Fig. 3).
Knowledge of the energy balance in the drying of different residues has practical
implications, such as accurately establishing the proper MC to dry a specific residue that
will then be used as a heat source. For example, even if there is an energy balance with
PL at all times, the MC to obtain the highest energy balance is when the residue is at 25%
and 60%, the lowest value being for shredded PL and the highest for 10-strand PL
without grooves in HAD, respectively (Fig. 4a). On the other hand, for GAD and EFB,
the highest energy balance value was at 0 and 5%, respectively, in HAD.
Even if there were maximum energy balance points in all the types of drying, the
values were higher for a pre-treatment or a drying process. For instance, for all the
residues, there was a maximum energy balance when air-drying at MC close to 0%, a
result to be expected, as this drying does not demand much energy. While for the other
drying techniques (HAD and SD) for PL, that energy balance was the highest for
PEER-REVIEWED ARTICLE bioresources.com
Moya et al. (2013). “Drying energy balance,” BioResources 8(2), 2033-2046. 2044
shredded PL in SD (Fig. 3b). This means that there is a limit to the minimum moisture
content, where the energy recovery from biomass sources can be effectively performed
though thermal conversion (Abbasi and Abbasi 2010).
Fig. 3. Energy balance per residue for each drying technique, air drying (a), solar drying (b), and hot air drying (c)
CONCLUSIONS
1. The energy employed during the drying of different lignocellulosic residues (PL,
GAD, and EFB) can be expressed by 1MC3+2MC
2+3MC+4 (polynomial equation)
or by (1ln(MC)+2). An energy input inflexion occurred at specific moisture contents
for all residues. The inflexion varied from 3 to 13% in MC for the different kinds of
residues, the critical point being higher in GAD and EFB, and lower for PL. On the
other hand, from 0% to the input inflexion MC, the change in energy input is of a
higher magnitude that goes from green to inflexion point MC.
2. The energy balance also varied with the kind of residue and the type of drying. In PL
HAD, the highest energy balance was at 25 to 60% MC with a balance of 2.99
kWh/kg to 4.38 kWh/kg. In GAD, the point of highest balance was at 0% MC with
4.38 kWh/kg, and EFB at 5% with 4.15 kWh/kg. In SD, PL presented the highest
energy balance at MC between 25 and 35% and balances of 3.37 and 3.64 kWh/kg.
Just as with the previous drying (HAD), the GAD and EFB reached their highest
PEER-REVIEWED ARTICLE bioresources.com
Moya et al. (2013). “Drying energy balance,” BioResources 8(2), 2033-2046. 2045
balance at 0 and 5% with values of 4.24 kWh/kg and 3.97 kWh/kg, respectively.
Regarding AD, all the residues obtained their highest energy balance at 0% MC with
values of 4.18 and 4.59 kWh/kg. Treated PL, with grooves or crushed, allowed for a
higher energy balance.
ACKNOWLEDGMENTS
The authors wish to thank The Vicerrectoría de Investigación y Extensión of the
Instituto Tecnológico de Costa Rica (ITCR), and Coorporación de Desarrollo Agrícola
del Monte S.A. (PINDECO), Palma Tica S.A. Company and Maderas Cultivadas S.A. for
its support in sampled trees.
REFERENCES CITED Abbasi, T., Abbasi, S.A. (2010) “Biomass energy and the environmental impacts
associated with its production and utilization,” Renewable and Sustainable Energy
Reviews 14, 919-937.
Anttila, P., Asikainen, A., Laitila, J., Broto, M., Campanero, I., Lizarralde, I., and
Rodriguez, F. (2011). “Potential and supply costs of wood chips from forests in Soria.
Spain,” Forest Systems 20, 245-254.
Artiaga, R., Naya, S., Garcia, A., Barbadillo, F., and Garcia L. (2005). “Subtracting the
water effect from DSC curves by using simultaneous TGA data,” Thermochim Acta.
428,137–139.
Askew, M., and Holmes, C. (2001). “The potential for biomass and energy crops in
agriculture in Europe, in land use, policy and rural economy terms,” Aspect. Appl.
Biol. 65, 365-374.
ASTM-American Society for Testing and Materials. (2003). “Standard test method for
gross calorific value of coal and coke,” D 5865-04. Annual Book of ASTM Standards,
Vol. 04.10. Philadelphia: American Standards Methods, 8 pp.
Bartholomew, D. P., Paull, R. E., and Rohrbach, K. G. (2003). The Pineapple: Botany,
Production and Uses, CABI Publishing, London, pp. 415.
Berry, S., and Roderick, M. L. (2005). “Plant–water relations and the fibre saturation
point,” New Phytol. 168, 25-38.
Chen, D. Y., Li, K., and Zhu, X. F. (2012). “Determination of effective moisture
diffusivity and activation energy for drying of powdered peanut shell under
isothermal conditions,” BioResources 7, 3670-3678.
Fagernäsa, L., Brammerb, J., Wiléna, C., Lauerc, M., and Verhoeffd, F. (2010). “Drying
of biomass for second generation syn fuel production,” Biomass Bioenerg. 34, 1267-
1277.
GFA Consulting Group (2010). “Informe Final: Estudio del Estado de la producción
sostenible y propuesta de mecanismos permanentes de fomento de la producción
sostenible,” (Consultoría SP-12-2009). San José. 417 p. (In Spanish)
Hamelinck, C. N., Roald, A. A., Suurs, A., and Faaij, S. (2005). “International bioenergy
transport costs and energy balance,” Biomass Bioenerg. 29, 114-134.
PEER-REVIEWED ARTICLE bioresources.com
Moya et al. (2013). “Drying energy balance,” BioResources 8(2), 2033-2046. 2046
La Gaceta. (2012). Resoluciones 742 a la 745-RCR-2011. Diario Oficial de Costa Rica
No.23, 1 de February, San José.
McKendry, P. (2002). “Energy production from biomass (part 1): Overview of biomass,”
Bioresource Tech. 83, 37-46.
Offerman, R., Seidenberger, T., Thrän, D., Kaltschmitt, M., Zinoviev, S., and Miertus, S.
(2011). “Assessment of global bioenergy potencials,” Mitig. Adapt. Strateg. Glob.
Change. 16, 103-115.
RECOPE (Refinadora Costarricense de petróleo, Costa Rica). (2012).
http://www.recope.go.cr/info_clientes/cliente_directo/Manual_Productos.pdf.
Sharma, A., Chen, C. R., and Vulan, N. (2009). “Solar energy drying systems: A review,”
Renew. Sust. Energ. Rev. 13, 1185-1210.
Shuit, S. H., Tan, K. T., Lee, K. T., and Kamaruddin, A. H. (2009). “Oil palm biomass as
a sustainable energy source: A Malaysian case study,” Energy 34, 1225-1235.
Tenorio, C., and Moya, R. (2012). “Evaluation of different methods proposal for the
drying of ligno-celluloses residues,” BioResources 7(3), 3500-3514.
White, J. E., Catallo, W. J., and Legendre, B. L. (2011). “Biomass pyrolysis kinetics: A
comparative critical review with relevant agricultural residue case studies,” J. Anal.
Appl. Pyrol. 91(1), 1-33.
Ulloa, J. B., Weerd, J. H., Huisman, E. A., and Verreth, J. A. J. (2004). “Tropical
agricultural residues and their potential uses in fish feeds: The Costa Rica situation,”
Waste Manag. 24, 87-97.
Article submitted: November 27, 2012; Peer review completed: February 10, 2013;
Revised version received and accepted: February 17, 2013; Published: February 28, 2013.