Embed Size (px)
Citation preview
510 Thornall Street, Suite 170
Edison, NJ 08837
Phone: 732-590-0122
Fax: 732-590-0129
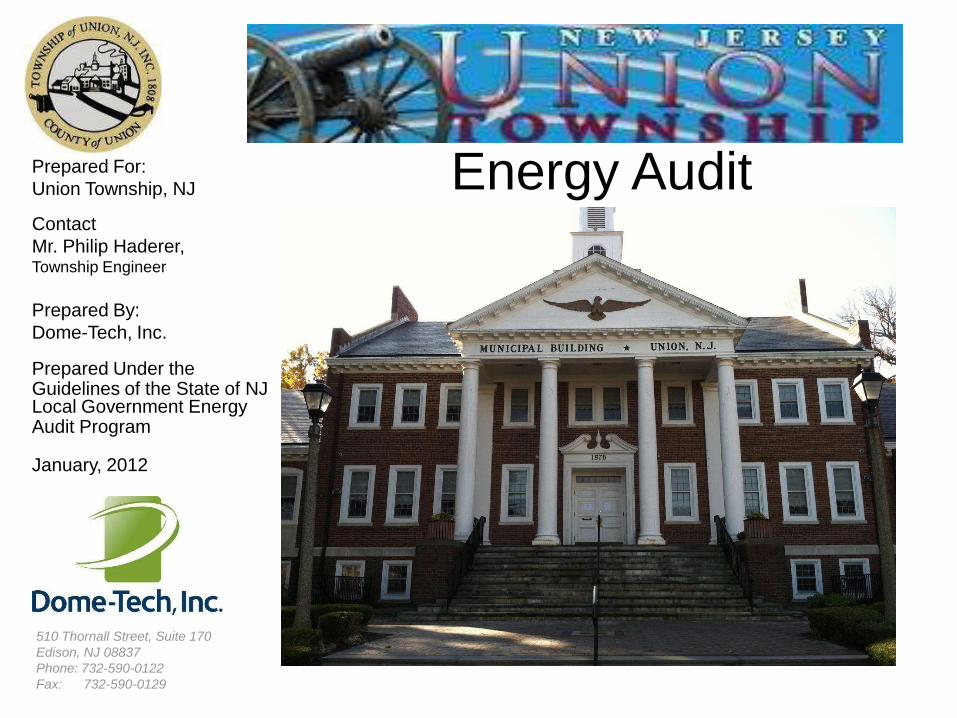
Energy Audit
Prepared For:
Union Township, NJ
Contact
Mr. Philip Haderer, Township Engineer
Prepared By:
Dome-Tech, Inc.
Prepared Under the Guidelines of the State of NJ Local Government Energy Audit Program
January, 2012

510 Thornall Street, Suite 170 Edison, NJ 08837
Tel: 732.590.0122 Fax: 732.590.0129
www.dome-tech.com
Commissioning HVAC Performance Testing Energy Audits Project Management
Retro-Commissioning Facility Management Consulting Energy Procurement
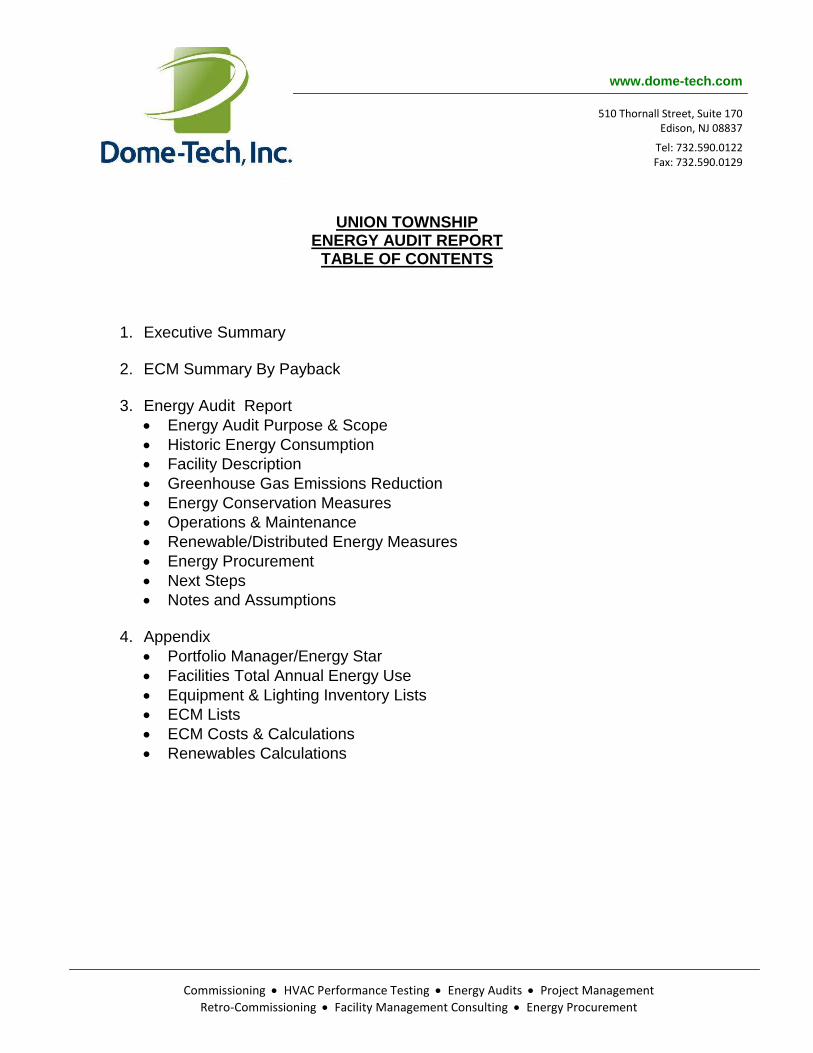
UNION TOWNSHIP
ENERGY AUDIT REPORT TABLE OF CONTENTS
1. Executive Summary
2. ECM Summary By Payback
3. Energy Audit Report
Energy Audit Purpose & Scope
Historic Energy Consumption
Facility Description
Greenhouse Gas Emissions Reduction
Energy Conservation Measures
Operations & Maintenance
Renewable/Distributed Energy Measures
Energy Procurement
Next Steps
Notes and Assumptions
4. Appendix
Portfolio Manager/Energy Star
Facilities Total Annual Energy Use
Equipment & Lighting Inventory Lists
ECM Lists
ECM Costs & Calculations
Renewables Calculations

510 Thornall Street, Suite 170 Edison, NJ 08837
Tel: 732.590.0122 Fax: 732.590.0129
www.dome-tech.com
Commissioning HVAC Performance Testing Energy Audits Project Management
Retro-Commissioning Facility Management Consulting Energy Procurement
February 28, 2012 Mr. Philip Haderer, P.E., C.M.E. Township Engineer Union Township 1976 Morris Avenue Union, NJ 07083 Re: EXECUTIVE SUMMARY FOR UNION TOWNSHIP STATE OF NEW JERSEY LOCAL GOVERNMENT ENERGY AUDIT Our Project Number DT11435 Dear Mr. Haderer: Dome-Tech was retained by Union Township, as a pre-qualified participant in the Local Government Energy Audit Program, to perform an energy audit. The objective of the energy audit was to evaluate the Township’s energy consumption, establish baselines for energy efficiency and identify opportunities to reduce the amount of energy used and/or its cost. The scope of the audit is standardized under the Program, and consisted of the following:
Benchmarking historic energy consumption utilizing EPA Energy Star’s Portfolio Manager
Characterizing building use, occupancy, size, and construction
Providing a detailed equipment list including estimated service life and efficiency
Identifying and quantifying energy conservation measures (ECMs)
Evaluating the economic viability of various renewable/distributed energy technologies
Performing a utility tariff analysis and assessing savings potential from energy procurement strategies
Providing the method of analyses Based upon data received for the twelve (12) month period August 2010 – August 2011 the Township had an annual expenditure of:
Electricity: 258,240 kWh at a total cost of $44,808
Natural Gas: 12,252 therms at a total cost of $12,673 Note that the electrical consumption for August 2010 was extrapolated from existing data to give a full year of data. The following building was evaluated under this study:
Union Township Municipal Building, 1976 Morris Avenue, Union, NJ 07093 at 28,750 square feet. Please refer to Section 2 of this report for a detailed list of identified Energy Conservation Measures (ECMs), along with a summary of their preliminary economics (estimated project cost, estimated annual energy savings, applicable rebate(s), etc.). In this report, all identified ECMs are ranked and presented according to their simple payback; however, please note that the master ECM table can also be sorted by building, by measure type, etc.
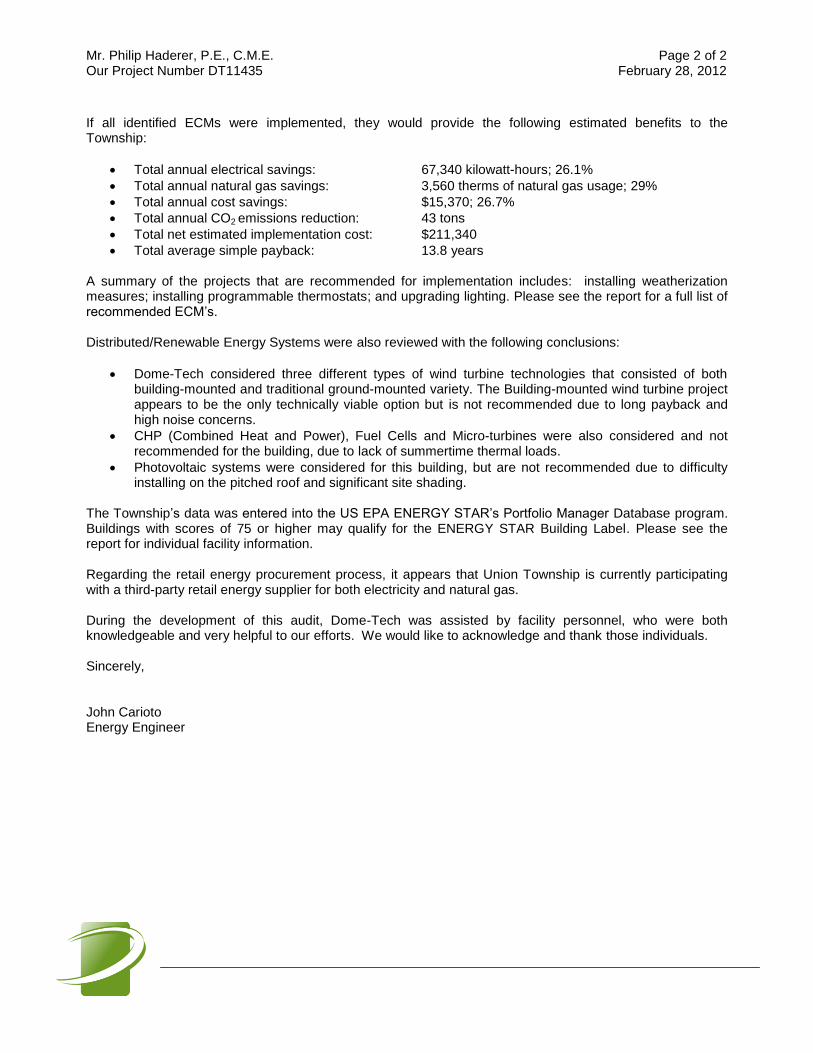
Mr. Philip Haderer, P.E., C.M.E. Page 2 of 2 Our Project Number DT11435 February 28, 2012
If all identified ECMs were implemented, they would provide the following estimated benefits to the Township:
Total annual electrical savings: 67,340 kilowatt-hours; 26.1%
Total annual natural gas savings: 3,560 therms of natural gas usage; 29%
Total annual cost savings: $15,370; 26.7%
Total annual CO2 emissions reduction: 43 tons
Total net estimated implementation cost: $211,340
Total average simple payback: 13.8 years A summary of the projects that are recommended for implementation includes: installing weatherization measures; installing programmable thermostats; and upgrading lighting. Please see the report for a full list of recommended ECM’s. Distributed/Renewable Energy Systems were also reviewed with the following conclusions:
Dome-Tech considered three different types of wind turbine technologies that consisted of both building-mounted and traditional ground-mounted variety. The Building-mounted wind turbine project appears to be the only technically viable option but is not recommended due to long payback and high noise concerns.
CHP (Combined Heat and Power), Fuel Cells and Micro-turbines were also considered and not recommended for the building, due to lack of summertime thermal loads.
Photovoltaic systems were considered for this building, but are not recommended due to difficulty installing on the pitched roof and significant site shading.
The Township’s data was entered into the US EPA ENERGY STAR’s Portfolio Manager Database program. Buildings with scores of 75 or higher may qualify for the ENERGY STAR Building Label. Please see the report for individual facility information. Regarding the retail energy procurement process, it appears that Union Township is currently participating with a third-party retail energy supplier for both electricity and natural gas. During the development of this audit, Dome-Tech was assisted by facility personnel, who were both knowledgeable and very helpful to our efforts. We would like to acknowledge and thank those individuals. Sincerely, John Carioto Energy Engineer
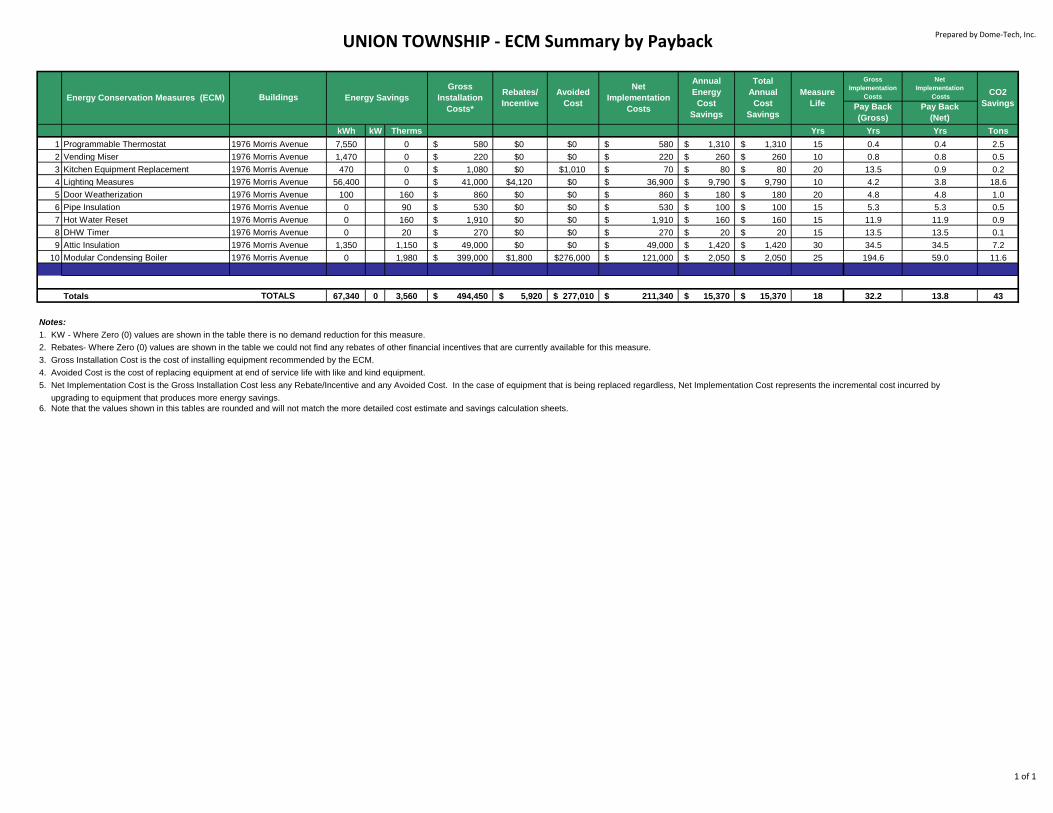
UNION TOWNSHIP - ECM Summary by PaybackPrepared by Dome-Tech, Inc.
Pay Back
(Gross)
Pay Back
(Net)
kWh kW Therms Yrs Yrs Yrs Tons
1 Programmable Thermostat 1976 Morris Avenue 7,550 0 580$ $0 $0 580$ 1,310$ 1,310$ 15 0.4 0.4 2.5
2 Vending Miser 1976 Morris Avenue 1,470 0 220$ $0 $0 220$ 260$ 260$ 10 0.8 0.8 0.5
3 Kitchen Equipment Replacement 1976 Morris Avenue 470 0 1,080$ $0 $1,010 70$ 80$ 80$ 20 13.5 0.9 0.2
4 Lighting Measures 1976 Morris Avenue 56,400 0 41,000$ $4,120 $0 36,900$ 9,790$ 9,790$ 10 4.2 3.8 18.6
5 Door Weatherization 1976 Morris Avenue 100 160 860$ $0 $0 860$ 180$ 180$ 20 4.8 4.8 1.0
6 Pipe Insulation 1976 Morris Avenue 0 90 530$ $0 $0 530$ 100$ 100$ 15 5.3 5.3 0.5
7 Hot Water Reset 1976 Morris Avenue 0 160 1,910$ $0 $0 1,910$ 160$ 160$ 15 11.9 11.9 0.9
8 DHW Timer 1976 Morris Avenue 0 20 270$ $0 $0 270$ 20$ 20$ 15 13.5 13.5 0.1
9 Attic Insulation 1976 Morris Avenue 1,350 1,150 49,000$ $0 $0 49,000$ 1,420$ 1,420$ 30 34.5 34.5 7.2
10 Modular Condensing Boiler 1976 Morris Avenue 0 1,980 399,000$ $1,800 $276,000 121,000$ 2,050$ 2,050$ 25 194.6 59.0 11.6
Totals TOTALS 67,340 0 3,560 494,450$ 5,920$ 277,010$ 211,340$ 15,370$ 15,370$ 18 32.2 13.8 43
Notes:
1. KW - Where Zero (0) values are shown in the table there is no demand reduction for this measure.
2. Rebates- Where Zero (0) values are shown in the table we could not find any rebates of other financial incentives that are currently available for this measure.
3. Gross Installation Cost is the cost of installing equipment recommended by the ECM.
4. Avoided Cost is the cost of replacing equipment at end of service life with like and kind equipment.
6. Note that the values shown in this tables are rounded and will not match the more detailed cost estimate and savings calculation sheets.
upgrading to equipment that produces more energy savings.
Energy SavingsBuildingsEnergy Conservation Measures (ECM)CO2
Savings
5. Net Implementation Cost is the Gross Installation Cost less any Rebate/Incentive and any Avoided Cost. In the case of equipment that is being replaced regardless, Net Implementation Cost represents the incremental cost incurred by
Gross
Implementation
Costs
Net
Implementation
CostsMeasure
Life
Total
Annual
Cost
Savings
Annual
Energy
Cost
Savings
Net
Implementation
Costs
Avoided
Cost
Rebates/
Incentive
Gross
Installation
Costs*
1 of 1

Union Township, NJ 1 FINAL – Energy Audit Report, February 2012
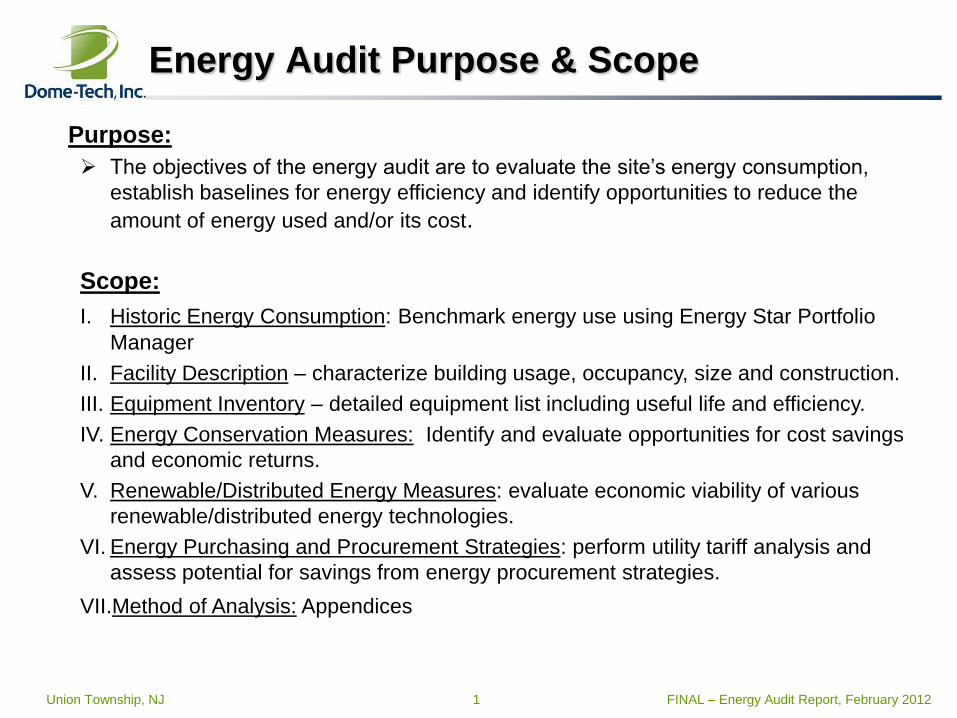
Energy Audit Purpose & Scope
Purpose:
The objectives of the energy audit are to evaluate the site’s energy consumption,
establish baselines for energy efficiency and identify opportunities to reduce the
amount of energy used and/or its cost.
Scope:
I. Historic Energy Consumption: Benchmark energy use using Energy Star Portfolio
Manager
II. Facility Description – characterize building usage, occupancy, size and construction.
III. Equipment Inventory – detailed equipment list including useful life and efficiency.
IV. Energy Conservation Measures: Identify and evaluate opportunities for cost savings
and economic returns.
V. Renewable/Distributed Energy Measures: evaluate economic viability of various
renewable/distributed energy technologies.
VI. Energy Purchasing and Procurement Strategies: perform utility tariff analysis and
assess potential for savings from energy procurement strategies.
VII.Method of Analysis: Appendices
Union Township, NJ 2 FINAL – Energy Audit Report, February 2012
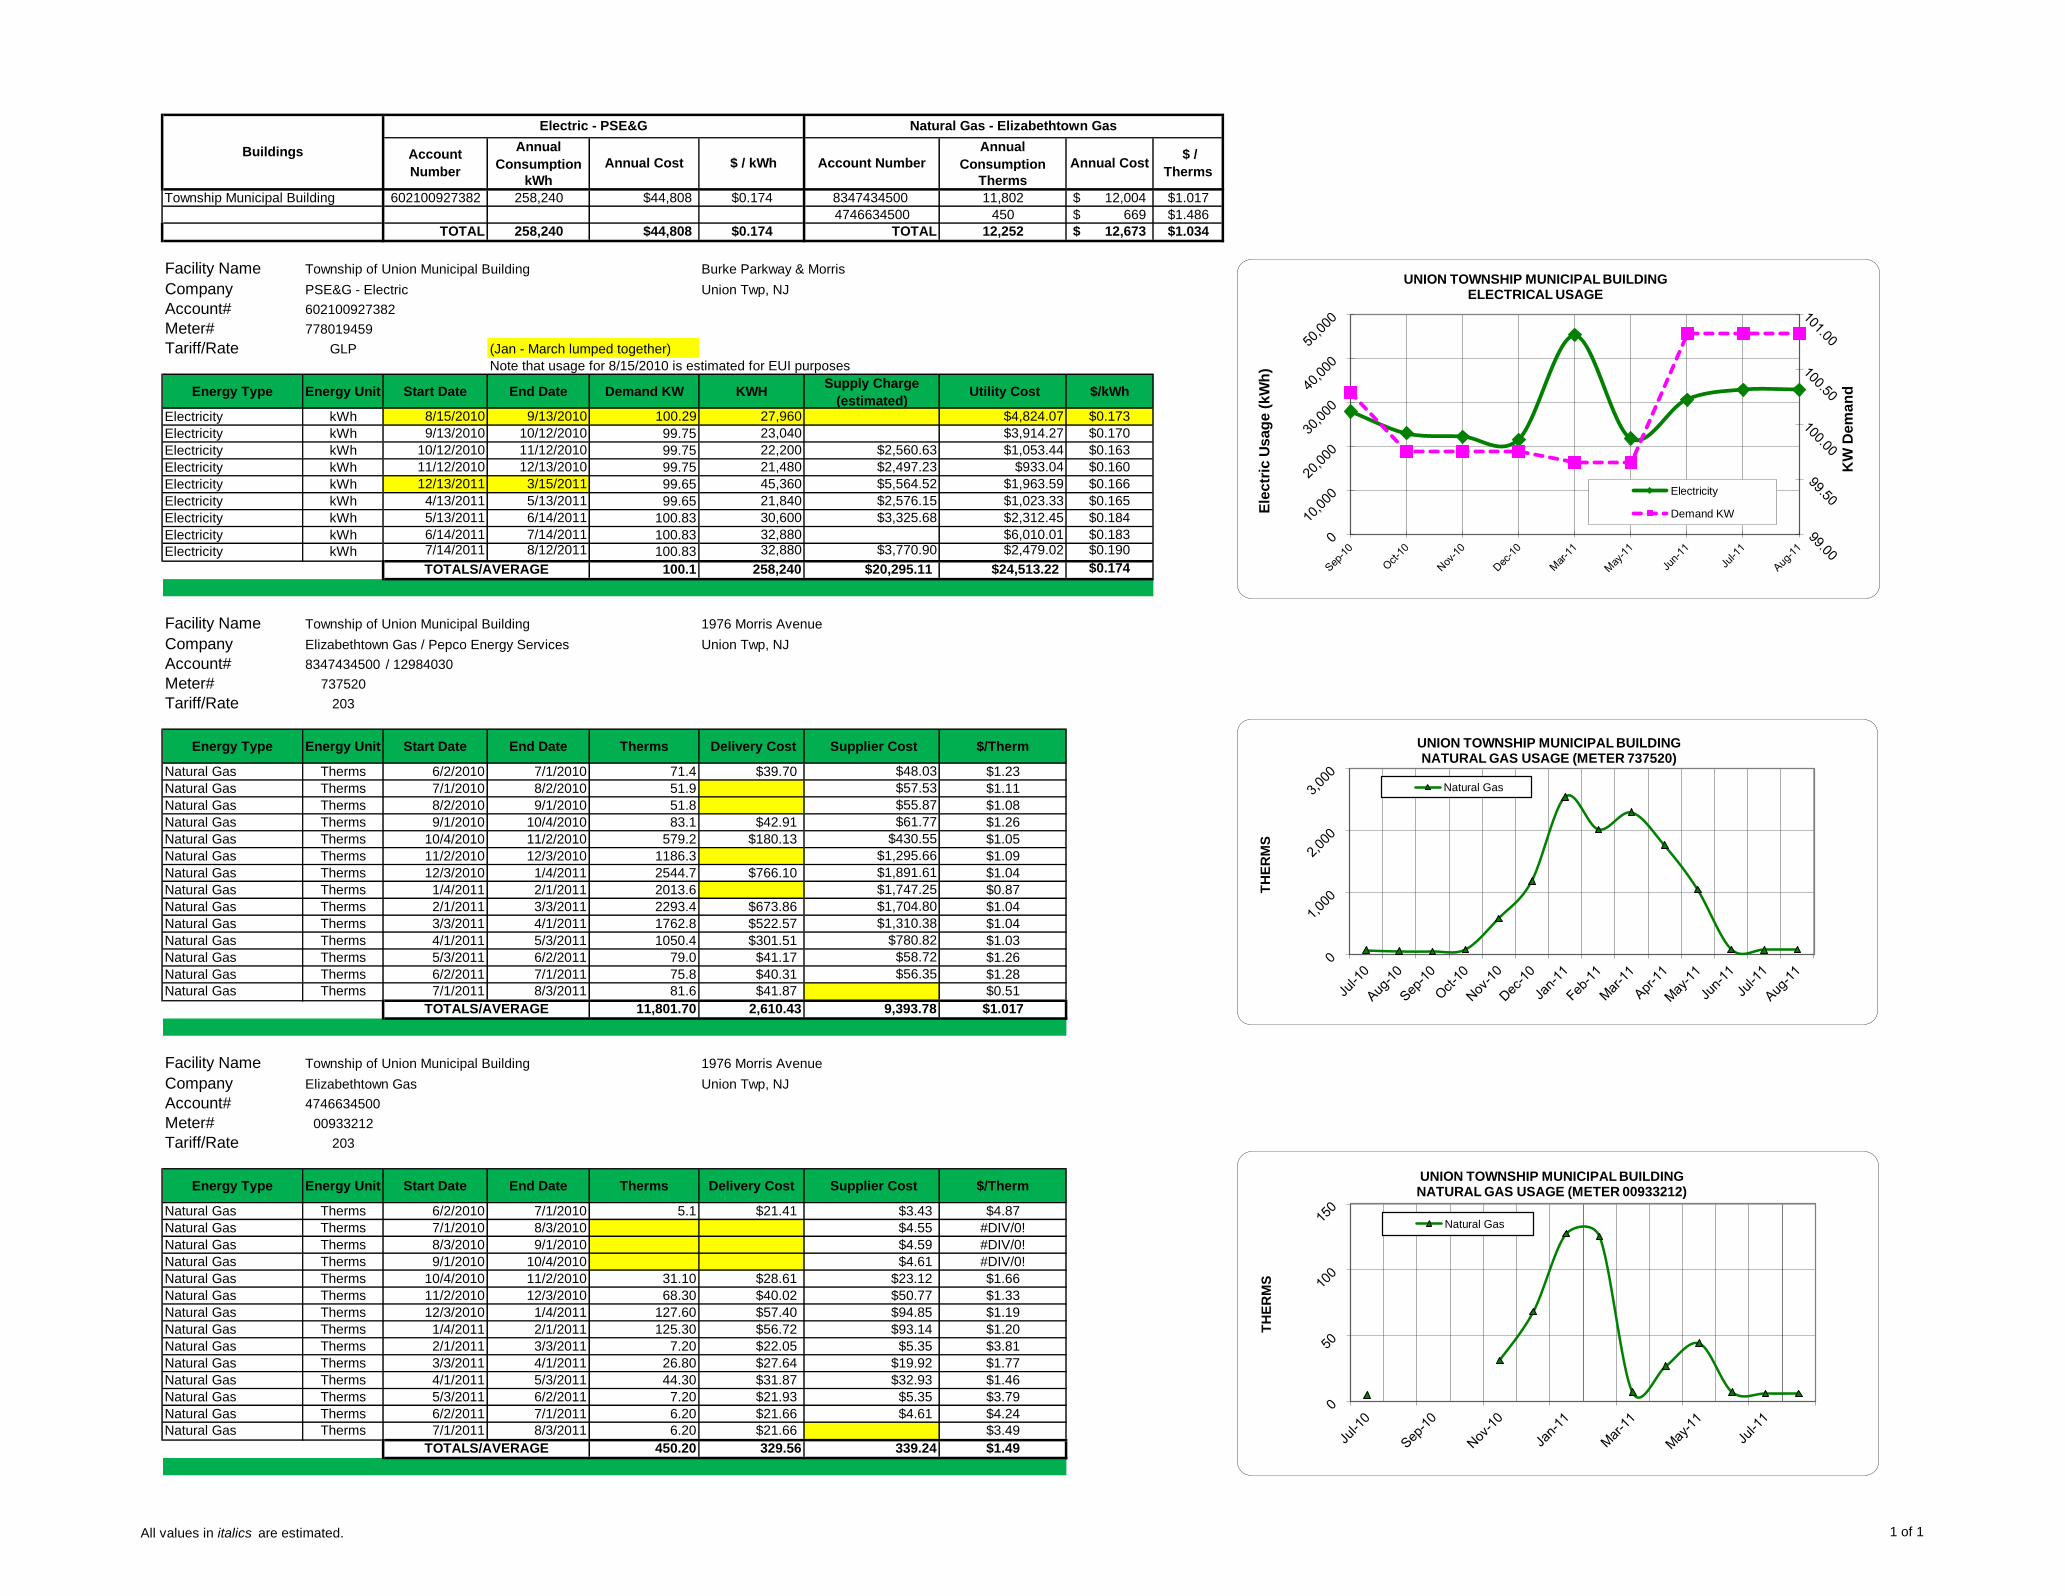
Historic Energy Consumption
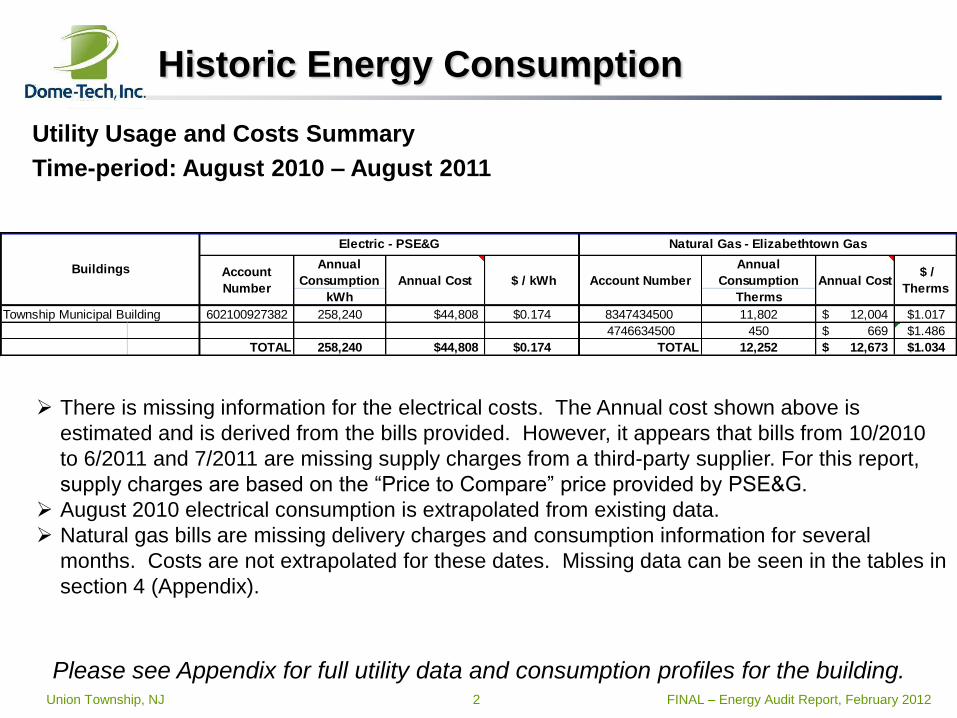
Utility Usage and Costs Summary
Time-period: August 2010 – August 2011
Please see Appendix for full utility data and consumption profiles for the building.
There is missing information for the electrical costs. The Annual cost shown above is
estimated and is derived from the bills provided. However, it appears that bills from 10/2010
to 6/2011 and 7/2011 are missing supply charges from a third-party supplier. For this report,
supply charges are based on the “Price to Compare” price provided by PSE&G.
August 2010 electrical consumption is extrapolated from existing data.
Natural gas bills are missing delivery charges and consumption information for several
months. Costs are not extrapolated for these dates. Missing data can be seen in the tables in
section 4 (Appendix).
Annual
Consumption
Annual
Consumption
kWh Therms
Township Municipal Building 602100927382 258,240 $44,808 $0.174 8347434500 11,802 12,004$ $1.017
4746634500 450 669$ $1.486
TOTAL 258,240 $44,808 $0.174 TOTAL 12,252 12,673$ $1.034
$ /
Therms
Electric - PSE&G Natural Gas - Elizabethtown Gas
Buildings Account
NumberAnnual Cost $ / kWh Account Number Annual Cost
Union Township, NJ 3 FINAL – Energy Audit Report, February 2012
Historic Energy Consumption
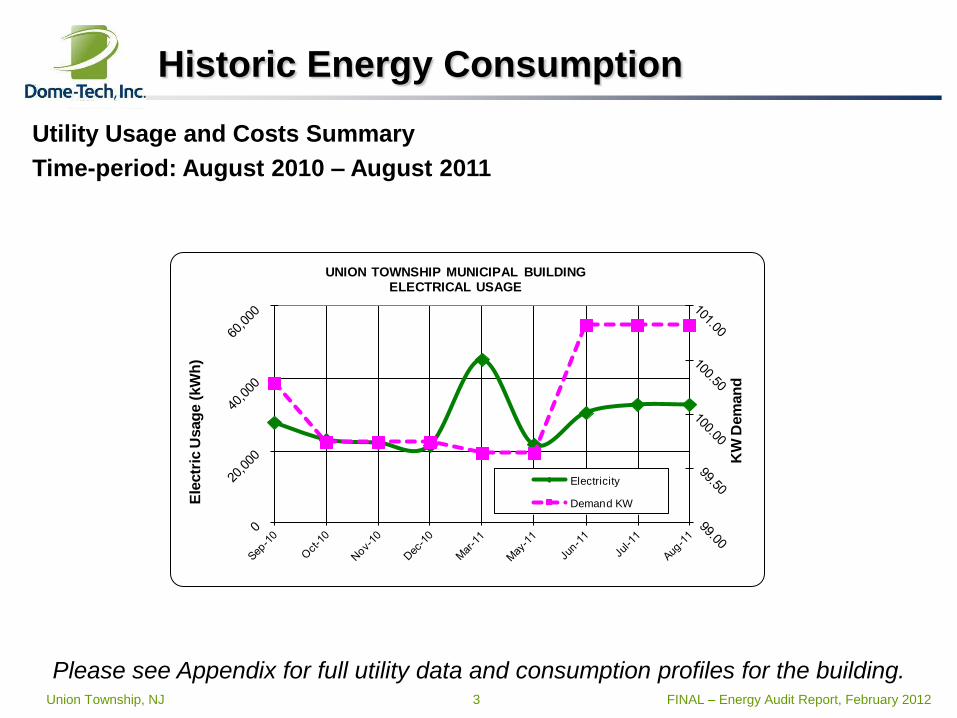
Utility Usage and Costs Summary
Time-period: August 2010 – August 2011
Please see Appendix for full utility data and consumption profiles for the building.
KW
Dem
an
d
Ele
ctr
ic U
sag
e (
kW
h)
UNION TOWNSHIP MUNICIPAL BUILDING ELECTRICAL USAGE
Electricity
Demand KW
Union Township, NJ 4 FINAL – Energy Audit Report, February 2012
Historic Energy Consumption
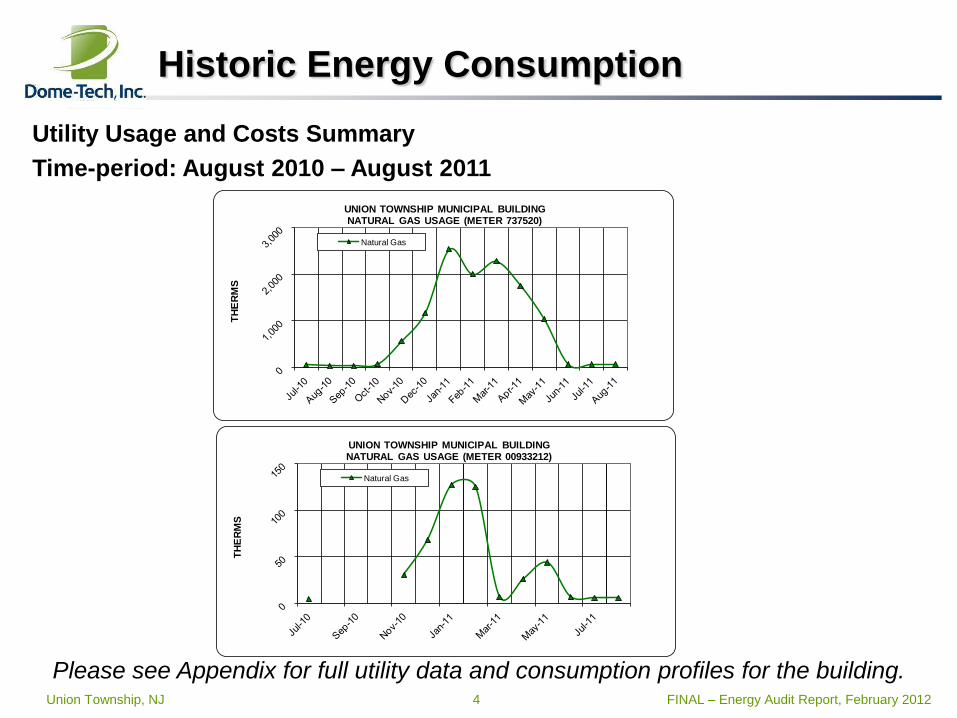
Utility Usage and Costs Summary
Time-period: August 2010 – August 2011
Please see Appendix for full utility data and consumption profiles for the building.
TH
ER
MS
UNION TOWNSHIP MUNICIPAL BUILDINGNATURAL GAS USAGE (METER 737520)
Natural GasT
HE
RM
S
UNION TOWNSHIP MUNICIPAL BUILDINGNATURAL GAS USAGE (METER 00933212)
Natural Gas
Union Township, NJ 5 FINAL – Energy Audit Report, February 2012
Historic Energy Consumption
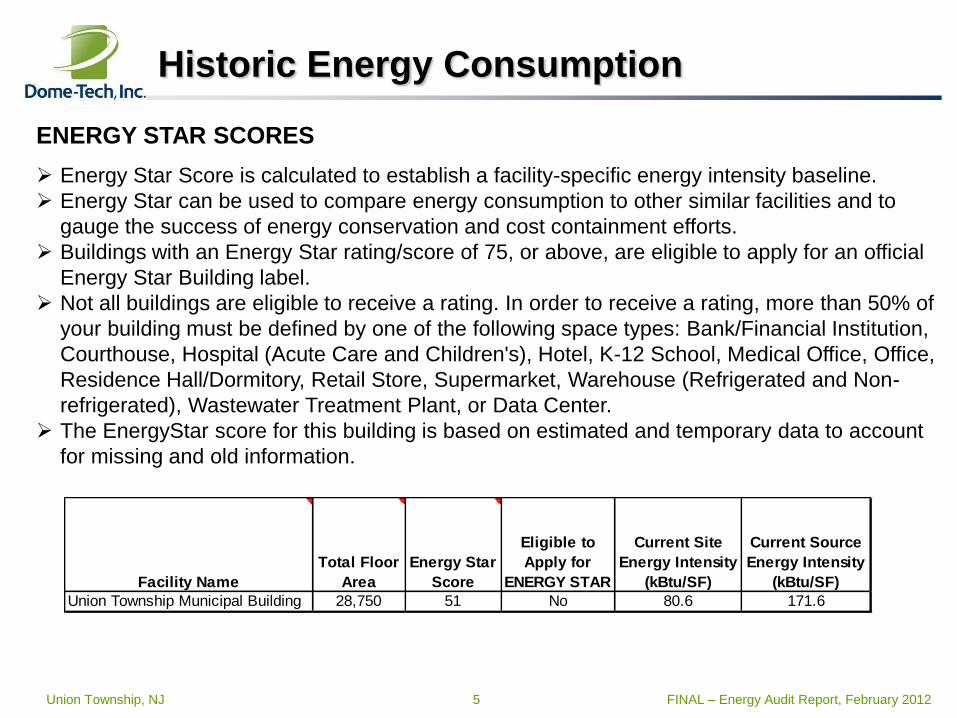
ENERGY STAR SCORES
Energy Star Score is calculated to establish a facility-specific energy intensity baseline.
Energy Star can be used to compare energy consumption to other similar facilities and to
gauge the success of energy conservation and cost containment efforts.
Buildings with an Energy Star rating/score of 75, or above, are eligible to apply for an official
Energy Star Building label.
Not all buildings are eligible to receive a rating. In order to receive a rating, more than 50% of
your building must be defined by one of the following space types: Bank/Financial Institution,
Courthouse, Hospital (Acute Care and Children's), Hotel, K-12 School, Medical Office, Office,
Residence Hall/Dormitory, Retail Store, Supermarket, Warehouse (Refrigerated and Non-
refrigerated), Wastewater Treatment Plant, or Data Center.
The EnergyStar score for this building is based on estimated and temporary data to account
for missing and old information.
Facility Name
Total Floor
Area
Energy Star
Score
Eligible to
Apply for
ENERGY STAR
Current Site
Energy Intensity
(kBtu/SF)
Current Source
Energy Intensity
(kBtu/SF)
Union Township Municipal Building 28,750 51 No 80.6 171.6
Union Township, NJ 6 FINAL – Energy Audit Report, February 2012
Historic Energy Consumption (continued)
Portfolio Manager Sign - In
An account has been created for the Township in Portfolio Manager. You will have
received an email to notify you of the generation of this account and shared access
with Dome-Tech. Please use this to read your facility information. Please feel free to
alter this information when the report is finalized. We would ask that you leave the
sign-in information alone until then. Your facility’s information is currently shared as
read only.
When the report is finalized the shared access will be changed so that you can use /
edit the information and change as you wish.
Website link to sign-in: https://www.energystar.gov/istar/pmpam/index.cfm?fuseaction=login.Login
Union Township, NJ 7 FINAL – Energy Audit Report, February 2012
Facility Information
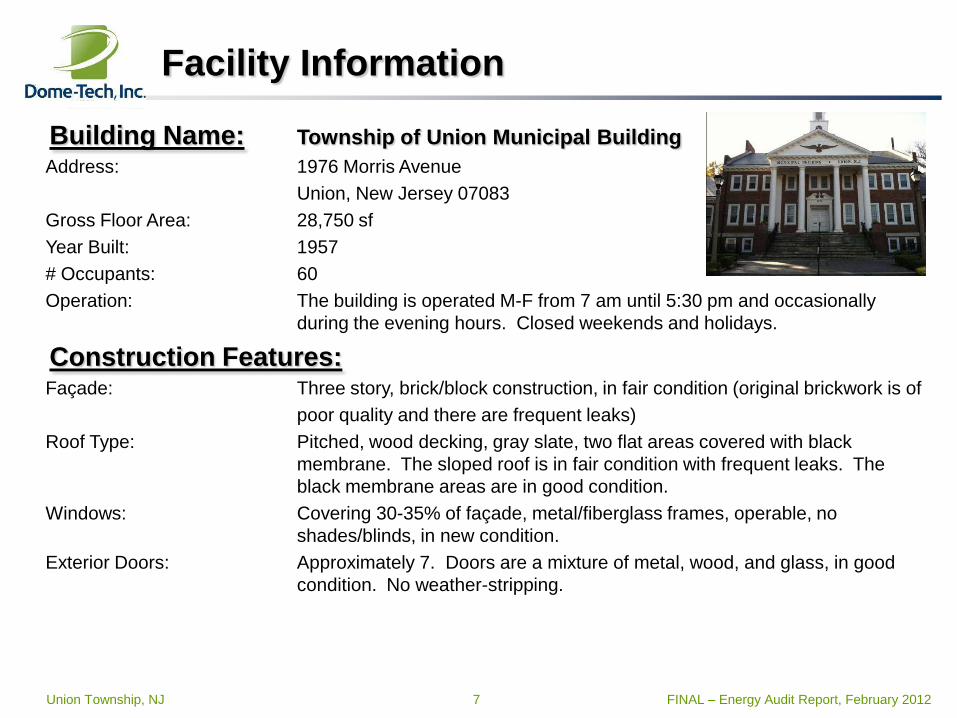
Building Name: Township of Union Municipal Building
Address: 1976 Morris Avenue
Union, New Jersey 07083
Gross Floor Area: 28,750 sf
Year Built: 1957
# Occupants: 60
Operation: The building is operated M-F from 7 am until 5:30 pm and occasionally
during the evening hours. Closed weekends and holidays.
Construction Features: Façade: Three story, brick/block construction, in fair condition (original brickwork is of
poor quality and there are frequent leaks)
Roof Type: Pitched, wood decking, gray slate, two flat areas covered with black
membrane. The sloped roof is in fair condition with frequent leaks. The
black membrane areas are in good condition.
Windows: Covering 30-35% of façade, metal/fiberglass frames, operable, no
shades/blinds, in new condition.
Exterior Doors: Approximately 7. Doors are a mixture of metal, wood, and glass, in good
condition. No weather-stripping.
Union Township, NJ 8 FINAL – Energy Audit Report, February 2012
Facility Information
Major Mechanical Systems Air Handlers / AC Systems / Ventilation Systems
Union Township has two (2) Air Handling units (AHUs) located in the basement mechanical room
The two primary AHUs are AC-1 which is a 40-ton direct expansion (DX) multi-zone unit serving the office spaces on all
three floors of the building and AC-2 is a 20-ton DX single-zone unit serving the Assembly area.
Supplemental units are used to serve the datacenter, telecom room and the accounts office.
Boilers
The building is heated by one(1) natural gas fired Pacific Steel hot water boiler which is over 50 years old. The hot water
system is a constant volume system with a three-way bypass valve maintaining a constant flow to the boiler.
Domestic Hot Water
The building’s domestic hot water is provided by an AO Smith, natural gas fired, domestic hot water heater, located in the
mechanical equipment room in the basement. It has a rated capacity of 74 gallons and an input of 80 kBTUh.
Controls
The two primary AHUs in the basement Mechanical Equipment Room (MER) as well as the boiler and hot water
distribution system are controlled by a hybrid DDC/pneumatic control system. Local supplemental ACs and fin tube
radiation are controlled by local thermostats. A handheld interface exists for this system, but is not in a useable state for
the facility personnel to access the system.
Union Township, NJ 9 FINAL – Energy Audit Report, February 2012
Greenhouse Gas Emission Reduction
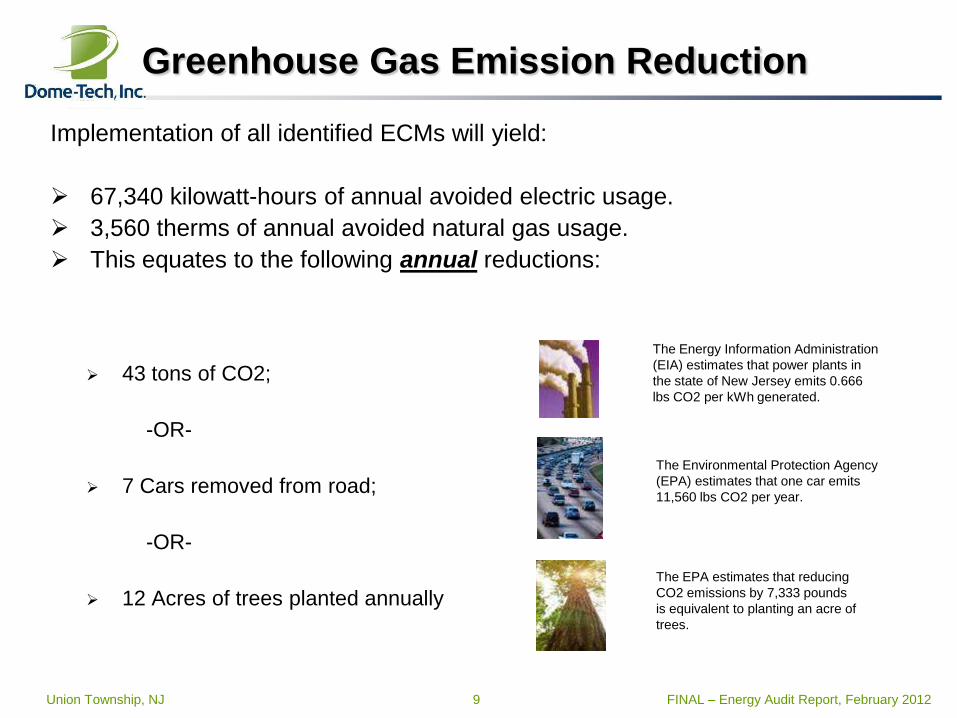
Implementation of all identified ECMs will yield:
67,340 kilowatt-hours of annual avoided electric usage.
3,560 therms of annual avoided natural gas usage.
This equates to the following annual reductions:
43 tons of CO2;
-OR-
7 Cars removed from road;
-OR-
12 Acres of trees planted annually
The Energy Information Administration
(EIA) estimates that power plants in
the state of New Jersey emits 0.666
lbs CO2 per kWh generated.
The Environmental Protection Agency
(EPA) estimates that one car emits
11,560 lbs CO2 per year.
The EPA estimates that reducing
CO2 emissions by 7,333 pounds
is equivalent to planting an acre of
trees.
Union Township, NJ 10 FINAL – Energy Audit Report, February 2012
Notes and Assumptions
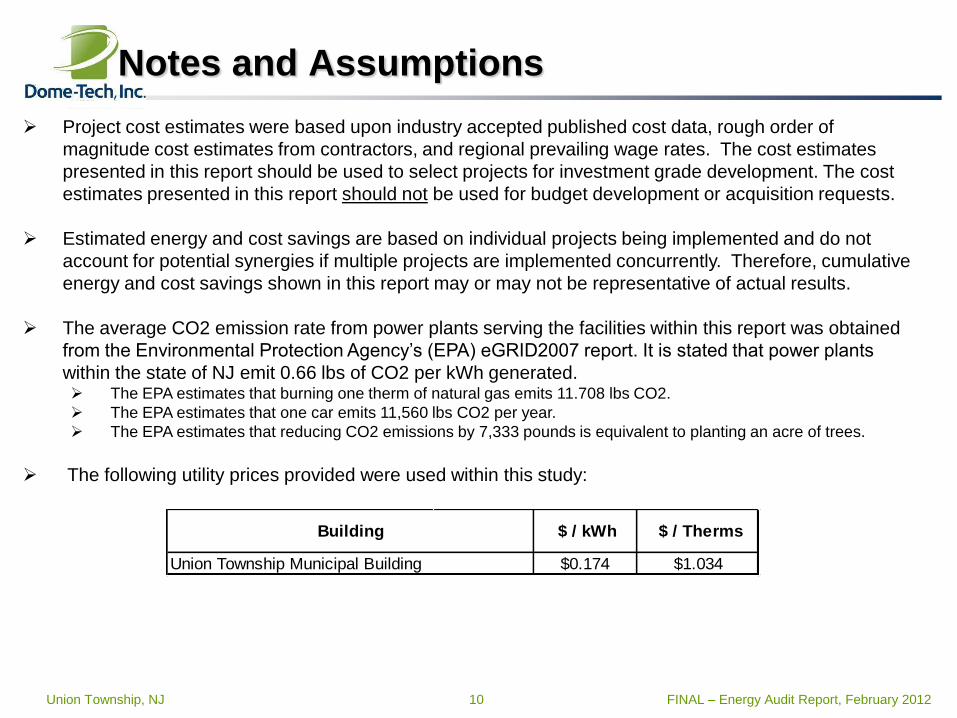
Project cost estimates were based upon industry accepted published cost data, rough order of
magnitude cost estimates from contractors, and regional prevailing wage rates. The cost estimates
presented in this report should be used to select projects for investment grade development. The cost
estimates presented in this report should not be used for budget development or acquisition requests.
Estimated energy and cost savings are based on individual projects being implemented and do not
account for potential synergies if multiple projects are implemented concurrently. Therefore, cumulative
energy and cost savings shown in this report may or may not be representative of actual results.
The average CO2 emission rate from power plants serving the facilities within this report was obtained
from the Environmental Protection Agency’s (EPA) eGRID2007 report. It is stated that power plants
within the state of NJ emit 0.66 lbs of CO2 per kWh generated. The EPA estimates that burning one therm of natural gas emits 11.708 lbs CO2.
The EPA estimates that one car emits 11,560 lbs CO2 per year.
The EPA estimates that reducing CO2 emissions by 7,333 pounds is equivalent to planting an acre of trees.
The following utility prices provided were used within this study:
$0.174 $1.034Union Township Municipal Building
Building $ / kWh $ / Therms
Union Township, NJ 11 FINAL – Energy Audit Report, February 2012
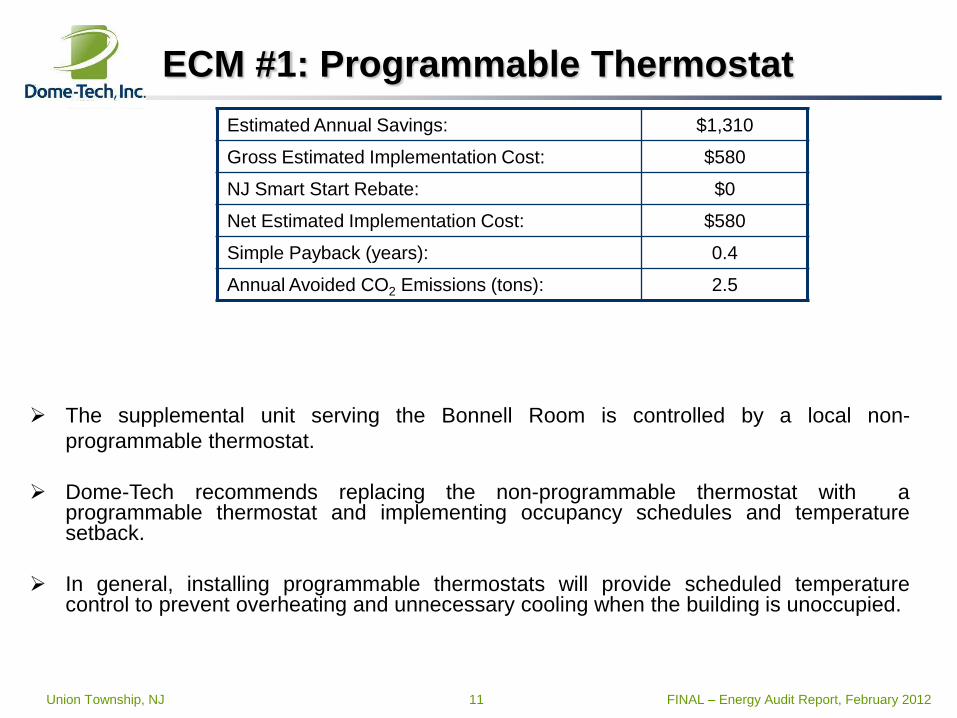
ECM #1: Programmable Thermostat
The supplemental unit serving the Bonnell Room is controlled by a local non-
programmable thermostat.
Dome-Tech recommends replacing the non-programmable thermostat with a programmable thermostat and implementing occupancy schedules and temperature setback.
In general, installing programmable thermostats will provide scheduled temperature control to prevent overheating and unnecessary cooling when the building is unoccupied.
Estimated Annual Savings: $1,310
Gross Estimated Implementation Cost: $580
NJ Smart Start Rebate: $0
Net Estimated Implementation Cost: $580
Simple Payback (years): 0.4
Annual Avoided CO2 Emissions (tons): 2.5
Union Township, NJ 12 FINAL – Energy Audit Report, February 2012
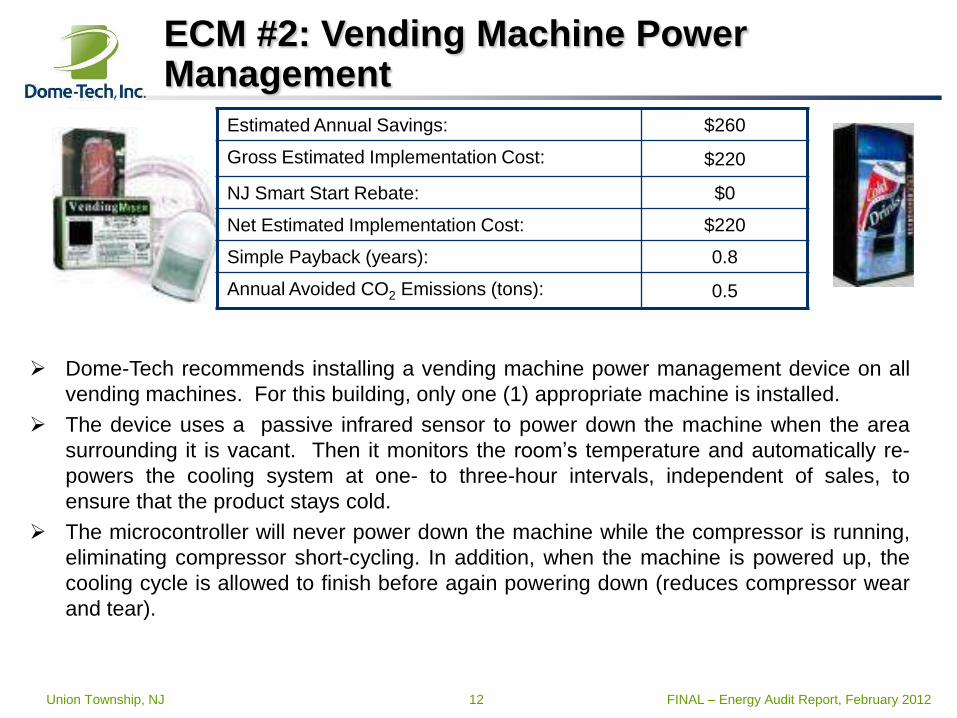
ECM #2: Vending Machine Power Management
Dome-Tech recommends installing a vending machine power management device on all
vending machines. For this building, only one (1) appropriate machine is installed.
The device uses a passive infrared sensor to power down the machine when the area
surrounding it is vacant. Then it monitors the room’s temperature and automatically re-
powers the cooling system at one- to three-hour intervals, independent of sales, to
ensure that the product stays cold.
The microcontroller will never power down the machine while the compressor is running,
eliminating compressor short-cycling. In addition, when the machine is powered up, the
cooling cycle is allowed to finish before again powering down (reduces compressor wear
and tear).
Estimated Annual Savings: $260
Gross Estimated Implementation Cost: $220
NJ Smart Start Rebate: $0
Net Estimated Implementation Cost: $220
Simple Payback (years): 0.8
Annual Avoided CO2 Emissions (tons): 0.5
Union Township, NJ 13 FINAL – Energy Audit Report, February 2012
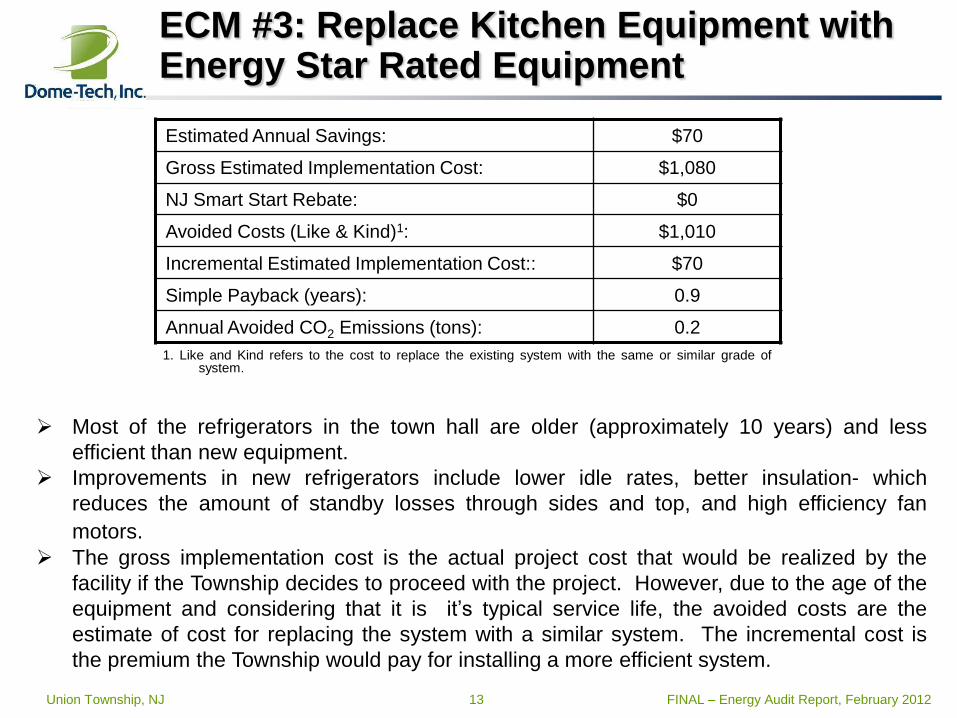
ECM #3: Replace Kitchen Equipment with Energy Star Rated Equipment
Most of the refrigerators in the town hall are older (approximately 10 years) and less
efficient than new equipment.
Improvements in new refrigerators include lower idle rates, better insulation- which
reduces the amount of standby losses through sides and top, and high efficiency fan
motors. The gross implementation cost is the actual project cost that would be realized by the
facility if the Township decides to proceed with the project. However, due to the age of the
equipment and considering that it is it’s typical service life, the avoided costs are the
estimate of cost for replacing the system with a similar system. The incremental cost is
the premium the Township would pay for installing a more efficient system.
Estimated Annual Savings: $70
Gross Estimated Implementation Cost: $1,080
NJ Smart Start Rebate: $0
Avoided Costs (Like & Kind)1: $1,010
Incremental Estimated Implementation Cost:: $70
Simple Payback (years): 0.9
Annual Avoided CO2 Emissions (tons): 0.2
1. Like and Kind refers to the cost to replace the existing system with the same or similar grade of system.
Union Township, NJ 14 FINAL – Energy Audit Report, February 2012
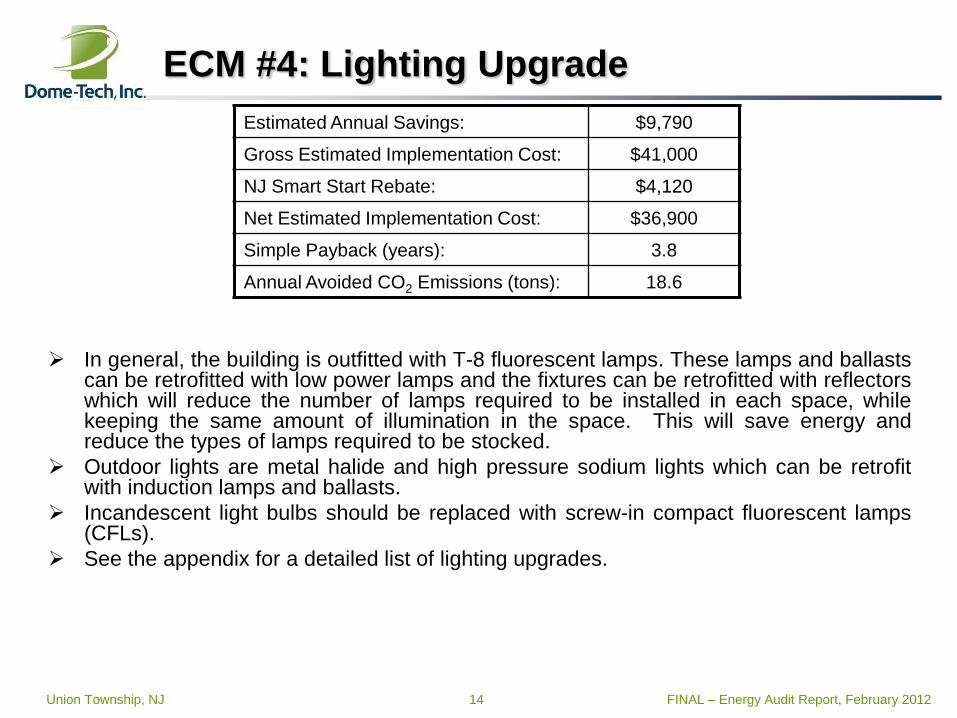
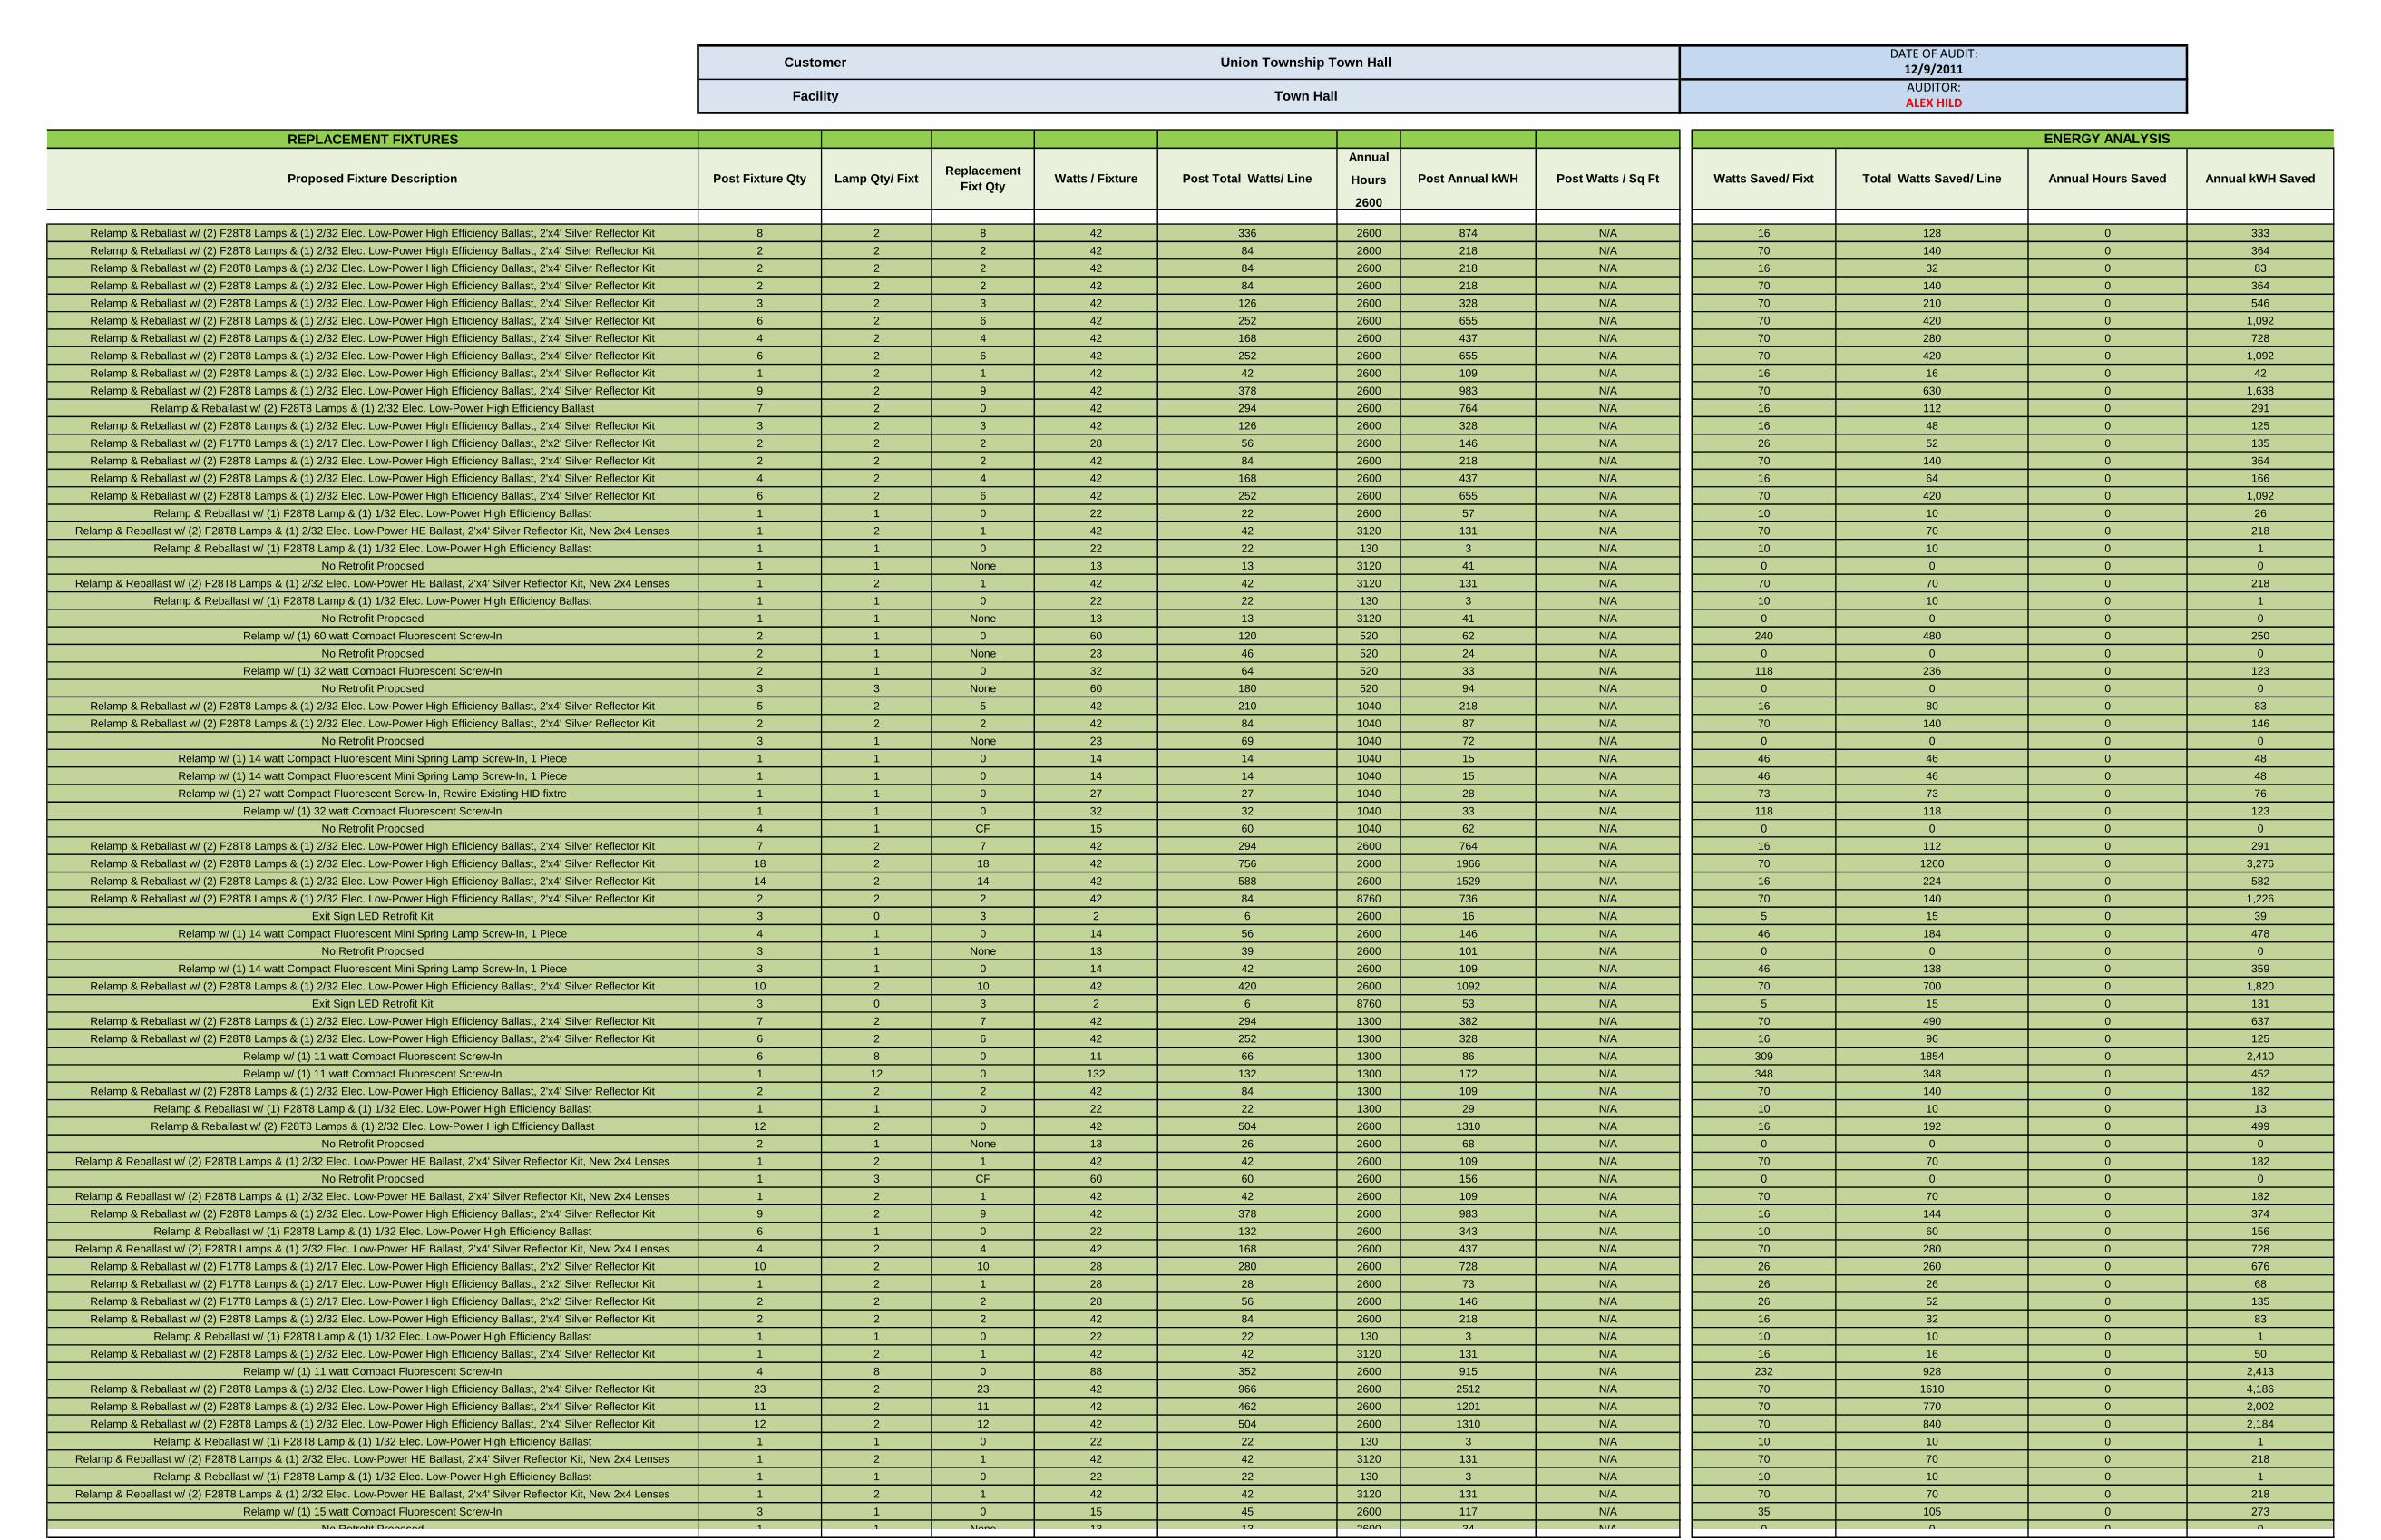
ECM #4: Lighting Upgrade
In general, the building is outfitted with T-8 fluorescent lamps. These lamps and ballasts can be retrofitted with low power lamps and the fixtures can be retrofitted with reflectors which will reduce the number of lamps required to be installed in each space, while keeping the same amount of illumination in the space. This will save energy and reduce the types of lamps required to be stocked.
Outdoor lights are metal halide and high pressure sodium lights which can be retrofit with induction lamps and ballasts.
Incandescent light bulbs should be replaced with screw-in compact fluorescent lamps (CFLs).
See the appendix for a detailed list of lighting upgrades.
Estimated Annual Savings: $9,790
Gross Estimated Implementation Cost: $41,000
NJ Smart Start Rebate: $4,120
Net Estimated Implementation Cost: $36,900
Simple Payback (years): 3.8
Annual Avoided CO2 Emissions (tons): 18.6
Union Township, NJ 15 FINAL – Energy Audit Report, February 2012
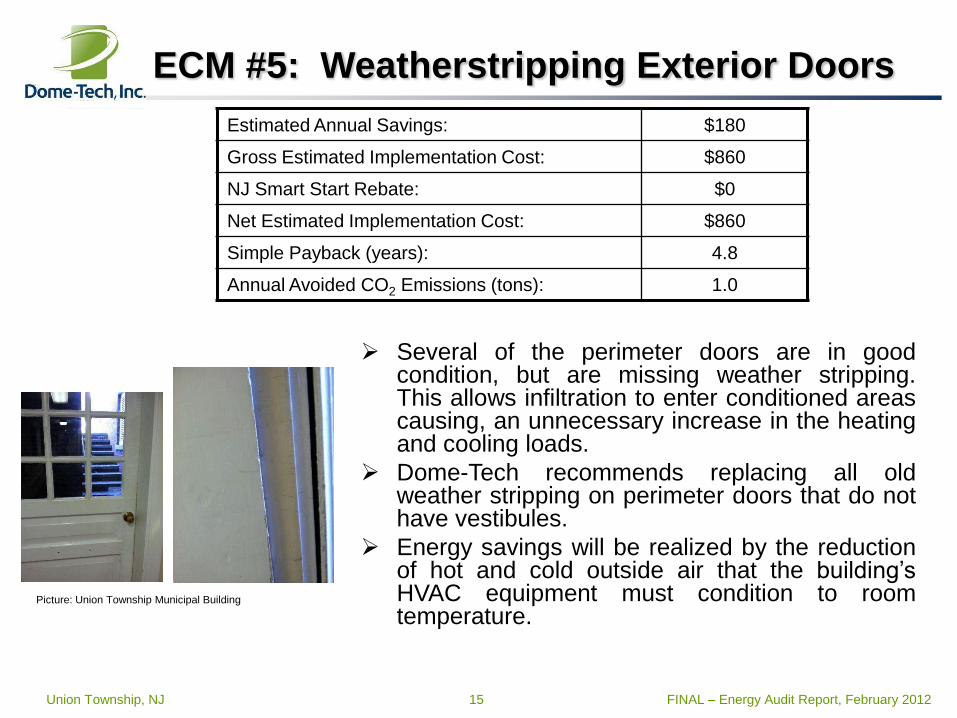
ECM #5: Weatherstripping Exterior Doors
Several of the perimeter doors are in good condition, but are missing weather stripping. This allows infiltration to enter conditioned areas causing, an unnecessary increase in the heating and cooling loads.
Dome-Tech recommends replacing all old weather stripping on perimeter doors that do not have vestibules.
Energy savings will be realized by the reduction of hot and cold outside air that the building’s HVAC equipment must condition to room temperature.
Picture: Union Township Municipal Building
Estimated Annual Savings: $180
Gross Estimated Implementation Cost: $860
NJ Smart Start Rebate: $0
Net Estimated Implementation Cost: $860
Simple Payback (years): 4.8
Annual Avoided CO2 Emissions (tons): 1.0
Union Township, NJ 16 FINAL – Energy Audit Report, February 2012
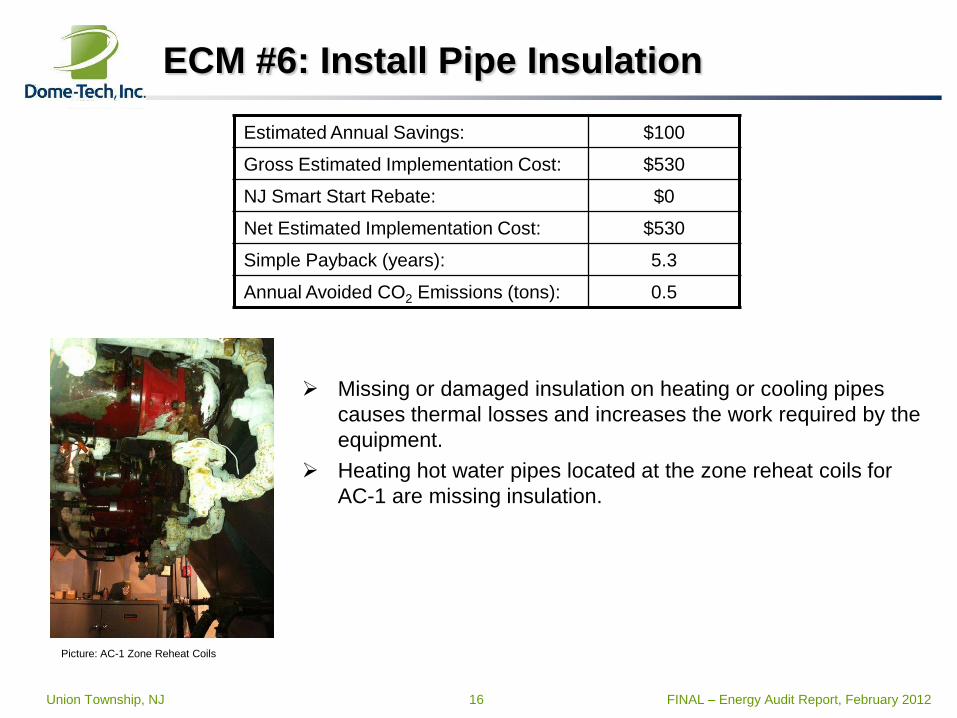
ECM #6: Install Pipe Insulation
Missing or damaged insulation on heating or cooling pipes
causes thermal losses and increases the work required by the
equipment.
Heating hot water pipes located at the zone reheat coils for
AC-1 are missing insulation.
Estimated Annual Savings: $100
Gross Estimated Implementation Cost: $530
NJ Smart Start Rebate: $0
Net Estimated Implementation Cost: $530
Simple Payback (years): 5.3
Annual Avoided CO2 Emissions (tons): 0.5
Picture: AC-1 Zone Reheat Coils
Union Township, NJ 17 FINAL – Energy Audit Report, February 2012
ECM #7: Hot Water Reset
A hot water reset program will reduce the temperature of the hot water
leaving the boiler during low load days. The decrease in hot temperature will
decrease the amount of heat lost through the distribution piping.
Connecting the boiler to a building management system and implementing a
temperature reset program will provide savings of over $100.
Estimated Annual Savings: $160
Gross Estimated Implementation Cost: $1,910
NJ Smart Start Rebate: $0
Net Estimated Implementation Cost: $1,910
Simple Payback (years): 11.9
Annual Avoided CO2 Emissions (tons): 0.9
Union Township, NJ 18 FINAL – Energy Audit Report, February 2012
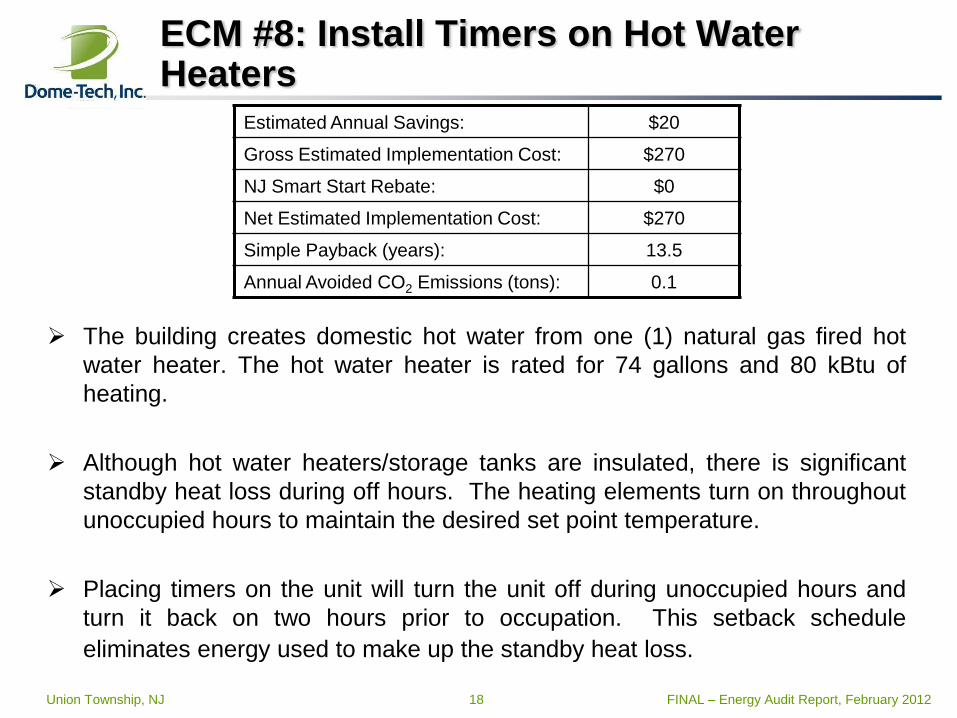
ECM #8: Install Timers on Hot Water Heaters
The building creates domestic hot water from one (1) natural gas fired hot
water heater. The hot water heater is rated for 74 gallons and 80 kBtu of
heating.
Although hot water heaters/storage tanks are insulated, there is significant
standby heat loss during off hours. The heating elements turn on throughout
unoccupied hours to maintain the desired set point temperature.
Placing timers on the unit will turn the unit off during unoccupied hours and
turn it back on two hours prior to occupation. This setback schedule
eliminates energy used to make up the standby heat loss.
Estimated Annual Savings: $20
Gross Estimated Implementation Cost: $270
NJ Smart Start Rebate: $0
Net Estimated Implementation Cost: $270
Simple Payback (years): 13.5
Annual Avoided CO2 Emissions (tons): 0.1
Union Township, NJ 19 FINAL – Energy Audit Report, February 2012
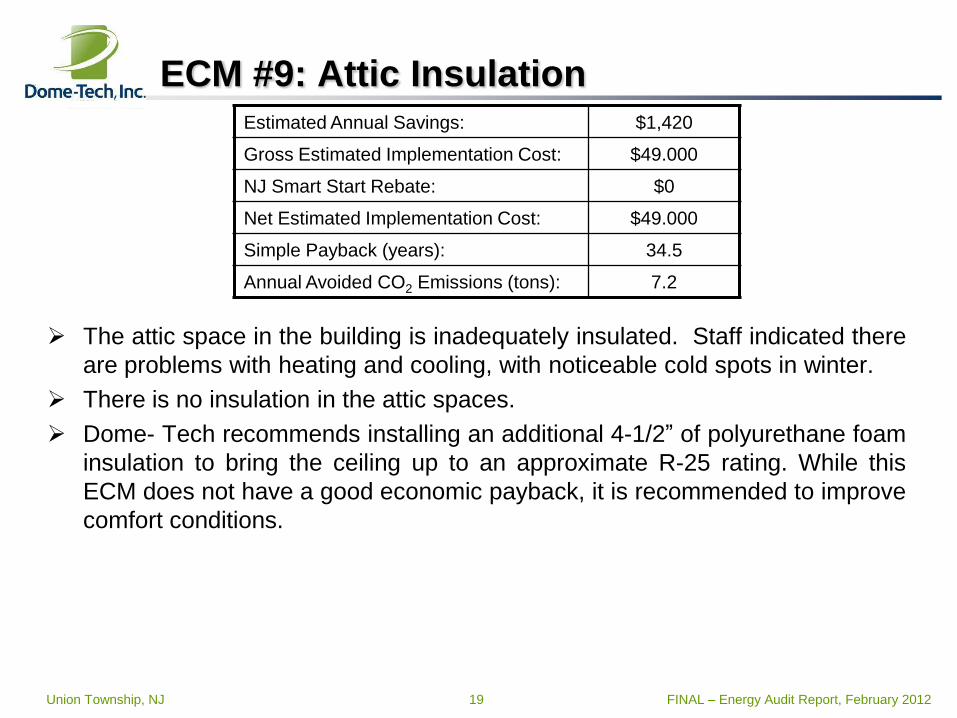
ECM #9: Attic Insulation
The attic space in the building is inadequately insulated. Staff indicated there
are problems with heating and cooling, with noticeable cold spots in winter.
There is no insulation in the attic spaces.
Dome- Tech recommends installing an additional 4-1/2” of polyurethane foam
insulation to bring the ceiling up to an approximate R-25 rating. While this
ECM does not have a good economic payback, it is recommended to improve
comfort conditions.
Estimated Annual Savings: $1,420
Gross Estimated Implementation Cost: $49.000
NJ Smart Start Rebate: $0
Net Estimated Implementation Cost: $49.000
Simple Payback (years): 34.5
Annual Avoided CO2 Emissions (tons): 7.2
Union Township, NJ 20 FINAL – Energy Audit Report, February 2012
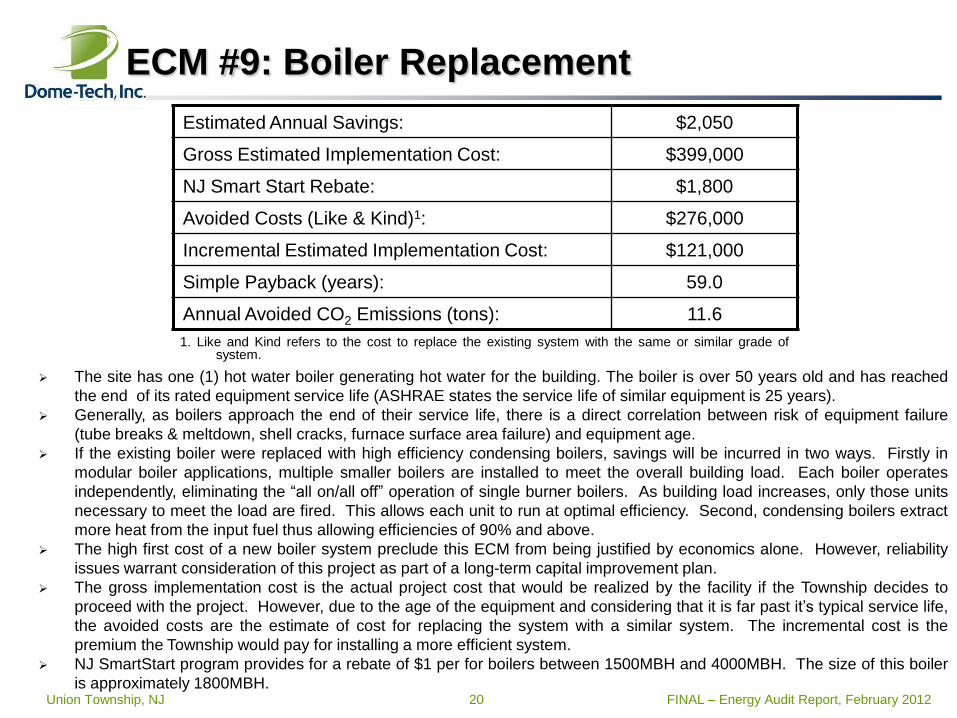
ECM #9: Boiler Replacement
The site has one (1) hot water boiler generating hot water for the building. The boiler is over 50 years old and has reached
the end of its rated equipment service life (ASHRAE states the service life of similar equipment is 25 years).
Generally, as boilers approach the end of their service life, there is a direct correlation between risk of equipment failure
(tube breaks & meltdown, shell cracks, furnace surface area failure) and equipment age.
If the existing boiler were replaced with high efficiency condensing boilers, savings will be incurred in two ways. Firstly in
modular boiler applications, multiple smaller boilers are installed to meet the overall building load. Each boiler operates
independently, eliminating the “all on/all off” operation of single burner boilers. As building load increases, only those units
necessary to meet the load are fired. This allows each unit to run at optimal efficiency. Second, condensing boilers extract
more heat from the input fuel thus allowing efficiencies of 90% and above.
The high first cost of a new boiler system preclude this ECM from being justified by economics alone. However, reliability
issues warrant consideration of this project as part of a long-term capital improvement plan.
The gross implementation cost is the actual project cost that would be realized by the facility if the Township decides to
proceed with the project. However, due to the age of the equipment and considering that it is far past it’s typical service life,
the avoided costs are the estimate of cost for replacing the system with a similar system. The incremental cost is the
premium the Township would pay for installing a more efficient system.
NJ SmartStart program provides for a rebate of $1 per for boilers between 1500MBH and 4000MBH. The size of this boiler
is approximately 1800MBH.
Estimated Annual Savings: $2,050
Gross Estimated Implementation Cost: $399,000
NJ Smart Start Rebate: $1,800
Avoided Costs (Like & Kind)1: $276,000
Incremental Estimated Implementation Cost: $121,000
Simple Payback (years): 59.0
Annual Avoided CO2 Emissions (tons): 11.6
1. Like and Kind refers to the cost to replace the existing system with the same or similar grade of system.
Union Township, NJ 21 FINAL – Energy Audit Report, February 2012
Renewable/Distributed Energy Measures
Distributed Generation & Renewable Energy
Distributed Generation (on-site generation) generates electricity from many
small energy sources. These sources can be renewable (solar/wind/geothermal) or can be small scale power generation technologies (CHP, fuel cells, microturbines).
Renewable energy is energy generated from natural resources (sunlight, wind, and underground geothermal heat) which are naturally replenished
Wind power is growing as well, mostly in Europe and the U.S.
Union Township, NJ 22 FINAL – Energy Audit Report, February 2012
Renewable Energy Technologies: Wind
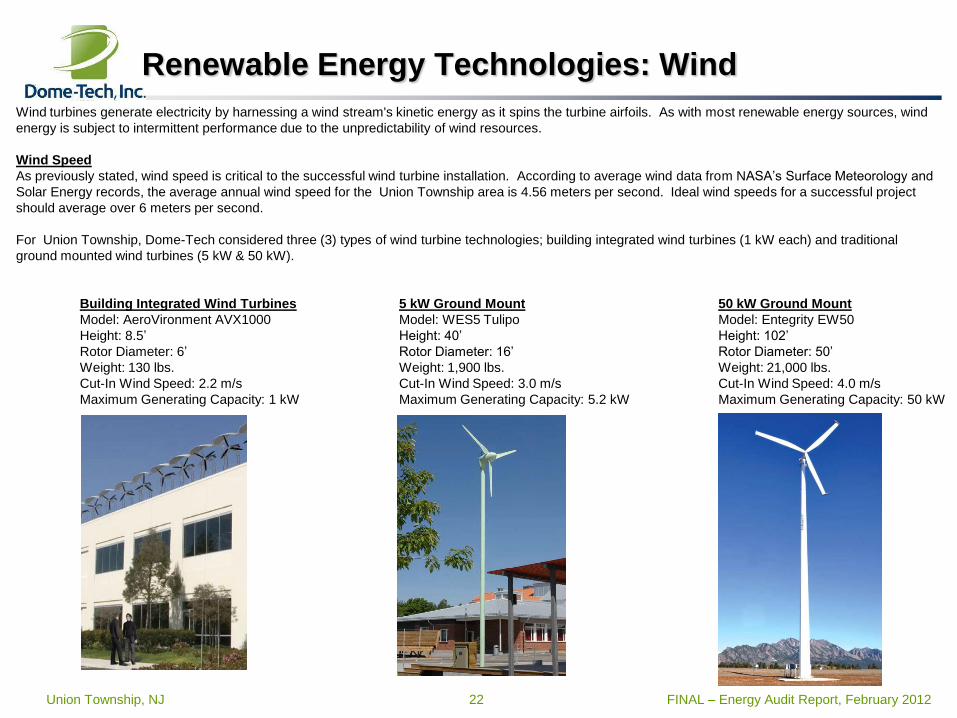
Wind turbines generate electricity by harnessing a wind stream's kinetic energy as it spins the turbine airfoils. As with most renewable energy sources, wind
energy is subject to intermittent performance due to the unpredictability of wind resources.
Wind Speed
As previously stated, wind speed is critical to the successful wind turbine installation. According to average wind data from NASA’s Surface Meteorology and
Solar Energy records, the average annual wind speed for the Union Township area is 4.56 meters per second. Ideal wind speeds for a successful project
should average over 6 meters per second.
For Union Township, Dome-Tech considered three (3) types of wind turbine technologies; building integrated wind turbines (1 kW each) and traditional
ground mounted wind turbines (5 kW & 50 kW).
Building Integrated Wind Turbines
Model: AeroVironment AVX1000
Height: 8.5’
Rotor Diameter: 6’
Weight: 130 lbs.
Cut-In Wind Speed: 2.2 m/s
Maximum Generating Capacity: 1 kW
5 kW Ground Mount
Model: WES5 Tulipo
Height: 40’
Rotor Diameter: 16’
Weight: 1,900 lbs.
Cut-In Wind Speed: 3.0 m/s
Maximum Generating Capacity: 5.2 kW
50 kW Ground Mount
Model: Entegrity EW50
Height: 102’
Rotor Diameter: 50’
Weight: 21,000 lbs.
Cut-In Wind Speed: 4.0 m/s
Maximum Generating Capacity: 50 kW
Union Township, NJ 23 FINAL – Energy Audit Report, February 2012
Renewable Energy Technologies: Wind
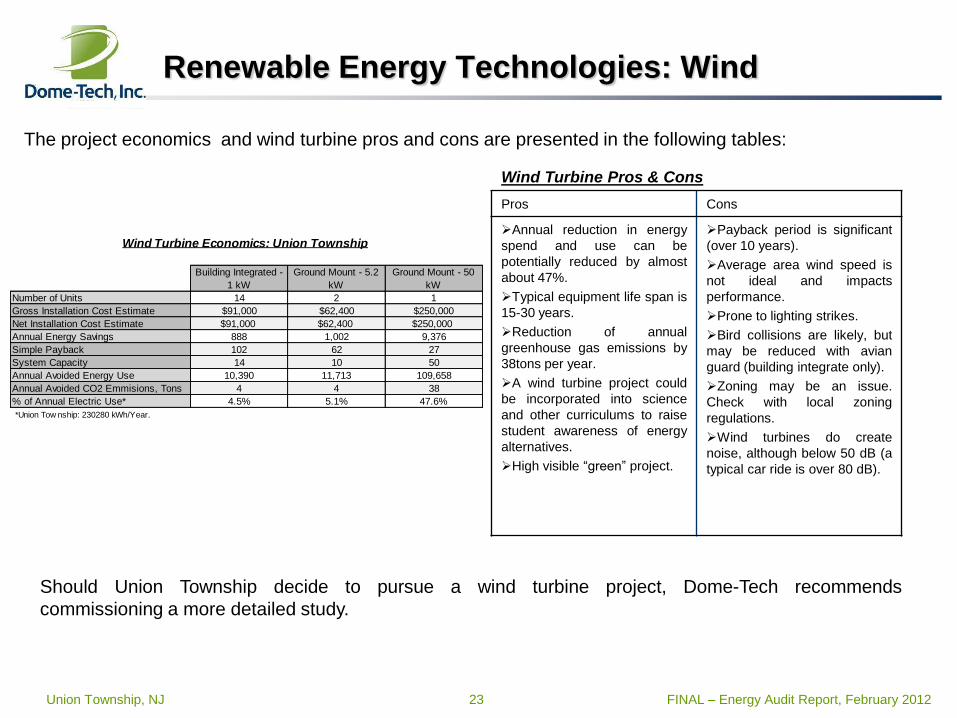
Wind Turbine Pros & Cons
Pros Cons
Annual reduction in energy
spend and use can be
potentially reduced by almost
about 47%.
Typical equipment life span is
15-30 years.
Reduction of annual
greenhouse gas emissions by
38tons per year.
A wind turbine project could
be incorporated into science
and other curriculums to raise
student awareness of energy
alternatives.
High visible “green” project.
Payback period is significant
(over 10 years).
Average area wind speed is
not ideal and impacts
performance.
Prone to lighting strikes.
Bird collisions are likely, but
may be reduced with avian
guard (building integrate only).
Zoning may be an issue.
Check with local zoning
regulations.
Wind turbines do create
noise, although below 50 dB (a
typical car ride is over 80 dB).
The project economics and wind turbine pros and cons are presented in the following tables:
Should Union Township decide to pursue a wind turbine project, Dome-Tech recommends
commissioning a more detailed study.
Building Integrated -
1 kW
Ground Mount - 5.2
kW
Ground Mount - 50
kW
Number of Units 14 2 1
Gross Installation Cost Estimate $91,000 $62,400 $250,000
Net Installation Cost Estimate $91,000 $62,400 $250,000
Annual Energy Savings 888 1,002 9,376
Simple Payback 102 62 27
System Capacity 14 10 50
Annual Avoided Energy Use 10,390 11,713 109,658
Annual Avoided CO2 Emmisions, Tons 4 4 38
% of Annual Electric Use* 4.5% 5.1% 47.6%
*Union Tow nship: 230280 kWh/Year.
Wind Turbine Economics: Union Township
Union Township, NJ 24 FINAL – Energy Audit Report, February 2012
Renewable Energy Technologies: Solar Photovoltaic
Solar Photovoltaic
Sunlight can be converted into electricity using photovoltaics (PV).
A solar cell or photovoltaic cell is a device that converts sunlight directly into electricity.
Photons in sunlight hit the solar panel and are absorbed by semiconducting materials, such as silicon. Electrons are knocked loose from their atoms, allowing them to flow through the material to produce electricity.
Solar cells are often electrically connected and encapsulated as a module, in series, creating an additive voltage. The modules are connected in an array. The power output of an array is measured in watts or kilowatts, and typical energy needs are measured in kilowatt-hours.
This system application can be considered for potential placement on additional buildings or areas such in parking lots, in overhead mounting.
This is not recommended for Union Township due to an abundance of shading and the difficulty of installing on pitched roofs.
Union Township, NJ 25 FINAL – Energy Audit Report, February 2012
Renewable Energy Technologies: CHP/Cogeneration
CHP (combined heat and power), or cogeneration, is the use of a heat
engine to simultaneously generate both electricity and useful heat.
Fuel Cells are electrochemical conversion devices that operate by catalysis, separation the protons and the electrons of the reactant fuel, and forcing the electrons to travel through a circuit to produce electricity. The catalyst is typically a platinum group metal or alloy. Another catalytic process takes the electrons back in, combining them with the protons and oxidant, producing waste products (usually water and carbon dioxide).
Microturbines are rotary engines that extract energy from a flow of combustion gas. They can be used with absorption chillers to provide cooling through waste heat rather than electricity. Microturbines are
best suited for facilities with year-round thermal and/or cooling loads. Not recommended for Union Township Municipal Building.
Union Township, NJ 26 FINAL – Energy Audit Report, February 2012
Retail Energy Purchasing: Recommendations
Electric
For the period studied, Union Township was utilizing a Third Party Supplier for electricity. Supplier bills were not
provided therefore Dome-Tech is unable to include contract details in this report.
Dome-Tech recommends the Township continue or develop a procurement strategy because there is an
opportunity to save money by switching to an electricity supplier versus paying the BGS default rate to the utility.
Currently, typical savings can be in the 5-15% range.
Natural Gas
For the period studied, Union Township was utilizing Pepco Energy Services as a Third Party Supplier for natural
gas at a fixed rate of $0.74 per therm.
If the Township is seeking budget certainty or would like to reduce their market exposure for Natural Gas, the
Township should continue with a fixed price contract with a supplier or joining a purchasing co-operative and
developing a procurement strategy.
Energy Purchasing Co-Operatives
Many public entities participate in various energy aggregation buying groups. Sometimes, an entity will have
multiple options to choose from. These might include purchasing through a County co-operative, or purchasing
through a trade-type association like ACES. Co-operative purchasing may not necessarily get you the lowest
rates; however, there is often substantial volume, and it can represent a good alternative for entities with limited
energy consumption who can have a difficult time getting energy suppliers to respond to them on a direct, singular
basis.
Union Township, NJ 27 FINAL – Energy Audit Report, February 2012
Utility Tariff and Rate Review: Electricity
Accounts and Rate Class: Union Township has one facility with one main electric account
with service behind Public Service Electric and Gas Company under rate class General
Lighting and Power (GLP).
Electric Consumption and Cost: Based on the one-year period studied, the total annual
electric expenditure for the Township is about $19,000 and the total annual consumption is
about 230,000 kilowatt-hours (kWh).
Average/Effective Rate per kWh: For the one year period studied, the Township's average
monthly cost per kilowatt-hour ranged from 16 ¢/kWh to 19 ¢/kWh, inclusive of utility delivery
charges. The Township’s overall, average cost per kilowatt-hour during this period was 17.4
¢/kWh (Supplier bills were not provided, therefore actual costs my vary).
o Note that these average electric rates are “all–inclusive”; that is, they include all supply service
(generation and commodity-related) charges, as well as all delivery service charges. The supply
service charges typically represent the majority (60-80%) of the total monthly bill. It is the supply
portion of your bill that is deregulated, which is discussed on subsequent slides in this section.
Union Township, NJ 28 FINAL – Energy Audit Report, February 2012
Utility Tariff and Rate Review: Natural Gas
Accounts and Rate Class: Union Township has one facility with two natural gas accounts
with service behind Elizabethtown Gas. The rate class was not listed on the utility bill.
Natural Gas Consumption and Cost: Based on the one-year period studied, the total
annual natural gas expenditure for the Township is about $12,600 and the total annual
consumption is about 12,200 therms. Natural gas is used mostly in the winter period for
heating purposes.
Average/Effective Rate per Therm: For the one year period studied, the Township’s overall,
average cost per therm during this period was $1.251 per therm.
o Note that these average natural gas rates are “all–inclusive”; that is, they include all supply service
(interstate transportation and commodity-related) charges, as well as all delivery service charges. The
supply service charges typically represent the majority (60-80%) of the total monthly bill. It is the supply
portion of your bill that is deregulated, which is discussed on subsequent slides in this section.
Union Township, NJ 29 FINAL – Energy Audit Report, February 2012
Utility Deregulation in New Jersey: Background and Retail Energy Purchasing
In August 2003, per the Electric Discount and Energy Competition Act [N.J.S.A. 48:3-49], the
State of New Jersey deregulated its electric marketplace thus making it possible for customers
to shop for a third-party (someone other than the utility) supplier of retail electricity.
Per this process, every single electric account for every customer in New Jersey was placed
into one of two categories: BGS-FP or BGS-CIEP. BGS-FP stands for Basic Generation
Service-Fixed Price; BGS-CIEP stands for Basic Generation Service-Commercial and
Industrial Energy Pricing.
At its first pass, this categorization of accounts was based on rate class. The largest electric
accounts in the State (those served under a Primary or a Transmission-level rate class) were
moved into BGS-CIEP pricing. All other accounts (the vast majority of accounts in the State of
New Jersey, including residential) were placed in the BGS-FP category, receiving default
electric supply service from the utility.
The New Jersey Board of Public Utilities (NJBPU) has continued to move new large energy
users from the BGS-FP category into the BGS-CIEP category by lowering the demand (kW)
threshold for electric accounts receiving Secondary service. Several years ago, this threshold
started at 1,500kW; now, it has come down to 1,000 kW. So, if an account’s “peak load share”
(as assigned by the utility) is less than 1,000 kW, then that facility/account is in the BGS-FP
category. If you are unsure, you may contact Dome-tech for assistance.
Union Township, NJ 30 FINAL – Energy Audit Report, February 2012
Utility Deregulation in New Jersey: Background and Retail Energy Purchasing
There are at least 3 important differentiating factors to note about each rate category:
1. The rate structure for BGS-FP accounts and for BGS-CIEP accounts varies.
2. The “do-nothing” option (i.e., what happens when you don’t shop for retail energy) varies.
3. The decision about whether, and why, to shop for a retail provider varies.
Secondary (small to medium) Electric Accounts:
BGS-FP rate schedules for all utilities are set, and re-set, each year. Per the results of our State’s BGS
Auction process, held each February, new utility default rates go into effect every year on June 1st. The
BGS-FP rates become each customer’s default rates, and they dictate a customer’s “Price to Compare”
(benchmark) for shopping purposes. To learn more about the BGS Auction process, please go to
www.bgs-auction.com.
A customer’s decision about whether to buy energy from a retail energy supplier is, therefore, dependent
upon whether a supplier can offer rates that are lower than the utility’s (default) Price to Compare. In
2009, and for the first time in several years, many BGS-FP customers have “switched” from the utility to
a retail energy supplier because there have been savings. This may be the same case in 2010.
Primary (large) Electric Accounts:
The BGS-CIEP category is quite different. There are two main features to note about BGS-CIEP
accounts that do not switch to a retail supplier for service. The first is that they pay an hourly market
rate for energy; the second is that these accounts also pay a “retail margin adder” of $0.0053/kWh. For
these large accounts, this retail adder can amount to tens of thousands of dollars. The adder is
eliminated when a customer switches to a retail supplier for service.
For BGS-CIEP accounts, the retail adder makes a customer’s decision about whether to switch
relatively simple. However, the process of setting forth a buying strategy can be complex, which is why
many public entities seek professional assistance when shopping for energy.
For more information concerning hourly electric market prices for our region, please refer to
www.pjm.com.
Union Township, NJ 31 FINAL – Energy Audit Report, February 2012
Utility Deregulation in New Jersey: Background and Retail Energy Purchasing
Natural Gas Accounts:
The natural gas market in New Jersey is also deregulated. Unlike the electric market, there are no
“penalties”, or “adders”, for not shopping for natural gas. Most customers that remain with the utility for
natural gas service pay rates that are market-based and that fluctuate on a monthly basis. While natural
gas is a commodity that is exceptionally volatile and that is traded minute-by-minute during open trading
sessions, market rates are “settled” each month, 3 business days prior to the subsequent month (this is
called the “prompt month”). Customers that do not shop for a natural gas supplier will typically pay this
monthly settlement rate to the utility, plus other costs that are necessary to bring gas from Louisiana up
to New Jersey and ultimately to your facility.
For additional information about natural gas trading and current market futures rates for various
commodities, you can refer to www.nymex.com.
A customer’s decision about whether to buy natural gas from a retail supplier is typically dependent
upon whether a customer seeks budget certainty and/or longer-term rate stability. Customers can
secure longer-term fixed prices by enlisting a retail natural gas supplier. Many larger natural gas
customers also seek the assistance of a professional consultant to assist in their procurement process.
Union Township, NJ 32 FINAL – Energy Audit Report, February 2012
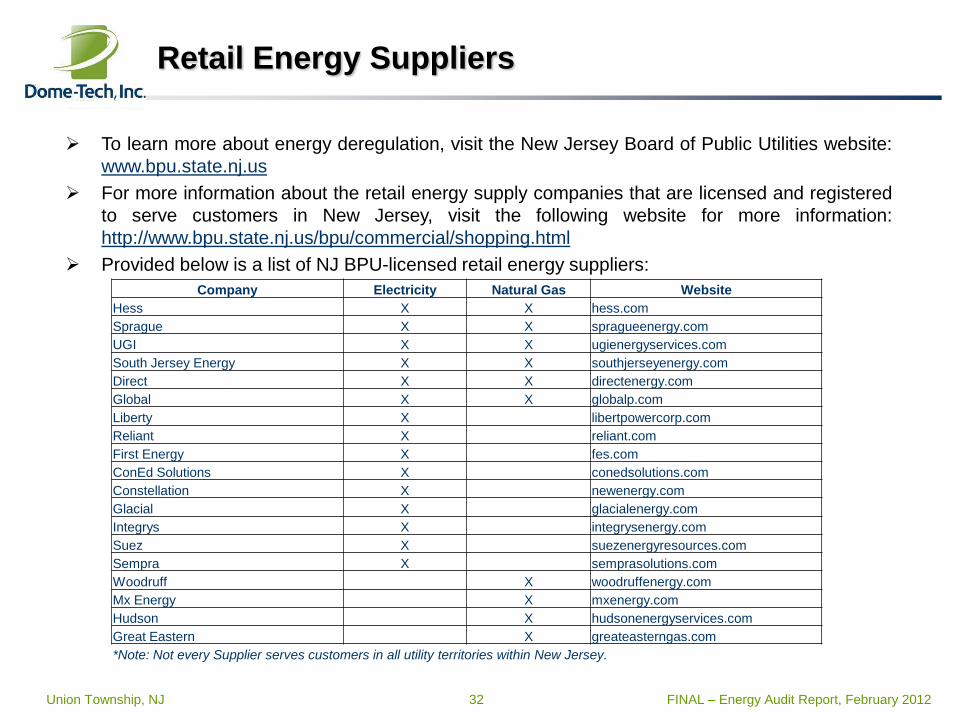
Retail Energy Suppliers
To learn more about energy deregulation, visit the New Jersey Board of Public Utilities website:
www.bpu.state.nj.us
For more information about the retail energy supply companies that are licensed and registered
to serve customers in New Jersey, visit the following website for more information:
http://www.bpu.state.nj.us/bpu/commercial/shopping.html
Provided below is a list of NJ BPU-licensed retail energy suppliers:
Company Electricity Natural Gas Website
Hess X X hess.com
Sprague X X spragueenergy.com
UGI X X ugienergyservices.com
South Jersey Energy X X southjerseyenergy.com
Direct X X directenergy.com
Global X X globalp.com
Liberty X libertpowercorp.com
Reliant X reliant.com
First Energy X fes.com
ConEd Solutions X conedsolutions.com
Constellation X newenergy.com
Glacial X glacialenergy.com
Integrys X integrysenergy.com
Suez X suezenergyresources.com
Sempra X semprasolutions.com
Woodruff X woodruffenergy.com
Mx Energy X mxenergy.com
Hudson X hudsonenergyservices.com
Great Eastern X greateasterngas.com
*Note: Not every Supplier serves customers in all utility territories within New Jersey.
Union Township, NJ 33 FINAL – Energy Audit Report, February 2012
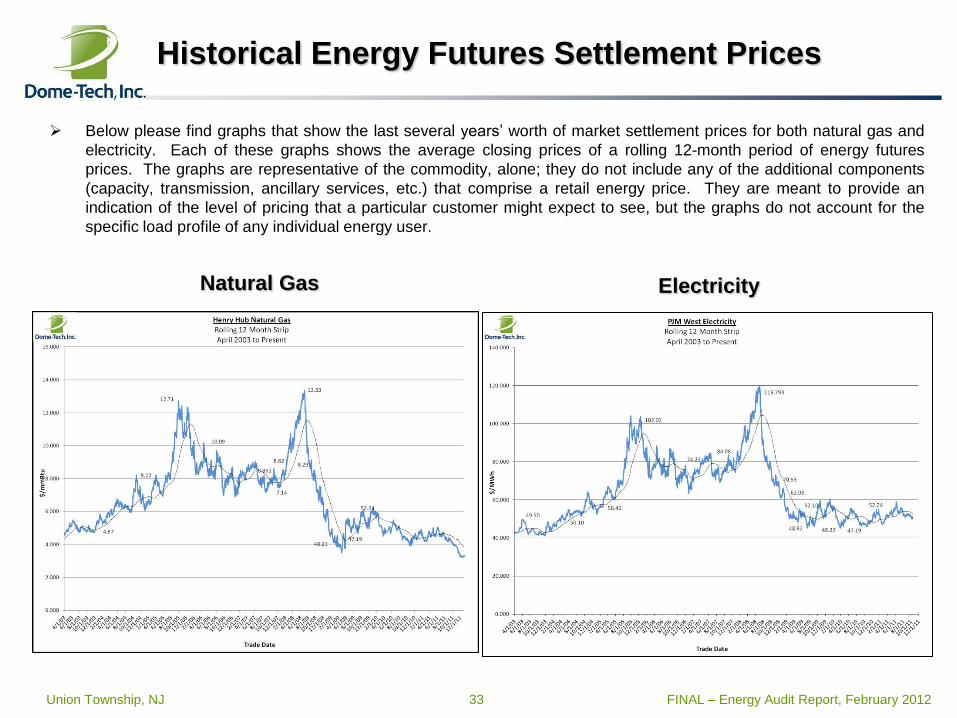
Historical Energy Futures Settlement Prices
Below please find graphs that show the last several years’ worth of market settlement prices for both natural gas and
electricity. Each of these graphs shows the average closing prices of a rolling 12-month period of energy futures
prices. The graphs are representative of the commodity, alone; they do not include any of the additional components
(capacity, transmission, ancillary services, etc.) that comprise a retail energy price. They are meant to provide an
indication of the level of pricing that a particular customer might expect to see, but the graphs do not account for the
specific load profile of any individual energy user.
Natural Gas Electricity
Union Township, NJ 34 FINAL – Energy Audit Report, February 2012
Operation and Maintenance (O&M): Measure #01
Control System Installation
Issue: The existing controls at the Municipal Building are old and in poor repair but are operational.
Facility personnel do not have the ability to monitor or adjust the system.
Impact: A full direct digital control (DDC) will allow for better monitoring and control of the building by
providing real-time feedback, historical trending and ease of use for setpoint adjustment and scheduling
changes.
Recommendation: Due to a high cost, Dome-Tech does not recommend this measure, but the
Township may wish to consider it for operational reasons. Dome-Tech’s estimate of cost for this
measure is $318,300.
Union Township, NJ 35 FINAL – Energy Audit Report, February 2012
Potential Project Funding Sources
Through the NJ Clean Energy program, the New Jersey Board of Public Utilities currently
offers a variety of subsidies or rebates for many of the project types outlined in this report.
More detailed information can be found at: www.njcleanenergy.com
NJ Smart Start Buildings – Equipment Rebates noted in ECMs where available. Equipment Rebates - Water Heaters, Lighting, Lighting Controls/Sensors, Chillers, Boilers, Heat
pumps, Air conditioners, Energy Mgmt. Systems/Building Controls, Motors, Motor-ASDs/VSDs,
Custom/Others http://www.njcleanenergy.com/commercial-industrial/programs/nj-smartstart-
buildings/nj-smartstart-buildings
Pay for Performance Program – Performance-Based Incentives for installations.
Provides up to 50% of total project costs. Based on findings in this study, up to $76,000 in
incentives for project implementation could be provided under this program. A minimum
reduction target of 15% compared to baseline must be achieved. Energy modeling of building and
systems and energy reduction plan is required (incentives provided to pay for part of study costs.)
http://www.njcleanenergy.com/commercial-industrial/programs/pay-performance/existing-buildings
Energy Savings Improvement Program (ESIP) Public entities can contract with energy
saving companies in up to 20-year lease purchases enabling public entities to implement energy
conservation measures to their facilities and pay for the costs using the value of energy savings that
result from the improvements. The Energy Saving Companies (ESCO) would assist in bypassing large
upfront costs to the entity.
www.nj.gov/dca/lgs/lfns/09lfns/2009-11.doc
Union Township, NJ 36 FINAL – Energy Audit Report, February 2012
Potential Project Funding Sources (continued)
Direct Install Program – NJ Clean Energy makes the investment in energy efficiency upgrades by
initially covering 60% of the cost to install the recommended energy efficiency measures. If eligible, the
entity will pay ONLY 40% of the total cost to install the energy efficiency measures.
http://www.njcleanenergy.com/commercial-industrial/programs/direct-install
We encourage you to contact the program directly for further information
on this particular program for all the buildings
Steps to Participate for Buildings
1. CONTACT THE PARTICIPATING CONTRACTOR IN YOUR AREA
Identify the contractor assigned and trained to provide Direct Install services in the county where your project is located. Using the contact
information provided, call or email the Participating Contractor to discuss your project. The contractor will schedule an Energy Assessment and work
with you to complete the Program Application and Participation Agreement. If you’re unable to contact the Participating Contractor or have
questions, you may contact us at 866-NJSMART or send an e-mail to [email protected]..
2. REVIEW RESULTS
After the Energy Assessment, the contractor will review results with you, including what measures qualify and your share of the project cost.
3. DECIDE TO MOVE FORWARD
You will sign a Scope of Work document to proceed with implementation of qualifying measures.
4. ARRANGE INSTALLATION
You and the Participating Contractor will set a convenient start date for the installation.
5. CONFIRM INSTALLATION
Once the Participating Contractor completes the installation, you accept the work by signing a Project Completion Form. A program representative
will approve the project as complete.
6. COMPLETE TRANSACTION
You pay the Participating Contractor your share of the project cost and the program pays its share.
Union Township, NJ 37 FINAL – Energy Audit Report, February 2012
Potential Project Funding Sources (continued)
Clean Energy Solutions Capital Investment Loan/Grant The EDA offers up to $5 million in interest-free loans and grants to promote the concept of "going
green" in New Jersey. Under this program, scoring criteria based on the project's environmental and
economic development impact determines the percentage split of loan and grant awarded. Funding
can be used to purchase fixed assets, including real estate and equipment, for an end-use energy
efficiency project, combined heat and power (CHP or cogen) production facility, or new state-of-the-art
efficient electric generation facility, including Class I and Class II renewable Energy.
http://www.njeda.com/web/Aspx_pg/Templates/Npic_Text.aspx?Doc_Id=1078&menuid=1360&topid=72
2&levelid=6&midid=1357
Clean Renewable Energy Bonds (CREBs) – For Renewable Energy Projects Federal Loan Program for Solar Thermal Electric, Photovoltaics, Landfill Gas, Wind, Biomass,
Hydroelectric, Geothermal Electric, Municipal Solid Waste, Hydrokinetic Power, Anaerobic Digestion,
Tidal Energy, Wave Energy, Ocean Thermal
http://www.irs.gov/irb/2007-14_IRB/ar17.html
Renewable funding for PV & wind, plus federal credits currently available: http://www.njcleanenergy.com/renewable-energy/programs/renewable-energy-incentive-
program/applications-and-e-forms-renewable-ener
Union Township, NJ 38 FINAL – Energy Audit Report, February 2012
Next Steps
The following projects should be considered for implementation:
Lighting upgrades
Vending machine power management
Programmable thermostat
Insulation
Note that additional “Phase 2” engineering may be required to further develop these projects, to
bring them to bidding and implementation.
Consider applying for Direct Install Programs
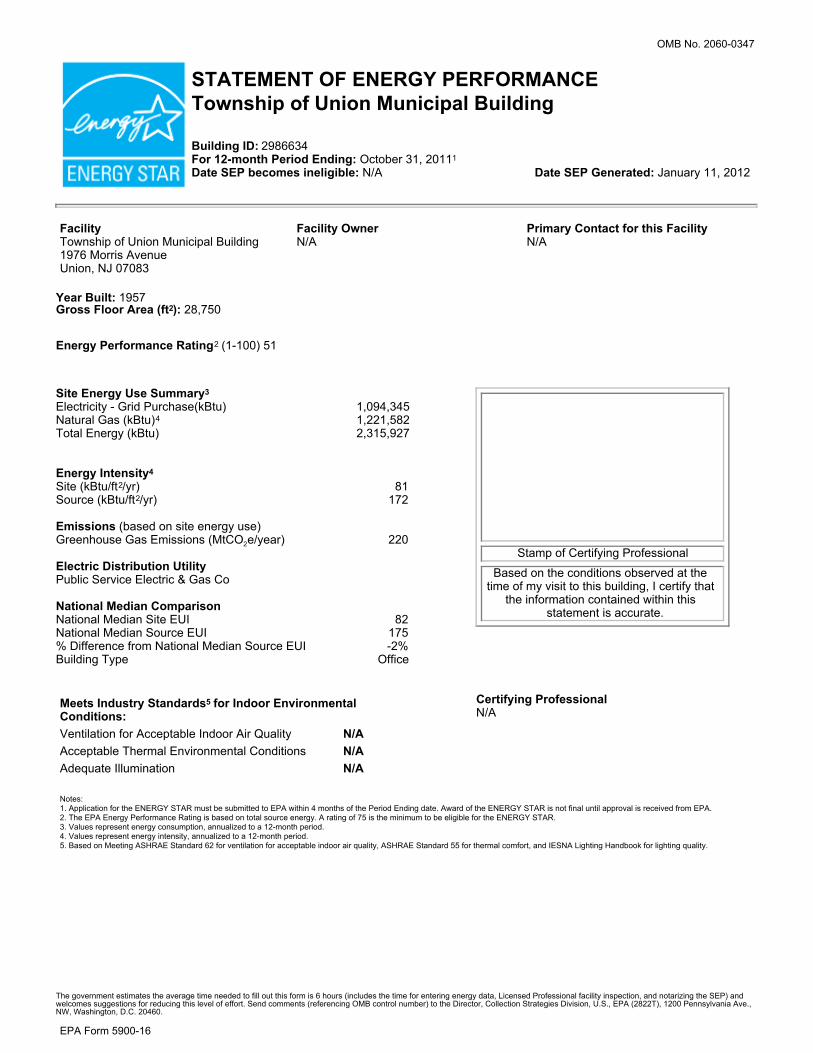
OMB No. 2060-0347
STATEMENT OF ENERGY PERFORMANCETownship of Union Municipal Building
Building ID: 2986634 For 12-month Period Ending: October 31, 20111
Date SEP becomes ineligible: N/A Date SEP Generated: January 11, 2012
FacilityTownship of Union Municipal Building1976 Morris AvenueUnion, NJ 07083
Facility OwnerN/A
Primary Contact for this FacilityN/A
Year Built: 1957Gross Floor Area (ft2): 28,750
Energy Performance Rating2 (1-100) 51
Site Energy Use Summary3
Electricity - Grid Purchase(kBtu) 1,094,345 Natural Gas (kBtu)4 1,221,582 Total Energy (kBtu) 2,315,927
Energy Intensity4 Site (kBtu/ft2/yr) 81 Source (kBtu/ft2/yr) 172 Emissions (based on site energy use) Greenhouse Gas Emissions (MtCO2e/year) 220 Electric Distribution Utility Public Service Electric & Gas Co National Median Comparison National Median Site EUI 82 National Median Source EUI 175 % Difference from National Median Source EUI -2% Building Type Office
Stamp of Certifying Professional
Based on the conditions observed at thetime of my visit to this building, I certify that
the information contained within thisstatement is accurate.
Meets Industry Standards5 for Indoor EnvironmentalConditions:Ventilation for Acceptable Indoor Air Quality N/A Acceptable Thermal Environmental Conditions N/A Adequate Illumination N/A
Certifying ProfessionalN/A
Notes: 1. Application for the ENERGY STAR must be submitted to EPA within 4 months of the Period Ending date. Award of the ENERGY STAR is not final until approval is received from EPA.2. The EPA Energy Performance Rating is based on total source energy. A rating of 75 is the minimum to be eligible for the ENERGY STAR.3. Values represent energy consumption, annualized to a 12-month period.4. Values represent energy intensity, annualized to a 12-month period.5. Based on Meeting ASHRAE Standard 62 for ventilation for acceptable indoor air quality, ASHRAE Standard 55 for thermal comfort, and IESNA Lighting Handbook for lighting quality.
The government estimates the average time needed to fill out this form is 6 hours (includes the time for entering energy data, Licensed Professional facility inspection, and notarizing the SEP) andwelcomes suggestions for reducing this level of effort. Send comments (referencing OMB control number) to the Director, Collection Strategies Division, U.S., EPA (2822T), 1200 Pennsylvania Ave.,NW, Washington, D.C. 20460.
EPA Form 5900-16
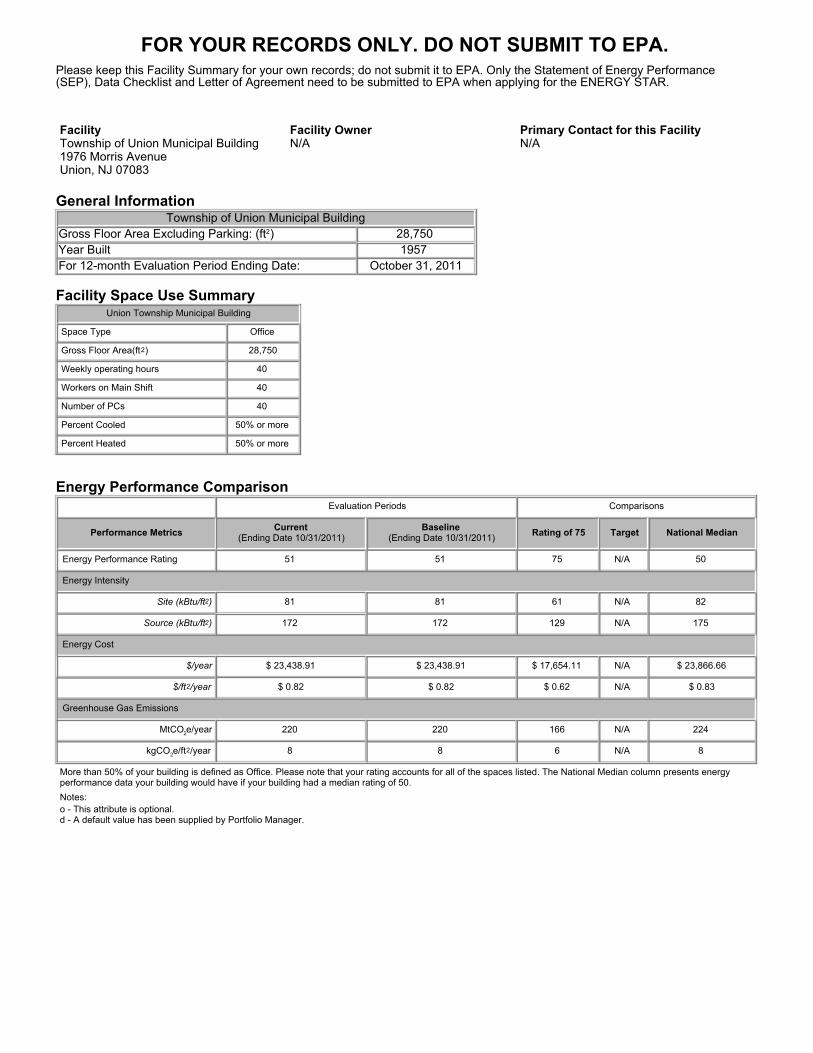
FOR YOUR RECORDS ONLY. DO NOT SUBMIT TO EPA.
Please keep this Facility Summary for your own records; do not submit it to EPA. Only the Statement of Energy Performance(SEP), Data Checklist and Letter of Agreement need to be submitted to EPA when applying for the ENERGY STAR.
FacilityTownship of Union Municipal Building1976 Morris AvenueUnion, NJ 07083
Facility OwnerN/A
Primary Contact for this FacilityN/A
General InformationTownship of Union Municipal Building
Gross Floor Area Excluding Parking: (ft2) 28,750 Year Built 1957 For 12-month Evaluation Period Ending Date: October 31, 2011
Facility Space Use SummaryUnion Township Municipal Building
Space Type Office
Gross Floor Area(ft2) 28,750
Weekly operating hours 40
Workers on Main Shift 40
Number of PCs 40
Percent Cooled 50% or more
Percent Heated 50% or more
Energy Performance ComparisonEvaluation Periods Comparisons
Performance Metrics Current(Ending Date 10/31/2011)
Baseline(Ending Date 10/31/2011) Rating of 75 Target National Median
Energy Performance Rating 51 51 75 N/A 50
Energy Intensity
Site (kBtu/ft2) 81 81 61 N/A 82
Source (kBtu/ft2) 172 172 129 N/A 175
Energy Cost
$/year $ 23,438.91 $ 23,438.91 $ 17,654.11 N/A $ 23,866.66
$/ft2/year $ 0.82 $ 0.82 $ 0.62 N/A $ 0.83
Greenhouse Gas Emissions
MtCO2e/year 220 220 166 N/A 224
kgCO2e/ft2/year 8 8 6 N/A 8
More than 50% of your building is defined as Office. Please note that your rating accounts for all of the spaces listed. The National Median column presents energyperformance data your building would have if your building had a median rating of 50. Notes:o - This attribute is optional.d - A default value has been supplied by Portfolio Manager.
Annual
Consumption
Annual
Consumption
kWh Therms
Township Municipal Building 602100927382 258,240 $44,808 $0.174 8347434500 11,802 12,004$ $1.017
4746634500 450 669$ $1.486
TOTAL 258,240 $44,808 $0.174 TOTAL 12,252 12,673$ $1.034
Facility Name Township of Union Municipal Building Burke Parkway & Morris
Company PSE&G - Electric Union Twp, NJ
Account#
Meter# 778019459
Tariff/Rate GLP (Jan - March lumped together)
Note that usage for 8/15/2010 is estimated for EUI purposes
Energy Type Energy Unit Start Date End Date Demand KW KWHSupply Charge
(estimated) Utility Cost $/kWh
Electricity kWh 8/15/2010 9/13/2010 100.29 27,960 $4,824.07 $0.173
Electricity kWh 9/13/2010 10/12/2010 99.75 23,040 $3,914.27 $0.170
Electricity kWh 10/12/2010 11/12/2010 99.75 22,200 $2,560.63 $1,053.44 $0.163
Electricity kWh 11/12/2010 12/13/2010 99.75 21,480 $2,497.23 $933.04 $0.160
Electricity kWh 12/13/2011 3/15/2011 99.65 45,360 $5,564.52 $1,963.59 $0.166
Electricity kWh 4/13/2011 5/13/2011 99.65 21,840 $2,576.15 $1,023.33 $0.165
Electricity kWh 5/13/2011 6/14/2011 100.83 30,600 $3,325.68 $2,312.45 $0.184
Electricity kWh 6/14/2011 7/14/2011 100.83 32,880 $6,010.01 $0.183
Electricity kWh 7/14/2011 8/12/2011 100.83 32,880 $3,770.90 $2,479.02 $0.190
100.1 258,240 $20,295.11 $24,513.22 $0.174
Facility Name Township of Union Municipal Building 1976 Morris Avenue
Company Elizabethtown Gas / Pepco Energy Services Union Twp, NJ
Account# 8347434500 / 12984030
Meter# 737520
Tariff/Rate 203
Energy Type Energy Unit Start Date End Date Therms Delivery Cost Supplier Cost $/Therm
Natural Gas Therms 6/2/2010 7/1/2010 71.4 $39.70 $48.03 $1.23
Natural Gas Therms 7/1/2010 8/2/2010 51.9 $57.53 $1.11
Natural Gas Therms 8/2/2010 9/1/2010 51.8 $55.87 $1.08
Natural Gas Therms 9/1/2010 10/4/2010 83.1 $42.91 $61.77 $1.26
Natural Gas Therms 10/4/2010 11/2/2010 579.2 $180.13 $430.55 $1.05
Natural Gas Therms 11/2/2010 12/3/2010 1186.3 $1,295.66 $1.09
Natural Gas Therms 12/3/2010 1/4/2011 2544.7 $766.10 $1,891.61 $1.04
Natural Gas Therms 1/4/2011 2/1/2011 2013.6 $1,747.25 $0.87
Natural Gas Therms 2/1/2011 3/3/2011 2293.4 $673.86 $1,704.80 $1.04
Natural Gas Therms 3/3/2011 4/1/2011 1762.8 $522.57 $1,310.38 $1.04
Natural Gas Therms 4/1/2011 5/3/2011 1050.4 $301.51 $780.82 $1.03
Natural Gas Therms 5/3/2011 6/2/2011 79.0 $41.17 $58.72 $1.26
Natural Gas Therms 6/2/2011 7/1/2011 75.8 $40.31 $56.35 $1.28
Natural Gas Therms 7/1/2011 8/3/2011 81.6 $41.87 $0.51
11,801.70 2,610.43 9,393.78 $1.017
Facility Name Township of Union Municipal Building 1976 Morris Avenue
Company Elizabethtown Gas Union Twp, NJ
Account# 4746634500
Meter# 00933212
Tariff/Rate 203
Energy Type Energy Unit Start Date End Date Therms Delivery Cost Supplier Cost $/Therm
Natural Gas Therms 6/2/2010 7/1/2010 5.1 $21.41 $3.43 $4.87
Natural Gas Therms 7/1/2010 8/3/2010 $4.55 #DIV/0!
Natural Gas Therms 8/3/2010 9/1/2010 $4.59 #DIV/0!
Natural Gas Therms 9/1/2010 10/4/2010 $4.61 #DIV/0!
Natural Gas Therms 10/4/2010 11/2/2010 31.10 $28.61 $23.12 $1.66
Natural Gas Therms 11/2/2010 12/3/2010 68.30 $40.02 $50.77 $1.33
Natural Gas Therms 12/3/2010 1/4/2011 127.60 $57.40 $94.85 $1.19
Natural Gas Therms 1/4/2011 2/1/2011 125.30 $56.72 $93.14 $1.20
Natural Gas Therms 2/1/2011 3/3/2011 7.20 $22.05 $5.35 $3.81
Natural Gas Therms 3/3/2011 4/1/2011 26.80 $27.64 $19.92 $1.77
Natural Gas Therms 4/1/2011 5/3/2011 44.30 $31.87 $32.93 $1.46
Natural Gas Therms 5/3/2011 6/2/2011 7.20 $21.93 $5.35 $3.79
Natural Gas Therms 6/2/2011 7/1/2011 6.20 $21.66 $4.61 $4.24
Natural Gas Therms 7/1/2011 8/3/2011 6.20 $21.66 $3.49
450.20 329.56 339.24 $1.49
TOTALS/AVERAGE
$ /
Therms
602100927382
TOTALS/AVERAGE
Electric - PSE&G Natural Gas - Elizabethtown Gas
Buildings Account
NumberAnnual Cost $ / kWh Account Number Annual Cost
TOTALS/AVERAGE
TH
ER
MS
UNION TOWNSHIP MUNICIPAL BUILDING NATURAL GAS USAGE (METER 737520)
Natural Gas
KW
Dem
an
d
Ele
ctr
ic U
sag
e (
kW
h)
UNION TOWNSHIP MUNICIPAL BUILDING ELECTRICAL USAGE
Electricity
Demand KW
TH
ER
MS
UNION TOWNSHIP MUNICIPAL BUILDING NATURAL GAS USAGE (METER 00933212)
Natural Gas
All values in italics are estimated. 1 of 1

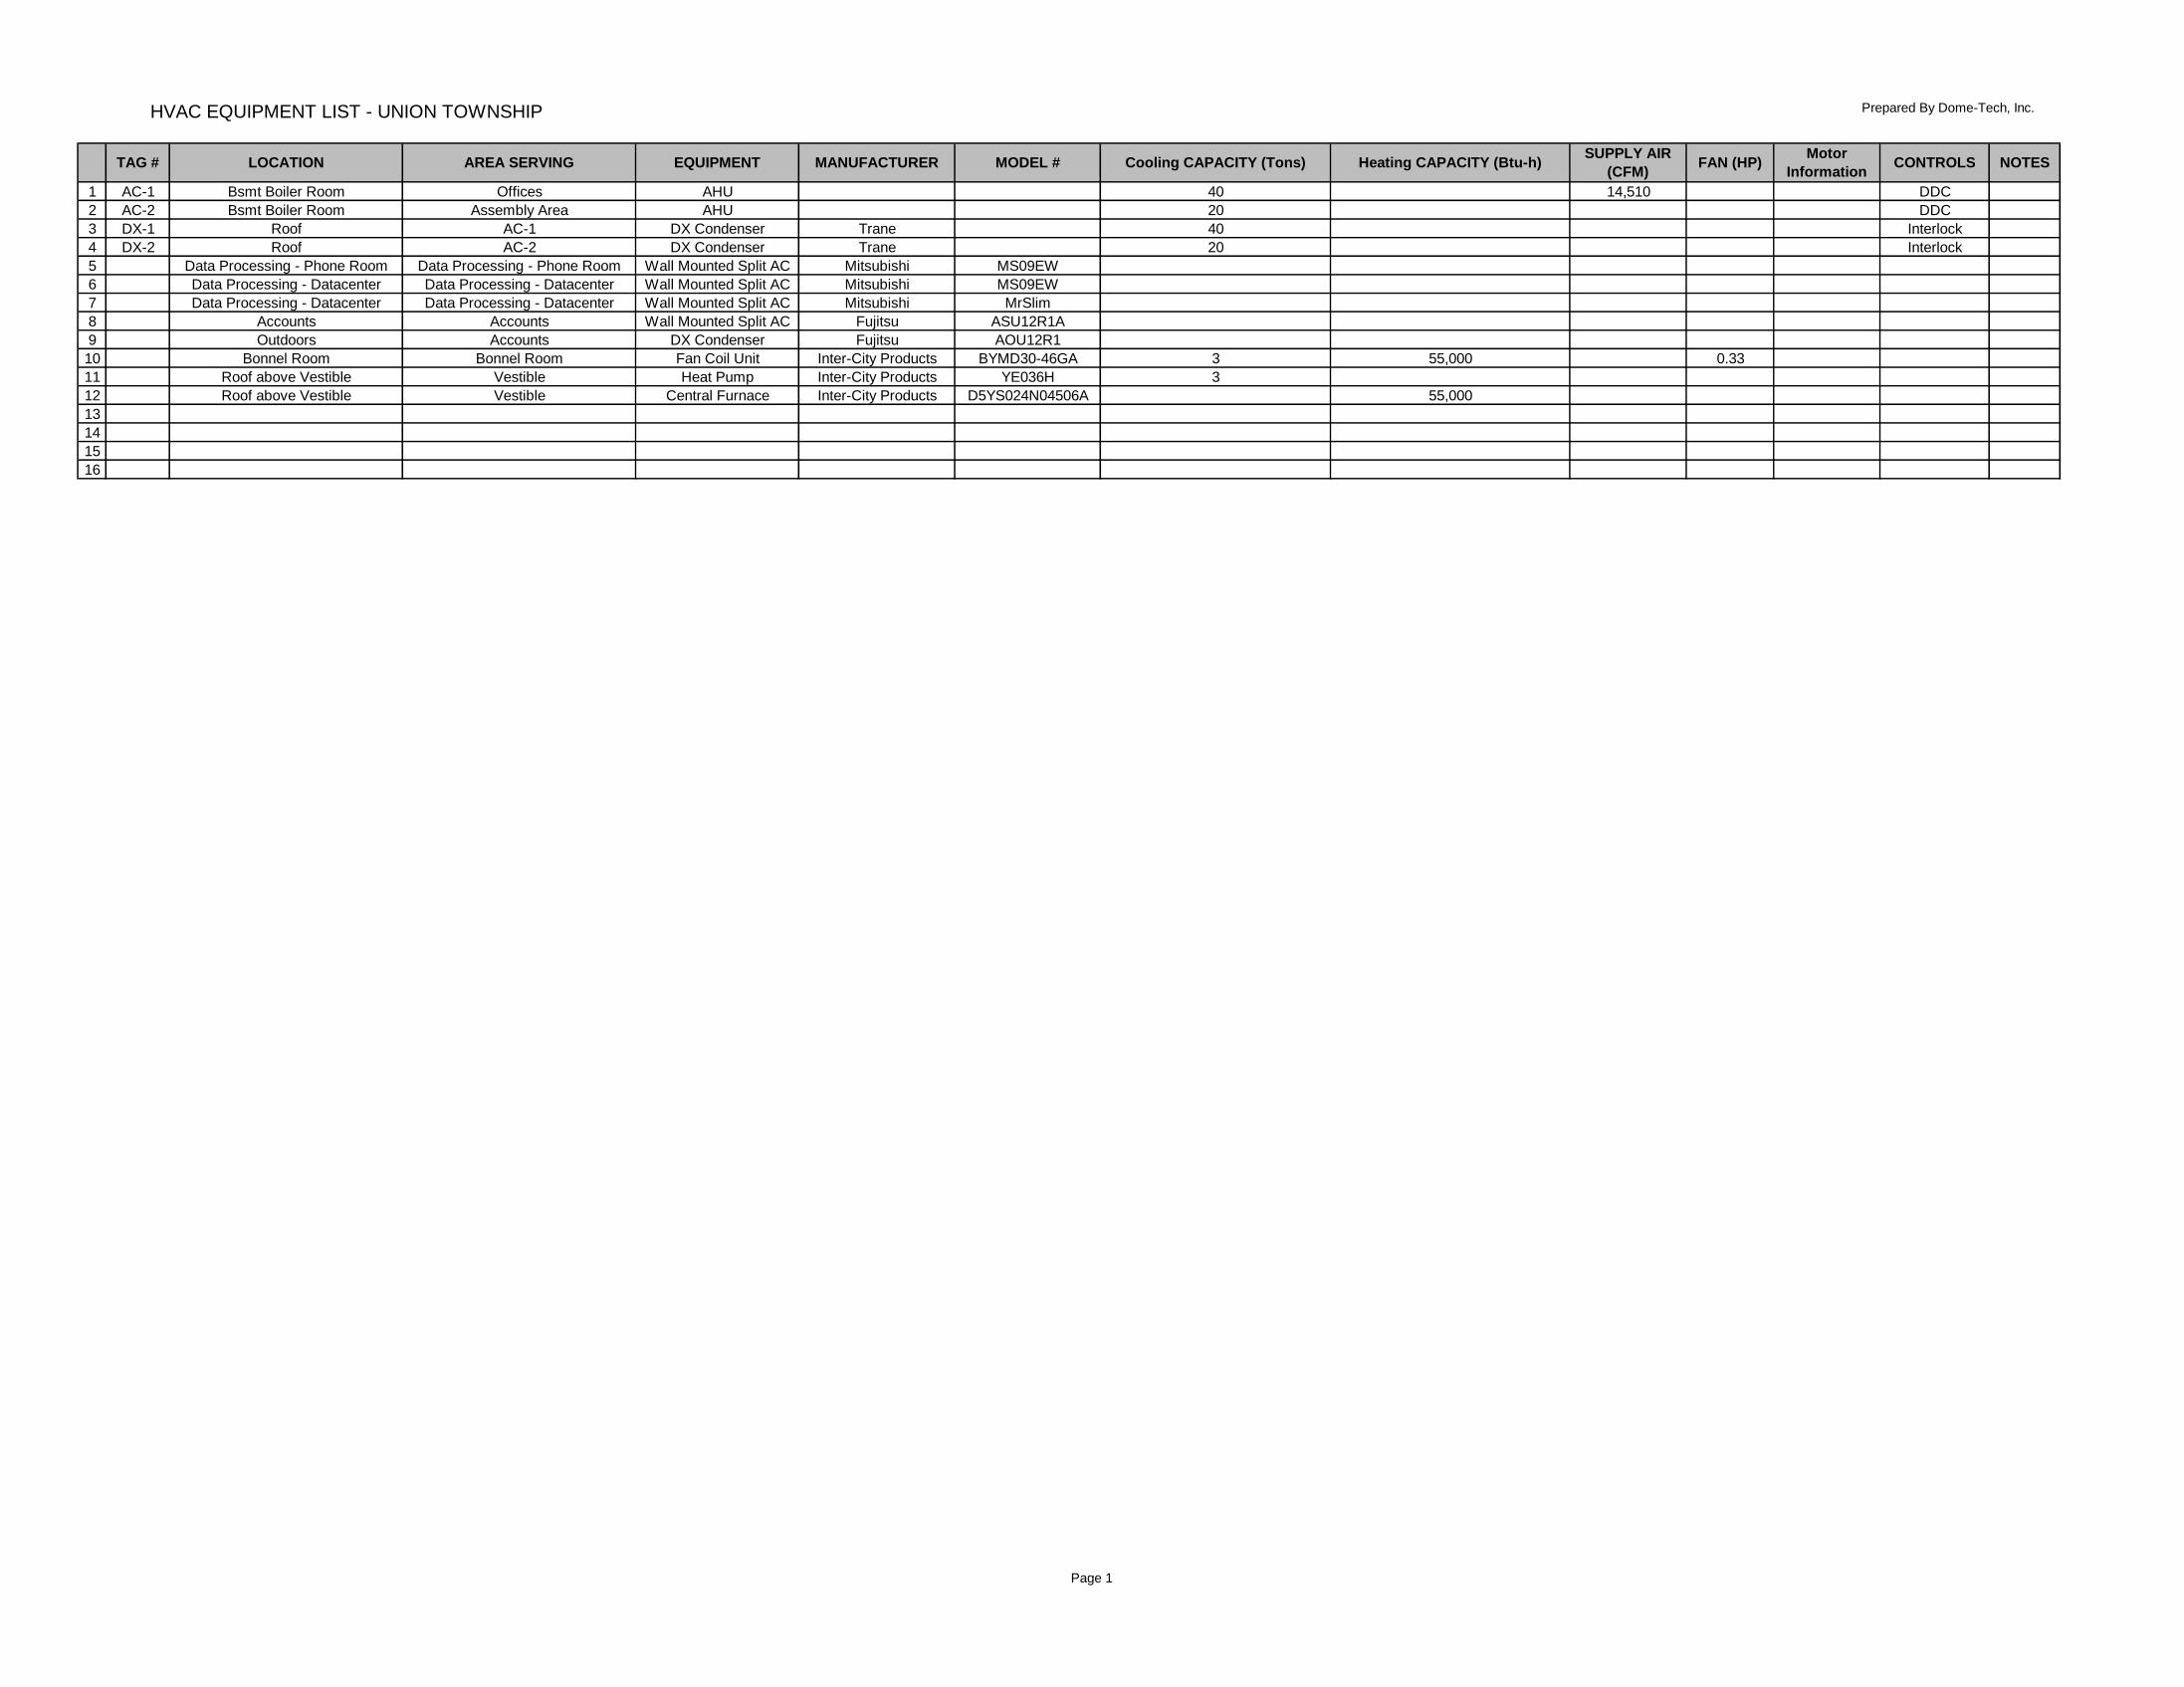
HVAC EQUIPMENT LIST - UNION TOWNSHIP Prepared By Dome-Tech, Inc.
TAG # LOCATION AREA SERVING EQUIPMENT MANUFACTURER MODEL # Cooling CAPACITY (Tons) Heating CAPACITY (Btu-h)SUPPLY AIR
(CFM)FAN (HP)
Motor
InformationCONTROLS NOTES
1 AC-1 Bsmt Boiler Room Offices AHU 40 14,510 DDC
2 AC-2 Bsmt Boiler Room Assembly Area AHU 20 DDC
3 DX-1 Roof AC-1 DX Condenser Trane 40 Interlock
4 DX-2 Roof AC-2 DX Condenser Trane 20 Interlock
5 Data Processing - Phone Room Data Processing - Phone Room Wall Mounted Split AC Mitsubishi MS09EW
6 Data Processing - Datacenter Data Processing - Datacenter Wall Mounted Split AC Mitsubishi MS09EW
7 Data Processing - Datacenter Data Processing - Datacenter Wall Mounted Split AC Mitsubishi MrSlim
8 Accounts Accounts Wall Mounted Split AC Fujitsu ASU12R1A
9 Outdoors Accounts DX Condenser Fujitsu AOU12R1
10 Bonnel Room Bonnel Room Fan Coil Unit Inter-City Products BYMD30-46GA 3 55,000 0.33
11 Roof above Vestible Vestible Heat Pump Inter-City Products YE036H 3
12 Roof above Vestible Vestible Central Furnace Inter-City Products D5YS024N04506A 55,000
13
14
15
16
Page 1
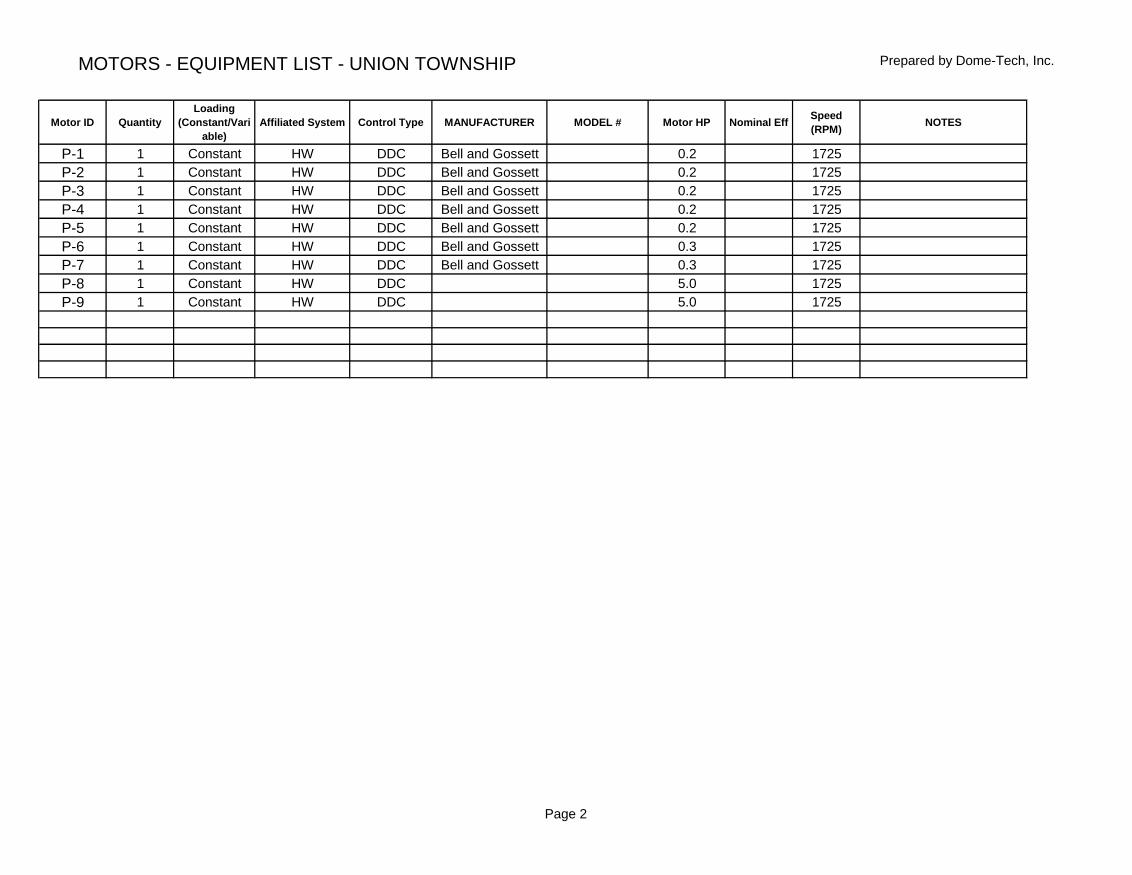
MOTORS - EQUIPMENT LIST - UNION TOWNSHIP Prepared by Dome-Tech, Inc.
Motor ID Quantity
Loading
(Constant/Vari
able)
Affiliated System Control Type MANUFACTURER MODEL # Motor HP Nominal EffSpeed
(RPM)NOTES
P-1 1 Constant HW DDC Bell and Gossett 0.2 1725
P-2 1 Constant HW DDC Bell and Gossett 0.2 1725
P-3 1 Constant HW DDC Bell and Gossett 0.2 1725
P-4 1 Constant HW DDC Bell and Gossett 0.2 1725
P-5 1 Constant HW DDC Bell and Gossett 0.2 1725
P-6 1 Constant HW DDC Bell and Gossett 0.3 1725
P-7 1 Constant HW DDC Bell and Gossett 0.3 1725
P-8 1 Constant HW DDC 5.0 1725
P-9 1 Constant HW DDC 5.0 1725
Page 2
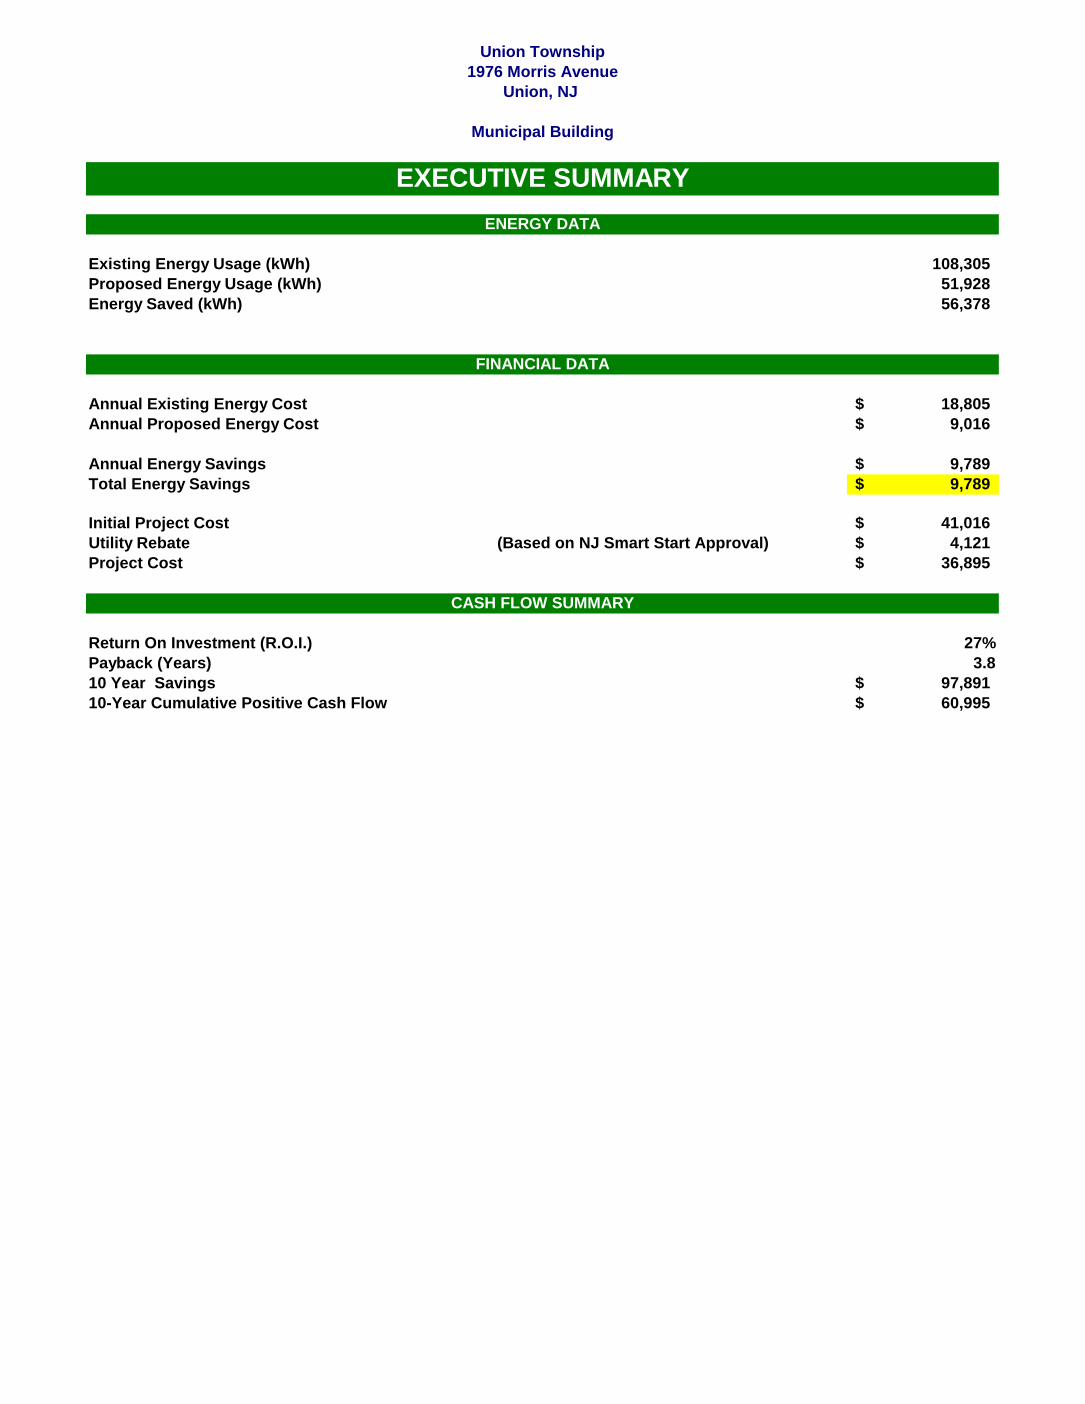
Existing Energy Usage (kWh) 108,305
Proposed Energy Usage (kWh) 51,928
Energy Saved (kWh) 56,378
Annual Existing Energy Cost 18,805$
Annual Proposed Energy Cost 9,016$
Annual Energy Savings 9,789$
Total Energy Savings 9,789$
Initial Project Cost 41,016$
Utility Rebate (Based on NJ Smart Start Approval) 4,121$
Project Cost 36,895$
Return On Investment (R.O.I.) 27%
Payback (Years) 3.8
10 Year Savings 97,891$
10-Year Cumulative Positive Cash Flow 60,995$
FINANCIAL DATA
CASH FLOW SUMMARY
Union Township
1976 Morris Avenue
Union, NJ
Municipal Building
EXECUTIVE SUMMARY
ENERGY DATA
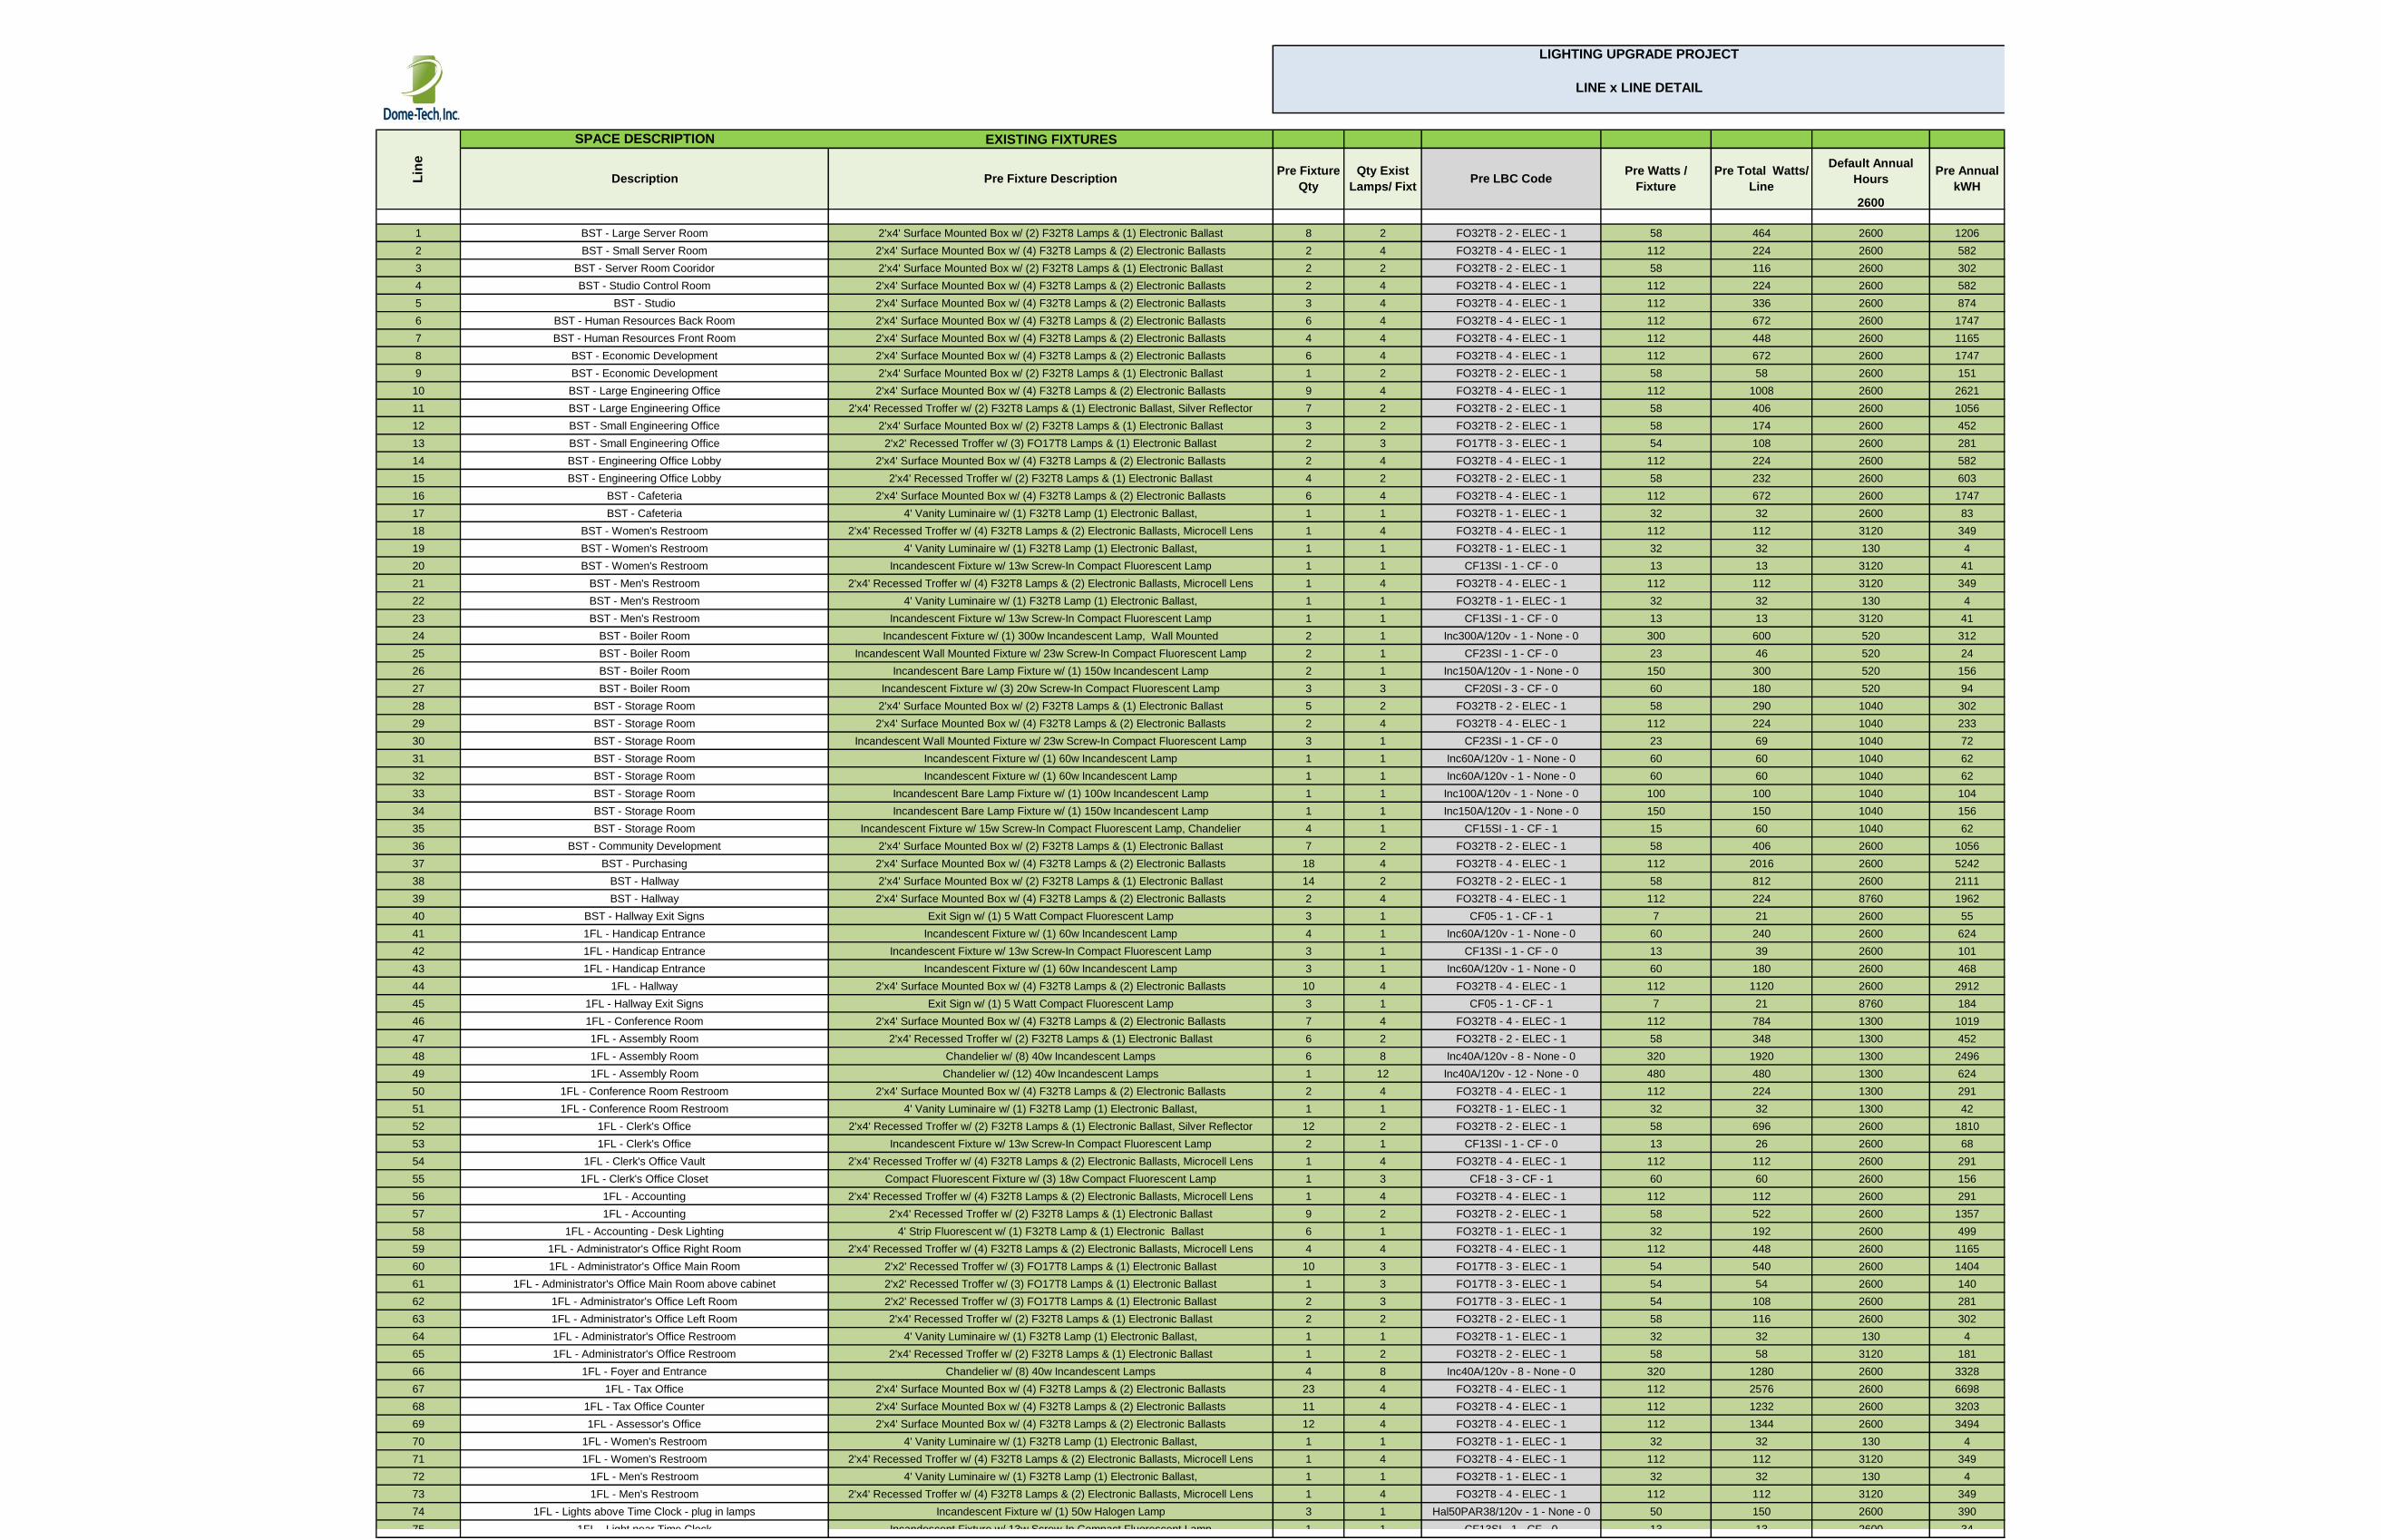
EXISTING FIXTURES
2600
1 BST - Large Server Room 2'x4' Surface Mounted Box w/ (2) F32T8 Lamps & (1) Electronic Ballast 8 2 FO32T8 - 2 - ELEC - 1 58 464 2600 1206
2 BST - Small Server Room 2'x4' Surface Mounted Box w/ (4) F32T8 Lamps & (2) Electronic Ballasts 2 4 FO32T8 - 4 - ELEC - 1 112 224 2600 582
3 BST - Server Room Cooridor 2'x4' Surface Mounted Box w/ (2) F32T8 Lamps & (1) Electronic Ballast 2 2 FO32T8 - 2 - ELEC - 1 58 116 2600 302
4 BST - Studio Control Room 2'x4' Surface Mounted Box w/ (4) F32T8 Lamps & (2) Electronic Ballasts 2 4 FO32T8 - 4 - ELEC - 1 112 224 2600 582
5 BST - Studio 2'x4' Surface Mounted Box w/ (4) F32T8 Lamps & (2) Electronic Ballasts 3 4 FO32T8 - 4 - ELEC - 1 112 336 2600 874
6 BST - Human Resources Back Room 2'x4' Surface Mounted Box w/ (4) F32T8 Lamps & (2) Electronic Ballasts 6 4 FO32T8 - 4 - ELEC - 1 112 672 2600 1747
7 BST - Human Resources Front Room 2'x4' Surface Mounted Box w/ (4) F32T8 Lamps & (2) Electronic Ballasts 4 4 FO32T8 - 4 - ELEC - 1 112 448 2600 1165
8 BST - Economic Development 2'x4' Surface Mounted Box w/ (4) F32T8 Lamps & (2) Electronic Ballasts 6 4 FO32T8 - 4 - ELEC - 1 112 672 2600 1747
9 BST - Economic Development 2'x4' Surface Mounted Box w/ (2) F32T8 Lamps & (1) Electronic Ballast 1 2 FO32T8 - 2 - ELEC - 1 58 58 2600 151
10 BST - Large Engineering Office 2'x4' Surface Mounted Box w/ (4) F32T8 Lamps & (2) Electronic Ballasts 9 4 FO32T8 - 4 - ELEC - 1 112 1008 2600 2621
11 BST - Large Engineering Office 2'x4' Recessed Troffer w/ (2) F32T8 Lamps & (1) Electronic Ballast, Silver Reflector 7 2 FO32T8 - 2 - ELEC - 1 58 406 2600 1056
12 BST - Small Engineering Office 2'x4' Surface Mounted Box w/ (2) F32T8 Lamps & (1) Electronic Ballast 3 2 FO32T8 - 2 - ELEC - 1 58 174 2600 452
13 BST - Small Engineering Office 2'x2' Recessed Troffer w/ (3) FO17T8 Lamps & (1) Electronic Ballast 2 3 FO17T8 - 3 - ELEC - 1 54 108 2600 281
14 BST - Engineering Office Lobby 2'x4' Surface Mounted Box w/ (4) F32T8 Lamps & (2) Electronic Ballasts 2 4 FO32T8 - 4 - ELEC - 1 112 224 2600 582
15 BST - Engineering Office Lobby 2'x4' Recessed Troffer w/ (2) F32T8 Lamps & (1) Electronic Ballast 4 2 FO32T8 - 2 - ELEC - 1 58 232 2600 603
16 BST - Cafeteria 2'x4' Surface Mounted Box w/ (4) F32T8 Lamps & (2) Electronic Ballasts 6 4 FO32T8 - 4 - ELEC - 1 112 672 2600 1747
17 BST - Cafeteria 4' Vanity Luminaire w/ (1) F32T8 Lamp (1) Electronic Ballast, 1 1 FO32T8 - 1 - ELEC - 1 32 32 2600 83
18 BST - Women's Restroom 2'x4' Recessed Troffer w/ (4) F32T8 Lamps & (2) Electronic Ballasts, Microcell Lens 1 4 FO32T8 - 4 - ELEC - 1 112 112 3120 349
19 BST - Women's Restroom 4' Vanity Luminaire w/ (1) F32T8 Lamp (1) Electronic Ballast, 1 1 FO32T8 - 1 - ELEC - 1 32 32 130 4
20 BST - Women's Restroom Incandescent Fixture w/ 13w Screw-In Compact Fluorescent Lamp 1 1 CF13SI - 1 - CF - 0 13 13 3120 41
21 BST - Men's Restroom 2'x4' Recessed Troffer w/ (4) F32T8 Lamps & (2) Electronic Ballasts, Microcell Lens 1 4 FO32T8 - 4 - ELEC - 1 112 112 3120 349
22 BST - Men's Restroom 4' Vanity Luminaire w/ (1) F32T8 Lamp (1) Electronic Ballast, 1 1 FO32T8 - 1 - ELEC - 1 32 32 130 4
23 BST - Men's Restroom Incandescent Fixture w/ 13w Screw-In Compact Fluorescent Lamp 1 1 CF13SI - 1 - CF - 0 13 13 3120 41
24 BST - Boiler Room Incandescent Fixture w/ (1) 300w Incandescent Lamp, Wall Mounted 2 1 Inc300A/120v - 1 - None - 0 300 600 520 312
25 BST - Boiler Room Incandescent Wall Mounted Fixture w/ 23w Screw-In Compact Fluorescent Lamp 2 1 CF23SI - 1 - CF - 0 23 46 520 24
26 BST - Boiler Room Incandescent Bare Lamp Fixture w/ (1) 150w Incandescent Lamp 2 1 Inc150A/120v - 1 - None - 0 150 300 520 156
27 BST - Boiler Room Incandescent Fixture w/ (3) 20w Screw-In Compact Fluorescent Lamp 3 3 CF20SI - 3 - CF - 0 60 180 520 94
28 BST - Storage Room 2'x4' Surface Mounted Box w/ (2) F32T8 Lamps & (1) Electronic Ballast 5 2 FO32T8 - 2 - ELEC - 1 58 290 1040 302
29 BST - Storage Room 2'x4' Surface Mounted Box w/ (4) F32T8 Lamps & (2) Electronic Ballasts 2 4 FO32T8 - 4 - ELEC - 1 112 224 1040 233
30 BST - Storage Room Incandescent Wall Mounted Fixture w/ 23w Screw-In Compact Fluorescent Lamp 3 1 CF23SI - 1 - CF - 0 23 69 1040 72
31 BST - Storage Room Incandescent Fixture w/ (1) 60w Incandescent Lamp 1 1 Inc60A/120v - 1 - None - 0 60 60 1040 62
32 BST - Storage Room Incandescent Fixture w/ (1) 60w Incandescent Lamp 1 1 Inc60A/120v - 1 - None - 0 60 60 1040 62
33 BST - Storage Room Incandescent Bare Lamp Fixture w/ (1) 100w Incandescent Lamp 1 1 Inc100A/120v - 1 - None - 0 100 100 1040 104
34 BST - Storage Room Incandescent Bare Lamp Fixture w/ (1) 150w Incandescent Lamp 1 1 Inc150A/120v - 1 - None - 0 150 150 1040 156
35 BST - Storage Room Incandescent Fixture w/ 15w Screw-In Compact Fluorescent Lamp, Chandelier 4 1 CF15SI - 1 - CF - 1 15 60 1040 62
36 BST - Community Development 2'x4' Surface Mounted Box w/ (2) F32T8 Lamps & (1) Electronic Ballast 7 2 FO32T8 - 2 - ELEC - 1 58 406 2600 1056
37 BST - Purchasing 2'x4' Surface Mounted Box w/ (4) F32T8 Lamps & (2) Electronic Ballasts 18 4 FO32T8 - 4 - ELEC - 1 112 2016 2600 5242
38 BST - Hallway 2'x4' Surface Mounted Box w/ (2) F32T8 Lamps & (1) Electronic Ballast 14 2 FO32T8 - 2 - ELEC - 1 58 812 2600 2111
39 BST - Hallway 2'x4' Surface Mounted Box w/ (4) F32T8 Lamps & (2) Electronic Ballasts 2 4 FO32T8 - 4 - ELEC - 1 112 224 8760 1962
40 BST - Hallway Exit Signs Exit Sign w/ (1) 5 Watt Compact Fluorescent Lamp 3 1 CF05 - 1 - CF - 1 7 21 2600 55
41 1FL - Handicap Entrance Incandescent Fixture w/ (1) 60w Incandescent Lamp 4 1 Inc60A/120v - 1 - None - 0 60 240 2600 624
42 1FL - Handicap Entrance Incandescent Fixture w/ 13w Screw-In Compact Fluorescent Lamp 3 1 CF13SI - 1 - CF - 0 13 39 2600 101
43 1FL - Handicap Entrance Incandescent Fixture w/ (1) 60w Incandescent Lamp 3 1 Inc60A/120v - 1 - None - 0 60 180 2600 468
44 1FL - Hallway 2'x4' Surface Mounted Box w/ (4) F32T8 Lamps & (2) Electronic Ballasts 10 4 FO32T8 - 4 - ELEC - 1 112 1120 2600 2912
45 1FL - Hallway Exit Signs Exit Sign w/ (1) 5 Watt Compact Fluorescent Lamp 3 1 CF05 - 1 - CF - 1 7 21 8760 184
46 1FL - Conference Room 2'x4' Surface Mounted Box w/ (4) F32T8 Lamps & (2) Electronic Ballasts 7 4 FO32T8 - 4 - ELEC - 1 112 784 1300 1019
47 1FL - Assembly Room 2'x4' Recessed Troffer w/ (2) F32T8 Lamps & (1) Electronic Ballast 6 2 FO32T8 - 2 - ELEC - 1 58 348 1300 452
48 1FL - Assembly Room Chandelier w/ (8) 40w Incandescent Lamps 6 8 Inc40A/120v - 8 - None - 0 320 1920 1300 2496
49 1FL - Assembly Room Chandelier w/ (12) 40w Incandescent Lamps 1 12 Inc40A/120v - 12 - None - 0 480 480 1300 624
50 1FL - Conference Room Restroom 2'x4' Surface Mounted Box w/ (4) F32T8 Lamps & (2) Electronic Ballasts 2 4 FO32T8 - 4 - ELEC - 1 112 224 1300 291
51 1FL - Conference Room Restroom 4' Vanity Luminaire w/ (1) F32T8 Lamp (1) Electronic Ballast, 1 1 FO32T8 - 1 - ELEC - 1 32 32 1300 42
52 1FL - Clerk's Office 2'x4' Recessed Troffer w/ (2) F32T8 Lamps & (1) Electronic Ballast, Silver Reflector 12 2 FO32T8 - 2 - ELEC - 1 58 696 2600 1810
53 1FL - Clerk's Office Incandescent Fixture w/ 13w Screw-In Compact Fluorescent Lamp 2 1 CF13SI - 1 - CF - 0 13 26 2600 68
54 1FL - Clerk's Office Vault 2'x4' Recessed Troffer w/ (4) F32T8 Lamps & (2) Electronic Ballasts, Microcell Lens 1 4 FO32T8 - 4 - ELEC - 1 112 112 2600 291
55 1FL - Clerk's Office Closet Compact Fluorescent Fixture w/ (3) 18w Compact Fluorescent Lamp 1 3 CF18 - 3 - CF - 1 60 60 2600 156
56 1FL - Accounting 2'x4' Recessed Troffer w/ (4) F32T8 Lamps & (2) Electronic Ballasts, Microcell Lens 1 4 FO32T8 - 4 - ELEC - 1 112 112 2600 291
57 1FL - Accounting 2'x4' Recessed Troffer w/ (2) F32T8 Lamps & (1) Electronic Ballast 9 2 FO32T8 - 2 - ELEC - 1 58 522 2600 1357
58 1FL - Accounting - Desk Lighting 4' Strip Fluorescent w/ (1) F32T8 Lamp & (1) Electronic Ballast 6 1 FO32T8 - 1 - ELEC - 1 32 192 2600 499
59 1FL - Administrator's Office Right Room 2'x4' Recessed Troffer w/ (4) F32T8 Lamps & (2) Electronic Ballasts, Microcell Lens 4 4 FO32T8 - 4 - ELEC - 1 112 448 2600 1165
60 1FL - Administrator's Office Main Room 2'x2' Recessed Troffer w/ (3) FO17T8 Lamps & (1) Electronic Ballast 10 3 FO17T8 - 3 - ELEC - 1 54 540 2600 1404
61 1FL - Administrator's Office Main Room above cabinet 2'x2' Recessed Troffer w/ (3) FO17T8 Lamps & (1) Electronic Ballast 1 3 FO17T8 - 3 - ELEC - 1 54 54 2600 140
62 1FL - Administrator's Office Left Room 2'x2' Recessed Troffer w/ (3) FO17T8 Lamps & (1) Electronic Ballast 2 3 FO17T8 - 3 - ELEC - 1 54 108 2600 281
63 1FL - Administrator's Office Left Room 2'x4' Recessed Troffer w/ (2) F32T8 Lamps & (1) Electronic Ballast 2 2 FO32T8 - 2 - ELEC - 1 58 116 2600 302
64 1FL - Administrator's Office Restroom 4' Vanity Luminaire w/ (1) F32T8 Lamp (1) Electronic Ballast, 1 1 FO32T8 - 1 - ELEC - 1 32 32 130 4
65 1FL - Administrator's Office Restroom 2'x4' Recessed Troffer w/ (2) F32T8 Lamps & (1) Electronic Ballast 1 2 FO32T8 - 2 - ELEC - 1 58 58 3120 181
66 1FL - Foyer and Entrance Chandelier w/ (8) 40w Incandescent Lamps 4 8 Inc40A/120v - 8 - None - 0 320 1280 2600 3328
67 1FL - Tax Office 2'x4' Surface Mounted Box w/ (4) F32T8 Lamps & (2) Electronic Ballasts 23 4 FO32T8 - 4 - ELEC - 1 112 2576 2600 6698
68 1FL - Tax Office Counter 2'x4' Surface Mounted Box w/ (4) F32T8 Lamps & (2) Electronic Ballasts 11 4 FO32T8 - 4 - ELEC - 1 112 1232 2600 3203
69 1FL - Assessor's Office 2'x4' Surface Mounted Box w/ (4) F32T8 Lamps & (2) Electronic Ballasts 12 4 FO32T8 - 4 - ELEC - 1 112 1344 2600 3494
70 1FL - Women's Restroom 4' Vanity Luminaire w/ (1) F32T8 Lamp (1) Electronic Ballast, 1 1 FO32T8 - 1 - ELEC - 1 32 32 130 4
71 1FL - Women's Restroom 2'x4' Recessed Troffer w/ (4) F32T8 Lamps & (2) Electronic Ballasts, Microcell Lens 1 4 FO32T8 - 4 - ELEC - 1 112 112 3120 349
72 1FL - Men's Restroom 4' Vanity Luminaire w/ (1) F32T8 Lamp (1) Electronic Ballast, 1 1 FO32T8 - 1 - ELEC - 1 32 32 130 4
73 1FL - Men's Restroom 2'x4' Recessed Troffer w/ (4) F32T8 Lamps & (2) Electronic Ballasts, Microcell Lens 1 4 FO32T8 - 4 - ELEC - 1 112 112 3120 349
74 1FL - Lights above Time Clock - plug in lamps Incandescent Fixture w/ (1) 50w Halogen Lamp 3 1 Hal50PAR38/120v - 1 - None - 0 50 150 2600 390
75 1FL - Light near Time Clock Incandescent Fixture w/ 13w Screw-In Compact Fluorescent Lamp 1 1 CF13SI - 1 - CF - 0 13 13 2600 34
Default Annual
HoursPre LBC CodePre Watts /
Fixture
Pre Total Watts/
Line
LIGHTING UPGRADE PROJECT
LINE x LINE DETAIL
Pre Annual
kWH
Lin
e
SPACE DESCRIPTION
Pre Fixture DescriptionDescriptionPre Fixture
Qty
Qty Exist
Lamps/ Fixt
REPLACEMENT FIXTURES
Annual
Hours
2600
Relamp & Reballast w/ (2) F28T8 Lamps & (1) 2/32 Elec. Low-Power High Efficiency Ballast, 2'x4' Silver Reflector Kit 8 2 8 42 336 2600 874 N/A 16 128 0 333
Relamp & Reballast w/ (2) F28T8 Lamps & (1) 2/32 Elec. Low-Power High Efficiency Ballast, 2'x4' Silver Reflector Kit 2 2 2 42 84 2600 218 N/A 70 140 0 364
Relamp & Reballast w/ (2) F28T8 Lamps & (1) 2/32 Elec. Low-Power High Efficiency Ballast, 2'x4' Silver Reflector Kit 2 2 2 42 84 2600 218 N/A 16 32 0 83
Relamp & Reballast w/ (2) F28T8 Lamps & (1) 2/32 Elec. Low-Power High Efficiency Ballast, 2'x4' Silver Reflector Kit 2 2 2 42 84 2600 218 N/A 70 140 0 364
Relamp & Reballast w/ (2) F28T8 Lamps & (1) 2/32 Elec. Low-Power High Efficiency Ballast, 2'x4' Silver Reflector Kit 3 2 3 42 126 2600 328 N/A 70 210 0 546
Relamp & Reballast w/ (2) F28T8 Lamps & (1) 2/32 Elec. Low-Power High Efficiency Ballast, 2'x4' Silver Reflector Kit 6 2 6 42 252 2600 655 N/A 70 420 0 1,092
Relamp & Reballast w/ (2) F28T8 Lamps & (1) 2/32 Elec. Low-Power High Efficiency Ballast, 2'x4' Silver Reflector Kit 4 2 4 42 168 2600 437 N/A 70 280 0 728
Relamp & Reballast w/ (2) F28T8 Lamps & (1) 2/32 Elec. Low-Power High Efficiency Ballast, 2'x4' Silver Reflector Kit 6 2 6 42 252 2600 655 N/A 70 420 0 1,092
Relamp & Reballast w/ (2) F28T8 Lamps & (1) 2/32 Elec. Low-Power High Efficiency Ballast, 2'x4' Silver Reflector Kit 1 2 1 42 42 2600 109 N/A 16 16 0 42
Relamp & Reballast w/ (2) F28T8 Lamps & (1) 2/32 Elec. Low-Power High Efficiency Ballast, 2'x4' Silver Reflector Kit 9 2 9 42 378 2600 983 N/A 70 630 0 1,638
Relamp & Reballast w/ (2) F28T8 Lamps & (1) 2/32 Elec. Low-Power High Efficiency Ballast 7 2 0 42 294 2600 764 N/A 16 112 0 291
Relamp & Reballast w/ (2) F28T8 Lamps & (1) 2/32 Elec. Low-Power High Efficiency Ballast, 2'x4' Silver Reflector Kit 3 2 3 42 126 2600 328 N/A 16 48 0 125
Relamp & Reballast w/ (2) F17T8 Lamps & (1) 2/17 Elec. Low-Power High Efficiency Ballast, 2'x2' Silver Reflector Kit 2 2 2 28 56 2600 146 N/A 26 52 0 135
Relamp & Reballast w/ (2) F28T8 Lamps & (1) 2/32 Elec. Low-Power High Efficiency Ballast, 2'x4' Silver Reflector Kit 2 2 2 42 84 2600 218 N/A 70 140 0 364
Relamp & Reballast w/ (2) F28T8 Lamps & (1) 2/32 Elec. Low-Power High Efficiency Ballast, 2'x4' Silver Reflector Kit 4 2 4 42 168 2600 437 N/A 16 64 0 166
Relamp & Reballast w/ (2) F28T8 Lamps & (1) 2/32 Elec. Low-Power High Efficiency Ballast, 2'x4' Silver Reflector Kit 6 2 6 42 252 2600 655 N/A 70 420 0 1,092
Relamp & Reballast w/ (1) F28T8 Lamp & (1) 1/32 Elec. Low-Power High Efficiency Ballast 1 1 0 22 22 2600 57 N/A 10 10 0 26
Relamp & Reballast w/ (2) F28T8 Lamps & (1) 2/32 Elec. Low-Power HE Ballast, 2'x4' Silver Reflector Kit, New 2x4 Lenses 1 2 1 42 42 3120 131 N/A 70 70 0 218
Relamp & Reballast w/ (1) F28T8 Lamp & (1) 1/32 Elec. Low-Power High Efficiency Ballast 1 1 0 22 22 130 3 N/A 10 10 0 1
No Retrofit Proposed 1 1 None 13 13 3120 41 N/A 0 0 0 0
Relamp w/ (1) 60 watt Compact Fluorescent Screw-In 2 1 0 60 120 520 62 N/A 240 480 0 250
No Retrofit Proposed 2 1 None 23 46 520 24 N/A 0 0 0 0
Relamp w/ (1) 32 watt Compact Fluorescent Screw-In 2 1 0 32 64 520 33 N/A 118 236 0 123
No Retrofit Proposed 3 3 None 60 180 520 94 N/A 0 0 0 0
Relamp & Reballast w/ (2) F28T8 Lamps & (1) 2/32 Elec. Low-Power High Efficiency Ballast, 2'x4' Silver Reflector Kit 5 2 5 42 210 1040 218 N/A 16 80 0 83
Relamp & Reballast w/ (2) F28T8 Lamps & (1) 2/32 Elec. Low-Power High Efficiency Ballast, 2'x4' Silver Reflector Kit 2 2 2 42 84 1040 87 N/A 70 140 0 146
No Retrofit Proposed 3 1 None 23 69 1040 72 N/A 0 0 0 0
Relamp w/ (1) 14 watt Compact Fluorescent Mini Spring Lamp Screw-In, 1 Piece 1 1 0 14 14 1040 15 N/A 46 46 0 48
Relamp w/ (1) 14 watt Compact Fluorescent Mini Spring Lamp Screw-In, 1 Piece 1 1 0 14 14 1040 15 N/A 46 46 0 48
Relamp w/ (1) 27 watt Compact Fluorescent Screw-In, Rewire Existing HID fixtre 1 1 0 27 27 1040 28 N/A 73 73 0 76
Relamp w/ (1) 32 watt Compact Fluorescent Screw-In 1 1 0 32 32 1040 33 N/A 118 118 0 123
No Retrofit Proposed 4 1 CF 15 60 1040 62 N/A 0 0 0 0
Relamp & Reballast w/ (2) F28T8 Lamps & (1) 2/32 Elec. Low-Power High Efficiency Ballast, 2'x4' Silver Reflector Kit 7 2 7 42 294 2600 764 N/A 16 112 0 291
Relamp & Reballast w/ (2) F28T8 Lamps & (1) 2/32 Elec. Low-Power High Efficiency Ballast, 2'x4' Silver Reflector Kit 18 2 18 42 756 2600 1966 N/A 70 1260 0 3,276
Relamp & Reballast w/ (2) F28T8 Lamps & (1) 2/32 Elec. Low-Power High Efficiency Ballast, 2'x4' Silver Reflector Kit 14 2 14 42 588 2600 1529 N/A 16 224 0 582
Relamp & Reballast w/ (2) F28T8 Lamps & (1) 2/32 Elec. Low-Power High Efficiency Ballast, 2'x4' Silver Reflector Kit 2 2 2 42 84 8760 736 N/A 70 140 0 1,226
Exit Sign LED Retrofit Kit 3 0 3 2 6 2600 16 N/A 5 15 0 39
Relamp w/ (1) 14 watt Compact Fluorescent Mini Spring Lamp Screw-In, 1 Piece 4 1 0 14 56 2600 146 N/A 46 184 0 478
No Retrofit Proposed 3 1 None 13 39 2600 101 N/A 0 0 0 0
Relamp w/ (1) 14 watt Compact Fluorescent Mini Spring Lamp Screw-In, 1 Piece 3 1 0 14 42 2600 109 N/A 46 138 0 359
Relamp & Reballast w/ (2) F28T8 Lamps & (1) 2/32 Elec. Low-Power High Efficiency Ballast, 2'x4' Silver Reflector Kit 10 2 10 42 420 2600 1092 N/A 70 700 0 1,820
Exit Sign LED Retrofit Kit 3 0 3 2 6 8760 53 N/A 5 15 0 131
Relamp & Reballast w/ (2) F28T8 Lamps & (1) 2/32 Elec. Low-Power High Efficiency Ballast, 2'x4' Silver Reflector Kit 7 2 7 42 294 1300 382 N/A 70 490 0 637
Relamp & Reballast w/ (2) F28T8 Lamps & (1) 2/32 Elec. Low-Power High Efficiency Ballast, 2'x4' Silver Reflector Kit 6 2 6 42 252 1300 328 N/A 16 96 0 125
Relamp w/ (1) 11 watt Compact Fluorescent Screw-In 6 8 0 11 66 1300 86 N/A 309 1854 0 2,410
Relamp w/ (1) 11 watt Compact Fluorescent Screw-In 1 12 0 132 132 1300 172 N/A 348 348 0 452
Relamp & Reballast w/ (2) F28T8 Lamps & (1) 2/32 Elec. Low-Power High Efficiency Ballast, 2'x4' Silver Reflector Kit 2 2 2 42 84 1300 109 N/A 70 140 0 182
Relamp & Reballast w/ (1) F28T8 Lamp & (1) 1/32 Elec. Low-Power High Efficiency Ballast 1 1 0 22 22 1300 29 N/A 10 10 0 13
Relamp & Reballast w/ (2) F28T8 Lamps & (1) 2/32 Elec. Low-Power High Efficiency Ballast 12 2 0 42 504 2600 1310 N/A 16 192 0 499
No Retrofit Proposed 2 1 None 13 26 2600 68 N/A 0 0 0 0
Relamp & Reballast w/ (2) F28T8 Lamps & (1) 2/32 Elec. Low-Power HE Ballast, 2'x4' Silver Reflector Kit, New 2x4 Lenses 1 2 1 42 42 2600 109 N/A 70 70 0 182
No Retrofit Proposed 1 3 CF 60 60 2600 156 N/A 0 0 0 0
Relamp & Reballast w/ (2) F28T8 Lamps & (1) 2/32 Elec. Low-Power HE Ballast, 2'x4' Silver Reflector Kit, New 2x4 Lenses 1 2 1 42 42 2600 109 N/A 70 70 0 182
Relamp & Reballast w/ (2) F28T8 Lamps & (1) 2/32 Elec. Low-Power High Efficiency Ballast, 2'x4' Silver Reflector Kit 9 2 9 42 378 2600 983 N/A 16 144 0 374
Relamp & Reballast w/ (1) F28T8 Lamp & (1) 1/32 Elec. Low-Power High Efficiency Ballast 6 1 0 22 132 2600 343 N/A 10 60 0 156
Relamp & Reballast w/ (2) F28T8 Lamps & (1) 2/32 Elec. Low-Power HE Ballast, 2'x4' Silver Reflector Kit, New 2x4 Lenses 4 2 4 42 168 2600 437 N/A 70 280 0 728
Relamp & Reballast w/ (2) F17T8 Lamps & (1) 2/17 Elec. Low-Power High Efficiency Ballast, 2'x2' Silver Reflector Kit 10 2 10 28 280 2600 728 N/A 26 260 0 676
Relamp & Reballast w/ (2) F17T8 Lamps & (1) 2/17 Elec. Low-Power High Efficiency Ballast, 2'x2' Silver Reflector Kit 1 2 1 28 28 2600 73 N/A 26 26 0 68
Relamp & Reballast w/ (2) F17T8 Lamps & (1) 2/17 Elec. Low-Power High Efficiency Ballast, 2'x2' Silver Reflector Kit 2 2 2 28 56 2600 146 N/A 26 52 0 135
Relamp & Reballast w/ (2) F28T8 Lamps & (1) 2/32 Elec. Low-Power High Efficiency Ballast, 2'x4' Silver Reflector Kit 2 2 2 42 84 2600 218 N/A 16 32 0 83
Relamp & Reballast w/ (1) F28T8 Lamp & (1) 1/32 Elec. Low-Power High Efficiency Ballast 1 1 0 22 22 130 3 N/A 10 10 0 1
Relamp & Reballast w/ (2) F28T8 Lamps & (1) 2/32 Elec. Low-Power High Efficiency Ballast, 2'x4' Silver Reflector Kit 1 2 1 42 42 3120 131 N/A 16 16 0 50
Relamp w/ (1) 11 watt Compact Fluorescent Screw-In 4 8 0 88 352 2600 915 N/A 232 928 0 2,413
Relamp & Reballast w/ (2) F28T8 Lamps & (1) 2/32 Elec. Low-Power High Efficiency Ballast, 2'x4' Silver Reflector Kit 23 2 23 42 966 2600 2512 N/A 70 1610 0 4,186
Relamp & Reballast w/ (2) F28T8 Lamps & (1) 2/32 Elec. Low-Power High Efficiency Ballast, 2'x4' Silver Reflector Kit 11 2 11 42 462 2600 1201 N/A 70 770 0 2,002
Relamp & Reballast w/ (2) F28T8 Lamps & (1) 2/32 Elec. Low-Power High Efficiency Ballast, 2'x4' Silver Reflector Kit 12 2 12 42 504 2600 1310 N/A 70 840 0 2,184
Relamp & Reballast w/ (1) F28T8 Lamp & (1) 1/32 Elec. Low-Power High Efficiency Ballast 1 1 0 22 22 130 3 N/A 10 10 0 1
Relamp & Reballast w/ (2) F28T8 Lamps & (1) 2/32 Elec. Low-Power HE Ballast, 2'x4' Silver Reflector Kit, New 2x4 Lenses 1 2 1 42 42 3120 131 N/A 70 70 0 218
Relamp & Reballast w/ (1) F28T8 Lamp & (1) 1/32 Elec. Low-Power High Efficiency Ballast 1 1 0 22 22 130 3 N/A 10 10 0 1
Relamp & Reballast w/ (2) F28T8 Lamps & (1) 2/32 Elec. Low-Power HE Ballast, 2'x4' Silver Reflector Kit, New 2x4 Lenses 1 2 1 42 42 3120 131 N/A 70 70 0 218
Relamp w/ (1) 15 watt Compact Fluorescent Screw-In 3 1 0 15 45 2600 117 N/A 35 105 0 273
No Retrofit Proposed 1 1 None 13 13 2600 34 N/A 0 0 0 0
Customer Union Township Town Hall
Facility Town Hall
DATE OF AUDIT:12/9/2011
AUDITOR:ALEX HILD
Post Fixture Qty Lamp Qty/ Fixt Annual Hours SavedTotal Watts Saved/ LineWatts / Fixture Post Total Watts/ Line Post Annual kWHProposed Fixture DescriptionReplacement
Fixt QtyWatts Saved/ Fixt
ENERGY ANALYSIS
Annual kWH SavedPost Watts / Sq Ft
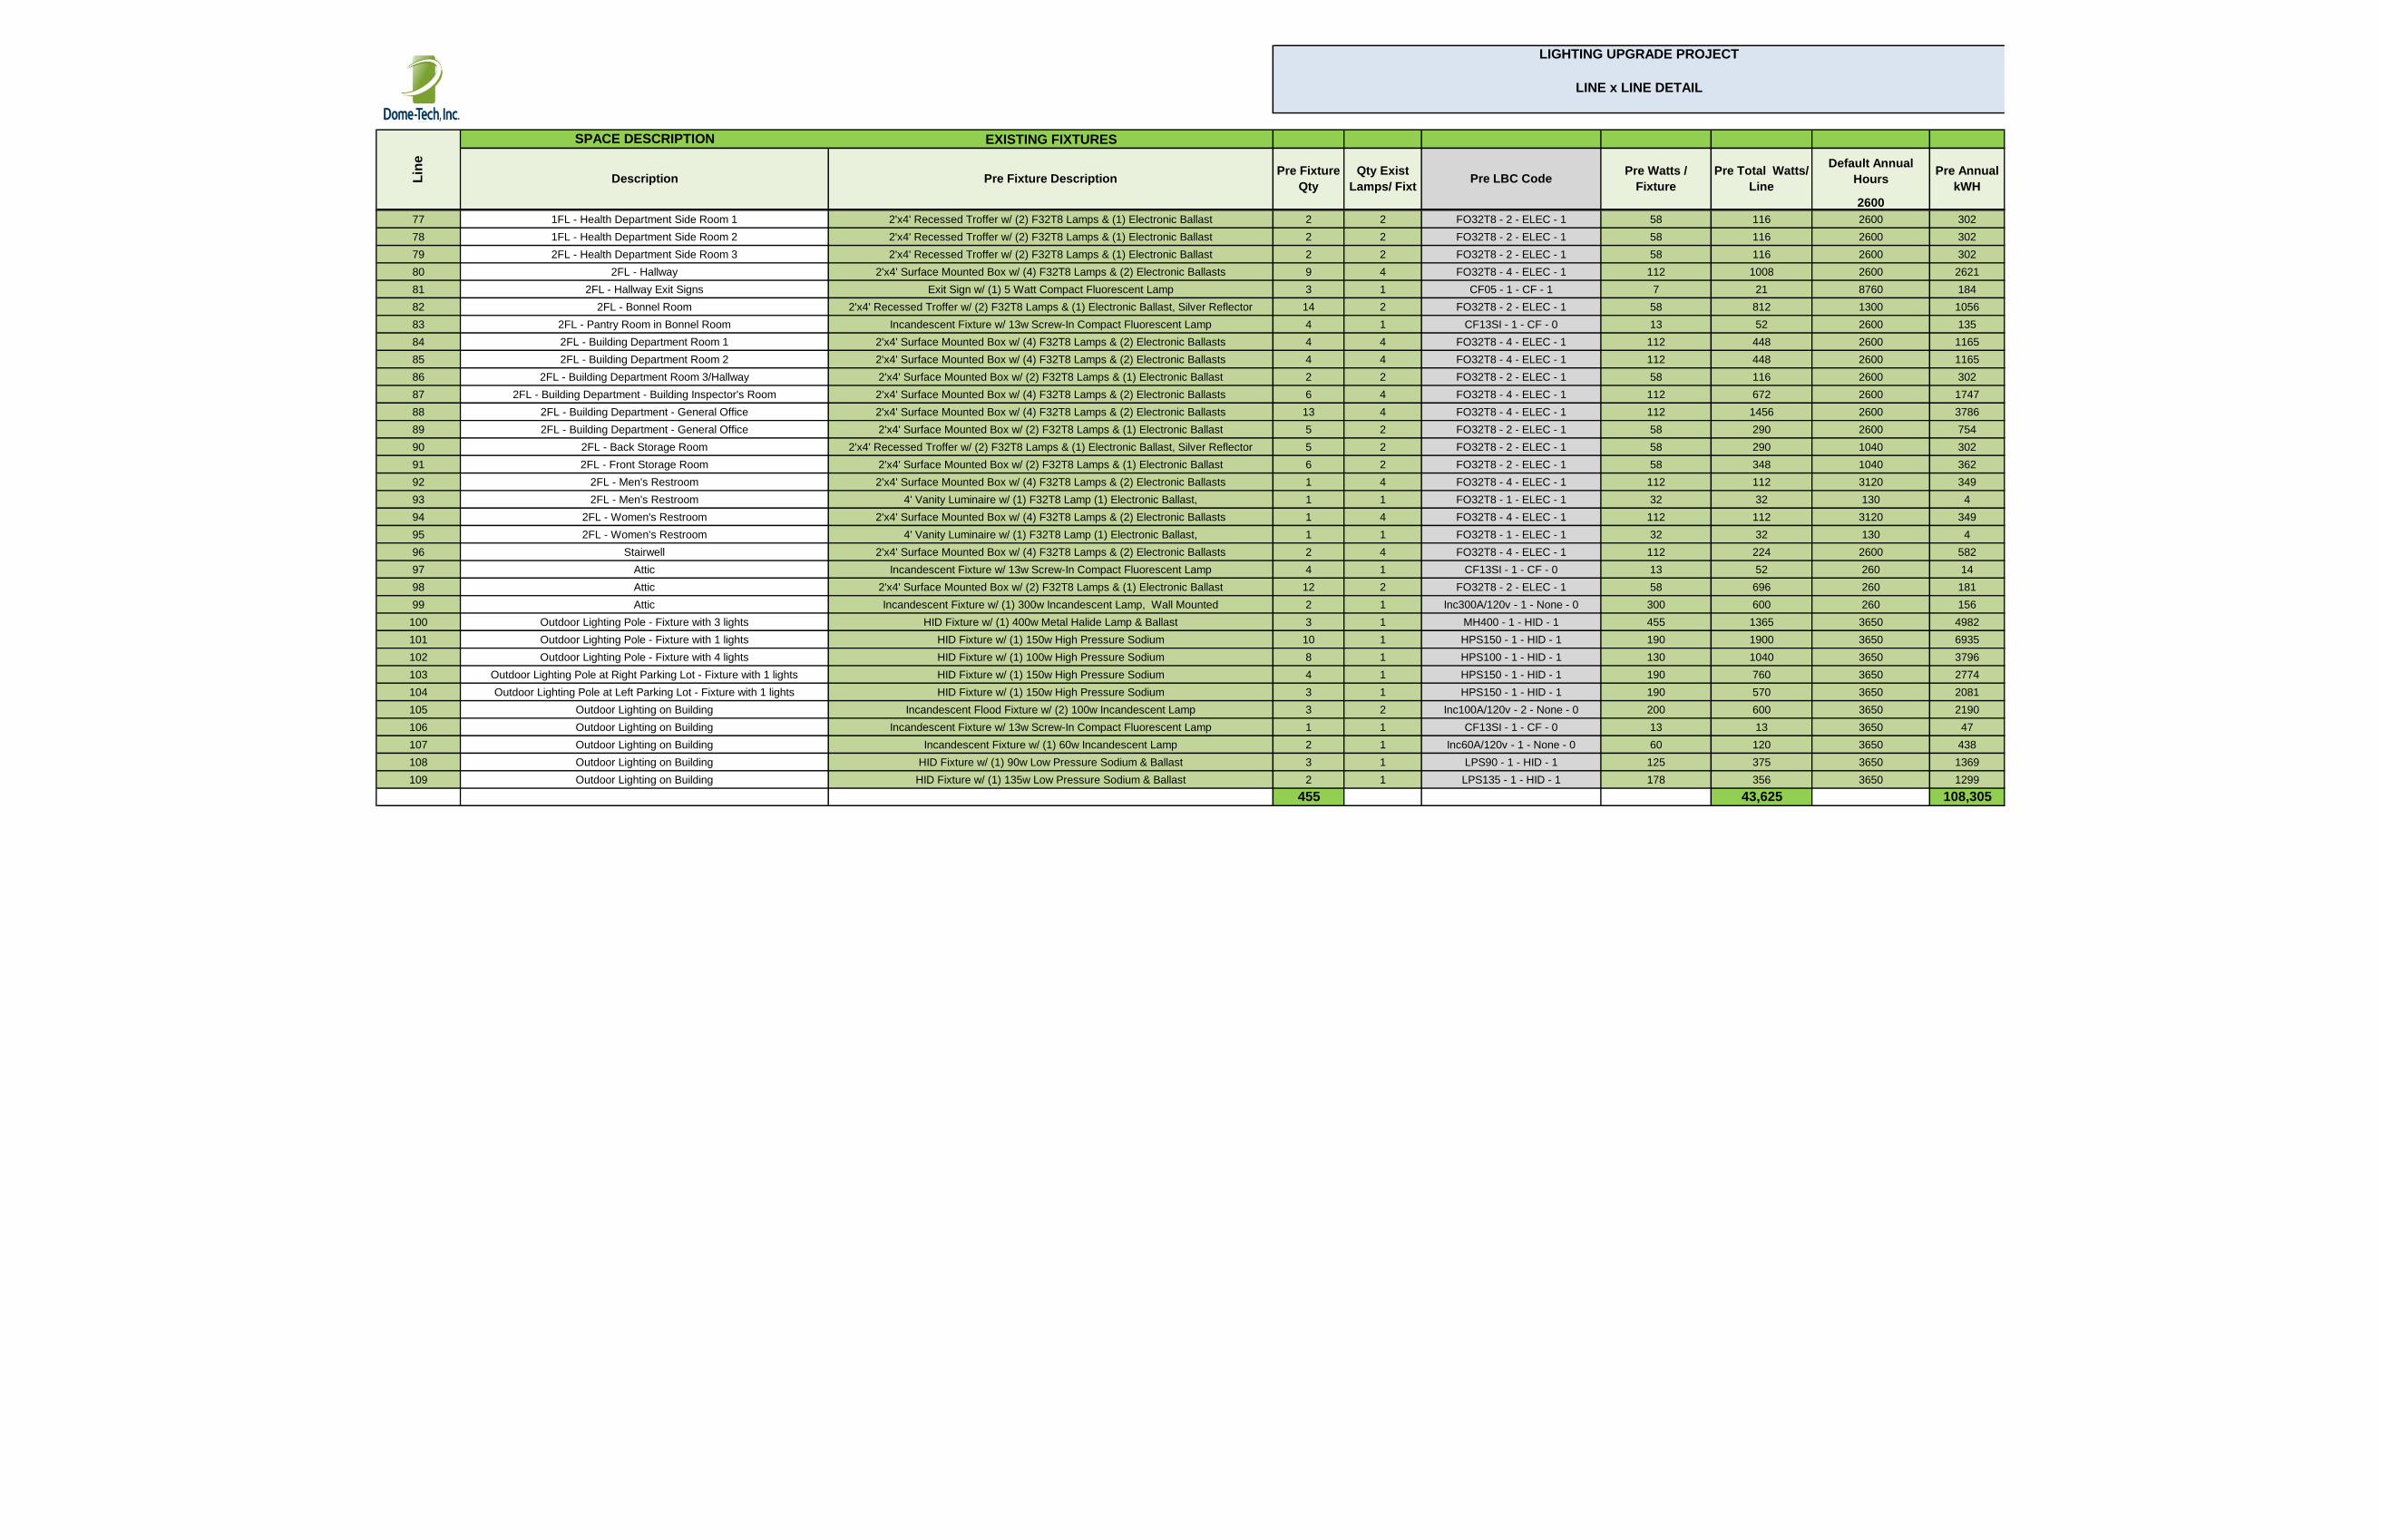
EXISTING FIXTURES
2600
Default Annual
HoursPre LBC CodePre Watts /
Fixture
Pre Total Watts/
Line
LIGHTING UPGRADE PROJECT
LINE x LINE DETAIL
Pre Annual
kWH
Lin
e
SPACE DESCRIPTION
Pre Fixture DescriptionDescriptionPre Fixture
Qty
Qty Exist
Lamps/ Fixt
77 1FL - Health Department Side Room 1 2'x4' Recessed Troffer w/ (2) F32T8 Lamps & (1) Electronic Ballast 2 2 FO32T8 - 2 - ELEC - 1 58 116 2600 302
78 1FL - Health Department Side Room 2 2'x4' Recessed Troffer w/ (2) F32T8 Lamps & (1) Electronic Ballast 2 2 FO32T8 - 2 - ELEC - 1 58 116 2600 302
79 2FL - Health Department Side Room 3 2'x4' Recessed Troffer w/ (2) F32T8 Lamps & (1) Electronic Ballast 2 2 FO32T8 - 2 - ELEC - 1 58 116 2600 302
80 2FL - Hallway 2'x4' Surface Mounted Box w/ (4) F32T8 Lamps & (2) Electronic Ballasts 9 4 FO32T8 - 4 - ELEC - 1 112 1008 2600 2621
81 2FL - Hallway Exit Signs Exit Sign w/ (1) 5 Watt Compact Fluorescent Lamp 3 1 CF05 - 1 - CF - 1 7 21 8760 184
82 2FL - Bonnel Room 2'x4' Recessed Troffer w/ (2) F32T8 Lamps & (1) Electronic Ballast, Silver Reflector 14 2 FO32T8 - 2 - ELEC - 1 58 812 1300 1056
83 2FL - Pantry Room in Bonnel Room Incandescent Fixture w/ 13w Screw-In Compact Fluorescent Lamp 4 1 CF13SI - 1 - CF - 0 13 52 2600 135
84 2FL - Building Department Room 1 2'x4' Surface Mounted Box w/ (4) F32T8 Lamps & (2) Electronic Ballasts 4 4 FO32T8 - 4 - ELEC - 1 112 448 2600 1165
85 2FL - Building Department Room 2 2'x4' Surface Mounted Box w/ (4) F32T8 Lamps & (2) Electronic Ballasts 4 4 FO32T8 - 4 - ELEC - 1 112 448 2600 1165
86 2FL - Building Department Room 3/Hallway 2'x4' Surface Mounted Box w/ (2) F32T8 Lamps & (1) Electronic Ballast 2 2 FO32T8 - 2 - ELEC - 1 58 116 2600 302
87 2FL - Building Department - Building Inspector's Room 2'x4' Surface Mounted Box w/ (4) F32T8 Lamps & (2) Electronic Ballasts 6 4 FO32T8 - 4 - ELEC - 1 112 672 2600 1747
88 2FL - Building Department - General Office 2'x4' Surface Mounted Box w/ (4) F32T8 Lamps & (2) Electronic Ballasts 13 4 FO32T8 - 4 - ELEC - 1 112 1456 2600 3786
89 2FL - Building Department - General Office 2'x4' Surface Mounted Box w/ (2) F32T8 Lamps & (1) Electronic Ballast 5 2 FO32T8 - 2 - ELEC - 1 58 290 2600 754
90 2FL - Back Storage Room 2'x4' Recessed Troffer w/ (2) F32T8 Lamps & (1) Electronic Ballast, Silver Reflector 5 2 FO32T8 - 2 - ELEC - 1 58 290 1040 302
91 2FL - Front Storage Room 2'x4' Surface Mounted Box w/ (2) F32T8 Lamps & (1) Electronic Ballast 6 2 FO32T8 - 2 - ELEC - 1 58 348 1040 362
92 2FL - Men's Restroom 2'x4' Surface Mounted Box w/ (4) F32T8 Lamps & (2) Electronic Ballasts 1 4 FO32T8 - 4 - ELEC - 1 112 112 3120 349
93 2FL - Men's Restroom 4' Vanity Luminaire w/ (1) F32T8 Lamp (1) Electronic Ballast, 1 1 FO32T8 - 1 - ELEC - 1 32 32 130 4
94 2FL - Women's Restroom 2'x4' Surface Mounted Box w/ (4) F32T8 Lamps & (2) Electronic Ballasts 1 4 FO32T8 - 4 - ELEC - 1 112 112 3120 349
95 2FL - Women's Restroom 4' Vanity Luminaire w/ (1) F32T8 Lamp (1) Electronic Ballast, 1 1 FO32T8 - 1 - ELEC - 1 32 32 130 4
96 Stairwell 2'x4' Surface Mounted Box w/ (4) F32T8 Lamps & (2) Electronic Ballasts 2 4 FO32T8 - 4 - ELEC - 1 112 224 2600 582
97 Attic Incandescent Fixture w/ 13w Screw-In Compact Fluorescent Lamp 4 1 CF13SI - 1 - CF - 0 13 52 260 14
98 Attic 2'x4' Surface Mounted Box w/ (2) F32T8 Lamps & (1) Electronic Ballast 12 2 FO32T8 - 2 - ELEC - 1 58 696 260 181
99 Attic Incandescent Fixture w/ (1) 300w Incandescent Lamp, Wall Mounted 2 1 Inc300A/120v - 1 - None - 0 300 600 260 156
100 Outdoor Lighting Pole - Fixture with 3 lights HID Fixture w/ (1) 400w Metal Halide Lamp & Ballast 3 1 MH400 - 1 - HID - 1 455 1365 3650 4982
101 Outdoor Lighting Pole - Fixture with 1 lights HID Fixture w/ (1) 150w High Pressure Sodium 10 1 HPS150 - 1 - HID - 1 190 1900 3650 6935
102 Outdoor Lighting Pole - Fixture with 4 lights HID Fixture w/ (1) 100w High Pressure Sodium 8 1 HPS100 - 1 - HID - 1 130 1040 3650 3796
103 Outdoor Lighting Pole at Right Parking Lot - Fixture with 1 lights HID Fixture w/ (1) 150w High Pressure Sodium 4 1 HPS150 - 1 - HID - 1 190 760 3650 2774
104 Outdoor Lighting Pole at Left Parking Lot - Fixture with 1 lights HID Fixture w/ (1) 150w High Pressure Sodium 3 1 HPS150 - 1 - HID - 1 190 570 3650 2081
105 Outdoor Lighting on Building Incandescent Flood Fixture w/ (2) 100w Incandescent Lamp 3 2 Inc100A/120v - 2 - None - 0 200 600 3650 2190
106 Outdoor Lighting on Building Incandescent Fixture w/ 13w Screw-In Compact Fluorescent Lamp 1 1 CF13SI - 1 - CF - 0 13 13 3650 47
107 Outdoor Lighting on Building Incandescent Fixture w/ (1) 60w Incandescent Lamp 2 1 Inc60A/120v - 1 - None - 0 60 120 3650 438
108 Outdoor Lighting on Building HID Fixture w/ (1) 90w Low Pressure Sodium & Ballast 3 1 LPS90 - 1 - HID - 1 125 375 3650 1369
109 Outdoor Lighting on Building HID Fixture w/ (1) 135w Low Pressure Sodium & Ballast 2 1 LPS135 - 1 - HID - 1 178 356 3650 1299
455 43,625 108,305
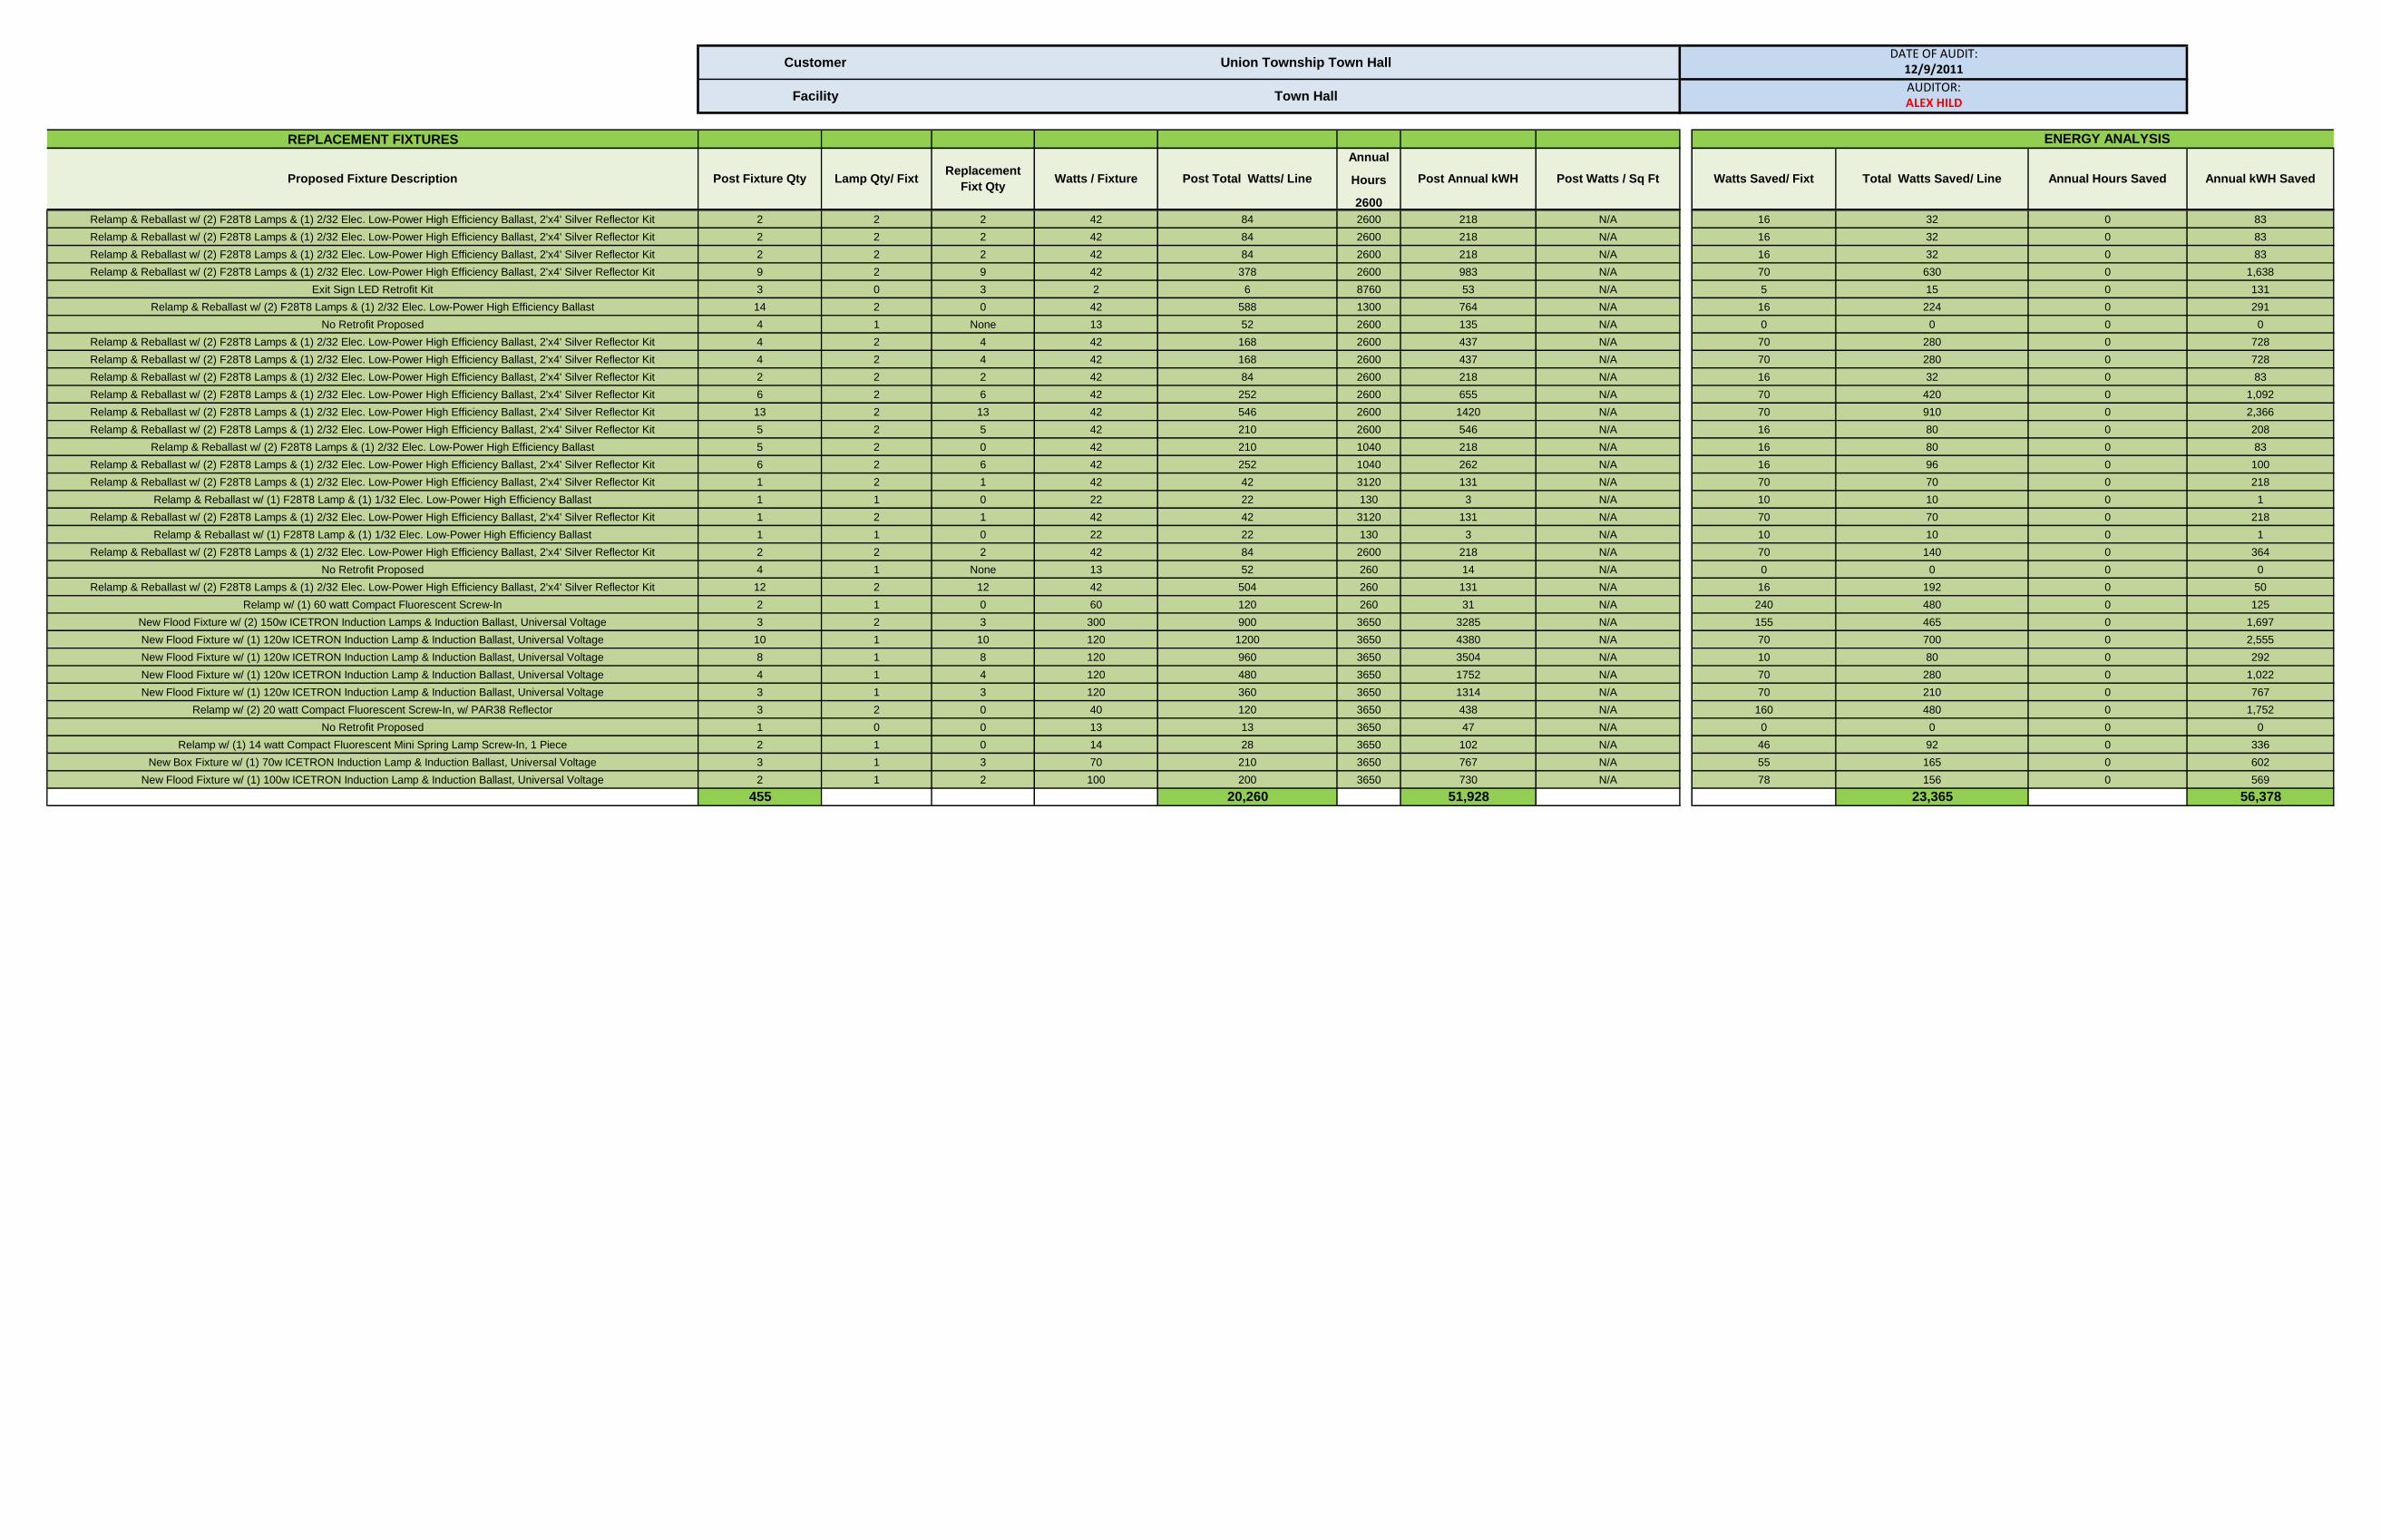
REPLACEMENT FIXTURES
Annual
Hours
2600
Customer Union Township Town Hall
Facility Town Hall
DATE OF AUDIT:12/9/2011
AUDITOR:ALEX HILD
Post Fixture Qty Lamp Qty/ Fixt Annual Hours SavedTotal Watts Saved/ LineWatts / Fixture Post Total Watts/ Line Post Annual kWHProposed Fixture DescriptionReplacement
Fixt QtyWatts Saved/ Fixt
ENERGY ANALYSIS
Annual kWH SavedPost Watts / Sq Ft
Relamp & Reballast w/ (2) F28T8 Lamps & (1) 2/32 Elec. Low-Power High Efficiency Ballast, 2'x4' Silver Reflector Kit 2 2 2 42 84 2600 218 N/A 16 32 0 83
Relamp & Reballast w/ (2) F28T8 Lamps & (1) 2/32 Elec. Low-Power High Efficiency Ballast, 2'x4' Silver Reflector Kit 2 2 2 42 84 2600 218 N/A 16 32 0 83
Relamp & Reballast w/ (2) F28T8 Lamps & (1) 2/32 Elec. Low-Power High Efficiency Ballast, 2'x4' Silver Reflector Kit 2 2 2 42 84 2600 218 N/A 16 32 0 83
Relamp & Reballast w/ (2) F28T8 Lamps & (1) 2/32 Elec. Low-Power High Efficiency Ballast, 2'x4' Silver Reflector Kit 9 2 9 42 378 2600 983 N/A 70 630 0 1,638
Exit Sign LED Retrofit Kit 3 0 3 2 6 8760 53 N/A 5 15 0 131
Relamp & Reballast w/ (2) F28T8 Lamps & (1) 2/32 Elec. Low-Power High Efficiency Ballast 14 2 0 42 588 1300 764 N/A 16 224 0 291
No Retrofit Proposed 4 1 None 13 52 2600 135 N/A 0 0 0 0
Relamp & Reballast w/ (2) F28T8 Lamps & (1) 2/32 Elec. Low-Power High Efficiency Ballast, 2'x4' Silver Reflector Kit 4 2 4 42 168 2600 437 N/A 70 280 0 728
Relamp & Reballast w/ (2) F28T8 Lamps & (1) 2/32 Elec. Low-Power High Efficiency Ballast, 2'x4' Silver Reflector Kit 4 2 4 42 168 2600 437 N/A 70 280 0 728
Relamp & Reballast w/ (2) F28T8 Lamps & (1) 2/32 Elec. Low-Power High Efficiency Ballast, 2'x4' Silver Reflector Kit 2 2 2 42 84 2600 218 N/A 16 32 0 83
Relamp & Reballast w/ (2) F28T8 Lamps & (1) 2/32 Elec. Low-Power High Efficiency Ballast, 2'x4' Silver Reflector Kit 6 2 6 42 252 2600 655 N/A 70 420 0 1,092
Relamp & Reballast w/ (2) F28T8 Lamps & (1) 2/32 Elec. Low-Power High Efficiency Ballast, 2'x4' Silver Reflector Kit 13 2 13 42 546 2600 1420 N/A 70 910 0 2,366
Relamp & Reballast w/ (2) F28T8 Lamps & (1) 2/32 Elec. Low-Power High Efficiency Ballast, 2'x4' Silver Reflector Kit 5 2 5 42 210 2600 546 N/A 16 80 0 208
Relamp & Reballast w/ (2) F28T8 Lamps & (1) 2/32 Elec. Low-Power High Efficiency Ballast 5 2 0 42 210 1040 218 N/A 16 80 0 83
Relamp & Reballast w/ (2) F28T8 Lamps & (1) 2/32 Elec. Low-Power High Efficiency Ballast, 2'x4' Silver Reflector Kit 6 2 6 42 252 1040 262 N/A 16 96 0 100
Relamp & Reballast w/ (2) F28T8 Lamps & (1) 2/32 Elec. Low-Power High Efficiency Ballast, 2'x4' Silver Reflector Kit 1 2 1 42 42 3120 131 N/A 70 70 0 218
Relamp & Reballast w/ (1) F28T8 Lamp & (1) 1/32 Elec. Low-Power High Efficiency Ballast 1 1 0 22 22 130 3 N/A 10 10 0 1
Relamp & Reballast w/ (2) F28T8 Lamps & (1) 2/32 Elec. Low-Power High Efficiency Ballast, 2'x4' Silver Reflector Kit 1 2 1 42 42 3120 131 N/A 70 70 0 218
Relamp & Reballast w/ (1) F28T8 Lamp & (1) 1/32 Elec. Low-Power High Efficiency Ballast 1 1 0 22 22 130 3 N/A 10 10 0 1
Relamp & Reballast w/ (2) F28T8 Lamps & (1) 2/32 Elec. Low-Power High Efficiency Ballast, 2'x4' Silver Reflector Kit 2 2 2 42 84 2600 218 N/A 70 140 0 364
No Retrofit Proposed 4 1 None 13 52 260 14 N/A 0 0 0 0
Relamp & Reballast w/ (2) F28T8 Lamps & (1) 2/32 Elec. Low-Power High Efficiency Ballast, 2'x4' Silver Reflector Kit 12 2 12 42 504 260 131 N/A 16 192 0 50
Relamp w/ (1) 60 watt Compact Fluorescent Screw-In 2 1 0 60 120 260 31 N/A 240 480 0 125
New Flood Fixture w/ (2) 150w ICETRON Induction Lamps & Induction Ballast, Universal Voltage 3 2 3 300 900 3650 3285 N/A 155 465 0 1,697
New Flood Fixture w/ (1) 120w ICETRON Induction Lamp & Induction Ballast, Universal Voltage 10 1 10 120 1200 3650 4380 N/A 70 700 0 2,555
New Flood Fixture w/ (1) 120w ICETRON Induction Lamp & Induction Ballast, Universal Voltage 8 1 8 120 960 3650 3504 N/A 10 80 0 292
New Flood Fixture w/ (1) 120w ICETRON Induction Lamp & Induction Ballast, Universal Voltage 4 1 4 120 480 3650 1752 N/A 70 280 0 1,022
New Flood Fixture w/ (1) 120w ICETRON Induction Lamp & Induction Ballast, Universal Voltage 3 1 3 120 360 3650 1314 N/A 70 210 0 767
Relamp w/ (2) 20 watt Compact Fluorescent Screw-In, w/ PAR38 Reflector 3 2 0 40 120 3650 438 N/A 160 480 0 1,752
No Retrofit Proposed 1 0 0 13 13 3650 47 N/A 0 0 0 0
Relamp w/ (1) 14 watt Compact Fluorescent Mini Spring Lamp Screw-In, 1 Piece 2 1 0 14 28 3650 102 N/A 46 92 0 336
New Box Fixture w/ (1) 70w ICETRON Induction Lamp & Induction Ballast, Universal Voltage 3 1 3 70 210 3650 767 N/A 55 165 0 602
New Flood Fixture w/ (1) 100w ICETRON Induction Lamp & Induction Ballast, Universal Voltage 2 1 2 100 200 3650 730 N/A 78 156 0 569
455 20,260 51,928 23,365 56,378

HVAC EQUIPMENT LIST - UNION TOWNSHIP Prepared By Dome-Tech, Inc.
TAG # LOCATION AREA SERVING EQUIPMENT MANUFACTURER MODEL # Cooling CAPACITY (Tons) Heating CAPACITY (Btu-h)SUPPLY AIR
(CFM)FAN (HP)
Motor
InformationCONTROLS NOTES
1 AC-1 Bsmt Boiler Room Offices AHU 40 14,510 DDC
2 AC-2 Bsmt Boiler Room Assembly Area AHU 20 DDC
3 DX-1 Roof AC-1 DX Condenser Trane 40 Interlock
4 DX-2 Roof AC-2 DX Condenser Trane 20 Interlock
5 Data Processing - Phone Room Data Processing - Phone Room Wall Mounted Split AC Mitsubishi MS09EW
6 Data Processing - Datacenter Data Processing - Datacenter Wall Mounted Split AC Mitsubishi MS09EW
7 Data Processing - Datacenter Data Processing - Datacenter Wall Mounted Split AC Mitsubishi MrSlim
8 Accounts Accounts Wall Mounted Split AC Fujitsu ASU12R1A
9 Outdoors Accounts DX Condenser Fujitsu AOU12R1
10 Bonnel Room Bonnel Room Fan Coil Unit Inter-City Products BYMD30-46GA 3 55,000 0.33
11 Roof above Vestible Vestible Heat Pump Inter-City Products YE036H 3
12 Roof above Vestible Vestible Central Furnace Inter-City Products D5YS024N04506A 55,000
13
14
15
16
Page 1

MOTORS - EQUIPMENT LIST - UNION TOWNSHIP Prepared by Dome-Tech, Inc.
Motor ID Quantity
Loading
(Constant/Vari
able)
Affiliated System Control Type MANUFACTURER MODEL # Motor HP Nominal EffSpeed
(RPM)NOTES
P-1 1 Constant HW DDC Bell and Gossett 0.2 1725
P-2 1 Constant HW DDC Bell and Gossett 0.2 1725
P-3 1 Constant HW DDC Bell and Gossett 0.2 1725
P-4 1 Constant HW DDC Bell and Gossett 0.2 1725
P-5 1 Constant HW DDC Bell and Gossett 0.2 1725
P-6 1 Constant HW DDC Bell and Gossett 0.3 1725
P-7 1 Constant HW DDC Bell and Gossett 0.3 1725
P-8 1 Constant HW DDC 5.0 1725
P-9 1 Constant HW DDC 5.0 1725
Page 2

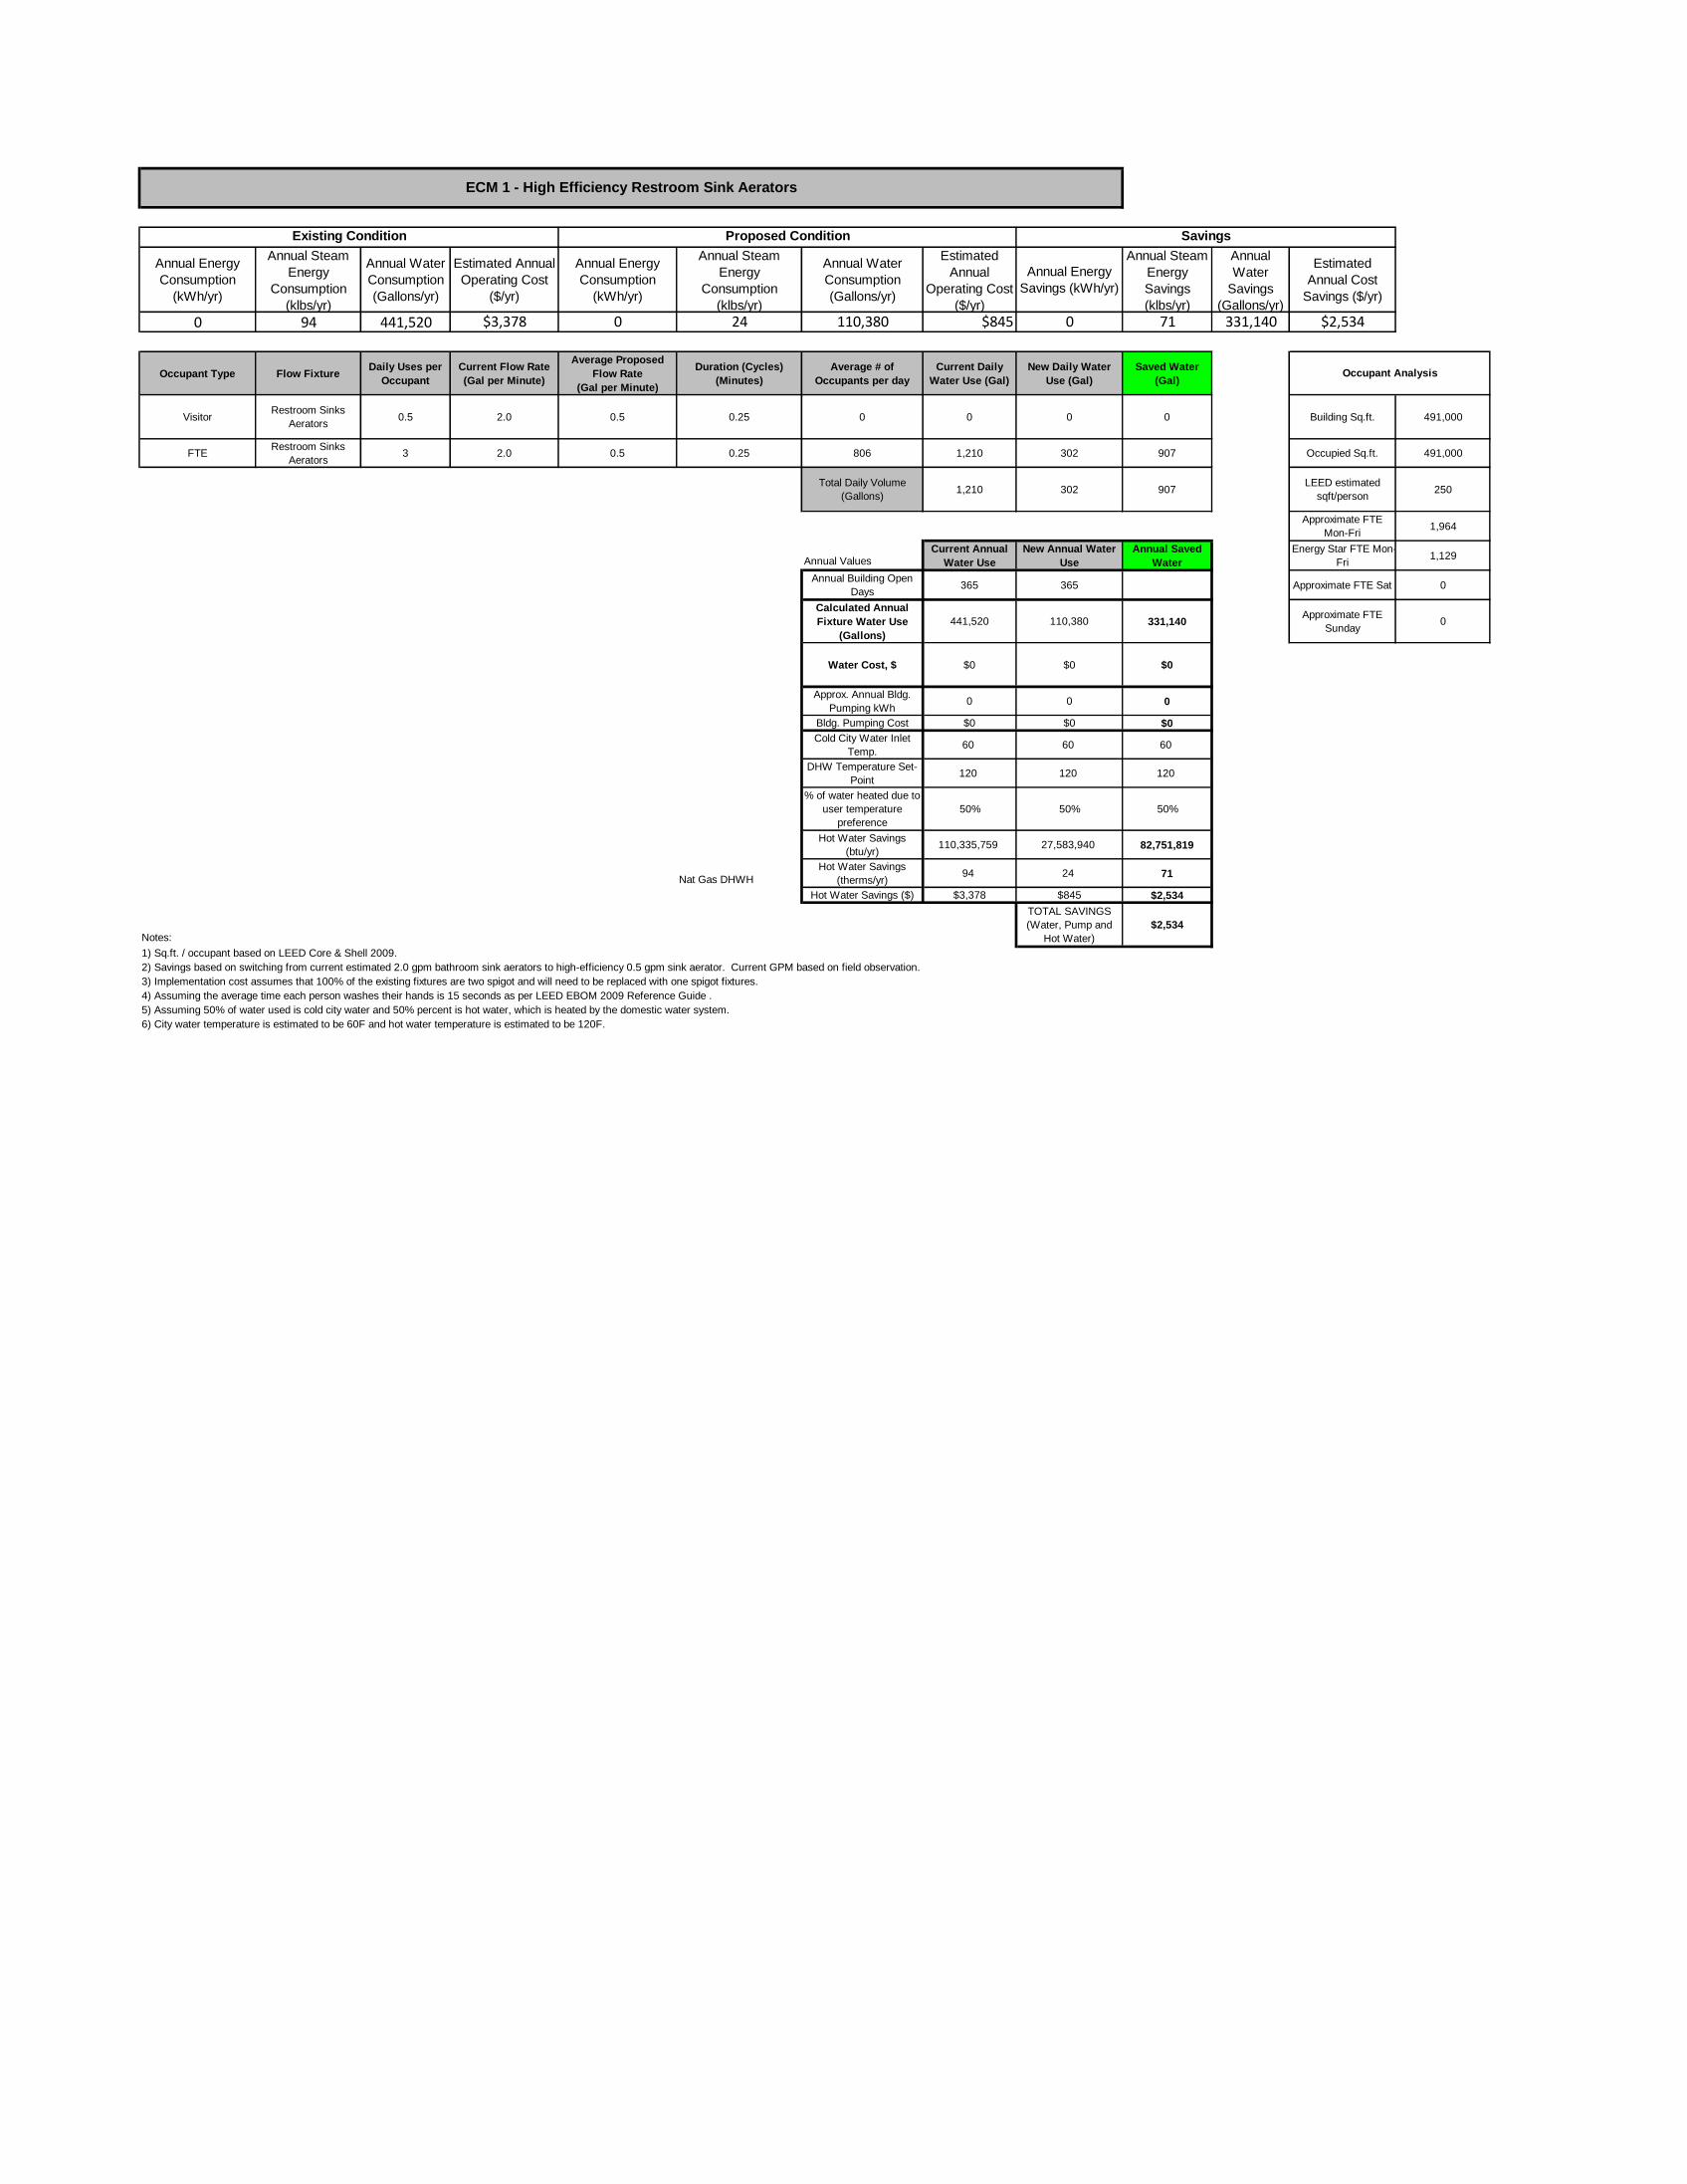
Existing Condition Proposed Condition Savings
Annual Energy
Consumption
(kWh/yr)
Annual Steam
Energy
Consumption
(klbs/yr)
Annual Water
Consumption
(Gallons/yr)
Estimated Annual
Operating Cost
($/yr)
Annual Energy
Consumption
(kWh/yr)
Annual Steam
Energy
Consumption
(klbs/yr)
Annual Water
Consumption
(Gallons/yr)
Estimated
Annual
Operating Cost
($/yr)
Annual Energy
Savings (kWh/yr)
Annual Steam
Energy
Savings
(klbs/yr)
Annual
Water
Savings
(Gallons/yr)
Estimated
Annual Cost
Savings ($/yr)
0 94 441,520 $3,378 0 24 110,380 $845 0 71 331,140 $2,534
Occupant Type Flow FixtureDaily Uses per
Occupant
Current Flow Rate
(Gal per Minute)
Average Proposed
Flow Rate
(Gal per Minute)
Duration (Cycles)
(Minutes)
Average # of
Occupants per day
Current Daily
Water Use (Gal)
New Daily Water
Use (Gal)
Saved Water
(Gal)
VisitorRestroom Sinks
Aerators0.5 2.0 0.5 0.25 0 0 0 0 Building Sq.ft. 491,000
FTERestroom Sinks
Aerators3 2.0 0.5 0.25 806 1,210 302 907 Occupied Sq.ft. 491,000
Total Daily Volume
(Gallons)1,210 302 907
LEED estimated
sqft/person250
Approximate FTE
Mon-Fri1,964
Annual ValuesCurrent Annual
Water Use
New Annual Water
Use
Annual Saved
Water
Energy Star FTE Mon-
Fri1,129
Annual Building Open
Days365 365 Approximate FTE Sat 0
Calculated Annual
Fixture Water Use
(Gallons)
441,520 110,380 331,140Approximate FTE
Sunday0
Water Cost, $ $0 $0 $0
Approx. Annual Bldg.
Pumping kWh0 0 0
Bldg. Pumping Cost $0 $0 $0
Cold City Water Inlet
Temp.60 60 60
DHW Temperature Set-
Point120 120 120
% of water heated due to
user temperature
preference
50% 50% 50%
Hot Water Savings
(btu/yr)110,335,759 27,583,940 82,751,819
Nat Gas DHWH
Hot Water Savings
(therms/yr)94 24 71
Hot Water Savings ($) $3,378 $845 $2,534
Notes:
TOTAL SAVINGS
(Water, Pump and
Hot Water)
$2,534
1) Sq.ft. / occupant based on LEED Core & Shell 2009.
2) Savings based on switching from current estimated 2.0 gpm bathroom sink aerators to high-efficiency 0.5 gpm sink aerator. Current GPM based on field observation.
3) Implementation cost assumes that 100% of the existing fixtures are two spigot and will need to be replaced with one spigot fixtures.
4) Assuming the average time each person washes their hands is 15 seconds as per LEED EBOM 2009 Reference Guide .
5) Assuming 50% of water used is cold city water and 50% percent is hot water, which is heated by the domestic water system.
6) City water temperature is estimated to be 60F and hot water temperature is estimated to be 120F.
Occupant Analysis
ECM 1 - High Efficiency Restroom Sink Aerators
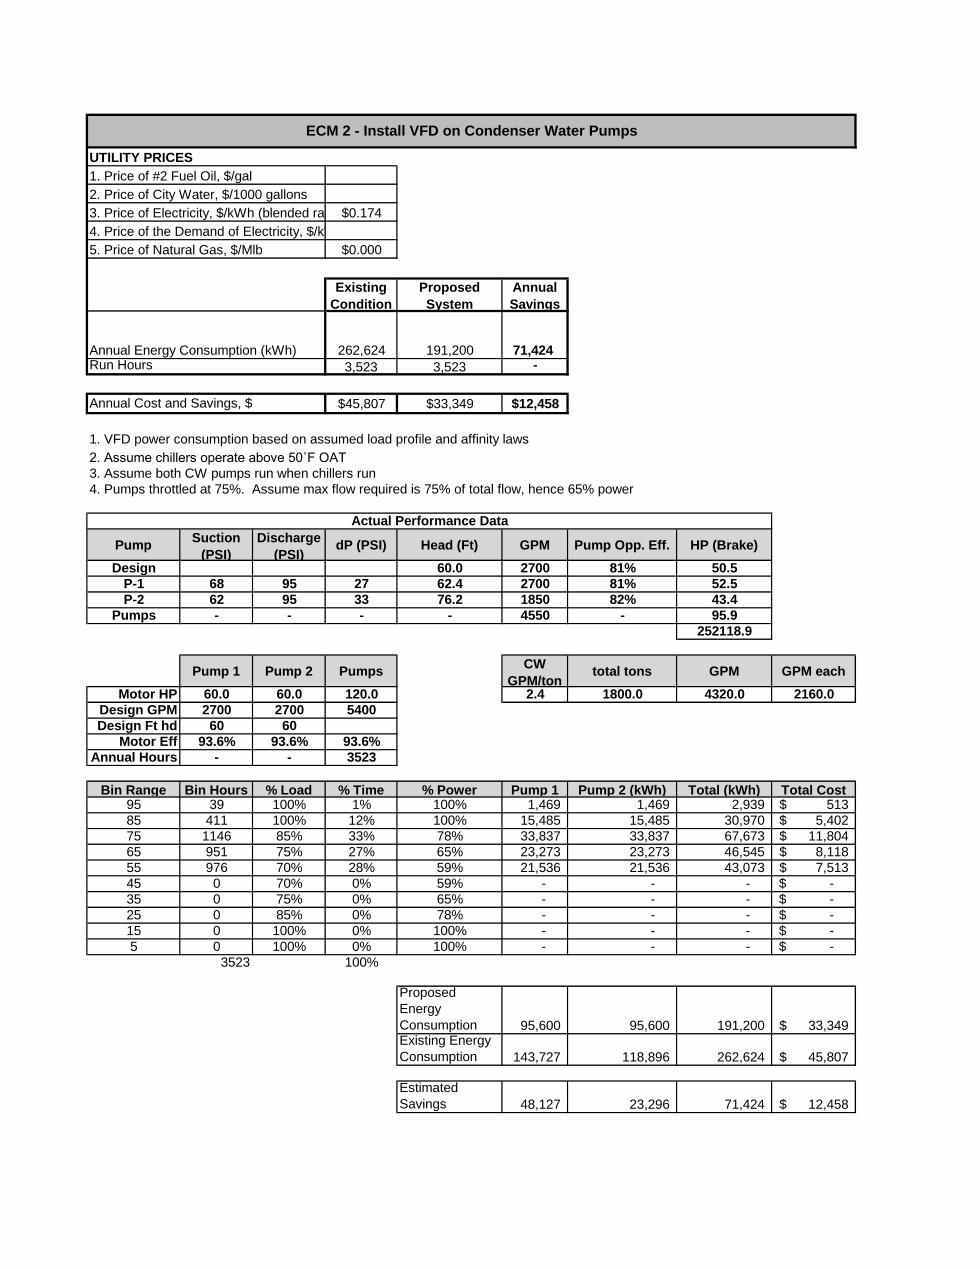
UTILITY PRICES
$0.174
$0.000
Existing
Condition
Proposed
System
Annual
Savings
262,624 191,200 71,424
3,523 3,523 -
$45,807 $33,349 $12,458
1. VFD power consumption based on assumed load profile and affinity laws
2. Assume chillers operate above 50˚F OAT
3. Assume both CW pumps run when chillers run
4. Pumps throttled at 75%. Assume max flow required is 75% of total flow, hence 65% power
PumpSuction
(PSI)
Discharge
(PSI)dP (PSI) Head (Ft) GPM Pump Opp. Eff. HP (Brake)
Design 60.0 2700 81% 50.5
P-1 68 95 27 62.4 2700 81% 52.5
P-2 62 95 33 76.2 1850 82% 43.4
Pumps - - - - 4550 - 95.9
252118.9
Pump 1 Pump 2 PumpsCW
GPM/tontotal tons GPM GPM each
Motor HP 60.0 60.0 120.0 2.4 1800.0 4320.0 2160.0
Design GPM 2700 2700 5400
Design Ft hd 60 60
Motor Eff 93.6% 93.6% 93.6%
Annual Hours - - 3523
Bin Range Bin Hours % Load % Time % Power Pump 1 Pump 2 (kWh) Total (kWh) Total Cost 95 39 100% 1% 100% 1,469 1,469 2,939 513$
85 411 100% 12% 100% 15,485 15,485 30,970 5,402$
75 1146 85% 33% 78% 33,837 33,837 67,673 11,804$
65 951 75% 27% 65% 23,273 23,273 46,545 8,118$
55 976 70% 28% 59% 21,536 21,536 43,073 7,513$
45 0 70% 0% 59% - - - -$
35 0 75% 0% 65% - - - -$
25 0 85% 0% 78% - - - -$
15 0 100% 0% 100% - - - -$
5 0 100% 0% 100% - - - -$
3523 100%
Proposed
Energy
Consumption 95,600 95,600 191,200 33,349$ Existing Energy
Consumption 143,727 118,896 262,624 45,807$
Estimated
Savings 48,127 23,296 71,424 12,458$
Run Hours
Annual Cost and Savings, $
2. Price of City Water, $/1000 gallons
3. Price of Electricity, $/kWh (blended rate)
4. Price of the Demand of Electricity, $/kW/month
5. Price of Natural Gas, $/Mlb
Annual Energy Consumption (kWh)
Actual Performance Data
ECM 2 - Install VFD on Condenser Water Pumps
1. Price of #2 Fuel Oil, $/gal
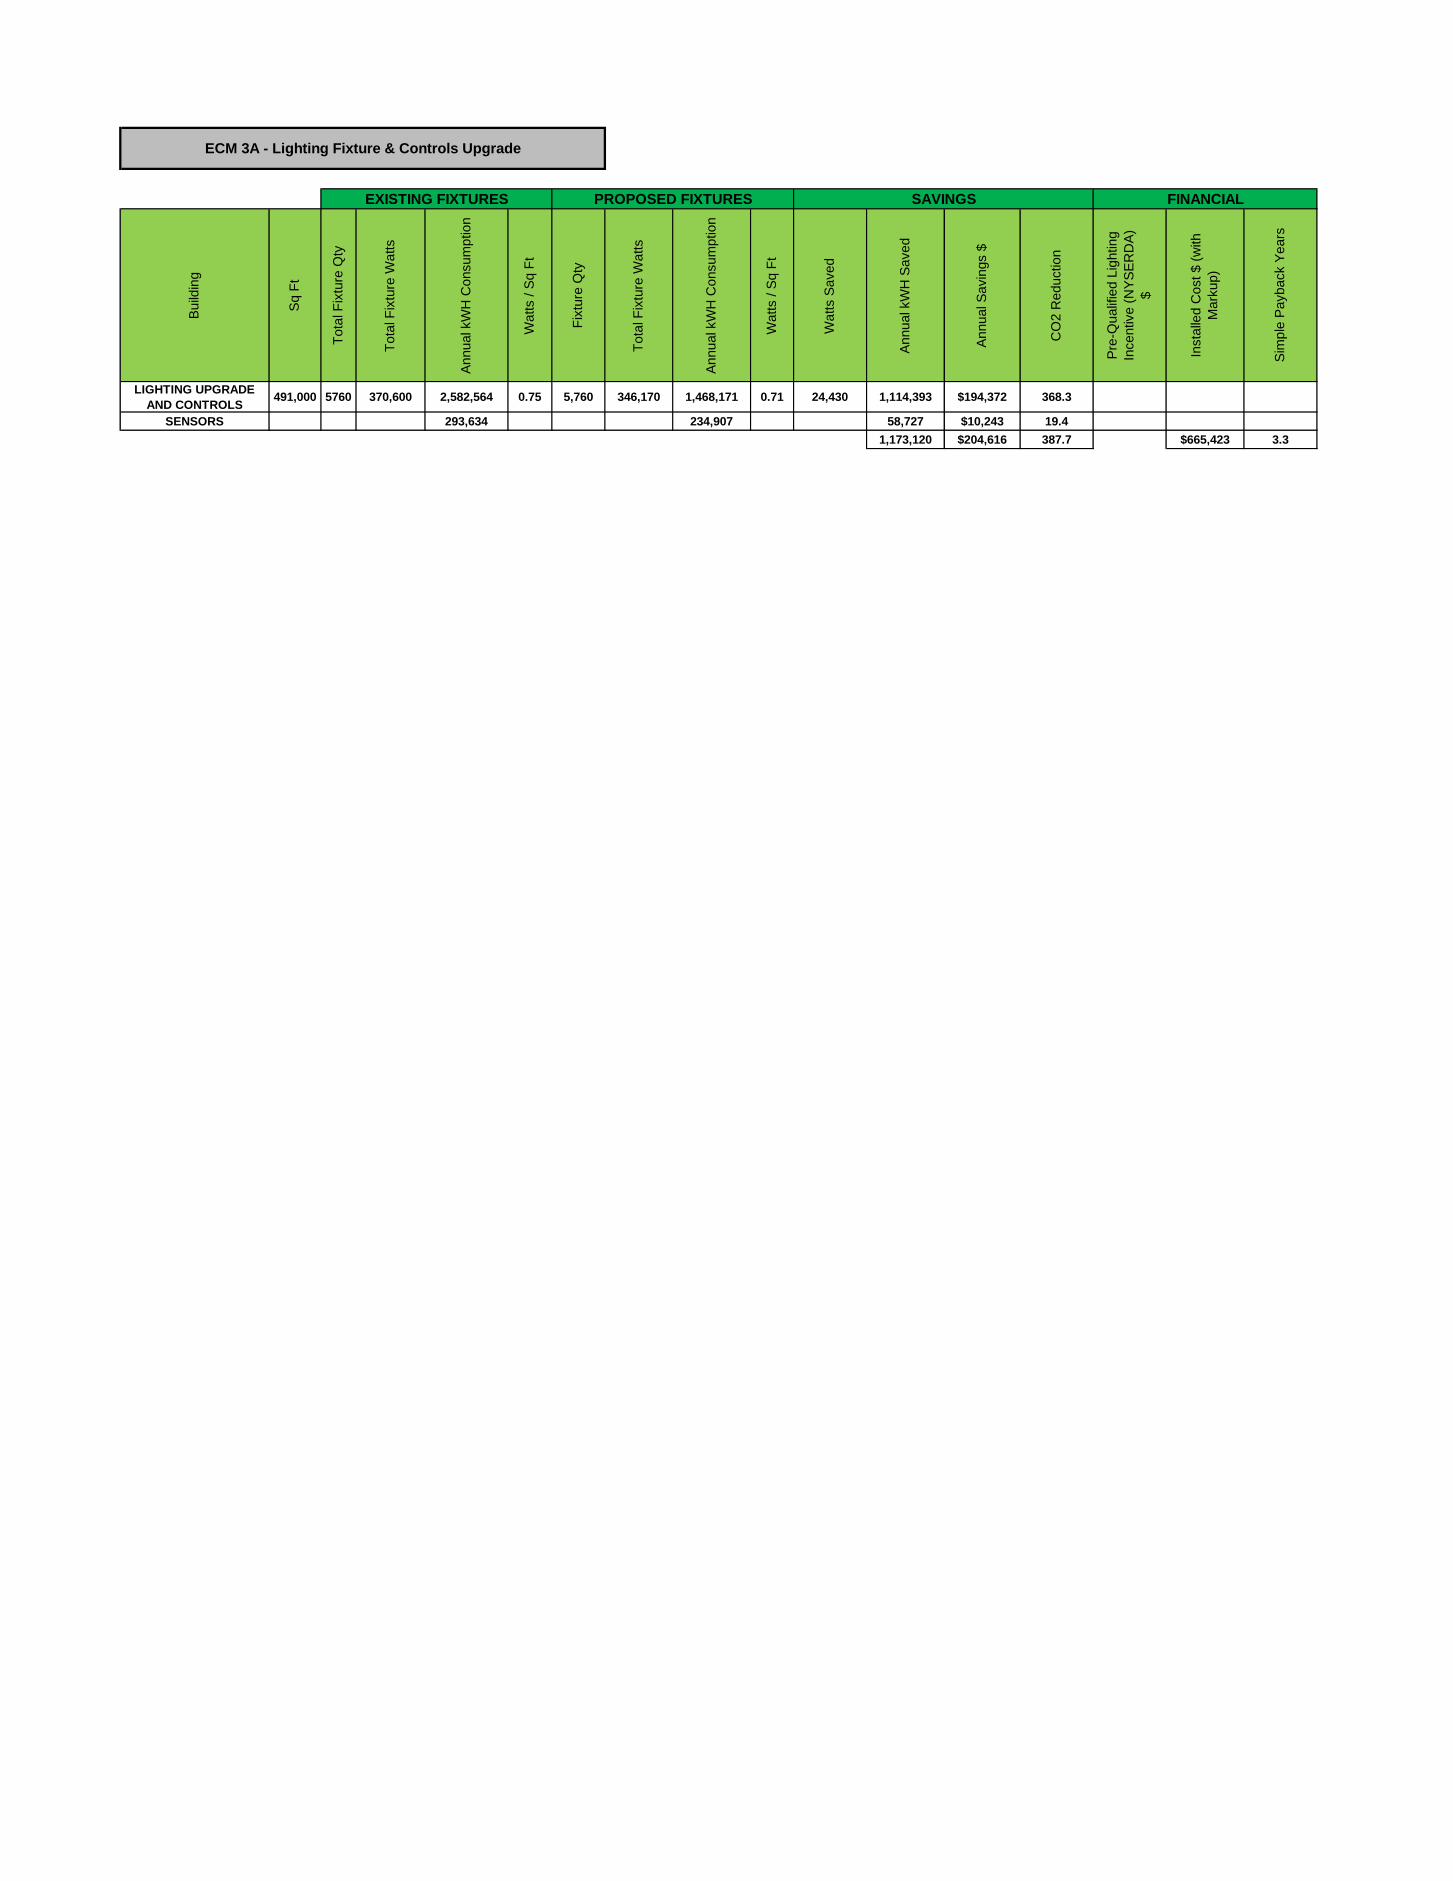
Bu
ildin
g
Sq
Ft
To
tal F
ixtu
re Q
ty
To
tal F
ixtu
re W
atts
An
nu
al kW
H C
onsu
mp
tio
n
Wa
tts /
Sq
Ft
Fix
ture
Qty
To
tal F
ixtu
re W
atts
An
nu
al kW
H C
onsu
mp
tio
n
Wa
tts /
Sq
Ft
Wa
tts S
ave
d
An
nu
al kW
H S
ave
d
An
nu
al S
avin
gs $
CO
2 R
edu
ctio
n
Pre
-Qu
alif
ied L
ightin
g
Ince
ntive
(N
YS
ER
DA
)
$
Insta
lled C
ost
$ (
with
Ma
rku
p)
Sim
ple
Pa
yb
ack Y
ears
LIGHTING UPGRADE
AND CONTROLS491,000 5760 370,600 2,582,564 0.75 5,760 346,170 1,468,171 0.71 24,430 1,114,393 $194,372 368.3
SENSORS 293,634 234,907 58,727 $10,243 19.4
1,173,120 $204,616 387.7 $665,423 3.3
EXISTING FIXTURES PROPOSED FIXTURES SAVINGS FINANCIAL
ECM 3A - Lighting Fixture & Controls Upgrade
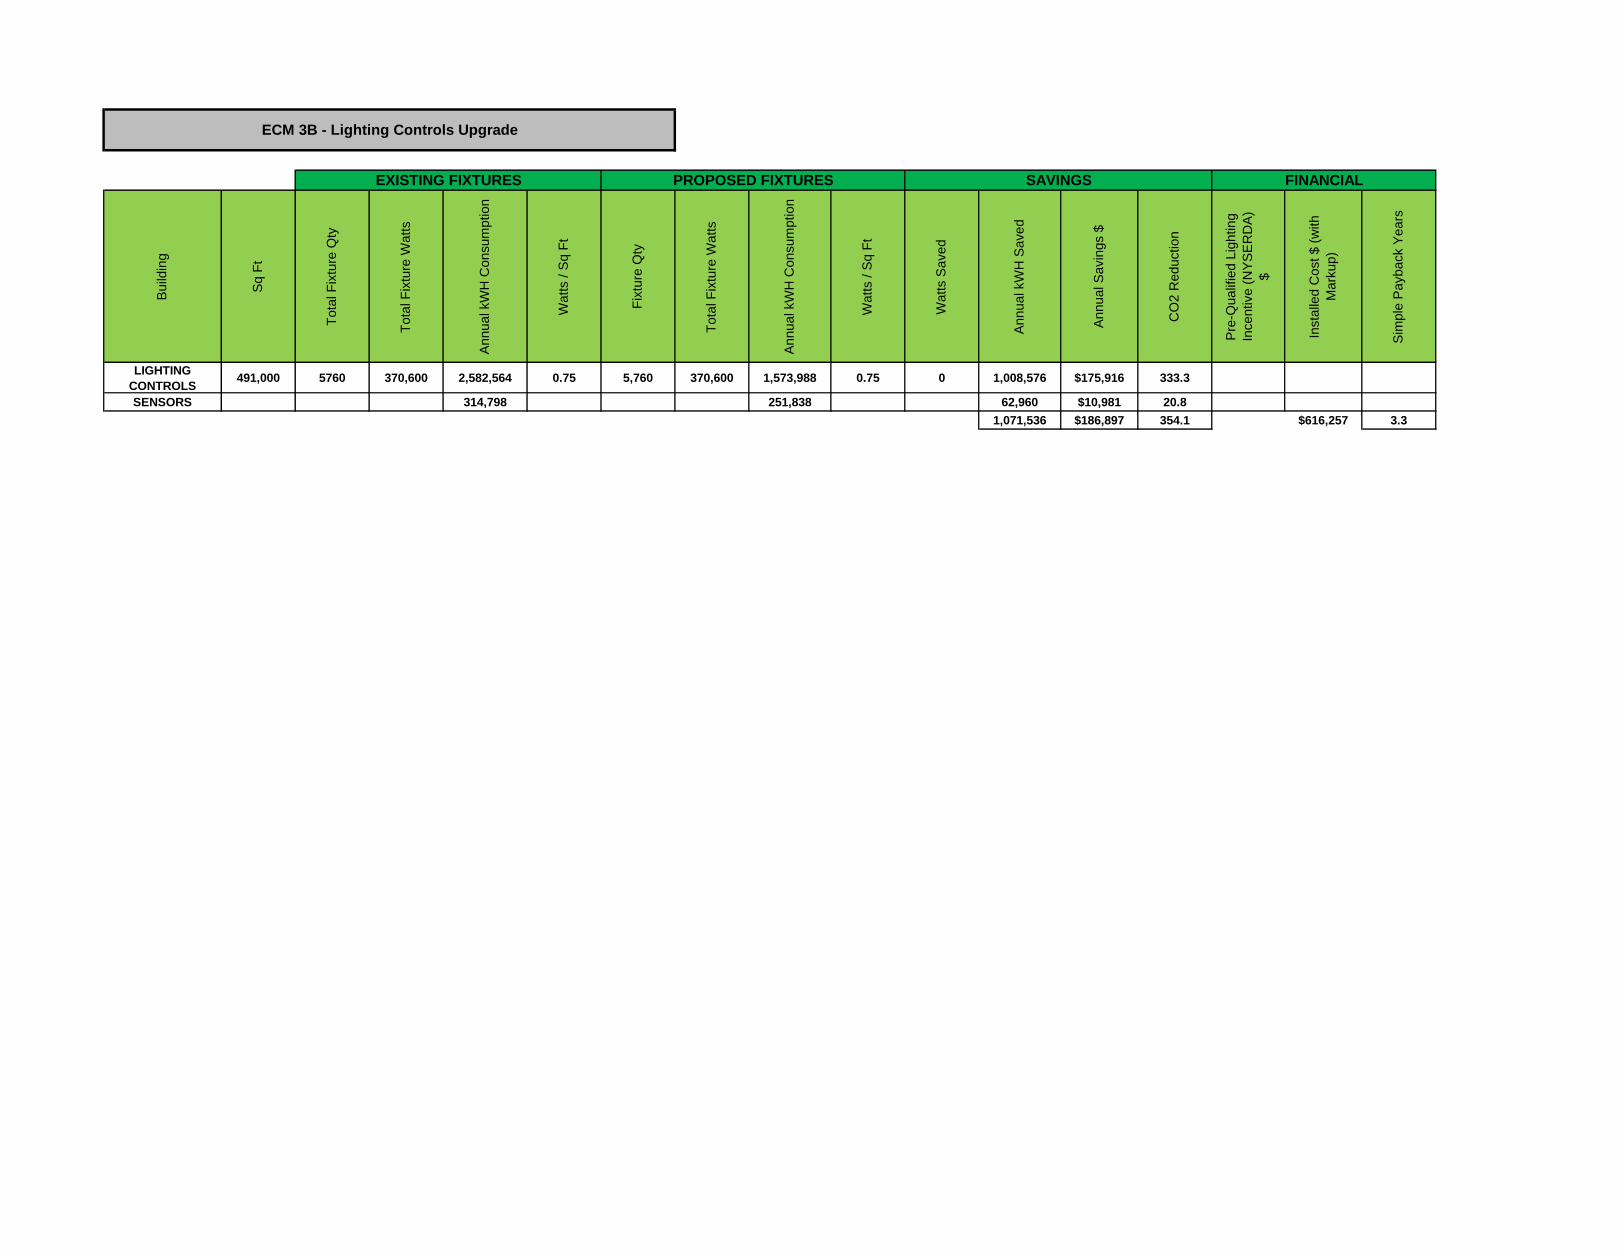
Build
ing
Sq F
t
To
tal F
ixtu
re Q
ty
To
tal F
ixtu
re W
att
s
Annual kW
H C
onsum
ption
Wa
tts / S
q F
t
Fix
ture
Qty
To
tal F
ixtu
re W
att
s
Annual kW
H C
onsum
ption
Wa
tts / S
q F
t
Wa
tts S
aved
Annual kW
H S
aved
Annual S
avin
gs $
CO
2 R
ed
uctio
n
Pre
-Qualif
ied L
ighting
Incentive (
NY
SE
RD
A)
$
Insta
lled C
ost $ (
with
Ma
rku
p)
Sim
ple
Payback Y
ears
LIGHTING
CONTROLS491,000 5760 370,600 2,582,564 0.75 5,760 370,600 1,573,988 0.75 0 1,008,576 $175,916 333.3
SENSORS 314,798 251,838 62,960 $10,981 20.8
1,071,536 $186,897 354.1 $616,257 3.3
EXISTING FIXTURES PROPOSED FIXTURES SAVINGS FINANCIAL
ECM 3B - Lighting Controls Upgrade
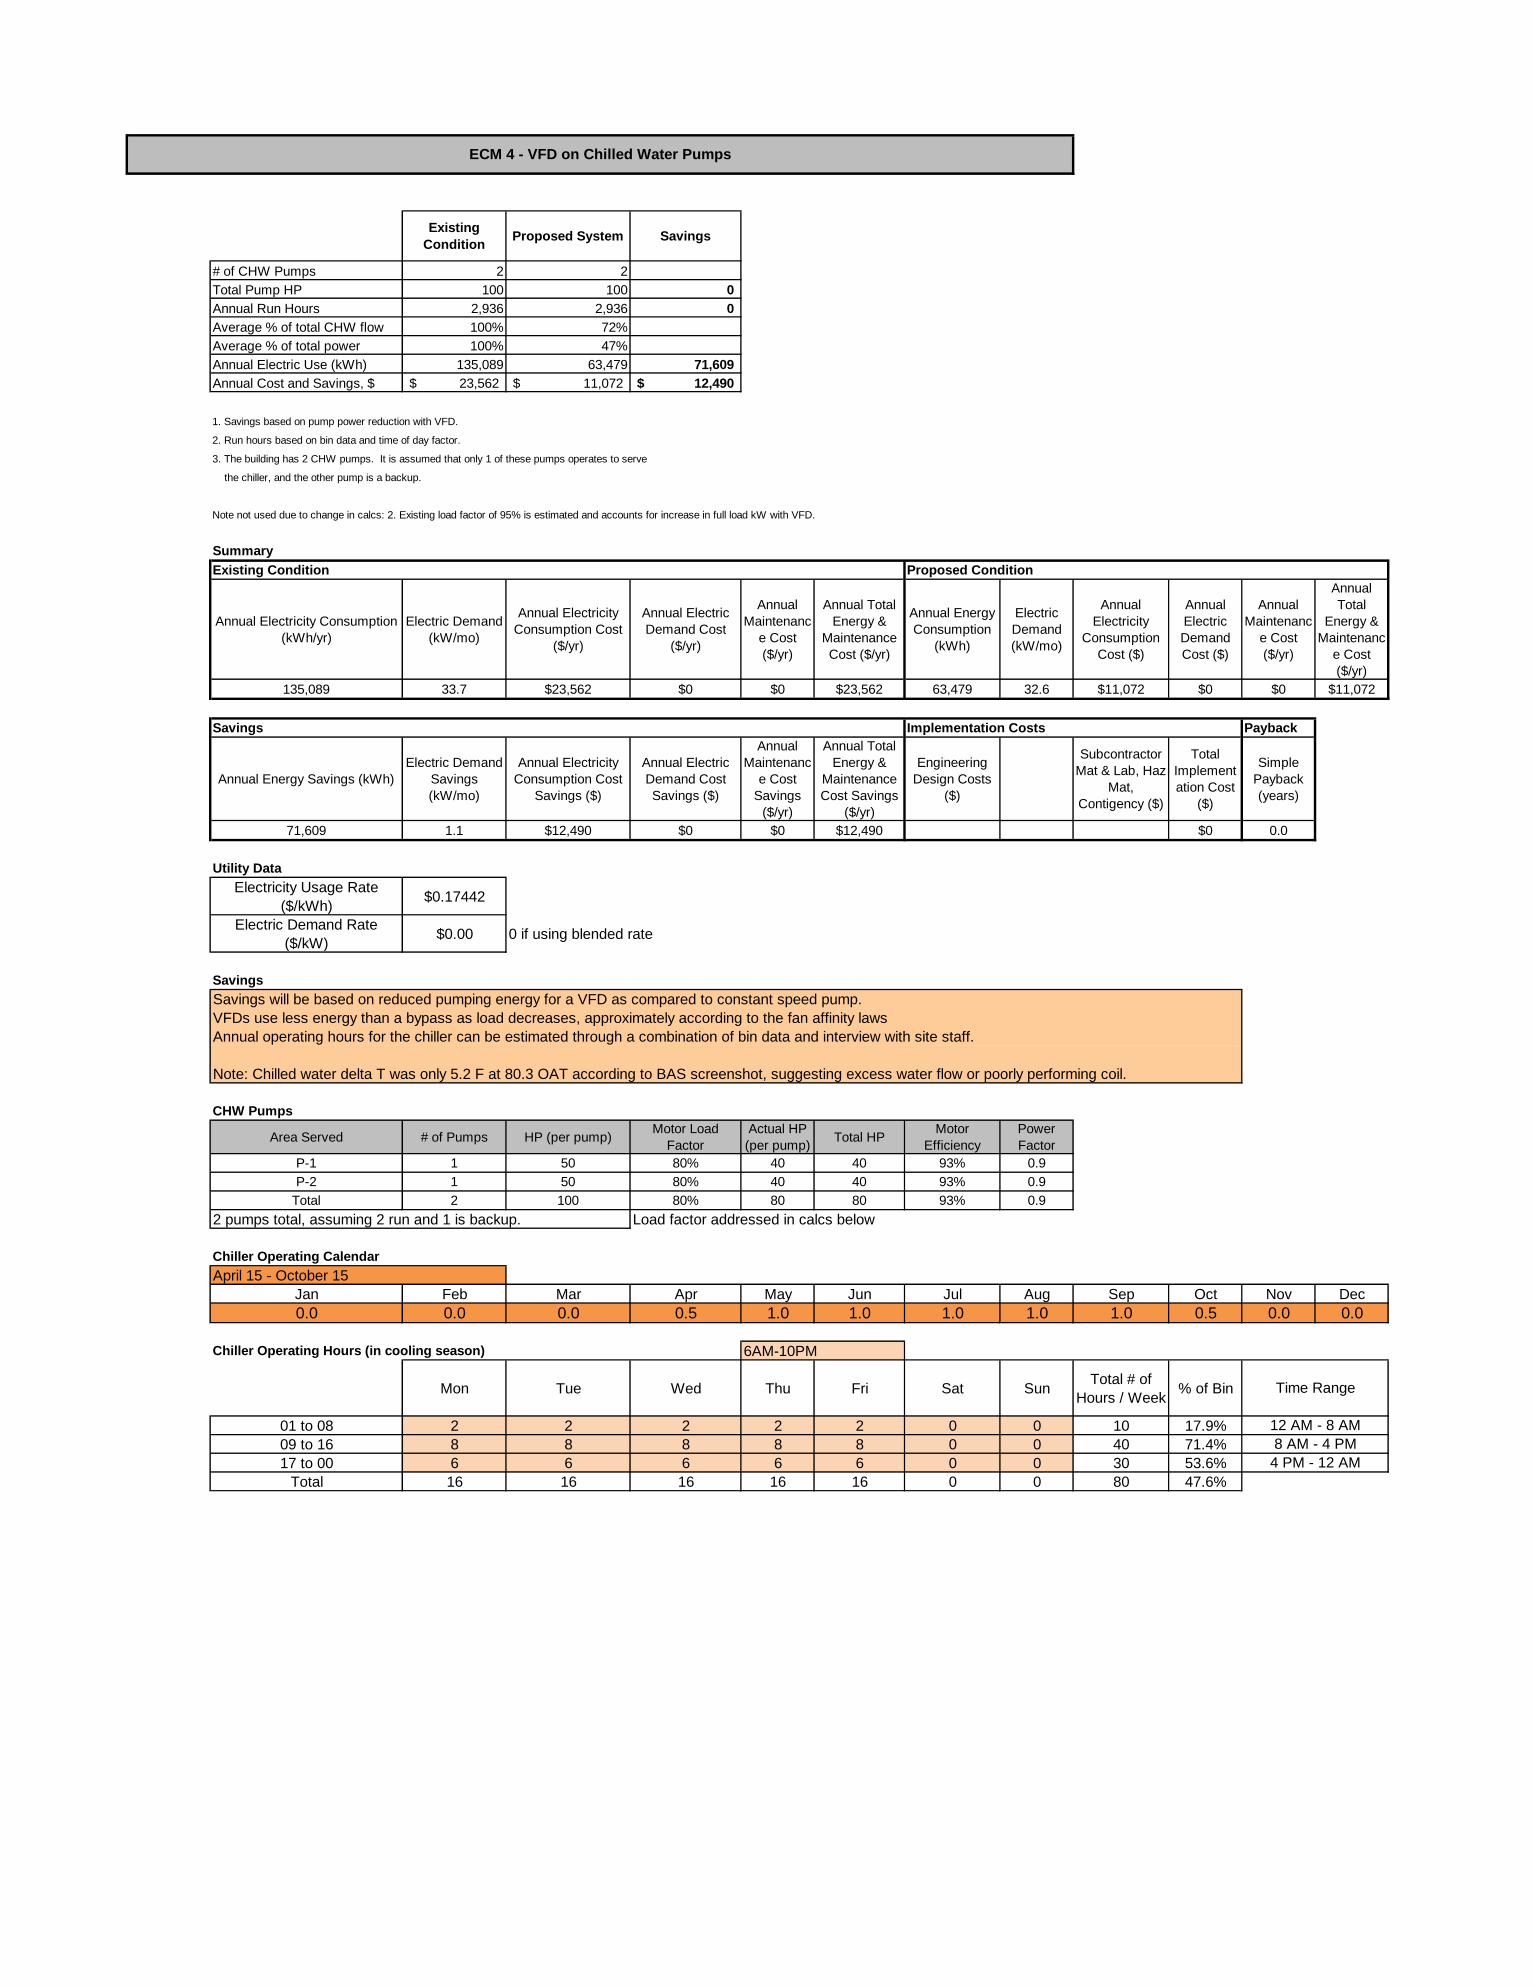
Existing
ConditionProposed System Savings
# of CHW Pumps 2 2
Total Pump HP 100 100 0
Annual Run Hours 2,936 2,936 0
Average % of total CHW flow 100% 72%
Average % of total power 100% 47%
Annual Electric Use (kWh) 135,089 63,479 71,609
Annual Cost and Savings, $ 23,562$ 11,072$ 12,490$
1. Savings based on pump power reduction with VFD.
2. Run hours based on bin data and time of day factor.
3. The building has 2 CHW pumps. It is assumed that only 1 of these pumps operates to serve
the chiller, and the other pump is a backup.
Note not used due to change in calcs: 2. Existing load factor of 95% is estimated and accounts for increase in full load kW with VFD.
Summary
Existing Condition Proposed Condition
Annual Electricity Consumption
(kWh/yr)
Electric Demand
(kW/mo)
Annual Electricity
Consumption Cost
($/yr)
Annual Electric
Demand Cost
($/yr)
Annual
Maintenanc
e Cost
($/yr)
Annual Total
Energy &
Maintenance
Cost ($/yr)
Annual Energy
Consumption
(kWh)
Electric
Demand
(kW/mo)
Annual
Electricity
Consumption
Cost ($)
Annual
Electric
Demand
Cost ($)
Annual
Maintenanc
e Cost
($/yr)
Annual
Total
Energy &
Maintenanc
e Cost
($/yr)
135,089 33.7 $23,562 $0 $0 $23,562 63,479 32.6 $11,072 $0 $0 $11,072
Savings Implementation Costs Payback
Annual Energy Savings (kWh)
Electric Demand
Savings
(kW/mo)
Annual Electricity
Consumption Cost
Savings ($)
Annual Electric
Demand Cost
Savings ($)
Annual
Maintenanc
e Cost
Savings
($/yr)
Annual Total
Energy &
Maintenance
Cost Savings
($/yr)
Engineering
Design Costs
($)
Subcontractor
Mat & Lab, Haz
Mat,
Contigency ($)
Total
Implement
ation Cost
($)
Simple
Payback
(years)
71,609 1.1 $12,490 $0 $0 $12,490 $0 0.0
Utility Data
Electricity Usage Rate
($/kWh)$0.17442
Electric Demand Rate
($/kW)$0.00 0 if using blended rate
Savings
Savings will be based on reduced pumping energy for a VFD as compared to constant speed pump.
VFDs use less energy than a bypass as load decreases, approximately according to the fan affinity laws
Annual operating hours for the chiller can be estimated through a combination of bin data and interview with site staff.
Note: Chilled water delta T was only 5.2 F at 80.3 OAT according to BAS screenshot, suggesting excess water flow or poorly performing coil.
CHW Pumps
Area Served # of Pumps HP (per pump)Motor Load
Factor
Actual HP
(per pump)Total HP
Motor
Efficiency
Power
Factor
P-1 1 50 80% 40 40 93% 0.9
P-2 1 50 80% 40 40 93% 0.9
Total 2 100 80% 80 80 93% 0.9
2 pumps total, assuming 2 run and 1 is backup. Load factor addressed in calcs below
Chiller Operating Calendar
April 15 - October 15
Jan Feb Mar Apr May Jun Jul Aug Sep Oct Nov Dec
0.0 0.0 0.0 0.5 1.0 1.0 1.0 1.0 1.0 0.5 0.0 0.0
Chiller Operating Hours (in cooling season) 6AM-10PM
Mon Tue Wed Thu Fri Sat SunTotal # of
Hours / Week% of Bin
01 to 08 2 2 2 2 2 0 0 10 17.9%
09 to 16 8 8 8 8 8 0 0 40 71.4%
17 to 00 6 6 6 6 6 0 0 30 53.6%
Total 16 16 16 16 16 0 0 80 47.6%
Time Range
12 AM - 8 AM
8 AM - 4 PM
4 PM - 12 AM
ECM 4 - VFD on Chilled Water Pumps
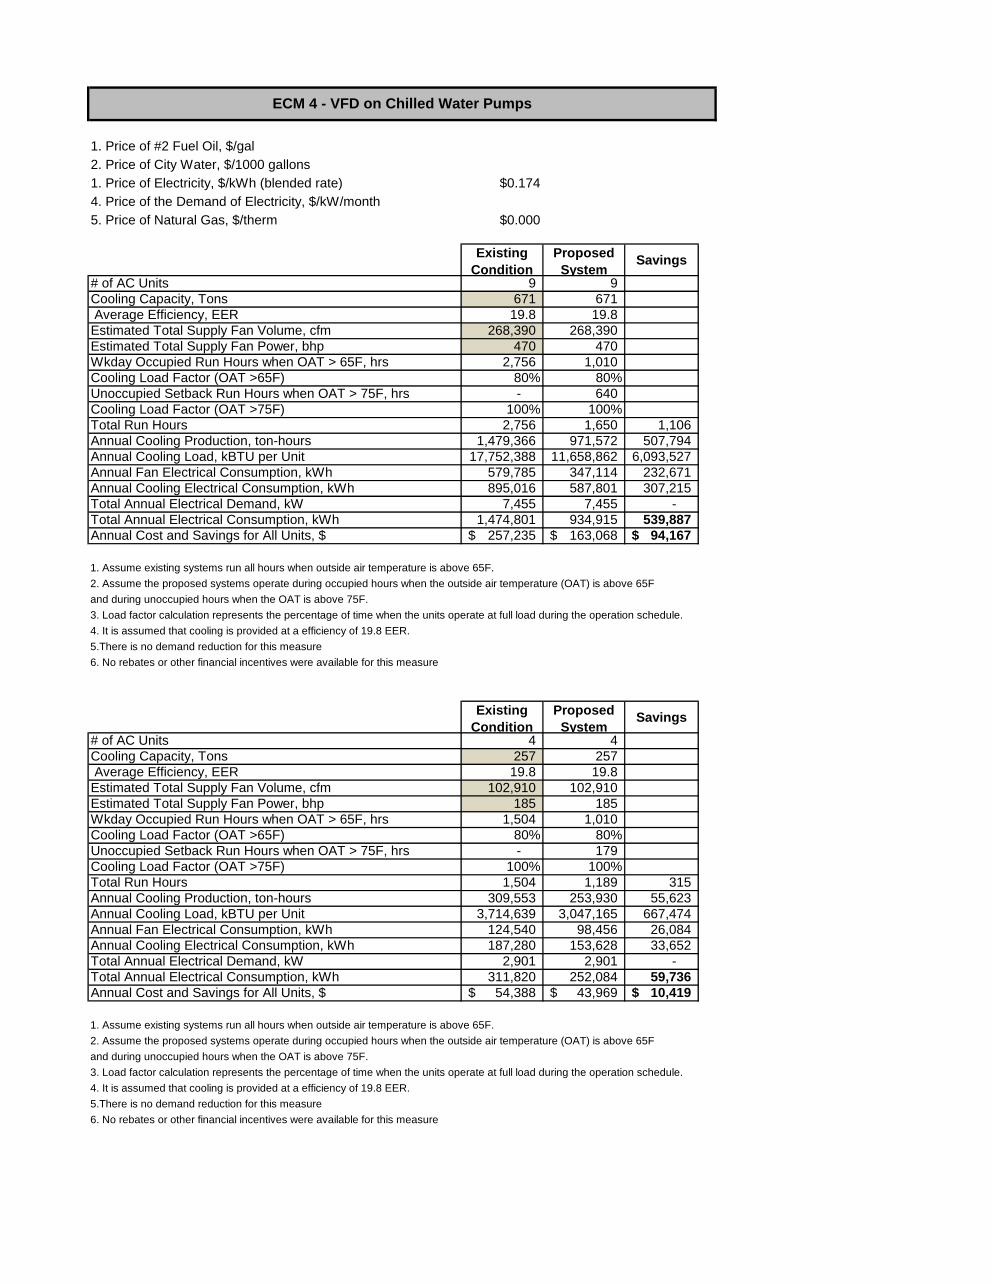
1. Price of #2 Fuel Oil, $/gal
2. Price of City Water, $/1000 gallons
1. Price of Electricity, $/kWh (blended rate) $0.174
4. Price of the Demand of Electricity, $/kW/month
5. Price of Natural Gas, $/therm $0.000
Existing
Condition
Proposed
System Savings
# of AC Units 9 9
Cooling Capacity, Tons 671 671
Average Efficiency, EER 19.8 19.8
Estimated Total Supply Fan Volume, cfm 268,390 268,390
Estimated Total Supply Fan Power, bhp 470 470
Wkday Occupied Run Hours when OAT > 65F, hrs 2,756 1,010
Cooling Load Factor (OAT >65F) 80% 80%
Unoccupied Setback Run Hours when OAT > 75F, hrs - 640
Cooling Load Factor (OAT >75F) 100% 100%
Total Run Hours 2,756 1,650 1,106
Annual Cooling Production, ton-hours 1,479,366 971,572 507,794
Annual Cooling Load, kBTU per Unit 17,752,388 11,658,862 6,093,527
Annual Fan Electrical Consumption, kWh 579,785 347,114 232,671
Annual Cooling Electrical Consumption, kWh 895,016 587,801 307,215
Total Annual Electrical Demand, kW 7,455 7,455 -
Total Annual Electrical Consumption, kWh 1,474,801 934,915 539,887
Annual Cost and Savings for All Units, $ 257,235$ 163,068$ 94,167$
1. Assume existing systems run all hours when outside air temperature is above 65F.
2. Assume the proposed systems operate during occupied hours when the outside air temperature (OAT) is above 65F
and during unoccupied hours when the OAT is above 75F.
3. Load factor calculation represents the percentage of time when the units operate at full load during the operation schedule.
4. It is assumed that cooling is provided at a efficiency of 19.8 EER.
Existing
Condition
Proposed
System Savings
# of AC Units 4 4
Cooling Capacity, Tons 257 257
Average Efficiency, EER 19.8 19.8
Estimated Total Supply Fan Volume, cfm 102,910 102,910
Estimated Total Supply Fan Power, bhp 185 185
Wkday Occupied Run Hours when OAT > 65F, hrs 1,504 1,010
Cooling Load Factor (OAT >65F) 80% 80%
Unoccupied Setback Run Hours when OAT > 75F, hrs - 179
Cooling Load Factor (OAT >75F) 100% 100%
Total Run Hours 1,504 1,189 315
Annual Cooling Production, ton-hours 309,553 253,930 55,623
Annual Cooling Load, kBTU per Unit 3,714,639 3,047,165 667,474
Annual Fan Electrical Consumption, kWh 124,540 98,456 26,084
Annual Cooling Electrical Consumption, kWh 187,280 153,628 33,652
Total Annual Electrical Demand, kW 2,901 2,901 -
Total Annual Electrical Consumption, kWh 311,820 252,084 59,736
Annual Cost and Savings for All Units, $ 54,388$ 43,969$ 10,419$
1. Assume existing systems run all hours when outside air temperature is above 65F.
2. Assume the proposed systems operate during occupied hours when the outside air temperature (OAT) is above 65F
and during unoccupied hours when the OAT is above 75F.
3. Load factor calculation represents the percentage of time when the units operate at full load during the operation schedule.
4. It is assumed that cooling is provided at a efficiency of 19.8 EER.
5.There is no demand reduction for this measure
6. No rebates or other financial incentives were available for this measure
5.There is no demand reduction for this measure
6. No rebates or other financial incentives were available for this measure
ECM 4 - VFD on Chilled Water Pumps
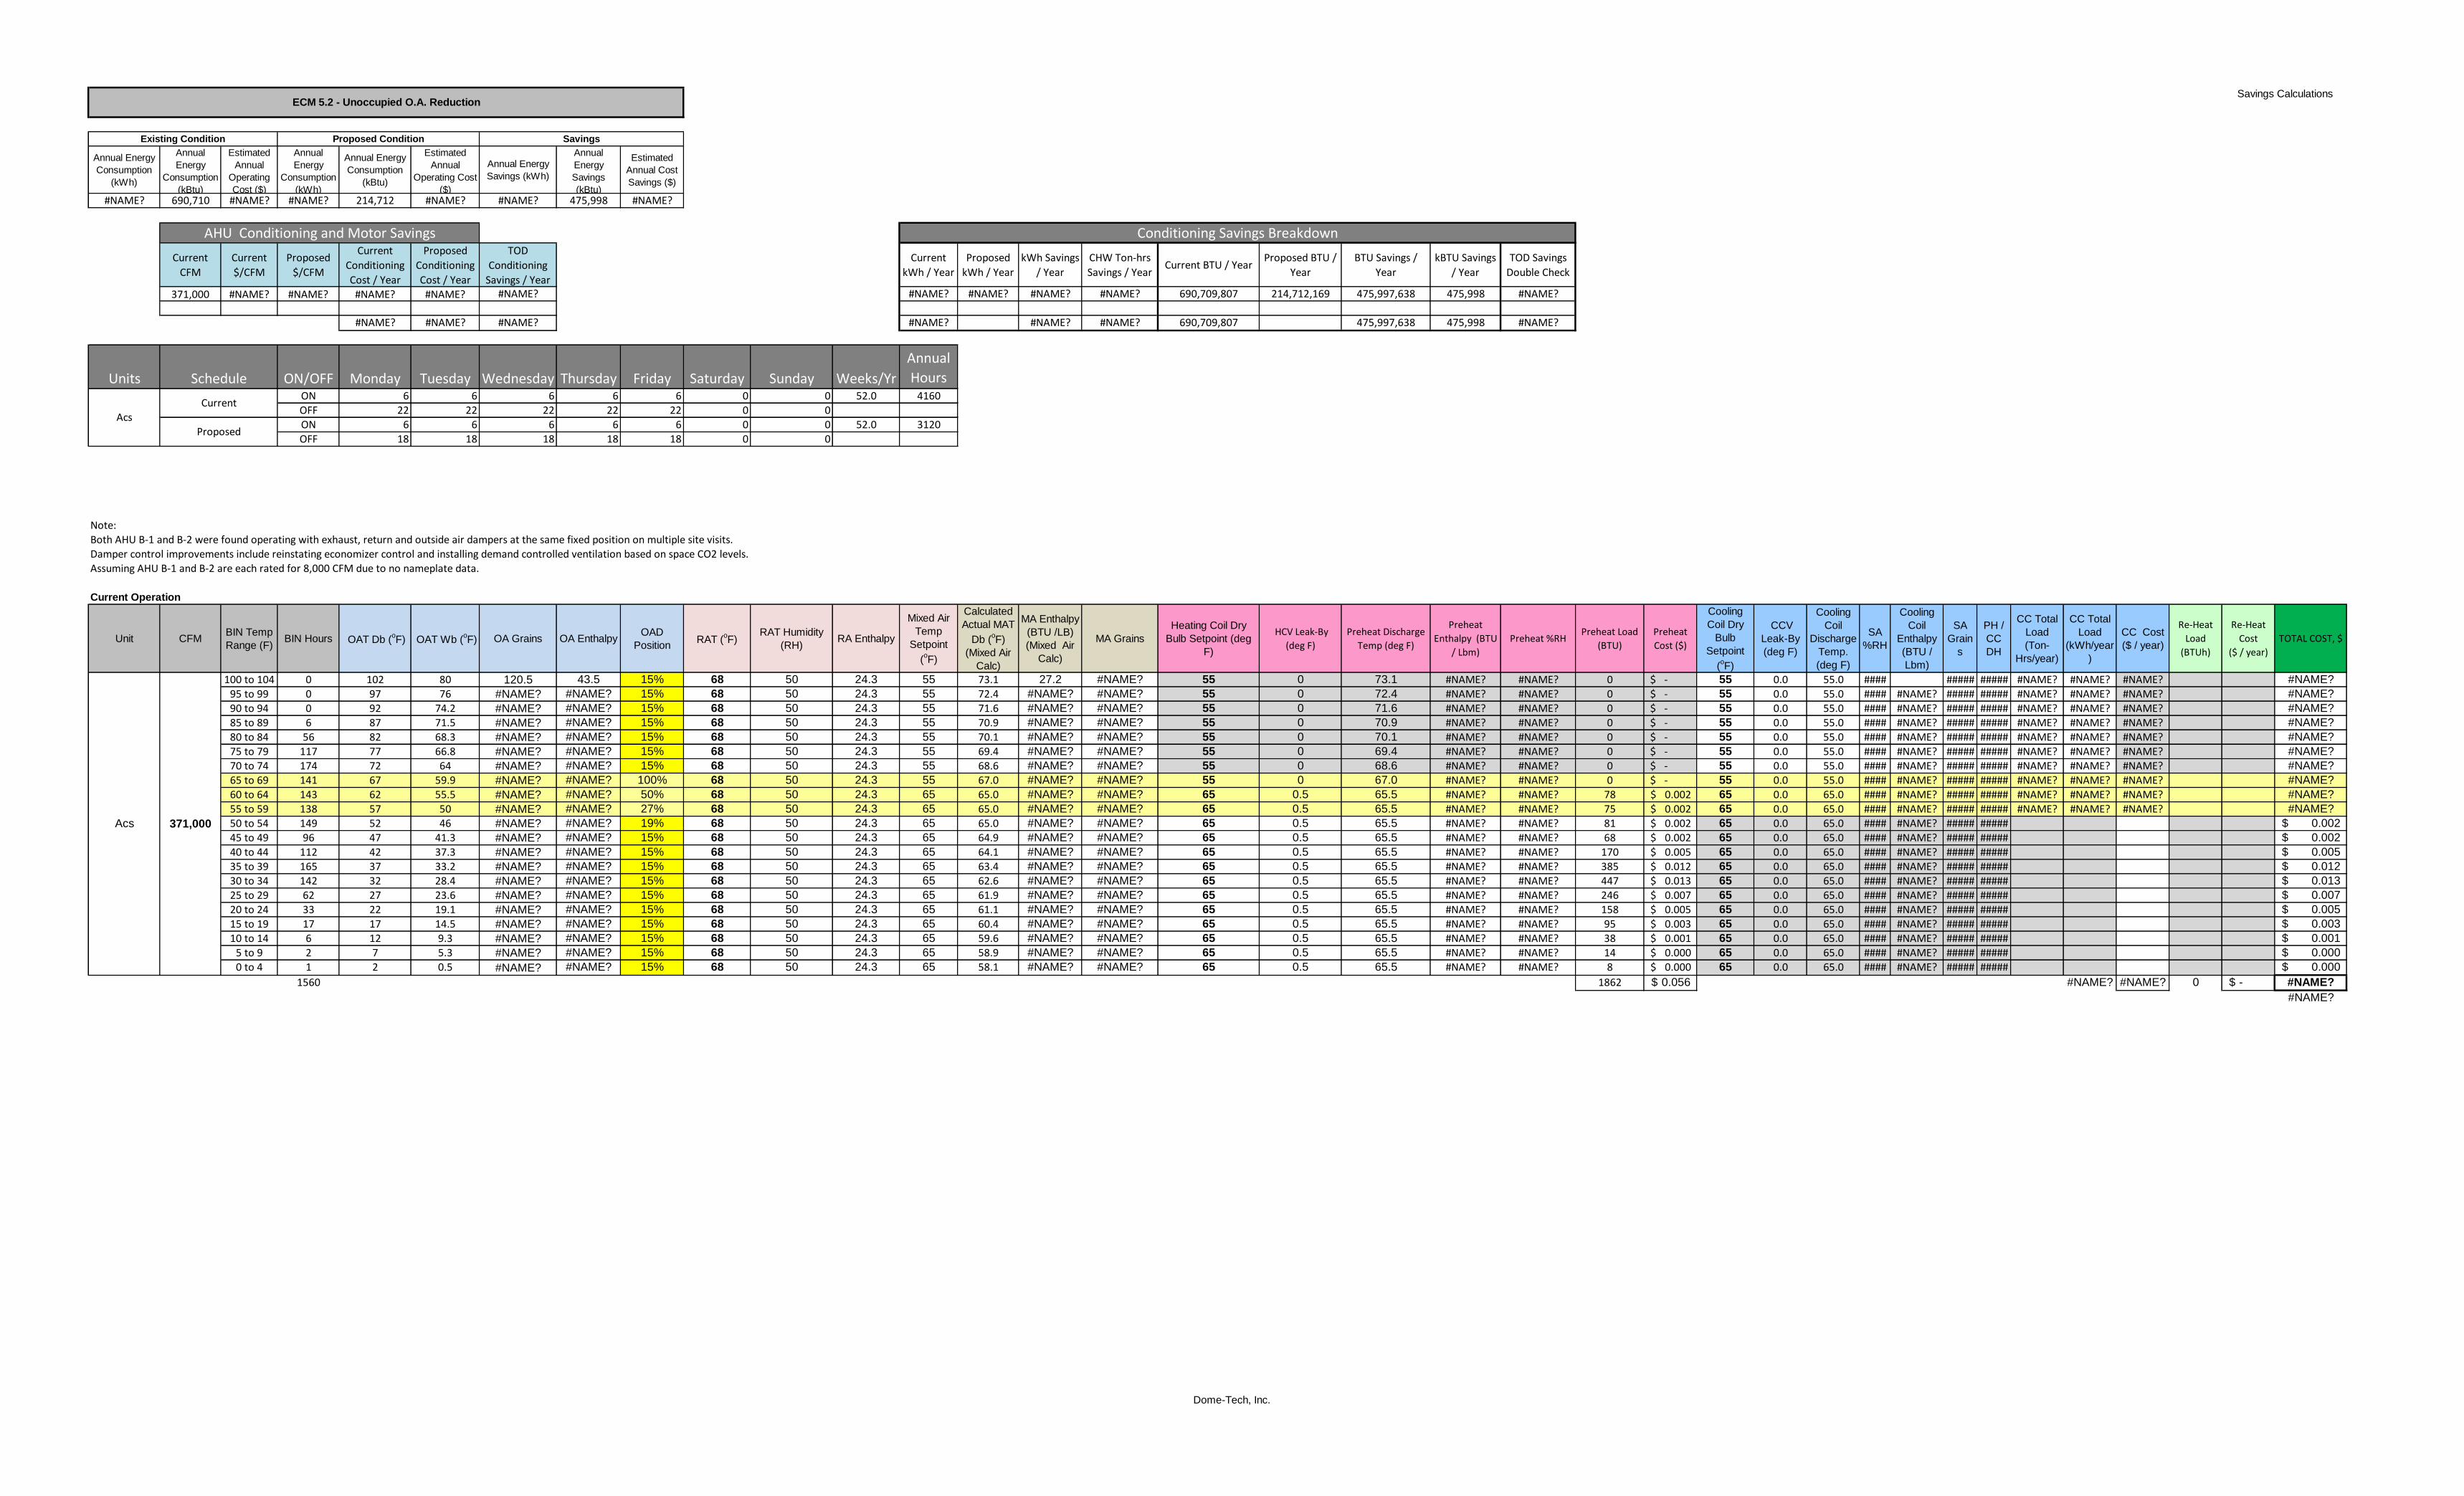
Savings Calculations
Annual Energy
Consumption
(kWh)
Annual
Energy
Consumption
(kBtu)
Estimated
Annual
Operating
Cost ($)
Annual
Energy
Consumption
(kWh)
Annual Energy
Consumption
(kBtu)
Estimated
Annual
Operating Cost
($)
Annual Energy
Savings (kWh)
Annual
Energy
Savings
(kBtu)
Estimated
Annual Cost
Savings ($)
#NAME? 690,710 #NAME? #NAME? 214,712 #NAME? #NAME? 475,998 #NAME?
Current
CFM
Current
$/CFM
Proposed
$/CFM
Current
Conditioning
Cost / Year
Proposed
Conditioning
Cost / Year
TOD
Conditioning
Savings / Year
Current
kWh / Year
Proposed
kWh / Year
kWh Savings
/ Year
CHW Ton-hrs
Savings / YearCurrent BTU / Year
Proposed BTU /
Year
BTU Savings /
Year
kBTU Savings
/ Year
TOD Savings
Double CheckImplementation Cost
371,000 #NAME? #NAME? #NAME? #NAME? #NAME? #NAME? #NAME? #NAME? #NAME? 690,709,807 214,712,169 475,997,638 475,998 #NAME?
#NAME? #NAME? #NAME? #NAME? #NAME? #NAME? 690,709,807 475,997,638 475,998 #NAME?
Units ON/OFF Monday Tuesday Wednesday Thursday Friday Saturday Sunday Weeks/Yr
Annual
HoursON 6 6 6 6 6 0 0 52.0 4160
OFF 22 22 22 22 22 0 0
ON 6 6 6 6 6 0 0 52.0 3120
OFF 18 18 18 18 18 0 0
Note:
Both AHU B-1 and B-2 were found operating with exhaust, return and outside air dampers at the same fixed position on multiple site visits.
Damper control improvements include reinstating economizer control and installing demand controlled ventilation based on space CO2 levels.
Assuming AHU B-1 and B-2 are each rated for 8,000 CFM due to no nameplate data.
Current Operation
Unit CFMBIN Temp
Range (F)BIN Hours OAT Db (
oF) OAT Wb (
oF) OA Grains OA Enthalpy
OAD
PositionRAT (
oF)
RAT Humidity
(RH)RA Enthalpy
Mixed Air
Temp
Setpoint
(oF)
Calculated
Actual MAT
Db (oF)
(Mixed Air
Calc)
MA Enthalpy
(BTU /LB)
(Mixed Air
Calc)
MA Grains
Heating Coil Dry
Bulb Setpoint (deg
F)
HCV Leak-By
(deg F)
Preheat Discharge
Temp (deg F)
Preheat
Enthalpy (BTU
/ Lbm)
Preheat %RHPreheat Load
(BTU)
Preheat
Cost ($)
Cooling
Coil Dry
Bulb
Setpoint
(oF)
CCV
Leak-By
(deg F)
Cooling
Coil
Discharge
Temp.
(deg F)
SA
%RH
Cooling
Coil
Enthalpy
(BTU /
Lbm)
SA
Grain
s
PH /
CC
DH
CC Total
Load
(Ton-
Hrs/year)
CC Total
Load
(kWh/year
)
CC Cost
($ / year)
Re-Heat
Load
(BTUh)
Re-Heat
Cost
($ / year)
TOTAL COST, $
100 to 104 0 102 80 120.5 43.5 15% 68 50 24.3 55 73.1 27.2 #NAME? 55 0 73.1 #NAME? #NAME? 0 -$ 55 0.0 55.0 #### ##### ##### #NAME? #NAME? #NAME? #NAME?
95 to 99 0 97 76 #NAME? #NAME? 15% 68 50 24.3 55 72.4 #NAME? #NAME? 55 0 72.4 #NAME? #NAME? 0 -$ 55 0.0 55.0 #### #NAME? ##### ##### #NAME? #NAME? #NAME? #NAME?
90 to 94 0 92 74.2 #NAME? #NAME? 15% 68 50 24.3 55 71.6 #NAME? #NAME? 55 0 71.6 #NAME? #NAME? 0 -$ 55 0.0 55.0 #### #NAME? ##### ##### #NAME? #NAME? #NAME? #NAME?
85 to 89 6 87 71.5 #NAME? #NAME? 15% 68 50 24.3 55 70.9 #NAME? #NAME? 55 0 70.9 #NAME? #NAME? 0 -$ 55 0.0 55.0 #### #NAME? ##### ##### #NAME? #NAME? #NAME? #NAME?
80 to 84 56 82 68.3 #NAME? #NAME? 15% 68 50 24.3 55 70.1 #NAME? #NAME? 55 0 70.1 #NAME? #NAME? 0 -$ 55 0.0 55.0 #### #NAME? ##### ##### #NAME? #NAME? #NAME? #NAME?
75 to 79 117 77 66.8 #NAME? #NAME? 15% 68 50 24.3 55 69.4 #NAME? #NAME? 55 0 69.4 #NAME? #NAME? 0 -$ 55 0.0 55.0 #### #NAME? ##### ##### #NAME? #NAME? #NAME? #NAME?
70 to 74 174 72 64 #NAME? #NAME? 15% 68 50 24.3 55 68.6 #NAME? #NAME? 55 0 68.6 #NAME? #NAME? 0 -$ 55 0.0 55.0 #### #NAME? ##### ##### #NAME? #NAME? #NAME? #NAME?
65 to 69 141 67 59.9 #NAME? #NAME? 100% 68 50 24.3 55 67.0 #NAME? #NAME? 55 0 67.0 #NAME? #NAME? 0 -$ 55 0.0 55.0 #### #NAME? ##### ##### #NAME? #NAME? #NAME? #NAME?
60 to 64 143 62 55.5 #NAME? #NAME? 50% 68 50 24.3 65 65.0 #NAME? #NAME? 65 0.5 65.5 #NAME? #NAME? 78 0.002$ 65 0.0 65.0 #### #NAME? ##### ##### #NAME? #NAME? #NAME? #NAME?
55 to 59 138 57 50 #NAME? #NAME? 27% 68 50 24.3 65 65.0 #NAME? #NAME? 65 0.5 65.5 #NAME? #NAME? 75 0.002$ 65 0.0 65.0 #### #NAME? ##### ##### #NAME? #NAME? #NAME? #NAME?
50 to 54 149 52 46 #NAME? #NAME? 19% 68 50 24.3 65 65.0 #NAME? #NAME? 65 0.5 65.5 #NAME? #NAME? 81 0.002$ 65 0.0 65.0 #### #NAME? ##### ##### 0.002$
45 to 49 96 47 41.3 #NAME? #NAME? 15% 68 50 24.3 65 64.9 #NAME? #NAME? 65 0.5 65.5 #NAME? #NAME? 68 0.002$ 65 0.0 65.0 #### #NAME? ##### ##### 0.002$
40 to 44 112 42 37.3 #NAME? #NAME? 15% 68 50 24.3 65 64.1 #NAME? #NAME? 65 0.5 65.5 #NAME? #NAME? 170 0.005$ 65 0.0 65.0 #### #NAME? ##### ##### 0.005$
35 to 39 165 37 33.2 #NAME? #NAME? 15% 68 50 24.3 65 63.4 #NAME? #NAME? 65 0.5 65.5 #NAME? #NAME? 385 0.012$ 65 0.0 65.0 #### #NAME? ##### ##### 0.012$
30 to 34 142 32 28.4 #NAME? #NAME? 15% 68 50 24.3 65 62.6 #NAME? #NAME? 65 0.5 65.5 #NAME? #NAME? 447 0.013$ 65 0.0 65.0 #### #NAME? ##### ##### 0.013$
25 to 29 62 27 23.6 #NAME? #NAME? 15% 68 50 24.3 65 61.9 #NAME? #NAME? 65 0.5 65.5 #NAME? #NAME? 246 0.007$ 65 0.0 65.0 #### #NAME? ##### ##### 0.007$
20 to 24 33 22 19.1 #NAME? #NAME? 15% 68 50 24.3 65 61.1 #NAME? #NAME? 65 0.5 65.5 #NAME? #NAME? 158 0.005$ 65 0.0 65.0 #### #NAME? ##### ##### 0.005$
15 to 19 17 17 14.5 #NAME? #NAME? 15% 68 50 24.3 65 60.4 #NAME? #NAME? 65 0.5 65.5 #NAME? #NAME? 95 0.003$ 65 0.0 65.0 #### #NAME? ##### ##### 0.003$
10 to 14 6 12 9.3 #NAME? #NAME? 15% 68 50 24.3 65 59.6 #NAME? #NAME? 65 0.5 65.5 #NAME? #NAME? 38 0.001$ 65 0.0 65.0 #### #NAME? ##### ##### 0.001$
5 to 9 2 7 5.3 #NAME? #NAME? 15% 68 50 24.3 65 58.9 #NAME? #NAME? 65 0.5 65.5 #NAME? #NAME? 14 0.000$ 65 0.0 65.0 #### #NAME? ##### ##### 0.000$
0 to 4 1 2 0.5 #NAME? #NAME? 15% 68 50 24.3 65 58.1 #NAME? #NAME? 65 0.5 65.5 #NAME? #NAME? 8 0.000$ 65 0.0 65.0 #### #NAME? ##### ##### 0.000$
1560 1862 0.056$ #NAME? #NAME? 0 -$ #NAME?
#NAME?
Acs 371,000
Acs
Current
Proposed
Conditioning Savings Breakdown
Schedule
AHU Conditioning and Motor Savings
Existing Condition Proposed Condition Savings
ECM 5.2 - Unoccupied O.A. Reduction
Dome-Tech, Inc.
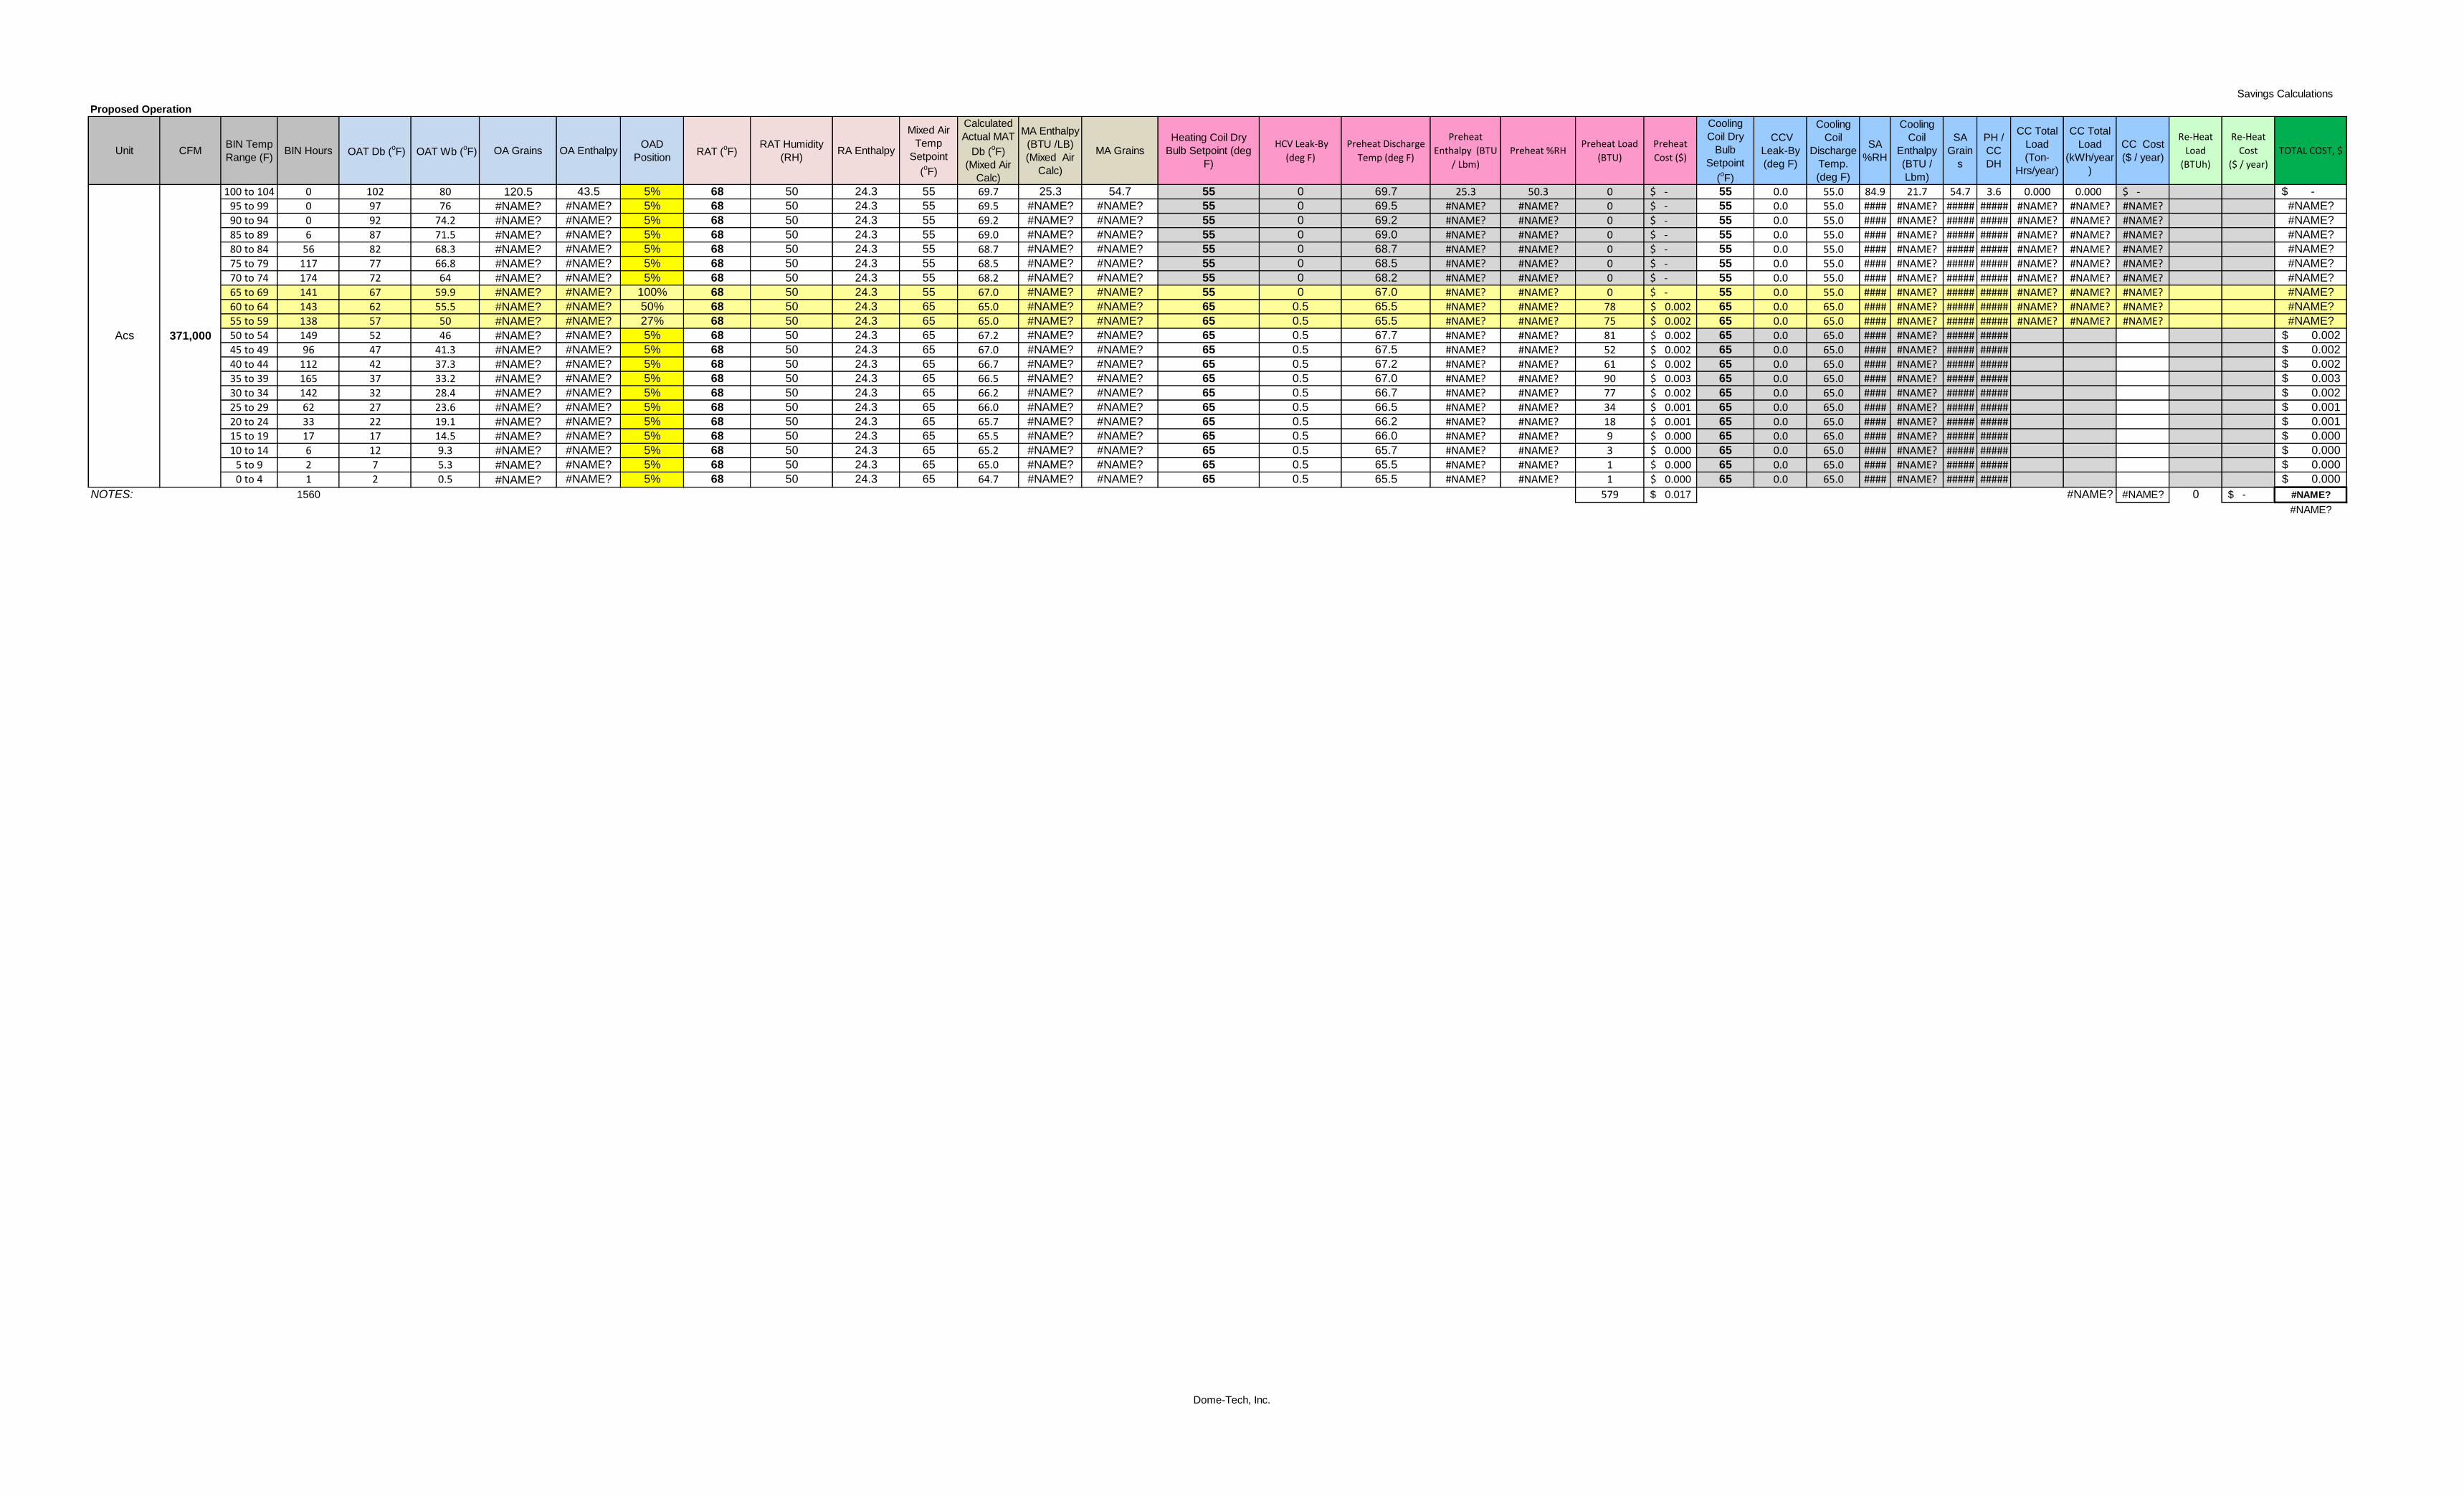
Savings Calculations
Proposed Operation
Unit CFMBIN Temp
Range (F)BIN Hours OAT Db (
oF) OAT Wb (
oF) OA Grains OA Enthalpy
OAD
PositionRAT (
oF)
RAT Humidity
(RH)RA Enthalpy
Mixed Air
Temp
Setpoint
(oF)
Calculated
Actual MAT
Db (oF)
(Mixed Air
Calc)
MA Enthalpy
(BTU /LB)
(Mixed Air
Calc)
MA Grains
Heating Coil Dry
Bulb Setpoint (deg
F)
HCV Leak-By
(deg F)
Preheat Discharge
Temp (deg F)
Preheat
Enthalpy (BTU
/ Lbm)
Preheat %RHPreheat Load
(BTU)
Preheat
Cost ($)
Cooling
Coil Dry
Bulb
Setpoint
(oF)
CCV
Leak-By
(deg F)
Cooling
Coil
Discharge
Temp.
(deg F)
SA
%RH
Cooling
Coil
Enthalpy
(BTU /
Lbm)
SA
Grain
s
PH /
CC
DH
CC Total
Load
(Ton-
Hrs/year)
CC Total
Load
(kWh/year
)
CC Cost
($ / year)
Re-Heat
Load
(BTUh)
Re-Heat
Cost
($ / year)
TOTAL COST, $
100 to 104 0 102 80 120.5 43.5 5% 68 50 24.3 55 69.7 25.3 54.7 55 0 69.7 25.3 50.3 0 -$ 55 0.0 55.0 84.9 21.7 54.7 3.6 0.000 0.000 -$ -$
95 to 99 0 97 76 #NAME? #NAME? 5% 68 50 24.3 55 69.5 #NAME? #NAME? 55 0 69.5 #NAME? #NAME? 0 -$ 55 0.0 55.0 #### #NAME? ##### ##### #NAME? #NAME? #NAME? #NAME?
90 to 94 0 92 74.2 #NAME? #NAME? 5% 68 50 24.3 55 69.2 #NAME? #NAME? 55 0 69.2 #NAME? #NAME? 0 -$ 55 0.0 55.0 #### #NAME? ##### ##### #NAME? #NAME? #NAME? #NAME?
85 to 89 6 87 71.5 #NAME? #NAME? 5% 68 50 24.3 55 69.0 #NAME? #NAME? 55 0 69.0 #NAME? #NAME? 0 -$ 55 0.0 55.0 #### #NAME? ##### ##### #NAME? #NAME? #NAME? #NAME?
80 to 84 56 82 68.3 #NAME? #NAME? 5% 68 50 24.3 55 68.7 #NAME? #NAME? 55 0 68.7 #NAME? #NAME? 0 -$ 55 0.0 55.0 #### #NAME? ##### ##### #NAME? #NAME? #NAME? #NAME?
75 to 79 117 77 66.8 #NAME? #NAME? 5% 68 50 24.3 55 68.5 #NAME? #NAME? 55 0 68.5 #NAME? #NAME? 0 -$ 55 0.0 55.0 #### #NAME? ##### ##### #NAME? #NAME? #NAME? #NAME?
70 to 74 174 72 64 #NAME? #NAME? 5% 68 50 24.3 55 68.2 #NAME? #NAME? 55 0 68.2 #NAME? #NAME? 0 -$ 55 0.0 55.0 #### #NAME? ##### ##### #NAME? #NAME? #NAME? #NAME?
65 to 69 141 67 59.9 #NAME? #NAME? 100% 68 50 24.3 55 67.0 #NAME? #NAME? 55 0 67.0 #NAME? #NAME? 0 -$ 55 0.0 55.0 #### #NAME? ##### ##### #NAME? #NAME? #NAME? #NAME?
60 to 64 143 62 55.5 #NAME? #NAME? 50% 68 50 24.3 65 65.0 #NAME? #NAME? 65 0.5 65.5 #NAME? #NAME? 78 0.002$ 65 0.0 65.0 #### #NAME? ##### ##### #NAME? #NAME? #NAME? #NAME?
55 to 59 138 57 50 #NAME? #NAME? 27% 68 50 24.3 65 65.0 #NAME? #NAME? 65 0.5 65.5 #NAME? #NAME? 75 0.002$ 65 0.0 65.0 #### #NAME? ##### ##### #NAME? #NAME? #NAME? #NAME?
50 to 54 149 52 46 #NAME? #NAME? 5% 68 50 24.3 65 67.2 #NAME? #NAME? 65 0.5 67.7 #NAME? #NAME? 81 0.002$ 65 0.0 65.0 #### #NAME? ##### ##### 0.002$
45 to 49 96 47 41.3 #NAME? #NAME? 5% 68 50 24.3 65 67.0 #NAME? #NAME? 65 0.5 67.5 #NAME? #NAME? 52 0.002$ 65 0.0 65.0 #### #NAME? ##### ##### 0.002$
40 to 44 112 42 37.3 #NAME? #NAME? 5% 68 50 24.3 65 66.7 #NAME? #NAME? 65 0.5 67.2 #NAME? #NAME? 61 0.002$ 65 0.0 65.0 #### #NAME? ##### ##### 0.002$
35 to 39 165 37 33.2 #NAME? #NAME? 5% 68 50 24.3 65 66.5 #NAME? #NAME? 65 0.5 67.0 #NAME? #NAME? 90 0.003$ 65 0.0 65.0 #### #NAME? ##### ##### 0.003$
30 to 34 142 32 28.4 #NAME? #NAME? 5% 68 50 24.3 65 66.2 #NAME? #NAME? 65 0.5 66.7 #NAME? #NAME? 77 0.002$ 65 0.0 65.0 #### #NAME? ##### ##### 0.002$
25 to 29 62 27 23.6 #NAME? #NAME? 5% 68 50 24.3 65 66.0 #NAME? #NAME? 65 0.5 66.5 #NAME? #NAME? 34 0.001$ 65 0.0 65.0 #### #NAME? ##### ##### 0.001$
20 to 24 33 22 19.1 #NAME? #NAME? 5% 68 50 24.3 65 65.7 #NAME? #NAME? 65 0.5 66.2 #NAME? #NAME? 18 0.001$ 65 0.0 65.0 #### #NAME? ##### ##### 0.001$
15 to 19 17 17 14.5 #NAME? #NAME? 5% 68 50 24.3 65 65.5 #NAME? #NAME? 65 0.5 66.0 #NAME? #NAME? 9 0.000$ 65 0.0 65.0 #### #NAME? ##### ##### 0.000$
10 to 14 6 12 9.3 #NAME? #NAME? 5% 68 50 24.3 65 65.2 #NAME? #NAME? 65 0.5 65.7 #NAME? #NAME? 3 0.000$ 65 0.0 65.0 #### #NAME? ##### ##### 0.000$
5 to 9 2 7 5.3 #NAME? #NAME? 5% 68 50 24.3 65 65.0 #NAME? #NAME? 65 0.5 65.5 #NAME? #NAME? 1 0.000$ 65 0.0 65.0 #### #NAME? ##### ##### 0.000$
0 to 4 1 2 0.5 #NAME? #NAME? 5% 68 50 24.3 65 64.7 #NAME? #NAME? 65 0.5 65.5 #NAME? #NAME? 1 0.000$ 65 0.0 65.0 #### #NAME? ##### ##### 0.000$
NOTES: 1560 579 0.017$ #NAME? #NAME? 0 -$ #NAME?
#NAME?
Acs 371,000
Dome-Tech, Inc.
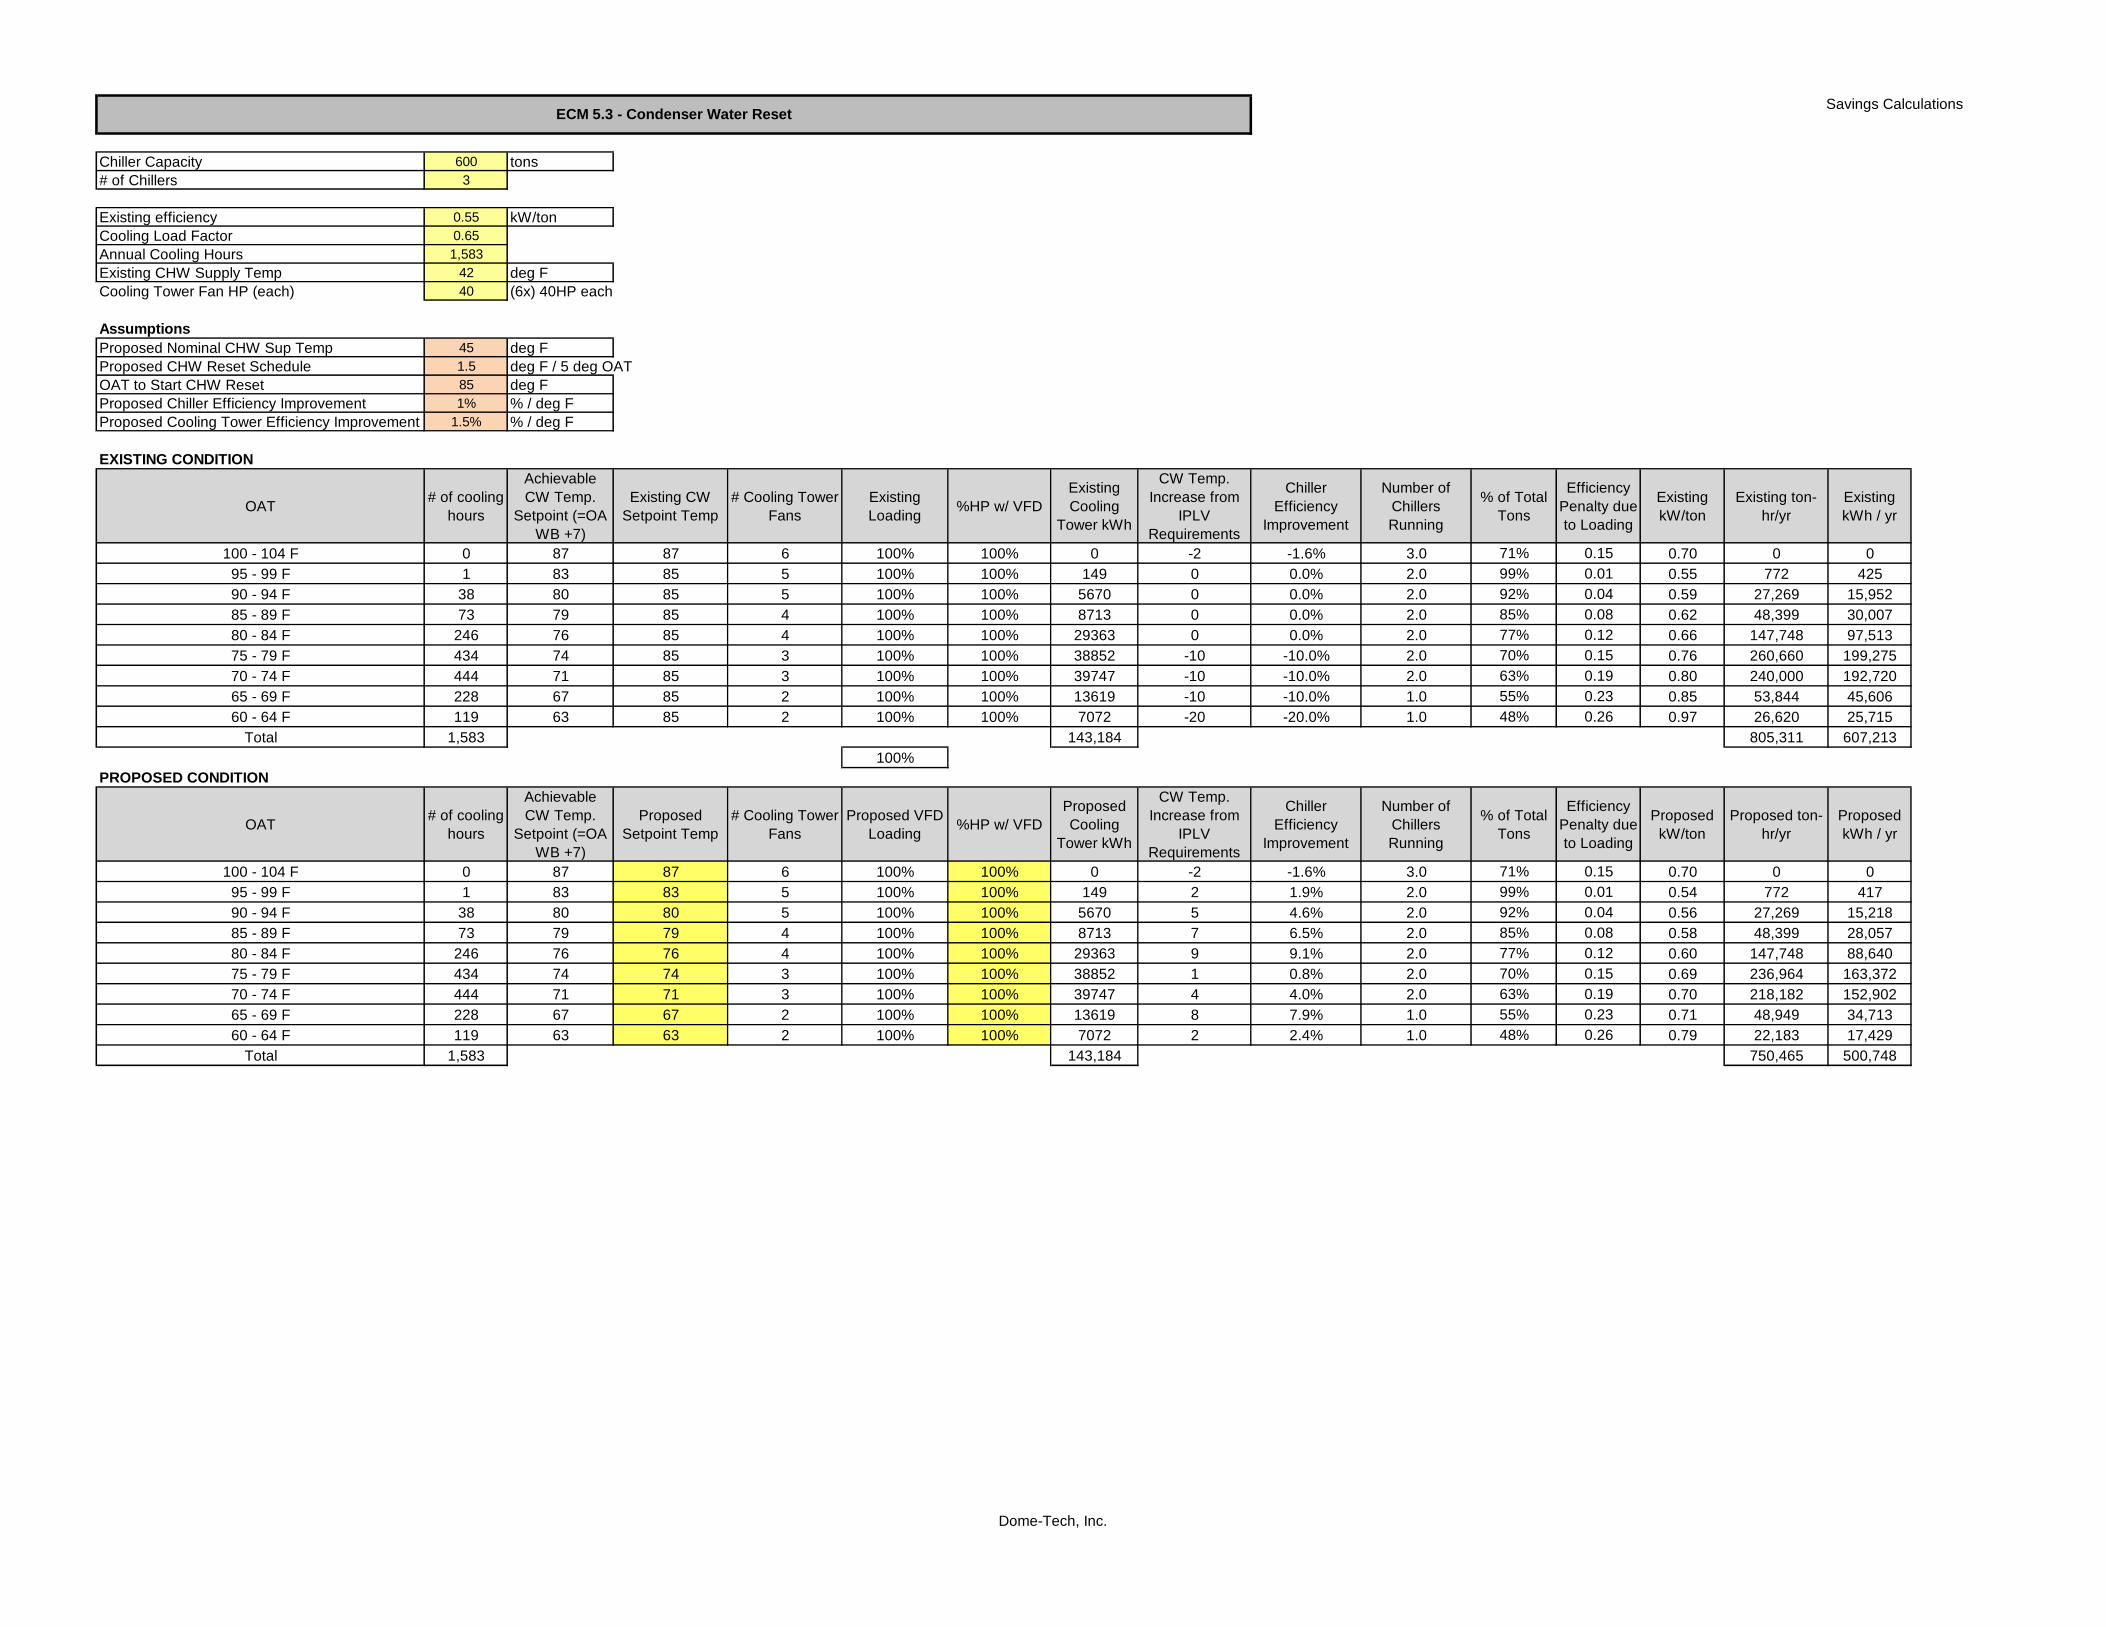
Savings Calculations
Chiller Capacity 600 tons
# of Chillers 3
Existing efficiency 0.55 kW/ton
Cooling Load Factor 0.65
Annual Cooling Hours 1,583
Existing CHW Supply Temp 42 deg F
Cooling Tower Fan HP (each) 40 (6x) 40HP each
Assumptions
Proposed Nominal CHW Sup Temp 45 deg F
Proposed CHW Reset Schedule 1.5 deg F / 5 deg OAT
OAT to Start CHW Reset 85 deg F
Proposed Chiller Efficiency Improvement 1% % / deg F
Proposed Cooling Tower Efficiency Improvement 1.5% % / deg F
EXISTING CONDITION
OAT# of cooling
hours
Achievable
CW Temp.
Setpoint (=OA
WB +7)
Existing CW
Setpoint Temp
# Cooling Tower
Fans
Existing
Loading%HP w/ VFD
Existing
Cooling
Tower kWh
CW Temp.
Increase from
IPLV
Requirements
Chiller
Efficiency
Improvement
Number of
Chillers
Running
% of Total
Tons
Efficiency
Penalty due
to Loading
Existing
kW/ton
Existing ton-
hr/yr
Existing
kWh / yr
100 - 104 F 0 87 87 6 100% 100% 0 -2 -1.6% 3.0 71% 0.15 0.70 0 0
95 - 99 F 1 83 85 5 100% 100% 149 0 0.0% 2.0 99% 0.01 0.55 772 425
90 - 94 F 38 80 85 5 100% 100% 5670 0 0.0% 2.0 92% 0.04 0.59 27,269 15,952
85 - 89 F 73 79 85 4 100% 100% 8713 0 0.0% 2.0 85% 0.08 0.62 48,399 30,007
80 - 84 F 246 76 85 4 100% 100% 29363 0 0.0% 2.0 77% 0.12 0.66 147,748 97,513
75 - 79 F 434 74 85 3 100% 100% 38852 -10 -10.0% 2.0 70% 0.15 0.76 260,660 199,275
70 - 74 F 444 71 85 3 100% 100% 39747 -10 -10.0% 2.0 63% 0.19 0.80 240,000 192,720
65 - 69 F 228 67 85 2 100% 100% 13619 -10 -10.0% 1.0 55% 0.23 0.85 53,844 45,606
60 - 64 F 119 63 85 2 100% 100% 7072 -20 -20.0% 1.0 48% 0.26 0.97 26,620 25,715
Total 1,583 143,184 805,311 607,213
100%
PROPOSED CONDITION
OAT# of cooling
hours
Achievable
CW Temp.
Setpoint (=OA
WB +7)
Proposed
Setpoint Temp
# Cooling Tower
Fans
Proposed VFD
Loading%HP w/ VFD
Proposed
Cooling
Tower kWh
CW Temp.
Increase from
IPLV
Requirements
Chiller
Efficiency
Improvement
Number of
Chillers
Running
% of Total
Tons
Efficiency
Penalty due
to Loading
Proposed
kW/ton
Proposed ton-
hr/yr
Proposed
kWh / yr
100 - 104 F 0 87 87 6 100% 100% 0 -2 -1.6% 3.0 71% 0.15 0.70 0 0
95 - 99 F 1 83 83 5 100% 100% 149 2 1.9% 2.0 99% 0.01 0.54 772 417
90 - 94 F 38 80 80 5 100% 100% 5670 5 4.6% 2.0 92% 0.04 0.56 27,269 15,218
85 - 89 F 73 79 79 4 100% 100% 8713 7 6.5% 2.0 85% 0.08 0.58 48,399 28,057
80 - 84 F 246 76 76 4 100% 100% 29363 9 9.1% 2.0 77% 0.12 0.60 147,748 88,640
75 - 79 F 434 74 74 3 100% 100% 38852 1 0.8% 2.0 70% 0.15 0.69 236,964 163,372
70 - 74 F 444 71 71 3 100% 100% 39747 4 4.0% 2.0 63% 0.19 0.70 218,182 152,902
65 - 69 F 228 67 67 2 100% 100% 13619 8 7.9% 1.0 55% 0.23 0.71 48,949 34,713
60 - 64 F 119 63 63 2 100% 100% 7072 2 2.4% 1.0 48% 0.26 0.79 22,183 17,429
Total 1,583 143,184 750,465 500,748
ECM 5.3 - Condenser Water Reset
Dome-Tech, Inc.
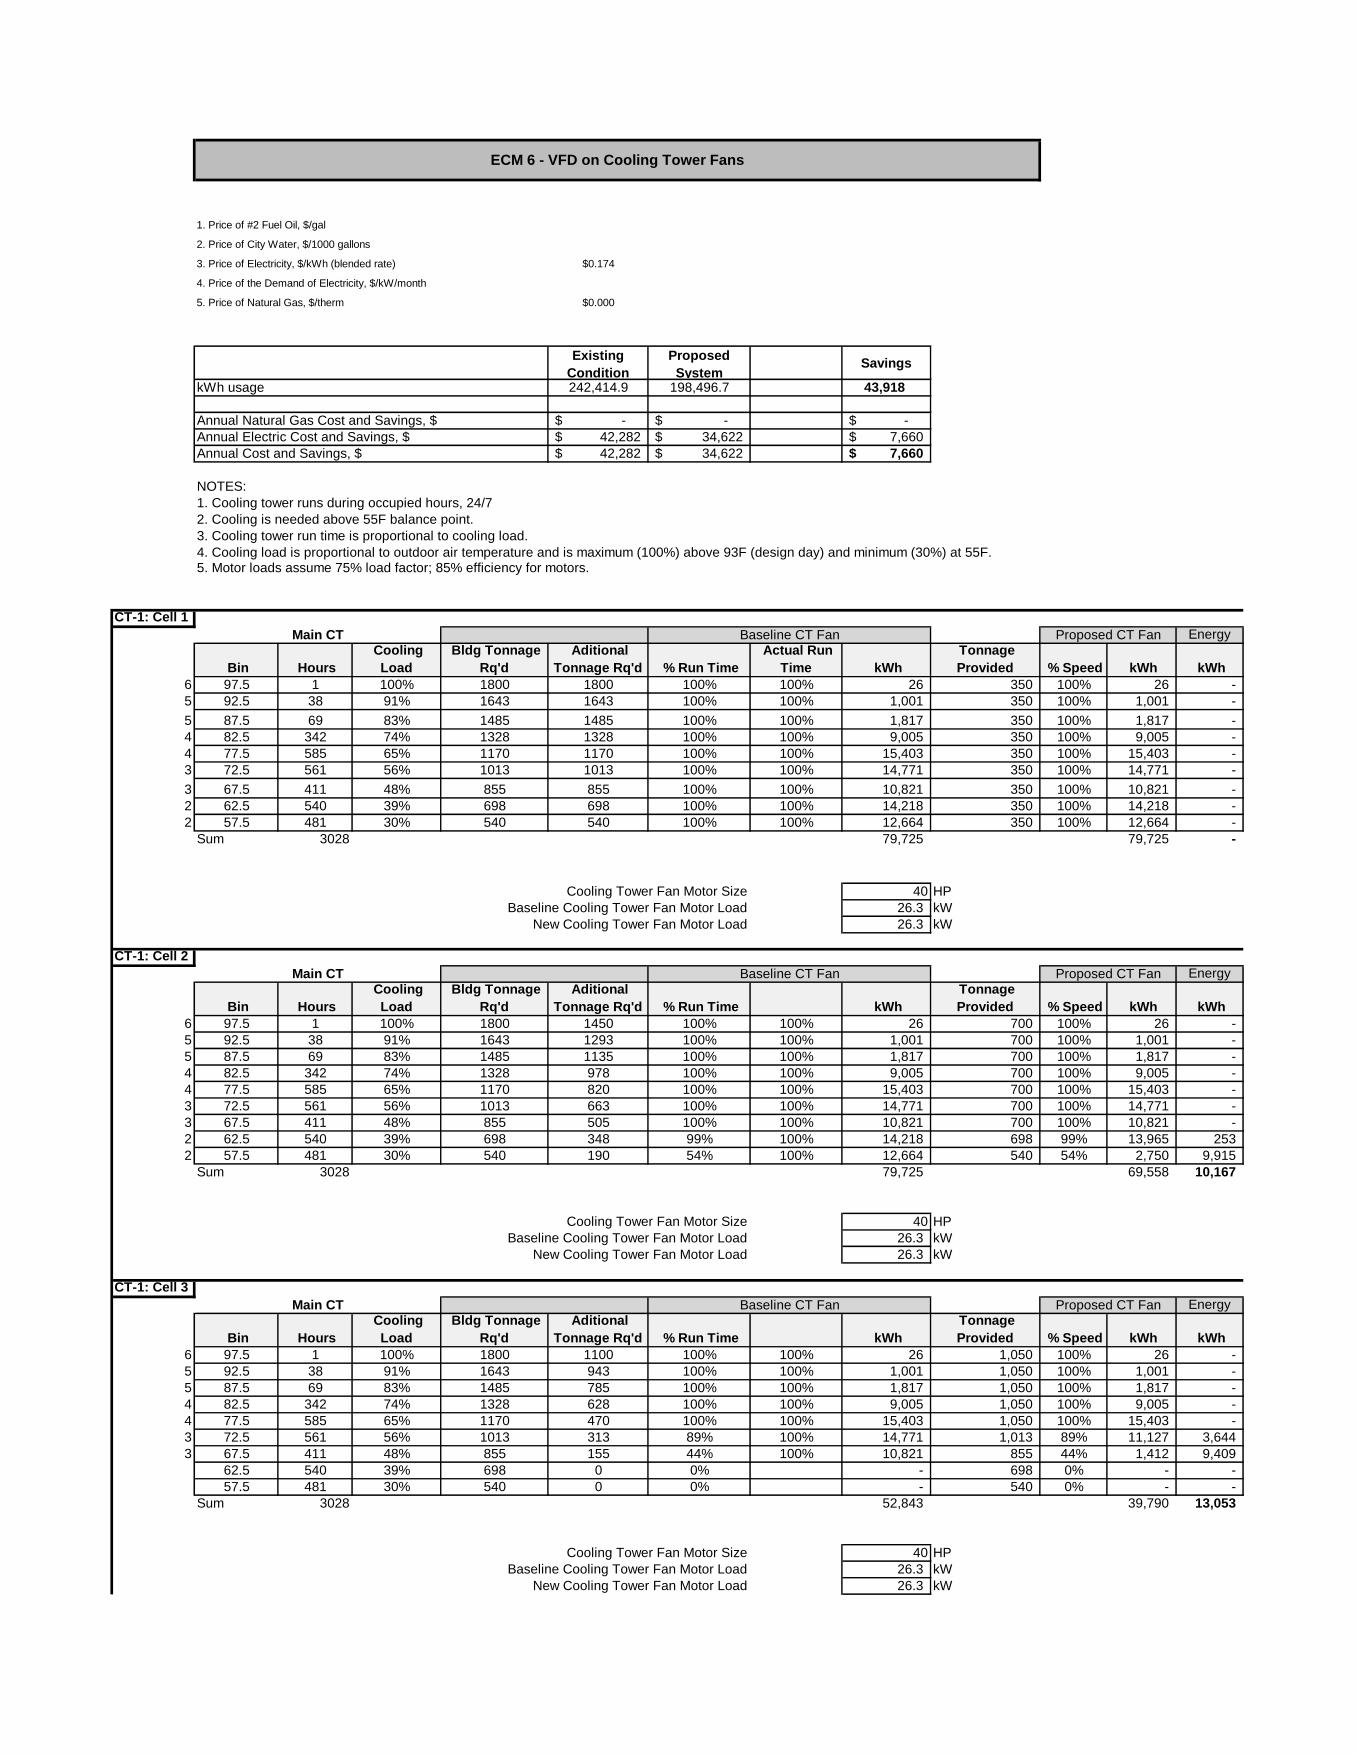
$0.174
$0.000
Existing
Condition
Proposed
SystemSavings
242,414.9 198,496.7 43,918
-$ -$ -$
42,282$ 34,622$ 7,660$
42,282$ 34,622$ 7,660$
CT-1: Cell 1
Energy
Bin Hours
Cooling
Load
Bldg Tonnage
Rq'd
Aditional
Tonnage Rq'd % Run Time
Actual Run
Time kWh
Tonnage
Provided % Speed kWh kWh
6 97.5 1 100% 1800 1800 100% 100% 26 350 100% 26 -
5 92.5 38 91% 1643 1643 100% 100% 1,001 350 100% 1,001 -
5 87.5 69 83% 1485 1485 100% 100% 1,817 350 100% 1,817 -
4 82.5 342 74% 1328 1328 100% 100% 9,005 350 100% 9,005 -
4 77.5 585 65% 1170 1170 100% 100% 15,403 350 100% 15,403 -
3 72.5 561 56% 1013 1013 100% 100% 14,771 350 100% 14,771 -
3 67.5 411 48% 855 855 100% 100% 10,821 350 100% 10,821 -
2 62.5 540 39% 698 698 100% 100% 14,218 350 100% 14,218 -
2 57.5 481 30% 540 540 100% 100% 12,664 350 100% 12,664 -
Sum 3028 79,725 79,725 -
Cooling Tower Fan Motor Size 40 HP
Baseline Cooling Tower Fan Motor Load 26.3 kW
New Cooling Tower Fan Motor Load 26.3 kW
CT-1: Cell 2
Energy
Bin Hours
Cooling
Load
Bldg Tonnage
Rq'd
Aditional
Tonnage Rq'd % Run Time kWh
Tonnage
Provided % Speed kWh kWh
6 97.5 1 100% 1800 1450 100% 100% 26 700 100% 26 -
5 92.5 38 91% 1643 1293 100% 100% 1,001 700 100% 1,001 -
5 87.5 69 83% 1485 1135 100% 100% 1,817 700 100% 1,817 -
4 82.5 342 74% 1328 978 100% 100% 9,005 700 100% 9,005 -
4 77.5 585 65% 1170 820 100% 100% 15,403 700 100% 15,403 -
3 72.5 561 56% 1013 663 100% 100% 14,771 700 100% 14,771 -
3 67.5 411 48% 855 505 100% 100% 10,821 700 100% 10,821 -
2 62.5 540 39% 698 348 99% 100% 14,218 698 99% 13,965 253
2 57.5 481 30% 540 190 54% 100% 12,664 540 54% 2,750 9,915
Sum 3028 79,725 69,558 10,167
Cooling Tower Fan Motor Size 40 HP
Baseline Cooling Tower Fan Motor Load 26.3 kW
New Cooling Tower Fan Motor Load 26.3 kW
CT-1: Cell 3
Energy
Bin Hours
Cooling
Load
Bldg Tonnage
Rq'd
Aditional
Tonnage Rq'd % Run Time kWh
Tonnage
Provided % Speed kWh kWh
6 97.5 1 100% 1800 1100 100% 100% 26 1,050 100% 26 -
5 92.5 38 91% 1643 943 100% 100% 1,001 1,050 100% 1,001 -
5 87.5 69 83% 1485 785 100% 100% 1,817 1,050 100% 1,817 -
4 82.5 342 74% 1328 628 100% 100% 9,005 1,050 100% 9,005 -
4 77.5 585 65% 1170 470 100% 100% 15,403 1,050 100% 15,403 -
3 72.5 561 56% 1013 313 89% 100% 14,771 1,013 89% 11,127 3,644
3 67.5 411 48% 855 155 44% 100% 10,821 855 44% 1,412 9,409
62.5 540 39% 698 0 0% - 698 0% - -
57.5 481 30% 540 0 0% - 540 0% - -
Sum 3028 52,843 39,790 13,053
Cooling Tower Fan Motor Size 40 HP
Baseline Cooling Tower Fan Motor Load 26.3 kW
New Cooling Tower Fan Motor Load 26.3 kW
3. Price of Electricity, $/kWh (blended rate)
Annual Natural Gas Cost and Savings, $
Annual Electric Cost and Savings, $
Annual Cost and Savings, $
NOTES:
1. Cooling tower runs during occupied hours, 24/7
2. Cooling is needed above 55F balance point.
3. Cooling tower run time is proportional to cooling load.
4. Cooling load is proportional to outdoor air temperature and is maximum (100%) above 93F (design day) and minimum (30%) at 55F.5. Motor loads assume 75% load factor; 85% efficiency for motors.
4. Price of the Demand of Electricity, $/kW/month
5. Price of Natural Gas, $/therm
1. Price of #2 Fuel Oil, $/gal
2. Price of City Water, $/1000 gallons
ECM 6 - VFD on Cooling Tower Fans
kWh usage
Main CT Baseline CT Fan Proposed CT Fan
Main CT Baseline CT Fan Proposed CT Fan
Main CT Baseline CT Fan Proposed CT Fan
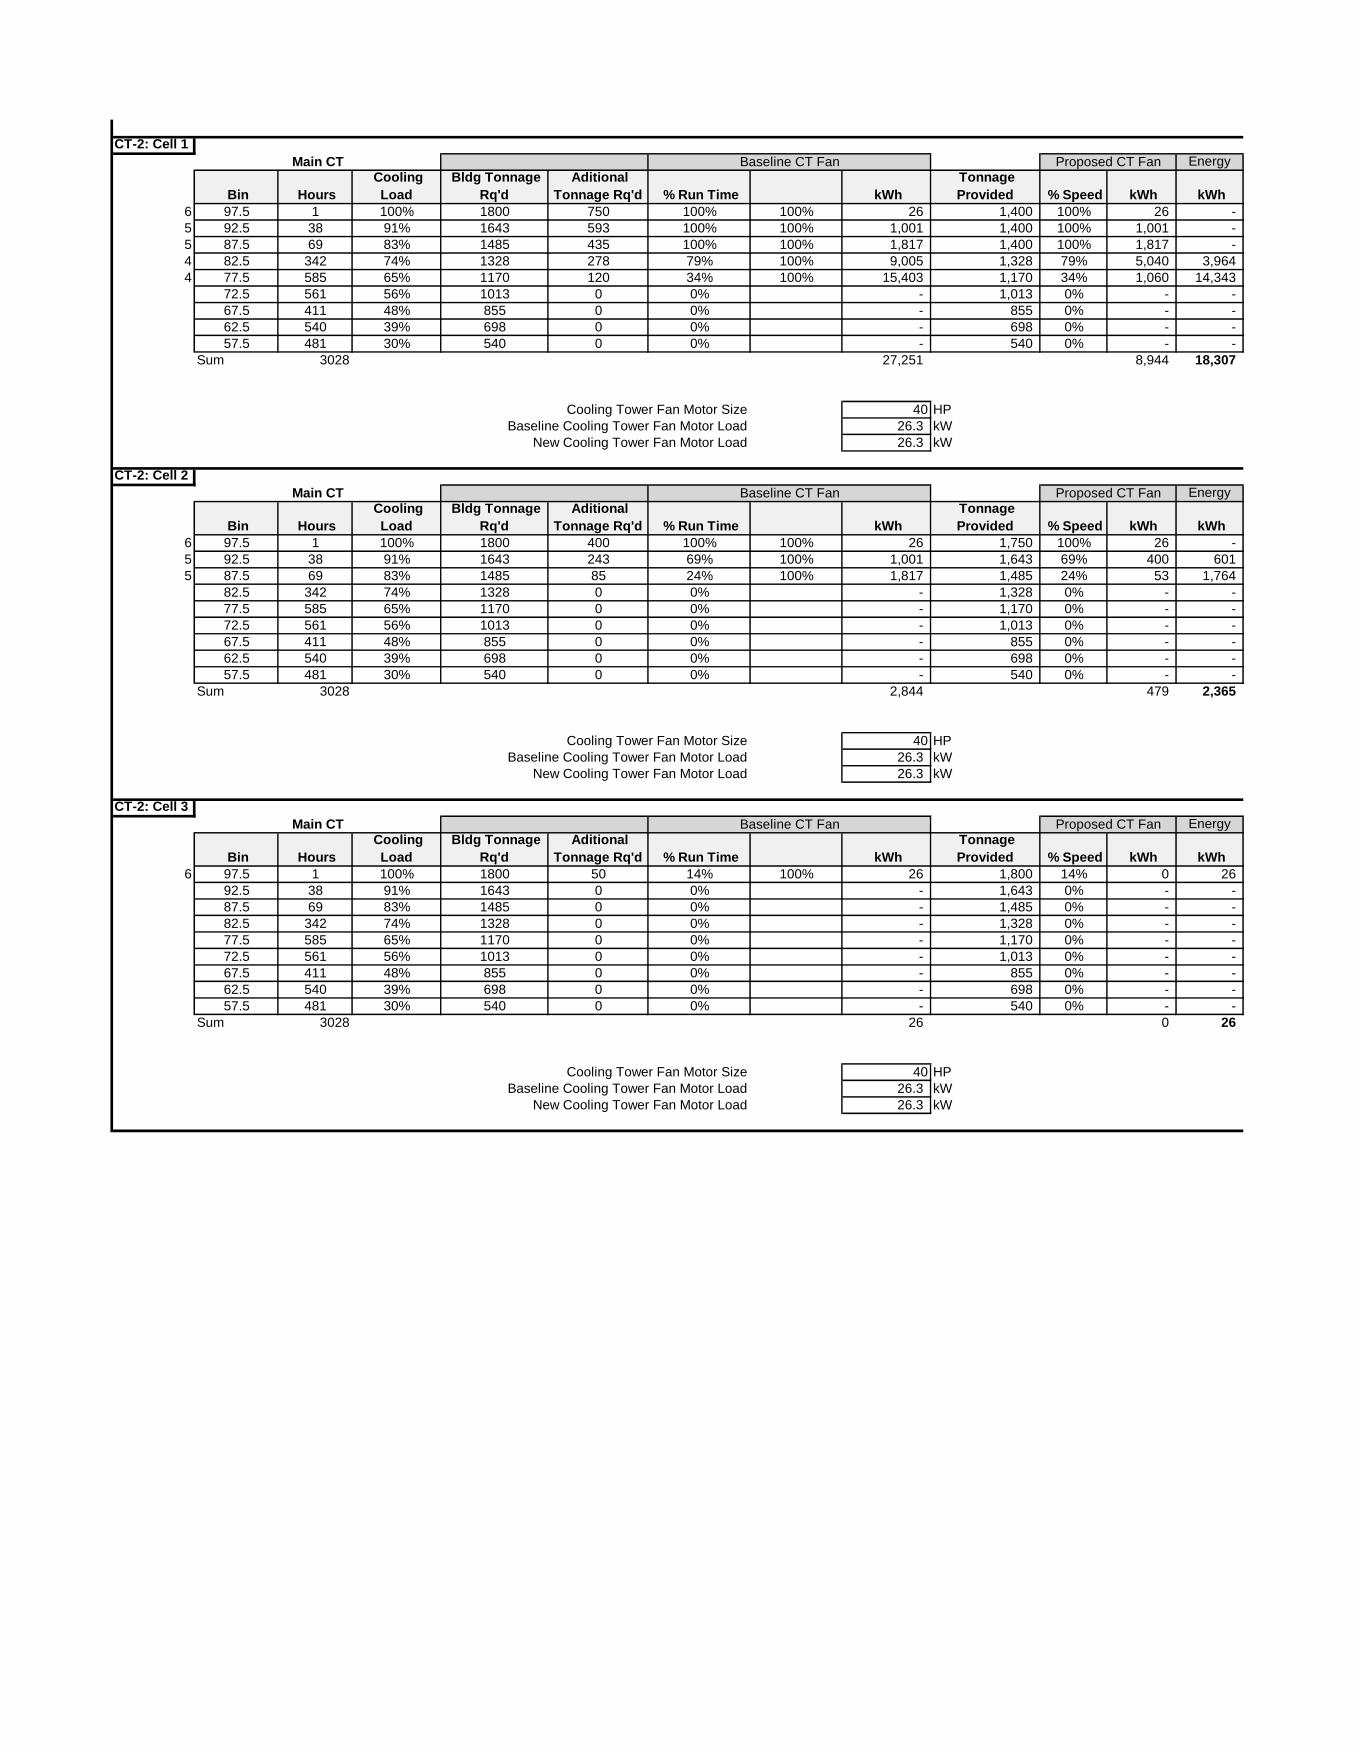
CT-2: Cell 1
Energy
Bin Hours
Cooling
Load
Bldg Tonnage
Rq'd
Aditional
Tonnage Rq'd % Run Time kWh
Tonnage
Provided % Speed kWh kWh
6 97.5 1 100% 1800 750 100% 100% 26 1,400 100% 26 -
5 92.5 38 91% 1643 593 100% 100% 1,001 1,400 100% 1,001 -
5 87.5 69 83% 1485 435 100% 100% 1,817 1,400 100% 1,817 -
4 82.5 342 74% 1328 278 79% 100% 9,005 1,328 79% 5,040 3,964
4 77.5 585 65% 1170 120 34% 100% 15,403 1,170 34% 1,060 14,343
72.5 561 56% 1013 0 0% - 1,013 0% - -
67.5 411 48% 855 0 0% - 855 0% - -
62.5 540 39% 698 0 0% - 698 0% - -
57.5 481 30% 540 0 0% - 540 0% - -
Sum 3028 27,251 8,944 18,307
Cooling Tower Fan Motor Size 40 HP
Baseline Cooling Tower Fan Motor Load 26.3 kW
New Cooling Tower Fan Motor Load 26.3 kW
CT-2: Cell 2
Energy
Bin Hours
Cooling
Load
Bldg Tonnage
Rq'd
Aditional
Tonnage Rq'd % Run Time kWh
Tonnage
Provided % Speed kWh kWh
6 97.5 1 100% 1800 400 100% 100% 26 1,750 100% 26 -
5 92.5 38 91% 1643 243 69% 100% 1,001 1,643 69% 400 601
5 87.5 69 83% 1485 85 24% 100% 1,817 1,485 24% 53 1,764
82.5 342 74% 1328 0 0% - 1,328 0% - -
77.5 585 65% 1170 0 0% - 1,170 0% - -
72.5 561 56% 1013 0 0% - 1,013 0% - -
67.5 411 48% 855 0 0% - 855 0% - -
62.5 540 39% 698 0 0% - 698 0% - -
57.5 481 30% 540 0 0% - 540 0% - -
Sum 3028 2,844 479 2,365
Cooling Tower Fan Motor Size 40 HP
Baseline Cooling Tower Fan Motor Load 26.3 kW
New Cooling Tower Fan Motor Load 26.3 kW
CT-2: Cell 3
Energy
Bin Hours
Cooling
Load
Bldg Tonnage
Rq'd
Aditional
Tonnage Rq'd % Run Time kWh
Tonnage
Provided % Speed kWh kWh
6 97.5 1 100% 1800 50 14% 100% 26 1,800 14% 0 26
92.5 38 91% 1643 0 0% - 1,643 0% - -
87.5 69 83% 1485 0 0% - 1,485 0% - -
82.5 342 74% 1328 0 0% - 1,328 0% - -
77.5 585 65% 1170 0 0% - 1,170 0% - -
72.5 561 56% 1013 0 0% - 1,013 0% - -
67.5 411 48% 855 0 0% - 855 0% - -
62.5 540 39% 698 0 0% - 698 0% - -
57.5 481 30% 540 0 0% - 540 0% - -
Sum 3028 26 0 26
Cooling Tower Fan Motor Size 40 HP
Baseline Cooling Tower Fan Motor Load 26.3 kW
New Cooling Tower Fan Motor Load 26.3 kW
Main CT Baseline CT Fan Proposed CT Fan
Main CT Baseline CT Fan Proposed CT Fan
Main CT Baseline CT Fan Proposed CT Fan
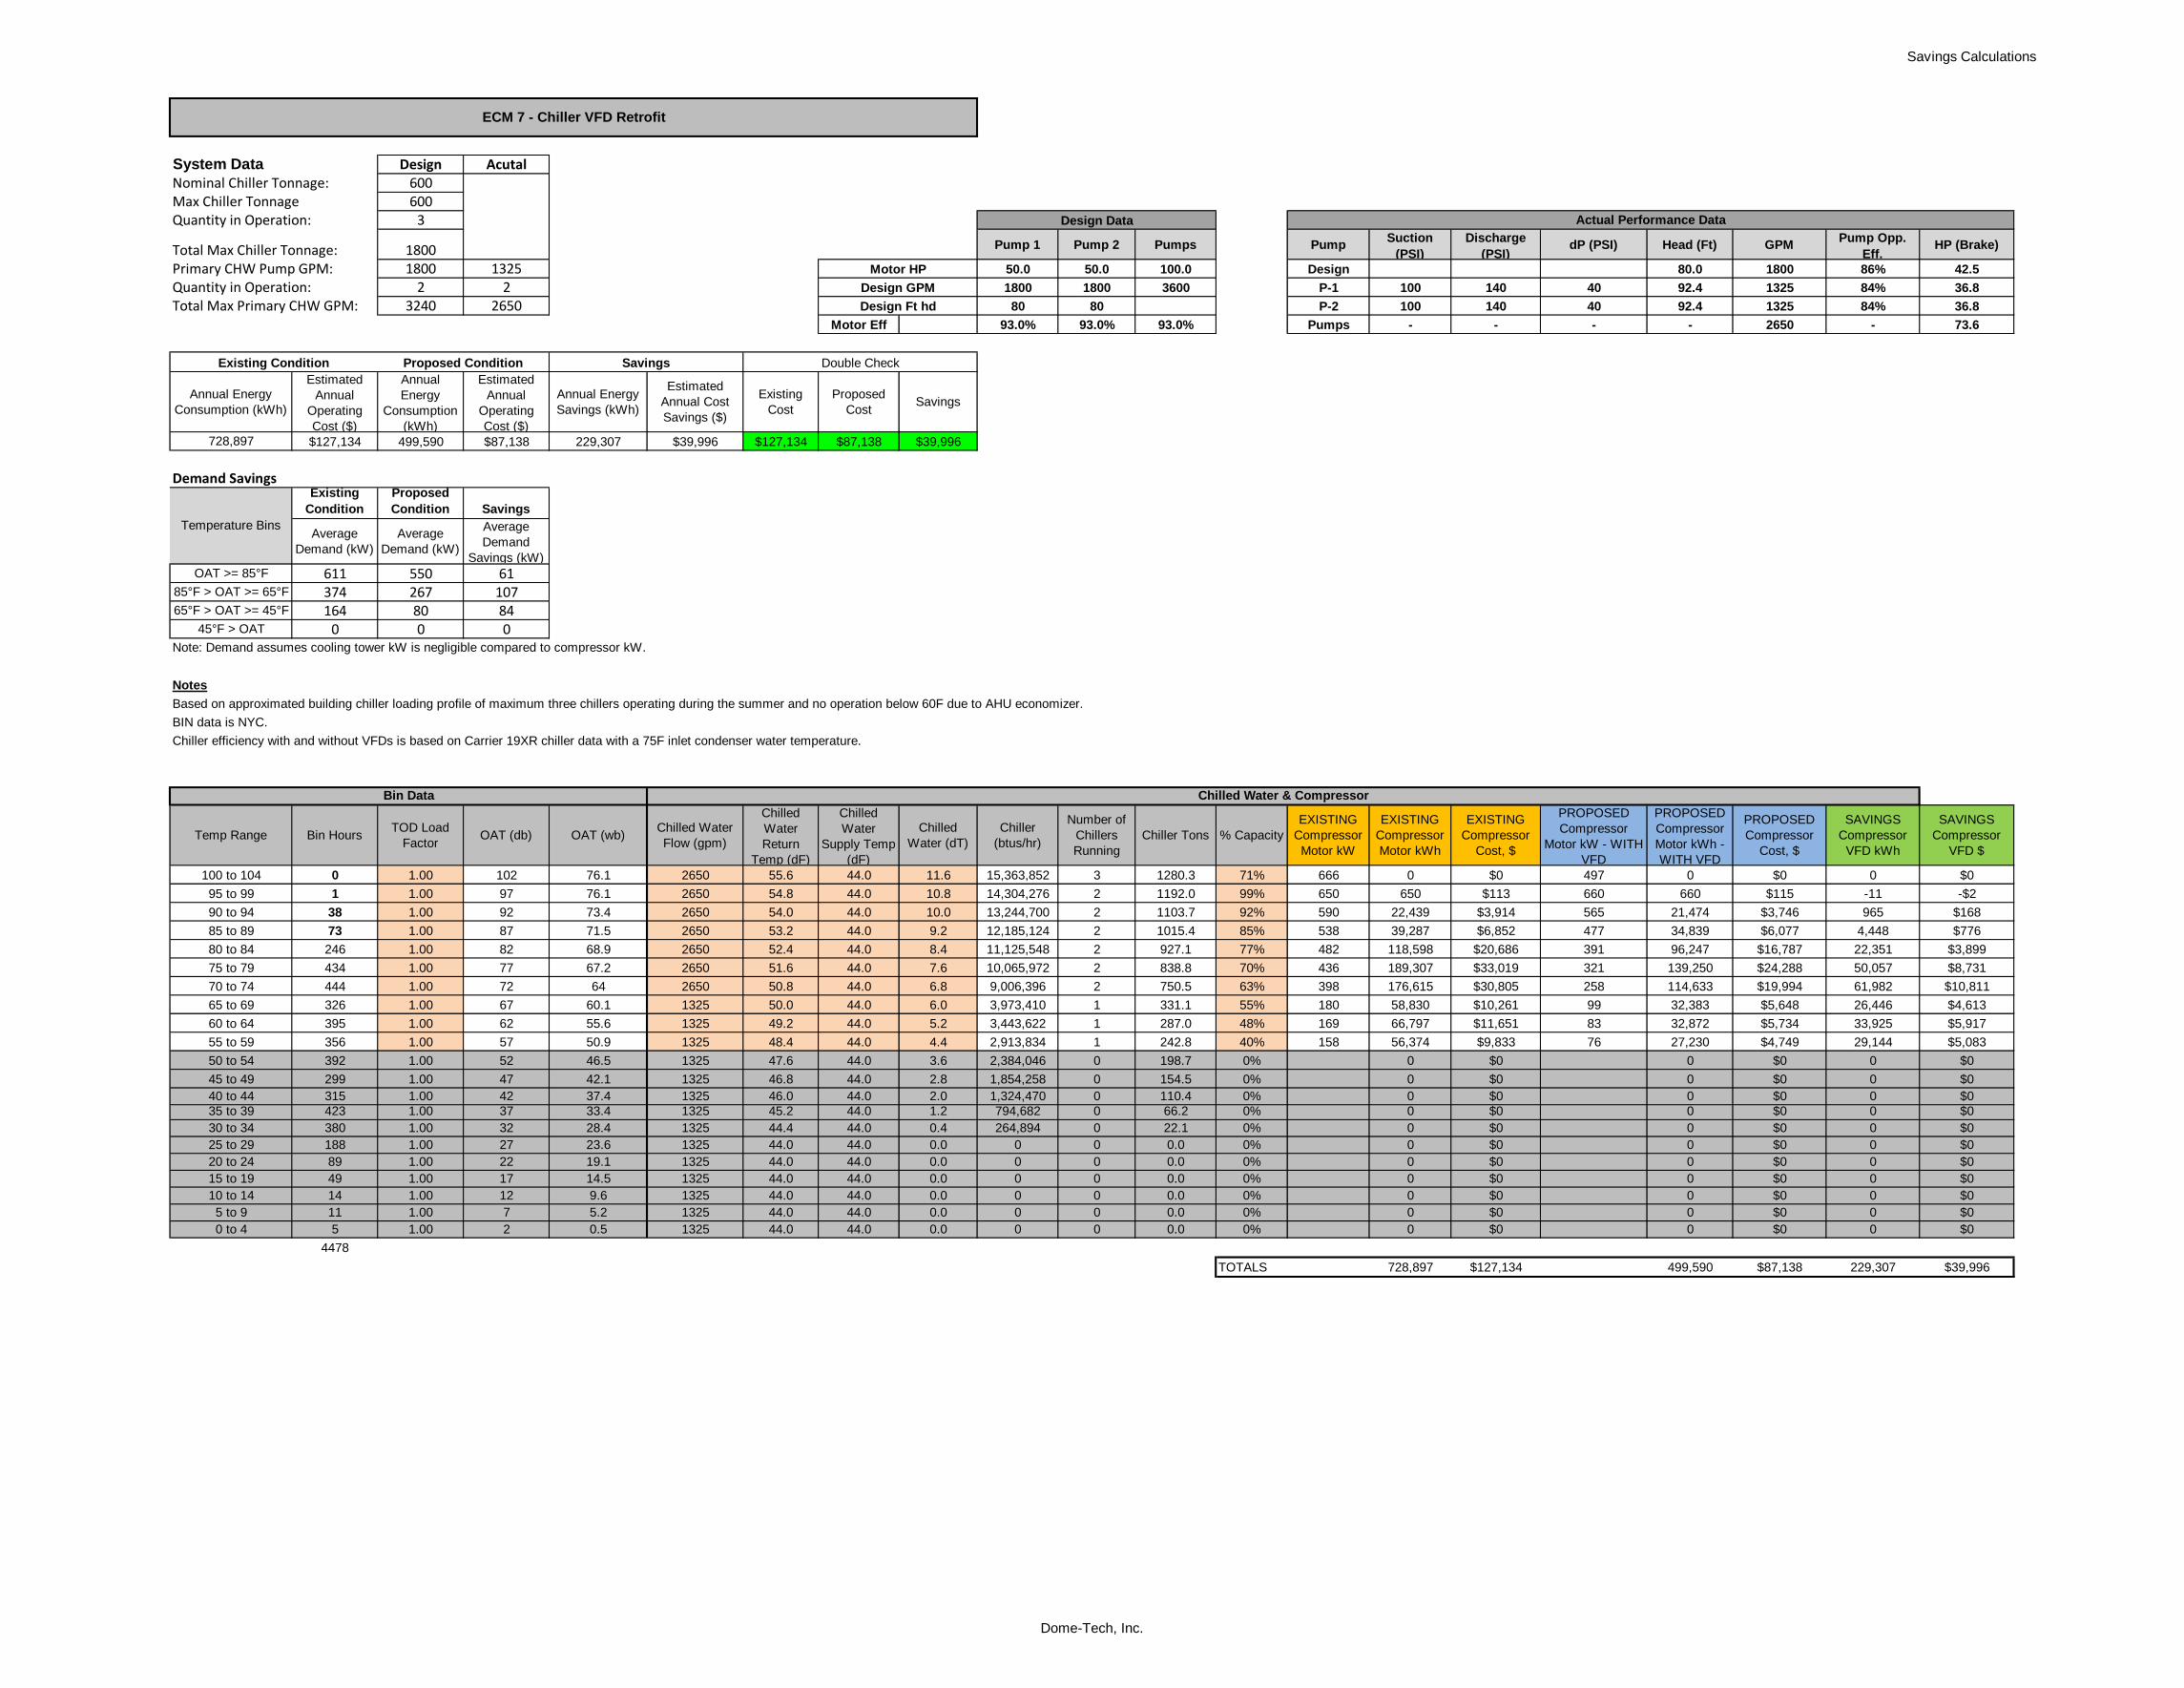
Savings Calculations
System Data Design AcutalNominal Chiller Tonnage: 600Max Chiller Tonnage 600Quantity in Operation: 3
Total Max Chiller Tonnage: 1800 Pump 1 Pump 2 Pumps PumpSuction
(PSI)
Discharge
(PSI)dP (PSI) Head (Ft) GPM
Pump Opp.
Eff.HP (Brake)
Primary CHW Pump GPM: 1800 1325 50.0 50.0 100.0 Design 80.0 1800 86% 42.5
Quantity in Operation: 2 2 1800 1800 3600 P-1 100 140 40 92.4 1325 84% 36.8
Total Max Primary CHW GPM: 3240 2650 80 80 P-2 100 140 40 92.4 1325 84% 36.8
Motor Eff 93.0% 93.0% 93.0% Pumps - - - - 2650 - 73.6
Annual Energy
Consumption (kWh)
Estimated
Annual
Operating
Cost ($)
Annual
Energy
Consumption
(kWh)
Estimated
Annual
Operating
Cost ($)
Annual Energy
Savings (kWh)
Estimated
Annual Cost
Savings ($)
Existing
Cost
Proposed
CostSavings
728,897 $127,134 499,590 $87,138 229,307 $39,996 $127,134 $87,138 $39,996
Demand SavingsExisting
Condition
Proposed
Condition Savings
Average
Demand (kW)
Average
Demand (kW)
Average
Demand
Savings (kW)
OAT >= 85°F 611 550 6185°F > OAT >= 65°F 374 267 10765°F > OAT >= 45°F 164 80 84
45°F > OAT 0 0 0Note: Demand assumes cooling tower kW is negligible compared to compressor kW.
Notes
Based on approximated building chiller loading profile of maximum three chillers operating during the summer and no operation below 60F due to AHU economizer.
BIN data is NYC.
Chiller efficiency with and without VFDs is based on Carrier 19XR chiller data with a 75F inlet condenser water temperature.
Temp Range Bin HoursTOD Load
FactorOAT (db) OAT (wb)
Chilled Water
Flow (gpm)
Chilled
Water
Return
Temp (dF)
Chilled
Water
Supply Temp
(dF)
Chilled
Water (dT)
Chiller
(btus/hr)
Number of
Chillers
Running
Chiller Tons % Capacity
EXISTING
Compressor
Motor kW
EXISTING
Compressor
Motor kWh
EXISTING
Compressor
Cost, $
PROPOSED
Compressor
Motor kW - WITH
VFD
PROPOSED
Compressor
Motor kWh -
WITH VFD
PROPOSED
Compressor
Cost, $
SAVINGS
Compressor
VFD kWh
SAVINGS
Compressor
VFD $
100 to 104 0 1.00 102 76.1 2650 55.6 44.0 11.6 15,363,852 3 1280.3 71% 666 0 $0 497 0 $0 0 $0
95 to 99 1 1.00 97 76.1 2650 54.8 44.0 10.8 14,304,276 2 1192.0 99% 650 650 $113 660 660 $115 -11 -$2
90 to 94 38 1.00 92 73.4 2650 54.0 44.0 10.0 13,244,700 2 1103.7 92% 590 22,439 $3,914 565 21,474 $3,746 965 $168
85 to 89 73 1.00 87 71.5 2650 53.2 44.0 9.2 12,185,124 2 1015.4 85% 538 39,287 $6,852 477 34,839 $6,077 4,448 $776
80 to 84 246 1.00 82 68.9 2650 52.4 44.0 8.4 11,125,548 2 927.1 77% 482 118,598 $20,686 391 96,247 $16,787 22,351 $3,899
75 to 79 434 1.00 77 67.2 2650 51.6 44.0 7.6 10,065,972 2 838.8 70% 436 189,307 $33,019 321 139,250 $24,288 50,057 $8,731
70 to 74 444 1.00 72 64 2650 50.8 44.0 6.8 9,006,396 2 750.5 63% 398 176,615 $30,805 258 114,633 $19,994 61,982 $10,811
65 to 69 326 1.00 67 60.1 1325 50.0 44.0 6.0 3,973,410 1 331.1 55% 180 58,830 $10,261 99 32,383 $5,648 26,446 $4,613
60 to 64 395 1.00 62 55.6 1325 49.2 44.0 5.2 3,443,622 1 287.0 48% 169 66,797 $11,651 83 32,872 $5,734 33,925 $5,917
55 to 59 356 1.00 57 50.9 1325 48.4 44.0 4.4 2,913,834 1 242.8 40% 158 56,374 $9,833 76 27,230 $4,749 29,144 $5,083
50 to 54 392 1.00 52 46.5 1325 47.6 44.0 3.6 2,384,046 0 198.7 0% 0 $0 0 $0 0 $0
45 to 49 299 1.00 47 42.1 1325 46.8 44.0 2.8 1,854,258 0 154.5 0% 0 $0 0 $0 0 $0
40 to 44 315 1.00 42 37.4 1325 46.0 44.0 2.0 1,324,470 0 110.4 0% 0 $0 0 $0 0 $0
35 to 39 423 1.00 37 33.4 1325 45.2 44.0 1.2 794,682 0 66.2 0% 0 $0 0 $0 0 $0
30 to 34 380 1.00 32 28.4 1325 44.4 44.0 0.4 264,894 0 22.1 0% 0 $0 0 $0 0 $0
25 to 29 188 1.00 27 23.6 1325 44.0 44.0 0.0 0 0 0.0 0% 0 $0 0 $0 0 $0
20 to 24 89 1.00 22 19.1 1325 44.0 44.0 0.0 0 0 0.0 0% 0 $0 0 $0 0 $0
15 to 19 49 1.00 17 14.5 1325 44.0 44.0 0.0 0 0 0.0 0% 0 $0 0 $0 0 $0
10 to 14 14 1.00 12 9.6 1325 44.0 44.0 0.0 0 0 0.0 0% 0 $0 0 $0 0 $0
5 to 9 11 1.00 7 5.2 1325 44.0 44.0 0.0 0 0 0.0 0% 0 $0 0 $0 0 $0
0 to 4 5 1.00 2 0.5 1325 44.0 44.0 0.0 0 0 0.0 0% 0 $0 0 $0 0 $0
4478
TOTALS 728,897 $127,134 499,590 $87,138 229,307 $39,996
Design Data
Temperature Bins
Bin Data Chilled Water & Compressor
Double Check
Actual Performance Data
Motor HP
Design GPM
Existing Condition Proposed Condition Savings
Design Ft hd
ECM 7 - Chiller VFD Retrofit
Dome-Tech, Inc.
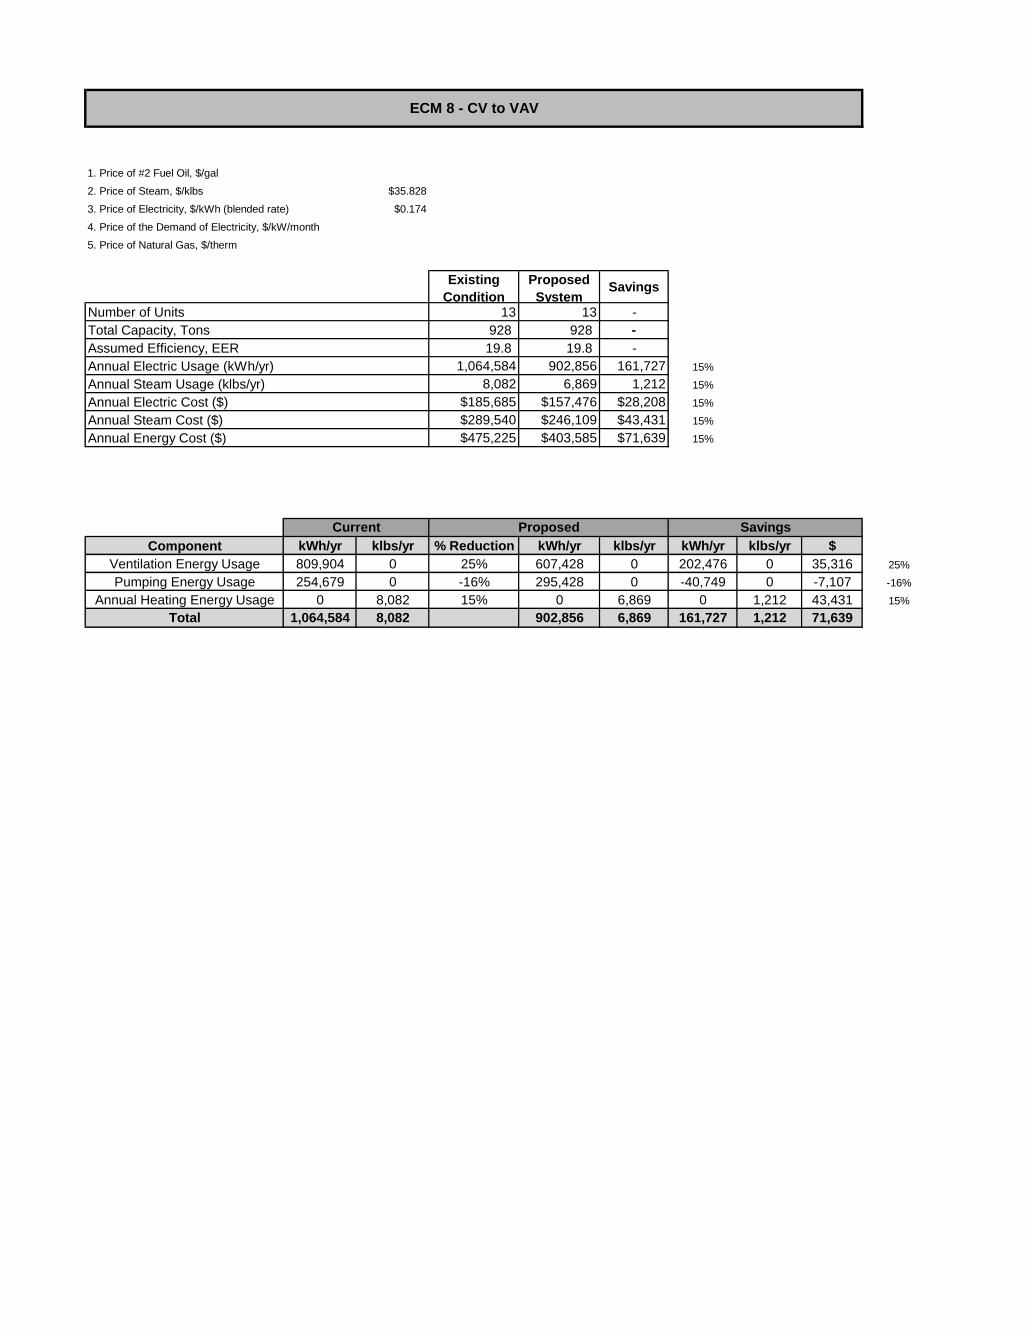
1. Price of #2 Fuel Oil, $/gal
2. Price of Steam, $/klbs $35.828
3. Price of Electricity, $/kWh (blended rate) $0.174
4. Price of the Demand of Electricity, $/kW/month
5. Price of Natural Gas, $/therm
Existing
Condition
Proposed
System Savings
13 13 -
928 928 -
19.8 19.8 -
1,064,584 902,856 161,727 15%
8,082 6,869 1,212 15%
$185,685 $157,476 $28,208 15%
$289,540 $246,109 $43,431 15%
$475,225 $403,585 $71,639 15%
Component kWh/yr klbs/yr % Reduction kWh/yr klbs/yr kWh/yr klbs/yr $
Ventilation Energy Usage 809,904 0 25% 607,428 0 202,476 0 35,316 25%
Pumping Energy Usage 254,679 0 -16% 295,428 0 -40,749 0 -7,107 -16%
Annual Heating Energy Usage 0 8,082 15% 0 6,869 0 1,212 43,431 15%
Total 1,064,584 8,082 902,856 6,869 161,727 1,212 71,639
ECM 8 - CV to VAV
Current Proposed Savings
Number of Units
Total Capacity, Tons
Assumed Efficiency, EER
Annual Electric Usage (kWh/yr)
Annual Steam Usage (klbs/yr)
Annual Electric Cost ($)
Annual Steam Cost ($)
Annual Energy Cost ($)

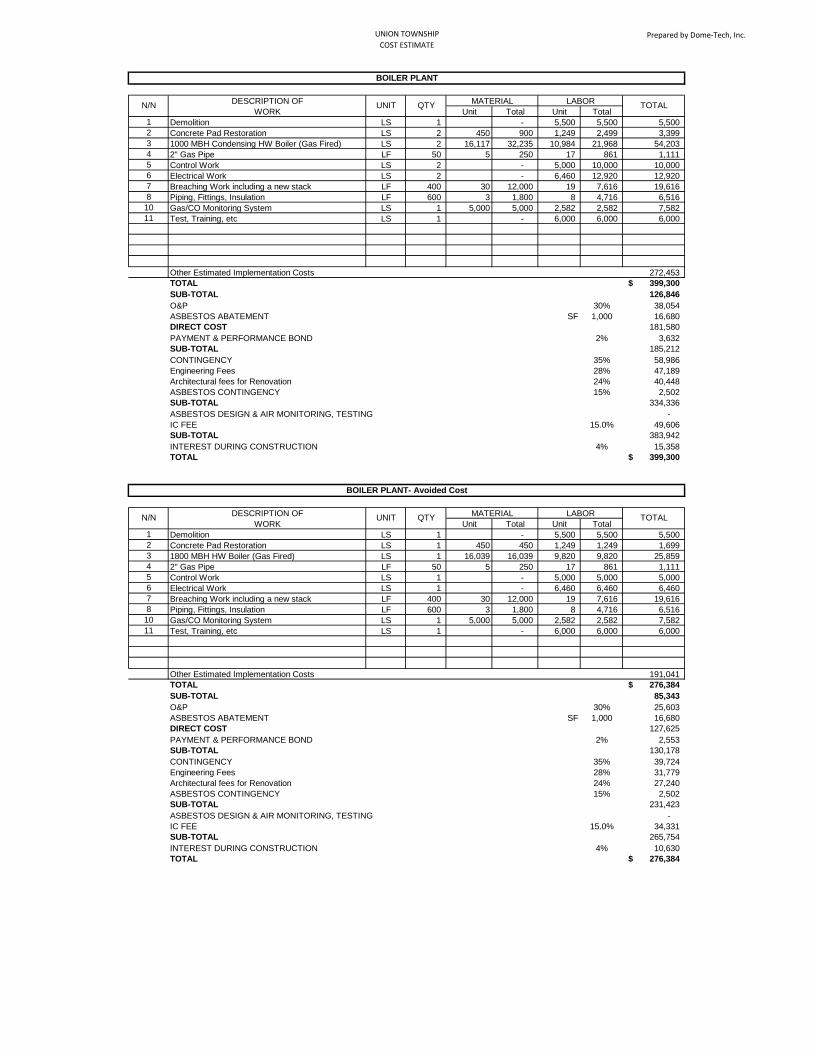
UNION TOWNSHIP
COST ESTIMATEPrepared by Dome-Tech, Inc.
DESCRIPTION OF
WORK Unit Total Unit Total
1 Demolition LS 1 - 5,500 5,500 5,500
2 Concrete Pad Restoration LS 2 450 900 1,249 2,499 3,399
3 1000 MBH Condensing HW Boiler (Gas Fired) LS 2 16,117 32,235 10,984 21,968 54,203
4 2" Gas Pipe LF 50 5 250 17 861 1,111
5 Control Work LS 2 - 5,000 10,000 10,000
6 Electrical Work LS 2 - 6,460 12,920 12,920
7 Breaching Work including a new stack LF 400 30 12,000 19 7,616 19,616
8 Piping, Fittings, Insulation LF 600 3 1,800 8 4,716 6,516
10 Gas/CO Monitoring System LS 1 5,000 5,000 2,582 2,582 7,582
11 Test, Training, etc LS 1 - 6,000 6,000 6,000
Other Estimated Implementation Costs 272,453
TOTAL 399,300$
SUB-TOTAL 126,846
O&P 30% 38,054
ASBESTOS ABATEMENT SF 1,000 16,680
DIRECT COST 181,580
PAYMENT & PERFORMANCE BOND 2% 3,632
SUB-TOTAL 185,212
CONTINGENCY 35% 58,986
Engineering Fees 28% 47,189
Architectural fees for Renovation 24% 40,448
ASBESTOS CONTINGENCY 15% 2,502
SUB-TOTAL 334,336
ASBESTOS DESIGN & AIR MONITORING, TESTING -
IC FEE 15.0% 49,606
SUB-TOTAL 383,942
INTEREST DURING CONSTRUCTION 4% 15,358
TOTAL 399,300$
DESCRIPTION OF
WORK Unit Total Unit Total
1 Demolition LS 1 - 5,500 5,500 5,500
2 Concrete Pad Restoration LS 1 450 450 1,249 1,249 1,699
3 1800 MBH HW Boiler (Gas Fired) LS 1 16,039 16,039 9,820 9,820 25,859
4 2" Gas Pipe LF 50 5 250 17 861 1,111
5 Control Work LS 1 - 5,000 5,000 5,000
6 Electrical Work LS 1 - 6,460 6,460 6,460
7 Breaching Work including a new stack LF 400 30 12,000 19 7,616 19,616
8 Piping, Fittings, Insulation LF 600 3 1,800 8 4,716 6,516
10 Gas/CO Monitoring System LS 1 5,000 5,000 2,582 2,582 7,582
11 Test, Training, etc LS 1 - 6,000 6,000 6,000
Other Estimated Implementation Costs 191,041
TOTAL 276,384$
SUB-TOTAL 85,343
O&P 30% 25,603
ASBESTOS ABATEMENT SF 1,000 16,680
DIRECT COST 127,625
PAYMENT & PERFORMANCE BOND 2% 2,553
SUB-TOTAL 130,178
CONTINGENCY 35% 39,724
Engineering Fees 28% 31,779
Architectural fees for Renovation 24% 27,240
ASBESTOS CONTINGENCY 15% 2,502
SUB-TOTAL 231,423
ASBESTOS DESIGN & AIR MONITORING, TESTING -
IC FEE 15.0% 34,331
SUB-TOTAL 265,754
INTEREST DURING CONSTRUCTION 4% 10,630
TOTAL 276,384$
QTYMATERIAL LABOR
TOTAL
BOILER PLANT
N/N UNIT QTYMATERIAL LABOR
TOTAL
BOILER PLANT- Avoided Cost
N/N UNIT

UNION TOWNSHIP
COST ESTIMATEPrepared by Dome-Tech, Inc.
DESCRIPTION OF
WORK Unit Total Unit Total
1 1/2" Pipe Insulation LF 42 3 119 5 213 332
Other Estimated Implementation Costs 197
TOTAL 529$
SUB-TOTAL 332
O&P 25% 83
ASBESTOS ABATEMENT SF -
DIRECT COST 415
PAYMENT & PERFORMANCE BOND 2% 8
SUB-TOTAL 423
CONTINGENCY 25% 106
Engineering Fees 0% -
Architectural fees for Renovation 0% -
ASBESTOS CONTINGENCY 15% -
SUB-TOTAL 529
ASBESTOS DESIGN & AIR MONITORING, TESTING -
IC FEE 0.0% -
SUB-TOTAL 529
INTEREST DURING CONSTRUCTION 0% -
TOTAL 529$
Pipe Insulation
N/N UNIT QTYMATERIAL LABOR
TOTAL
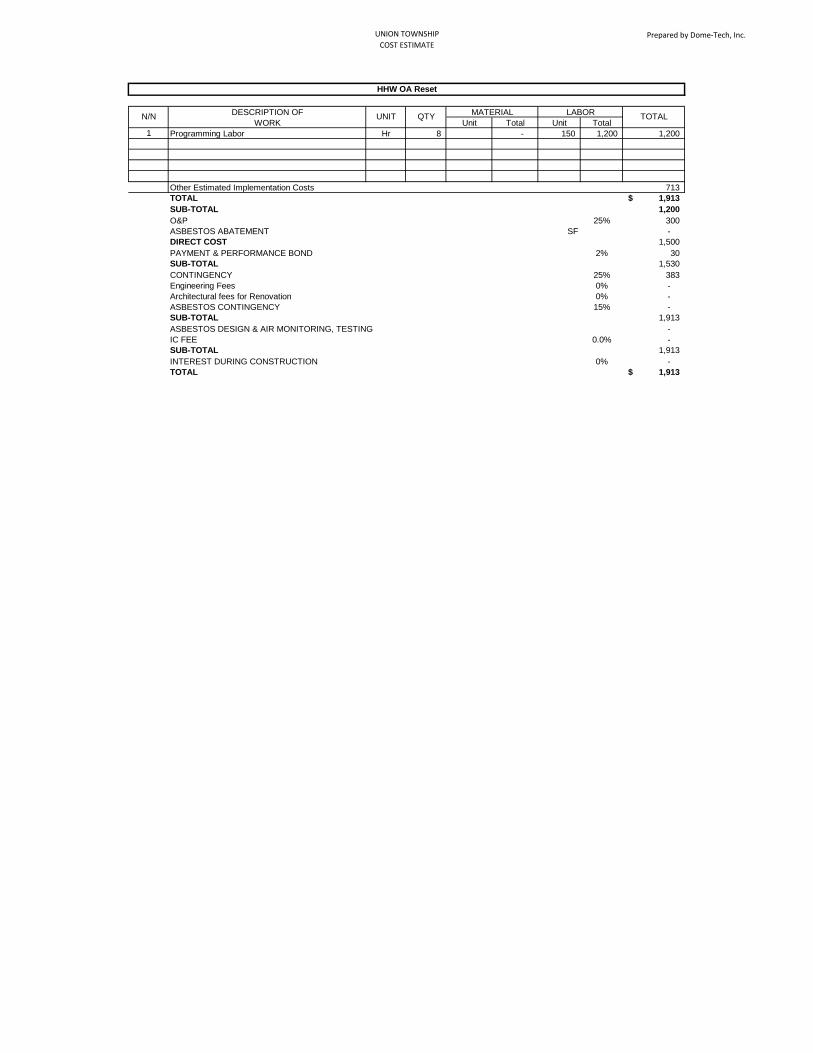
UNION TOWNSHIP
COST ESTIMATEPrepared by Dome-Tech, Inc.
DESCRIPTION OF
WORK Unit Total Unit Total
1 Programming Labor Hr 8 - 150 1,200 1,200
Other Estimated Implementation Costs 713
TOTAL 1,913$
SUB-TOTAL 1,200
O&P 25% 300
ASBESTOS ABATEMENT SF -
DIRECT COST 1,500
PAYMENT & PERFORMANCE BOND 2% 30
SUB-TOTAL 1,530
CONTINGENCY 25% 383
Engineering Fees 0% -
Architectural fees for Renovation 0% -
ASBESTOS CONTINGENCY 15% -
SUB-TOTAL 1,913
ASBESTOS DESIGN & AIR MONITORING, TESTING -
IC FEE 0.0% -
SUB-TOTAL 1,913
INTEREST DURING CONSTRUCTION 0% -
TOTAL 1,913$
HHW OA Reset
N/N UNIT QTYMATERIAL LABOR
TOTAL
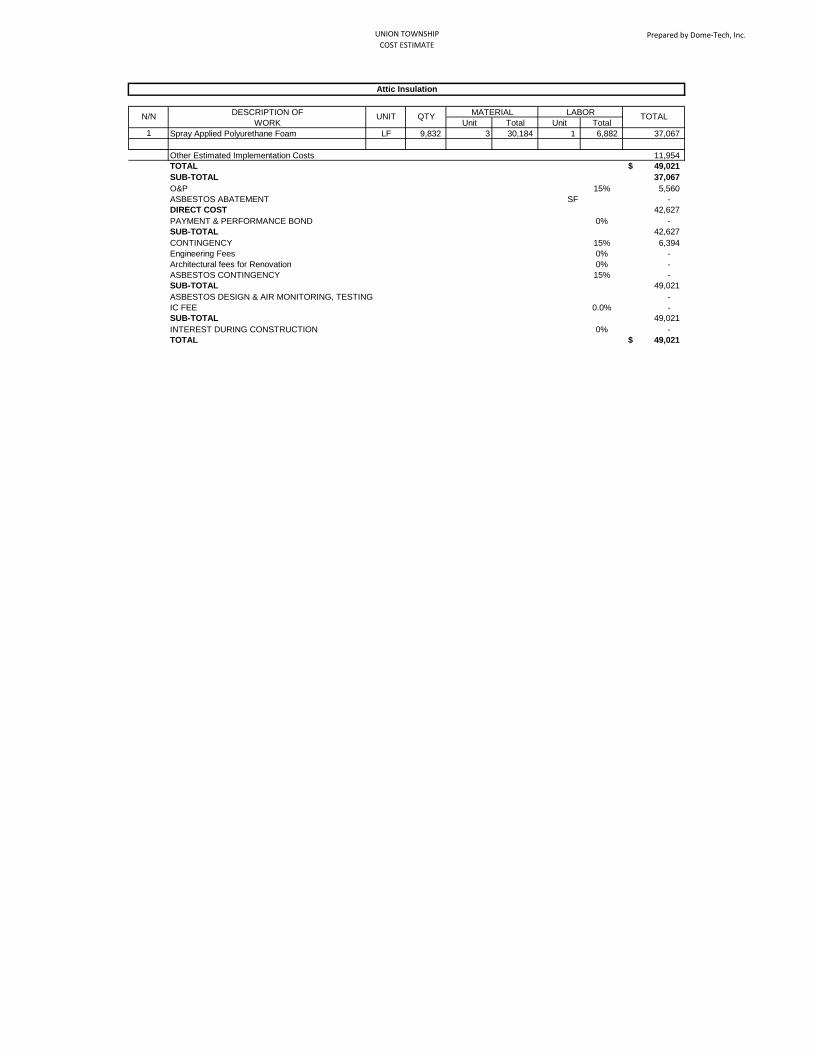
UNION TOWNSHIP
COST ESTIMATEPrepared by Dome-Tech, Inc.
DESCRIPTION OF
WORK Unit Total Unit Total
1 Spray Applied Polyurethane Foam LF 9,832 3 30,184 1 6,882 37,067
Other Estimated Implementation Costs 11,954
TOTAL 49,021$
SUB-TOTAL 37,067
O&P 15% 5,560
ASBESTOS ABATEMENT SF -
DIRECT COST 42,627
PAYMENT & PERFORMANCE BOND 0% -
SUB-TOTAL 42,627
CONTINGENCY 15% 6,394
Engineering Fees 0% -
Architectural fees for Renovation 0% -
ASBESTOS CONTINGENCY 15% -
SUB-TOTAL 49,021
ASBESTOS DESIGN & AIR MONITORING, TESTING -
IC FEE 0.0% -
SUB-TOTAL 49,021
INTEREST DURING CONSTRUCTION 0% -
TOTAL 49,021$
Attic Insulation
N/N UNIT QTYMATERIAL LABOR
TOTAL

UNION TOWNSHIP
COST ESTIMATEPrepared by Dome-Tech, Inc.
DESCRIPTION OF
WORK Unit Total Unit Total
1 Programmable Thermostat Ea 1 151 151 215.33 215 366
Other Estimated Implementation Costs 217
TOTAL 584$
SUB-TOTAL 366
O&P 25% 92
ASBESTOS ABATEMENT SF -
DIRECT COST 458
PAYMENT & PERFORMANCE BOND 2% 9
SUB-TOTAL 467
CONTINGENCY 25% 117
Engineering Fees 0% -
Architectural fees for Renovation 0% -
ASBESTOS CONTINGENCY 15% -
SUB-TOTAL 584
ASBESTOS DESIGN & AIR MONITORING, TESTING -
IC FEE 0.0% -
SUB-TOTAL 584
INTEREST DURING CONSTRUCTION 0% -
TOTAL 584$
Programmable Thermostat
N/N UNIT QTYMATERIAL LABOR
TOTAL
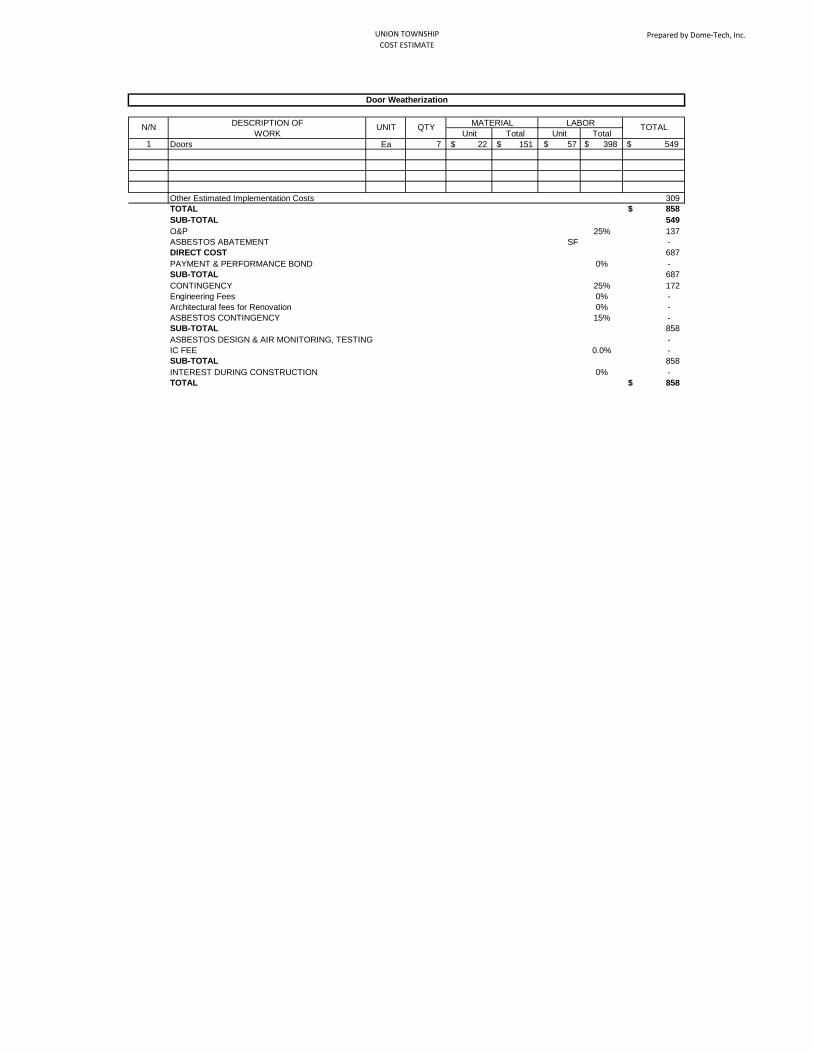
UNION TOWNSHIP
COST ESTIMATEPrepared by Dome-Tech, Inc.
DESCRIPTION OF
WORK Unit Total Unit Total
1 Doors Ea 7 22$ 151$ $ 57 $ 398 $ 549
Other Estimated Implementation Costs 309
TOTAL 858$
SUB-TOTAL 549
O&P 25% 137
ASBESTOS ABATEMENT SF -
DIRECT COST 687
PAYMENT & PERFORMANCE BOND 0% -
SUB-TOTAL 687
CONTINGENCY 25% 172
Engineering Fees 0% -
Architectural fees for Renovation 0% -
ASBESTOS CONTINGENCY 15% -
SUB-TOTAL 858
ASBESTOS DESIGN & AIR MONITORING, TESTING -
IC FEE 0.0% -
SUB-TOTAL 858
INTEREST DURING CONSTRUCTION 0% -
TOTAL 858$
Door Weatherization
N/N UNIT QTYMATERIAL LABOR
TOTAL

UNION TOWNSHIP
COST ESTIMATEPrepared by Dome-Tech, Inc.
DESCRIPTION OF
WORK Unit Total Unit Total
1 Time Clock Ea 1 78$ 78$ $ 109 $ 109 $ 187
Other Estimated Implementation Costs 82
TOTAL 269$
SUB-TOTAL 187
O&P 25% 47
ASBESTOS ABATEMENT SF -
DIRECT COST 234
PAYMENT & PERFORMANCE BOND 0% -
SUB-TOTAL 234
CONTINGENCY 15% 35
Engineering Fees 0% -
Architectural fees for Renovation 0% -
ASBESTOS CONTINGENCY 15% -
SUB-TOTAL 269
ASBESTOS DESIGN & AIR MONITORING, TESTING -
IC FEE 0.0% -
SUB-TOTAL 269
INTEREST DURING CONSTRUCTION 0% -
TOTAL 269$
DHW Timer
N/N UNIT QTYMATERIAL LABOR
TOTAL
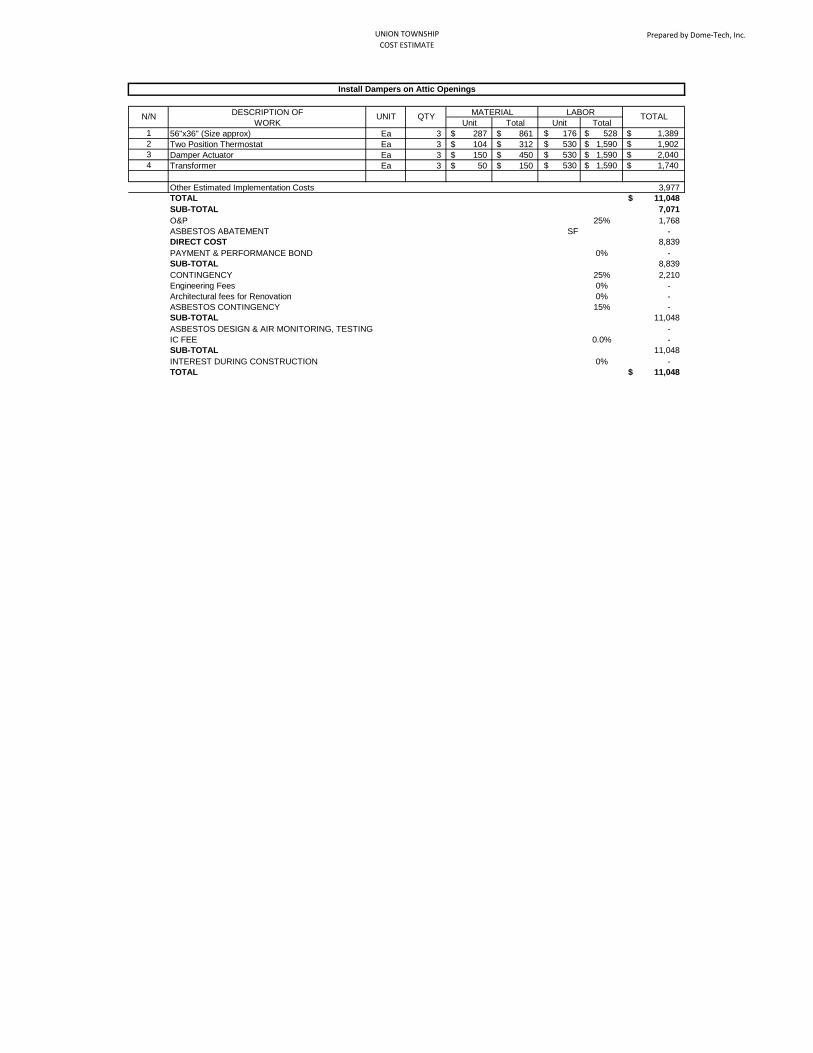
UNION TOWNSHIP
COST ESTIMATEPrepared by Dome-Tech, Inc.
DESCRIPTION OF
WORK Unit Total Unit Total
1 56"x36" (Size approx) Ea 3 287$ 861$ $ 176 $ 528 $ 1,389
2 Two Position Thermostat Ea 3 104$ 312$ $ 530 $ 1,590 $ 1,902
3 Damper Actuator Ea 3 150$ 450$ $ 530 $ 1,590 $ 2,040
4 Transformer Ea 3 50$ 150$ $ 530 $ 1,590 $ 1,740
Other Estimated Implementation Costs 3,977
TOTAL 11,048$
SUB-TOTAL 7,071
O&P 25% 1,768
ASBESTOS ABATEMENT SF -
DIRECT COST 8,839
PAYMENT & PERFORMANCE BOND 0% -
SUB-TOTAL 8,839
CONTINGENCY 25% 2,210
Engineering Fees 0% -
Architectural fees for Renovation 0% -
ASBESTOS CONTINGENCY 15% -
SUB-TOTAL 11,048
ASBESTOS DESIGN & AIR MONITORING, TESTING -
IC FEE 0.0% -
SUB-TOTAL 11,048
INTEREST DURING CONSTRUCTION 0% -
TOTAL 11,048$
Install Dampers on Attic Openings
N/N UNIT QTYMATERIAL LABOR
TOTAL
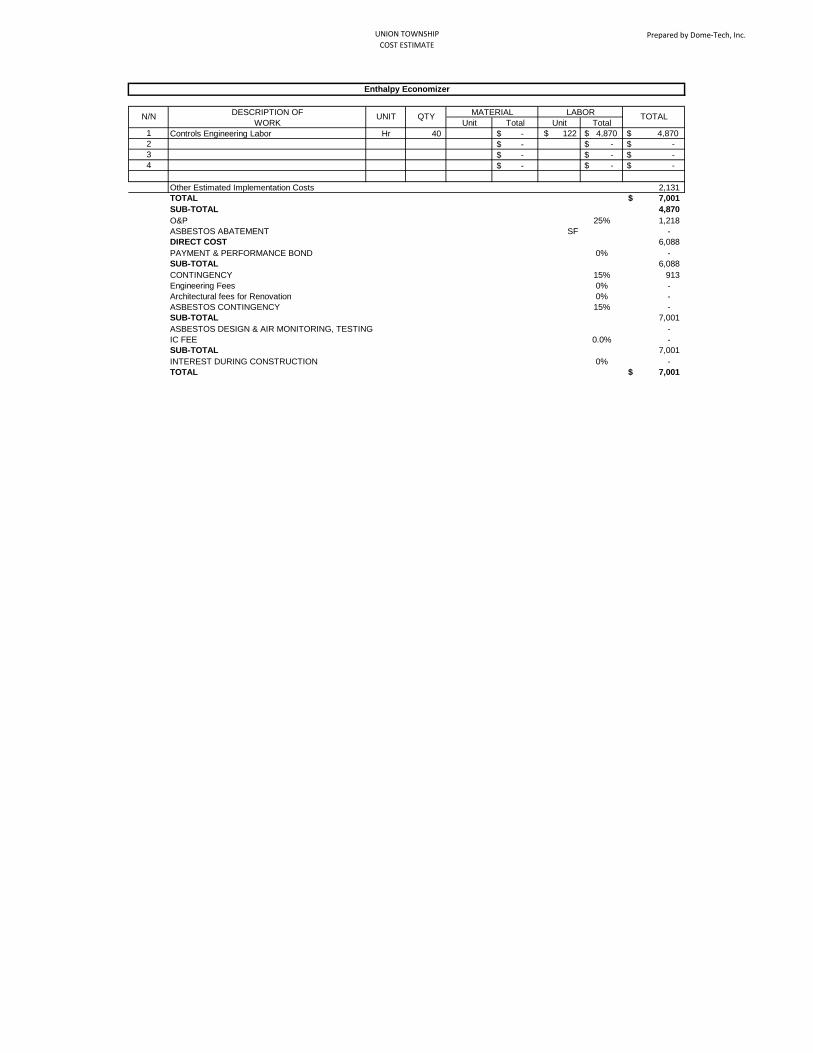
UNION TOWNSHIP
COST ESTIMATEPrepared by Dome-Tech, Inc.
DESCRIPTION OF
WORK Unit Total Unit Total
1 Controls Engineering Labor Hr 40 -$ $ 122 $ 4,870 $ 4,870
2 -$ $ - $ -
3 -$ $ - $ -
4 -$ $ - $ -
Other Estimated Implementation Costs 2,131
TOTAL 7,001$
SUB-TOTAL 4,870
O&P 25% 1,218
ASBESTOS ABATEMENT SF -
DIRECT COST 6,088
PAYMENT & PERFORMANCE BOND 0% -
SUB-TOTAL 6,088
CONTINGENCY 15% 913
Engineering Fees 0% -
Architectural fees for Renovation 0% -
ASBESTOS CONTINGENCY 15% -
SUB-TOTAL 7,001
ASBESTOS DESIGN & AIR MONITORING, TESTING -
IC FEE 0.0% -
SUB-TOTAL 7,001
INTEREST DURING CONSTRUCTION 0% -
TOTAL 7,001$
Enthalpy Economizer
N/N UNIT QTYMATERIAL LABOR
TOTAL
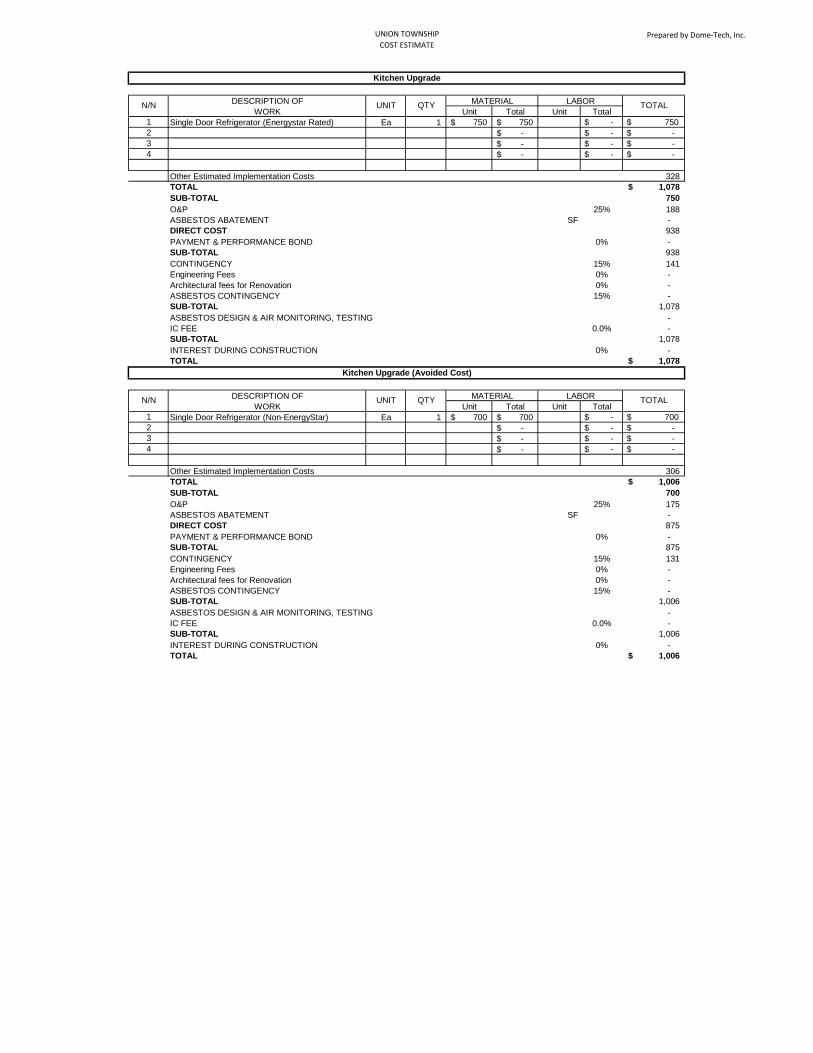
UNION TOWNSHIP
COST ESTIMATEPrepared by Dome-Tech, Inc.
DESCRIPTION OF
WORK Unit Total Unit Total
1 Single Door Refrigerator (Energystar Rated) Ea 1 750$ 750$ $ - $ 750
2 -$ $ - $ -
3 -$ $ - $ -
4 -$ $ - $ -
Other Estimated Implementation Costs 328
TOTAL 1,078$
SUB-TOTAL 750
O&P 25% 188
ASBESTOS ABATEMENT SF -
DIRECT COST 938
PAYMENT & PERFORMANCE BOND 0% -
SUB-TOTAL 938
CONTINGENCY 15% 141
Engineering Fees 0% -
Architectural fees for Renovation 0% -
ASBESTOS CONTINGENCY 15% -
SUB-TOTAL 1,078
ASBESTOS DESIGN & AIR MONITORING, TESTING -
IC FEE 0.0% -
SUB-TOTAL 1,078
INTEREST DURING CONSTRUCTION 0% -
TOTAL 1,078$
DESCRIPTION OF
WORK Unit Total Unit Total
1 Single Door Refrigerator (Non-EnergyStar) Ea 1 700$ 700$ $ - $ 700
2 -$ $ - $ -
3 -$ $ - $ -
4 -$ $ - $ -
Other Estimated Implementation Costs 306
TOTAL 1,006$
SUB-TOTAL 700
O&P 25% 175
ASBESTOS ABATEMENT SF -
DIRECT COST 875
PAYMENT & PERFORMANCE BOND 0% -
SUB-TOTAL 875
CONTINGENCY 15% 131
Engineering Fees 0% -
Architectural fees for Renovation 0% -
ASBESTOS CONTINGENCY 15% -
SUB-TOTAL 1,006
ASBESTOS DESIGN & AIR MONITORING, TESTING -
IC FEE 0.0% -
SUB-TOTAL 1,006
INTEREST DURING CONSTRUCTION 0% -
TOTAL 1,006$
Kitchen Upgrade
N/N UNIT QTYMATERIAL LABOR
TOTAL
Kitchen Upgrade (Avoided Cost)
N/N UNIT QTYMATERIAL LABOR
TOTAL

UNION TOWNSHIP
COST ESTIMATEPrepared by Dome-Tech, Inc.
DESCRIPTION OF
WORK Unit Total Unit Total
1 Vending Machine Power Management Ea 1 179$ 179$ $ - $ 179
2 -$ $ - $ -
3 -$ $ - $ -
4 -$ $ - $ -
Other Estimated Implementation Costs 37
TOTAL 216$
SUB-TOTAL 179
O&P 15% 27
ASBESTOS ABATEMENT SF -
DIRECT COST 206
PAYMENT & PERFORMANCE BOND 0% -
SUB-TOTAL 206
CONTINGENCY 5% 10
Engineering Fees 0% -
Architectural fees for Renovation 0% -
ASBESTOS CONTINGENCY 15% -
SUB-TOTAL 216
ASBESTOS DESIGN & AIR MONITORING, TESTING -
IC FEE 0.0% -
SUB-TOTAL 216
INTEREST DURING CONSTRUCTION 0% -
TOTAL 216$
Vending Maching Power Management
N/N UNIT QTYMATERIAL LABOR
TOTAL

UNION TOWNSHIP
COST ESTIMATEPrepared by Dome-Tech, Inc.
DESCRIPTION OF
WORK Unit Total Unit Total
1 Lighting Measures Ea 1 28,952$ 28,952$ $ 12,064 $ 12,064 $ 41,016
2 -$ $ - $ -
3 -$ $ - $ -
4 -$ $ - $ -
Other Estimated Implementation Costs -
TOTAL 41,016$
SUB-TOTAL 41,016
O&P 0% -
ASBESTOS ABATEMENT SF -
DIRECT COST 41,016
PAYMENT & PERFORMANCE BOND 0% -
SUB-TOTAL 41,016
CONTINGENCY 0% -
Engineering Fees 0% -
Architectural fees for Renovation 0% -
ASBESTOS CONTINGENCY 0% -
SUB-TOTAL 41,016
ASBESTOS DESIGN & AIR MONITORING, TESTING -
IC FEE 0.0% -
SUB-TOTAL 41,016
INTEREST DURING CONSTRUCTION 0% -
TOTAL 41,016$
Lighting Measures
N/N UNIT QTYMATERIAL LABOR
TOTAL
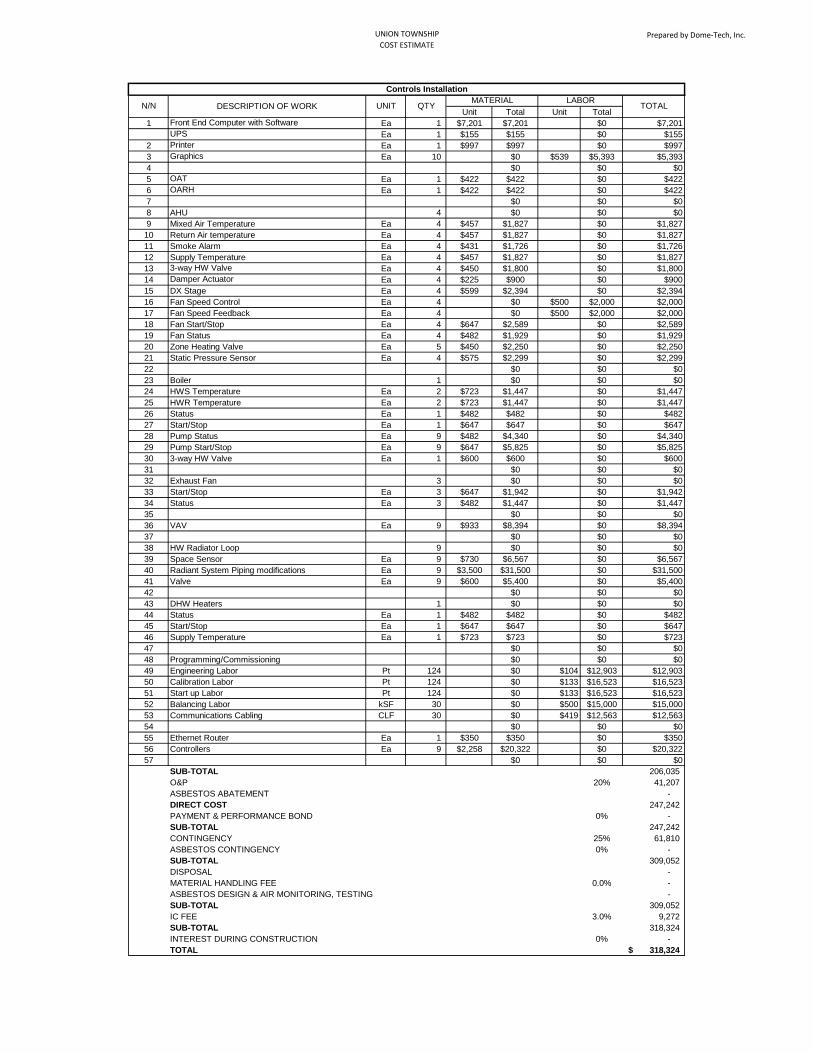
UNION TOWNSHIP
COST ESTIMATEPrepared by Dome-Tech, Inc.
Unit Total Unit Total
1 Front End Computer with Software Ea 1 $7,201 $7,201 $0 $7,201
UPS Ea 1 $155 $155 $0 $155
2 Printer Ea 1 $997 $997 $0 $997
3 Graphics Ea 10 $0 $539 $5,393 $5,393
4 $0 $0 $0
5 OAT Ea 1 $422 $422 $0 $422
6 OARH Ea 1 $422 $422 $0 $422
7 $0 $0 $0
8 AHU 4 $0 $0 $0
9 Mixed Air Temperature Ea 4 $457 $1,827 $0 $1,827
10 Return Air temperature Ea 4 $457 $1,827 $0 $1,827
11 Smoke Alarm Ea 4 $431 $1,726 $0 $1,726
12 Supply Temperature Ea 4 $457 $1,827 $0 $1,827
13 3-way HW Valve Ea 4 $450 $1,800 $0 $1,800
14 Damper Actuator Ea 4 $225 $900 $0 $900
15 DX Stage Ea 4 $599 $2,394 $0 $2,394
16 Fan Speed Control Ea 4 $0 $500 $2,000 $2,000
17 Fan Speed Feedback Ea 4 $0 $500 $2,000 $2,000
18 Fan Start/Stop Ea 4 $647 $2,589 $0 $2,589
19 Fan Status Ea 4 $482 $1,929 $0 $1,929
20 Zone Heating Valve Ea 5 $450 $2,250 $0 $2,250
21 Static Pressure Sensor Ea 4 $575 $2,299 $0 $2,299
22 $0 $0 $0
23 Boiler 1 $0 $0 $0
24 HWS Temperature Ea 2 $723 $1,447 $0 $1,447
25 HWR Temperature Ea 2 $723 $1,447 $0 $1,447
26 Status Ea 1 $482 $482 $0 $482
27 Start/Stop Ea 1 $647 $647 $0 $647
28 Pump Status Ea 9 $482 $4,340 $0 $4,340
29 Pump Start/Stop Ea 9 $647 $5,825 $0 $5,825
30 3-way HW Valve Ea 1 $600 $600 $0 $600
31 $0 $0 $0
32 Exhaust Fan 3 $0 $0 $0
33 Start/Stop Ea 3 $647 $1,942 $0 $1,942
34 Status Ea 3 $482 $1,447 $0 $1,447
35 $0 $0 $0
36 VAV Ea 9 $933 $8,394 $0 $8,394
37 $0 $0 $0
38 HW Radiator Loop 9 $0 $0 $0
39 Space Sensor Ea 9 $730 $6,567 $0 $6,567
40 Radiant System Piping modifications Ea 9 $3,500 $31,500 $0 $31,500
41 Valve Ea 9 $600 $5,400 $0 $5,400
42 $0 $0 $0
43 DHW Heaters 1 $0 $0 $0
44 Status Ea 1 $482 $482 $0 $482
45 Start/Stop Ea 1 $647 $647 $0 $647
46 Supply Temperature Ea 1 $723 $723 $0 $723
47 $0 $0 $0
48 Programming/Commissioning $0 $0 $0
49 Engineering Labor Pt 124 $0 $104 $12,903 $12,903
50 Calibration Labor Pt 124 $0 $133 $16,523 $16,523
51 Start up Labor Pt 124 $0 $133 $16,523 $16,523
52 Balancing Labor kSF 30 $0 $500 $15,000 $15,000
53 Communications Cabling CLF 30 $0 $419 $12,563 $12,563
54 $0 $0 $0
55 Ethernet Router Ea 1 $350 $350 $0 $350
56 Controllers Ea 9 $2,258 $20,322 $0 $20,322
57 $0 $0 $0
SUB-TOTAL 206,035
O&P 20% 41,207
ASBESTOS ABATEMENT -
DIRECT COST 247,242
PAYMENT & PERFORMANCE BOND 0% -
SUB-TOTAL 247,242
CONTINGENCY 25% 61,810
ASBESTOS CONTINGENCY 0% -
SUB-TOTAL 309,052
DISPOSAL -
MATERIAL HANDLING FEE 0.0% -
ASBESTOS DESIGN & AIR MONITORING, TESTING -
SUB-TOTAL 309,052
IC FEE 3.0% 9,272
SUB-TOTAL 318,324
INTEREST DURING CONSTRUCTION 0% -
TOTAL 318,324$
Controls Installation
N/N DESCRIPTION OF WORK UNIT QTYMATERIAL LABOR
TOTAL
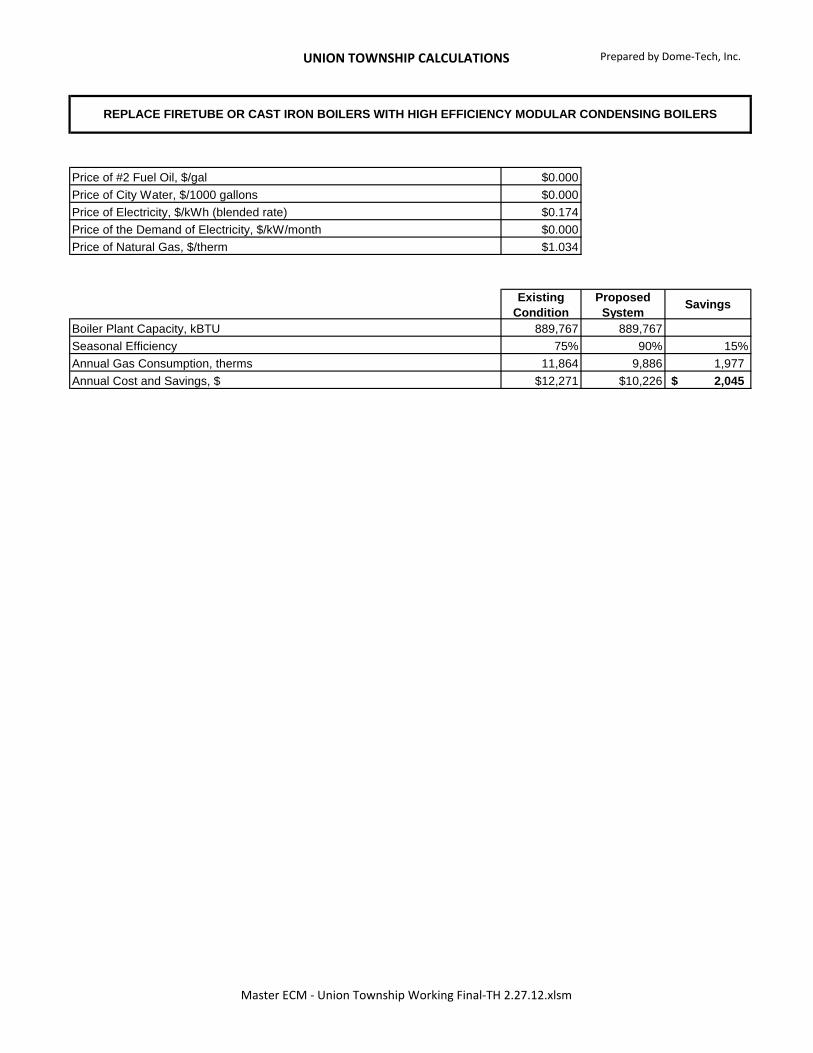
UNION TOWNSHIP CALCULATIONS Prepared by Dome-Tech, Inc.
$0.000
$0.000
$0.174
$0.000
$1.034
Existing
Condition
Proposed
SystemSavings
889,767 889,767
75% 90% 15%
11,864 9,886 1,977
$12,271 $10,226 2,045$
REPLACE FIRETUBE OR CAST IRON BOILERS WITH HIGH EFFICIENCY MODULAR CONDENSING BOILERS
Price of the Demand of Electricity, $/kW/month
Price of Natural Gas, $/therm
Boiler Plant Capacity, kBTU
Seasonal Efficiency
Annual Gas Consumption, therms
Annual Cost and Savings, $
Price of #2 Fuel Oil, $/gal
Price of City Water, $/1000 gallons
Price of Electricity, $/kWh (blended rate)
Master ECM - Union Township Working Final-TH 2.27.12.xlsm
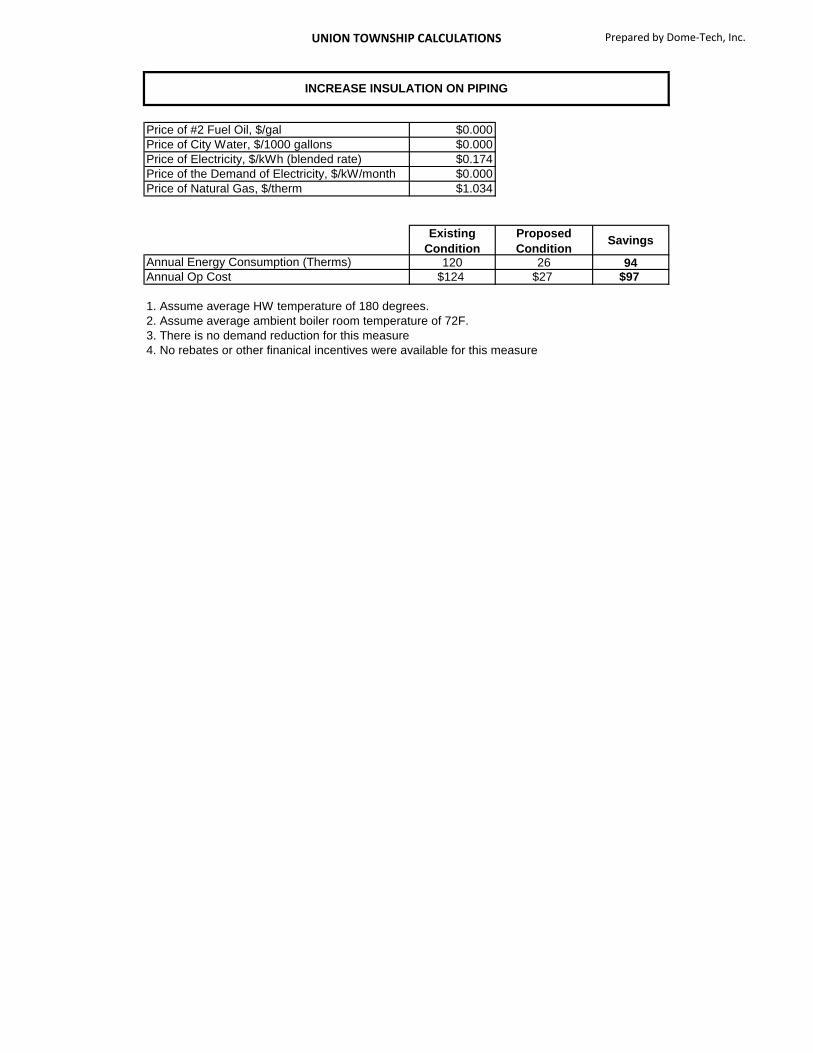
UNION TOWNSHIP CALCULATIONS Prepared by Dome-Tech, Inc.
$0.000
$0.000
$0.174
$0.000
$1.034
Existing
Condition
Proposed
ConditionSavings
Annual Energy Consumption (Therms) 120 26 94Annual Op Cost $124 $27 $97
1. Assume average HW temperature of 180 degrees.
2. Assume average ambient boiler room temperature of 72F.
3. There is no demand reduction for this measure
4. No rebates or other finanical incentives were available for this measure
INCREASE INSULATION ON PIPING
Price of #2 Fuel Oil, $/gal
Price of City Water, $/1000 gallons
Price of Electricity, $/kWh (blended rate)
Price of the Demand of Electricity, $/kW/month
Price of Natural Gas, $/therm
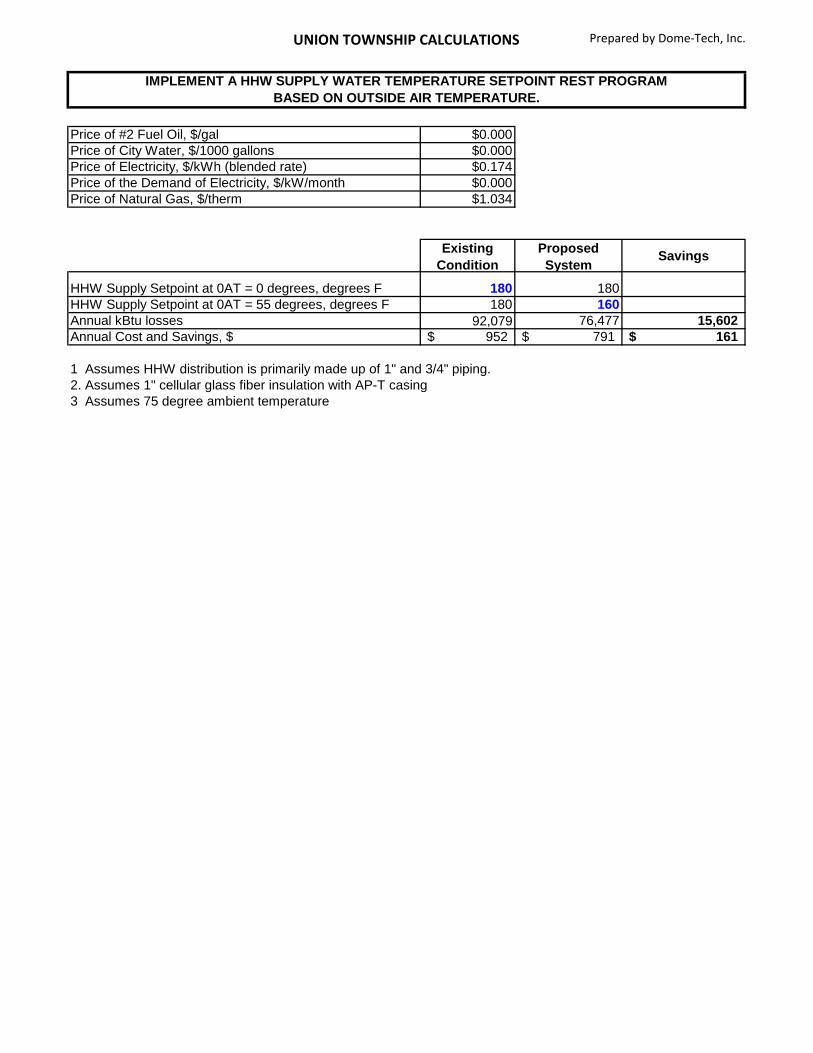
UNION TOWNSHIP CALCULATIONS Prepared by Dome-Tech, Inc.
$0.000
$0.000
$0.174
$0.000
$1.034
Existing
Condition
Proposed
SystemSavings
HHW Supply Setpoint at 0AT = 0 degrees, degrees F 180 180
HHW Supply Setpoint at 0AT = 55 degrees, degrees F 180 160
Annual kBtu losses 92,079 76,477 15,602
Annual Cost and Savings, $ 952$ 791$ 161$
1 Assumes HHW distribution is primarily made up of 1" and 3/4" piping.
2. Assumes 1" cellular glass fiber insulation with AP-T casing
3 Assumes 75 degree ambient temperature
Price of #2 Fuel Oil, $/gal
Price of City Water, $/1000 gallons
Price of Electricity, $/kWh (blended rate)
Price of the Demand of Electricity, $/kW/month
Price of Natural Gas, $/therm
IMPLEMENT A HHW SUPPLY WATER TEMPERATURE SETPOINT REST PROGRAM
BASED ON OUTSIDE AIR TEMPERATURE.
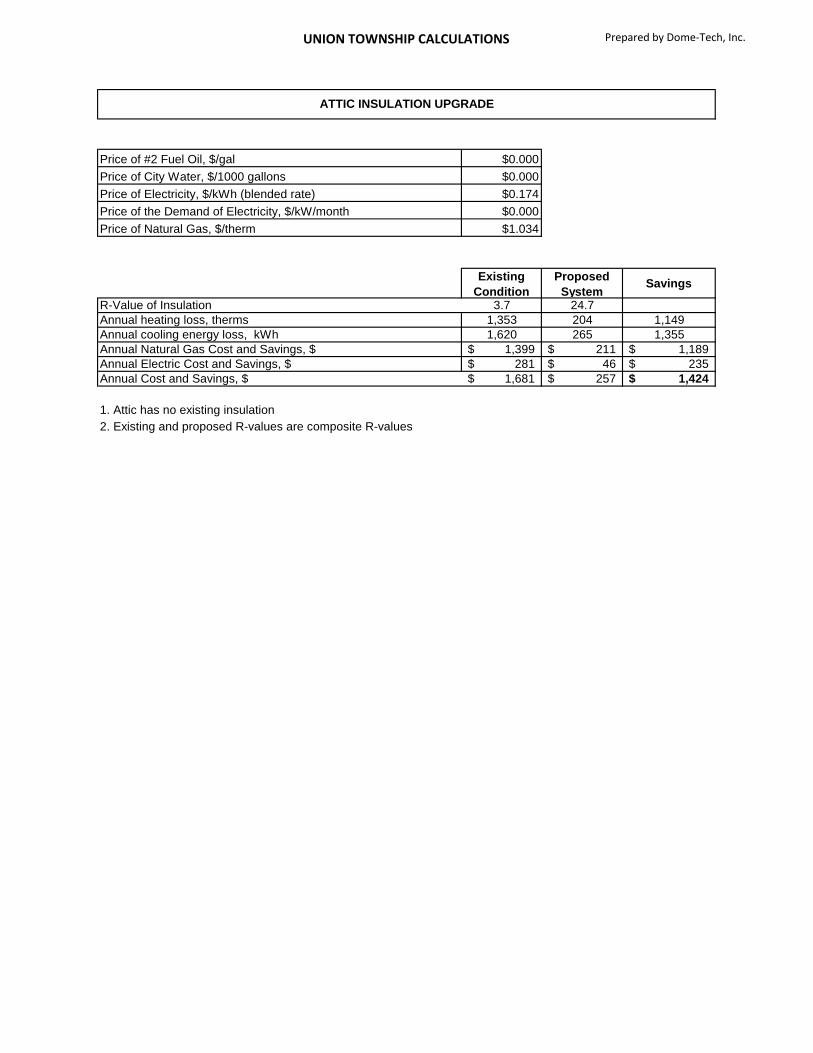
UNION TOWNSHIP CALCULATIONS Prepared by Dome-Tech, Inc.
$0.000
$0.000
$0.174
$0.000
$1.034
Existing
Condition
Proposed
SystemSavings
R-Value of Insulation 3.7 24.7
Annual heating loss, therms 1,353 204 1,149
Annual cooling energy loss, kWh 1,620 265 1,355
Annual Natural Gas Cost and Savings, $ 1,399$ 211$ 1,189$
Annual Electric Cost and Savings, $ 281$ 46$ 235$
Annual Cost and Savings, $ 1,681$ 257$ 1,424$
1. Attic has no existing insulation
2. Existing and proposed R-values are composite R-values
ATTIC INSULATION UPGRADE
Price of #2 Fuel Oil, $/gal
Price of City Water, $/1000 gallons
Price of Electricity, $/kWh (blended rate)
Price of the Demand of Electricity, $/kW/month
Price of Natural Gas, $/therm
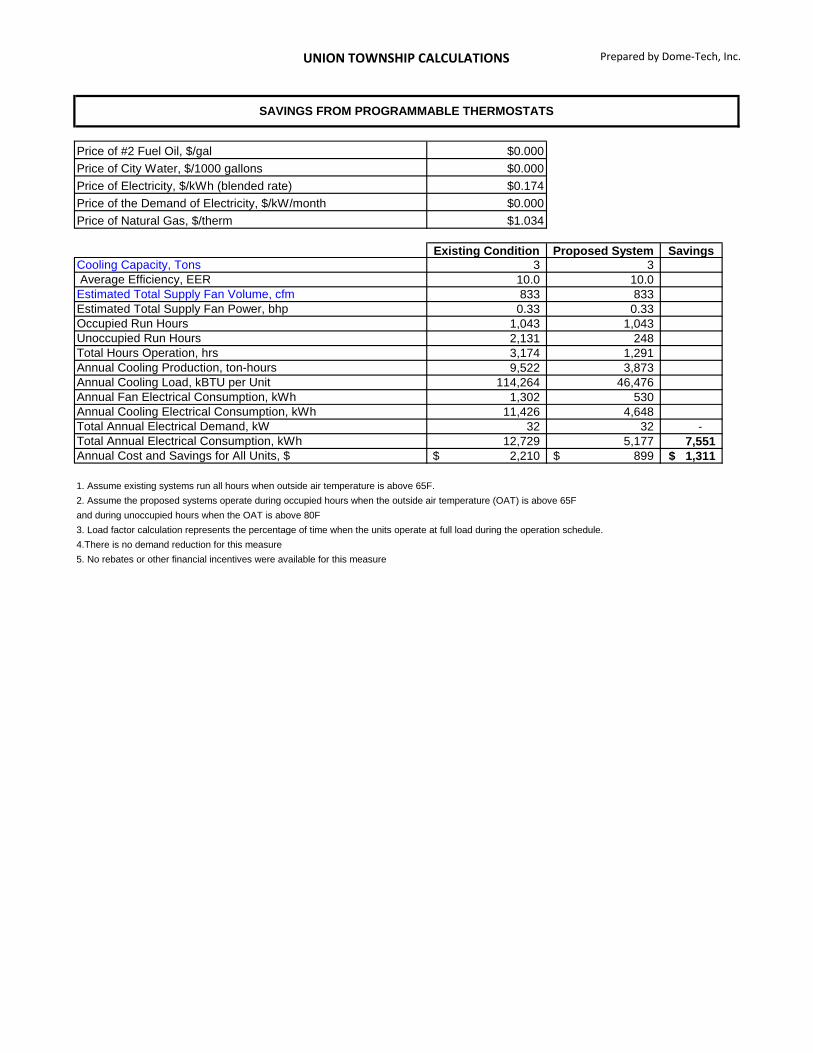
UNION TOWNSHIP CALCULATIONS Prepared by Dome-Tech, Inc.
$0.000
$0.000
$0.174
$0.000
$1.034
Existing Condition Proposed System Savings Cooling Capacity, Tons 3 3
Average Efficiency, EER 10.0 10.0
Estimated Total Supply Fan Volume, cfm 833 833
Estimated Total Supply Fan Power, bhp 0.33 0.33
Occupied Run Hours 1,043 1,043
Unoccupied Run Hours 2,131 248
Total Hours Operation, hrs 3,174 1,291
Annual Cooling Production, ton-hours 9,522 3,873
Annual Cooling Load, kBTU per Unit 114,264 46,476
Annual Fan Electrical Consumption, kWh 1,302 530
Annual Cooling Electrical Consumption, kWh 11,426 4,648
Total Annual Electrical Demand, kW 32 32 -
Total Annual Electrical Consumption, kWh 12,729 5,177 7,551
Annual Cost and Savings for All Units, $ 2,210$ 899$ 1,311$
1. Assume existing systems run all hours when outside air temperature is above 65F.
2. Assume the proposed systems operate during occupied hours when the outside air temperature (OAT) is above 65F
and during unoccupied hours when the OAT is above 80F
3. Load factor calculation represents the percentage of time when the units operate at full load during the operation schedule.
SAVINGS FROM PROGRAMMABLE THERMOSTATS
Price of #2 Fuel Oil, $/gal
Price of City Water, $/1000 gallons
Price of Electricity, $/kWh (blended rate)
Price of the Demand of Electricity, $/kW/month
Price of Natural Gas, $/therm
4.There is no demand reduction for this measure
5. No rebates or other financial incentives were available for this measure
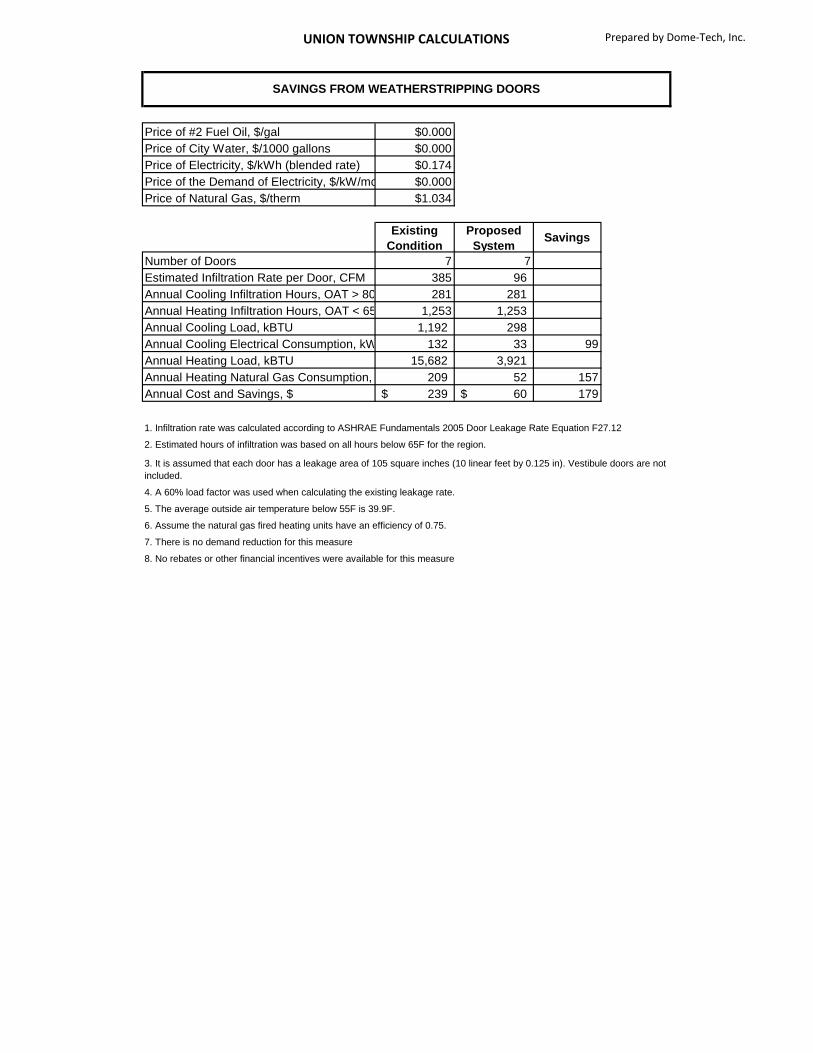
UNION TOWNSHIP CALCULATIONS Prepared by Dome-Tech, Inc.
$0.000
$0.000
$0.174
$0.000
$1.034
Existing
Condition
Proposed
System Savings
Number of Doors 7 7
Estimated Infiltration Rate per Door, CFM 385 96
Annual Cooling Infiltration Hours, OAT > 80F 281 281
Annual Heating Infiltration Hours, OAT < 65F 1,253 1,253
Annual Cooling Load, kBTU 1,192 298
Annual Cooling Electrical Consumption, kWh 132 33 99
Annual Heating Load, kBTU 15,682 3,921
Annual Heating Natural Gas Consumption, Therms 209 52 157
Annual Cost and Savings, $ 239$ 60$ 179
1. Infiltration rate was calculated according to ASHRAE Fundamentals 2005 Door Leakage Rate Equation F27.12
2. Estimated hours of infiltration was based on all hours below 65F for the region.
4. A 60% load factor was used when calculating the existing leakage rate.
5. The average outside air temperature below 55F is 39.9F.
6. Assume the natural gas fired heating units have an efficiency of 0.75.
SAVINGS FROM WEATHERSTRIPPING DOORS
7. There is no demand reduction for this measure
8. No rebates or other financial incentives were available for this measure
Price of #2 Fuel Oil, $/gal
Price of City Water, $/1000 gallons
Price of Electricity, $/kWh (blended rate)
Price of the Demand of Electricity, $/kW/month
Price of Natural Gas, $/therm
3. It is assumed that each door has a leakage area of 105 square inches (10 linear feet by 0.125 in). Vestibule doors are not
included.
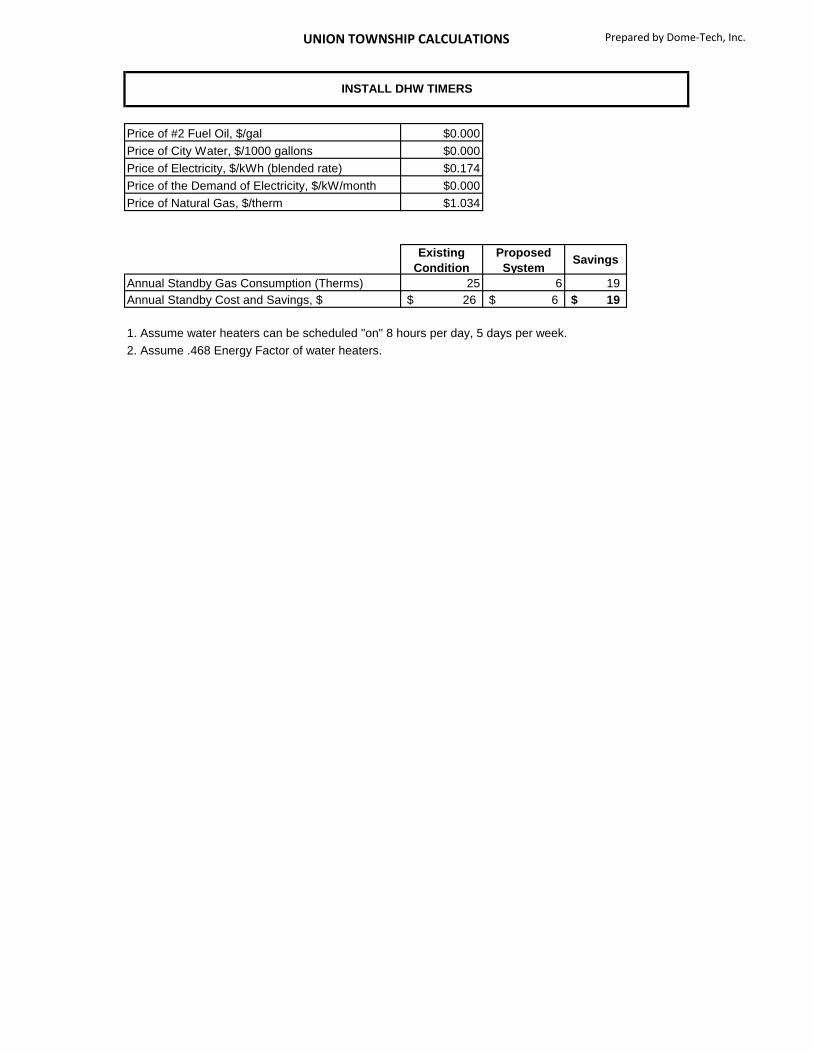
UNION TOWNSHIP CALCULATIONS Prepared by Dome-Tech, Inc.
$0.000
$0.000
$0.174
$0.000
$1.034
Existing
Condition
Proposed
SystemSavings
Annual Standby Gas Consumption (Therms) 25 6 19
Annual Standby Cost and Savings, $ 26$ 6$ 19$
1. Assume water heaters can be scheduled "on" 8 hours per day, 5 days per week.
2. Assume .468 Energy Factor of water heaters.
INSTALL DHW TIMERS
Price of #2 Fuel Oil, $/gal
Price of City Water, $/1000 gallons
Price of Electricity, $/kWh (blended rate)
Price of the Demand of Electricity, $/kW/month
Price of Natural Gas, $/therm
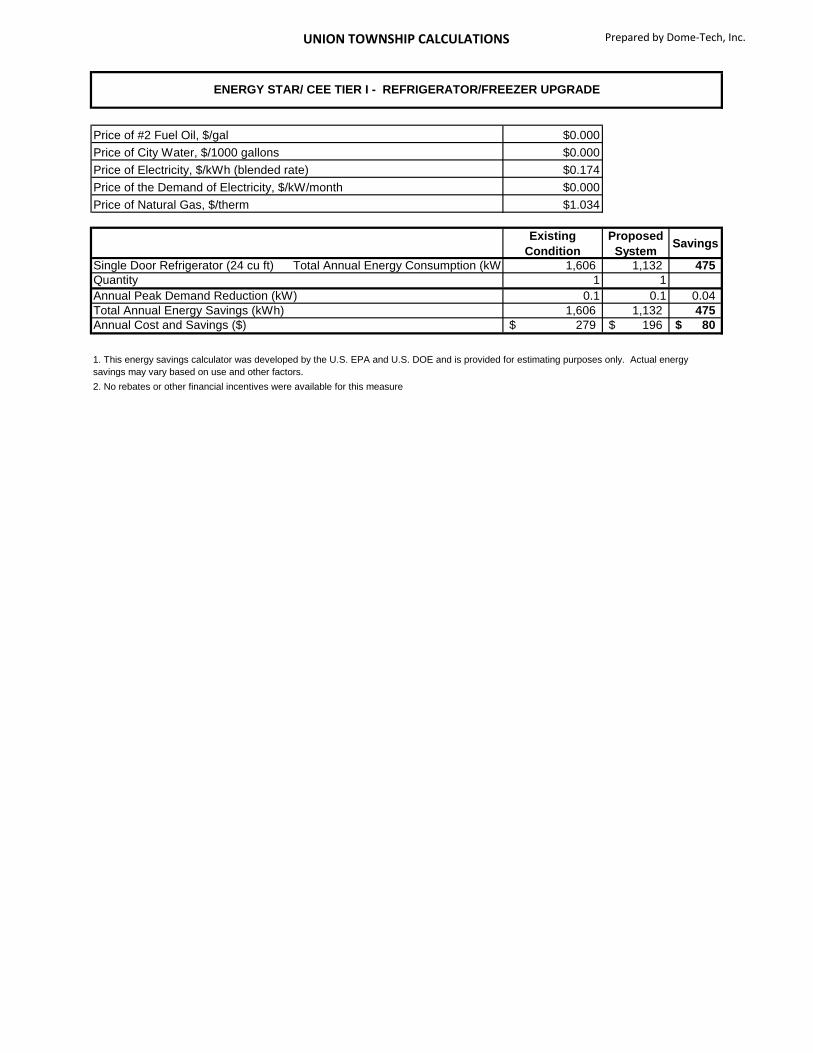
UNION TOWNSHIP CALCULATIONS Prepared by Dome-Tech, Inc.
$0.000
$0.000
$0.174
$0.000
$1.034
Existing
Condition
Proposed
SystemSavings
Single Door Refrigerator (24 cu ft) Total Annual Energy Consumption (kWh) 1,606 1,132 475
1 1
0.1 0.1 0.04
1,606 1,132 475
279$ 196$ 80$
2. No rebates or other financial incentives were available for this measure
Price of City Water, $/1000 gallons
Price of Electricity, $/kWh (blended rate)
Price of the Demand of Electricity, $/kW/month
Price of Natural Gas, $/therm
1. This energy savings calculator was developed by the U.S. EPA and U.S. DOE and is provided for estimating purposes only. Actual energy
savings may vary based on use and other factors.
ENERGY STAR/ CEE TIER I - REFRIGERATOR/FREEZER UPGRADE
Quantity
Annual Peak Demand Reduction (kW)
Total Annual Energy Savings (kWh)
Annual Cost and Savings ($)
Price of #2 Fuel Oil, $/gal
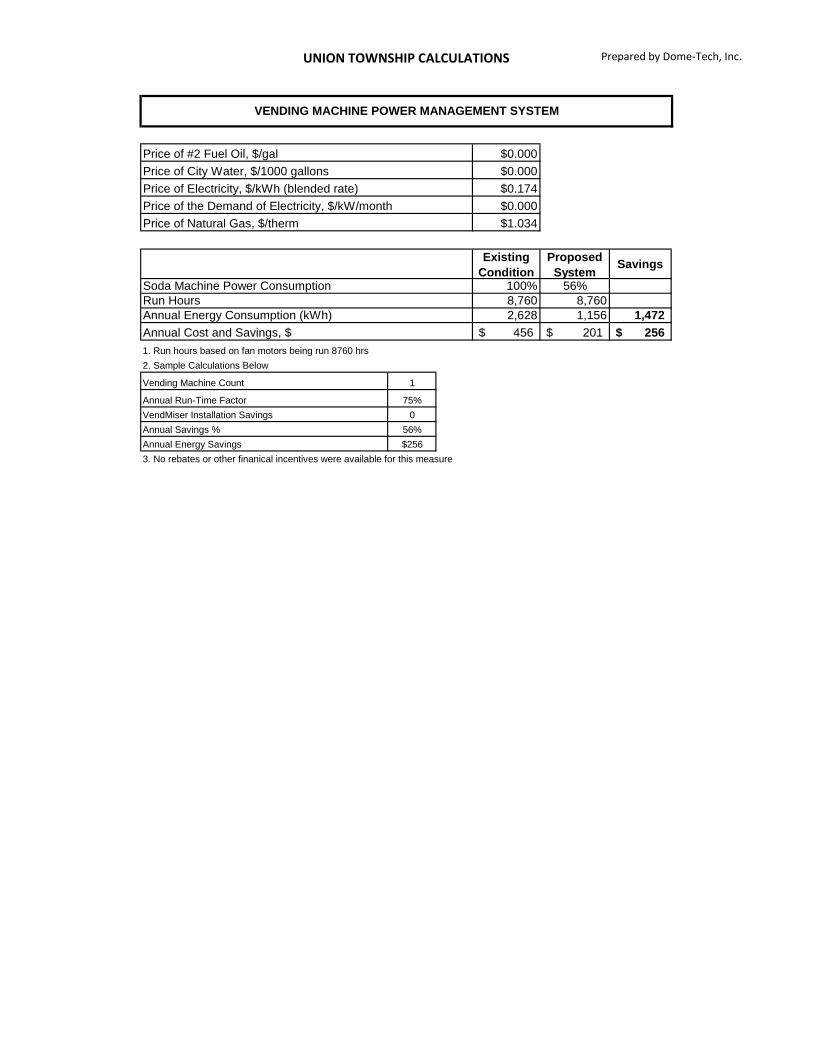
UNION TOWNSHIP CALCULATIONS Prepared by Dome-Tech, Inc.
$0.000
$0.000
$0.174
$0.000
$1.034
Existing
Condition
Proposed
SystemSavings
Soda Machine Power Consumption 100% 56%
Run Hours 8,760 8,760
Annual Energy Consumption (kWh) 2,628 1,156 1,472
Annual Cost and Savings, $ 456$ 201$ 256$
1. Run hours based on fan motors being run 8760 hrs
Vending Machine Count 1
Annual Run-Time Factor 75%
VendMiser Installation Savings 0
Annual Savings % 56%
Annual Energy Savings $256
2. Sample Calculations Below
3. No rebates or other finanical incentives were available for this measure
Price of #2 Fuel Oil, $/gal
Price of City Water, $/1000 gallons
Price of Electricity, $/kWh (blended rate)
Price of the Demand of Electricity, $/kW/month
Price of Natural Gas, $/therm
VENDING MACHINE POWER MANAGEMENT SYSTEM
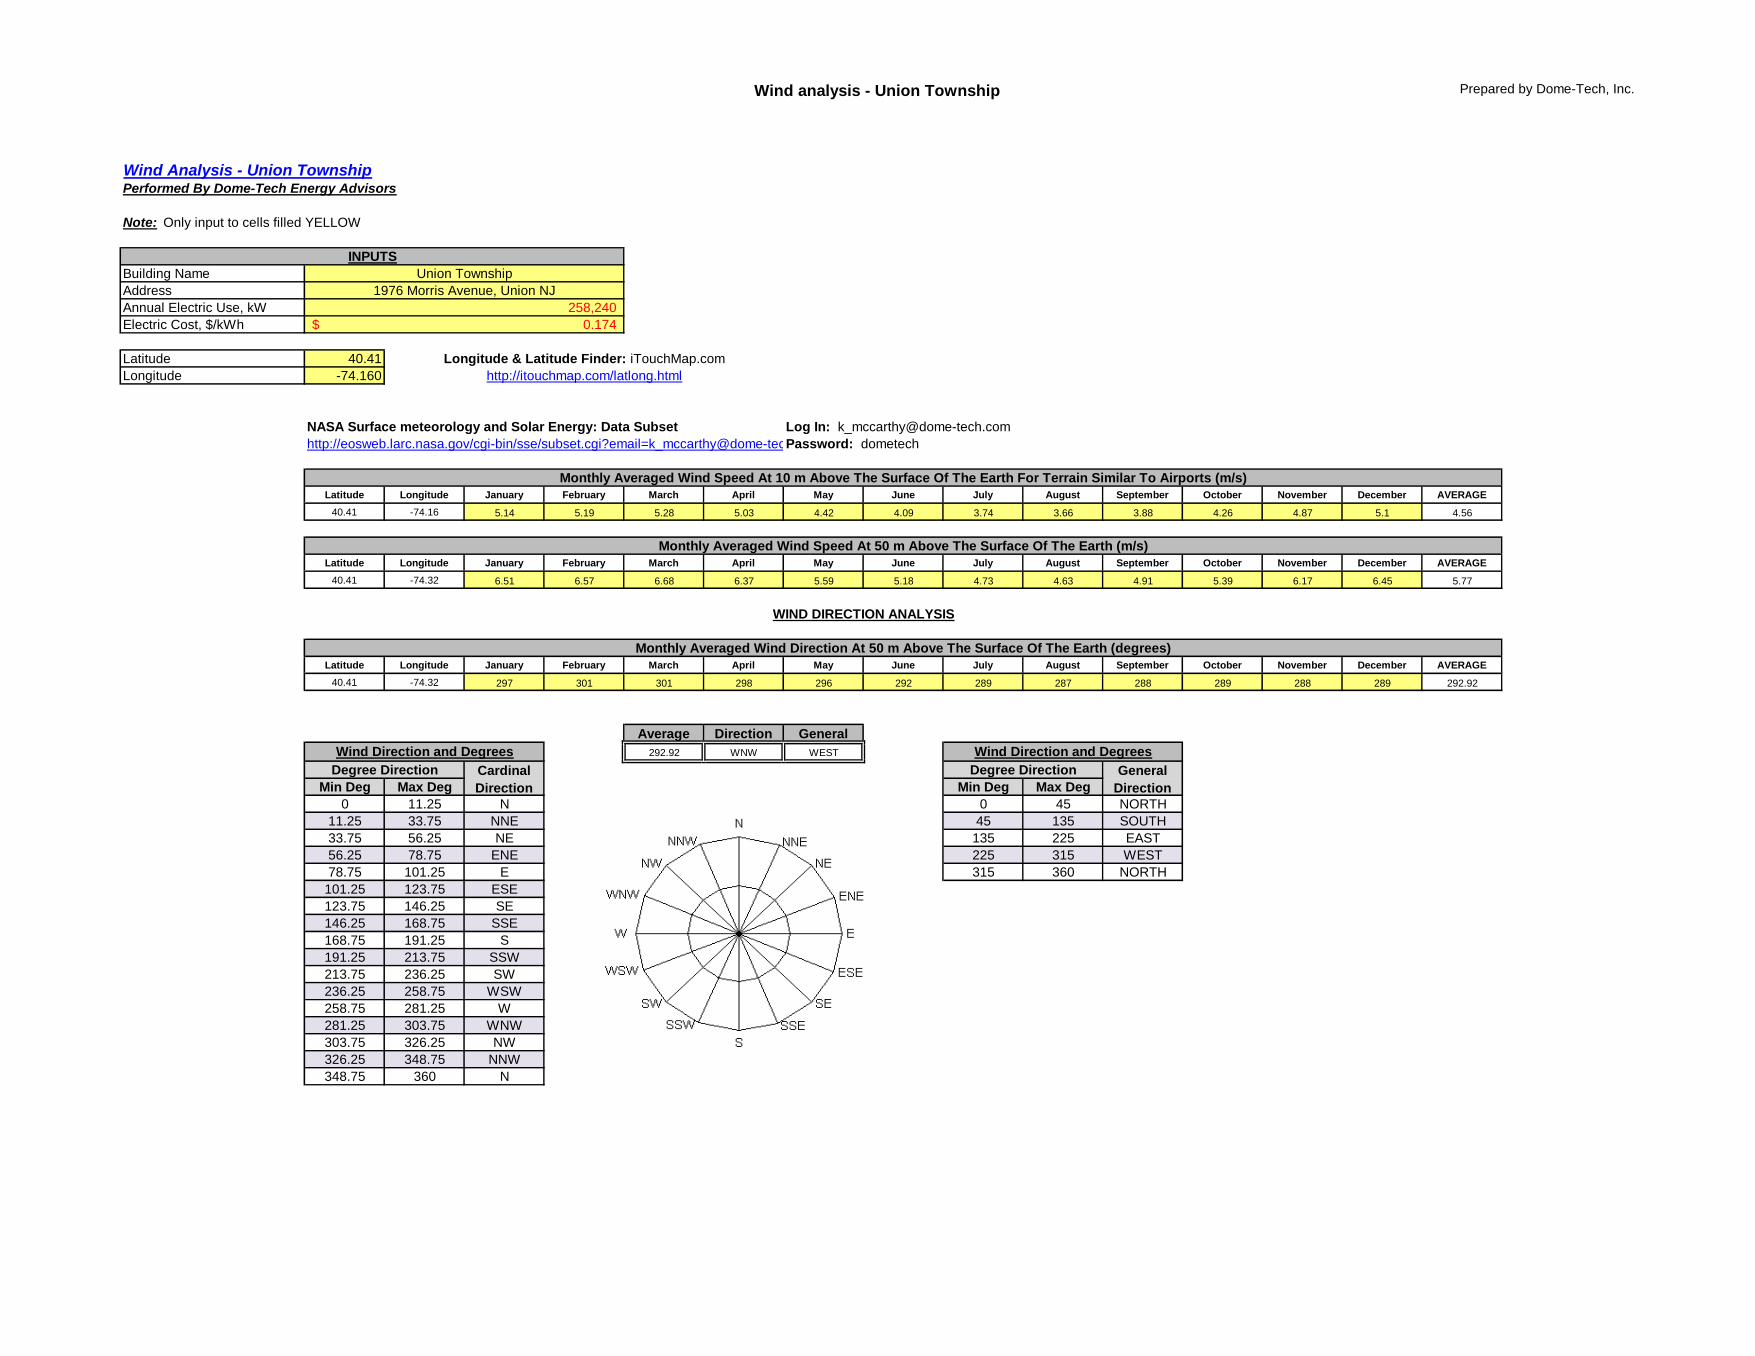
Wind analysis - Union Township Prepared by Dome-Tech, Inc.
Building Name
Address
Annual Electric Use, kW
Electric Cost, $/kWh
Latitude 40.41
Longitude -74.160
Latitude Longitude January February March April May June July August September October November December AVERAGE
40.41 -74.16 5.14 5.19 5.28 5.03 4.42 4.09 3.74 3.66 3.88 4.26 4.87 5.1 4.56
Latitude Longitude January February March April May June July August September October November December AVERAGE
40.41 -74.32 6.51 6.57 6.68 6.37 5.59 5.18 4.73 4.63 4.91 5.39 6.17 6.45 5.77
Latitude Longitude January February March April May June July August September October November December AVERAGE
40.41 -74.32 297 301 301 298 296 292 289 287 288 289 288 289 292.92
Average Direction General
292.92 WNW WEST
Min Deg Max Deg Min Deg Max Deg
0 11.25 N 0 45 NORTH
11.25 33.75 NNE 45 135 SOUTH
33.75 56.25 NE 135 225 EAST
56.25 78.75 ENE 225 315 WEST
78.75 101.25 E 315 360 NORTH
101.25 123.75 ESE
123.75 146.25 SE
146.25 168.75 SSE
168.75 191.25 S
191.25 213.75 SSW
213.75 236.25 SW
236.25 258.75 WSW
258.75 281.25 W
281.25 303.75 WNW
303.75 326.25 NW
326.25 348.75 NNW
348.75 360 N
Wind Analysis - Union TownshipPerformed By Dome-Tech Energy Advisors
Monthly Averaged Wind Speed At 10 m Above The Surface Of The Earth For Terrain Similar To Airports (m/s)
Monthly Averaged Wind Speed At 50 m Above The Surface Of The Earth (m/s)
NASA Surface meteorology and Solar Energy: Data Subset
http://eosweb.larc.nasa.gov/cgi-bin/sse/[email protected]
Log In: [email protected]
Password: dometech
http://itouchmap.com/latlong.html
Union Township
INPUTS
258,240
0.174$
Monthly Averaged Wind Direction At 50 m Above The Surface Of The Earth (degrees)
Note: Only input to cells filled YELLOW
WIND DIRECTION ANALYSIS
Wind Direction and Degrees
Degree Direction General
Direction
1976 Morris Avenue, Union NJ
Degree Direction Cardinal
Direction
Wind Direction and Degrees
Longitude & Latitude Finder: iTouchMap.com
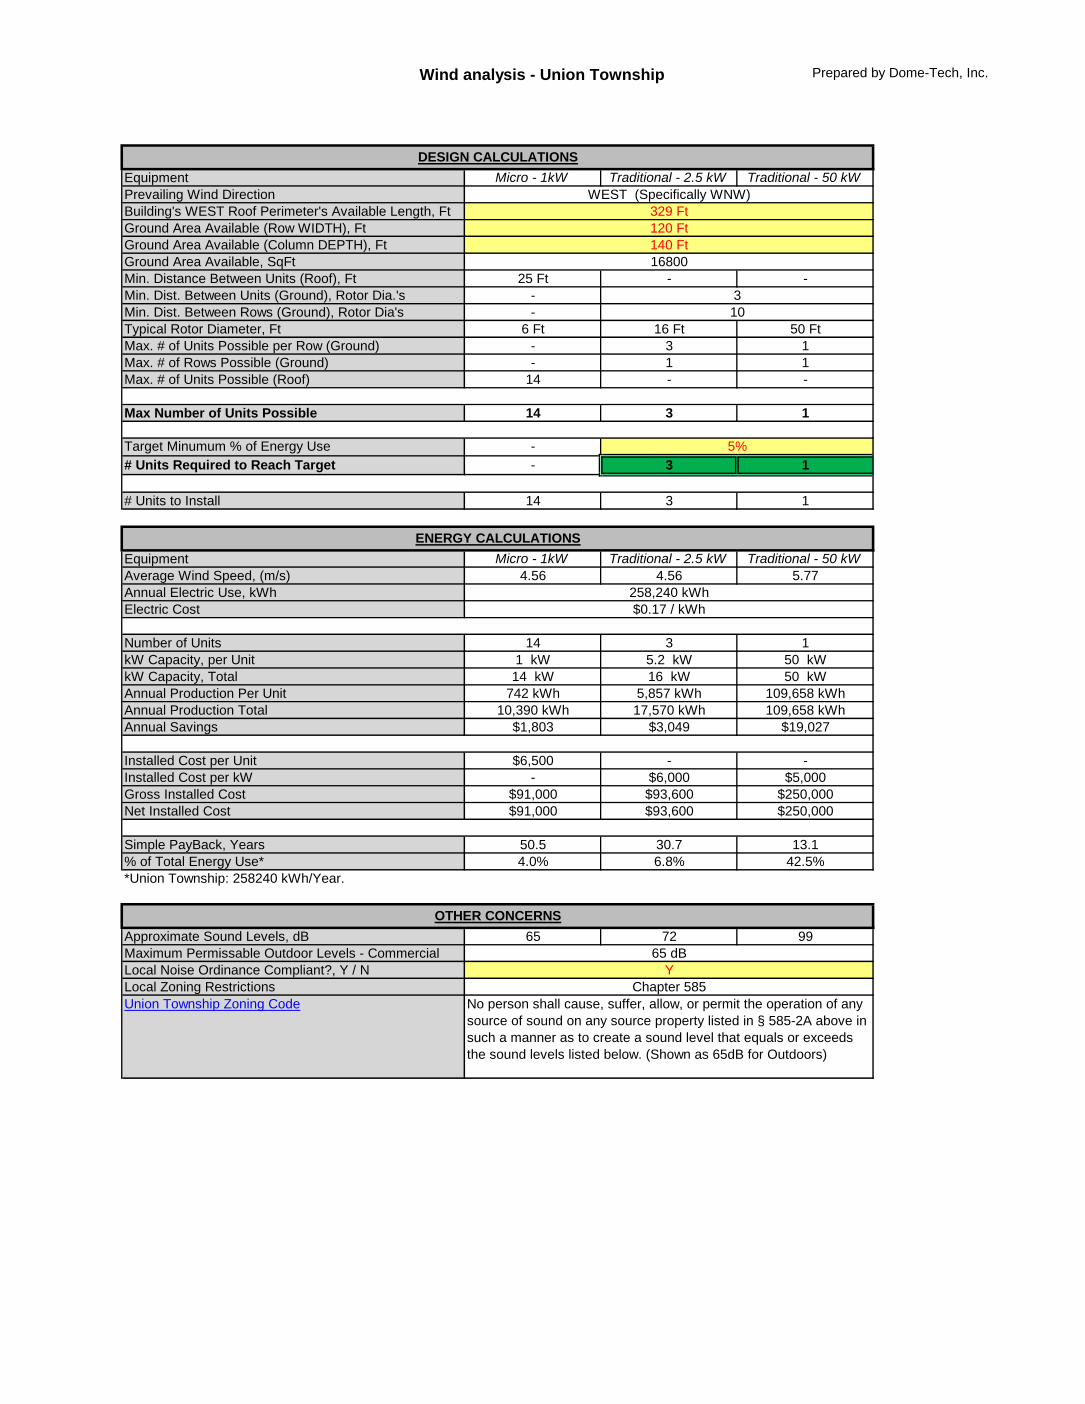
Wind analysis - Union Township Prepared by Dome-Tech, Inc.
Equipment Micro - 1kW Traditional - 2.5 kW Traditional - 50 kW
Prevailing Wind Direction
Building's WEST Roof Perimeter's Available Length, Ft
Ground Area Available (Row WIDTH), Ft
Ground Area Available (Column DEPTH), Ft
Ground Area Available, SqFt
Min. Distance Between Units (Roof), Ft 25 Ft - -
Min. Dist. Between Units (Ground), Rotor Dia.'s -
Min. Dist. Between Rows (Ground), Rotor Dia's -
Typical Rotor Diameter, Ft 6 Ft 16 Ft 50 Ft
Max. # of Units Possible per Row (Ground) - 3 1
Max. # of Rows Possible (Ground) - 1 1
Max. # of Units Possible (Roof) 14 - -
Max Number of Units Possible 14 3 1
Target Minumum % of Energy Use -
# Units Required to Reach Target - 3 1
# Units to Install 14 3 1
Equipment Micro - 1kW Traditional - 2.5 kW Traditional - 50 kW
Average Wind Speed, (m/s) 4.56 4.56 5.77
Annual Electric Use, kWh
Electric Cost
Number of Units 14 3 1
kW Capacity, per Unit 1 kW 5.2 kW 50 kW
kW Capacity, Total 14 kW 16 kW 50 kW
Annual Production Per Unit 742 kWh 5,857 kWh 109,658 kWh
Annual Production Total 10,390 kWh 17,570 kWh 109,658 kWh
Annual Savings $1,803 $3,049 $19,027
Installed Cost per Unit $6,500 - -
Installed Cost per kW - $6,000 $5,000
Gross Installed Cost $91,000 $93,600 $250,000
Net Installed Cost $91,000 $93,600 $250,000
Simple PayBack, Years 50.5 30.7 13.1
% of Total Energy Use* 4.0% 6.8% 42.5%
*Union Township: 258240 kWh/Year.
Approximate Sound Levels, dB 65 72 99
Maximum Permissable Outdoor Levels - Commercial
Local Noise Ordinance Compliant?, Y / N
Local Zoning Restrictions
Union Township Zoning Code
65 dB
No person shall cause, suffer, allow, or permit the operation of any
source of sound on any source property listed in § 585-2A above in
such a manner as to create a sound level that equals or exceeds
the sound levels listed below. (Shown as 65dB for Outdoors)
OTHER CONCERNS
Y
Chapter 585
ENERGY CALCULATIONS
258,240 kWh
$0.17 / kWh
DESIGN CALCULATIONS
16800
3
10
5%
WEST (Specifically WNW)
329 Ft
120 Ft
140 Ft
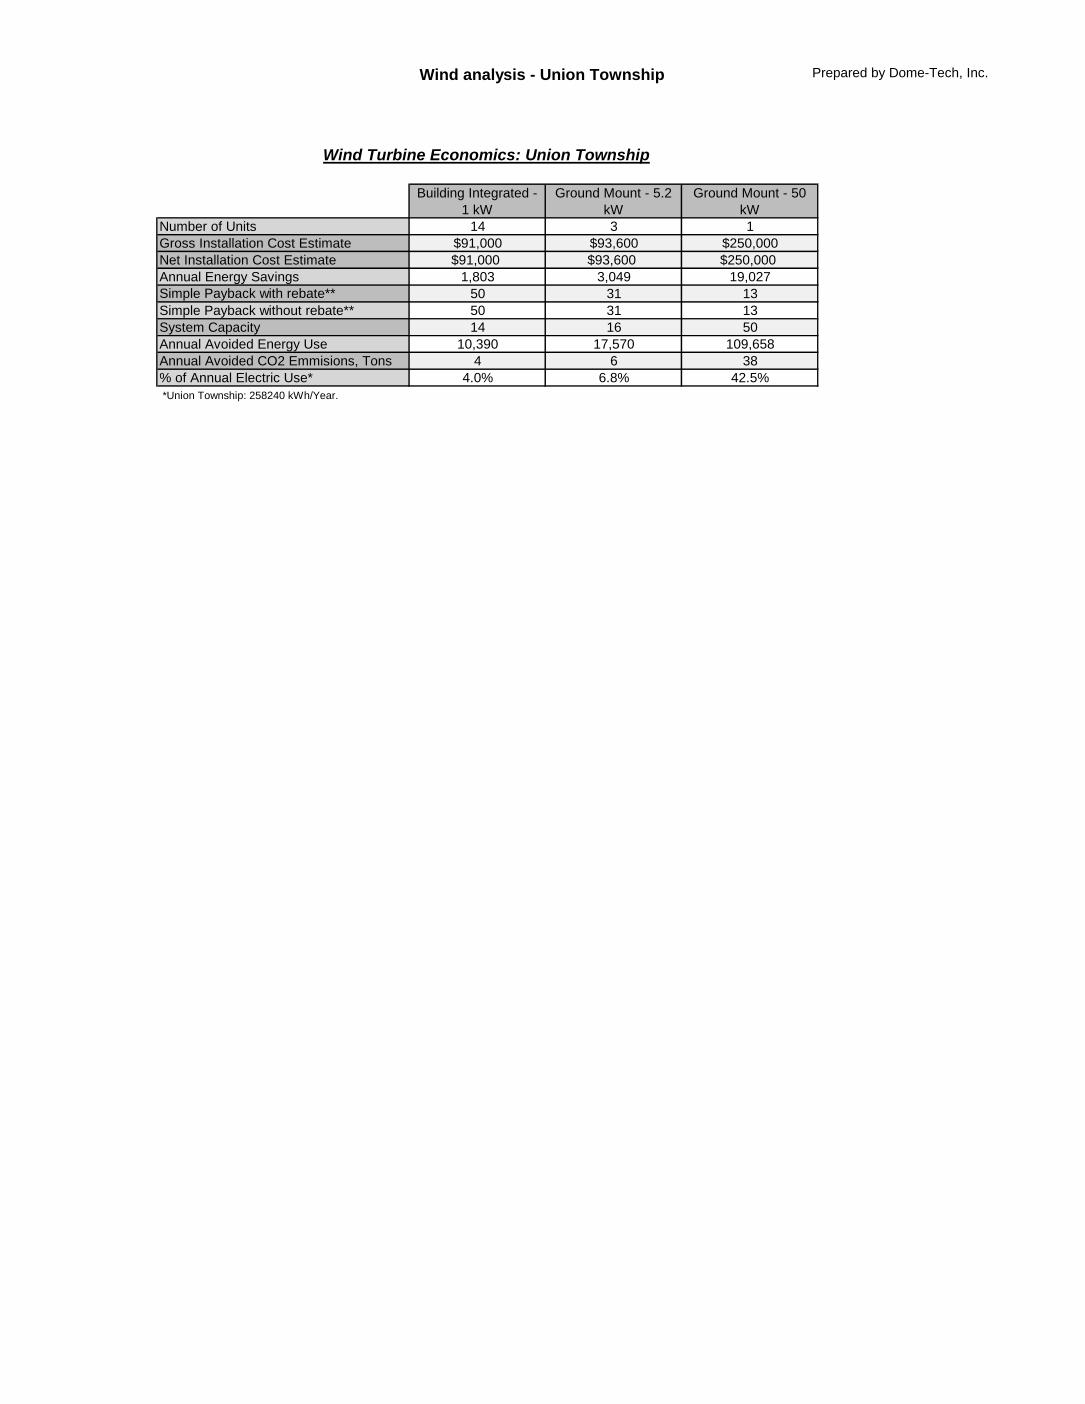
Wind analysis - Union Township Prepared by Dome-Tech, Inc.
Building Integrated -
1 kW
Ground Mount - 5.2
kW
Ground Mount - 50
kW
Number of Units 14 3 1
Gross Installation Cost Estimate $91,000 $93,600 $250,000
Net Installation Cost Estimate $91,000 $93,600 $250,000
Annual Energy Savings 1,803 3,049 19,027
Simple Payback with rebate** 50 31 13
Simple Payback without rebate** 50 31 13
System Capacity 14 16 50
Annual Avoided Energy Use 10,390 17,570 109,658
Annual Avoided CO2 Emmisions, Tons 4 6 38
% of Annual Electric Use* 4.0% 6.8% 42.5%
*Union Township: 258240 kWh/Year.
Wind Turbine Economics: Union Township