Embed Size (px)
Citation preview
American Journal of Electrical Power and Energy Systems 2020; 9(1): 1-13
http://www.sciencepublishinggroup.com/j/epes
doi: 10.11648/j.epes.20200901.11
ISSN: 2326-912X (Print); ISSN: 2326-9200 (Online)
Energy Audit and Management of a Tannery Company: A Case Study of Kano State
Jamilu Ya’u Muhammad1, *
, Sirajo Alhassan1, Ibrahim Sule Ahmad Abdulmajeed
2,
Nuhu Hassan Waziri3, Najib Aminu Ismail
4, Faru Faruk Tukur
4
1Department of Mechanical Engineering, Bayero University, Kano, Nigeria 2Department of Mechanical Engineering, Federal Airports Authority of Nigeria, Abuja, Nigeria 3Department of Mechanical Engineering, Modibbo Adama University of Technology, Yola, Nigeria 4Department of Mechanical Engineering, Ahmadu Bello University, Zaria, Nigeria
Email address:
*Corresponding author
To cite this article: Jamilu Ya’u Muhammad, Sirajo Alhassan, Ibrahim Sule Ahmad Abdulmajeed, Nuhu Hassan Waziri, Najib Aminu Ismail, Faru Faruk Tukur.
Energy Audit and Management of a Tannery Company: A Case Study of Kano State. American Journal of Electrical Power and Energy
Systems. Vol. 9, No. 1, 2020, pp. 1-13. doi: 10.11648/j.epes.20200901.11
Received: November 16, 2019; Accepted: February 26, 2020; Published: March 23, 2020
Abstract: Energy audit is considered as one of the comprehensive methods in checking the energy usage and wastage in
facilities/buildings. This paper presents the results of the energy audit conducted to investigate the energy consumption pattern
of tannery company from its record of fuel expenditure and electricity bills for a period of 5 years (2012 - 2016). Also, the use
of energy models system, Energy Quick Energy Simulation Tool (eQUEST) to evaluate the consumption of the energy end
users and performance of the company. Results shows peak electricity demand during the hot months from April to August due
to high cooling or significant Air condition requirement. 2.37% of electricity consumed was contributed by the burning of
AGO in the diesel power generators showing very less contribution over that of National grid 97.63%. The annual average
consumption demand of electricity and diesel (kWh equivalent) of the company were 118960.72 kWh and 2881.17 kWh
respectively. The energy modeling and simulation results shows that the sum total of the total monthly energy consumption by
the end users is 138164 kWh representing the total average value of the annual energy use in air-conditioning (space cooling)
was 27%, ventilation fan 2%, factory machineries 39%, heat rejection is 4%, pump and auxiliary is 2% and area lighting 26%.
Also, the total monthly peak demand by space cooling was 22372.2 kWh, ventilation fan 1376 kWh, factory machineries
14294kWh heat rejection is 4461 kWh, pump and auxiliary is 1343 kWh and area light 11023 kWh respectively having a sum
total monthly peak demand by the end users to be 44969.2 kWh. This represent energy use in air-conditioning (space cooling)
was 41%, ventilation fan 3%, 26% factory machineries, heat rejection is 8%, pump and auxiliary is 2% and 20% area light of
the annual peak demand. The Energy Used Index (average annual electricity use per tones of leather) was found to be
717.38kWh/tones of leather/Annum.
Keywords: Energy Audit, National Grid, eQUEST, Leather, AGO
1. Introduction
Energy has a major impact on every aspect of our socio-
economic life. It plays a vital role in the economic, social
and political development of our nation. Inadequate supply
of energy restricts socio-economic activities, limits
economic growth and adversely affects the quality of life
[1]. In Nigeria, a lot of energy is wasted because
households, public and private offices, as well as industries
use more energy than is actually necessary to fulfill their
needs. One of the reasons is that they use outdated and
inefficient equipment and production processes, therefore,
the need for energy is exceeding it is supply in view of
these circumstances, primary energy conservation,
2 Jamilu Ya’u Muhammad et al.: Energy Audit and Management of a Tannery Company: A Case Study of Kano State
rationalization, and efficient use are immediate needs.
Getting all the possible energy from the fuel into the
working fluid is the goal of efficient equipment operations.
This leads to higher productivity and saves not only money,
but also influences the life and safety of the equipment and
reduces pollution [2].
Global, country-specific, and industry-specific analyses
continue to show that significant energy-efficiency
improvement opportunities exist in the industrial sector,
many of which are cost-effective. These energy-efficiency
options include both cross-cutting as well as sector-specific
measures. However, industrial facilities are not always
aware of their overall energy efficiency improvement
potential or specific technologies and measures that can be
implemented. One of the most common methods adopted
around the world to address these issues is to undertake an
industrial energy audit. An industrial energy audit is a
necessary first step for defining energy consumption by end
use and identifying key areas for energy saving in industrial
operations. Without baseline energy use data, it is
impossible to have a clear understanding of the current
situation or to make cost-effective decisions regarding
energy-efficiency strategies. An industrial energy audit is
also an important impetus to encourage industrial facilities
to implement energy-efficiency measures and technologies
with most saving potential. In general, preliminary energy
audits provide quick estimates of costs, potential cost and
energy savings, as well as simple payback periods.
Comprehensive energy audits, on the other hand, are
enabled to provide detailed cost-effective analysis of all
identified measures and technologies, based on plant’s
specific operating conditions. Creditable energy audits
provide packages of customized recommendations for
plants to consider. In this regard, an energy audit is often a
key component of industrial energy efficiency programs
and has also been considered as a supporting policy tool for
policies such as voluntary agreements or emissions cap and
trade policies [3].
Energy audits are an inspection of energy consumption
habits within a building. An audit team examines utility bills,
lights, plug loads, the HVAC system, and the building
envelope to gather data. These data are used to create one or
more models of energy consumption in the building. After
these models are verified against actual building
consumption, potential methods to reduce energy
consumption are modeled to quantify savings from the
implementation of each method. Once savings for an Energy
Conservation Measure (ECM) are quantified, a financial
analysis is performed to determine whether that measure is
worth implementing. The worthwhile ECMs are
recommended to building owners; along with details about
the financial and material investment each measure requires
[4].
From the literature, many studies related energy efficiency
and savings based on the building sector like commercial and
high-volume buildings have found [5, 6].
2. Materials and Method
2.1. Materials
Materials used in this research are as follows:
a) Electricity bills file.
b) AGO consumption file.
c) Records of skin processed.
d) Power ratings of factory machineries.
e) eQUEST 3-6.5 version Energy simulation software.
f) Laptop Computer.
2.1.1. Energy Audit Simulator
Computer-based simulation is accepted by many energy
efficiency studies as a reliable tool for evaluating building
energy use and retrofit possibilities [7-9]. eQUEST was
decided to use because it is a user friendly freeware
program that offers a comprehensive set of features:
eQUEST predicts the hourly energy use and energy cost of
a building given user-input information including hourly
weather data, building layout, HVAC description, and
utility rate structure [10].
eQUEST v3.65 was used in creating a simulation model of
the case study building based on building schematic
drawings. In addition to building parameters weather data
was also required. The closest weather station with complete
weather data available for the period under consideration is
in Kano, Nigeria. Utility bills for diesel and electricity from
January 2012 and December 2016 were compiled for
comparison against simulated energy consumption.
2.1.2. Factory Machineries and Their Uses
The following are some factory machineries descriptions
and their uses:
a) De-dusting Machine: This is a metal mesh rotating
cylinder that can provide the de-dusting process suitable
to remove dust from double face leather.
b) Dry Buffing Machine: This is a cylinder machines,
equipped with sandpaper or emery for the processing of
leather with unbuckle or suede effect, or to correct any
defects on the leather grain side. Control devices with
hydraulic drive are used to quickly reverse the direction
of rotation of the feed roller and make it easier the
manual extraction of the leather. The systems are
supplemented by specific elements of the dust
extraction and collection in the bags.
c) Fleshing Machine: This is a machine which is scraping
off of the excessive organic material from the hide
(connective tissue, fat and so on).
d) Shaving Machine: This is used in carrying out of
shaving process in order to achieve an even thickness
throughout the skin/hide, and it can be carried out on
tanned or crusted leather.
e) Drying machines: The objective of drying is to dry the
leather whilst optimizing the quality and area yield.
Drying techniques include samming, centrifuging,
setting, hang drying, vacuum drying, toggle drying and
paste drying.
American Journal of Electrical Power and Energy Systems 2020; 9(1): 1-13 3
Table B8 present the power rating and estimated daily and
monthly energy consumptions of factory machineries and
other equipment used in the company.
2.1.3. Computer Laptop Specifications
HP pavilion g6 computer core “i5 system, 2.50GHz
processor, 8GB RAM size on Microsoft window 7 operating
system is used in the research simulation.
2.2. Method
2.2.1. Data Collection
For the energy carriers, the first stage in this study was the
data collection, in which a meeting was held with the
Management and all key operating personnel, and they were
briefed over the audit objectives, the scope of the work and
description of scheduled project activities. An energy audit
check list was drawn to acquire data by physical checks. The
monthly consumption figures of two energy carriers
(Electrical and AGO) for a period of five years (2012 - 2016)
were extracted from electrical consumption and diesel
consumption files from physical personnel of the company.
Also, information obtained by physical checks where used to
construct various types of electricity used profiles,
comparison tables, corresponding correlation plots.
2.2.2. Data Analysis
From the data collected, the following procedural steps
were adopted to analyze the data, inputted and presented in
the required forms:
a) Data Analysis for Energy carries
i. Energy types (electricity and AGO) were identified
and collated.
ii. The energy consumption per year for each type of
energy carrier was determined.
iii. The percentage breakdown of total energy
consumption was calculated.
iv. The energy used index (EUI) in (kWh/tones of
leather/per) year was determined to establish energy
utilization pattern.
b) Computations for Electrical Energy consumption (kWh)
and percentage (%) share for types.
i. Energy carriers (National grid and AGO)
In this study, monthly average electrical energy
consumption and percentage share for the period of 5 years
(i.e. 2012 to 2016) are computed from the relation given as
follows [3]:
����� = �� �∑ ������� � �� (1)
�������� = ��� �∑ �������� � �� (2)
����ℎ��������� !�"ℎ ��%� = $%%&'%%& × 100 (3)
+' = +,-�. + +,01 (4)
Where:
AMEEC: Average monthly electrical energy consumed
from 2012 to 2016
MAAEEC: Monthly annual average electrical energy
consumption
TEEC: The total electrical energy consumed per annum
k: The year i.e 2012, 2013, 2014, 2015 and 2016
MEEC: Monthly electrical energy consumed
AEEC: Annual electrical energy consumed
XT: Monthly total of energy consumption of national grid
and AGO
Xgrid: Monthly energy consumption from national grid
Xgen: Monthly energy consumption from AGO
The Automotive Gas Oil (AGO) consumed in MJ was
converted to kWh for data analysis. And the equivalent
energy value of 3.6MJ = 1 kWh.
For example the monthly electricity consumption from
combined energy types for each month was X3 = X4567 +X489
For the month of January 2012
X�:��;<= = +,-�.>?@ + +,01>?@ = 38019�D + 774�D = 38793�D = 10775.83IJℎ
Values for the subsequent month and years were computed
and presented in the Appendix “B” table B1.
AMEEC for electricity consumption from combine energy
types for the month of January was computed using equation
(1) above
������KL1ML-N = 15 �����:�� +�����:�O
+�����:�P +�����:�� +�����:�Q�
������KL1ML-N = 15 10775.83IJℎ + 9015.56IJℎ
+ 10100IJℎ + 10334.72IJℎ+ 10148.33IJℎ� = 10074.89IJℎ
Values for the subsequent months were computed and
presented in table B1 of Appendix “B”.
MAAEEC for electricity consumption from combine
energy types for the year 2012 was computed using equation
2:
�������� = TU �������
� �V�
������ = 123945.3IJℎ
Values for the subsequent months were computed and
presented in table B2 of Appendix “B”.
Also yearly percentage of energy types can be deduced
using equation (3) above. For the year 2012 we have,
�� �%�1LWM-LX,-�. = 120907.5123945.2778 × 100 = 97.5%
�� �%�YZ[ = 3037.778123945.2778 × 100 = 2.5%
Values for the subsequent months were computed and
4 Jamilu Ya’u Muhammad et al.: Energy Audit and Management of a Tannery Company: A Case Study of Kano State
presented in table B3 of Appendix “B”.
ii. National Grid
In this research, monthly electricity consumption and
annual total for period of 5 years (2012-2016) were obtained
using equations given above:
AMEEC for national grid consumption for the month of
January can be found using equation 1:
������KL1ML-N = 15 �����:�� +�����:�O +�����:�P +�����:�� +�����:�Q�
= 15 38019 + 31708 + 35672 + 36455 + 35707��D
= 15 177561�D� = 9864.5IJℎ
Values for the subsequent months were computed and presented in table B9 of Appendix “B”.
MAAEEC for national grid consumption for the year 2012 was computed using equation 2:
�������� = TU �������
� �V�
������ = 38019 + 36825 + 34972 + 36075 + 37280 + 35555 + 37331 + 32963 + 38467 + 36035 + 35929+ 35816��D = 435267�D = 12090.55IJℎ
Values for the subsequent years were computed and
presented in table B2 of Appendix “B”.
MAAEEC for year 2012 is computed using equation:
��������:�� = 12090.5512 = 1007.55IJℎ
Values for the subsequent years were computed and
presented in table B4 of Appendix “B”.
iii. Automotive gas oil (AGO)
In this study, AGO consumption by company generator
was analyzed. The average monthly diesel consumption,
monthly Annual Average diesel consumption and Annual
total were determined using the relation as follows [4]:
��\��� = �� ]∑ �\��� � ^ (5)
��\��� = ��� ∑ �\���� � � (6)
Where:
k: The year
AMDC: Average monthly diesel consumption
MADC: Monthly Annual average diesel consumption
i: The number of month,
TDC: Total diesel consumed per annum
MADC for the year 2012 was computed using equation 5:
��\���:�� = 10936�D12 = 911.33�D = 23.61�_���`
The values of the average consumption for the subsequent years were computed and presented in table B5 of the Appendix
“B”
The total annual consumption in terms of kWh for years (2012-2016) were computed and presented in table B2.
Overall percentage contribution of each source
Nationalgridcontribution = 594803.61
DieselAGO�contribution = 14405.83
Total = 609209.44
Percentageofnationalgrid = 594803.61609209.44 × 100 = 97.6%
PercentageAGO = 14405.83609209.44 × 100 = 2.4%
The results were computed and presented in table B3
Appendix “B”. The annual percentage contribution of each
source is computed and presented in table B3 appendix B.
c) Evaluation of Energy Used Index (Annual electricity
Used per tones of leather)
A total of five years (2012 – 2016) electricity consumption
data was collected and analyze. To simplify the analysis, the
consumption data was averaged over five year’s period.
Energy used per tones of leather (also known as energy
utilization index) is used to compare the energy intensity
American Journal of Electrical Power and Energy Systems 2020; 9(1): 1-13 5
among different years. Sample calculation of energy used index for the year 2012.
����!�w`�xy�x�z�wy� = Y{0-L,0�|}~�0X0�W-���WNN�~1�M��W�~1'~WLXW~10�~�X0LW}0- (7)
�wy = ��O�P�.��
��P
�wy � 712.33kWh
tonesofleather/year
Values for the subsequent years were computed and
presented in table B6 of Appendix “B”.
2.2.3. Computer Simulation
A. Building Description
The case building selected for this research is an industrial
building located in the challawa industrial building area of
Kano, Nigeria. It is cumulative building area is 51224 m2 and
comprises of machineries area of 41282 m2 and 9942 m
2 for
administration area.
B. Building Material and Envelope
The exterior walls of the building are 9 inches blocks with
R-12 polystyrene insulation. The floor is 6 inches concrete
base with ceramic/stone finish. The internal walls are 6
inches sheetrock framed on metal studs with insulation on
select interiors. The building is operated under positive
pressure, which eliminates any potential envelope infiltration.
A screenshot of the eQUEST wizard screen for inputting
building material and envelope details is displayed in figure
C1.
C. Heating Ventilation and Air conditioning (HVAC)
System
The building air conditioning is primarily a standard VAV
and the domestic hot water is provided by a domestic hot
water supply loop connected to central hot water pumps
(figure C2).
D. Building Schedules
The building is in operation 5 days a week from Monday
through Friday. The occupants generally begin to enter at
around 7am and leave at 5pm. The building is closed on
Saturday and Sunday as well as on local holidays. A typical
schedule input screen for eQUEST is shown in figure C3.
3. Results and Discussions
3.1. Results
3.1.1. Energy Carriers
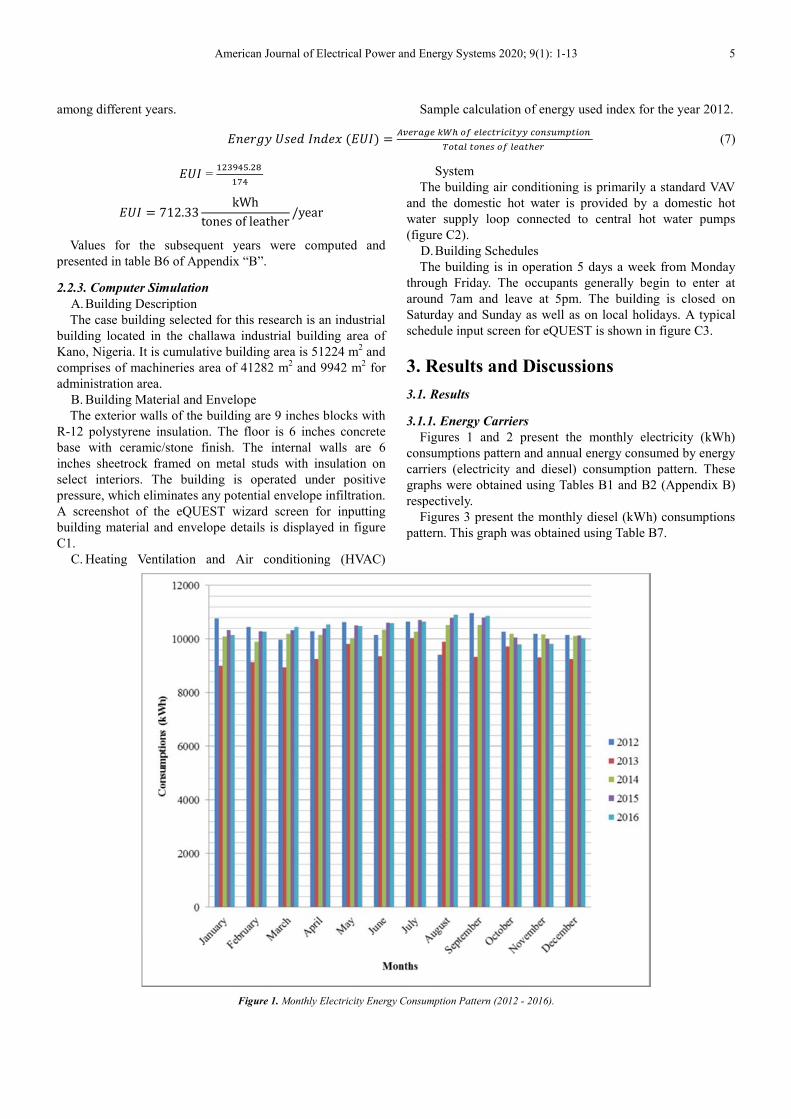
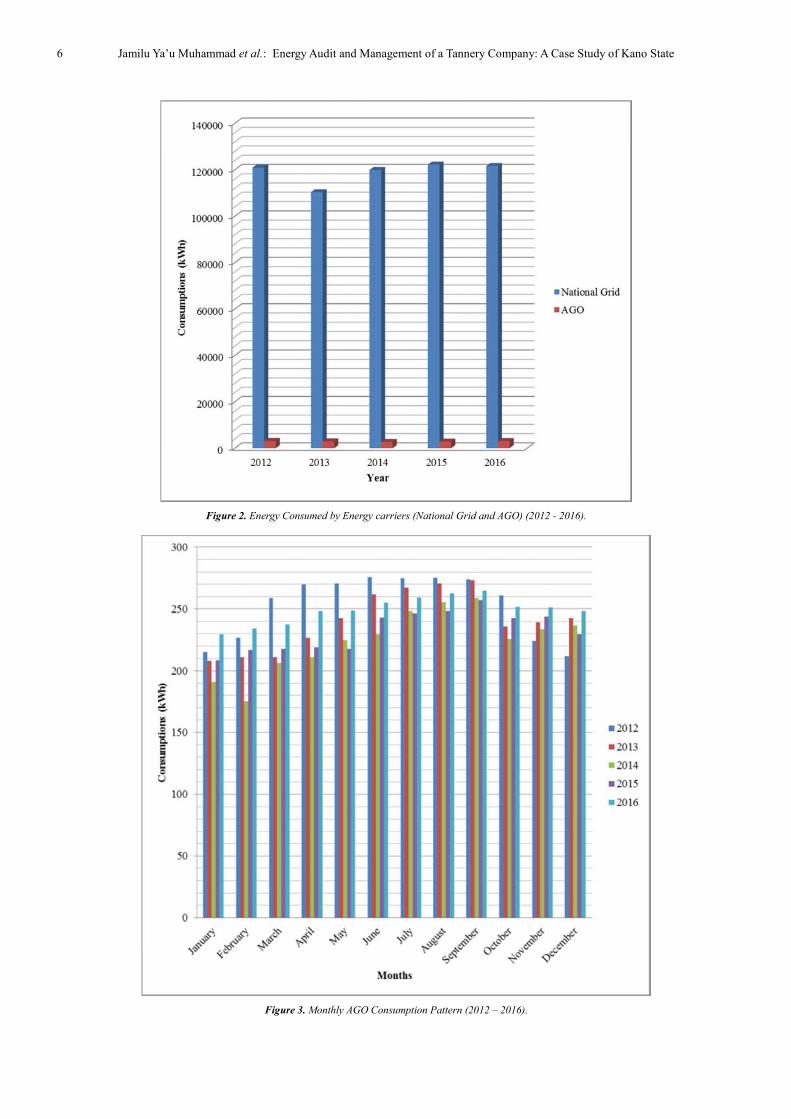
Figures 1 and 2 present the monthly electricity (kWh)
consumptions pattern and annual energy consumed by energy
carriers (electricity and diesel) consumption pattern. These
graphs were obtained using Tables B1 and B2 (Appendix B)
respectively.
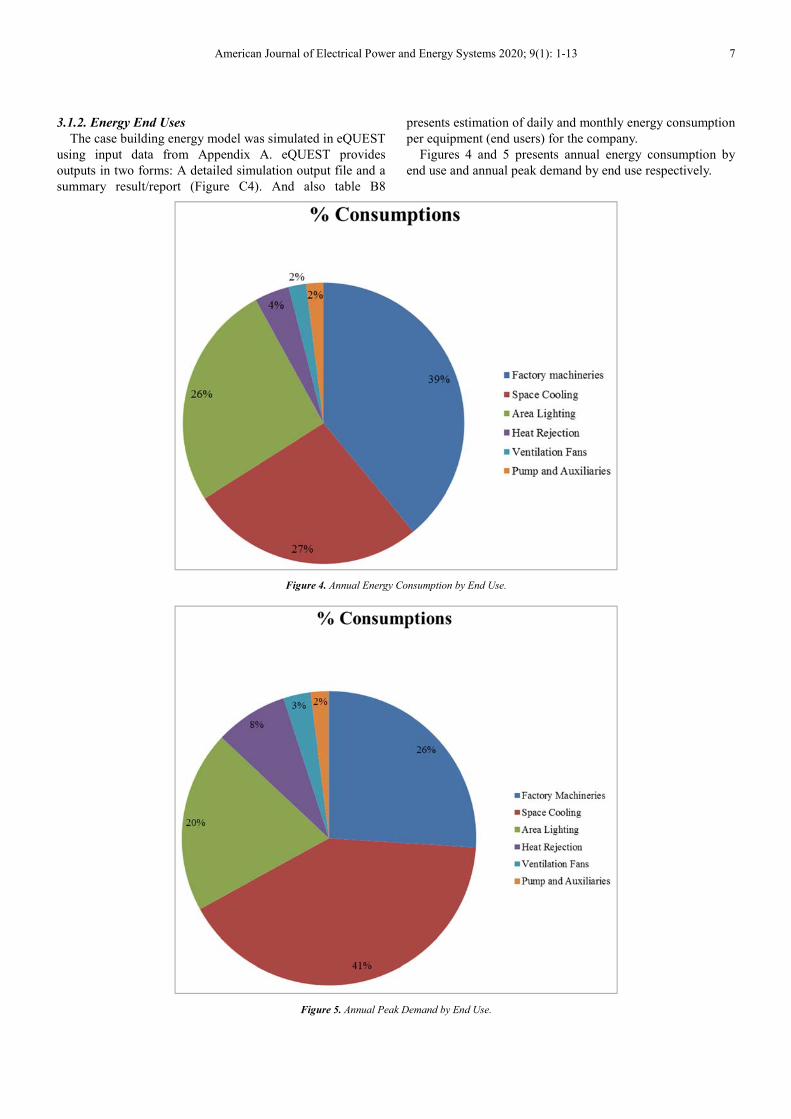
Figures 3 present the monthly diesel (kWh) consumptions
pattern. This graph was obtained using Table B7.
Figure 1. Monthly Electricity Energy Consumption Pattern (2012 - 2016).
6 Jamilu Ya’u Muhammad et al.: Energy Audit and Management of a Tannery Company: A Case Study of Kano State
Figure 2. Energy Consumed by Energy carriers (National Grid and AGO) (2012 - 2016).
Figure 3. Monthly AGO Consumption Pattern (2012 – 2016).
American Journal of Electrical Power and Energy Systems 2020; 9(1): 1-13 7
3.1.2. Energy End Uses
The case building energy model was simulated in eQUEST
using input data from Appendix A. eQUEST provides
outputs in two forms: A detailed simulation output file and a
summary result/report (Figure C4). And also table B8
presents estimation of daily and monthly energy consumption
per equipment (end users) for the company.
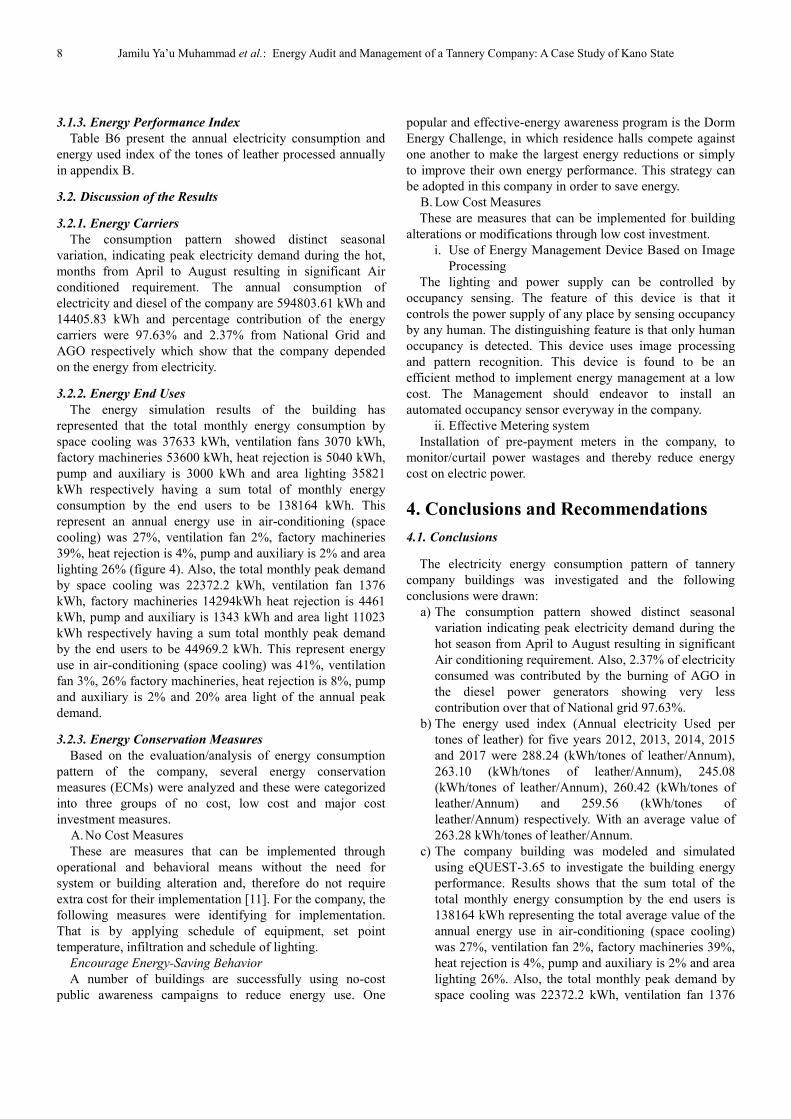
Figures 4 and 5 presents annual energy consumption by
end use and annual peak demand by end use respectively.
Figure 4. Annual Energy Consumption by End Use.
Figure 5. Annual Peak Demand by End Use.
8 Jamilu Ya’u Muhammad et al.: Energy Audit and Management of a Tannery Company: A Case Study of Kano State
3.1.3. Energy Performance Index
Table B6 present the annual electricity consumption and
energy used index of the tones of leather processed annually
in appendix B.
3.2. Discussion of the Results
3.2.1. Energy Carriers
The consumption pattern showed distinct seasonal
variation, indicating peak electricity demand during the hot,
months from April to August resulting in significant Air
conditioned requirement. The annual consumption of
electricity and diesel of the company are 594803.61 kWh and
14405.83 kWh and percentage contribution of the energy
carriers were 97.63% and 2.37% from National Grid and
AGO respectively which show that the company depended
on the energy from electricity.
3.2.2. Energy End Uses
The energy simulation results of the building has
represented that the total monthly energy consumption by
space cooling was 37633 kWh, ventilation fans 3070 kWh,
factory machineries 53600 kWh, heat rejection is 5040 kWh,
pump and auxiliary is 3000 kWh and area lighting 35821
kWh respectively having a sum total of monthly energy
consumption by the end users to be 138164 kWh. This
represent an annual energy use in air-conditioning (space
cooling) was 27%, ventilation fan 2%, factory machineries
39%, heat rejection is 4%, pump and auxiliary is 2% and area
lighting 26% (figure 4). Also, the total monthly peak demand
by space cooling was 22372.2 kWh, ventilation fan 1376
kWh, factory machineries 14294kWh heat rejection is 4461
kWh, pump and auxiliary is 1343 kWh and area light 11023
kWh respectively having a sum total monthly peak demand
by the end users to be 44969.2 kWh. This represent energy
use in air-conditioning (space cooling) was 41%, ventilation
fan 3%, 26% factory machineries, heat rejection is 8%, pump
and auxiliary is 2% and 20% area light of the annual peak
demand.
3.2.3. Energy Conservation Measures
Based on the evaluation/analysis of energy consumption
pattern of the company, several energy conservation
measures (ECMs) were analyzed and these were categorized
into three groups of no cost, low cost and major cost
investment measures.
A. No Cost Measures
These are measures that can be implemented through
operational and behavioral means without the need for
system or building alteration and, therefore do not require
extra cost for their implementation [11]. For the company, the
following measures were identifying for implementation.
That is by applying schedule of equipment, set point
temperature, infiltration and schedule of lighting.
Encourage Energy-Saving Behavior
A number of buildings are successfully using no-cost
public awareness campaigns to reduce energy use. One
popular and effective-energy awareness program is the Dorm
Energy Challenge, in which residence halls compete against
one another to make the largest energy reductions or simply
to improve their own energy performance. This strategy can
be adopted in this company in order to save energy.
B. Low Cost Measures
These are measures that can be implemented for building
alterations or modifications through low cost investment.
i. Use of Energy Management Device Based on Image
Processing
The lighting and power supply can be controlled by
occupancy sensing. The feature of this device is that it
controls the power supply of any place by sensing occupancy
by any human. The distinguishing feature is that only human
occupancy is detected. This device uses image processing
and pattern recognition. This device is found to be an
efficient method to implement energy management at a low
cost. The Management should endeavor to install an
automated occupancy sensor everyway in the company.
ii. Effective Metering system
Installation of pre-payment meters in the company, to
monitor/curtail power wastages and thereby reduce energy
cost on electric power.
4. Conclusions and Recommendations
4.1. Conclusions
The electricity energy consumption pattern of tannery
company buildings was investigated and the following
conclusions were drawn:
a) The consumption pattern showed distinct seasonal
variation indicating peak electricity demand during the
hot season from April to August resulting in significant
Air conditioning requirement. Also, 2.37% of electricity
consumed was contributed by the burning of AGO in
the diesel power generators showing very less
contribution over that of National grid 97.63%.
b) The energy used index (Annual electricity Used per
tones of leather) for five years 2012, 2013, 2014, 2015
and 2017 were 288.24 (kWh/tones of leather/Annum),
263.10 (kWh/tones of leather/Annum), 245.08
(kWh/tones of leather/Annum), 260.42 (kWh/tones of
leather/Annum) and 259.56 (kWh/tones of
leather/Annum) respectively. With an average value of
263.28 kWh/tones of leather/Annum.
c) The company building was modeled and simulated
using eQUEST-3.65 to investigate the building energy
performance. Results shows that the sum total of the
total monthly energy consumption by the end users is
138164 kWh representing the total average value of the
annual energy use in air-conditioning (space cooling)
was 27%, ventilation fan 2%, factory machineries 39%,
heat rejection is 4%, pump and auxiliary is 2% and area
lighting 26%. Also, the total monthly peak demand by
space cooling was 22372.2 kWh, ventilation fan 1376
American Journal of Electrical Power and Energy Systems 2020; 9(1): 1-13 9
kWh, factory machineries 14294kWh heat rejection is
4461 kWh, pump and auxiliary is 1343 kWh and area
light 11023 kWh respectively having a sum total
monthly peak demand by the end users to be 44969.2
kWh. This represent energy use in air-conditioning
(space cooling) was 41%, ventilation fan 3%, 26%
factory machineries, heat rejection is 8%, pump and
auxiliary is 2% and 20% area light of the annual peak
demand.
4.2. Recommendations
Based on the conclusion of this research work, the
following recommendations are made for the existing
building in company.
a) Creation of Energy Management Units in the company
system to educate staff switch off the lights directly at
the end of the day or when not in use.
b) The company management should implement an
automated lighting system, which helps in switching off
street lights automatically during the day.
c) Use of high efficient equipment: High efficiency
equipment reduces the energy needed to deliver a given
level of energy services or produces more energy
service per unit of energy. A careful observation shows
that space cooling misc. equipment and area lighting
were items which consumed the bulk of the energy
supplied to the company, thus flagged areas for
potential improvement of efficiency.
d) Reducing energy use for lighting: Energy use for
lighting in company can be reduced by appropriate
window design and glass to make maximum use of
daylight while avoiding excessive solar gain. Energy
efficient lighting systems (e.g. using task lighting) to
avoid excessive background luminance levels.
Appendix
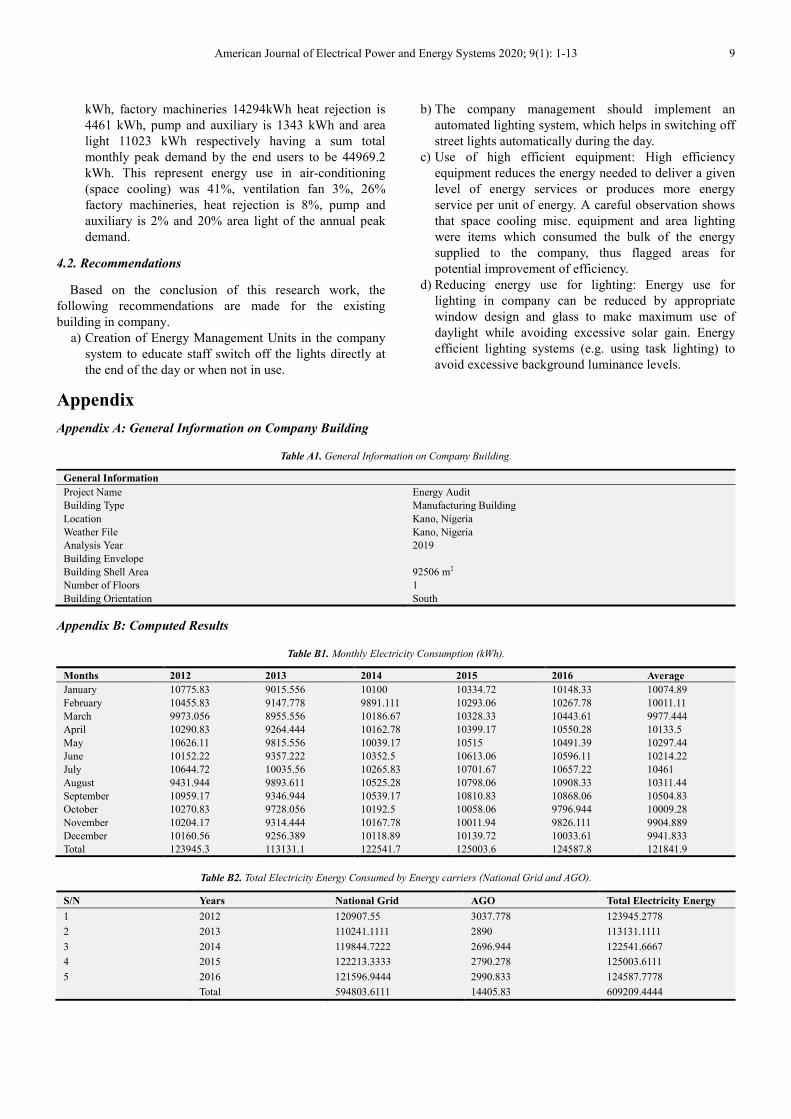
Appendix A: General Information on Company Building
Table A1. General Information on Company Building.
General Information
Project Name Energy Audit
Building Type Manufacturing Building
Location Kano, Nigeria
Weather File Kano, Nigeria
Analysis Year 2019
Building Envelope
Building Shell Area 92506 m2
Number of Floors 1
Building Orientation South
Appendix B: Computed Results
Table B1. Monthly Electricity Consumption (kWh).
Months 2012 2013 2014 2015 2016 Average
January 10775.83 9015.556 10100 10334.72 10148.33 10074.89
February 10455.83 9147.778 9891.111 10293.06 10267.78 10011.11
March 9973.056 8955.556 10186.67 10328.33 10443.61 9977.444
April 10290.83 9264.444 10162.78 10399.17 10550.28 10133.5
May 10626.11 9815.556 10039.17 10515 10491.39 10297.44
June 10152.22 9357.222 10352.5 10613.06 10596.11 10214.22
July 10644.72 10035.56 10265.83 10701.67 10657.22 10461
August 9431.944 9893.611 10525.28 10798.06 10908.33 10311.44
September 10959.17 9346.944 10539.17 10810.83 10868.06 10504.83
October 10270.83 9728.056 10192.5 10058.06 9796.944 10009.28
November 10204.17 9314.444 10167.78 10011.94 9826.111 9904.889
December 10160.56 9256.389 10118.89 10139.72 10033.61 9941.833
Total 123945.3 113131.1 122541.7 125003.6 124587.8 121841.9
Table B2. Total Electricity Energy Consumed by Energy carriers (National Grid and AGO).
S/N Years National Grid AGO Total Electricity Energy
1 2012 120907.55 3037.778 123945.2778
2 2013 110241.1111 2890 113131.1111
3 2014 119844.7222 2696.944 122541.6667
4 2015 122213.3333 2790.278 125003.6111
5 2016 121596.9444 2990.833 124587.7778
Total 594803.6111 14405.83 609209.4444
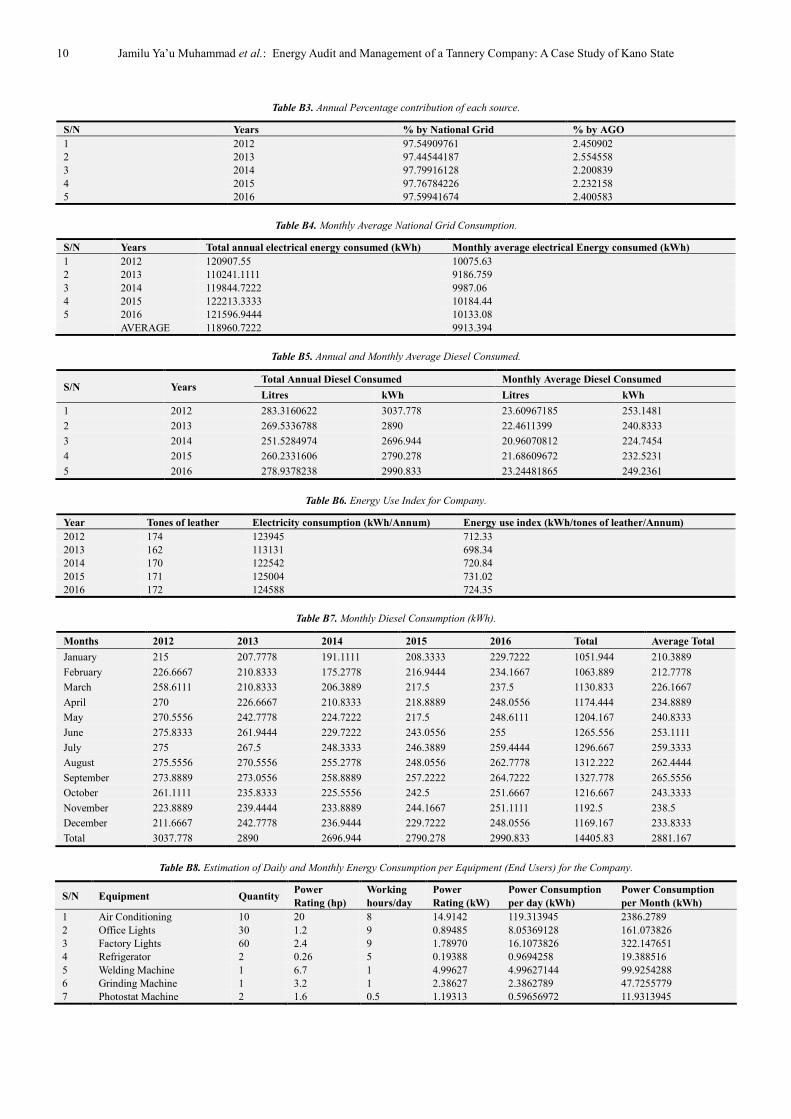
10 Jamilu Ya’u Muhammad et al.: Energy Audit and Management of a Tannery Company: A Case Study of Kano State
Table B3. Annual Percentage contribution of each source.
S/N Years % by National Grid % by AGO
1 2012 97.54909761 2.450902
2 2013 97.44544187 2.554558
3 2014 97.79916128 2.200839
4 2015 97.76784226 2.232158
5 2016 97.59941674 2.400583
Table B4. Monthly Average National Grid Consumption.
S/N Years Total annual electrical energy consumed (kWh) Monthly average electrical Energy consumed (kWh)
1 2012 120907.55 10075.63
2 2013 110241.1111 9186.759
3 2014 119844.7222 9987.06
4 2015 122213.3333 10184.44
5 2016 121596.9444 10133.08
AVERAGE 118960.7222 9913.394
Table B5. Annual and Monthly Average Diesel Consumed.
S/N Years Total Annual Diesel Consumed Monthly Average Diesel Consumed
Litres kWh Litres kWh
1 2012 283.3160622 3037.778 23.60967185 253.1481
2 2013 269.5336788 2890 22.4611399 240.8333
3 2014 251.5284974 2696.944 20.96070812 224.7454
4 2015 260.2331606 2790.278 21.68609672 232.5231
5 2016 278.9378238 2990.833 23.24481865 249.2361
Table B6. Energy Use Index for Company.
Year Tones of leather Electricity consumption (kWh/Annum) Energy use index (kWh/tones of leather/Annum)
2012 174 123945 712.33
2013 162 113131 698.34
2014 170 122542 720.84
2015 171 125004 731.02
2016 172 124588 724.35
Table B7. Monthly Diesel Consumption (kWh).
Months 2012 2013 2014 2015 2016 Total Average Total
January 215 207.7778 191.1111 208.3333 229.7222 1051.944 210.3889
February 226.6667 210.8333 175.2778 216.9444 234.1667 1063.889 212.7778
March 258.6111 210.8333 206.3889 217.5 237.5 1130.833 226.1667
April 270 226.6667 210.8333 218.8889 248.0556 1174.444 234.8889
May 270.5556 242.7778 224.7222 217.5 248.6111 1204.167 240.8333
June 275.8333 261.9444 229.7222 243.0556 255 1265.556 253.1111
July 275 267.5 248.3333 246.3889 259.4444 1296.667 259.3333
August 275.5556 270.5556 255.2778 248.0556 262.7778 1312.222 262.4444
September 273.8889 273.0556 258.8889 257.2222 264.7222 1327.778 265.5556
October 261.1111 235.8333 225.5556 242.5 251.6667 1216.667 243.3333
November 223.8889 239.4444 233.8889 244.1667 251.1111 1192.5 238.5
December 211.6667 242.7778 236.9444 229.7222 248.0556 1169.167 233.8333
Total 3037.778 2890 2696.944 2790.278 2990.833 14405.83 2881.167
Table B8. Estimation of Daily and Monthly Energy Consumption per Equipment (End Users) for the Company.
S/N Equipment Quantity Power
Rating (hp)
Working
hours/day
Power
Rating (kW)
Power Consumption
per day (kWh)
Power Consumption
per Month (kWh)
1 Air Conditioning 10 20 8 14.9142 119.313945 2386.2789
2 Office Lights 30 1.2 9 0.89485 8.05369128 161.073826
3 Factory Lights 60 2.4 9 1.78970 16.1073826 322.147651
4 Refrigerator 2 0.26 5 0.19388 0.9694258 19.388516
5 Welding Machine 1 6.7 1 4.99627 4.99627144 99.9254288
6 Grinding Machine 1 3.2 1 2.38627 2.3862789 47.7255779
7 Photostat Machine 2 1.6 0.5 1.19313 0.59656972 11.9313945
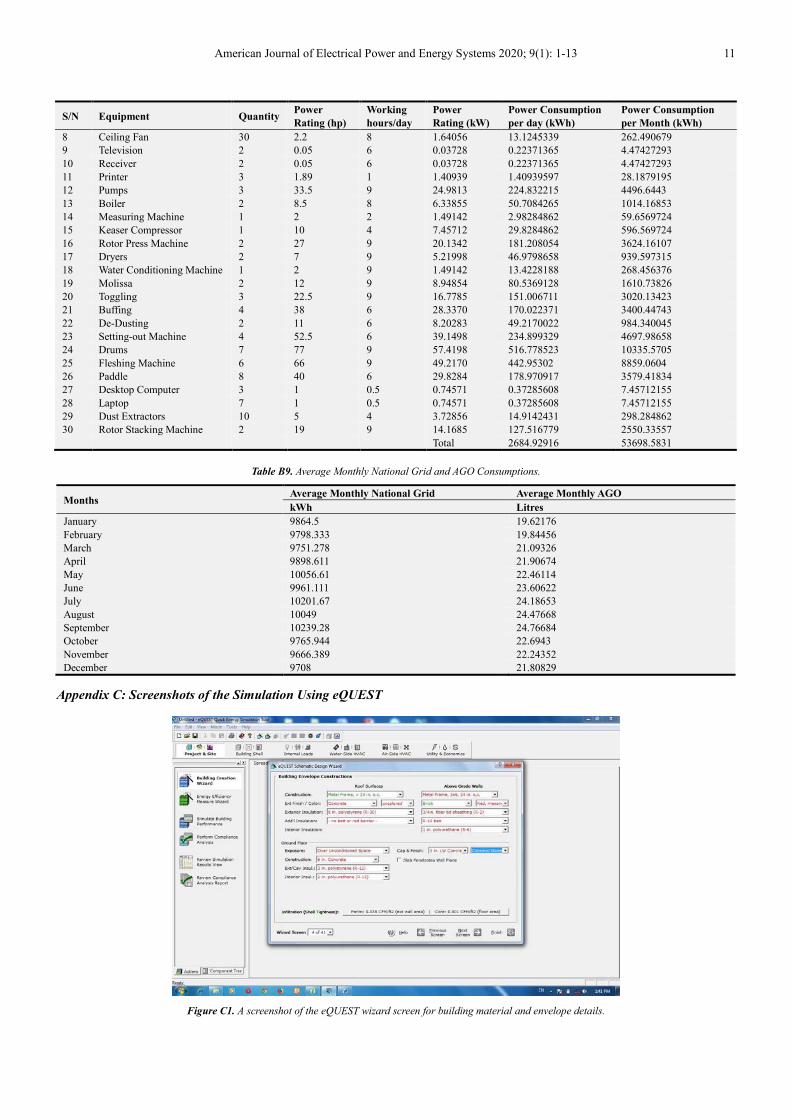
American Journal of Electrical Power and Energy Systems 2020; 9(1): 1-13 11
S/N Equipment Quantity Power
Rating (hp)
Working
hours/day
Power
Rating (kW)
Power Consumption
per day (kWh)
Power Consumption
per Month (kWh)
8 Ceiling Fan 30 2.2 8 1.64056 13.1245339 262.490679
9 Television 2 0.05 6 0.03728 0.22371365 4.47427293
10 Receiver 2 0.05 6 0.03728 0.22371365 4.47427293
11 Printer 3 1.89 1 1.40939 1.40939597 28.1879195
12 Pumps 3 33.5 9 24.9813 224.832215 4496.6443
13 Boiler 2 8.5 8 6.33855 50.7084265 1014.16853
14 Measuring Machine 1 2 2 1.49142 2.98284862 59.6569724
15 Keaser Compressor 1 10 4 7.45712 29.8284862 596.569724
16 Rotor Press Machine 2 27 9 20.1342 181.208054 3624.16107
17 Dryers 2 7 9 5.21998 46.9798658 939.597315
18 Water Conditioning Machine 1 2 9 1.49142 13.4228188 268.456376
19 Molissa 2 12 9 8.94854 80.5369128 1610.73826
20 Toggling 3 22.5 9 16.7785 151.006711 3020.13423
21 Buffing 4 38 6 28.3370 170.022371 3400.44743
22 De-Dusting 2 11 6 8.20283 49.2170022 984.340045
23 Setting-out Machine 4 52.5 6 39.1498 234.899329 4697.98658
24 Drums 7 77 9 57.4198 516.778523 10335.5705
25 Fleshing Machine 6 66 9 49.2170 442.95302 8859.0604
26 Paddle 8 40 6 29.8284 178.970917 3579.41834
27 Desktop Computer 3 1 0.5 0.74571 0.37285608 7.45712155
28 Laptop 7 1 0.5 0.74571 0.37285608 7.45712155
29 Dust Extractors 10 5 4 3.72856 14.9142431 298.284862
30 Rotor Stacking Machine 2 19 9 14.1685 127.516779 2550.33557
Total 2684.92916 53698.5831
Table B9. Average Monthly National Grid and AGO Consumptions.
Months Average Monthly National Grid Average Monthly AGO
kWh Litres
January 9864.5 19.62176
February 9798.333 19.84456
March 9751.278 21.09326
April 9898.611 21.90674
May 10056.61 22.46114
June 9961.111 23.60622
July 10201.67 24.18653
August 10049 24.47668
September 10239.28 24.76684
October 9765.944 22.6943
November 9666.389 22.24352
December 9708 21.80829
Appendix C: Screenshots of the Simulation Using eQUEST
Figure C1. A screenshot of the eQUEST wizard screen for building material and envelope details.
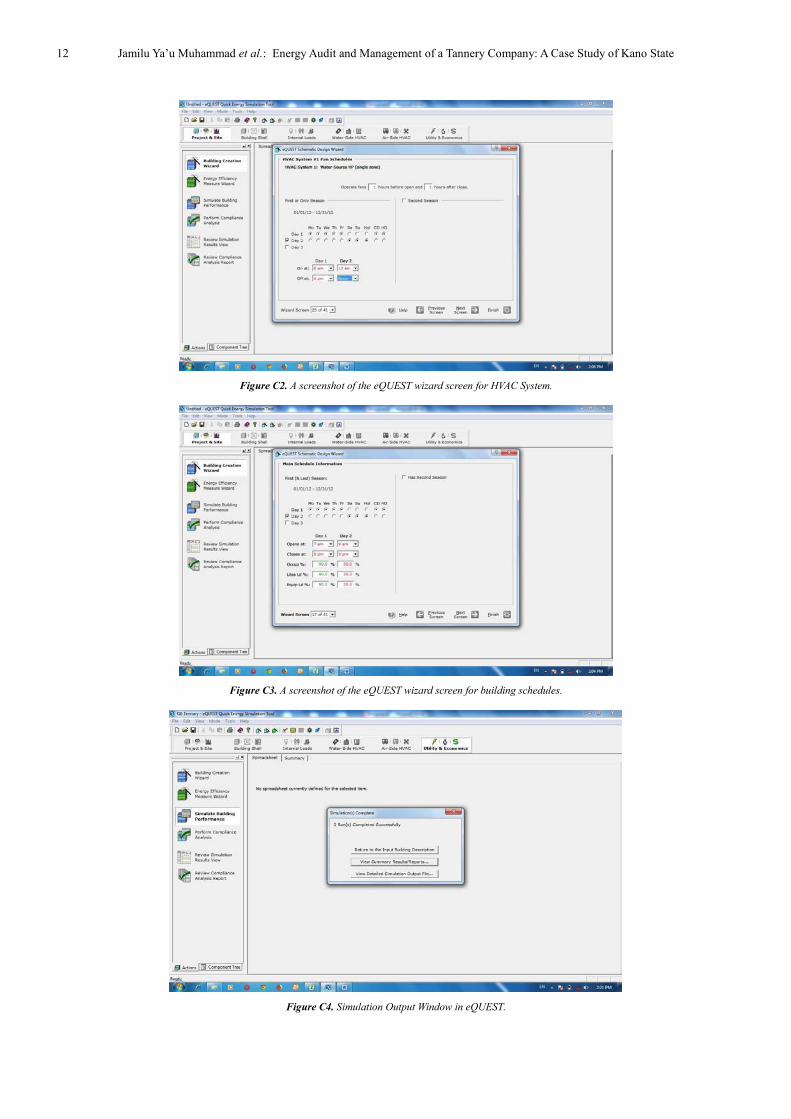
12 Jamilu Ya’u Muhammad et al.: Energy Audit and Management of a Tannery Company: A Case Study of Kano State
Figure C2. A screenshot of the eQUEST wizard screen for HVAC System.
Figure C3. A screenshot of the eQUEST wizard screen for building schedules.
Figure C4. Simulation Output Window in eQUEST.
American Journal of Electrical Power and Energy Systems 2020; 9(1): 1-13 13
References
[1] Jamilu, Y. M.; Adamu, A. A.; Mika’il, A. A.; Yerima Y. A. (2018). Energy Audit and Efficiency of a Complex Building: A Comprehensive Review. Engineering Science. 3 (4): 36-41. doi: 10.11648/j.es.20180304.11.
[2] Habib, M. A.; Said, S. A. M.; Igbo, M. O.; El-Mahallawy, F. M.; Mahdi, E. A. (1999). Energy Conservation and Early Failure Prediction in Boilers and Industrial Furnaces. Symposium in management of energy consumption in industry, chamber of commerce, kingdom of Saudi Arabia.
[3] Galadima, U. (2001). Analysis of Electricity Energy Consumption for Effective Utilization in a Government Owned Housing Unit in Zamfara State. Unpublished M. Eng. Thesis, Bayero University, Kano.
[4] Tukur, U. (2013). Study of Electrical Energy Utilization in Katsina General Hospital. Unpublished PGDME Project, Bayero University, Kano.
[5] Lohani S. P. (2010). Energy and exergy analysis of fossil plant
and heat pump building heating system at two different dead-state temperatures, Energy 35 (8): 3323-3331.
[6] Kondo, K. (2009). Energy and exergy utilization efficiencies in the Japanese residential/commercial sectors. Energy Policy, 37: 3475–3483.
[7] James, S. (2006). Green building and sustainability. Building Science Digest, 5: 1-11.
[8] Almohoud, M. (2001). Computer-aided building energy analysis techniques. Building and Environment, 36 (4): 421-433.
[9] Zhu, Y. (2006). Applying computer-based simulation to energy auditing: a case study. Energy and Buildings, 38 (5): 421-428.
[10] eQUEST. (2008). eQUEST-The quick energy simulation tool, an overview. Retrieved from http://www.doe2.com/download/equest/eQUESTv3-Overview.pdf
[11] Lam, J. C.; Chan, R. Y. C.; Tsang C. L.; Li D. H. W. (2004). Electricity use characteristics of purpose, built office building in subtropical dimates. Energy conversion and management Energy-int. J; 45: 829-844.