Embed Size (px)
Citation preview

Sustainable Energy Watch 2005/2006
Report by: Dipankar Dey
Email: [email protected] [email protected]
Summary of Report Initial findings indicate that from 1990 to 2002 India failed to achieve any noteworthy progress in the management and development of its energy sector, especially in the areas of cleaner and renewable energy. The absence of a holistic energy policy and the increasingly reliance on road transportation are further worsening the situation. More funds need to be allocated towards rapid upgrading and expanding India’s railway infrastructure and improved road taxes for transport vehicles need to be applied. To promote the effective use of renewable energy sources strong, committed leadership is urgently required.
Energy and Sustainable Development in India
HELIO International / India
2
Preface
The findings of this report are based on the analysis of secondary data, mostly supplied by the government and other reliable sources. The main problem faced was in collecting appropriate data on investment and the actual production pertaining to renewable energy. Moreover, time series data on air pollution for all major cities of India were not available. Statistical figures in India are presented against a financial year calendar, i.e. for the period between April and March. In order to compare data supplied by international sources, normally presented in calendar year, i.e. January to December, figures had to be adjusted to correspond to the financial year. The most recent data for the majority of the indicators were for 2002-03. Beyond that reliable data across all the indicators could not be collected despite of best efforts. Verified data for Indian GHG emission was only available for 1994. The Report has been prepared by Dipankar Dey. Ms.Karabi Mitra Dey assisted it the collation and tabulation of data. Mr.Partha Chowdhury helped in typing tables and manuscript. Their contributions are acknowledged. Prof Sujay provided feedback on the initial findings. However any mistake in the report, are solely the responsibility of the author.
Author The Report has been prepared by Dipankar Dey (b.1964). Dr. Dey has a PhD in Business Management from the University of Calcutta and a Master in Business Management from the same university. His PhD dissertation was on ‘State and Foreign Involvement in the Development of Indian Petroleum Industry Between 1970 and 1989’. His present areas of research interest are: WTO regulations, FDI movement, renewable energy, global trade in services, regional and sub-regional trade blocks and impact of globalization on social sector. Prior to joining ICFAI Business School (IBS), Kolkata in December 2002 as a Faculty, he worked with corporate sector for over twelve years in very senior positions. For a brief period he was also associated with a leading NGO. Dr Dey’s main areas of teaching are International Finance and Trade, International Marketing, Marketing Research and International Business Environment. He is the Co-ordinator of PhD Programme and Member of the Doctoral Advisory Committee (DAC) of IBS Kolkata. He conducts Management Development Programs (MDPs) on trade policy and social sector management on a regular basis. Currently, he is attached to the Department of Business Management, University of Calcutta as a Guest Faculty in the area of International Marketing.

HELIO International / India
3
Dr Dey has participated as delegate and resource person in different national and international seminars including the Conference of Parties-8 (CoP -8) of United Nations Framework Convention of Climate Change (UNFCCC) and ‘International Seminar on Environmental Regulations and Market Access’ organized by OECD and UNCTAD. He was a member of the Advisory Group (Energy) formed by Stakeholder Forum (UK) during the Johannesburg Earth Summit 2002. Dr. Dey has produced numerous publications. His research article and commentaries have been published in the Economic and Political Weekly, The Hindu Business Line and The Statesman. Dipankar is also associated with ‘Kolkata Green Earth’ – a small voluntary organization of a few social activists who work for a nuclear free greener earth. Dipankar Dey, PhD Faculty ICFAI Business School Block –GP, Sector V Salt Lake Kolkata –700 091 India Phone:91-33-23577124/125 [email protected], [email protected].

HELIO International / India
4
Glossary Abbreviations ADB Asian Development Bank CDM Clean Development Mechanism CERC Central Electricity Regulatory Commission CMIE Centre for Monetary Indian Economy CNG Compressed Natural Gas CO Carbon monoxide CPCB Central Pollution Control Board DSM Demand Side Management GDP Gross Domestic Product GHG Green House Gases GOI Government of India IGCC Integrated Gasification Combined Cycle IMF International Monetary Fund INR Indian Rupees IREDA Indian Renewable Energy Development Agency koe Kg. of Oil Equivalent MMT Million Metric Tone MNES Ministry of Non conventional Energy Sources MoEF Ministry of Environment & Forests MT Metric Tone MTOE Million Tone of Oil Equivalent MW Mega watt NABARD National Bank for Agriculture and Rural Development NIPM National Integrated Pest Management Nox Oxides of Nitrogen PLF Plant Load Factor Rs Indian Currency Sox Sulphur Oxides SPM Suspended Particle Matter T & D Transmission and Distribution TERI Tata Energy Research Institute TNC Trans National Corporation
Conversion Factors
1 Kilowatt Hour 12.14 BTU, 3.6x10⁶ Joules 1 BTU 252 Kilo Cal, 1.055 Kilo Joules 1 BkWh Hydro or Wind Electricity 0.086 MTOE 1 lakh 10 Million 1 Crore 100 Million 1 Billion 1000 Million
HELIO International / India
5
Table of Contents Summary of Report...................................................................... 1 Preface....................................................................................... 2 Glossary ..................................................................................... 4
Abbreviations .................................................................................... 4 Conversion Factors............................................................................. 4
Table of Contents ........................................................................ 5 Executive Summary ..................................................................... 8 General Discussion of the Country ................................................. 9
Land area ......................................................................................... 9 Animal Husbandry.............................................................................. 9
Table 1:Production of Major Livestock Products and Fish ...............................10 Population........................................................................................10
Table 2:Percentage of Literates & Literacy Rates 2001..................................10 Economic Conditions .........................................................................10
Table 3:Growth in GDP .............................................................................11 Principal Imports and Exports (energy and non-energy) ........................11
Table 4:Major Imports and Exports (US $ Million) .......................................12 Impact of Globalization......................................................................12 Income and Equity ............................................................................13
Table 5:Human Development Index (HDI)...................................................13 Energy Usage ...................................................................................13
Table 6:Share of Different Fuel- Mix ...........................................................13 Table 7:Production and Consumption of Energy (2003-04) by Sector and Source .........................................................................................14 Figure 1:Electricity Production and Consumption (2003-4) ............................14
Principal Environmental Pressures.......................................................15 Table 8:Greenhouse Gas...........................................................................15 Case Study 1: Clemenceau ........................................................................15 Case Study 2: Vedanta Alumina Company ...................................................17 Case Study 3: Mitsubishi Chemicals in India.................................................17
Transport System .............................................................................18 Table 9:Indian Railway .............................................................................19 Table 10:Indian Roadways ........................................................................19
Overview of the National Sustainable Development Strategy............21
Indian Philosophy .............................................................................21 Table 11:India’s Development Indicators ....................................................22
MoEF the Nodal Body for SD...............................................................22 Concerns .........................................................................................24
Energy Related Developments ......................................................25

HELIO International / India
6
Current Situation ..............................................................................25 Figure 2:Fuel Mixes (2001-02) and Projected Scenario (2021-22) ..................26
Power Sector Reform.........................................................................28 New Energy Policy.............................................................................31
Table 12:Scenario for Fuel Mix in Year 2031-32 (MMTOE) .............................32 Concerns .........................................................................................38
Environmental Sustainability ........................................................39
Indicator 1: CO2 Emission kg/capita....................................................39 Table 13:CO2 Emission kg/capita...............................................................40
Indicator 2: Most Significant Energy-related Local Pollutants ..................40 Table 14:Air Pollution µg/m3 (Residential) ..................................................41
Social Sustainability ....................................................................42
Indicator 3: Household Access to Electricity .........................................42 Table 15:Household Access to Electricity.....................................................42 Table 16:Distribution of Households by Source of Lighting 2001 ....................43 Case Study 4: Low-cost Lamps for Rural India..............................................44
Indicator 4: Investment in Clean Energy..............................................45 Table 17:Investments 1990-91 and 2002-03...............................................45
Economic Sustainability ...............................................................45
Indicator 5: Energy Resilience: Energy Trade Benefits ...........................45 Table 18:Consumption and Imports of Petroleum and Petroleum Products (million tones) .........................................................................................46 Table 19:Non-renewable Commercial Energy (including hydro from big dams) (mtoe) .........................................................................................47
Indicator 6: Burden of Public Energy Investments.................................47 Table 20:Public Investment in Non-renewable Energy...................................47
Technological Sustainability .........................................................50
Indicator 7: Energy Intensity (Energy Consumption/GDP)......................50 Table 21:Energy Intensity .........................................................................50
Indicator 8: Renewable Energy Deployment .........................................51 Table 22:Total Primary* Energy Consumption (MTOE) ..................................52 Table 23:Total Primary Commercial Energy Consumption (MTOE) ..................52 Table 24:Net Geothermal, Solar, Wind, Wood and Waste Electric Power Generation (billion kwh)............................................................................52 Table 25:Electricity from Renewable Sources...............................................52 Table 26:Electricity Generation (billion kwh)................................................53 Table 27:Renewable Energy* as % of Primary Commercial Energy.................53
Indicators Results .......................................................................54
Table 28:Indicators ..................................................................................54 Presentation of Country Star ........................................................55
Figure 3:Star with scale 0 � 5 ..................................................................55 Figure 4:Star with scale 0 � 3 ..................................................................56

HELIO International / India
7
Conclusions and Policy Recommendations......................................57
Bibliography...............................................................................57 Annex 1.....................................................................................60
Table 29:Rates of Energy Consumption ( Mj per pkm) and Emission of Pollutants (in g per pkm) for Passenger Traffic (2000-01) ............................................60 Table 30:Rates of Energy Consumption (Mj per pkm) and Emission of Pollutants (in g per pkm) for Freight Traffic (2000-01) ................................................61
Annex II ....................................................................................61
Table 31:Capital Costs and Typical Cost of Generated Electricity from Renewable Options .........................................................................................61

HELIO International / India
8
Executive Summary India is the 7th largest country of the world with an area of 3.29 million sq km. It is one of the densely populated countries of the world with a population of over 1 billion. Though agriculture contributes less than 24% of the GDP, it employs the maximum working population of the country. The economy is growing at a rate of over 8%. India – a nuclear power –is considered as one of the fastest growing markets of the world. The Ministry of Environment and Forest (MoEF) is entrusted with the issues relating to sustainable development. Although the Planning Commission of India has outlined human development goals for the next five to ten years, that are more ambitious than the UN Millennium Development Goals (MDG), it is unlikely that the government with meet the associated objectives. The demand for energy is growing very fast. Dependence on imported petroleum is also very high. To meet the increasing energy demand and to ensure energy security the government, in 2005, formed a high level Energy Co-ordination Committee (ECC). The committee recently issued a draft report with specific recommendations for how to meet future energy demands. For the first time since India’s independence the draft report tried to address the country’s energy issues from a holistic prospective and develop an energy policy that reflected the aspiration of an independent country. The study reveals that from 1990 to 2002 India failed to achieve any noteworthy progress in the management and development of its energy sector, especially in the areas of cleaner and renewable energy. Moreover, water, air and land pollution has increased significantly. The absence of a holistic energy policy and increasingly greater reliance on road transportation are worsening the situation. More funds need to be allocated to rapid upgrading and expansion of India’s railway infrastructure. Imposition of increased road taxes for transport vehicles appears necessary. To ensure the effective use of renewable energy sources, which has tremendous potential in a vast country like India, a ‘passionate intent’ from the leadership is urgently required. The public sector oil distributing companies such as Indian Oil Corporation Ltd. and Hindustan Petroleum Corporation Ltd., which have huge distribution network all over the country including in the remotest villages, should be asked to distribute renewable energy items like solar lanterns, solar panels etc. In line with the Telecommunication Mission of 1980s, Energy Technology Missions on (i) coal technology; (ii) solar technology; (iii) bio fuels; (iv) bio mass plantation; and (v) community biogas plants should be implemented immediately.

HELIO International / India
9
General Discussion of the Country Land area India is the seventh largest country in the World with an area of 3.29-million sq.km. It is surrounded by three oceans to the east, west and south. The Himalayan mountain range guards the north. Apart from its 7000 km coastline, India shares the longest land border with Bangladesh China, Pakistan, Nepal, Burma and Bhutan. India is also a land of rivers. Twelve major rivers cover 75% of the catchment’s area of the country.1 India is richly endowed with mineral resources including include fossil fuels, ferrous and non-ferrous ores, and industrial minerals. There are approximately 20000 known mineral deposits in the country and as many as 87 minerals (4 fuels, 11 metallic, 50 non-metallic, 22 minor minerals) are being exploited. The country has abundant reserves of bauxite, coal, dolomite, iron ore, manganese, limestone, magnesite and adequate reserves of chromite, graphite, lignite, and rock salt. Arable land More than 54% of India’s total land mass is arable and has 590,000 sq km under irrigation. Principal crops include paddy, wheat, and pulses. Forests India’s has 63.73 million forested ha (19.39 of geographical area), including 37.74 million ha (11.48%) dense forest, 25.5 million ha (7.76%) open forest and 0.49 million ha (0.15%) mangroves. 16 major groups comprising 221 forest types are found. Biodiversity 45,000 plant species (including 6% of the world's flowering plants) have been identified. Of these, a third of the 15,000 flowering plants are endemic to India. Of the 81,000 identified species of animals in the country, 14% of its 1,228 bird species, 32% of its 446 reptiles and 62% of its 204 amphibians are native. The country also has 330 species of mammals. Two of 18 internationally recognized biodiversity hotspots are the Eastern Himalayas and Western Ghats.2
Animal Husbandry The growth in this sector in the last two decades, as Table 1 illustrates is very impressive.
1 MoEF,2002 2 MoEF, Agenda 21

HELIO International / India
10
Table 1: Production of Major Livestock Products and Fish Year Milk
(Million tones) Eggs (Million tones)
Fish (Thousand tones)
1980-81 31.6 10060 2442 1990-91 53.9 21101 3836 2002-03 86.7 39823 6200 Source: MoF (GOI), the Economic Survey, 2004-05.
Population as of November 2005 India’s population is 1.08 billions. Of this, 31.2% is aged below 14 years, 63.9% is between 15-64 years and the remaining 4.9% are senior citizens (65 years and older). Unlike some developed countries where the percentage of senior citizens are relatively higher, India has a a greater number of people in the working age group with a strong numbers of younger group ready to join the working population. The estimated current growth rate of the population is 1.4%.3 Urbanization As per 2001(the latest) Census Report, 25.73% population of India lives in urban towns and cities; the remaining 74.27% live in villages. Literacy and Education By 2003, only 59.3% of the population could read and write; of this 70.2% was male and 48.3% female. Apart from indicating a very low level of literacy, the above figures also reveal the gender and rural- urban divide in Indian society.4 Table 2: Percentage of Literates & Literacy Rates 2001 Persons Males Females
Total 52.21% 64.13% 39.29% Rural 44.69% 57.87% 30.62% Urban 73.08% 81.09% 64.05 Source: Census of India, 2001
Economic Conditions
After economic reform in early 1990s, the economy has grown at faster rate of approximately 6%. Currently the growth rate stands at just over 7%. Increased economic performance has reduced the incidence of poverty by raising over 10% of the population above the poverty line. (The percentage of the population below the poverty line declined from 44.48% in 1983 to
3 Office of the Registrar General, GoI 4 HDR, 2005

HELIO International / India
11
35.97% in 1993-94 and to 26.10% between 1999 and 2000.). However, nearly 25% of the population, which in absolute terms exceeds 250 million people, are still below the poverty line meaning that they are unable to meet the basic requirements of food, cloth and shelter. The public distribution system, which is now managed through the open market mechanism, has failed in the distribution of food grains. Though food has increased substantially over the last four decades, death by starvation, mainly in tribal areas, is frequently reported in newspapers. India’s GDP in 2002 was: Agriculture (23.6%), Industry (28.4%), Services (48%).5 Table 3: Growth in GDP Year GDP at factor cost
(at 1993-94 price) (Rs.in billion)
Population (Nos. billions)
Per Capita GDP (Rs.)
1990-91 6928.71 0.839 8258.29 2002-03 13183.62 1.055 12496.32 Source: The Economic Survey, 2004-05, CMIE, and Monthly Review of Indian Economy, June 1999, and September 2005.
Principal Imports and Exports (energy and non-energy) Despite immense media hype regarding export potential, India’s share (2005) in the global trade was less than 1% (0.8%). Though India now enjoys a positive balance of payments, its trade balance is still negative. However, in percentage terms, this gap is narrowing (see Table 4). Among the principal imports, petroleum-crude accounts for the largest share. With regards to exports, manufactured goods enjoy the maximum share. In a global production system dominated by transnational corporations (TNCs), much of these manufactured exports are intra-subsidiary transfers. Among the other export items, software exports showed remarkable growth; between 1993-04 and 2003-04, the average growth rate of software export was 40%.6
5 CIA, 2005 6 The Economic Survey, 2004-05, *http://www.sed.manchester.ac.uk/idpm/research/is/isi/isiexpt.htm visited on 19.2.06

HELIO International / India
12
Table 4: Major Imports and Exports (US $ Million) Principal Items Imported 1990-91 2002-03
Petroleum, oil and lubricant 6028 17640 Edible Oil 182 1814 Fertilizers 984 542 Chemicals Elements and compounds 1276 3477 Plastic Material etc. 610 782 Pulp and Waste paper 255 343 Pearls, precious and semi-precious stones, 2083 6063 Iron and Steel 1178 888 Non-ferrous metals 614 5621 Capital Goods 5833 7405 Total Import (includes all items) 24075 61412
Principal Items Exported 1990-91 2002-03
Agricultural and allied products 3521 6962 Ores and minerals (excl.coal) 834 1568 Manufactured goods 13229 41070 Mineral fuels and lubricants (incl. Coal) 528 2707 Software* 131 7550 Total Export (includes all items) 18143 52719 *http://www.sed.manchester.ac.uk/idpm/research/is/isi/isiexpt.htm visited on 19.2.06 Source: The Economic Survey, 2004-05,
The exchange rate over the past few years was by and large stable. The average exchange rates of Indian rupees per US dollar in 2000 were Rs 44.942 in 2000 and had an average rate of Rs 45.317 in 2004. 7
Impact of Globalization The Indian economy has never been a closed economy. It has had strong links with the global economy for over two thousand years. Before British colonial rule, India enjoyed a dominant share in global trade. Indian spices and textiles earned premium price in the international market. In post-British India the globalization process was accelerated after 1991. It coincided with the structural adjustment process, i.e. the liberalization process that the country had to initiate as a precondition of the IMF loan that the government had to negotiate to avoid a foreign exchange crisis due to sudden increase in crude price after the gulf war of 1990. The impacts of globalization has been mixed. Some sectors of the economy and a few sections of the population have benefited from it. Though the economy has grown at 4% per annum during from 1990 to 2003 (compared to 3.3% from 1975 to 2003), a large section of population has suffered. A key features of India’s economic growth in the 1990s was the decline of “employment elasticity” (employment generated per unit growth of output). While the employment elasticity of the 1980s and early 1990s was 0.5, it
7 CIA,2005

HELIO International / India
13
decreased to 0.16 in the late 1990s. The higher capital intensity of economic growth due to globalization and competitive pressure were responsible for this.8 The net effect was increased layoffs and closure of uncompetitive production units. Pressure on the government to privatize public utilities has been increased.
Income and Equity Though the GDP growth rate has been impressive, the HDI rank has deteriorated despite scoring a better HDI value. Table 5: Human Development Index (HDI) HDI 1990 2002 2003
Value 0.297 0.595 0.602 Rank 121 127 127 Source: Human Development Report, 1992, 2004, 2005.
Inequality in India exists in many forms. In addition to the economic and rural urban divide, gender discrimination is a social evil that still persists. In 1999 the share of income enjoyed by 20% of the poorest and the 20% of the richest Indians were 8.9% and 43.3% respectively. Previous year data (1998) on maternal and child health indicates a worsening situation. In 1998 alone in only 16.4 % cases did skilled health personnel assist at childbirth of those women were in the poorest 20% section of the population. The corresponding figures were 84.4% for the richest 20% of the population. The ratio of the estimated female and male earned income was 0.38 9
Energy Usage The share of oil and gas has declined during over the past decade; the share of non fossil fuel has increased (see Table 6). Table 6: Share of Different Fuel- Mix Energy Type 1960-61 1990-91 2001-02
Coal 74.1 39.0 34.65 Oil & Gas 20.9 43.4 30.65 Non –Fossil Fuel 5.0 17.6 34.70* * The major components of the non-fossil fuel are: nuclear (1,18%) and renewable total (33.52%). The later consists of hydro (1.73%); biomass (31.76%); wind (0.03%); solar and bio fuel (negligible). Source: GOI, Planning Commission, 8th Five Year Plan, Vol2; MNES New and Renewable Energy Policy, Draft II, 2005
8 Venkitaramanan,2002 9 HDR,2005

HELIO International / India
14
Table 7: Production and Consumption of Energy (2003-04) by Sector and Source
Availability (MMTOE) Consumption (MMTOE) Sector/ Source
Domestic Net Import
Total Power Generation
Loss/ Self Con sumption
Household Agriculture Transport Industry (includes Non-energy uses)
Services
Fuel (Commercial)
328.00
Coal & Lignite
170.35 14.00 184.35 131.61 0.00 0.55 0.00 0.00 52.19 0.00
Oil & Products
33.38 82.62 116.00 6.96 8.24 19.37 7.76 34.02 19.75 19.90
Gas 27.65 0 27.65 10.02 4.38 0.08 0.12 0.52 12.53 0.00 Non-fuel (Commercial)
8.29
Hydel 6.47 Wind 0.29 Nuclear 1.53 Non Commercial
155.89
Fuel wood 115.44 92.57 22.87 Agro Waste 17.12 17.12 Dung Cake 22.62 22.62 Bio-gas 0.71 0.71 Grand Total 395.56 96.62 492.18
Source: Planning Commission, 2005.
Electricity During 2003-04, 45.63 MTOE of electricity were generated in India. Figure 1 graphically illustrates this generation and consumption Figure 1: Electricity Production and Consumption (2003-4)
Source: Planning Commission, 2005
Source: Planning Commission, 2005
70%
14%
1%
11%
1% 3%
Thermal
Hydel
Oil
Gas
Wind
Nuclear17%16%
2%
23%
33%
9% Self Consumption/Loss
Household
Agriculture
Transport
Industry
Services
>
45.63 MTOE 45.63 MTOE

HELIO International / India
15
The Economic Survey, 205-06, reveals that the power shortage that occur around 12% in peak and 8% on average is equivalent to Rs 15,000 crores of foregone generation and associated GDP loss of Rs 300000 crores.10
Principal Environmental Pressures Deforestation, soil erosion, desertification, air pollution from industrial effluents and vehicle emissions, water pollution from arsenic, raw sewage runoffs of agricultural pesticides are some of the important environmental issues which demand immediate attention. Table 8: Greenhouse Gas GHG(CO2 equivalent) 1994 1,228,540 Giga gram Per Year (Gg) Per capita GHG (1994) 1.3 tones Main Constituent of GHG (1994) CO2 (65%), CH4 (31%), N2O (4%) Main Contributors of GHG Energy Sector 61%. Agriculture 28%,
Industrial Process 8%, Waste 2%, Land Use and Land Use Change and Forestry (LULUCF) 1%
Source: MoEF, (June 2004), India’s Initial National Commitments to the United Nations Framework Convention on Climate Change, Govt. of India.
Electronic waste has become a new environmental menace. India generates around 1,050 tones of electronic scrap each year. A Silicon Valley Toxics coalition report predicts that 500 million computers will become obsolete by 2007 resulting in 6.32 billion pounds of plastic and 1.58 billion pounds of lead. 50% to 80% of US e-waste collected for recycling is sent to Asia- mainly to China, India, and Pakistan. A recent report on this suggests that e-waste recycling has become a lucrative business. However toxic materials like lead, cadmium, mercury etc., make e-waste a health hazard. 11 Case Study 1: Clemenceau In February 2006, the Indian government under pressure from toxic waste disposal lobby and ship breaking industry failed to take any categorical stand against allowing the condemned French warship Clemenceau to enter Indian waters. The ship allegedly carrying toxic waste was heading towards a ship-breaking yard on the Indian shore. Though the Indian government failed to take any bold stand, environmental activists across the globe including India protested against such move by the French government. The European Union has also started an investigation regarding France’s decision and is considering legal proceedings. Under global protest, the French government has recalled the war ship. Source:Bidwai,2006; http://www.expressindia.com/fullstory.php?newsid=62908#compstory
10The Times of India, 28.2.06 11The Economic Times, 14.12.2004

HELIO International / India
16
Industrial Accidents and Natural Calamities Two major accidents in oil fields in the mid 2005 - one at offshore platform of Bombay High, the major source of indigenous crude and another in an abandoned oil field in Dibrugarh district of the State of Assam. Both accidents have seriously polluted the environment. In December 2004, a major natural calamity struck the coasts of South-east Asia. This devastating tsunami killed nearly 11,000 lives in India while over 6,000 remain missing. It destroyed worth $1.2 billion worth of property. Several hundred fishing fleets were also destroyed. 12 Water and Sanitation In 1990, only 12% population of India had sustainable access to improved sanitation. In 2002, this figure rose to 30%. During the same period, the percentage of the population with sustainable access to improved water source was 68% and 86% respectively.13 The per capita availability of fresh water in the country has dropped from an acceptable 5,180 cubic meters in 1951 to 1,820 cubic meters in 2001. It is estimated that this will drop to 1,340 cubic meters by 2025 and to 1,140 cubic meters by 2050. This is alarming as the threshold per capita value for water stress is 1,000 cubic meters. India, with 16% of world’s population has only 2.5% of the world’s land resources and 4% of the fresh water resources. Agriculture has emerged as the worst depleter and polluter of water as new methods of farming with hybrid seeds and high usage of chemical fertilizer increases regulated water use by a factor of ten, leading to groundwater withdrawals beyond recharge capacity, thus driving the push for large dams and intensive irrigation projects. Arsenic contamination of ground water is another major problem. Pollution by agrochemicals has contaminated many drinking water sources. The recent scandal of pesticide residues in soft drinks highlights the scale of water contamination14. The combination of overuse and pollution has caused a severe crisis.(Shiva, 2004) Between 1970-71 and 2002-03, application of pesticide in agriculture increased from 24,320MT to 48,350 MT. In this period the total pesticide used in India amounted to 18, 39,121.62 MT a portion of which polluted both ground and surface water.15 Social Resistance As awareness about protecting the environment has increased among the citizens there has been an increase of organized resistance against degradation of environment (see Case Study 2) and clandestine dumping of hazardous wastes (see Case Study 1) around the country.
12 CIA 13 HDR,2005 14 www.cseindia.org 15 Directorate of Plant protection and Quarantine, Faridabad, India; Ref web site of NIPM

HELIO International / India
17
Case Study 2: Vedanta Alumina Company
Vedanta Alumina Company developed a $800 million project at Niyamgiri bauxite reserves (in remote Orissa) to dig for high quality bauxite, used in the manufacturing of aluminum. The project site was the home of several vulnerable animal species. In addition, this area was inhabitant by the critically endangered Dongaria Kondh tribe. The area is part of Kalahandi- India’s poorest district, infamous for starvation deaths. The local people along with few environmental groups protested against bauxite mining and in response the Indian Supreme Court, in 2002, set up a Centrally Empowered Committee (CEC), a quasi-judicial body, to look into forest and environment issues. Recently CEC submitted their report to the Supreme Court. In the report the CEC called the MoEF to task for granting environmental clearance for the project in September 20004 on the assumption that no forestland was involved in the project, which proved untrue.
Source: The Telegraph, 27/11/2005, Kolkata
Relocation of Dirty Industries As environment-related regulations in developed countries are becoming more stringent, many transnational firms are now shifting their dirty industries to capital-starved, developing countries like India (see Case Study 3) Case Study 3: Mitsubishi Chemicals in India In the late 1990s Mitsubishi Chemical Corporation (MCC) decided to open in China or in India a new plant for the production of purified terapthalic acid (PTA) – a highly toxic chemical. India was selected for the expansion of their PTA production capacity. MCC PTA India Corporation Pvt. Ltd.(MCPI) - the subsidiary of MCC - started its Indian operation in April 2000. The plant has been set up at Haldia a port town in the state of West Bengal) with an initial production capacity of 3.5 lakh tpa. As the raw materials for the Haldia PTA plant were sourced from Singapore and Thailand, logistically it made sense to locate the plant on the east coast. The factors influencing the choice of Haldia as a destination were easy availability of land and industrial water, good port facilities for handling liquid cargo and availability of skilled resources. There was also strong support from the State Government. The plant was set up with an investment of Rs.1, 475 crores making it one of the biggest Japanese investments in the country. MCC holds a 66% stake in the Indian outfit while Mitsubishi Corporation has 9 per cent stake. Four other Japanese firms – Nissho Iwai Corporation, Tomen Corporation, Marubeni Corporation and Sumikin Bussan Corporation – hold 8%, 5%, 5% and 2% respectively. It operates on MCC licensed technology. Due to increased demand, MCC PTA had increased the production capacity within two years from 3.5 lakh tpa to 4.70 lakh tpa. MCC had also planned to set up a 5 lakh tpa plant in China by 2005.

HELIO International / India
18
Source: The Hindu, 10.1. 2006; The Hindu Business Line, 7.8.2002; The Financial Express, 23.11.2004; Business Week on line, 8.1. 2001
Transport System Rail and roadways (almost entirely managed by the state) are the backbone of transport system for both passenger and cargo movement in India. These systems are supplemented by aviation and water transport systems. The aviation sector is growing while the water transport system, although very cheap in comparison to air, is declining. Twelve major rivers and hundreds of canals and small rivers crisscross India. Prior to the British raj, waterways were the backbone of India’s transport system. Rail bridges destroyed the system as larger boats could not negotiate the columns used to construct the rail bridges and which span the breath of the river. Unlike in Europe and other Western countries where hanging bridges were built across the rivers to facilitate the movement of boats and steamers, in India huge columns were used. The only exception was the famous bridge on the river Hoogly connecting Howrah with Kolkata. This was mainly done to allow movement of big ships, which entered the Calcutta port. Shift from Rail to Road In India, the British built the primary railway infrastructure to rapidly transport their raw material to the nearest seaport for outward shipment to Europe to feed the fast growing manufacturing sector. Though it permanently destroyed the traditional time tested water transportation system, an efficient railway network was developed in India. Unfortunately the governments of the independent India have not capitalize on it. Instead they had shifted their priority from low-cost, low-polluting railway transportation to high-cost, high-polluting roadways. In 1980, the National Transport Policy Committee noted the cost and energy efficiencies of the rail mode and recommended measures to increase its share in total traffic. However, road-based transportation in India had continued to grow at the expense of rail. The national modal split between rail and road (in percentage terms) in 2000-01 was estimated at 26:74 for freight movement and 18:82 for passenger movement. The share of rail is projected to decline further still. Tables 9 and 10 support this observation.
In January 2006, the Board of Directors of Mitsubishi Chemicals Corporation (MCC) approved an expansion of the company’s pta production facility at Haldia. This new line entails an investment of Rs.1665 crore, creating an annual capacity of eight lakh tones. Once the expansion project is completed (targeted date is June 2008), the Haldia facility will become a major pta production center in the world. In 2004, MCPI was awarded with the Environment Excellence Award for Industry sector. The West Bengal Pollution Control Board (WBPCB) and Indian Chamber of Commerce (ICC) jointly instituted the Award in 2002.

HELIO International / India
19
Table 9: Indian Railway 1970-71 1980-81 1990-91 2002-03
Route Kilometers (000’) 59.8 61.2 62.4 63.1 Electrified (000) 3.7 5.3 10.0 16.3 Goods carried (billion tonne-km) 110.7 147.7 235.8 353.2
Table 10: Indian Roadways 1970-71 1980-81 1990-91 2001-02
Total length of Road** (000’) 915.0 1485.4 1998.2 2483.3 National Highways (000) 24.0 31.7 33.7 58.1 Number of Regd. Vehicles (000) 1865.0 5391.0 21374.0 58863.0 **Excluding around 9 lakhs km of Rural Roads. Source: The Economic Survey 2004-05
The above tables show that between 1970 and 2002, negligible kilometers were added to the railway system while the highways and vehicles grew by over 125%. Super-highways are being built across India as part of the globalization agenda. However the price people are paying for expressways and super-highways in terms of the social and ecological costs outweigh the benefits a handful of elite are gaining by speedier road travel. The government has amended the Land Acquisition Act for acquiring land for highways; this land is then privatized. Legislation on the Control of National Highways for prevention of encroachment, traffic regulation etc., on national highways has been enacted. Highways encourage the shift from sustainable methods of transport such as water and rail to non-sustainable movement of goods and people via roads. The Golden Quadrilateral is a major initiative in this road to progress initiative. Dedicated in December 2003 this mammoth project attempts to fulfill the quest for connectivity. Combined with the North-South, East-West corridors (due to be completed in December 2007) the project, christened the National Highways Development Project (NHDP) has a budget of Rs.54, 000 cr. and will extend 13,151 km. Impact on Environment A study was carried out at J. N University, New Delhi, to compare the energy and environmental impact of the rail and road transportation. The result of the base year 2000-01 was presented (see Annex I) as an indication of the relative impact of the two modes. The findings were:
• if freight movement and passenger movement via road by a combination of car and bus were considered, the rail mode was always superior in terms of energy efficiency;

HELIO International / India
20
• for almost all greenhouse gases (the exception being CO2), rail exhibited a lower emission rate. Emissions of SO2/SOX were lower for rail vis-à-vis passenger movement by car/bus combination; and,
• rail was the superior form of transport for the movement of freight.
An additional exercise was carried out to look into the effects of substitution of gas for coal at thermal power plants. Emissions attributable to the consumption of electricity by the rail come down drastically and rail became environmentally less damaging vis-à-vis emissions from road travel. The policy recommendation resulting from the study promoted transportation via rail mode over road especially in the interests of sustainable intercity transport. 16 Fuel Savings A recent study by Planning Commission revealed that transporting commodities through railways saves substantial amount of fuel. In addition to cutting transportation cost and reducing dependence on crude imports, reduced fuel consumption means reduced toxic gas emissions as well. The share of railways in total tonne kilometer of goods traffic fell from 70% in 1970-71 to 39% in 2003-04. Had the railway carried 70 percent of the goods traffic, it would have carried 300 btkm of additional traffic. Assuming that diesel was used and that rail carried all of these goods, the diesel saved from 2003 to 2004 would have been approximately 5 MMT out of a total consumption of 40 MMT in the country that year. Thus significant savings of diesel is possible if railways operations can be upgraded to win back the haulage lost to road traffic.( Planning Commission , 2005,Draft Report of the Expert Committee on Integrated Energy Policy, New Delhi.) Safety Issues Road transport is 20 times more accident prone than rail transport.17Road accidents have emerged as “Killer No.1” in India accounting for 37% of all accident-related deaths. In US two people per 100,000 die due to road accidents, in Pakistan the figure is 32.5 and in India 140 per 100,000. According to the Institute of Road Traffic Education around 230 deaths and 3, 5000 injuries occur daily on India’s roads.18 In a Asian Development Bank (ADB) sponsored study, it is noted that if Southeast Asian nations don’t start taking road safety seriously, there will be 385,000 road deaths and 24 million injuries over the next five years, incurring more than US$88 billion in economic losses. Some 75,000 persons were killed and more than 4.7 million were injured in road crashes in Southeast Asian countries during 2003, with many victims being severely disable. Annual economic losses from road crashes are estimated to be around $15 billion, or 2.2% of the region’s total gross domestic product. The
16 Chaudhury, 2003 17 Shiva, 2004a 18 Shiva, 2004b

HELIO International / India
21
percentage of GDP lost annually through road accidents ranges from 0.5% in Singapore to 3.21% in Cambodia, averaging out at 2.23% for the region. Indonesia loses the most in money terms, amounting to $6.03 billion per year (or 2.91% of annual GDP), followed by Thailand at $3 billion (2.1% of GDP). Road crashes are a growing problem worldwide, resulting in around 1 million deaths and more than 23 million injuries annually, the draft strategy says. Around 85% of these deaths occur in developing countries.19 In the budget session of the parliament (February 16, 2006), India’s President mentioned about Rs 20,000 crores investment for rail freight corridor in his address. The corresponding figures for investment in national highways were Rs 1, 75,000 crores. When the above high social and ecological costs are taken into account, the exclusive and obsessive focus on building super highways is not in the nation’s interest. What India needs is pluralism in transport and mobility with the pedestrian, the cyclist, the bullock cart, the rickshaw, the two wheeler given equal ecological space and democratic space for ensuring mobility for all, not just the car owning elite.
Overview of the National Sustainable Development Strategy Indian Philosophy The notion of 'sustainable development’s is not new to India. Through the preaching of great saints like Mahavir, Buddha, Ashoka20 and Gandhi, the concept of sacrifice for others became the integral part of the oriental philosophy. The Sufis and Moulanas (Muslim religious leaders) have also contributed to this Indian (and oriental) philosophy of overcoming greed and desire. The inherent strength of this philosophy has helped the Indian civilization survive and thrive over five thousand years without invading or colonizing other countries. Though in its long history although being invaded many times, only the British - via the introduction of western science – were able to impact the the lifestyle and production system of this old civilization. Western science taught key sectors of the Indian population how to exploit and dominate nature; pre-British India believed in co-existence with nature where agriculture, production system, transportation, social and religious events were all planned as per the weather cycles. Oriental science respected nature. But modern science has taught how to mine coal and crude, build bridges and dams, pump out underground water to produce hybrid grains during off-season, genetically modify plants etc. Within two hundred years of the application of these forms of new knowledge, a country with five
19 ADB, 2004 20 Ashoka was the great emperor who left his kingdom after winning the Kalinga war and became a disciple of Buddha.

HELIO International / India
22
thousand years of sustainable existence (without any record of large scale famines prior to British rule) is now desperately searching for a viable model of sustainable development to rescue itself from the current environmental (also economic) mess. Table 11: India’s Development Indicators Indicator Value
Human Development Index 2003(rank) 0.602 (127) Human Poverty Index 2003 (rank) 31.3% (58) Environmental Sustainability Index, 2005* 45.2 (101) GHG Emissions 1994 1,228,540 Giga gram (Gg) per year;
1.3 tons per capita GDP and GDP per capita (2002-03) Rs 13183.62 billion, Rs12496.32
* Source: http//www: yale.edu/esi/
MoEF the Nodal Body for SD The Ministry of Environment and Forests, Government of India (MoEF), is primarily concerned with the implementation of policies and programmes relating to conservation of the country’s natural resources including lakes and rivers, its biodiversity, forests and wildlife, ensuring the welfare of animals and prevention and abatement of pollution. While implementing these policies and programmes, the Ministry is guided by the principle of sustainable development and enhancement of human well being as outlined in Agenda 21. Agenda 21 (which emerged from the Earth Summit in 1992) reflects a global consensus and political commitment at the highest level about development and environment cooperation. It also provides a major re-affirmation of a number of traditional values inherent in the Indian culture The Ministry serves as the nodal agency in the country for the United Nations Environment Programme (UNEP), South Asia Co-operative Environment Programme (SACEP), International Centre for Integrated Mountain Development (ICIMOD) and for the follow-up of the United Nationals Conference on Environment and Development (UNCED). The Ministry is also entrusted with the issues relating to multilateral bodies such as the Commission on Sustainable Development (CSD), Global Environment Facility (GEF) and of regional bodies such as the Economic and Social Council for Asia and Pacific (ESCAP) and the South Asian Association for Regional Co-operation (SAARC) on matters pertaining to environment.21 The broad objectives of the Ministry are:
1. conservation and survey of flora, fauna, forests and wildlife; prevention and control of pollution;
2. afforestation and regeneration of degraded areas;
21 MoEF 2002

HELIO International / India
23
3. protection of the environment; and, 4. ensuring the welfare of animals.
These objectives are well supported by a set of legislative and regulatory measures aimed at the preservation, conservation and protection of the environment. Besides legislative measures, a National Conservation Strategy and Policy Statement on Environment and Development and Development (1992), National Forest Policy (1988), a Policy Statement on Abatement of Pollution (1992); Biodiversity Act (2002) and a National Environment Policy (2005) have also been developed. In addition to these, to conserve petroleum products, the Petroleum Conservation Research Association (PCRA) was set-up in 1978 by Ministry of Petroleum and Natural Gas (MOPNG). The Bureau of Energy Efficiency was established under the Energy Conservation Act in 2001 and effective 1st March 2002 is now under the Ministry of Power (MOP). The mission of BEE is to develop policies and strategies on self-regulation and market principles within the overall framework of the energy Conservation Act with primary objective of reducing energy intensity of the Indian economy. The Seventh Conference of Parties (COP-7) to the UNFCCC decided that Parties participating in CDM should designate a National Authority for the CDM. Accordingly the Central Government has constituted the National Clean Development Mechanism (CDM) Authority 22for the purpose of protecting and improving the quality of environment in terms of the Kyoto Protocol.23 Goals In the Tenth, Five Year Plan (2002-2007), the Planning Commission has outlined India’s human development goals and targets. Most of these are related to and are more ambitious than the UN Millennium Development Goals (MDG). These are:
• to reduce the poverty ratio by 5 percentage points by 2007 and by 15 percentage points by 2012;
• to provide gainful and high-quality employment at least to the addition to the labour force over the Tenth Plan period;
• to ensure that all children are in school by 2003 and that by 2007 all children complete 5 years of schooling;
• to reduce the gender gaps in literacy and wage rates by at least 50 per cent by 2007;
• to reduce the decadal rate of population growth between 2001 and 2011 to 16.2 per cent;
• to increase in literacy rates to 75 per cent within the Tenth Plan period (2002-03 to 2006-7);
• to reduce infant mortality rate (IMR) to 45 per 1000 live births by 2007 and to 28 by 2012;
22 National CDM Authority, Web:http://envfor.nic.in/cdm/cdm_india.htm 23 MoEF, Annual Report 2004-05

HELIO International / India
24
• to reduce maternal mortality ratio (MMR) to 2 per 1000 live births by 2007 and to 1 by 2012;
• to increase in forest and tree cover to 25 per cent by 2007 and 33 per cent by 2012;
• to provide all villages with sustained access to potable drinking water within the Plan period; and,
• to clean all major polluted rivers by 2007 and other notified stretches by 2012.24
Concerns 78% of the rural people and 30% of the urban population of India are still dependent on fuel wood and chips as their main fuel source. The dependence on fuel wood in rural areas implies that carbon sequestration or conservation cannot be achieved in isolation without fuel wood or integrated land use management or energy substitution policies. In CDM projects, if the use of common property resources is curtailed so as to ensure carbon conservation, it can have negative implications on the rural communities.25 Analyzing two CDM projects undertaken in India, Down to Earth (2005) commented that ‘sustainable development was not an important goal’ to such projects. The CDM Auditors put a high importance on proper ‘documentation of benefits’ rather than on the ‘actual benefit to the environment achieved through such projects’.26 Bio-piracy of genetic resources from India has become a reality. Although the Biodiversity Act 2002 aimed to check bio-piracy through regulating access to genetic resources and traditional knowledge by foreign institutions, it failed to protect biological resources from pirates. The granting of patent (May 2003) by the European Patent Office to seed TNC Monsanto on a hybrid Indian wheat variety is a case in point. Monsanto had patented a wheat invented by crossing a traditional Indian variety ‘Galahad’ with the ‘Nam Hal’ variety. Monsanto named the ‘new’ patented variety as ‘Galahad 7’.The patent also covered the dough made from the flour and all edible products made by cooking such dough. Gene scientists termed this act as a clear case of theft with the potential to block further breeding of high –quality varieties utilizing this heritage wheat seed. Condemning this, in a strongly worded statement, International Greenpeace said, ‘Monsanto is targeting and stealing from Indian farmers who have cultured this specific variety of wheat for centuries. This patent demonstrates the urgent need for a general legal ban on the patenting of genes, live organisms and seeds.’ 27 In summary, it is unlikely that the government with meet the development objectives outlined above. Three additional reasons support this claim.
24 UNDP,2005 25 Gundimeda,2005 26 Down to Earth, 2005 27 Srinivas, 2003

HELIO International / India
25
1. Between 1990 and 2002, India’s rank in human development has deteriorated from 121 to 127. In 1990-91, per capita consumption of cereals was 161.2 kg per year, which fell to 144.9 kg by 1998. Per capita availability of pulses too declined between 1991 and 2001 from 15.2 kg per year to 10.6 kg per year a drop of 30 percent.28 Interestingly, during this period, the production of food grain increased in India. This indicates a casual approach of the government to address the starvation and malnutrition problems.
2. In 1991, prior to the Earth Summit (1992), the government had
introduced an environment friendly labeling scheme – Eco-Mark – for sixteen different product categories. Indian firms did not bother to comply with those standards. There was also no government implementation.
3. Public expenditure on health as percentage of GDP in 1990 was as low
as 1.3%. After over a decade, in 2002 the figure remained same.
4. BEE was established in 2002 with noble mission and objectives. But BEE does not have a fulltime director and its staff strength as of September 2005 was only 4 professionals!
Energy Related Developments
Current Situation Per capita consumption of energy in India is one of the lowest in the world. India consumed 520 kg. of oil equivalent (kgoe) per person of primary energy in 2003 compared to 1090 kgoe in China and to the world average of 1,688 kgoe. The consumption in the US was 7835 kgoe per person. The per capita electricity consumption is also very low at 435 kwh. As the level of economic development is positively co-related to per capita energy consumption, the energy consumption figures in India are in line with its low per capita income.29 The total primary energy consumption in 2001-02 was 437.69 MTOE and the projected consumption in 2021- 22 is 890 MTOE. The fuel mix for 2001-02 was:
• coal (34.64%); • oil (24.55 %); • gas (6.10%); • nuclear (1.18%), • hydro (1.73%);
28 RUPE,2004 29 Planning Commission, 2005; MNES, 2005

HELIO International / India
26
• Biomass (31.76%); • solar, wind and bio-fuel (0.03%).
The corresponding projected figures for the year 2021-22 are:
• coal (28.09%); • oil (24.72%); • gas (14.04%); • nuclear (2.25%); • hydro (3.37%), • biomass (26.74%); • solar, wind, bio-fuel (0.78%)30
Figure 2: Fuel Mixes (2001-02) and Projected Scenario (2021-22)
Source: MNES, 2005
Primary Sources Consumption of petroleum products increased at the rate of 3.8% per annum during 2002-04. In 2003-04, excluding exports, India consumed 116.01MMT of crude oil products including refinery fuel. Domestic production of crude oil was between 30.3 MMT and 33.86 MMT. 72.2% of consumption was met through imports. In 2003-04, the proven reserve to production (R/P) ratio was only 22. In January 2005, India signed a long term deal for 7.5 million, metric tones/annum LNG from Iran, based on an indexed price (with a ceiling at oil of $31/barrel brent crude), which at today’s oil prices comes to the ceiling of $3.21/MMBTU FOB. Critics contend this to be expensive, especially when compared to Qatari gas, which was sold for some years at $2.53/ MMBTU FOB. 31
30 MNES, 2005 31 Tongia , 2005
2001- 02
34%
25%6%
1%
2%
32%
0% Coal
Oil
Gas
Nuclear
Hydro
Biomass
Wind ;solar;bio fuel
2021- 22
28%
25%14%
2%
3%
27%
1%
Coal
Oil
Gas
Nuclear
Hydro
Biomass
Wind ;solar;bio
fuel

HELIO International / India
27
Coal consumption increased from 140 million tonne in 1984 to over 400 million tonne in 2004 with the growth rate of 5.4%. Thermal power plants using coal account for 60% of India’s total generation capacity. Although ash content of Indian coal is high, sulphur content is low. Thus, Indian coal is relatively clean. Coal accounts for over 50% of India’s commercial energy consumption and some 78% of domestic coal production is dedicated to power generation. Since prices were de-regulated the sector has become profitably primarily as a result of price increases and the rising share of open cast production. Despite large reserve, low domestic production will increase the share of imports, which is negligible at present. The majority of Indians use traditional fuels such as dung, agricultural wastes and firewood as cooking fuel. These fuels cause indoor pollution. The National Sample Survey (NSS) 55th round (1999-2000) revealed that for 86% of rural households the primary source of cooking energy was firewood and chips of dung cake. In urban areas no more than 20% households relied on firewood and chips. Only 5% of rural households verses 44% of urban households use LPG. 22% of urban households and only 2.7% of rural households use kerosene for cooking. Other sources of cooking energy used by urban and rural households include coke and charcoal, gobar gas (gas produced out of cow dung), electricity and other fuels.32 Secondary Sources Over the last 25 years, India’s power capacity has risen at the rate of 5.87% per annum. The total supply of electricity has risen at the rate of 7.14% over the same period. In 2004-05 the average plant load factor (PLF) was 74.8%. Power shortage and low quality of power continue to plague the country. For the country as whole, aggregate technical and commercial losses, which include theft, billing & collection inefficiency, transmission and distribution losses, exceeds 40%. The Ministry of Power has set a target of adding a 100,000 MW of generation capacity by 2012. This capacity addition programme includes the 41,110 MW33 proposed to be added in the 10th Five Year Plan (2002-07). During 2004-05, the Central Electricity Authority completed preparations of the pre-feasibility reports of 162 schemes with an aggregate installed capacity of over 47000 MW under the 50000 MW hydroelectric initiatives.34 Nuclear power contributes a very nominal percent of energy to the total energy mix. But the latest deal35 with the US will help India gain international market access to uranium for its energy programme. The US business community has estimated a $100- billion worth new opportunities in India’s
32 Planning Commission, 2005 33 Revised to 34,024 MW (The Economic Times 28.2.06) 34 Planning Commission 2005 35 On March 2, 2006, India and USA have entered into a civilian nuclear deal where India promised to separate its civilian and military installations in return for uninterrupted supply of uranium and access to advanced nuclear technology to fuel growing energy needs.

HELIO International / India
28
energy sector. The Indo –US deal would likely to reduce India’s dependence on hydrocarbon.36
Power Sector Reform The State Electricity Boards (SEBs) were formed through the Indian Electricity [Supply] Act of 1948.The Boards have been charged to meet the social obligations of the party. However the alteration of how revenue was collected in order to garner key political support in elections as well as certain trade-union activities have made a mockery of the administration. The overall effect had been a creeping sickness, which has become more serious over the years. In 1998 the central government finally passed a Regulatory Commission Act to restore the economic viability of the Boards. The Electricity Regulatory Commission, theoretically independent of the government, was entrusted to fix the tariff in a rational manner so as to preserve/restore the financial health of the Boards. The Act permits aggrieved parties such as consumer associations or Chambers of industries to bring issues before the High Court or Supreme Court. At length after nearly three years of debate and deliberations and final revisions by the Parliamentary Standing Committee, the new Electricity Act, 2003 had been enacted in June 2003. The present Act is a comprehensive one and replaces all the three previous Acts of 1910, 1948 and 1998 governing the electricity industry in the country. This Act is intended to bring in a market orientated approach to the traditional regulated monopoly character of the electricity supply industry by incorporating certain conceptual changes (already in practice in some countries in Europe) such as power trading, open access and even parallel distribution network. These will make the generation totally deregulated, transmission partly regulated and distribution fully regulated. The proclaimed long-term objectives are (i) lower price due to competition, (ii) better quality of power, and (iii) wider consumer choices. As per the new Act, power trading within the state and interstate can be done directly between producer and consumer or through a third party. On the question of subsidy there is a strong disapproval of cross subsidy but if a state government wishes to grant subsidies it has to be paid in advance and not later. The Act permits multiple distributors operating in one area even with parallel lines. In promoting rural electrification the Act has made rural electricity supply free from any licensing process. Anybody can produce and sell electricity in rural areas and the state does not have any major say in this supply business.
36The Economic Times, 3.2.06

HELIO International / India
29
A Critique A study had shown that T&D losses, covering the usual technical losses and the unusual thefts, were higher in the states where law and order where inferior. Thus the parties in power are corrupt and run the Board administration accordingly. The systemic problems with the SEBs has stemmed from the corrupt political system. Under such a situation no amount of legislation can help – Electricity Act, 2003 is no exception. A strong political will and the proper enforcement of the existing electricity rules can improve the situation decidedly. Reforms are being introduced to bring in competition and to lower prices. Trading of power is also being introduced. But the reform experience in other countries – both in developed and developing – has established one simple fact; private operators are intent on maximizing profits and with the kind of regulatory mechanism that does not include strong public participation, consumers will have to pay higher prices. The commodification of electricity and its trading is the result of the global trend of increasing control of speculative capital and trade. The deregulation of generation is expected to bring in many private generators, most of them small. Being small in size, the cost of generation will be higher. A network or consortium of the generators will eventually result and if the distributors also extend their ownership, re-integration or re-bundling will be the most likely result. This had been the process in the early state of electrification in the US, in India and elsewhere. The unbundling of the SEBs in the country has lead to huge losses and consumer sufferings. The Act will give it an official stamp.37 The Economic Survey for 2005-06 informs that despite various reformist measures, the power sector is in mess. The growth rate of power generation has slowed down to 4.7% in 2005 from 6.5% in 2004. The commercial loss of SEBs’ has gone up to Rs.22, 569 crores in 2005-06 from Rs.22, 558 in 2004-0538 Alternative People’s Plan for Power Sector Reform In a recent article published in The Economic and Political Weekly (October 5, 2002), T L Sankar (TLS)39- an eminent energy expert proposed a People’s Plan for Power Sector Reform. This proposal was a ‘conceptual and methodological breakthrough and an outstanding example of strategy and policy formulation based on creative analysis’, as commented by Prof Amulya Reddy – a renowned energy expert. According to him, the power sector reforms were a failure because of “inadequate appreciation of the objectives of power sector reform”. Hence, to get it right, TLS adopted a normative goal-oriented approach with the objectives of availability, accessibility and
37 Basu, 2004 38 The Economic Times, 28.2.2006. 39 Shankar, 2002

HELIO International / India
30
affordability. The focus on poor households and irrigation pump sets was TLS’s starting point for re-designing power sector reform. 40 According to the proposed plan, from a purely socio-economic perspective, the ‘availability’ objective could be achieved by arranging supplies through three streams of generation:
1. the cheapest power generating stations meet agricultural and other socially relevant demands;
2. the demand of existing consumers (poor households and agriculture) above their entitlement would be met from the pooled power of utilities; and,
3. the emerging large demand would be met by new private/public/captive power stations through mutually arranged commercial contracts using the transmission/sub-transmission lines of utilities bearing pre-announced wheeling charges. In effect, such consumers would pay the marginal cost of power.41
This end-use/user orientation is the key to achieving the expansion of ‘accessibility’. It makes the People’s Plan for Power Sector Reform a fundamentally different approach compared to conventional frameworks. Traditionally, pump sets and poor households were the pariahs of the power sector to which the major financial problems of the sector are traced. By ignoring the needs of these pariahs, current World Bank-led reforms have become politically unviable with the result that they are unable to address the financial problems that they were implemented to solve. A crucial part of this partitioning of power generation is the assignment of separate generation systems for each sector. But this assignment is not random. The oldest and cheapest plants are dedicated to the below-entitlement agricultural pump sets and domestic connections, the remaining plants for the above-entitlement agricultural pump sets and domestic connections and for other existing consumers and the expensive yet-to-be built/completed plants are intended to meet the emerging large demands. By sorting the generation in this manner and dedicating it to the end-users/uses as mentioned, the below-entitlement agricultural pump sets and domestic end users/uses have the lowest average generation cost, the above-entitlement agricultural pump sets and domestic connections and other existing consumers have the next highest average cost, and the emerging large demand has the highest and rising cost of new plants, i.e. the marginal cost. Coining the word ‘demander’ as one who/which demands, in effect, what is being proposed is a ‘demander pays principle’ – analogous to the ‘polluter pays principle’ in environmental policy – so that those who exert small demands for power pay less than those who generate large demands.42
40 Reddy, 2002 41 Shankar, 2002 42 Reddy, 2002
HELIO International / India
31
The current pattern of World Bank-led reforms stresses the importance of partitioning or unbundling the integrated power sector into separate generation, transmission and distribution entities. In contrast, TLS has maintained the integration of generation, transmission and distribution, but separated the so-called ‘fuel cycles’ (for the flow of electricity from sources to end-users) so that the fuel cycle for agricultural pump sets and the domestic power needs of the poor is ‘insulated’ from the fuel cycles for the other existing customers and for the emerging demand of the ‘affluent consumer’ categories. In effect, what is proposed is a partitioning of the power sector into three separate power sectors that share a common transmission system: (i) a power sector A consisting of those agricultural pump sets and domestic connections of the poor and consume less than certain specified entitlements, (ii) a power sector B for the above-entitlement agricultural pump sets and domestic connections and all the other existing consumers, and (iii) a power sector C for emerging large demands. To demonstrate the feasibility of his people’s plan, TLS had taken the case of Andhra Pradesh and provided prima facie calculations that showed that a people’s plan is feasible and requires a lower government subsidy.43
New Energy Policy
The spiraling price of crude has prompted the government and the industry to focus on integrating energy policy and energy security. In 2005, the Prime Minister set up an Energy Coordination Committee (ECC) to formulate an integrated energy policy as different fuels can substitute each other in both production and consumption. As Alternative technologies are available there is substantial scope for exploiting synergy for energy system efficiency to meet requirement for energy services. If the energy system is to be efficient, policies have to look at it as an integrated system. As there are currently five separate Ministries (Coal, Petroleum and Natural Gas, Atomic Energy, Power and Non-Conventional Energy Sources) each concerned with its own mandate, policies are not always consistent, opportunities for inter-linkages and synergy are missing and sub-optimal solutions emerge. In December 2005, The Expert Committee on Integrated Energy Policy (noted hereafter as the Expert Committee) have submitted, a draft report on the same. 44 The final report is expected within next few weeks. The major findings of the draft report are:
• In order to ensure sustained growth of 8% through 2031, India would, at a minimum, need to grow its primary energy supply 3 to 4 times
43 ibid 44 Planning Commission 2005

HELIO International / India
32
and electricity supply 5 to 7 times in comparison to today’s consumption.
• By 2031-32 power generations’ capacity would have to increase to
778095 MW and annual cost requirement would be 2040 MMT. Meeting this vision would require that India pursues all available fuel options and forms of energy, both conventional and non-conventional, as well as new and emerging technologies and energy sources. Assuming an 8% growth rate, the Expert Committee has made ten different projections with varied energy mix combinations for the year 2031-31. In all the projections, the share of coal ranged between 65% and 42%, share of oil varied between 34% and 28%, gas had a share ranging between 12% and 7% while nuclear’s share could rise up to a maximum of 6%. See Tables 12 and 13 for two such projections. Table 12: Scenario for Fuel Mix in Year 2031-32 (MMTOE) (assuming 8% GDP growth) Scenario Description
Coal Dominant Case
% Renewable Dominant Case
%
Oil 467 28% 406 29% Natural Gas 114 7% 163 12% Coal 1082 65% 659 42% Hydro 5 0% 50 4% Nuclear 3 0% 89 6% Solar 0% 0% Wind 1 0% 0 1% Fuel wood 0% 5% Ethanol 0% Bio-diesel 1% Total 1672 100% 1383 100% Source: Planning Commission, 2005.
It is clear that coal shall remain India’s most important energy source until 2031-32 and possibly beyond. India will need to take a lead in seeking clean coal technologies and, given its growing demand, new coal extraction technologies such as in-situ gasification in order to tap its vast coal reserves that are currently difficult to extract (from an economic perspective) using conventional technologies. The committee has concluded that imported coal is far more cost-competitive than imported gas for power generation especially along the western and southern coasts of India. This preference for coal over gas is likely to continue for a while.

HELIO International / India
33
Relative prices play the most important role in the choice of fuel and energy form. They are thus the most vital aspect of an integrated energy policy that promotes efficient fuel choices and facilitates appropriate substitution. Lowering energy intensity of GDP growth through higher energy efficiency is also key to meeting India’s energy challenge and ensuring its energy security. India’s energy intensity has been decreasing and is about half what it used to be in the early seventies. Relative Prices for Efficiency Relative prices play the most important role in the choice of fuel and energy form. They are a vital aspect of integrated policy that aims to promote efficient fuel choices and facilitate fuel substitution. Prices of different fuels cannot be set independently of each other. However, this is the current practice and the domestic energy prices are not only uncompetitive but suffer from a number of pricing distortions. Energy Pricing Based on purchasing power parity comparisons, the Indian consumer pays the highest tariffs in the world for its energy supplies/services. Petroleum products are priced at international parity without any competition among incumbents and then loaded with taxes and levies. Access to petroleum products including subsidized kerosene meant for the Public Distribution System is limited. There is a need to examine (a) why the so called import parity price is used for oil products which are not imported, (b) rationale for not using trade parity prices, (c) the basic data on which import parity is calculated and (d) the leakage in subsidized products namely kerosene and LPG. Natural gas supplies are well below current demand levels and multiple prices prevail in the market. Coal has been deregulated under a monopoly supplier and the import and transportation infrastructure for moving coal is both deficient and managed by natural monopolies. Supplies of coal barely match demand. Power, a secondary form of commercial energy is grossly overpriced (for the paying industrial, commercial and large domestic consumers) since less than 50% of the energy through-put is paid for and collected by the State utilities. Indian uranium fuel for its nuclear plants is at least five times costlier compared to international prices due to very poor country deposits. Wind power in India delivers on average only 17% of its capacity, India’s hydro sector has been plagued with significant delays. Non-commercial energy is practically free since opportunity costs of labor spent in collecting firewood or cow dung and preparing the same is rarely factored in. Taxes on petroleum products are a key source for government revenue and are not uniform across products. Varying state taxes and custom duties on

HELIO International / India
34
crude and products introduce further distortions in energy pricing in India. (Contributions from petroleum oil and lubricants to central government revenues have gone up from Rs33806 crore in 2002/03 to Rs 41386 crore in 2004/05, registering a 22% increase. In 2004/05, 68% of this came from two products: petrol and diesel.45) The main recommendations of the Expert Committee are:46
• promote coal imports; • accelerate power sector reforms; • cut the cost of power; • rationalize fuel prices to mimic free market prices that promote
efficient fuel choice and substitution promoting energy efficiency and conservation;
• augment energy resources and supply, encouraging renewable and local solutions;
• enhance energy security; • promote and focusing energy R&D; • promote energy security through entitlements for the poor, gender
equity and empowerment; and, • create an enabling environment and regulatory oversight for
competitive efficiency. The Ministry of Non-conventional Energy Sources (MNES) has also come out with a New and Renewable Energy Policy Statement 2005. 47It has identified the following drivers of new and renewable energy technologies products and services:
• lesser dependence on energy imports through a diverse and sustainable fuel mix in furtherance of the aim of National Energy Security;
• sustaining accelerated deployment of renewable energy
systems/devices through indigenous design, development and manufacture apart from creating new sources of energy in furtherance of the aim of Energy Independence;
• expand cost-effective energy supply for achieving per capita energy
consumption level at par with global average through increasing share of new and renewable energy in the fuel mix in furtherance of the aim of ‘equity’;
• augment energy supply to remove and deficient areas to provide
normative consumption levels to all sections of the population across
45 Mishra et al, 2005 46 Planning Commission, 2005 47 MNES, 2005

HELIO International / India
35
the country through new and renewable energy sources in furtherance of the aim of Accessibility; and,
• fuel-switching through new and renewable energy system/device
deployment in furtherance of the aim of conventional Energy Conservation.
The New and Renewable Energy Policy, 2005 has prepared a detailed study on the indicative time frame for commercial viability of various new and renewable energy sources. As per that time frame, between 2005 and 2010 only two forms of renewable energy (photovoltaic and energy efficient stoves) are expected to be commercially viable. Thus, in the short-term substantial contribution from renewable energy sources cannot be expected. Climate Change The draft report on integrated energy policy refrained from making any such assessment of future GHG emission due to increased energy use. Rather it spoke for a sustainable development policy by promoting energy efficiency, renewable energy, changing the fuel mix to cleaner sources, introducing relative energy pricing, enforcing pollution abatement, implementing afforestation, and encouraging mass transport. It also included promoting higher growth rates of less energy-intense services sectors to ensure a relatively GHG benign growth path. The report also pointed out that any constraints on the emissions of GHGs by India, whether direct, by way of emissions targets, or indirect, would reduce growth rates, and impair pollution abatement efforts. The 2005 new and renewable energy policy has outlined three different fuels–mix projections for 2051-52. In these projections the share of fossil fuels, nuclear energy and renewable sources ranged between 65.79% and 46.88%, 5.52% and 5.26%, and 47.66% and 28.95% respectively. As per the report, the likely carbon emission for the years 2020-21 and 2051-52 are fully “climate change” complaint. For the year 2021-22, the projected carbon dioxide emission related to energy is: 2.7 MT per capita. For 2051-52, the projected value ranged between 3.4MT per capita to 4.1 MT per capita. 48 By comparing Box 2 and Table 12, it is clear that there exists a huge difference in the fuel mix projections in the above two reports. The report prepared by the Expert Committee has given much more weight to coal in the future fuel mix compared to the other report prepared by MNES. Conservative estimates on the usage of coal in the later report might have resulted in a moderate per capita carbon emission figure in 2051-52. However, it is expected that technological breakthrough would make every form of energy much cleaner in the future.
48 MNES, 2005

HELIO International / India
36
Energy Security The World Energy Outlook, published by the International Energy Agency (IEA), projects that India’s dependence on oil imports will grow to 91.6% by the year 2020. Concerned about it growing reliance on oil from the Persian Gulf – over 65% of its energy is imported from the region – India is seeking other oil sources49. In 2004/05 the share of the Middle East oil in India’s total oil imports was 67.43%. The remaining 32.57% was divided as follows: Saudi Arabia was the major supplier with a share of 24.96%, followed by Nigeria (15.73%). Other major suppliers were Kuwait 11.85%, Iraq 8.69%, Iran 10.03%, and UAE 6.71%.50 The Expert Committee has studied the security perspective from different angles and came up with the following suggestions.
• reduce energy requirements through application of better technology to improve fuel efficiency, reliance on rail transport etc.;
• substitute imported energy with domestic alternatives such as the use
of bio diesel etc. Coal can be converted into oil as is being done in South Africa. The technology is well developed and in use for years. Sasol is routinely available at filling stations along with petrol and diesel;
• diversify supply sources;
• diversify supply mode such as importation of gas through pipelines,
importation of hydro power through Nepal/Bhutan;
• expand the resource base and develop alternative energy sources; and,
• increase the country’s ability to withstand supply shocks. Many
countries maintain a strategic oil reserve of 90 days and India could use this as a rule of thumb.
R&D Energy related R&D did not get the resources it needed. The Expert Committee strongly felt the need to focus on research on energy generation, distribution and conservation. Claude Mandil, Executive Director, International Energy Agency, France, in his keynote address at Delhi Sustainable Development Summit, DSDS 2006 (2 – 4 February) commented
“To meet the energy demand and stabilize carbon dioxide concentrations, unprecedented technology changes must occur in this century…No single technology or policy can do it all.” 51
49 Institute for the Analysis of Global Security www.iags.org/n0121043.htm 50 Planning Commission 2005 51 TERI, Summit Bulletin, February 2006)

HELIO International / India
37
The Expert Committee recommended a comprehensive R&D plan to make India self-sufficient by making breakthroughs in clean energy. The expert group has recommended five technology approaches.52
1. Coal technology: (i) recovering coal bed methane and mine mouth methane; (ii) in-situ coal gasification; (iii) carbon capture and sequestration; and (iv) integrated gasification combined cycle (IGCC)
2. Solar: A technology approach should be initiated to bring down the
cost of solar photovoltaic or solar thermal by a factor of five as soon as possible.
3. Bio-fuels: (i) A bio-fuel mission to plant Jatropha or other appropriate
oil plants on half a million hectare of wasteland within two years should be undertaken; (ii) biomass plantation and wood gasification,; and (iii) community biogas plants run on commercial basis.
In addition to this, coordinated research efforts were suggested for the development of:
4. nuclear technology including fusion power 5. battery and hydrogen technology
The Expert Committee has also recommended the formation of a National Energy Fund (NEF) by imposing a tax of 0.1% of the turnover of all energy firms whose turnover exceeds Rs.100 crores a year. As per 2004-05 turnovers, this will collect Rs.500 to Rs.600 crores per year and will increase overtime. In order to encourage the firms to do their own R&D a rebate of up to 80% of this tax may be given to firms for R&D carried out by them. An Independent Board should govern the fund with representatives from the department of Science and Technology (DST), Planning Commission and Energy Ministries. However, the majority of representatives should be outside experts. The idea is to support all stages of R&D from basic research to diffusion with appropriate policies, resources and institutions. Conservation There exists a huge potential for saving energy in India. A study done for the Asian Development Bank in 2003 estimated an immediate market potential of energy saving of 54,500 Million Units and a peak savings of 9240 MW, totaling an investment potential of Rs14,000 crores. The cost-effective saving potential is at least 10% of the total generation through Demand Side Management. Additional savings are possible by auxiliary reduction in
52 The technology approach to telecommunications (C-DoT) undertaken in late 1980s that changed the entire telephony system of India within a span of ten years. It is hoped that these focused and targeted technology approaches will result in drastic changes in India’s fuel mix of India and perhaps assist other countries to do the same.

HELIO International / India
38
generation plants. The expert committee has suggested the following recommendations:
• Energy efficiency and conservation programmes and standards should be established and enforced. The Bureau of Energy Efficiency (BEE) should develop such standards for all energy intensive industries and appliance and develop modalities for a system of incentives/penalties for compliance/noncompliance. These standards should be levels equal to or near current international norms
• The BEE should be made autonomous and independent of the Ministry
of Power. It should be funded by a contribution from all energy Ministries or from a tax on fuels and electricity and an adjusted tax on fuels for generating electricity. BEE staffing should be substantially strengthened.
• Existing national energy efficiency organizations like the Petroleum
Conservation Research Association (PCRA) should be merged with BEE. This will ensure that BEE is responsible for energy efficiency for all sectors and all end uses.
Participation of Civil Society To date civil society’s involvement in the energy sector has been limited to organizing awareness creation campaign on the role and need for new and renewable energy systems/devices in everyday life. The draft report on renewable energy has recommended the participation of civil society to assist in identifying opportunities for diffusion of renewable energy and to support the diffusion of renewable energy within the country’s infrastructure and other socio economic sectors.
Concerns For the first time in independent India, the Draft Report of the Expert Committee on Integrated Energy Policy has tried to address the energy issues of the country from a holistic prospective and tried to evolve an Energy Policy that reflects the aspiration of an independent country. Over the past six decades India has failed miserably to formulate an energy policy that integrates all available energy options. The previous two major policy statements (the Fuel Policy Committee, 1974 and the Working Group of Energy Policy, 1979) were full of policy recommendation, most of which were not implemented. There are concerns about the latest report origins as, in the case of the previous two committees, this committee was also formed at a time when the international price of crude oil was increasing. This report, like its predecessors, is a reaction to an eminent crisis. Should the crisis be resolved quickly, it is more than likely that the recommendations on self-reliance, security, technology mission etc., will remain on paper only.

HELIO International / India
39
The above report was prepared when Mani Shankar Aiyar was the Minister of Petroleum, Oil and Natural Gas. He initiated the negotiation process for Trans-Asia energy cooperation, joint ventures with China, and Iran-Pakistan-India pipeline. Analyst claimed that due to his independent attitude he earned the wrath of few western energy lobbies. A plan to pipe gas from Iran to India via Pakistan has particularly worried US policymakers. The Prime Minister M M Singh acted to allay their concerns to some extent by removing this high profile and independent-minded petroleum minister from his position in a reshuffle in January 2006. A pro-US right wing politician has replaced him. As the trans-Asia gas pipeline was central to Mr Aiyar's energy policy his sudden removal from the Ministry of Petroleum has raised suspicions within India about Mr Singh's willingness to align his economic and foreign policy more closely with US interests. 53Recently India, under pressure from US, has voted against Iran- its long trusted friend and major supplier of crude. All these factors reinforce the apprehension that the strong policy recommendations on energy security will be watered down in the final report, expected April 2006. Moreover, the India –US deal on civilian nuclear programme would accelerate the growth of nuclear energy. Despite recommendations of the Expert Committee, imported uranium may replace indigenous coal as a feedstock for power generation.
Environmental Sustainability Indicator 1: CO2 Emission kg/capita By global standard carbon emission per capita is relatively low in India due to low energy consumption which has led to a low GDP per capita. However CO2 emissions have increased marginally 1990 to 2002 for the following reasons:
1. The number of registered vehicles has increased by over 250% between 1991 and 2001-02. The corresponding figures are 21.37 million and 58.86 millions.
2. During the same period, the consumption of coal and production of
petroleum products increased steeply. The refinery throughput increased from 51.8 million tons to 112.6 million tons. India today is largely self-sufficient in its petroleum product production. Major imports are LPG while diesel, petrol and STF are exported. As refinery throughput has increased, the environmental pollution has increased. India bore an increased pollution burden by importing and processing high levels of crude oil in its refineries.
53EIU Viewswire Via Thomson Dialog NewsEdge COUNTRY BRIEFING, http://www.tmcnet.com/usubmit/2006/02/27/1412052.htm

HELIO International / India
40
3. Consumption of coal increased from 225.5 million tons to 367.2 million tons. 70% of the consumed coal was used for generating electricity. The New and Renewable Energy Policy 2005 54 document indicates that, of the total emission of 1572 MMT in 2001-02, CO2 emission from energy sector was 60%. The sector-wise contributions to the total energy related carbon-dioxide emissions in 1997-98 were as follows: Power (36.51%); industry (19.47%); transport (7.84%); residential 34.92%; agriculture (0.87%), and commercial (0.97%). 55
4. GDP and manufacturing sector grew at a faster rate during this period.
Electricity consumption (kwh) per capita has also increased from 173 kwh in 1980 to 569kwh in 2002.56
Table 13: CO2 Emission kg/capita 1990 2002 1194 1200
Source: MoEF, (June 2004), India’s Initial National Commitments to the United Nations Framework Convention on Climate Change; HDR, 2004.
Indicator 2: Most Significant Energy-related Local Pollutants
The ambient air quality has deteriorated all over the country, especially in the semi-urban and urban areas. Three anthropogenic activities are the major sources of air pollution: stationary sources (use of fossil fuels in industries and thermal power plants), mobile sources (vehicles) and in-door sources (burning of bio-mass). The relative contribution of the 3 sources varies across the country depending upon various factors. The National Human Development Report 2001 (Planning Commission) mentioned that the ambient air quality recorded for India’s 23 major cities revealed that the Suspended Particulate Matter (SPM) levels were critical in many cities. What is more startling is that in smaller and medium towns the SPM levels were far higher than the larger metropolitan cities. In addition to common air pollutants such as sulphur dioxide and the nitrogen oxide several toxic and carcinogenic chemicals have also been detected in the air.
54 MNES, 2005 55 Reddy, Balachandra, 2002. 56 HDR, 2005

HELIO International / India
41
Table 14: Air Pollution µg/m3 (Residential) Place SPM
(1990) SPM (2002)
SO2 (1990)
SO2 (2002)
Delhi (Nizamuddin) 294 329 7.4 13.1 Delhi (Ashoke Vihar) 339 425 6.6 6.4 Delhi (Janakpur) 317 442 6.5 13.7 Delhi (Siri Fort) 317 378 8.7 11.8 Delhi Average 316.75 393.5 7.3 11.25
Source: Website Central Pollution Control Board, Govt. of India.
A nation-wide programme was initiated in 1984 to measure the extent of pollution in different parts of the country. On March 31, 1995, the network comprised 290 stations covering over 90 towns/cities distributed over 24 States and 4 Union Territories. As of June 30, 2000, the Central Pollution Control Board (CPCB) has identified a total of 1551 medium and large industrial units under the seventeen highly polluting industrial sectors. Of these, about 77% were responsible for water pollution, 15% contributed to air pollution and the remaining 8% of the industries were potentially polluting both air and water. Out of 1551 units, 1324 have installed requisite pollution control facilities, 165 units have closed and 62 units defaulted.57 One estimate shows that in 2000, about 3,000 metric tones of air pollutants were emitted everyday in Delhi. The major sources of air pollutants were:
• emissions from vehicles (67%); • coal based thermal power plants (13%); • industrial units (12%); and, • domestic (8%).
During 1991 air pollutant emission were 1,450 metric tones per day. Emissions have more than doubled in less than ten years. The transportation sector contributes most of the pollution load (27% NOx, 74% carbon monoxide [CO], 11% volatile organic compound and 100% lead) in urban areas. 58 In 2000, public sector oil companies introduced low benzene petrol and low sulphur diesel. Armed with a Supreme Court order, the Delhi administration introduced CNG in the capital city in 2001. In the rural areas, the burning of unprocessed cooking fuels in homes is a major source of pollution. Rural households rely mostly on bio fuels such as cow dung, fuel wood, and crop residues and in some cases low grade coal to meet their fuel needs.59
57 Ghosh S, undated 58 ibid 59 The primary focus in the rural energy work of the 1970s was on cooking. Research, development and
dissemination were devoted to stoves and particularly fuel wood stoves. There was some initial success in improving the fuel wood stove efficiency and making them less smoky. The emphasis now has turned to

HELIO International / India
42
Social Sustainability Indicator 3: Household Access to Electricity In 2002, the household access to electricity was only 57.35%. As per the 1991 Census Report, the percentage of electrified rural and urban households was 30.5% and 75.8% respectively. The corresponding figures in 2001 were 43.5% and 87.6% Table 15: Household Access to Electricity Year 1990 1991 2001 2002
Household electrified (%)
41.25 42.4 55.8 57.35
Compound Annual Growth Rate: 2.784% Source: Ministry of Power, Govt. India, and Census Report 1991,2001, The Ministry of Power has defined a series of major policy initiatives in 2004-05 to accelerate electrification in general and rural electrification in particular,60 the National Electricity Policy. This policy aims to accelerate the development of power sector by providing supply of electricity to all areas while protecting the interests of consumers and other stakeholders. The National Rural Electricity infrastructure and Household Electrification Programme was launched to provide access to electricity to all households in five years. The Centre will provide 90% capital subsidy under this scheme. The Rajiv Gandhi Gram Vidyutikaran Yojana (RGGVY) aim’s to electrify the 1,25,000 villages, connect all the estimated 2.34 crore unelectrified households below the poverty line (BPL) with 90% subsidy for connecting costs and augmenting by 2010 the network in all the already electrified 4.62 lakh households. For the approximately 5.46 crore households that are currently not electrified but are above the poverty line, they will not receive any subsidy to help them establish an electricity connection. The figures in Table16 illustrate the low level of rural electrification The failure of rural electrification highlights that existing policies should be critically re assessed.
large-scale dissemination particularly through government programmes. Success has been partial. Improved cooking stoves penetrated only 15% of India’s homes between early 1980s and 1992. Meanwhile, the priority on wood stove research was reduced. Restricting the efforts to improve fuel wood stoves implied the acceptance of a ‘dual-fuel’ society, i e, a society in which the poor cooked with messy solid fuels on relatively inefficient stoves while the rich enjoyed clean gaseous fuels such as LPG on efficient stoves. There was also little awareness of the strong gender bias against women in this shifting of priorities (Reddy,1999) 60 MoP, Annual Report, 2004-05

HELIO International / India
43
Table 16: Distribution of Households by Source of Lighting 2001 Source of lighting
Total Rural Urban
Total 100 100.0 100.0 Electricity 55.8 43.5 87.6 Kerosene 43.3 55.6 11.6 Solar energy 0.3 0.3 0.2 Other oil 0.1 0.1 0.1 Any other 0.2 0.2 0.1 No lighting 0.3 0.3 0.4
Source: Table H-9: Census of India 2001
In the past, Indian energy planners have equated rural electrification with village electrification. Even one pole near a village qualified it as an electrified village. Moreover, agricultural consumers dominated the priority list of electricity end-users with their demand for energizing irrigation pump sets. Home electrification was not seen as a challenge by the electricity boards and the political parties. On the supply side, rural electrification was understood as grid electrification as was to follow centralized generation from mega projects. The whole challenge of off-grid decentralized generation from local sources has not been part of the electrification agenda. 61 From the mid nineties onwards, solar photovoltaic has been receiving top priority by rural energy planners not only in India but also globally although the initial high capital investment in solar power has made it too costly for most of the rural poor. The government has a long history of subsidizing kerosene and LPG with the assumption that kerosene is the poor man’s fuel. The 2001 census survey clearly revealed that only 1.62% of the households in rural areas use kerosene as the primary fuel for cooking. LPG penetration is higher at 5.6%. Most of the kerosene consumed is for lighting purposes where the quality of light generated is extremely poor. A study by The Energy and Resources Institute 62reveals that if the government would decide to subsidize solar lanterns instead of providing kerosene at a subsidized rate, the net savings to the government could increase substantially. Even if the government provided a free solar lantern to each of the households comprising the 57% population with no access to electricity, the annualized subsidy burden would amount to only few thousand crore rupees. The report also demonstrates that the benefit of the LPG subsidy has gone primarily to the richer segments of society (40% of the subsidy goes to the top 6.75% of households). Such numbers reveal that there is no rationale for continuing with the LPG subsidy – both for the rural and urban affluent consumers.
61 Reddy, 1999 62 Mishra et al, 2005

HELIO International / India
44
Instead, the LPG subsidy should be provided to targeted households –both rural and urban. Even after providing a free solar lanterns to the 57% non-electrified households AND extending targeted subsidies to LPG to the poorer section of the population, the government would still be revenue positive compared to the huge subsidy provided now towards kerosene and LPG. Moreover, by converting kerosene into higher value products the earnings of the refineries would be higher. The government also would be able to raise a higher tax from the higher value product. Case Study 4: Low-cost Lamps for Rural India The Grameen Surya Bijli Foundation (GSBF), a Bombay-based nongovernmental organization focused on bringing light to rural India, have introduced an innovative low –cost solar lighting system. The GSBF lamps use LEDs - light emitting diodes - that are four times more efficient than an incandescent bulb. After a $55 installation cost, solar energy lights the lamp free of charge. LED lamps, or more specifically white LEDS, are believed to produce nearly 200 times more useful light than a kerosene lamp and almost 50 times the amount of useful light of a conventional bulb. LED lighting, like cell phones, is another example of a technology whose low cost could allow the rural poor to leapfrog into the 21st century. “This technology can light an entire rural village with less energy than that used by a single conventional 100 watt light bulb," says Dave Irvine-Halliday, a professor of electrical engineering at the University of Calgary, Canada and the founder of Light Up the World Foundation (LUTW). The rural markets would be able to afford the initial expenses if they had access to micro-credit. LUTW is in the process of creating such a micro-credit facility for South Africa. "Then more than 4 million homes in South Africa will be able to afford this lighting system," he says. Founded in 1997, LUTW has used LED technology to bring light to nearly 10,000 homes in remote and disadvantaged corners of some 27 countries like India, Nepal, Sri Lanka, Bolivia, and the Philippines. The technology, which is not yet widely known in India, faces some skepticism. "LED systems are revolutionizing rural lighting, but this isn't a magic solution to the world's energy problems," says Ashok Jhunjhunwala, head of the electrical engineering department at the Indian Institute of Technology, Madras. At $55 each, the lamps installed in nearly 300 homes by GSBF cost nearly half the price of other solar lighting systems. Jasjeet Singh Chaddha, the founder of the NGO, currently imports his LEDs from China. He wants to set up an LED manufacturing unit and a solar panel manufacturing unit in India. If manufactured locally, the cost of his LED lamp could plummet to $22, as they won't incur heavy import duties. "But we need close to $5 million for this," he says. "And investments are difficult to come by." The lamps provided by GSBF have enough power to provide just four hours of light a day. But that's enough for people to get their work done in the early hours of the night, and is more reliable than light generated off India's electrical grid. Source: Chopra A, Correspondent, The Christian Science Monitor)Circulated via email by: Antony Froggatt [mailto:[email protected]] , 04 January 2006 05:26, http:www.eu-energy.com

HELIO International / India
45
Indicator 4: Investment in Clean Energy Indian industry has not shown much enthusiasm in investing in cleaner energy and on energy saving technology. Probable reasons are the low level of per capita energy consumption and carbon emissions, relatively low price of energy compared to investment cost in energy saving process and cleaner energy system. However, through the formation of PCRA and BEE (discussed earlier) awareness for the need about energy saving technologies is increasing. Table 17 shows government sector investments. Data pertaining to private investment in clean energy is not available. (Not all investments in renewable are not necessarily ‘clean investment’). Table 17: Investments 1990-91 and 2002-03 Investment in Energy 1990-91 2002-03
Total (Rs.in billion) 171.011 447.09.99 Clean (Rs.in billion) 1.364 17.12.24 Clean as a % of total 0.80% 3.83%
Source: The Economic Survey, 2003-04, Govt. of India. The 8th Five Year Plan (1992-97) made a provision of Rs.1, 000 crores for energy efficiency to provide projected energy savings of 5000 MW and 6 million tones in the electricity and petroleum sectors respectively. However this money was not explicitly spent for this purpose. The 10th Five Year Plan (2002-07) proposed benchmarking the hydrocarbon sector against the rest in the world. It also suggested demand side management specifically in the transport sector. The target for energy savings in the 10th Plan is 95,000 Million Units. However, unlike generation targets, there was no specific allocation to meet. It is also likely that the performance review will not indicate the actual savings realized.63
Economic Sustainability Indicator 5: Energy Resilience: Energy Trade Benefits Many countries like India are highly dependent on imported fuels. The threat of supply interruption is real, primarily for unforeseeable political reasons, pipeline accidents, system vulnerabilities, embargoes, terrorism, and civil strife. The more universal threat is price fluctuations that can destabilize both importing and exporting nations. Over dependence of imports and exports, especially for energy sources like petroleum make a country vulnerable.
63 Planning Commission,2005

HELIO International / India
46
Looking at the production and import statistics of petroleum products, between 1990 and 2002, though the import of crude increased the import of petroleum products declined and India became net exporter. India is today largely self-sufficient in its petroleum product production. Major imports are LPG while exports consist of diesel, petrol, and ATF. Table 18: Consumption and Imports of Petroleum and Petroleum
Products (million tones)
Net Import Year Consumption
Crude Petroleum 1990-91 55 20.7 6.0 2002-03 104.1 82.0 -3.6
Source: The Economic Survey, 2004-05.
Although between 1990 and 2002, India was a net exporter of petroleum products, its dependence on imports increased substantially mainly in crude oil, making it increasingly vulnerable to oil price hike and supply shocks. From 2004-05, India’s dependence on imported crude stood at 77% of its crude processing requirement. While the total quantum of crude imports by the country grew at a CAGR (compounded annual growth rate) of 15.72% during the period 1997/1998 to 2004/05, the total import bill, during the same period, increased by more than double this rate (33.03%). The net-import dependency of India is declining. It has decreased from 86% in 1999/2000 to 70% in 2004/05. This is due to 64 increase in the refining capacity resulting in a reduction in import of petroleum products and the export of some products. During 2004-05, the country exported 17.53 MT of petroleum products against an import of 8.83 MT. There has been an upsurge in the export market of diesel, petrol, naphtha, ATF (aviation turbine fuel), and fuel oil. In the last four years, the export market for diesel, petrol, and ATF has grown at a CAGR of 40.30%, 26.41%, and a whopping 97.37% respectively. On the import front, over the last four years, LPG imports have increased at a CAGR of 27.65%, standing at 2.33 MT in 2004/05 while kerosene imports have declined at a rate of 43.19%.65
64 Mishra et al, 2005 65 ibid

HELIO International / India
47
Table 19: Non-renewable Commercial Energy (including hydro from big dams) (mtoe)
Year 1990-91 2002-03
Production 166.7 246.9 Import 32.1 100.1 Available 191.5 334.7 Export* 7.3 9.3 Net Import 24.8 90.8
* Computed by deducting ‘production’ and ‘import’ figures from ‘available’ data (4th row). By deducting the export figures from the corresponding years’ import figures, ‘net imports’ have been computed. The ‘available’ figures as above are considered equal to the amount of non-renewable commercial energy consumed in the corresponding years. Source: CMIE, Energy, May 2005
Indicator 6: Burden of Public Energy Investments
Production and distribution of commercial energy was under state control. Recently privatization has occurred but the government still maintains major control. Only in case of renewable energy is the government’s participation negligible. Table 20 demonstrated that public investment in terms of GDP has increased during last one decade. Table 20: Public Investment in Non-renewable Energy 1990-91 2002-03
Public Investment (Rs billion) 169.64.7 429.9775 GDP (Rs crore) 6928.71 13183.62 Investment as percentage of GDP
2.448 3.26145
Source: The Economic Survey, 2003-04; CMIE, Energy, May 2005
Privatization of the energy sector started in the 1990s. During last few years this process has accelerated. However, on key issues government still maintains its control. Coal Sector The coal sector is dominated by Public Sector Undertakings (PSUs). Central PSUs which is engaged in production of coal and lignite contributes nearly 90% and 73% of total production of coal and lignite respectively. In 1993, limited private participation was permitted in the coal sector, essentially in captive mining for self-use. Now, foreign direct investment (FDI) in coal mining has been allowed and coal mining by joint venture companies is permitted. The Coal Mines Nationalization (Amendment) Bill 2000 was introduced in Parliament for bringing in suitable legislative

HELIO International / India
48
amendments to permit private sector entry into coal sector. However, its passage is still awaited.66 Recently the Expert Committee has recommended that the coal blocks held by Coal India Limited (CIL) which CIL cannot bring into production by 2016-17, either directly or through joint ventures, should be made available to other eligible candidates for development and bringing into production 2011-12. Ideally, the Coal Mines (Nationalization) Act, 1973 should be amended to facilitate (a) private participation in coal mining for purposes other than those specified and (b) offering of future coal blocks to potential entrepreneurs. Oil Sector The oil sector remains largely in the hands of the Central Public Sector Units (CPSUs). The exception is in refining where some 26% of capacity is now in private hands. In 1987, the Government allowed private participation in refining through joint ventures, which was eventually de-regulated in 1998. The country’s largest refinery, a 27 MMTPA facility at Jamnagar, Gujarat is run by a private sector company. Parallel marketing of LPG and kerosene was permitted in 1993. Under the scheme, imports of these products were decanalized and private parties were allowed to import and market these at market-determined prices. Over the years parallel marketers have developed facilities for imports, storage tanks and LPG bottling plants as well as setting up their own distribution and marketing networks. Until 1997, public sector firms concentrated mainly on oil and gas exploration. Progressive liberalization of exploration and licensing policies have attracted some private and foreign firms. Despite this the success of the explorations has been marginal in enhancing oil reserves. However, some sizeable gas reserves amounting to 680 MTOE (176 MTOE claimed by Reliance and 504 MTOE claimed by Gujarat’s State Petroleum Corporations (GSPC)) has been recently reported. More work is needed to estimate the extractable potential. Despite one of the most liberal exploration licensing regimes, India has failed to attract any oil majors to explore in India. Exploration blocks were put on offer under the New Exploration Licensing Policy (NELP) in 1999, under radically different terms and conditions in order to try and attract private investment. NELP was fairly successful in attracting investments to the upstream sector – 25 blocks were awarded under the first round, while another 23 blocks were awarded later. So far, India has offered 110 oil and gas blocks and 16 coal bed methane blocks for exploration in its attempt to raise domestic energy production to
66 Min of Coal, Annual Report, 2004-05

HELIO International / India
49
reduce import dependence. An indication of global interest in India's energy deposits, is illustrated by major firms snapping up seismic data worth Rs 200 million ($4.5 million) for 55 oil and gas blocks and 10 coal bed methane blocks offered for exploration on 22nd February, 2006. This is expected to translate into aggressive bidding for the blocks offered under the sixth round of the New Exploration Licensing Policy (NELP) and third round of coal bed methane exploration. Of the 55 oil and gas blocks offered in the sixth round of NELP, 24 are in the deep sea, six in shallow offshore and 25 are on land blocks. 67 Power Sector The sector is dominated by large state monopolies both at the national and state level. Over 88.44% of the utility-based generation is in the public sector with transmission almost entirely in the public sector. In the power sector, institutional changes introduced over the past few years have removed the legal barriers to create an environment favorable for private sector participation. As a result of these measures, the contribution of the private sector to installed capacity in the first four years of the Ninth Plan (97-01) was 4174 MW – 26.5% of the total in comparison to the 1262 MW (7.7%) in the eighth plan period (92-97). Simultaneously executive action has been taken to allow foreign investment into the sector – in 1998; foreign investment was almost 100% of equity in almost all activities of the power sector. 68The Electricity Act 2003 has encouraged private sector investment worth Rs 58,000 crore in projects worth 16,432 MW generation capacities. 69 A loan agreement for US$400 million to finance the upgrading of India’s national power transmission grid was signed in November 2005 between the Asian Development Bank (ADB) and Power Grid Corporation of India Limited (POWERGRID). This project aims to strengthen and expand the capacity of the national transmission grid which comprises of 765-kilovolt (kv) and 400 kv transmission lines as well as substations operated by POWERGRID. Its National Transmission Development Plan (NTDP) entails an investment program of about US$12.6 billion up to year 2012. Including this loan, ADB has approved 15 loans totaling about US$3 billion to India’s power sector, accounting for about 23% of its total public sector loans to India.,70 In 2005-06, the Ministry of Power has launched an initiative for setting up of ultra mega power projects (4000 MW or above) on ‘build, own and operate (BOO)’ basis. 71
67The Hindustan Times. 23.2.06 68 Planning Commission 2005 69 The Economic Times, 28.2.06 70 ADB, 2005 71 The Economic Times, 28.2.06

HELIO International / India
50
Renewable Energy The renewable sector is primarily dependent on private entrepreneurs with the Indian Renewable Energy Development Agency Ltd. (IREDA) acting as the financing agency. The Experts Committee has recommended that the IREDA be converted into a national refinancing institution for the renewable enrgy sector along the lines of the National Bank for Agriculture and Rural Development (NABARD)/National Housing Bank (NHB). IREDA’s own equity base could then be expanded by the financial institutions of the country instead of being supported by the government as is currently the case. As per the new renewable policy, renewable energy technologies and projects will be allowed 100 percent foreign equity through automatic approval route to attract FDI to this sector. 72
Technological Sustainability Indicator 7: Energy Intensity (Energy Consumption/GDP) India’s energy intensity of growth has been falling and is about half what it used to be in the early seventies. Currently India consumes 0.19 kilogram of oil equivalent per dollar of GDP expressed in purchasing power parity terms. This is equal to the energy intensity of the OECD and better than the 0.21kilograms of China, 0.22 kilograms of the US and the world average of 0.21. However, there are several countries in Europe at or below 0.12 with Brazil at 0.14 and Japan at 0.15. Thus, clearly there is room to improve and energy intensity can be brought down significantly in India with commercially available technologies.73 Table 21: Energy Intensity Primary Energy
Consumption
1990 2002 2003
India: Per capita (Million Btu) 9.6 13.1 13.2 Total Primary Energy consumption per $ of Gross GDP (Btu per US$ using market exchange rate for Y2000)
29447 26955 25460
Total Primary Energy consumption per $ of Gross GDP (MJ per US$ using market exchange rate for Y2000)
31.066 28.437 26.8603
1 Btu=1.055 kJ, 1kJ = 1000J 1 MJ = 1000 kJ Source: International Energy Annual, 2003, EIA
72 MNES, 2005 73 Planning Commission, 2005

HELIO International / India
51
Indicator 8: Renewable Energy Deployment The Ministry of Non-Conventional Energy Sources (MNES) is the central ministry of the Indian government for all matters relating to new and renewable energy. Although it has a very well defined mission, its performance to date has not been impressive. MNES’s mission is as follows:
1. Energy Security: Development and deployment of alternate fuels (hydrogen, bio-fuels and synthetic) to help bridge the gap between domestic crude oil demand and supply;
2. Development and Deployment: Renewable (bio-energy, wind, hydro,
solar, geothermal & tidal) energy to supplement fossil fuel based electricity generation;
3. Technology Ladder for Traditional Biomass: More efficient and cleaner
conversion of biomass to meet the energy needs of cooking, lighting and motor power in rural areas;
4. Availability, Accessibility, Affordability: Normative levels of energy
supplies to energy deficient sections of the population; and
5. Per-capita Energy Consumption: Consumption to be at par with the global average level by 2050, through a sustainable fuel- mix.
The Indian Renewable Energy Development Agency Ltd. (IREDA) was established in 1987 as a public sector non-banking company under the Ministry of Non-Conventional Energy Sources (MNES) with the objective of providing loans for new and renewable sources of energy (NRSE). The exact production figures of Indian renewable energy are very difficult to find. MNES mainly focuses on installed capacity thus how much of this installed capacity is productive is not known. More over hydro-electricity produced by constructing big dams cannot be considered as renewable sources. The President of India in his Independence Day speech mentioned that the current share of renewable in the total primary energy is around 5%.74 Again the figures on primary energy provided by different sources vary widely. The BP Energy statistics - mentioned below - probably do not considered the non- commercial (traditional) source of renewable energy such as biomass etc., that as per MNES calculation constitutes more than 31.78% of total primary energy supply. In 2001-02, the major components of the non-fossil fuel were: nuclear (1.18%) and renewable (33.52%). The later consists of hydro (1.73%);
74 The Economist, Sept 24,2005
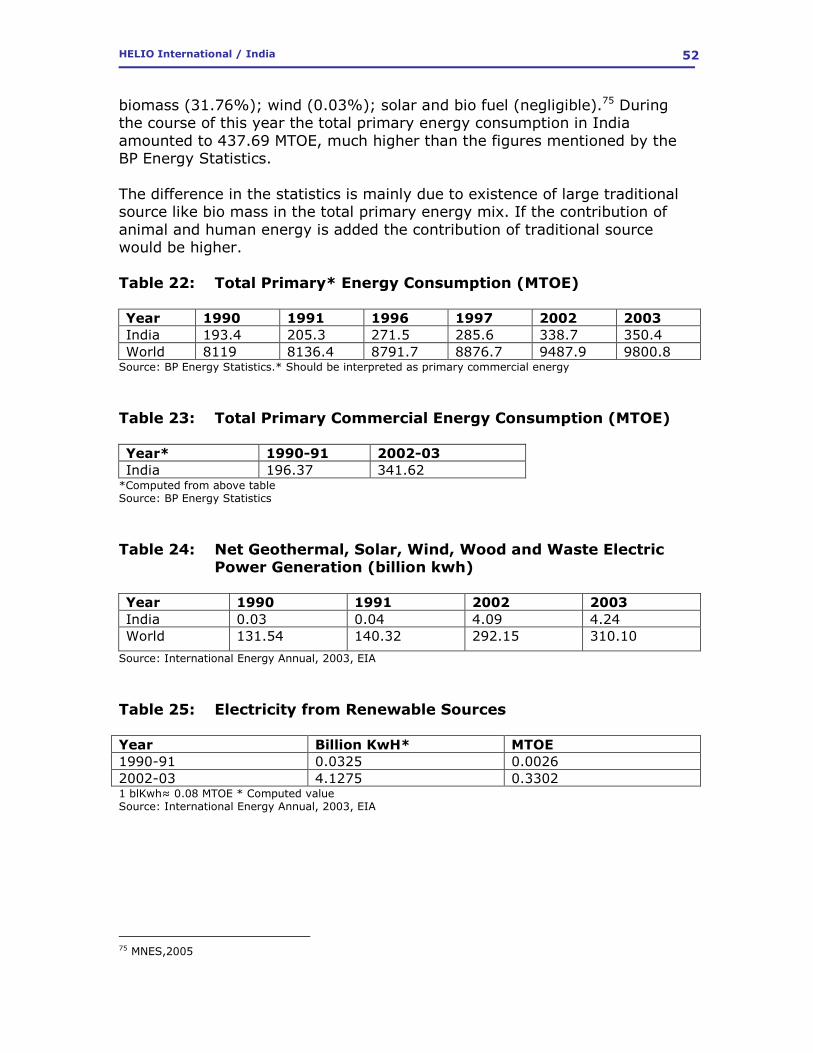
HELIO International / India
52
biomass (31.76%); wind (0.03%); solar and bio fuel (negligible).75 During the course of this year the total primary energy consumption in India amounted to 437.69 MTOE, much higher than the figures mentioned by the BP Energy Statistics. The difference in the statistics is mainly due to existence of large traditional source like bio mass in the total primary energy mix. If the contribution of animal and human energy is added the contribution of traditional source would be higher. Table 22: Total Primary* Energy Consumption (MTOE) Year 1990 1991 1996 1997 2002 2003
India 193.4 205.3 271.5 285.6 338.7 350.4 World 8119 8136.4 8791.7 8876.7 9487.9 9800.8
Source: BP Energy Statistics.* Should be interpreted as primary commercial energy
Table 23: Total Primary Commercial Energy Consumption (MTOE) Year* 1990-91 2002-03
India 196.37 341.62 *Computed from above table Source: BP Energy Statistics
Table 24: Net Geothermal, Solar, Wind, Wood and Waste Electric
Power Generation (billion kwh) Year 1990 1991 2002 2003
India 0.03 0.04 4.09 4.24 World 131.54 140.32 292.15 310.10
Source: International Energy Annual, 2003, EIA
Table 25: Electricity from Renewable Sources Year Billion KwH* MTOE
1990-91 0.0325 0.0026 2002-03 4.1275 0.3302 1 blKwh≈ 0.08 MTOE * Computed value Source: International Energy Annual, 2003, EIA
75 MNES,2005

HELIO International / India
53
Table 26: Electricity Generation (billion kwh) Year Commercial source Renewable
Source Grand Total
Hydro Coal Oil Gas Nuclear
Total
1990-91
71.64 178.32
0.11 8.11 6.14 264.33 0.0325 264.362
2002-03
64.01 389.55
7.05 52.68
19.39 532.69 4.1275 536.817
Source: CMIE, Energy, May 2005, International Energy Annual, 2003
Table 27: Renewable Energy* as % of Primary Commercial Energy Year Renewable
*(MTOE)
Total Primary
Commercial Energy Consumption (MTOE)
% of Total
1990-91 0.002 196.37 0.00101 2002-03 0.330 341.62 0.09659 * Electricity generated from renewable energy Source: Calculated from above tables
In annex II, the unit costs of different types of renewable energy are shown. Solar, although having tremendous potential, is still expensive. However, focused R&D may reduce the cost at an affordable level.

HELIO International / India
54
Indicators Results Table 28: Indicators
Value in India Indicators Indicators
1990 2002 I(1990) I (2002)
CO2 emission kg/capita
1194 1200 1.081 1.088
Local emission (Delhi) (µg/m3) SPM SO2 Average – I
316.75 7.3
393.5 11.25
7.669 -0.098 3.785
9.588 -0.016 4.786
Household Access to electricity (%)
41.25 57.35 0.588 0.427
Investments in clean energy (%)
0.7976 3.82965 1.000 0.968
*Energy resilience (%)
16.8 29.9 0.168 0.299
Burden of energy investments (%)
2.448 3.26145 0.245 0.326
Energy productivity MJ/US$
31.066 28.437 3.132 2.858
Renewable energy (%)
0.00101 0.09659 1.100 1.099
* Ratio between total import and total consumption (availability)

HELIO International / India
55
Presentation of Country Star Two stars have been presented here using two different scales.
Figure 3: Star with scale 0 ���� 5
Eight Sustainability Indicators
0
1
2
3
4
5
1) CO2 emissions
2) Ambient pollutants
3) Access to electricity
4) Investments
5) Vulnerability
6) Public sector investment
7) Energy productivity
8) Renewables
Current Year Base Year

HELIO International / India
56
Figure 4: Star with scale 0 ���� 3
Eight Sustainability Indicators
0
1
2
3 1) CO2 emissions
2) Ambient pollutants
3) Access to electricity
4) Investments
5) Vulnerability
6) Public sector investment
7) Energy productivity
8) Renewables
Current Year Base Year

HELIO International / India
57
Conclusions and Policy Recommendations Initial findings indicate that from 1990 to 2002 India failed to achieve any noteworthy progress in the management and development of energy sector especially in the areas of cleaner and renewable energy. The absence of a holistic energy policy and the increasingly reliance on road transportation are further worsening the situation. More funds need to be allocated towards rapid upgrading and expanding India’s railway infrastructure. The application of improved road taxes for transport vehicles is necessary. In order to promote the effective use of renewable energy sources, which has tremendous potential in a vast country like India, strong, committed leadership is urgently required. The public sector oil-distributing companies such as the Indian Oil Corporation Ltd., and the Hindustan Petroleum Corporation Ltd., which have huge distribution network all over India including in the remotest villages, should be asked to distribute different renewable energy items such as solar lanterns, solar panels etc. The existing retail pump outlets and kerosene/lubricant depots can be used as sales and service centers for such items. Basic engineering skill pertaining to the servicing of solar panels and small windmills can be taught to local students through workshops and training. The public sector oil companies with their massive, nation-wide infrastructure could organize this educational component on a regular basis in different locations. The training and promotional expenses towards this would be less compared to the amount of subsidy the companies pay each year to sell kerosene to the underprivileged section of the rural and urban India. Similar to the Telecommunication Initiative of 1980s, Energy Technology initiatives on (i) coal technology (ii) solar technology (iii) bio fuels, (iv) bio mass plantation (v) community biogas plants should be implemented immediately. An alternative power sector reform as proposed by TL Sankar deserves due attention from energy planners.
Bibliography ADB, 2004, Road Crashes Costing Southeast Asian Countries US$15 Billion Per Year, ADB Studies say, November 22, New Release No.155/04. ADB, 2005, Signs $400 Million Loan to Upgrade India’s Power Transmission Card, November 3, New Release No.11/05. BP Plc, ‘BP Statistical Review of World Energy 2005’. Bidwai Praful 2006, India: Sacrificing sovereignty, Frontline, February 16.
HELIO International / India
58
Central Pollution Control Board (CPCB), GoI, website; http//www.cpcb.nic.in Chaudhury P.D., 2003, Rail and Road in Intercity Transport – Energy and Environmental Impact, Economic and Political Weekly, October 13 CIA, The World Fact Book- India, (11,/26/2005) CMIE, Energy, May 2005 CMIE, Monthly Review of Indian Economy, June 1999, September, 2005. Down To Earth, 2005, Vol.14 No.12, Nov, 07 http://www.downtoearth.org.in/fullprint.asp (visited on 12.11.05) EIA, Country Analysis Briefs, India, October 2004. Environmental Performance Measurement (EPM) Project (Yale University) and The Center for International Earth Science Information Network (Columbia University), 2005 Environmental Sustainability Index: Benchmarking National Environmental Stewardship, http//www: yale.edu/esi/ Ghosh S., Sustainable Energy Policies for Clean Air in India, CII, New Delhi. Gundimeda H, 2005, Can CPRs Generate Carbon Credits without Hurting the Poor? Economic and Political Weekly, May 5, IEA, International Energy Annual, 2003 Ministry of Coal (GoI), Annual Report, 2004-05 Ministry of Environment and Forest (MoEF), GoI, Annual Report, 2004-05 Ministry of Finance (GoI), ‘The Economic Survey’, 2004-05. Ministry of Non Conventional Energy (GoI), Annual Report 2004-05 Ministry of Petroleum (GoI), Annual Report, 2004-05 Ministry of Power (GoI), Annual Report, 2004-05 Ministry of Shipping, Road Transport and Highways, GoI, Website (visited on 15.2.06). Mishra N, Chawla R, Srivastava L, Pachauri R K, 2005, Petroleum Pricing in India – Balancing efficiency and equity, The Energy and Resources Institute, New Delhi.

HELIO International / India
59
MoEF, (June 2004), India’s Initial National Commitments to the United Nations Framework Convention on Climate Change, Govt. of India MoEF, 2002, Powering People for Sustainable Development MNES, 2005, New and Renewable Energy Policy, Draft – II. MoEF, Agenda 21- An Assessment National CDM Authority, Web:http://envfor.nic.in/cdm/cdm_india.htm NIPM, http://www.ncipm.org.in/asps/DisplayPesticides.asp visited on 24.2.06 Office of the Registrar General (GoI), Census of India, 2001 Planning Commission (GoI), 2005, Draft Report of the Expert Committee on Integrated Energy Policy, New Delhi, December. Reddy A, 2002, In Support of a People’s Plan for Power Sector Reform, November 2-9, The Economic and Political Weekly. Reddy S, Balachandra P, 2002, A Sustainable Energy Strategy for India Revisited, December 28, The Economic and Political Weekly, Mumbai. Reddy A K N, 1999, Goals, Strategies and Policies for Rural Energy, December 4, The Economic and Political Weekly, Mumbai. RUPE, 2004, Aspects of India’s Economy, No.36 & 37, Mumbai. Shankar T L, 2002, Towards a People’s Plan for Power Sector Reform, October 5, The Economical Political Weekly, Mumbai Shiva V, 2004a, Super Highways – Lines on the palm or tattoos of dictatorship on the land, Znet, February 19. Shiva V, 2004b, The impact of globalisation on India’s environment - Global Ecology, May 7. Srinivas N.N. (2003), Monsanto Patents Indian Wheat Gene http://www.indiaresource.org/raw/news/2003/4486.html (visited on 12.11.05) The Human Development Report (HDR), 1992,2004,2005 Tongia R, 2005, Revisiting Natural Gas Imports for India, May 14, Economic and Political Weekly. UNDP, 2005, Indian Human Development Goals.

HELIO International / India
60
Venkitaramanan S, 2002, Unemployment Problem: Bitter Remedies, July 22, The Hindu Business Line, Chennai.
Annex 1 Table 29: Rates of Energy Consumption ( Mj per pkm) and Emission
of Pollutants (in g per pkm) for Passenger Traffic (2000-01)
Type of Section
Energy CO2 CO NOX NMVOCS SO2/SOX TSP
Rail sections with electric traction
0.19 25.57 0.002 0.13 Na 0.09 2.56
Corresponding road sections - Car and bus - Car only - Bus only
0.33 0.63 0.16
23.26 1.69 2.24
1.69 2.24 1.00
1.11 0.35 1.61
0.57 1.17 0.15
0.10 0.03 0.14
0.10 not appl 0.20
Rail sections with diesel traction
0.18 13.41 0.11 0.34 0.02 0.08 0.02
Corresponding road sections - Car and bus - Car only - Bus only
0.30 0.64 0.17
21.35 44.57 12.48
1.60 2.28 1.04
1.22 0.37 1.62
0.50 1.19 0.16
0.11 0.03 0.14
0.12 not appl 0.20
Source: Chaudhury P.D., 2003, Rail and Road in Intercity Transport – Energy and Environmental Impact, Economic and Political Weekly, October 13
Notes: na – not available; not appl – not applicable; Carbon dioxide (CO2); Carbon Monoxide (CO); Nitrogen Oxides (NOX); Non-Methane Volatile Organic Compounds (NMVOCs); Total Suspended Particulate Matter (TSP); Passenger kilometre (pkm); and net tonne kilometre (ntkm).
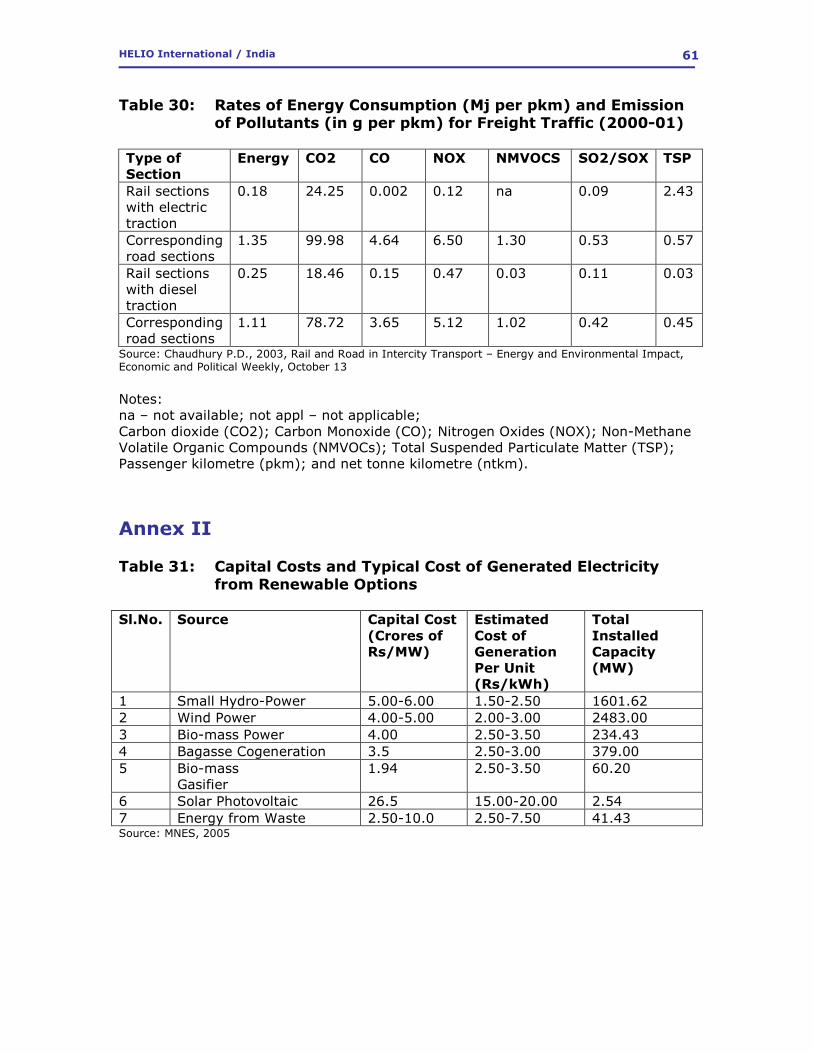
HELIO International / India
61
Table 30: Rates of Energy Consumption (Mj per pkm) and Emission of Pollutants (in g per pkm) for Freight Traffic (2000-01)
Type of Section
Energy CO2 CO NOX NMVOCS SO2/SOX TSP
Rail sections with electric traction
0.18 24.25 0.002 0.12 na 0.09 2.43
Corresponding road sections
1.35 99.98 4.64 6.50 1.30 0.53 0.57
Rail sections with diesel traction
0.25 18.46 0.15 0.47 0.03 0.11 0.03
Corresponding road sections
1.11 78.72 3.65 5.12 1.02 0.42 0.45
Source: Chaudhury P.D., 2003, Rail and Road in Intercity Transport – Energy and Environmental Impact, Economic and Political Weekly, October 13
Notes: na – not available; not appl – not applicable; Carbon dioxide (CO2); Carbon Monoxide (CO); Nitrogen Oxides (NOX); Non-Methane Volatile Organic Compounds (NMVOCs); Total Suspended Particulate Matter (TSP); Passenger kilometre (pkm); and net tonne kilometre (ntkm).
Annex II Table 31: Capital Costs and Typical Cost of Generated Electricity
from Renewable Options Sl.No. Source Capital Cost
(Crores of Rs/MW)
Estimated
Cost of Generation Per Unit (Rs/kWh)
Total
Installed Capacity (MW)
1 Small Hydro-Power 5.00-6.00 1.50-2.50 1601.62 2 Wind Power 4.00-5.00 2.00-3.00 2483.00 3 Bio-mass Power 4.00 2.50-3.50 234.43 4 Bagasse Cogeneration 3.5 2.50-3.00 379.00 5 Bio-mass
Gasifier 1.94 2.50-3.50 60.20
6 Solar Photovoltaic 26.5 15.00-20.00 2.54 7 Energy from Waste 2.50-10.0 2.50-7.50 41.43 Source: MNES, 2005