Embed Size (px)
Citation preview

ENERGY AND RESILIENT CITIES
OECD
Public Governance and Territorial Development
Regional Policies for Sustainable Development
Masaru Sugahara

Objective
• To explore how cities can manage energy smartly so as to build resilience.
Energy and Resilient Cites : Thematic study of “Resilient Cites” project
• Ensuring the access and continual provision of energy is critical for resilience in cities.
• Energy has various impacts on resilience in cities.
Key questions
• How can energy influence resilience in cities?
• What are the effective policy strategies for managing energy smartly so as to build resilience?
Outline of the study

Structure of the report
Chapter 1. How energy can influence resilience in cities Social, environmental, economic and institutional aspects
Chapter 2. Policy practices on energy in cities
Toronto (Canada) Barcelona (Spain) Munich (Germany) Kyoto (Japan) Bristol (UK) Perpignan (France)
Chapter 3. Conclusions
Summarises key policy strategies for managing energy smartly to build resilience in cities.

URBANISATION AND ENERGY

Energy production and GDP
-4
-2
0
2
4
619
72
197
4
197
6
197
8
198
0
198
2
198
4
198
6
198
8
199
0
199
2
199
4
199
6
199
8
20
00
20
02
20
04
20
06
20
08
20
10
20
12
20
14Gr
ow
th r
ate
s (
%)
GDP growth Energy production growth rate
Source: OECD (2016), OECD.Stat
Growth rate of energy production and GDP in OECD

Energy demand in cities will increase
7,908
9,785
12,374
3,822 4,336 4,640
-
2,000
4,000
6,000
8,000
10,000
12,000
14,000
2006 2015 2030
Mtoe
Energy demand in cities Energy demand outside of cities
Estimated energy demand in cities
Source: Data from IEA (2008)
Energy demand will increase by 57% in cities
73% of the world energy demand

Urbanisation correlates with energy
consumption Urban population share and Total final consumption of energy per capita (2010)
Source: Own calculations based on the data from UN (2014), IEA (2015)
Australia Austria
Belgium
Canada
Chile
Czech Republic Denmark
Estonia
Finland
France
Germany
Greece Hungary
Iceland
Ireland
Israel Italy Japan
Korea
Luxembourg
Mexico
Netherlands
New Zealand
Norway
Poland
Portugal
Slovak Republic Slovenia
Spain
Sweden
Switzerland
Turkey
United Kingdom
United States
0
1
2
3
4
5
6
7
8
9
50% 60% 70% 80% 90% 100%
TF
C /
Po
pu
lati
on
(2
010
) (k
toe
)
Urban population share (2010)

Cities use more fossil fuels than rural areas
Fossil fuels, 86%
Fossil fuels, 69%
Nuclear, 7%
Nuclear, 5%
Renewables, 7%
Renewables, 26%
0%
20%
40%
60%
80%
100%
Cities Outside of cities
Energy demand by fuel type (2006)
Note: Renewables include hydro, biomass and waste, and other renewables. Fossil fuels include coal, oil and gas. “Cities” refers to all urban areas, from megacities to smaller-scale urban settlements. Energy demand was calculated by data including the US, EU, Australia, New Zealand, China, Tokyo and Moscow (IEA, 2008). “Outside cities” refers to the area outside the aforementioned “Cities”. Source: Data from IEA (2008)

Renewable energy production is growing
7.8%
8.2%
11.5%
7%
8%
9%
10%
11%
12%
13%
0
50 000
100 000
150 000
200 000
250 000
300 000
350 000
400 000
450 000
500 000
Sh
ar
e o
f r
en
ew
ab
les
in
to
tal
en
er
gy
pr
od
uc
tio
n
(%)
Pr
od
uc
tio
n o
f r
en
ew
ab
le e
ne
rg
y (
kto
e)
Charcoal Tide, Wave and OceanOther Liquid Biofuels Solar ThermalSolar Photovoltaics Renewable Municipal WasteBiodiesel BiogasesBiogasoline GeothermalWind HydroSolid Biofuel excluding charcoal Share of renewables in total energy production
Source: OECD (2016), OECD.Stat
Renewable energy production and its share in OECD
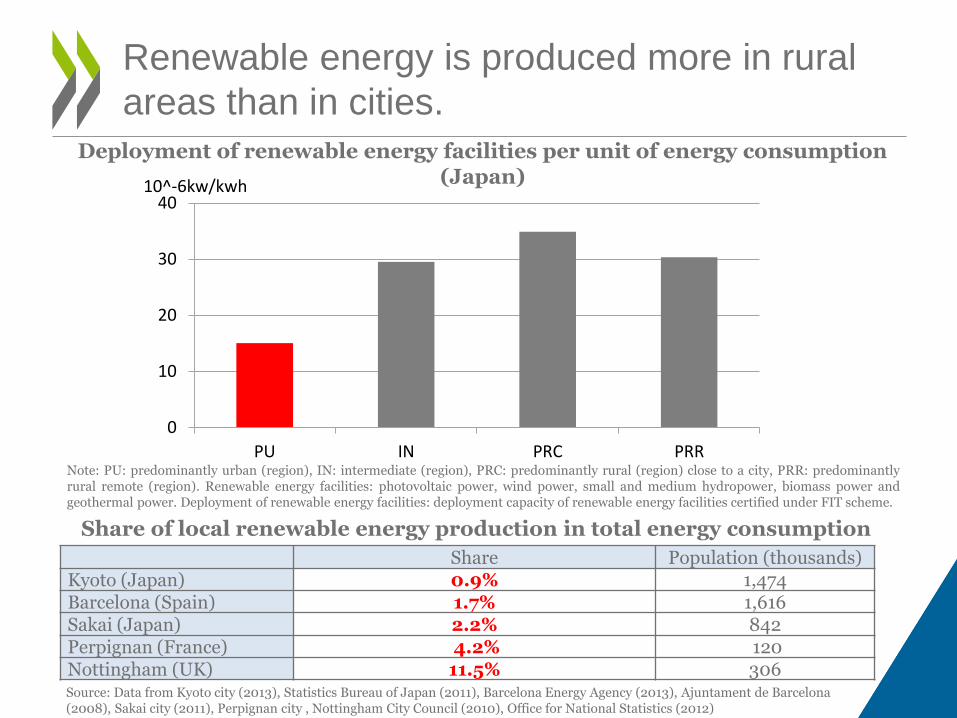
Renewable energy is produced more in rural
areas than in cities.
0
10
20
30
40
PU IN PRC PRR
10^-6kw/kwh
Note: PU: predominantly urban (region), IN: intermediate (region), PRC: predominantly rural (region) close to a city, PRR: predominantly rural remote (region). Renewable energy facilities: photovoltaic power, wind power, small and medium hydropower, biomass power and geothermal power. Deployment of renewable energy facilities: deployment capacity of renewable energy facilities certified under FIT scheme.
Deployment of renewable energy facilities per unit of energy consumption (Japan)
Share of local renewable energy production in total energy consumption
Share Population (thousands) Kyoto (Japan) 0.9% 1,474 Barcelona (Spain) 1.7% 1,616 Sakai (Japan) 2.2% 842 Perpignan (France) 4.2% 120 Nottingham (UK) 11.5% 306 Source: Data from Kyoto city (2013), Statistics Bureau of Japan (2011), Barcelona Energy Agency (2013), Ajuntament de Barcelona (2008), Sakai city (2011), Perpignan city , Nottingham City Council (2010), Office for National Statistics (2012)

HOW ENERGY GIVES IMPACTS ON RESILIENCE IN CITIES
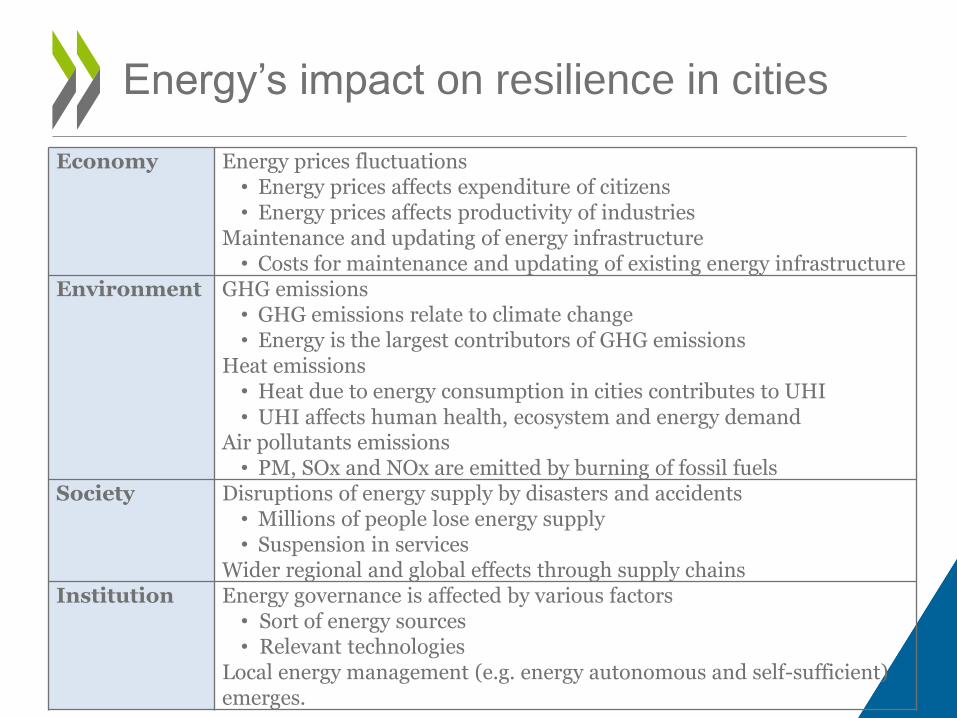
Energy’s impact on resilience in cities
Economy Energy prices fluctuations • Energy prices affects expenditure of citizens • Energy prices affects productivity of industries
Maintenance and updating of energy infrastructure • Costs for maintenance and updating of existing energy infrastructure
Environment GHG emissions • GHG emissions relate to climate change • Energy is the largest contributors of GHG emissions
Heat emissions • Heat due to energy consumption in cities contributes to UHI • UHI affects human health, ecosystem and energy demand
Air pollutants emissions • PM, SOx and NOx are emitted by burning of fossil fuels
Society Disruptions of energy supply by disasters and accidents • Millions of people lose energy supply • Suspension in services
Wider regional and global effects through supply chains
Institution
Energy governance is affected by various factors • Sort of energy sources • Relevant technologies
Local energy management (e.g. energy autonomous and self-sufficient) emerges.

Total energy prices fluctuate
Source: Data from OECD.Stat; OECD (2015), Energy Prices and Taxes, Vol. 2015/3
OECD - Energy end-use price indices: real (base year 2010)
40
50
60
70
80
90
100
110
120
Weighted average index of both industry and households
Industrial index
Households index

Using fossil fuels impacts human health
9% of metropolitan population are below WHO air quality guidelines (10μg/m³)
PM2.5 in the OECD metropolitan areas (2005)
Source: Data from The OECD Metropolitan Areas Database
<10µg/m³ 9%
10 to 15µg/m³ 28%
15 to 25µg/m³ 53%
25 to 35µg/m³ 9%
35µg/m³< 1%

Energy disruptions by disasters and accidents
impact economy and societies in cities
Disasters and accidents Impact
Hurricane Sandy (October 2012)
• More than 8 million customers in 21 states lost electricity
• New York Stock Exchange was closed for 2 days • Some of the nuclear power units in New York and New
Jersey shut down
The Great East Japan Earthquake (March 2011)
• 8 million households in east part of Japan affected • About a week required to recover in most areas • Rolling blackouts were implemented to respond to long
term energy shortages
Blackout in Europe in November 2006 (November 2006)
• 15 million households across Europe affected • UCTE interconnected grid affected by an incident
originating from the North German transmission grid
The Northeast blackout of 2003 (August 2003)
• 50 million people across the U.S.-Canadian Border affected
• The blackout lasted 4 days • USD 4-10 bn costs in U.S., GDP in Canada for August
down by 0.7%, manufacturing shipments in Ontario down CAD 2.3 bn

POLICY PRACTICES OF ENERGY IN CITIES

Case study cities
Population GDP per capita GHG emissions per capita
Energy consumption per capita
Toronto (Canada)
2 808 503 (2014)
37 522 EUR (2014)
7.4 tCO2e (2013)
9.2 MWh (2009) (electricity)
Barcelona (Spain)
1 602 386 (2014)
39 632 EUR (2012)
2.3 tCO2e (2012)
10.4 MWh (2012)
Munich (Germany)
1 517 868 (2015)
57 980 EUR (2012)
7.6 t * (2012, CO2 only)
23.7 MWh (2012)
Kyoto (Japan)
1 468 019 (2015)
30 531 EUR (2012)
5.4 tCO2e (2013)
15.2 MWh (2012)
Bristol (UK)
442 500 (2014)
30 298 EUR (2014)
5.5 t * (2008, CO2 only)
0.1 MWh (2014) (electricity, by
city council)
Perpignan (France)
120 959 (2013)
N/A 9.4 tCO2e (2012)
5.2 MWh (**) (electricity)
Perpignan Méditerranée Communauté Urbaine
266 611 (2015)
N/A 9.8 tCO2e (2014)
19.5 MWh (2014)
Note: * GHG emissions data for Munich and Bristol are for the metropolitan areas. According to the EU-OECD definition, metropolitan areas are functional urban areas with a population of between 500 000 and 1.5 million people; where functional urban areas are the densely populated municipalities and adjacent cities with high levels of commuting towards the densely populated urban cores (OECD, 2012d). ** Estimations based on data available; Electricity: 2014, Population: 2012. GDP was collected in local currency units and converted into euros, using specific countries PPP (Purchasing Power Parity) conversion factors and PPP for the 28 European countries as a basis. GDP per capita and energy consumption per capita are author’s own calculation, based on the relevant population data.

Some cities develop more ambitious visions and
targets on energy than national governments.
City’s targets National targets EU targets
Perpignan (France)
100% (2015) (Perpignan Méditerranée)
23% (2020) 32% (2030)
20% (2020) 27% (2030)
Munich (Germany)
100% (2025) 40-45% (2025) 55-60% (2035)
80% (2050)
Bristol (UK)
20% (2020) 15% (2020)
Targets of RE deployment of cities, national governments and EU
Source: Ministry of Ecology, Sustainable Development and Energy, France (n.d), IEA (2015), C40 Cities (2014), Bristol 2015 (2015), Barcelona City Council (n.d), European Commission (2016),

Urban development policies and energy
policies need to be integrated.
Key measures Examples
Public transport and green mobility
• “City master plan” (Kyoto) aims to concentrate urban functions at public transportation centres.
• “Low emissions zone” (Munich) allows vehicles with less particulate emissions to enter the city centre.
Improving energy efficiency of housing, buildings and districts
Improving energy efficiency of housing and buildings • Economic policy tools: “Home Energy Loan Program”
(Toronto) offers low interest loans for local residents. • Technical assistance: “ÖKOPROFIT” (Munich) provides
technical and management advices to local companies. • Regulatory policy tools: “Carbon Reduction
Commitment” (Bristol) requires large organisations to purchase allowances according to their CO2 emission.
Energy self-sufficient buildings and districts • “Community Energy Planning” (Toronto) promotes to
develop RE facilities in neighbourhood-based strategy.
Increasing RE production in the city
• “Local urban planning” (Perpignan) includes land use and regulations of physical environment considering RE.
• Conflicts between RE facilities and urban design are addressed by the landscape rules.

Finance schemes are provided by
national and sub national governments Providers of finance
Objectives Tools Examples
National governments
Implement national energy policies
Grants Subsidies
Invest for the future (France) to finance for increasing market penetration of RE
Clean energy Fund (Canada) to finance pilot projects which address the institutional difficulties of RE
Encourage actions by subnational governments and local stakeholders
Grants Subsidies
Contract for Difference (UK) to fund the RE plants of local authorities
Energy saving and diversification investment fund (Spain) to finance sustainable developments projects of public or private sectors led by ESCO
Sub national governments
Implement urban energy projects of subnational governments
Interest free loans
Salix scheme (Bristol) to fund energy projects of the city with interest-free loans
Encourage actions by local stakeholders including citizens, communities and local industries
Investment Community programme (Bristol) to promote community-based investment by gathering citizens investment in RE projects
Kyoto civic cooperation power generation scheme (Kyoto) to provide the roofs of public facilities for the organizations which conduct solar generation projects

Institutional capacities development has
to be included in energy policy
Key measures Examples
Collaboration among industries, academia and governments
• “Compromiso 22” (Barcelona) gathers 800 stakeholders including professional associations, universities and businesses to share practices, resources and knowledge.
• “Urban oilfield development project” (Kyoto) cooperates among industry, academia and government to produce petroleum fuel from paper and food waste.
Raising awareness among citizens
• “Eco school district project” (Kyoto) supports communities by providing materials, information and consultation.
• “Bristol Green Capital Official Schools Programme” (Bristol) empowers teachers to introduce sustainability and energy issues in their programme so as to be an ethos for children.
Creating alliances among cities
• “Perpignan Méditerranée consists of 36 cities” including the city of Perpignan set the target of local RE production and implement projects jointly.
• “Designated city council on renewable energy” develops and submits the recommendations on RE policy to the national government (Kyoto).

Pilot projects are useful for future policy
development
Key measures Examples
Mobilizing various stakeholders
• “Catalan Ecopark” (Perpignan) involves stakeholders including electricity, waste treatment and gas companies to develop wind farm, solar plant, heat network, waste energy plant and biogas production unit.
Carried out in particular areas
• “Decentralized power system in Okazaki area” (Kyoto) pilots a community energy management system (CEMS) that networks facilities and optimizes energy use in an entire community.
• “Intervention Plan of Dividing Faces” (Barcelona) was developed in the city’s new innovation and business centre to integrate renewable energy facilities into facades of buildings.
Choosing feasible and effective measures
• “Renewable Energies Expansion Campaign” (Munich) massively develops several sources of renewable energy through the city to select cost-efficient source of renewable energy.

CONCLUSION POLICY STRATEGIES
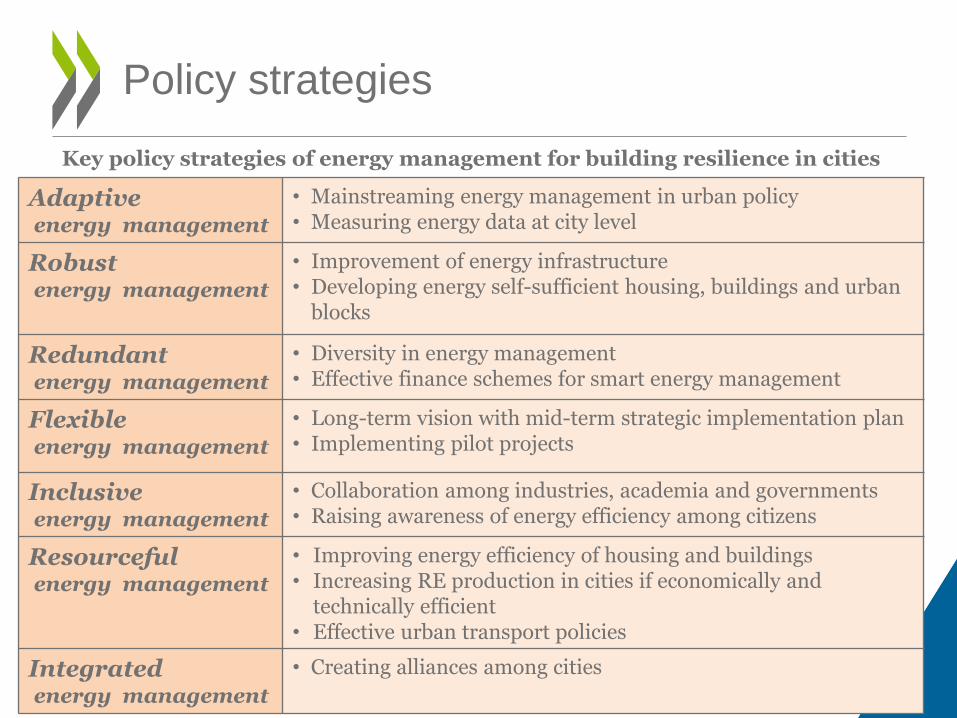
Policy strategies
Adaptive
energy management
• Mainstreaming energy management in urban policy • Measuring energy data at city level
Robust energy management
• Improvement of energy infrastructure • Developing energy self-sufficient housing, buildings and urban
blocks
Redundant energy management
• Diversity in energy management • Effective finance schemes for smart energy management
Flexible energy management
• Long-term vision with mid-term strategic implementation plan • Implementing pilot projects
Inclusive energy management
• Collaboration among industries, academia and governments • Raising awareness of energy efficiency among citizens
Resourceful energy management
• Improving energy efficiency of housing and buildings • Increasing RE production in cities if economically and
technically efficient • Effective urban transport policies
Integrated energy management
• Creating alliances among cities
Key policy strategies of energy management for building resilience in cities