Embed Size (px)
Citation preview
ENERGY AND PROTEIN NUTRITION OFTRANSITION DAIRY COWS
José Eduardo P. Santos
Veterinary Medicine Teaching and Research Center School of Veterinary MedicineUniversity of California - Davis
Grouping Dry Cows
• Dry period:– Far off– Close up
• Several metabolic and endocrine changes taking place associated with different nutrient requirements
• Parity– Primiparous– Multiparous
• Social interaction, competition, and different nutrient requirements
0
10
20
30
40
50
60
70
80
90
100
110
Nu
mb
er
of
co
ws
250 255 260 265 270 275 280 285 290 295 300
Gestation period, d
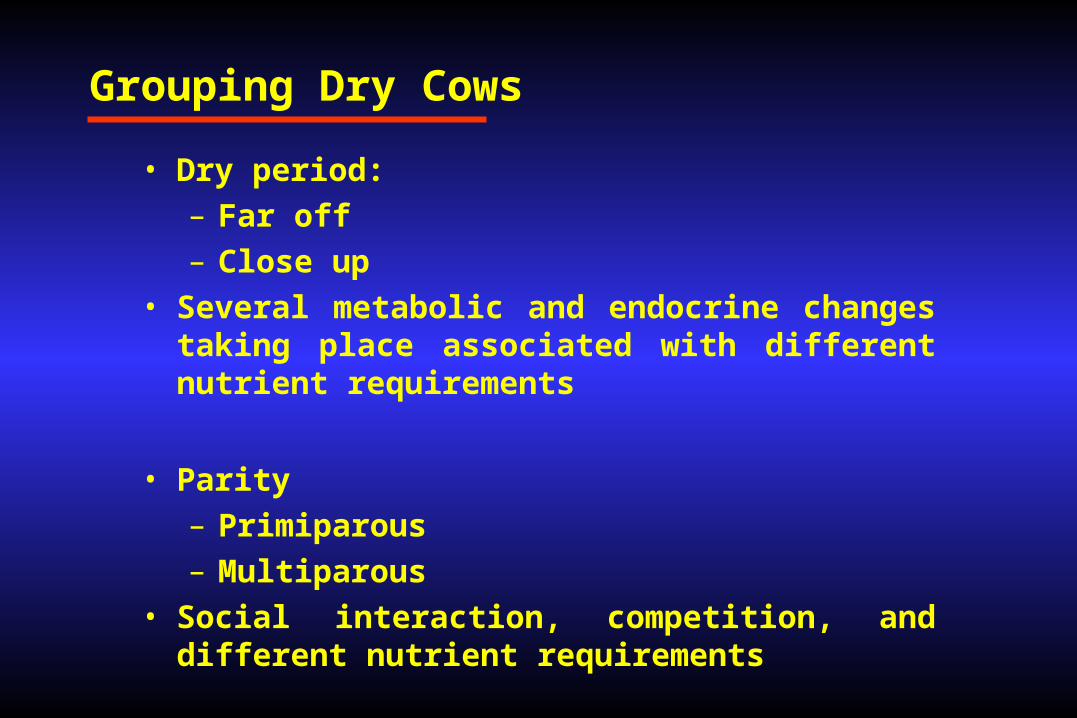
Distribution of the Gestation Period of Holstein Cows (Oetzel, 1998)
24 % 76 %
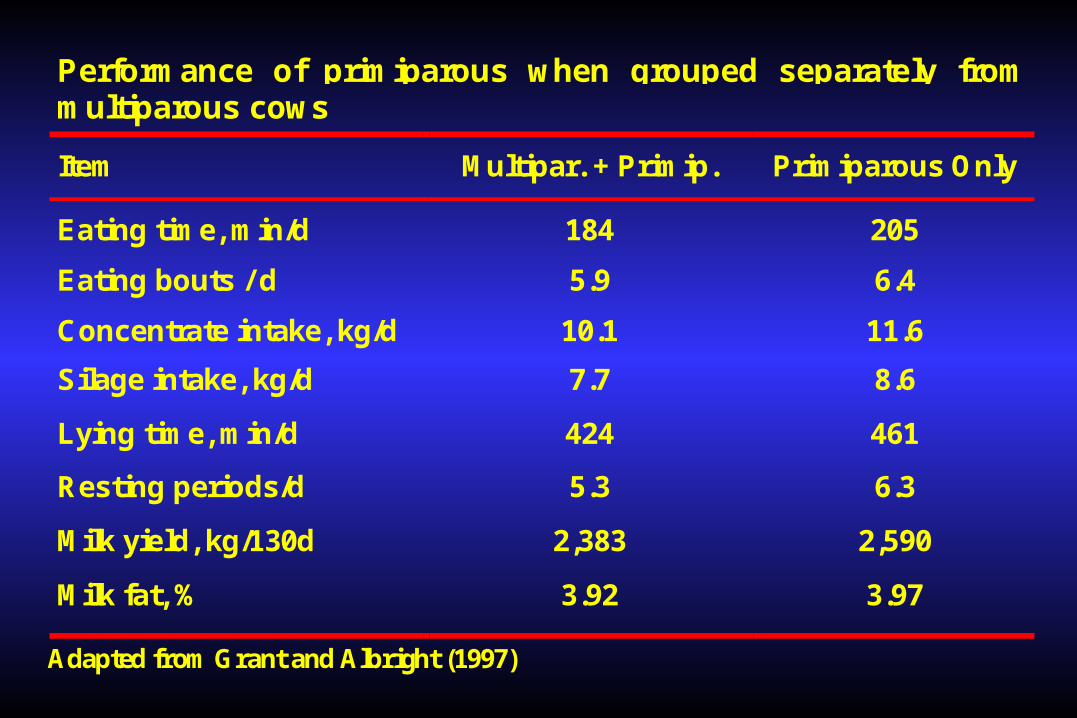
Performance of primiparous when grouped separately frommultiparous cows
Item Multipar. + Primip. Primiparous Only
Eating time, min/d 184 205
Eating bouts / d 5.9 6.4
Concentrate intake, kg/d 10.1 11.6
Silage intake, kg/d 7.7 8.6
Lying time, min/d 424 461
Resting periods/d 5.3 6.3
Milk yield, kg/130d 2,383 2,590
Milk fat, % 3.92 3.97
Adapted from Grant and Albright (1997)
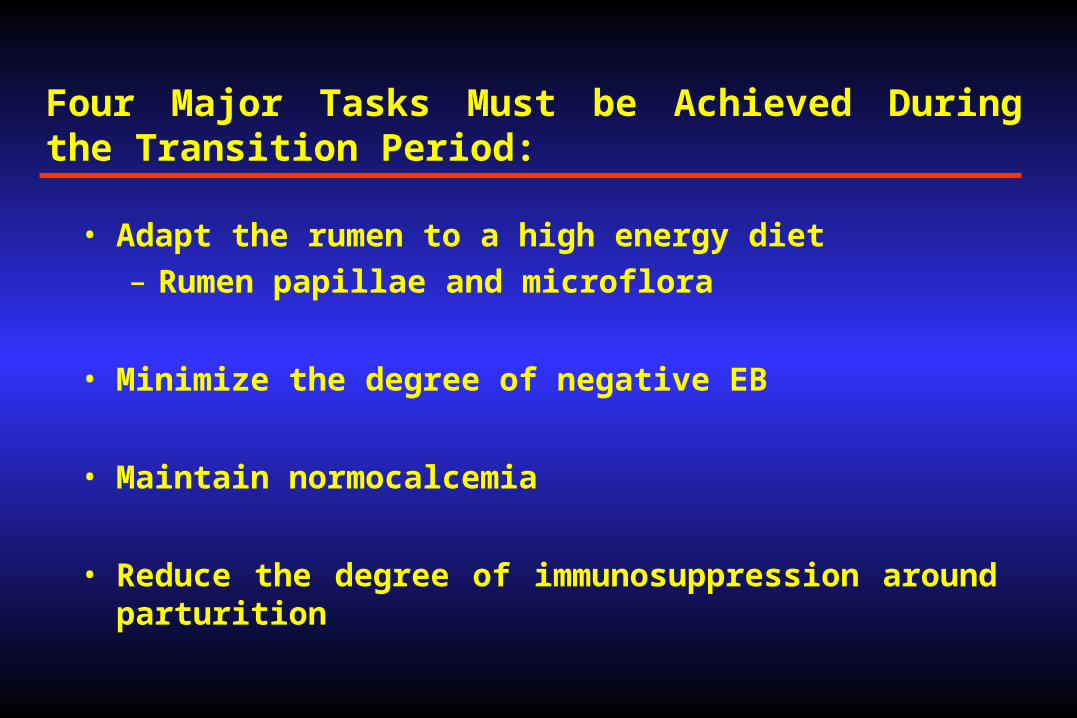
Four Major Tasks Must be Achieved During the Transition Period:
• Adapt the rumen to a high energy diet– Rumen papillae and microflora
• Minimize the degree of negative EB
• Maintain normocalcemia
• Reduce the degree of immunosuppression around parturition
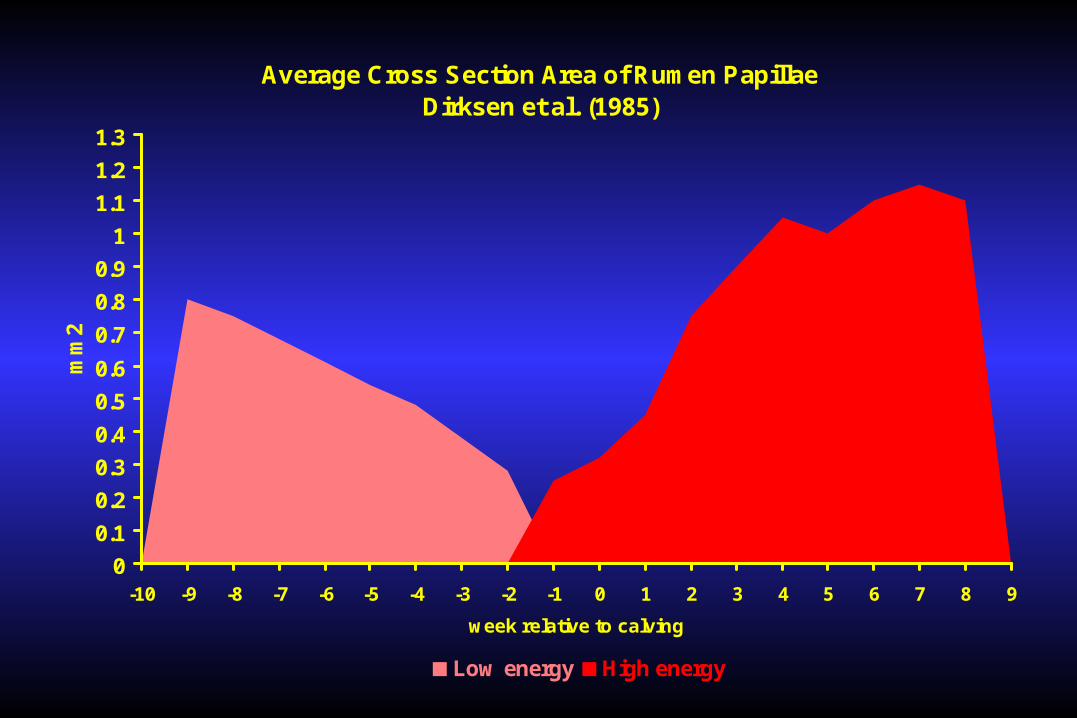
Average Cross Section Area of Rumen PapillaeDirksen et al. (1985)
0
0.1
0.2
0.3
0.4
0.5
0.6
0.7
0.8
0.9
1
1.1
1.2
1.3
-10 -9 -8 -7 -6 -5 -4 -3 -2 -1 0 1 2 3 4 5 6 7 8 9
week relative to calving
mm
2
Low energy High energy
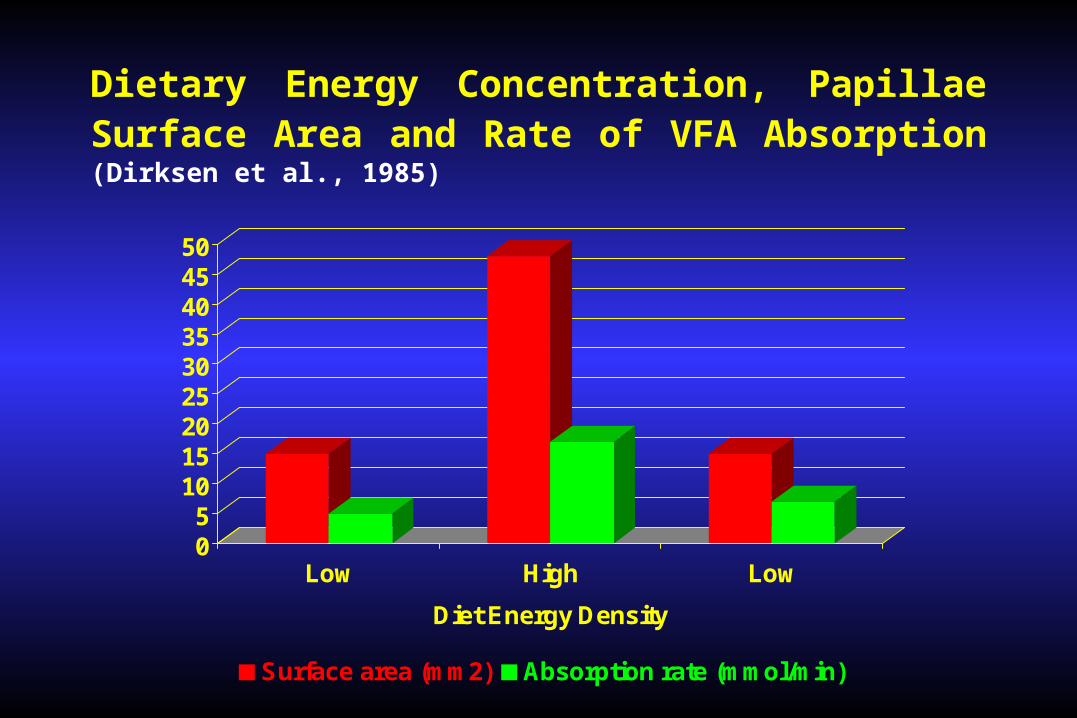
Dietary Energy Concentration, Papillae Surface Area and Rate of VFA Absorption (Dirksen et al., 1985)
05
101520253035404550
Low High Low
Diet Energy Density
Surface area (mm2) Absorption rate (mmol/min)
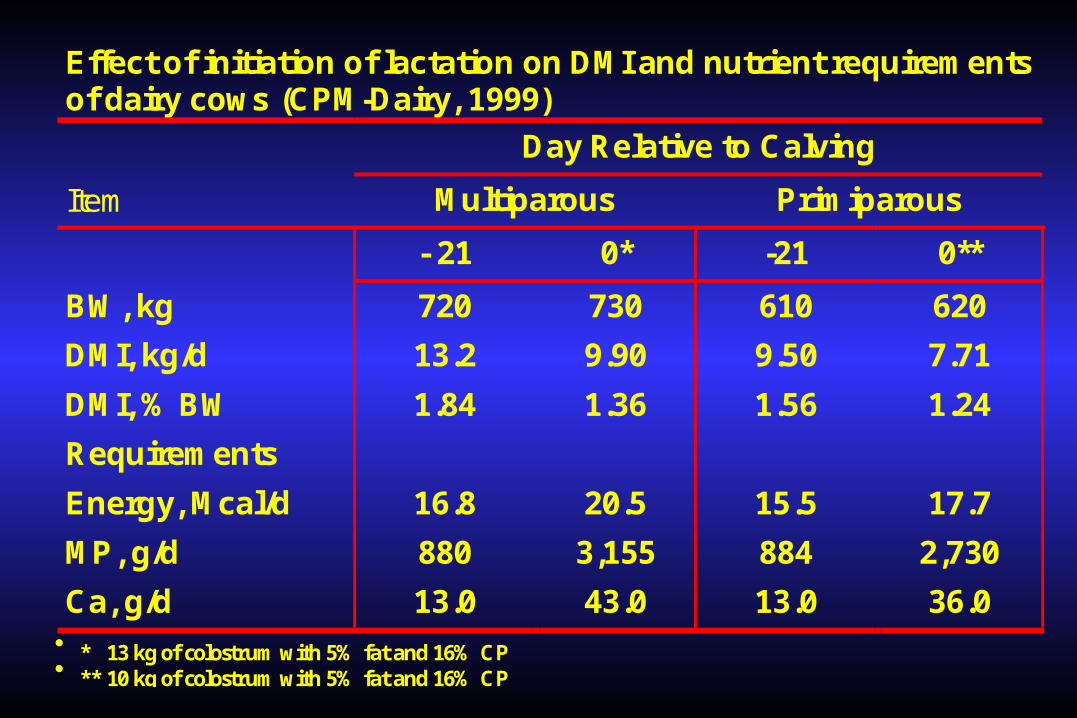
Effect of initiation of lactation on DMI and nutrient requirementsof dairy cows (CPM-Dairy, 1999)
Day Relative to Calving
Item Multiparous Primiparous
- 21 0* -21 0**
BW, kg 720 730 610 620
DMI, kg/d 13.2 9.90 9.50 7.71
DMI, % BW 1.84 1.36 1.56 1.24
Requirements
Energy, Mcal/d 16.8 20.5 15.5 17.7
MP, g/d 880 3,155 884 2,730
Ca, g/d 13.0 43.0 13.0 36.0 * 13 kg of colostrum with 5% fat and 16% CP ** 10 kg of colostrum with 5% fat and 16% CP
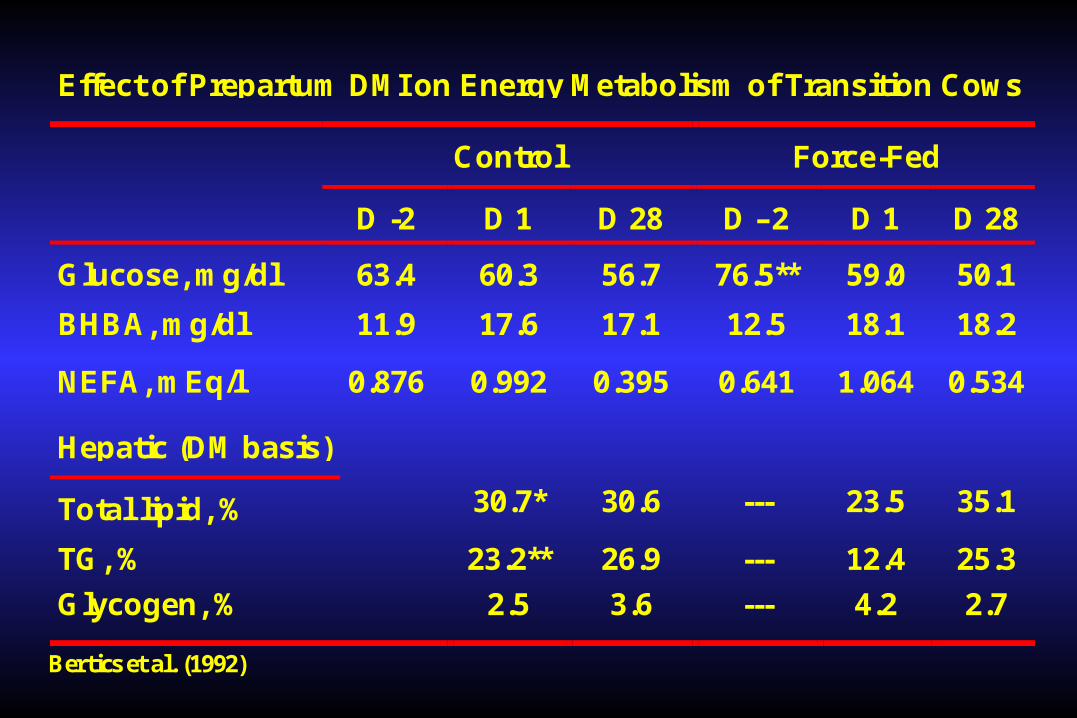
Effect of Prepartum DMI on Energy Metabolism of Transition Cows
Control Force-Fed
D -2 D 1 D 28 D –2 D 1 D 28
Glucose, mg/dl 63.4 60.3 56.7 76.5** 59.0 50.1
BHBA, mg/dl 11.9 17.6 17.1 12.5 18.1 18.2
NEFA, mEq/l 0.876 0.992 0.395 0.641 1.064 0.534
Hepatic (DM basis)
Total lipid, % 30.7* 30.6 --- 23.5 35.1
TG, % 23.2** 26.9 --- 12.4 25.3
Glycogen, % 2.5 3.6 --- 4.2 2.7
Bertics et al. (1992)
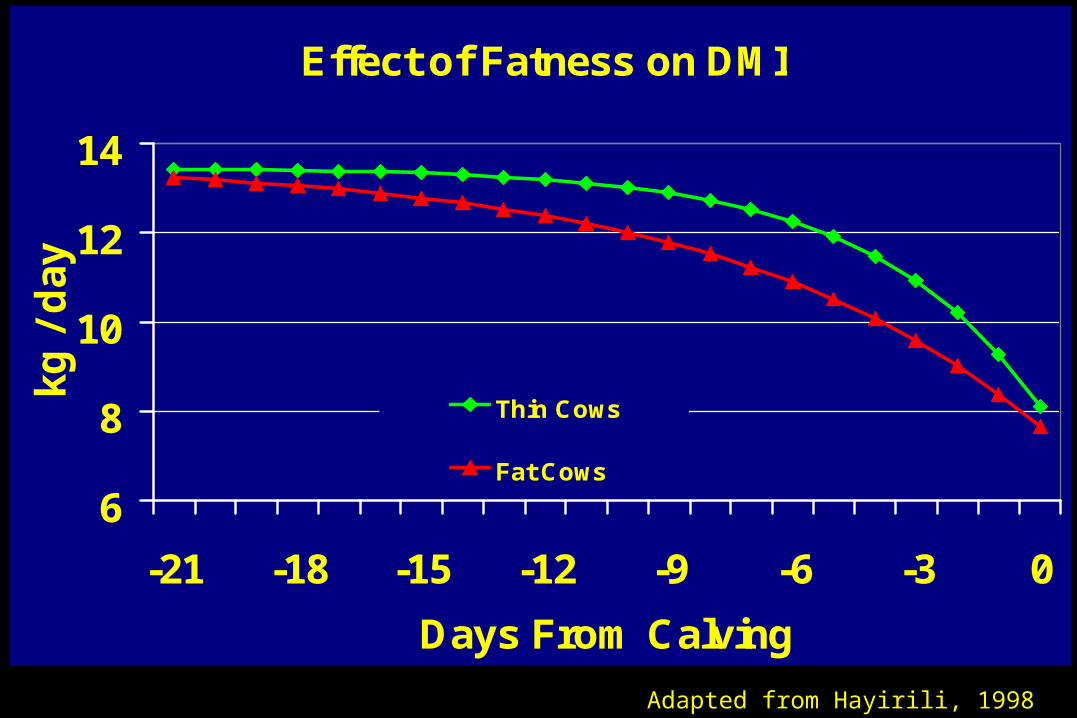
Effect of Fatness on DMI
6
8
10
12
14
-21 -18 -15 -12 -9 -6 -3 0
Days From Calving
kg
/ d
ay
Thin Cows
Fat Cows
Adapted from Hayirili, 1998
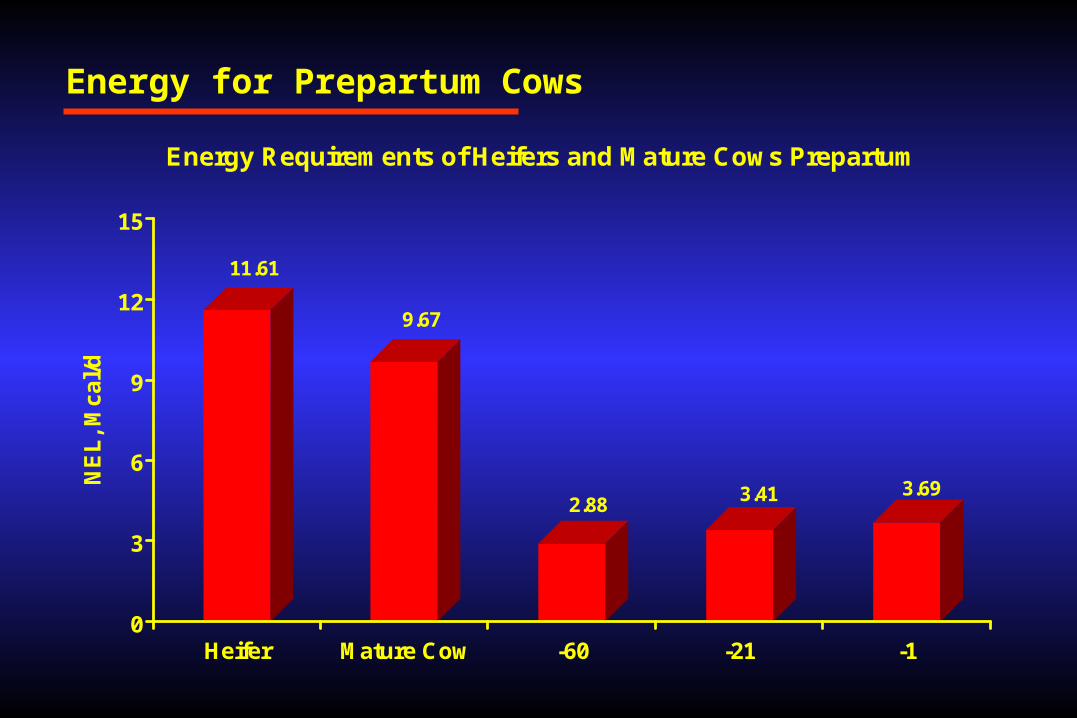
Energy for Prepartum Cows
11.61
9.67
2.88 3.41 3.69
0
3
6
9
12
15
NE
L,
Mc
al/
d
Heifer Mature Cow -60 -21 -1
Energy Requirements of Heifers and Mature Cows Prepartum
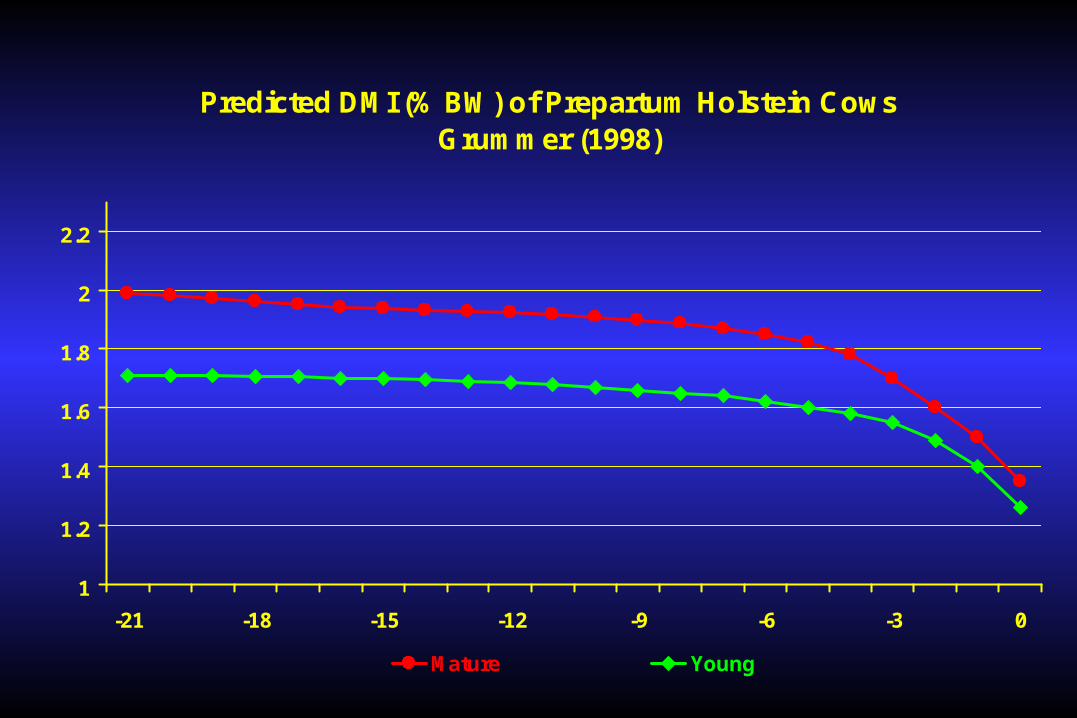
Predicted DMI (% BW) of Prepartum Holstein CowsGrummer (1998)
1
1.2
1.4
1.6
1.8
2
2.2
-21 -18 -15 -12 -9 -6 -3 0
Mature Young
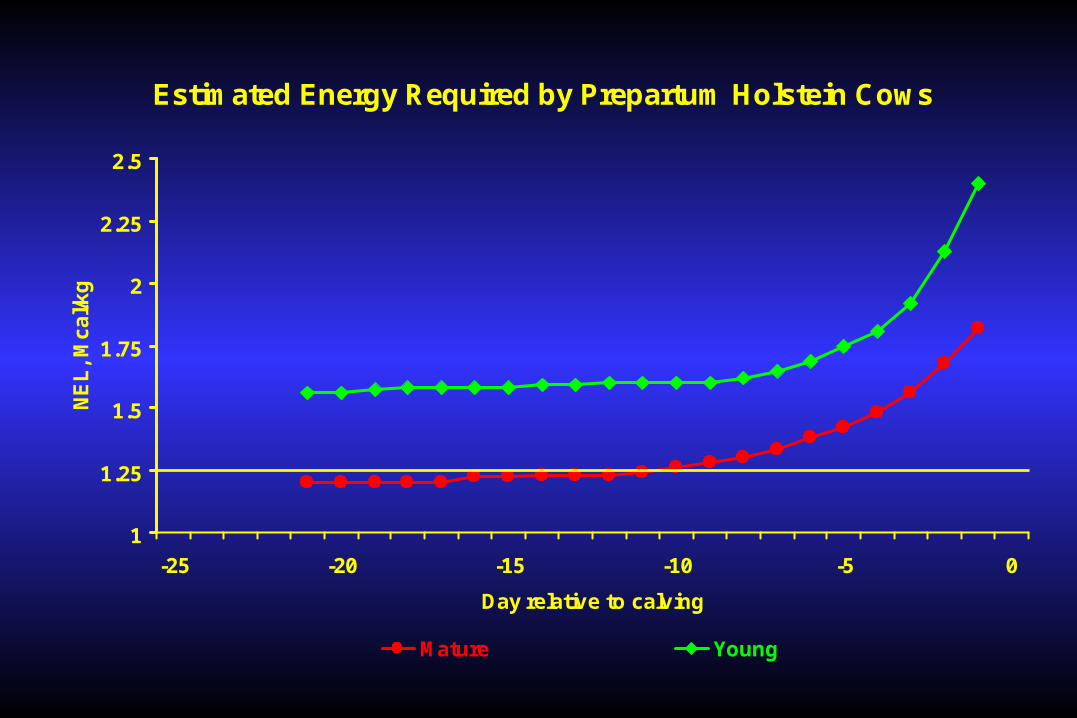
Estimated Energy Required by Prepartum Holstein Cows
1
1.25
1.5
1.75
2
2.25
2.5
-25 -20 -15 -10 -5 0
Day relative to calving
NE
L,
Mc
al/k
g
Mature Young
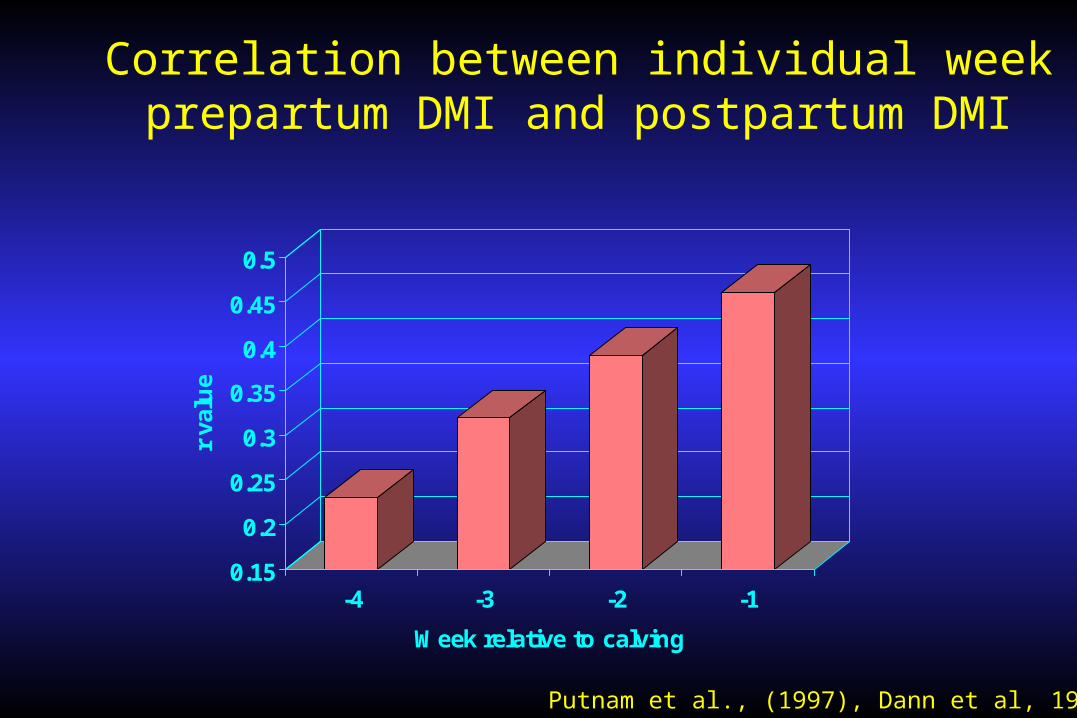
Correlation between individual week prepartum DMI and postpartum DMI
0.15
0.2
0.25
0.3
0.35
0.4
0.45
0.5
r va
lue
-4 -3 -2 -1
Week relative to calving
Putnam et al., (1997), Dann et al, 1999
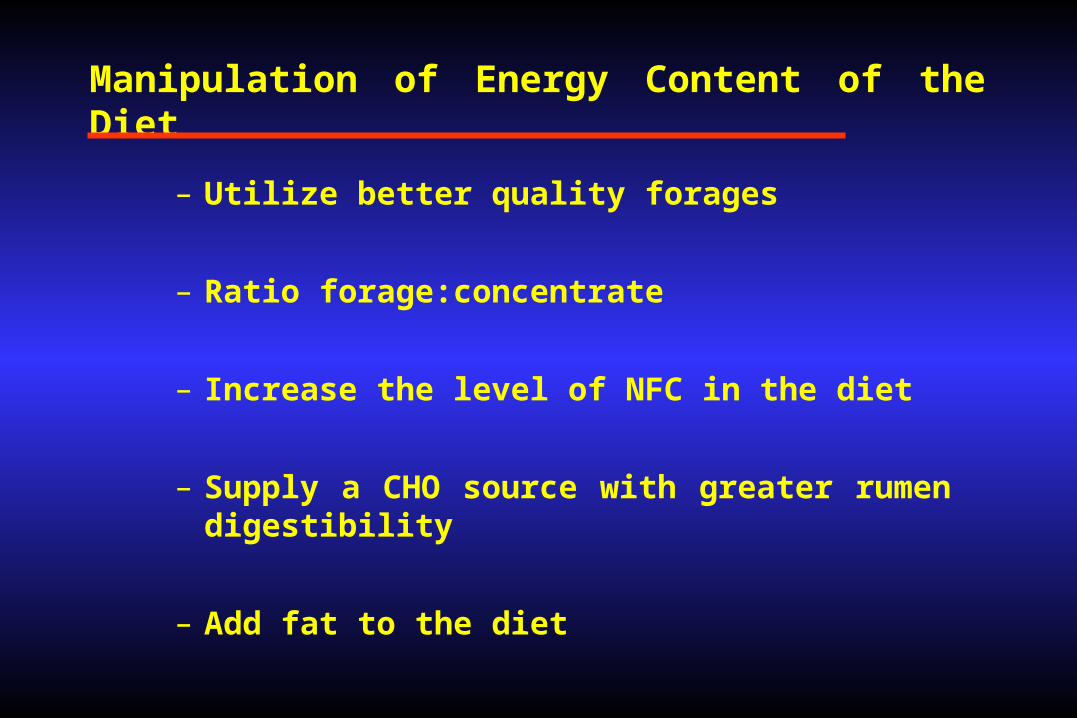
Manipulation of Energy Content of the Diet
– Utilize better quality forages
– Ratio forage:concentrate
– Increase the level of NFC in the diet
– Supply a CHO source with greater rumen digestibility
– Add fat to the diet
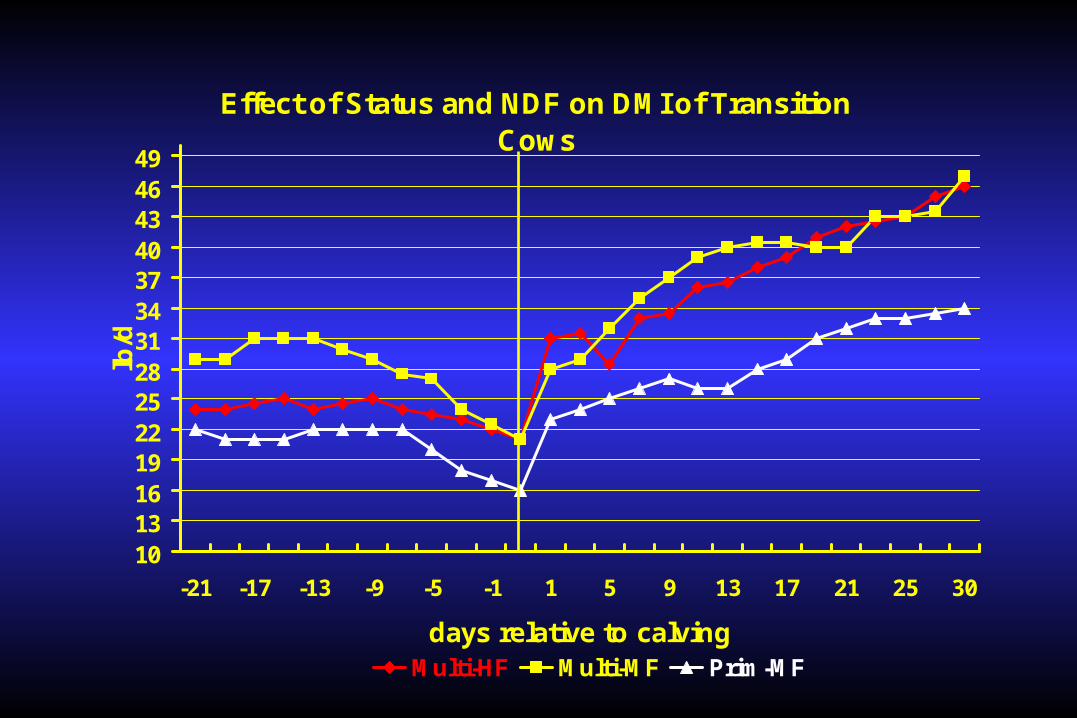
Effect of Status and NDF on DMI of Transition Cows
1013161922252831343740434649
-21 -17 -13 -9 -5 -1 1 5 9 13 17 21 25 30
days relative to calving
lb/d
Multi-HF Multi-MF Prim-MF
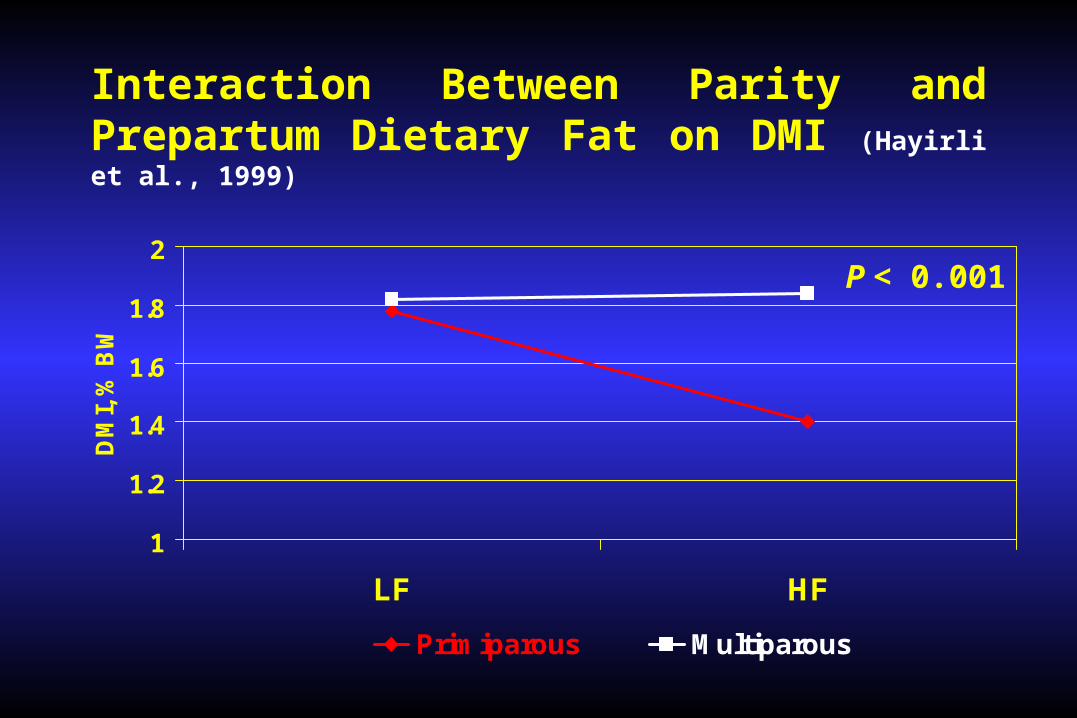
Interaction Between Parity and Prepartum Dietary Fat on DMI (Hayirli et al., 1999)
1
1.2
1.4
1.6
1.8
2
LF HF
DM
I, %
BW
Primiparous Multiparous
P < 0.001
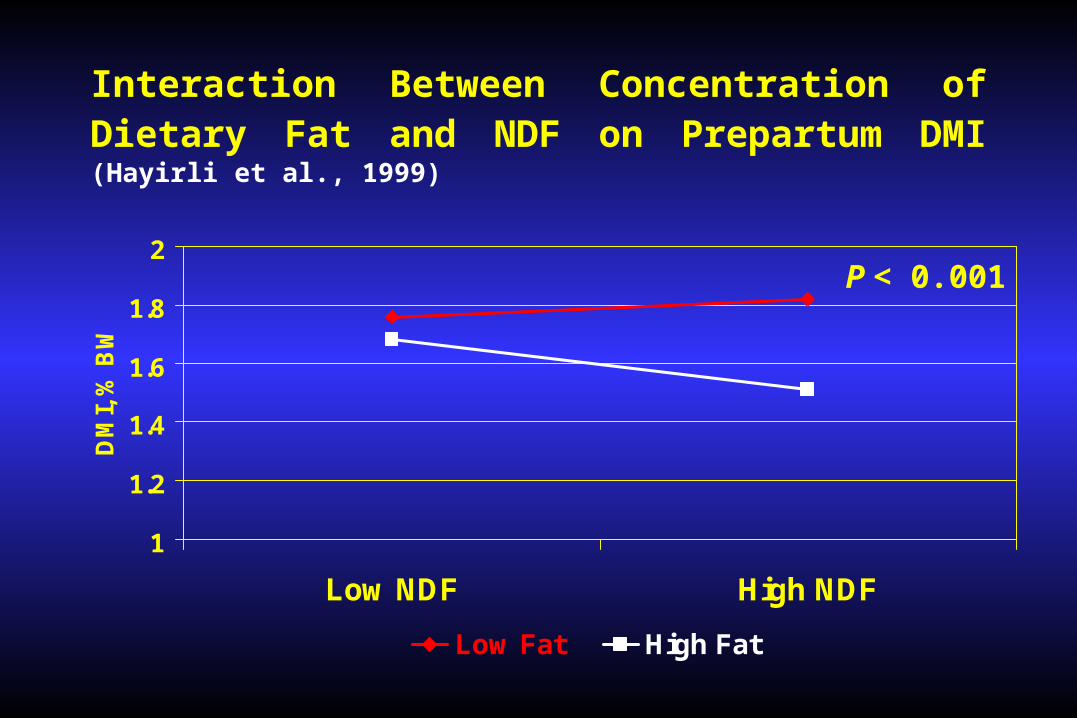
Interaction Between Concentration of Dietary Fat and NDF on Prepartum DMI (Hayirli et al., 1999)
1
1.2
1.4
1.6
1.8
2
Low NDF High NDF
DM
I, %
BW
Low Fat High Fat
P < 0.001
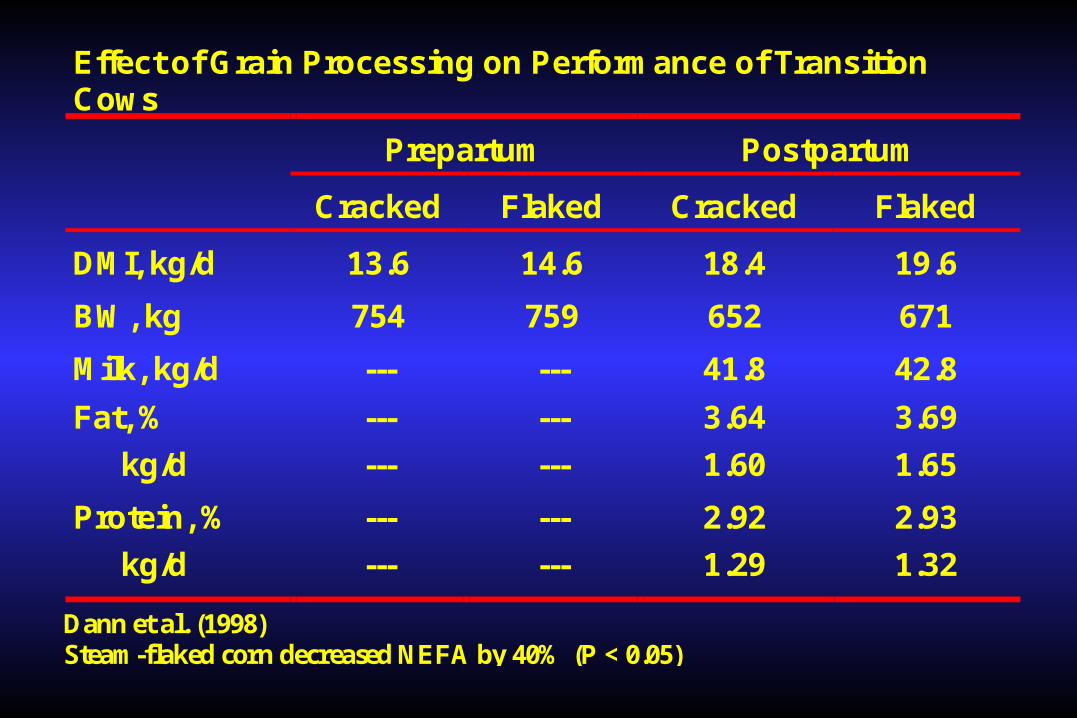
Effect of Grain Processing on Performance of TransitionCows
Prepartum Postpartum
Cracked Flaked Cracked Flaked
DMI, kg/d 13.6 14.6 18.4 19.6
BW, kg 754 759 652 671
Milk, kg/d --- --- 41.8 42.8
Fat, % --- --- 3.64 3.69
kg/d --- --- 1.60 1.65
Protein, % --- --- 2.92 2.93
kg/d --- --- 1.29 1.32
Dann et al. (1998)Steam-flaked corn decreased NEFA by 40% (P < 0.05)
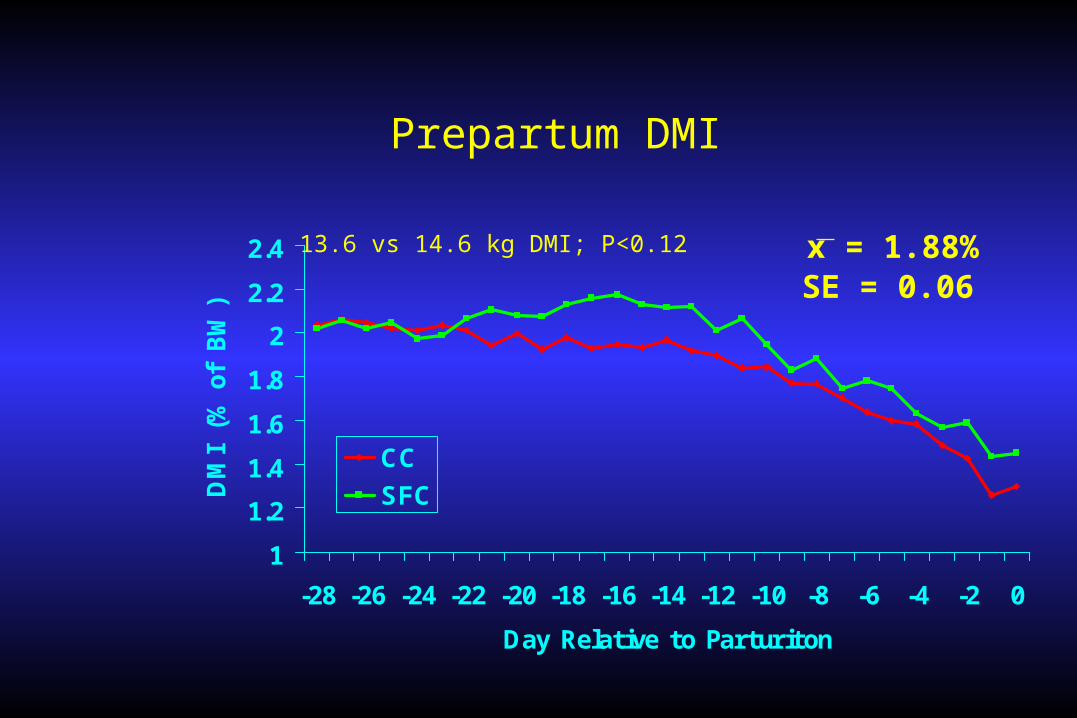
Prepartum DMI
1
1.2
1.4
1.6
1.8
2
2.2
2.4
-28 -26 -24 -22 -20 -18 -16 -14 -12 -10 -8 -6 -4 -2 0
Day Relative to Parturiton
DM
I (%
of
BW
)
CC
SFC
x = 1.88%SE = 0.06
13.6 vs 14.6 kg DMI; P<0.12
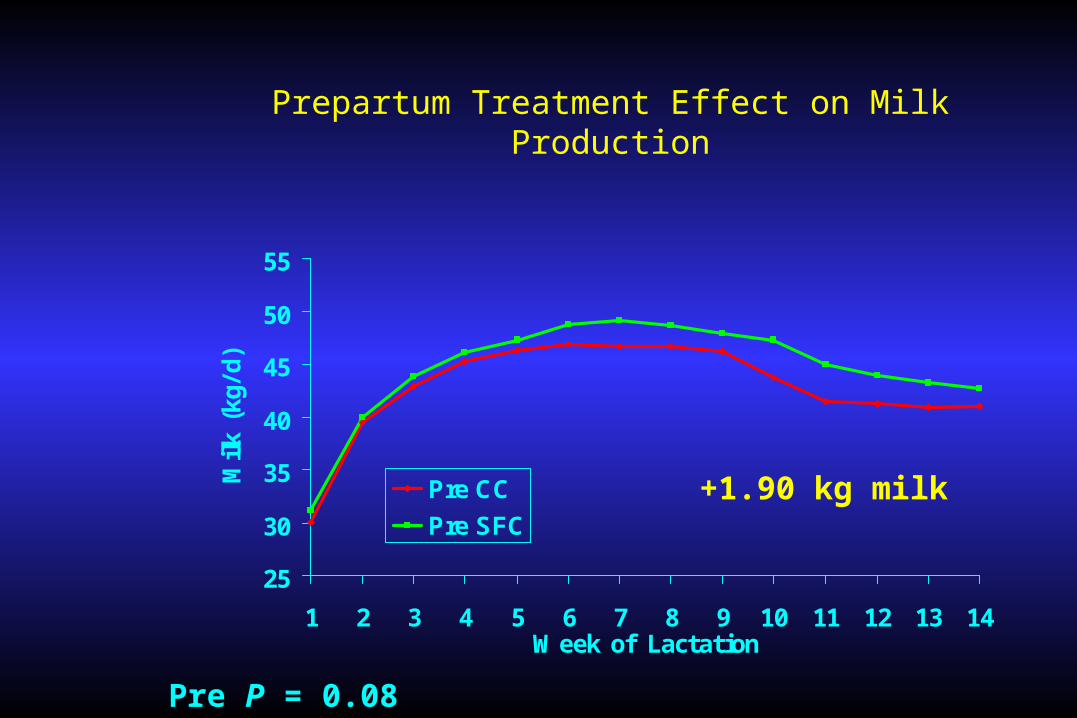
Prepartum Treatment Effect on Milk Production
25
30
35
40
45
50
55
1 2 3 4 5 6 7 8 9 10 11 12 13 14Week of Lactation
Milk
(kg/
d)
Pre CC
Pre SFC
Pre P = 0.08
+1.90 kg milk
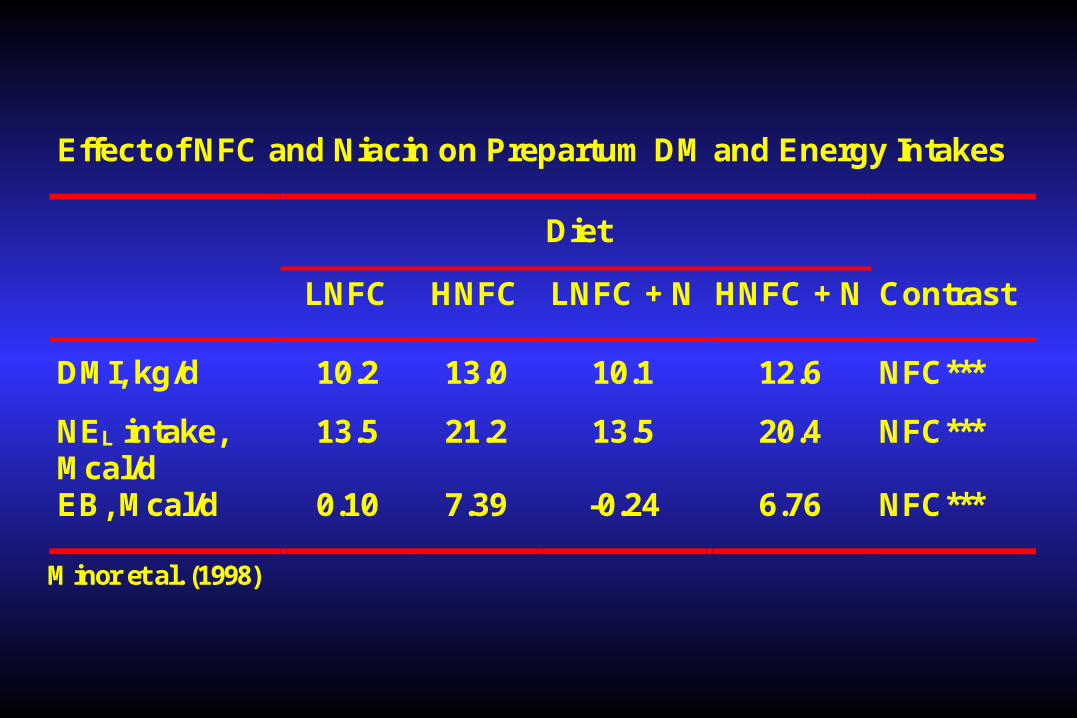
Effect of NFC and Niacin on Prepartum DM and Energy Intakes
Diet
LNFC HNFC LNFC + N HNFC + N Contrast
DMI, kg/d 10.2 13.0 10.1 12.6 NFC***
NEL intake,Mcal/d
13.5 21.2 13.5 20.4 NFC***
EB, Mcal/d 0.10 7.39 -0.24 6.76 NFC***
Minor et al. (1998)
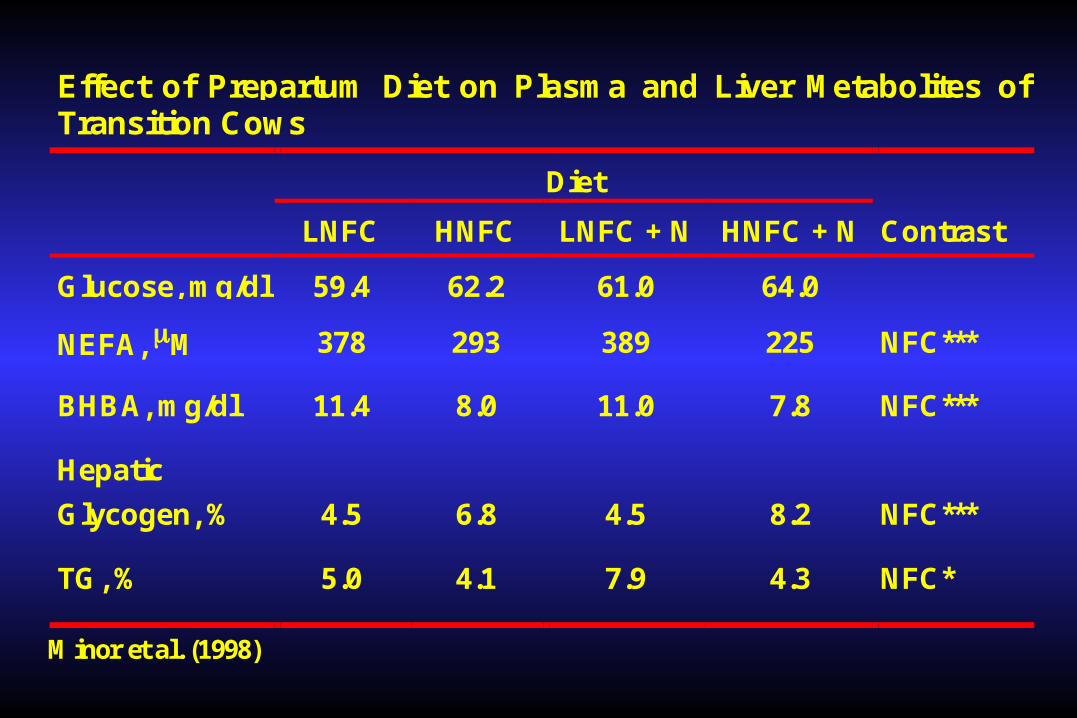
Effect of Prepartum Diet on Plasma and Liver Metabolites ofTransition Cows
Diet
LNFC HNFC LNFC + N HNFC + N Contrast
Glucose, mg/dl 59.4 62.2 61.0 64.0
NEFA, M 378 293 389 225 NFC***
BHBA, mg/dl 11.4 8.0 11.0 7.8 NFC***
Hepatic
Glycogen, % 4.5 6.8 4.5 8.2 NFC***
TG, % 5.0 4.1 7.9 4.3 NFC*
Minor et al. (1998)
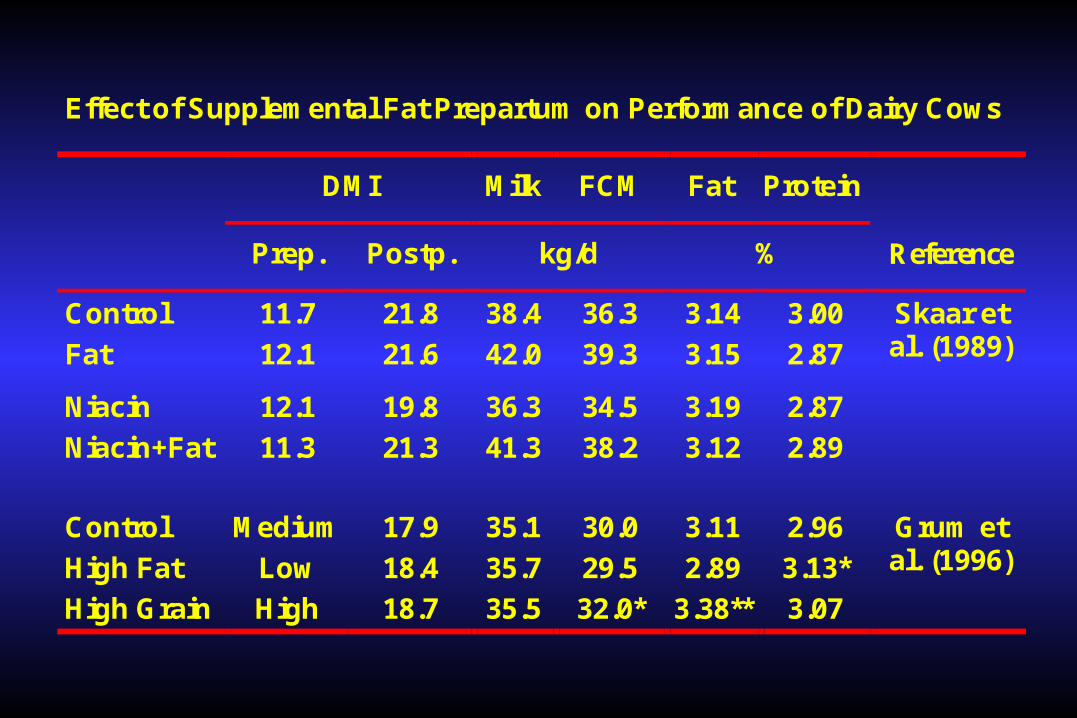
Effect of Supplemental Fat Prepartum on Performance of Dairy Cows
DMI Milk FCM Fat Protein
Prep. Postp. kg/d % Reference
Control
Fat
11.7
12.1
21.8
21.6
38.4
42.0
36.3
39.3
3.14
3.15
3.00
2.87
Skaar etal. (1989)
Niacin
Niacin+Fat
12.1
11.3
19.8
21.3
36.3
41.3
34.5
38.2
3.19
3.12
2.87
2.89
Control
High Fat
High Grain
Medium
Low
High
17.9
18.4
18.7
35.1
35.7
35.5
30.0
29.5
32.0*
3.11
2.89
3.38**
2.96
3.13*
3.07
Grum etal. (1996)
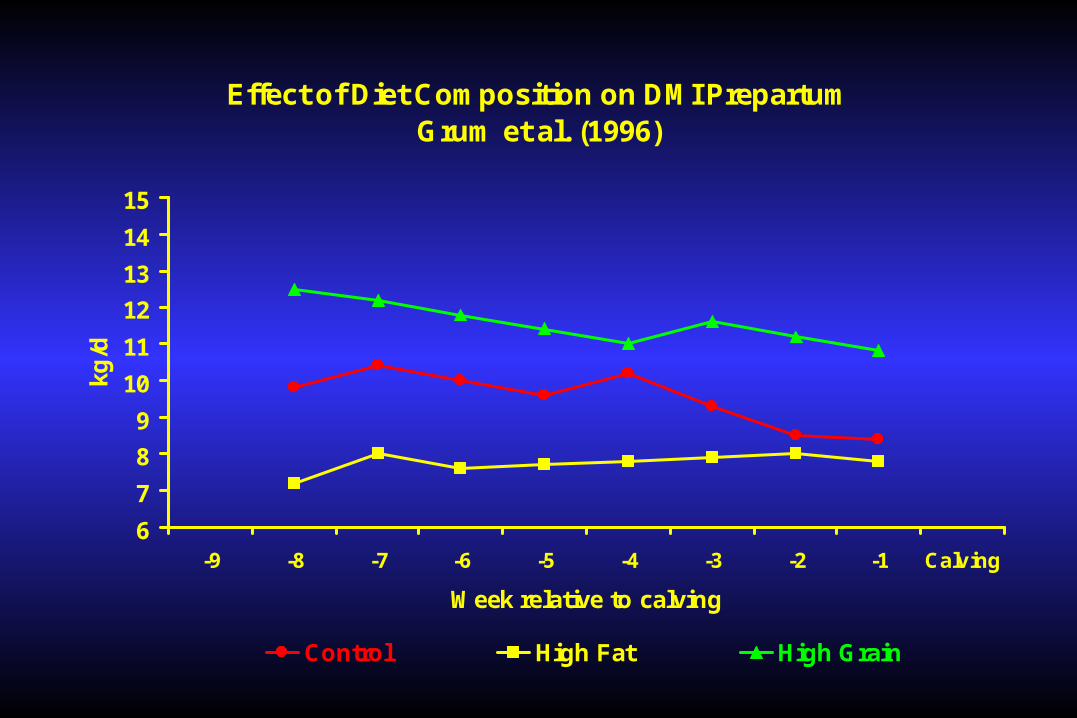
Effect of Diet Composition on DMI PrepartumGrum et al. (1996)
6
7
8
9
10
11
12
13
14
15
-9 -8 -7 -6 -5 -4 -3 -2 -1 Calving
Week relative to calving
kg/d
Control High Fat High Grain
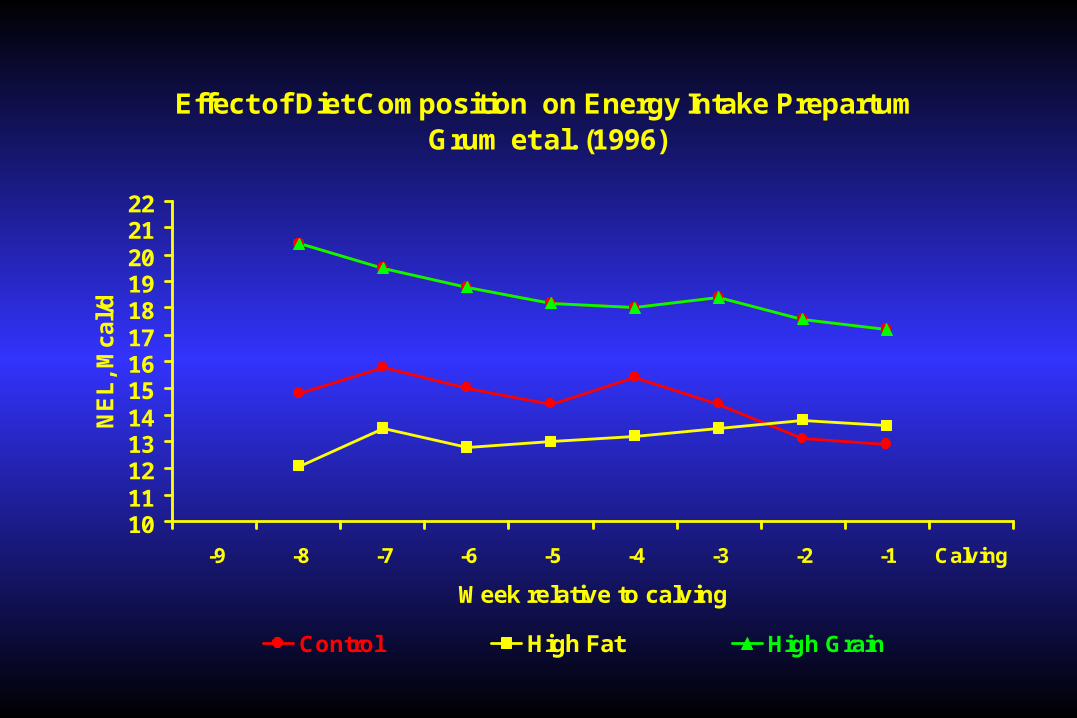
Effect of Diet Composition on Energy Intake PrepartumGrum et al. (1996)
10111213141516171819202122
-9 -8 -7 -6 -5 -4 -3 -2 -1 Calving
Week relative to calving
NE
L,
Mc
al/
d
Control High Fat High Grain
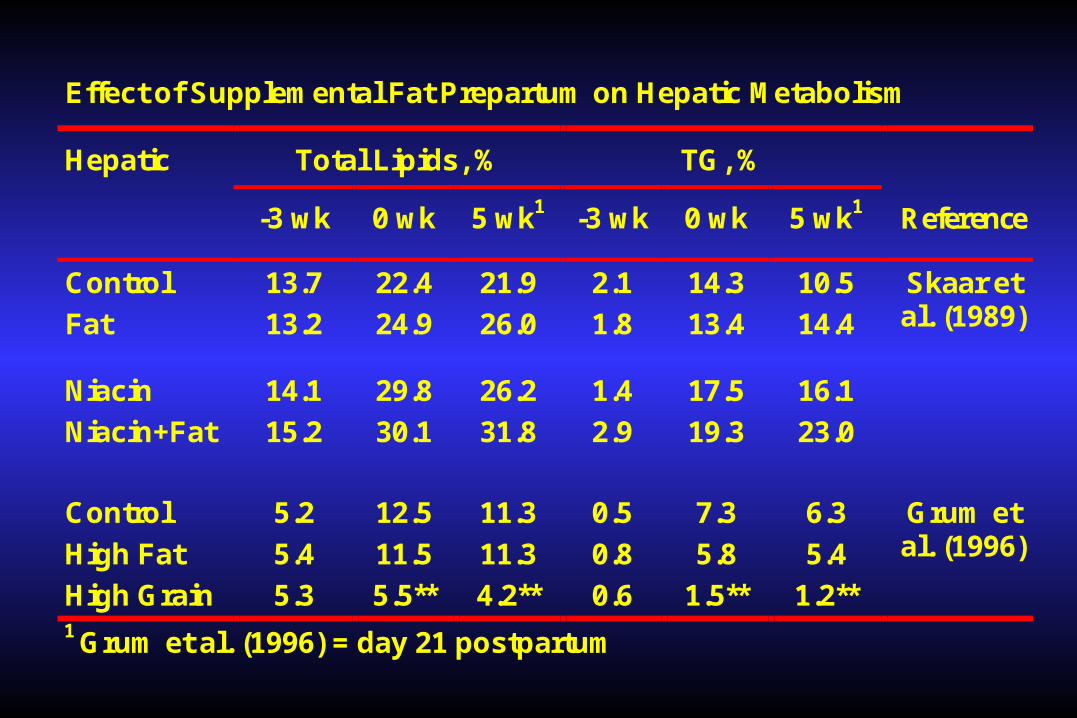
Effect of Supplemental Fat Prepartum on Hepatic Metabolism
Hepatic Total Lipids, % TG, %
-3 wk 0 wk 5 wk1 -3 wk 0 wk 5 wk1 Reference
Control
Fat
13.7
13.2
22.4
24.9
21.9
26.0
2.1
1.8
14.3
13.4
10.5
14.4
Skaar etal. (1989)
Niacin
Niacin+Fat
14.1
15.2
29.8
30.1
26.2
31.8
1.4
2.9
17.5
19.3
16.1
23.0
Control
High Fat
High Grain
5.2
5.4
5.3
12.5
11.5
5.5**
11.3
11.3
4.2**
0.5
0.8
0.6
7.3
5.8
1.5**
6.3
5.4
1.2**
Grum etal. (1996)
1 Grum et al. (1996) = day 21 postpartum
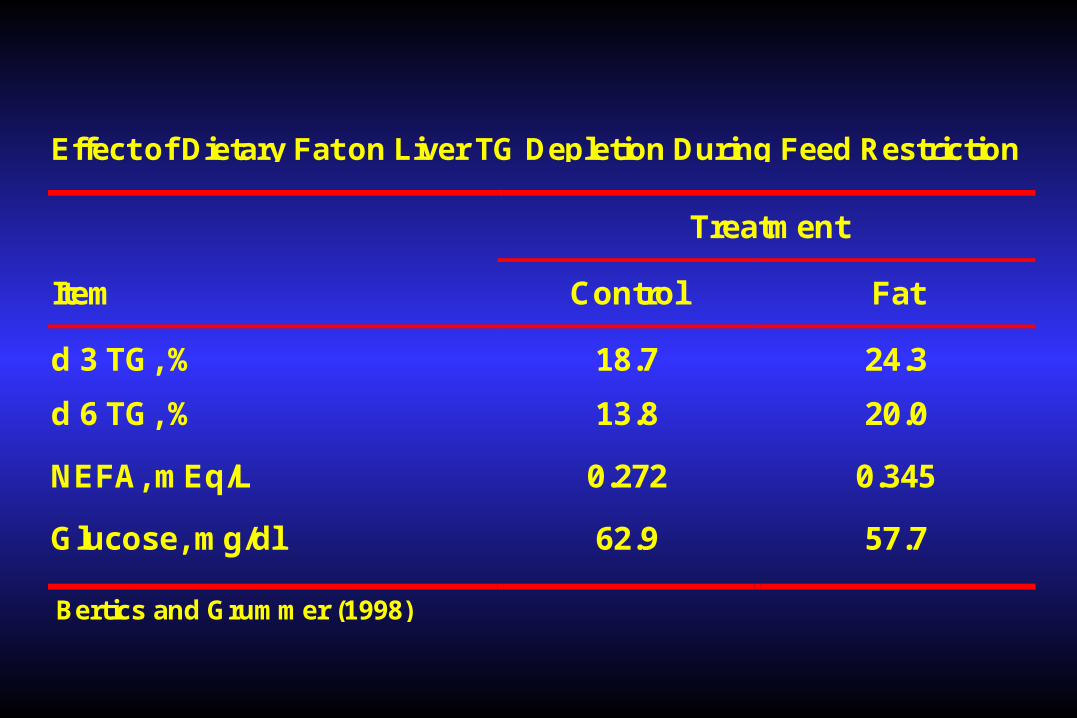
Effect of Dietary Fat on Liver TG Depletion During Feed Restriction
Treatment
Item Control Fat
d 3 TG, % 18.7 24.3
d 6 TG, % 13.8 20.0
NEFA, mEq/L 0.272 0.345
Glucose, mg/dl 62.9 57.7
Bertics and Grummer (1998)
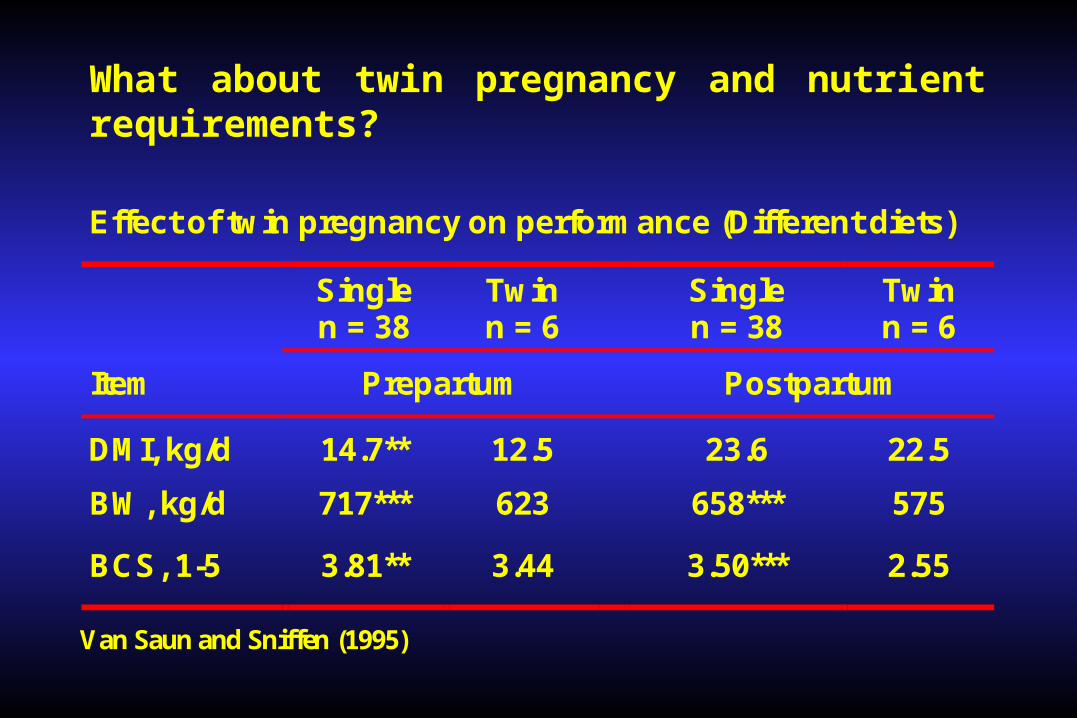
What about twin pregnancy and nutrient requirements?
Effect of twin pregnancy on performance (Different diets)
Singlen = 38
Twinn = 6
Singlen = 38
Twinn = 6
Item Prepartum Postpartum
DMI, kg/d 14.7** 12.5 23.6 22.5
BW, kg/d 717*** 623 658*** 575
BCS, 1-5 3.81** 3.44 3.50*** 2.55
Van Saun and Sniffen (1995)
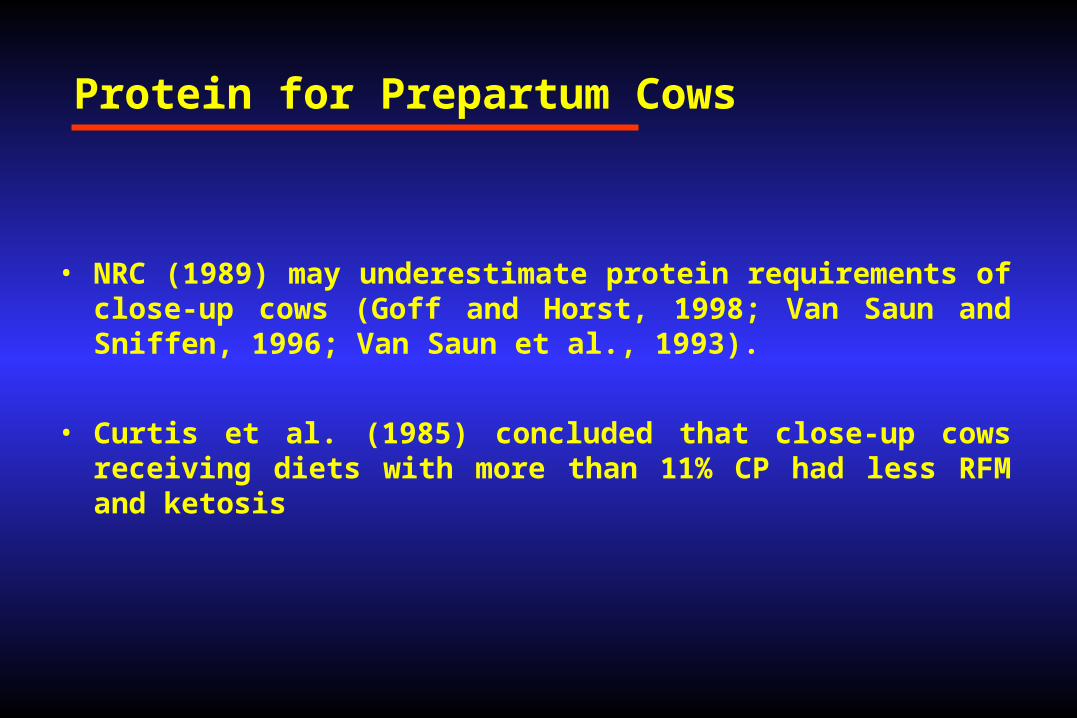
Protein for Prepartum Cows
• NRC (1989) may underestimate protein requirements of close-up cows (Goff and Horst, 1998; Van Saun and Sniffen, 1996; Van Saun et al., 1993).
• Curtis et al. (1985) concluded that close-up cows receiving diets with more than 11% CP had less RFM and ketosis
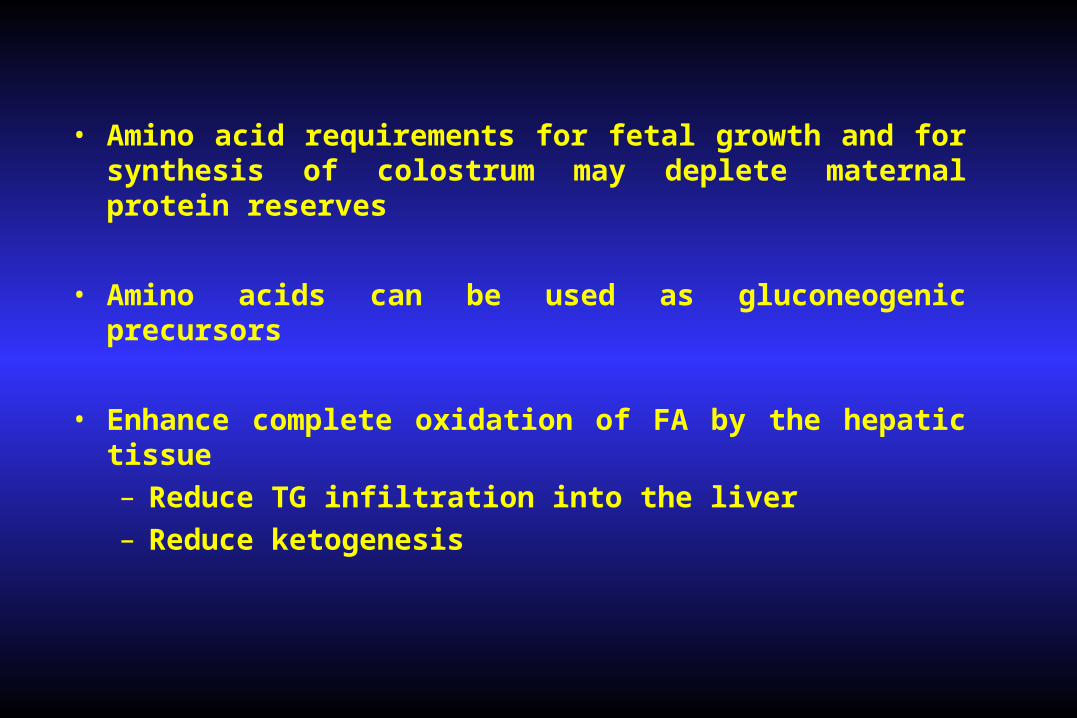
• Amino acid requirements for fetal growth and for synthesis of colostrum may deplete maternal protein reserves
• Amino acids can be used as gluconeogenic precursors
• Enhance complete oxidation of FA by the hepatic tissue
– Reduce TG infiltration into the liver
– Reduce ketogenesis
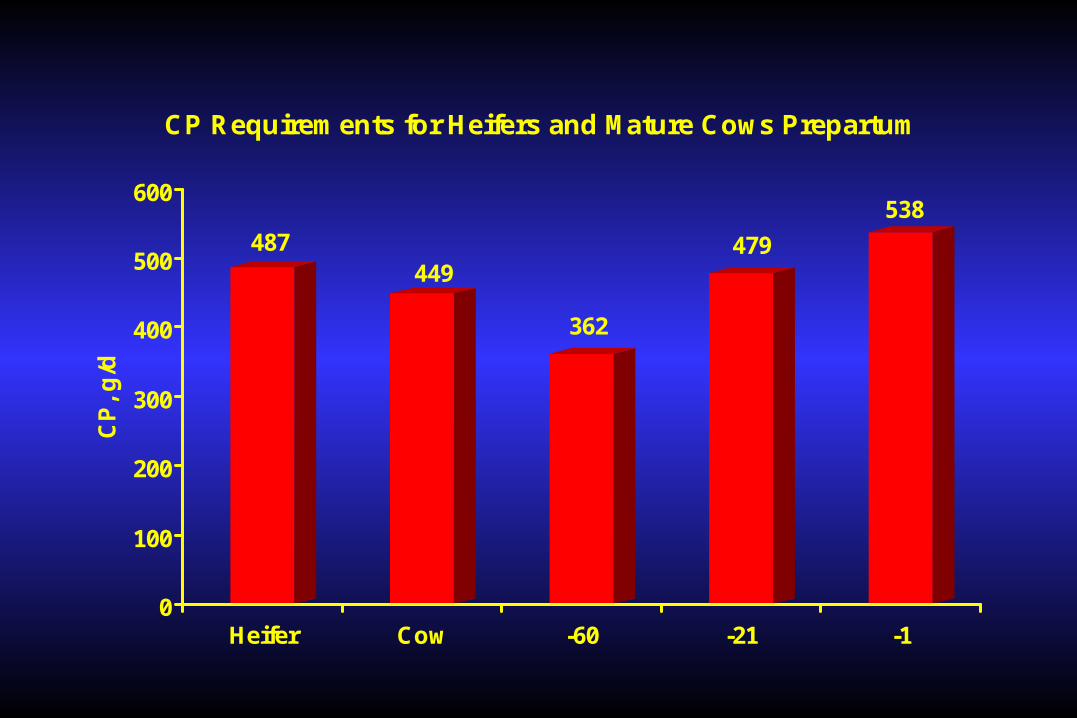
487449
362
479
538
0
100
200
300
400
500
600
CP
, g
/d
Heifer Cow -60 -21 -1
CP Requirements for Heifers and Mature Cows Prepartum
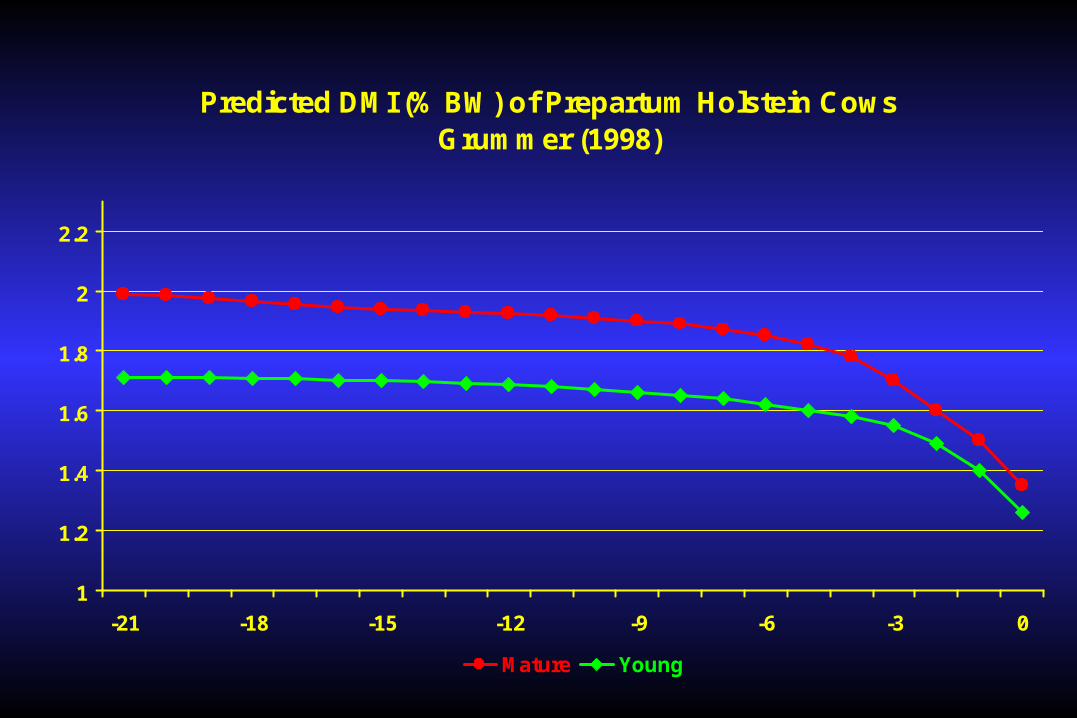
Predicted DMI (% BW) of Prepartum Holstein CowsGrummer (1998)
1
1.2
1.4
1.6
1.8
2
2.2
-21 -18 -15 -12 -9 -6 -3 0
Mature Young
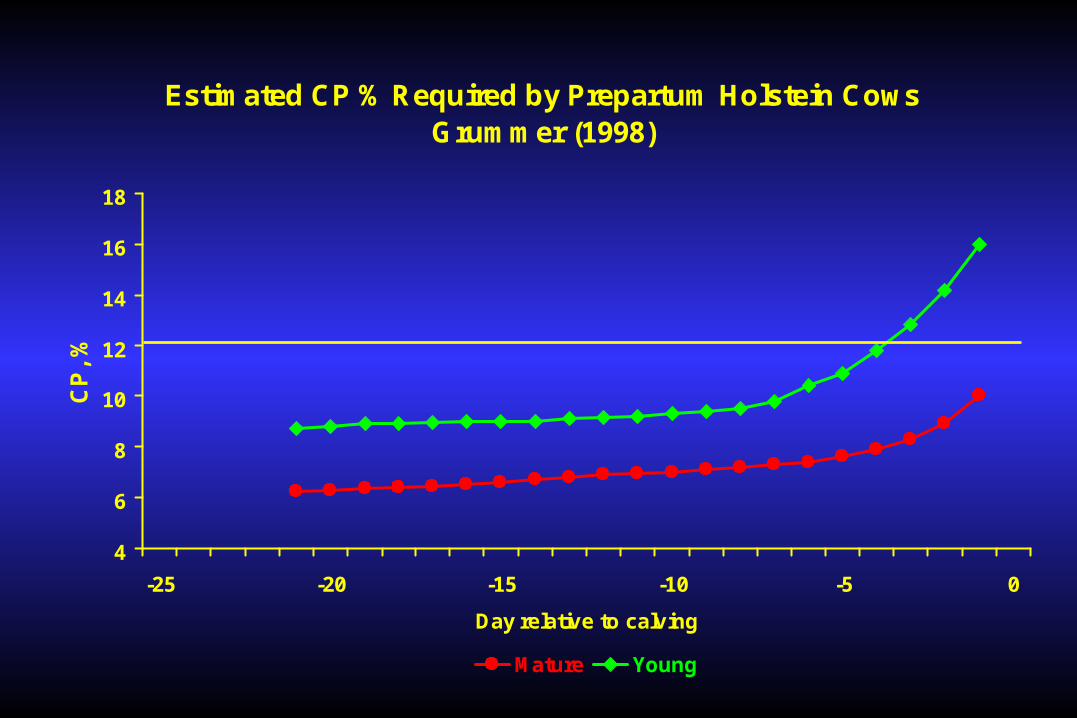
Estimated CP % Required by Prepartum Holstein CowsGrummer (1998)
4
6
8
10
12
14
16
18
-25 -20 -15 -10 -5 0
Day relative to calving
CP
, %
Mature Young
0
10
20
30
40
He
pa
tic
pro
tein
syn
the
sis
(%
/d)
-47 -9 6 44
Day relative to calving
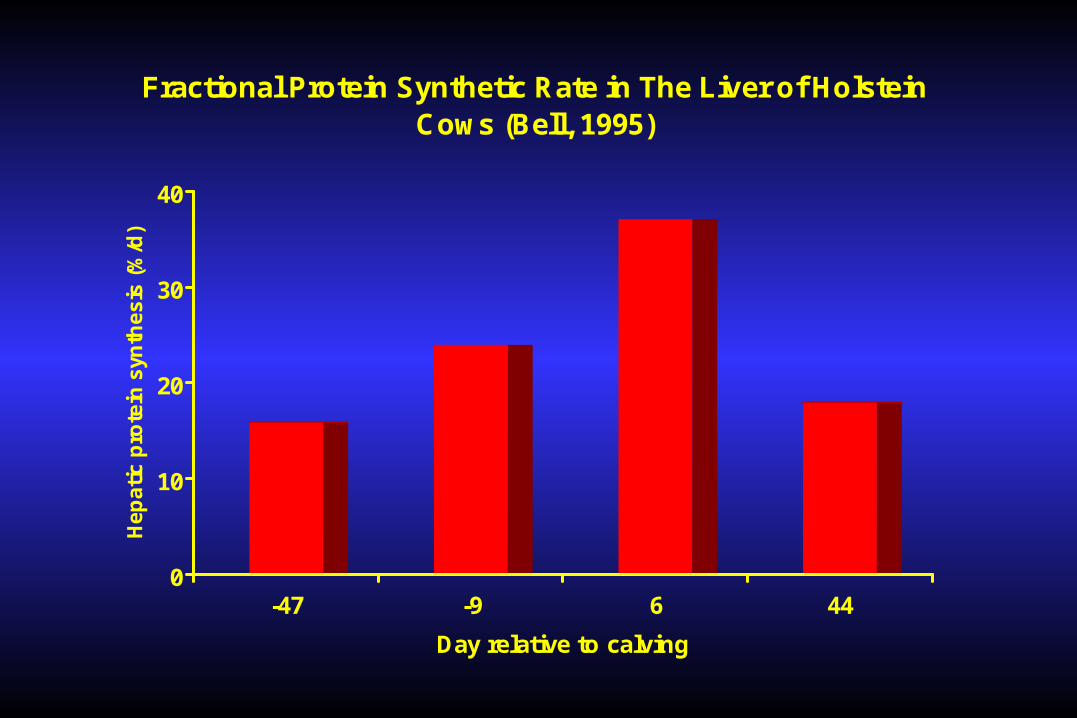
Fractional Protein Synthetic Rate in The Liver of Holstein Cows (Bell, 1995)
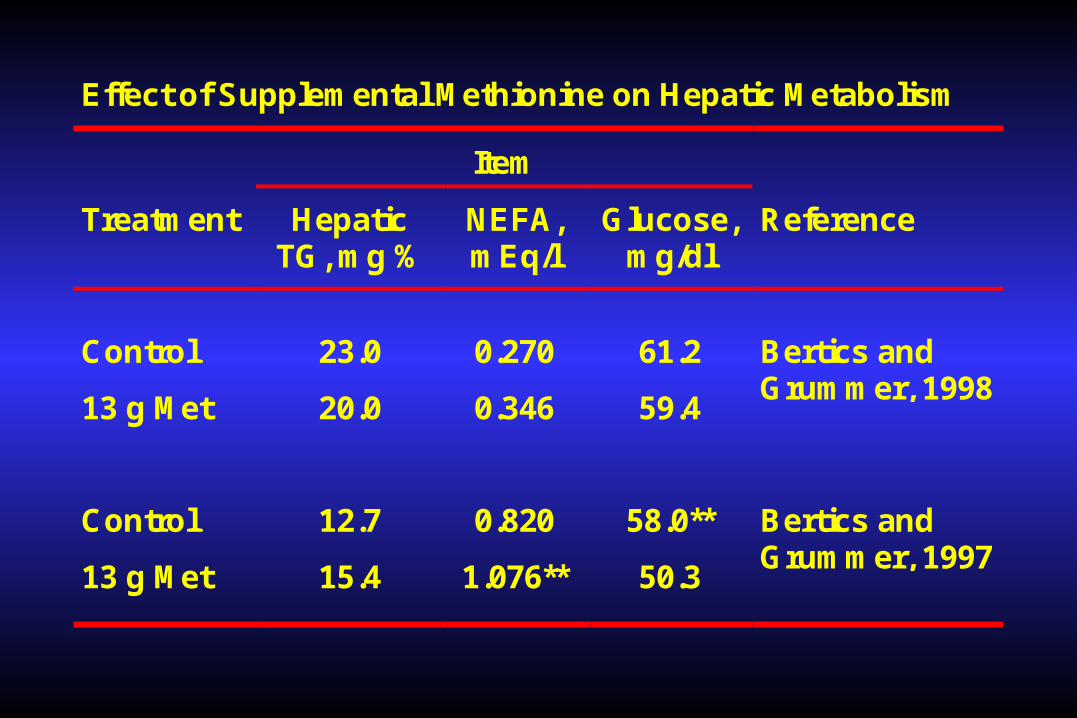
Effect of Supplemental Methionine on Hepatic Metabolism
Item
Treatment HepaticTG, mg %
NEFA,mEq/l
Glucose,mg/dl
Reference
Control 23.0 0.270 61.2
13 g Met 20.0 0.346 59.4
Bertics andGrummer, 1998
Control 12.7 0.820 58.0**
13 g Met 15.4 1.076** 50.3
Bertics andGrummer, 1997
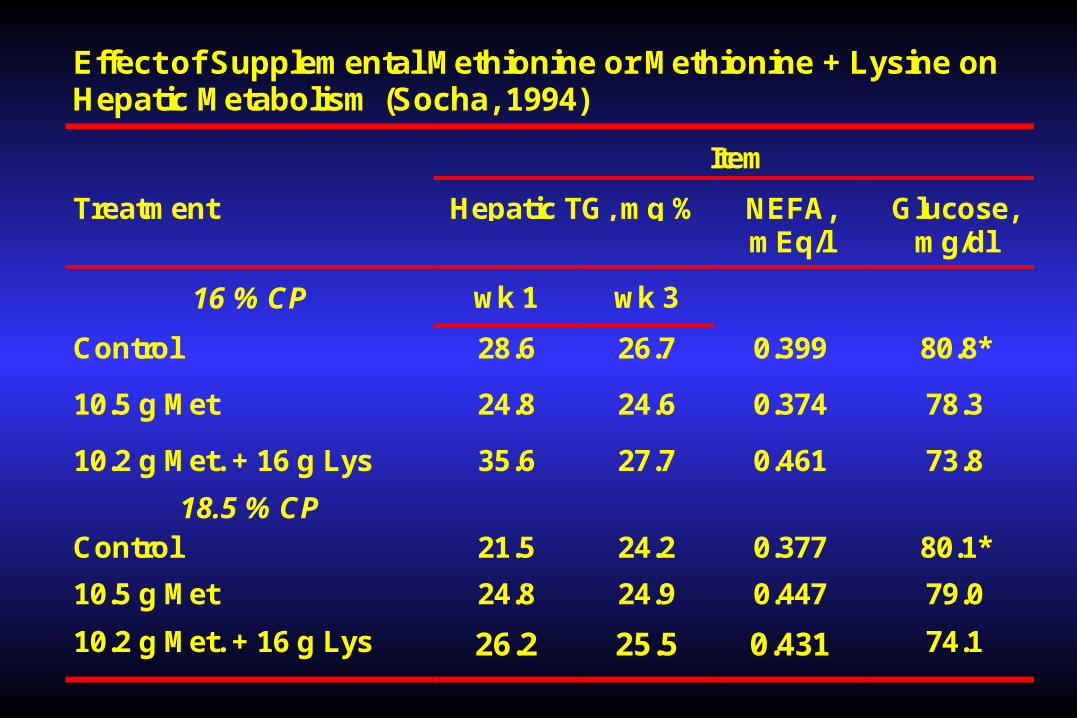
Effect of Supplemental Methionine or Methionine + Lysine onHepatic Metabolism (Socha, 1994)
Item
Treatment Hepatic TG, mg % NEFA,mEq/l
Glucose,mg/dl
16 % CP wk 1 wk 3
Control 28.6 26.7 0.399 80.8*
10.5 g Met 24.8 24.6 0.374 78.3
10.2 g Met. + 16 g Lys 35.6 27.7 0.461 73.8
18.5 % CPControl 21.5 24.2 0.377 80.1*
10.5 g Met 24.8 24.9 0.447 79.0
10.2 g Met. + 16 g Lys 26.2 25.5 0.431 74.1
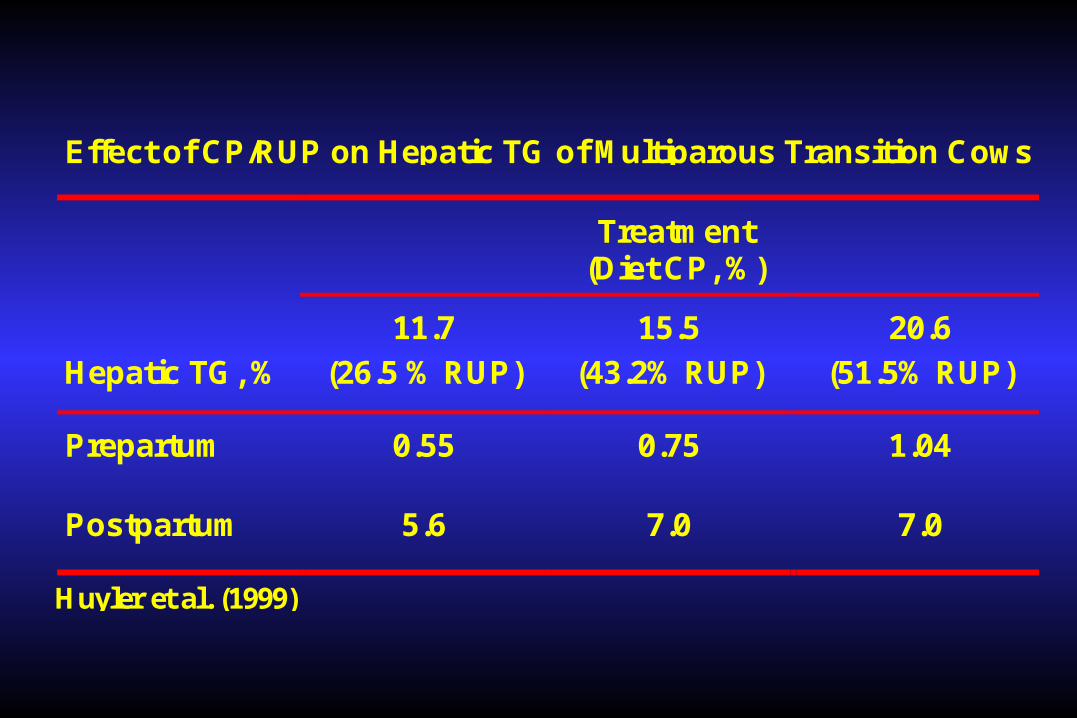
Effect of CP/RUP on Hepatic TG of Multiparous Transition Cows
Treatment(Diet CP, %)
Hepatic TG, %
11.7
(26.5 % RUP)
15.5
(43.2% RUP)
20.6
(51.5% RUP)
Prepartum 0.55 0.75 1.04
Postpartum 5.6 7.0 7.0
Huyler et al. (1999)
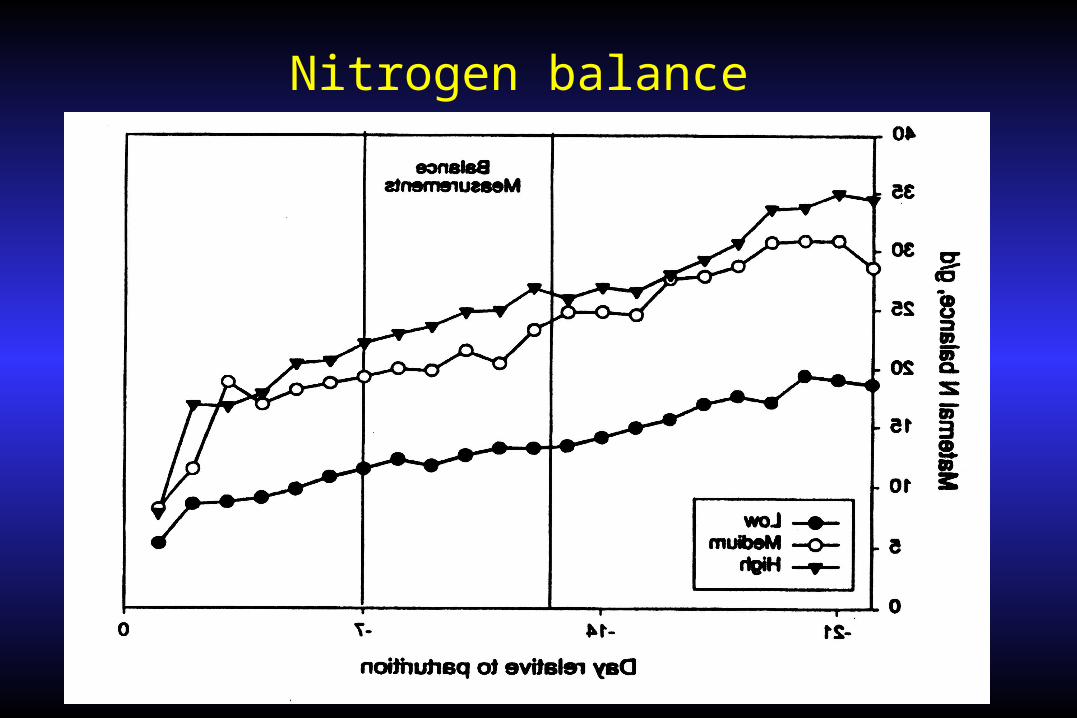
Nitrogen balance
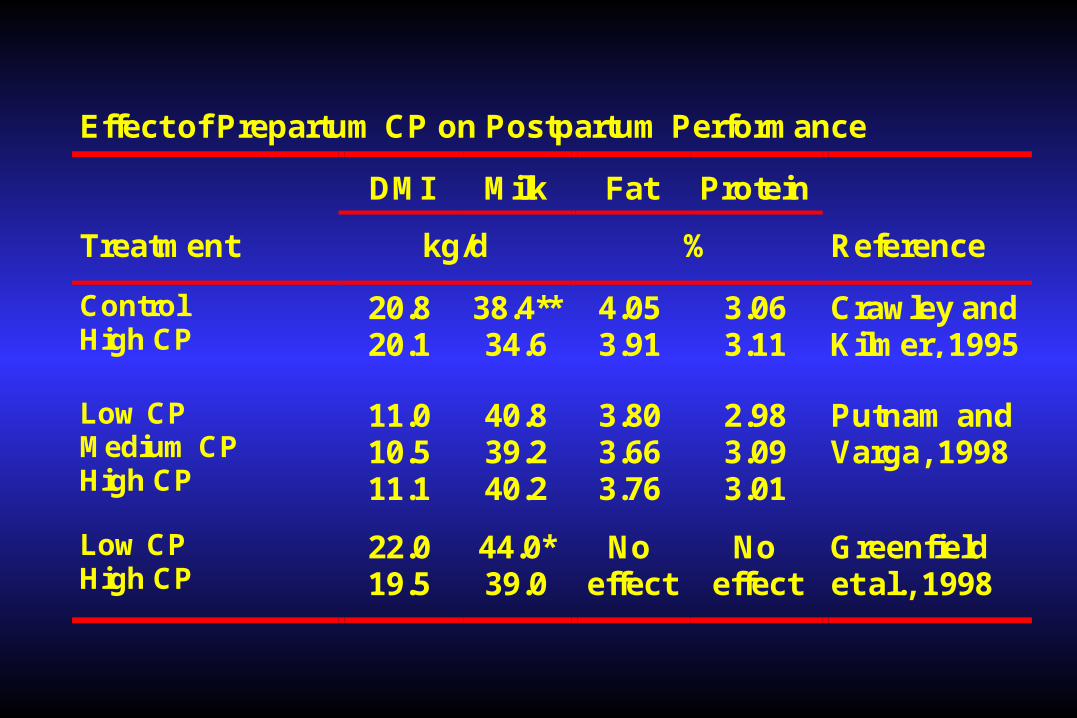
Effect of Prepartum CP on Postpartum Performance
DMI Milk Fat Protein
Treatment kg/d % Reference
ControlHigh CP
20.820.1
38.4**34.6
4.053.91
3.063.11
Crawley andKilmer, 1995
Low CPMedium CPHigh CP
11.010.511.1
40.839.240.2
3.803.663.76
2.983.093.01
Putnam andVarga, 1998
Low CPHigh CP
22.019.5
44.0*39.0
Noeffect
Noeffect
Greenfieldet al., 1998
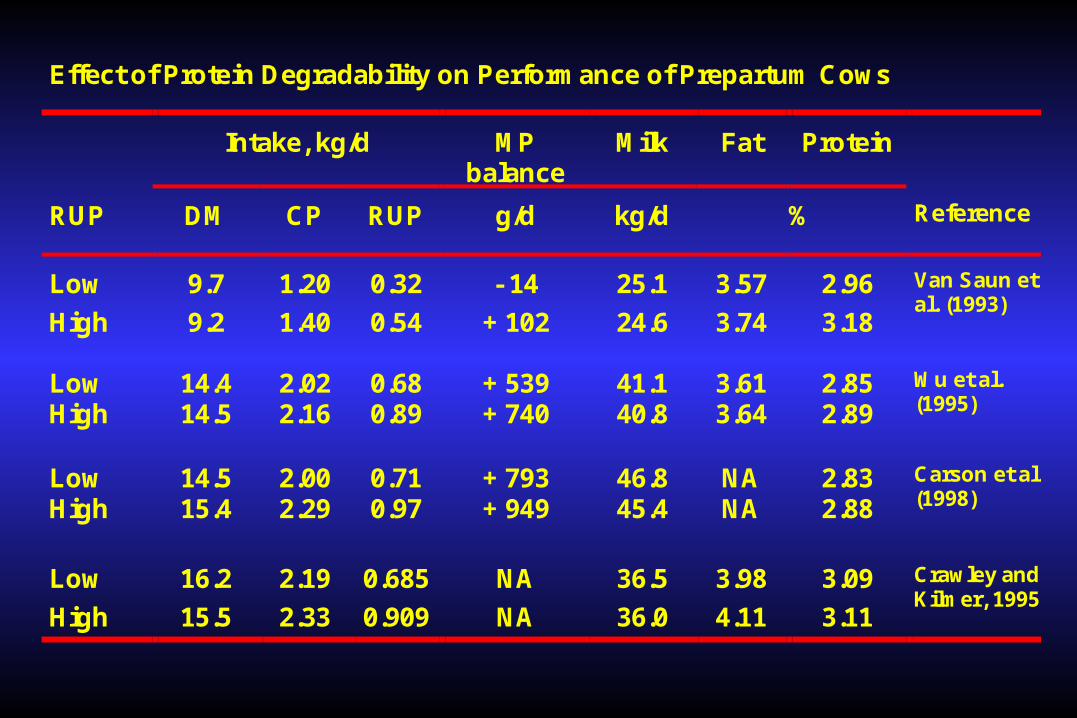
Effect of Protein Degradability on Performance of Prepartum Cows
Intake, kg/d MPbalance
Milk Fat Protein
RUP DM CP RUP g/d kg/d % Reference
Low
High
9.7
9.2
1.20
1.40
0.32
0.54
- 14
+ 102
25.1
24.6
3.57
3.74
2.96
3.18
Van Saun etal. (1993)
LowHigh
14.414.5
2.022.16
0.680.89
+ 539+ 740
41.140.8
3.613.64
2.852.89
Wu et al.(1995)
LowHigh
14.515.4
2.002.29
0.710.97
+ 793+ 949
46.845.4
NANA
2.832.88
Carson et al.(1998)
Low
High
16.2
15.5
2.19
2.33
0.685
0.909
NA
NA
36.5
36.0
3.98
4.11
3.09
3.11
Crawley andKilmer, 1995
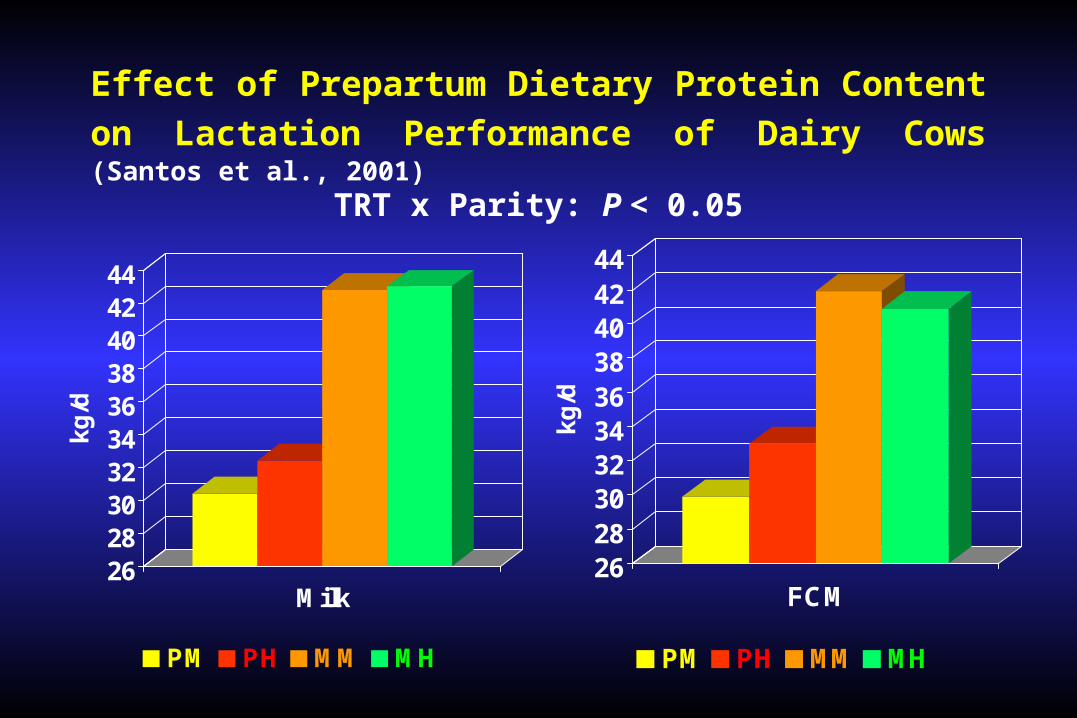
Effect of Prepartum Dietary Protein Content on
Lactation Performance of Dairy Cows (Santos et al., 2001)
26283032343638404244
kg
/d
Milk
PM PH MM MH
26283032343638404244
kg
/dFCM
PM PH MM MH
TRT x Parity: P < 0.05
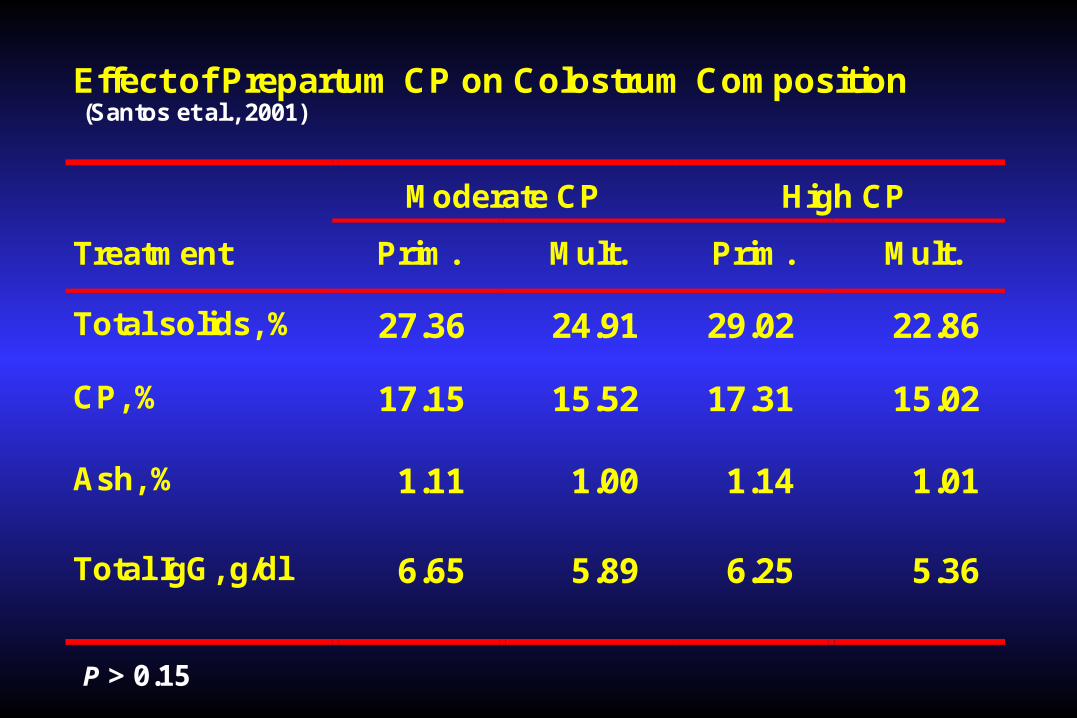
Effect of Prepartum CP on Colostrum Composition (Santos et al., 2001)
Moderate CP High CP
Treatment Prim. Mult. Prim. Mult.
Total solids, % 27.36 24.91 29.02 22.86
CP, % 17.15 15.52 17.31 15.02
Ash, % 1.11 1.00 1.14 1.01
Total IgG, g/dl 6.65 5.89 6.25 5.36
P > 0.15
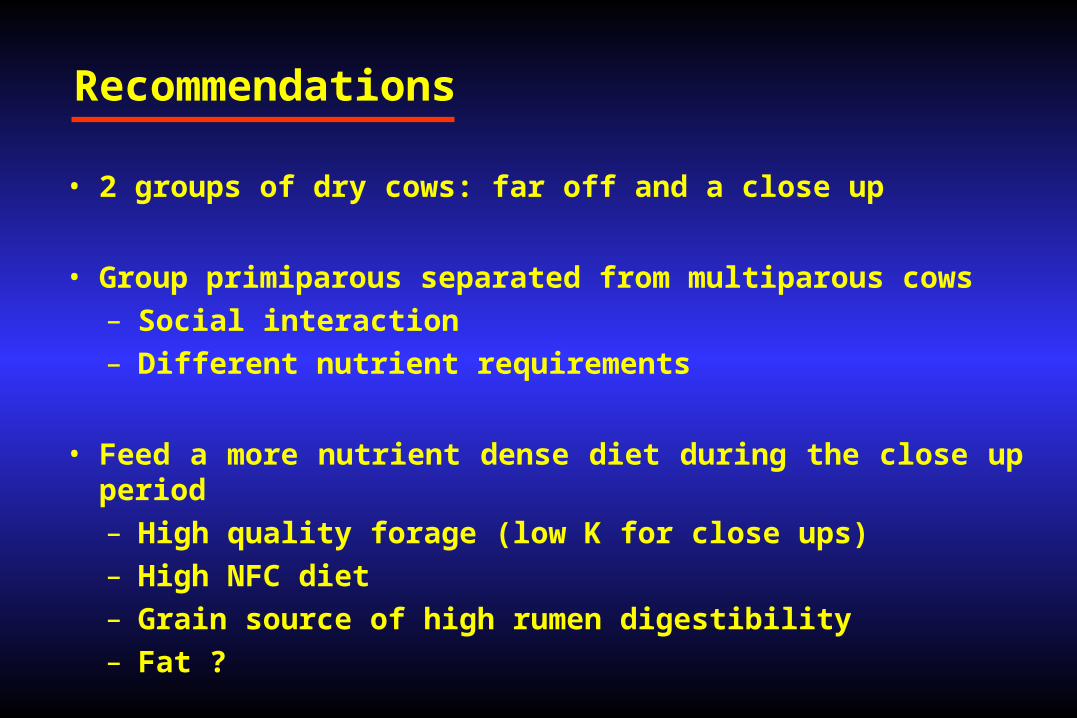
Recommendations
• 2 groups of dry cows: far off and a close up
• Group primiparous separated from multiparous cows– Social interaction– Different nutrient requirements
• Feed a more nutrient dense diet during the close up period– High quality forage (low K for close ups)– High NFC diet– Grain source of high rumen digestibility– Fat ?
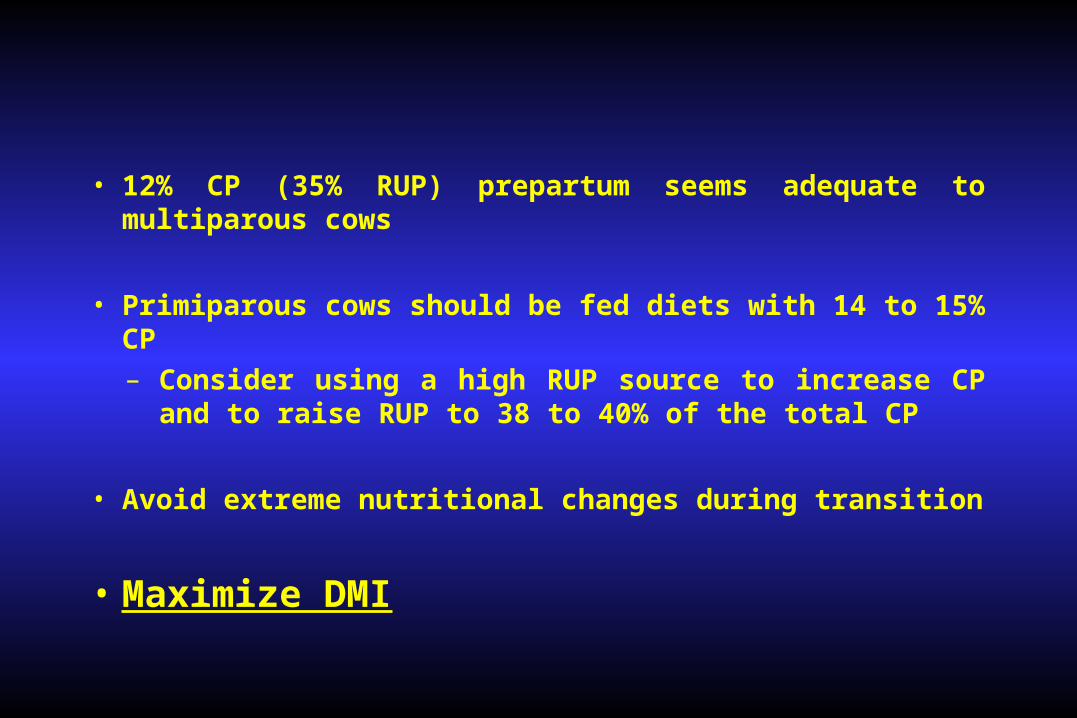
• 12% CP (35% RUP) prepartum seems adequate to multiparous cows
• Primiparous cows should be fed diets with 14 to 15% CP – Consider using a high RUP source to increase CP
and to raise RUP to 38 to 40% of the total CP
• Avoid extreme nutritional changes during transition
• Maximize DMI
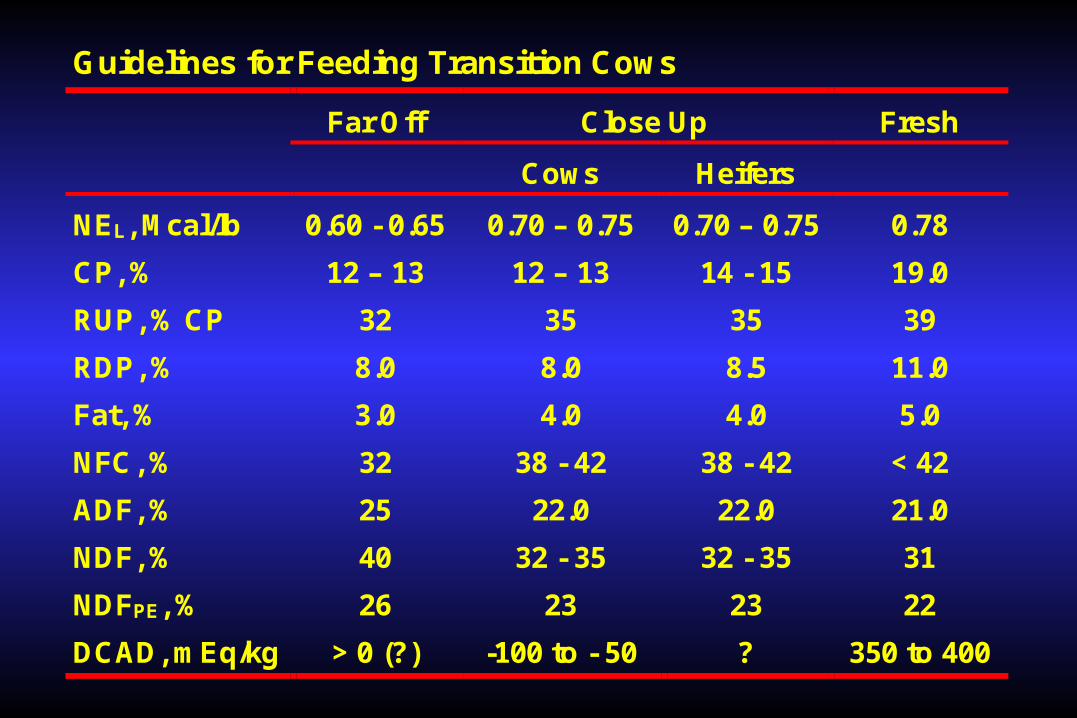
Guidelines for Feeding Transition Cows
Far Off Close Up Fresh
Cows Heifers
NEL, Mcal/lb 0.60 - 0.65 0.70 – 0.75 0.70 – 0.75 0.78
CP, % 12 – 13 12 – 13 14 - 15 19.0
RUP, % CP 32 35 35 39
RDP, % 8.0 8.0 8.5 11.0
Fat, % 3.0 4.0 4.0 5.0
NFC, % 32 38 - 42 38 - 42 < 42
ADF, % 25 22.0 22.0 21.0
NDF, % 40 32 - 35 32 - 35 31
NDFPE, % 26 23 23 22
DCAD, mEq/kg > 0 (?) -100 to - 50 ? 350 to 400
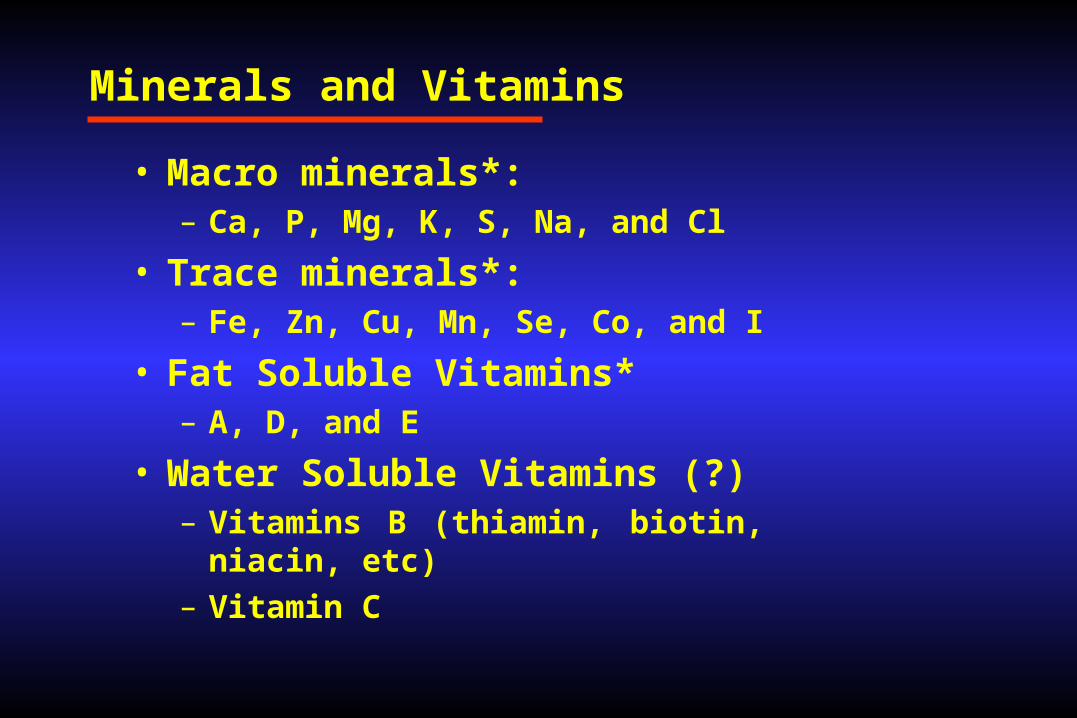
Minerals and Vitamins
• Macro minerals*:– Ca, P, Mg, K, S, Na, and Cl
• Trace minerals*:– Fe, Zn, Cu, Mn, Se, Co, and I
• Fat Soluble Vitamins*– A, D, and E
• Water Soluble Vitamins (?)– Vitamins B (thiamin, biotin, niacin, etc)– Vitamin C
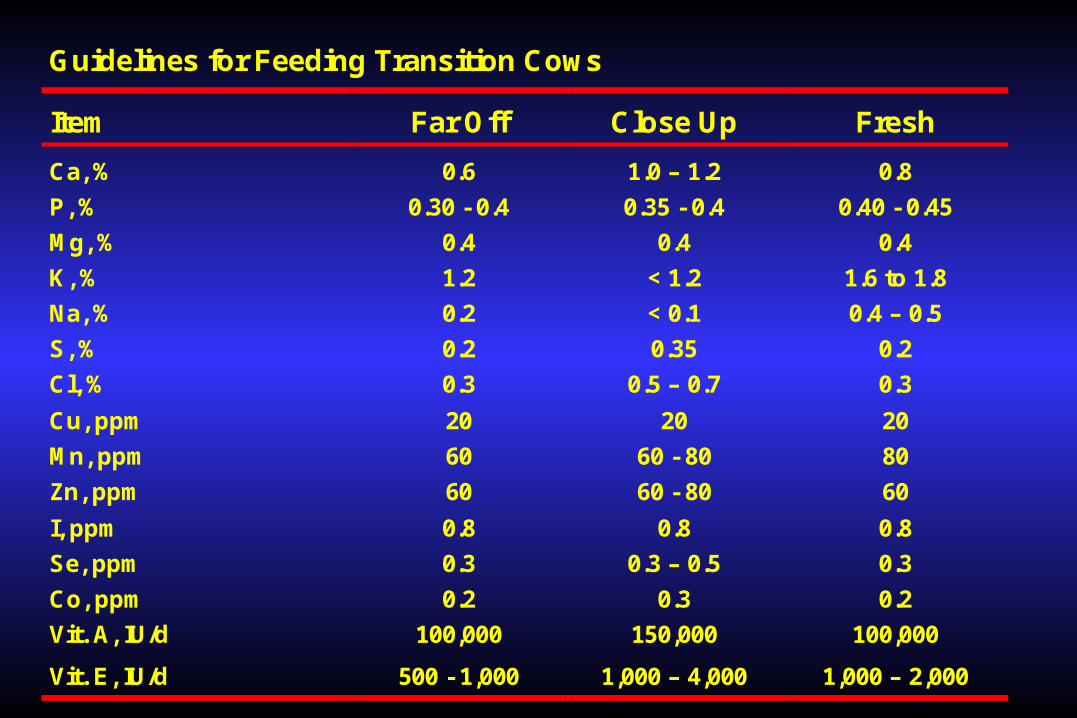
Guidelines for Feeding Transition Cows
Item Far Off Close Up Fresh
Ca, % 0.6 1.0 – 1.2 0.8
P, % 0.30 - 0.4 0.35 - 0.4 0.40 - 0.45
Mg, % 0.4 0.4 0.4
K, % 1.2 < 1.2 1.6 to 1.8
Na, % 0.2 < 0.1 0.4 – 0.5
S, % 0.2 0.35 0.2
Cl, % 0.3 0.5 – 0.7 0.3
Cu, ppm 20 20 20
Mn, ppm 60 60 - 80 80
Zn, ppm 60 60 - 80 60
I, ppm 0.8 0.8 0.8
Se, ppm 0.3 0.3 – 0.5 0.3
Co, ppm 0.2 0.3 0.2
Vit. A, IU/d 100,000 150,000 100,000
Vit. E, IU/d 500 - 1,000 1,000 – 4,000 1,000 – 2,000