Embed Size (px)
Citation preview
Energy 27 (2002) 607–623www.elsevier.com/locate/energy
Energy and environmental optimization in thermoelectricalgenerating processes—application of a carbon dioxide
capture system
Ismael Garcı´a a,∗, J.V.M. Zorraquinob
a SENER Engineering and Systems, Zugazarte No. 56, 48930 Getxo, Spainb Department of Heat Machines and Engines, ETSII, University of The Basque Country, Al. Urquijo s/n, 48013
Bilbao, Spain
Received 7 June 2001; revised form 3 January 2002; accepted 5 February 2002
Abstract
Increased thermodynamic efficiency coupled with reduced impact on the environment are fundamentalaims in the generation and rational use of energy if a contribution is to be made towards sustainabledevelopment on both a local and worldwide scale. Technological developments over recent years in thefield of thermal electricity generation, together with research and technologies emerging from environmen-tally friendly systems, are allowing increases in the efficiency of energy generating processes accompaniedby a reduction in polluting gases released into the atmosphere. This work develops the methodology fordefining and designing a cogeneration plant based on a combined cycle and using a computer program toprovide time simulation. By way of example, the results obtained from the thermal power station of achemical complex are given. As a novel feature, the work includes the application of a system to capturecarbon dioxide, a gas that makes a significant contribution to the so-called ‘greenhouse effect’, the maincause of global warming. The work carried out allows highly accurate forecasting of future working ofthe cogeneration system in the proposed application, and analysis of the performance of the plant as afunction of its capacity to capture carbon dioxide. The work also considers the feasibility of long-termconfinement of the captured carbon dioxide in the deep ocean, and analyses its impact on plant efficiency.Finally, an economical analysis of the proposed plant is included in order to evaluate the impact of thepotential carbon dioxide capture and storage system. 2002 Elsevier Science Ltd. All rights reserved.
∗ Corresponding author. Fax:+34-94-481-75-77.E-mail address: [email protected] (I. Garcı´a).
0360-5442/02/$ - see front matter 2002 Elsevier Science Ltd. All rights reserved.PII: S0360-5442(02)00007-5
608 I. Garcı́a, J.V.M. Zorraquino / Energy 27 (2002) 607–623
Nomenclature
CC Combined cyclecEURO Cent of euroESP Pesetas (Spanish Monetary Unit)EURO Euros (European Union Monetary Unit) (1 EURO equivalent to 166.386 ESP)ISO International standardization organizationMEA MonoethanolamineMESP Million pesetasMEURO Million eurosLHV Low heat valueppmV Parts per million in volumePSC Proposed cogeneration plant without CO2 captureP50C Plant layout with CO2 capture capacity of 50% of design capacity (21% CO2
capture)P100C Plant layout with design CO2 capture capacity (42% CO2 capture)P100CA Plant layout with design CO2 capture capacity and marine injection (42% CO2
capture and injection)P200C Plant layout with CO2 capture capacity of 200% of design capacity (84% CO2
capture)P200CA Plant layout with CO2 capture capacity of 200% of design capacity and marine
storage (84% CO2 capture and injection)t TonneUA Product of overall heat transfer coefficient and area of interchange
1. Introduction
Electricity generation based on combined-cycle plants, which burn natural gas and use gas andsteam turbines with highly efficient recovery boilers are an important alternative to conventionalgenerating systems, since they offer high energy efficiency together with a significant reductionin gas emissions.
In industrial production processes with a high thermal energy demand, as in the chemical andpetrochemical sectors, application of a combined cycle based on tri-generation (generation ofsteam at various levels, hot water and cold water) makes it possible to obtain net electricalefficiencies of over 50% coupled with substantial reductions in gas emissions (CO2, SO2, NOx)with respect to conventional generating systems. Competitive kilowatt hour generating costs area further advantage of applying this technology.
In addition to the reduced CO2 levels produced by combined cycle as opposed to traditionalthermal systems of electricity generation, the application of a carbon dioxide capture systemallows emission levels of this gas to fall to levels close to 100 g of CO2/kWh generated, with aconsequent reduction in the so-called ‘greenhouse effect’ .
Within such a context, this work presents the application of a combined-cycle plant based on
609I. Garcı́a, J.V.M. Zorraquino / Energy 27 (2002) 607–623
tri-generation at an industrial complex where the thermal power station has coal and fuel-firedboilers as generating elements. Through incorporation of a carbon dioxide capture system basedon chemical absorption, the potential capture of this gas from the exhaust gases of high-powergas turbines is evaluated, as is its possible long-term confinement and the effect of the captureand storage capacity on the thermodynamic efficiency of the plant and on cost per kilowatt hourgenerated. Moreover, the results obtained in the case of a pure combined cycle (with no thermaldemands in the industrial complex) are extrapolated with a view to optimizing the electricalefficiency of the proposed installation.
2. Design criteria
2.1. Application to a real case
The chosen application is a chemical factory situated in the north of Spain whose productionprocess consumes a large quantity of thermal and electrical energy, and whose manufacturing andplant data are available. The factory works 8325 h per year with various hourly production ratesranging from 1400 t of product per day to 2600 t per day, final production being 850,000 t per year.
The power station at the complex is based on coal and fuel oil boilers with back-pressure steamturbines. The complex needs process steam at three pressure levels (28, 15.5 and 2.25 bar), hotwater at 95 °C and cold water at 5 °C. These consumptions vary according to the different factoryproduction rates, total steam consumption varying between 180 and 330 t/h. Hot water demandis established at 150 t/h at 95 °C, and cold water 245 t/h at 5 °C.
Carbon dioxide emissions from the existing power station are determined by the fuel used (coalwith an LHV of 24,700 kJ/kg) and by the equivalent electrical efficiency (reference efficiency of35% assumed), corresponding to a mean emission of 1166 g of CO2/kWh electricity generated.
2.2. Optimization criteria
The new cogeneration plant has been designed on the basis of the following optimization cri-teria:
� Latest generation high-efficiency turbines incorporating dry low NOx emission combustionchamber.
� Gas turbine intake air cooling.� Preheating of natural gas fuelling the turbines.� Recovery boilers without additional combustion, with steam generation at three pressure levels
and intermediate reheating.� Condensate preheating via closed-loop recirculation.� Preheating of treated water added to cycle, and preheating of hot water depending on factory
demand.� Use made of low-level thermal energy from recovery boiler to obtain cold water in an absorp-
tion chiller, according to factory demand.� The new cogeneration plant must be capable of supplying the factory’s thermal demands
610 I. Garcı́a, J.V.M. Zorraquino / Energy 27 (2002) 607–623
(different steam levels, hot and cold water) under all possible operating modes. Optimum sizingof the new plant will define the condensation capacity of the water-steam cycle (combined-cycle cogeneration). Surplus electrical energy will be supplied to the Electricity Company grid.
3. Description of the installation
3.1. Definition of the new plant
The gas turbine selected for the new plant corresponds to ABB model GT-26, whose perform-ance under ISO conditions is given in Table 1.
On the basis of the factory’s thermal demands and those corresponding to application of thecarbon dioxide capture system being considered, the new plant will consist of two gas turbine-recovery boiler lines and one common condensing steam turbine which will provide the extrac-tions needed to supply the factory’s demands for steam.
The recovery boilers selected, using no additional combustion, are at three pressure levels andincorporate an intermediate reheating section. The following design parameters have been selec-ted:
� High pressure level: 130 bar (a)/540 °C� Intermediate reheat level: 29.5 bar (a)/540 °C� Medium pressure level: 15.5 bar (a)/230 °C� Low pressure level: 2.25 bar (a)/saturated
The heat sink in the condenser consists of a closed cooling water circuit with an induced draughttower capable of supplying cold water at 23 °C, having established a condensation temperatureof 36 °C corresponding to a condensation pressure of 0.059 bar (a).
3.1.1. Cooling of gas turbine intake airAs the drive compressor of a gas turbine is a volumetric machine, cooling the intake air gives
rise to an increase in mass flow due to the increase in air density. As a result, there is an increase
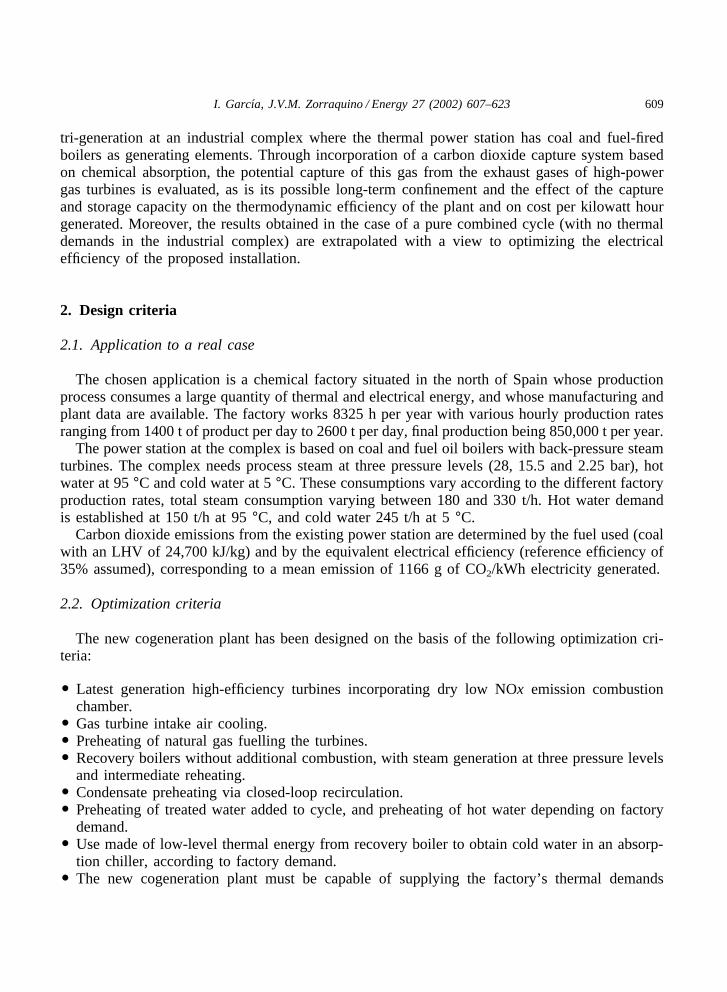
Table 1Performance of GT-26 gas turbine under ISO conditions
ITEM Units Value
Rated power kW 251,000Specific fuel consumption kJ/kWh 9400Pressure ratio - 30Exhaust gas flow kg/s 562.0Exhaust gas temperature °C 610
Reference: Gas turbine world 1997 handbook (electric power table, ABB data for GT-26).
611I. Garcı́a, J.V.M. Zorraquino / Energy 27 (2002) 607–623
in the power developed by the machine with a corresponding increase in efficiency since lossesremain almost constant within the practical margins for variation of the mass flow.
The cooling system selected is in the form of a mechanical chiller. An evaporative cooler isnot applicable owing to the environmental conditions of the site. An absorption chiller was alsounsuitable owing to the lack of surplus thermal energy at a low heat level. The design capacityof the mechanical chiller selected enables the temperature of the air intake flow to be reducedfrom 20 to 8 °C.
3.1.2. Preheating of natural gasThe natural gas supplying the gas turbine combustion chambers is preheated to improve turbine
efficiency. To this end, a preheater has been fitted which for its thermal fluid uses water bled offfrom the economizer output corresponding to the second level of the recovery boiler (15.5 bar).This preheater heats the natural gas to 150 °C prior to its entry into the combustion chamber.
3.1.3. Condensate preheatingThe condensate pumped from the condenser is preheated in the recovery boiler before passing
to the de-aerator. This condensate preheating loop incorporates a closed recirculation circuit toregulate the temperature at which the condensate enters the boiler, and thereby control flue gastemperature and optimize recovery boiler efficiency.
The system envisages heating the cold condensate via the recirculation loop to 60 °C, at whichtemperature it enters the boiler preheater where it is further heated up to 95 °C before enteringthe de-aerator. The temperature anticipated for gases leaving the boiler is in the range 78–84 °C.
3.1.4. Water preheatingThe low heat level section of each recovery boiler incorporates a preheater to generate hot
water at 95 °C for use in the following services:
� Heating circuit for treated cycle makeup water.� External hot water circuit to meet factory demand.� Hot water circuit for use as thermal fluid in an absorption cooling system to generate cold
water to meet factory demand.
3.2. Combined-cycle flow diagram
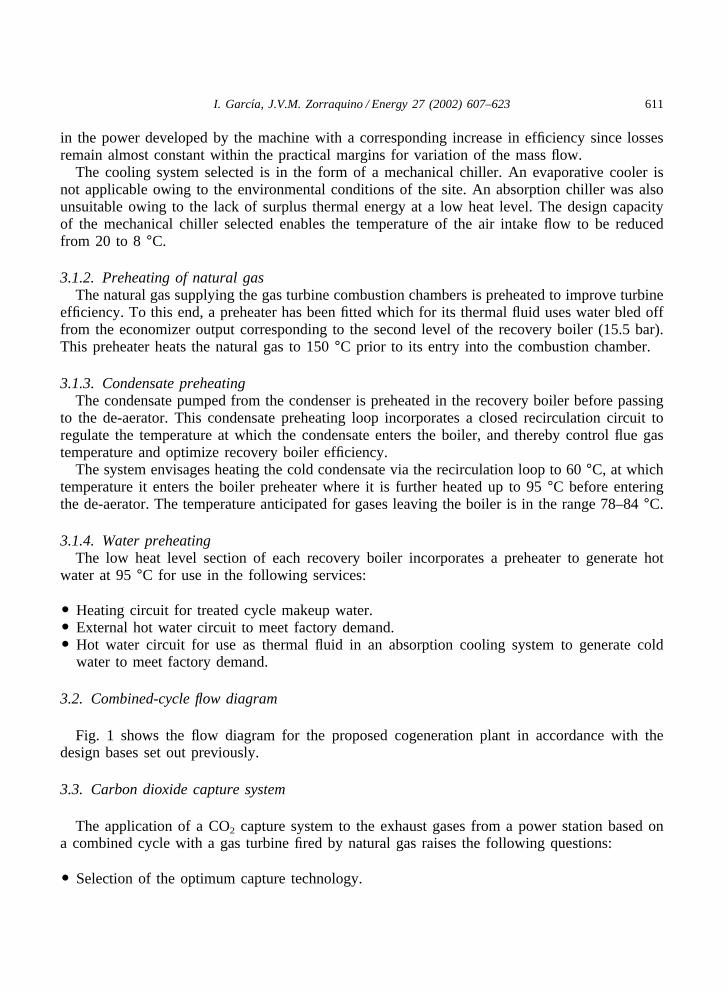
Fig. 1 shows the flow diagram for the proposed cogeneration plant in accordance with thedesign bases set out previously.
3.3. Carbon dioxide capture system
The application of a CO2 capture system to the exhaust gases from a power station based ona combined cycle with a gas turbine fired by natural gas raises the following questions:
� Selection of the optimum capture technology.
612 I. Garcı́a, J.V.M. Zorraquino / Energy 27 (2002) 607–623
Fig. 1. Flow diagram of the cogeneration plant.
� Analysis of the installation’s repercussions on electrical and thermal efficiencies as a functionof the percentage of CO2 captured.
� What to do with the captured CO2: reutilization and/or storage.
Of existing methods of CO2 capture, the optimum industrial method where low concentrationsof the gas to be separated, as in the case of CO2 in gas turbine exhaust gases, is based onchemical absorption: the CO2 reacts with a chemical solvent to form a loosely bonded intermediatecarbonated compound which is easily separable when heat is applied, regenerating the originalsolvent and producing CO2 which is collected and carried off [1].
The capture system selected for this application uses a solution of monoethanolamine (MEA)in water, which possesses the following properties:
� High capacity to recover CO2 from exhaust gases (in the range 85–90%).� Does not require removal of oxygen for gases being treated.� Allows limits of NOx and SOx in gases being treated up to 100 ppmV (much higher than those
existing in natural gas-fired gas turbine exhaust gases).
613I. Garcı́a, J.V.M. Zorraquino / Energy 27 (2002) 607–623
� Requires low concentrations of absorbent solution (15–20%), minimizing the potential for cor-rosion.
� Uses saturated steam at 4 bar (a) as heat source.� The system does not need pressurization. The only electrical consumption is by the blower
which conveys the gases through the absorption column and the pumps which impel the absorb-ing solution.
� Optimization of energy efficiency of the capture process via techniques to make maximum useof energy.
� The process used (MEA as absorbing agent) does not generate materials classified as hazard-ous waste.
� There is the possibility of obtaining CO2 as a product with a purity higher than 99.99% forfood applications, and 99.90% for industrial applications.
� Operating data in food industry installations (from coal-fired power station exhaust gases) givesavailability higher than 98% from the capture plant.
� The process has no harmful effect on the environment.
The capture reaction which takes place is as follows:
MEA: C2H4 OHNH2 (RNH2)RNH2 � CO2⇔RCO2NH2 (1)
CO2 ABSORPTION AT 50 °C: Reaction (1) unbalances towards the right, capturing the CO2.CO2 DE-ABSORPTION AT 100 °C: Reaction (1) unbalances towards the left, releasing the CO2.
3.3.1. Carbon dioxide capture capacityThe design capacity of the CO2 capture system is determined on the one hand by the generation
of carbon dioxide in the cogeneration plant, and on the other hand by the energy consumption ofthe capture system and its impact on cycle efficiency. The proposed CO2 capture system requires aconsumption of 2.35 kg of saturated steam at a pressure of 4 bar and an electrical consumptionof 0.1 kWh for every kilogram of CO2 captured [2,3].
Based on these criteria, a CO2 capture system with a CO2 removal capacity of 1600 t per dayis selected per cogeneration line (one GT/HRSG). This capacity (defined as 100% CO2 designcapture capacity) corresponds to a CO2 capture of 42% with respect to the total carbon dioxidegenerated per cogeneration line.
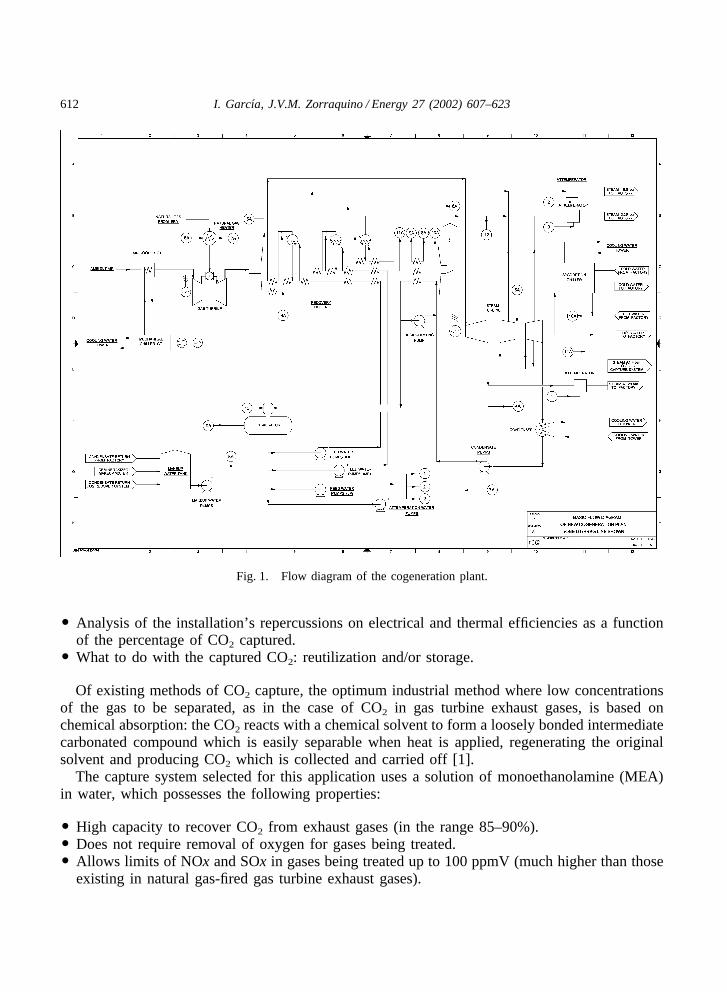
Defining a commercial capacity of the CO2 capture system of 400 t per day, the scenario for42% capture of the total CO2 generated will include four 400 t per day capture lines in parallelfor each one of the two cogeneration lines. Fig. 2 shows the conceptual schematic for a singleCO2 capture line.
To assess the sensitivity of plant efficiency to the percentage of CO2 captured, different scen-arios of CO2 capture capacities are analysed with 1, 2, 4 and 8 CO2 capture lines per cogenerationline. Therefore, the scenario of maximum capture will correspond to a capture of the 84% of thetotal CO2 generated (case 200% of the design capture capacity).
614 I. Garcı́a, J.V.M. Zorraquino / Energy 27 (2002) 607–623
Fig. 2. Conceptual diagram of CO2 capture system.
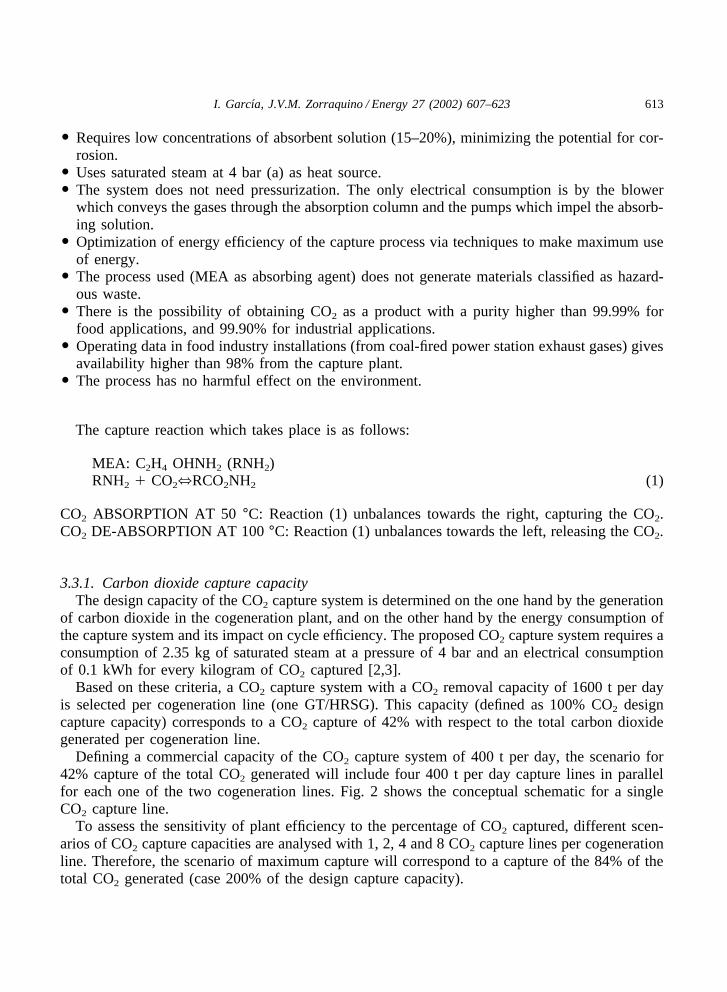
3.4. Carbon dioxide compression and ocean storage system
There is a huge difference between the amount of carbon dioxide generated in thermal powerstations and the relatively limited capacity to use this gas [4]. Due to this imbalance, alternativemechanisms to store or eliminate the potential captured carbon dioxide are required. Among thesystems which are currently at a high degree of industrial development are storage in deep oceanbeds, involving pumping liquid CO2 to depths of between 1000 and 3000 m, and injection intodeep saline aquifers [5–7].
The study considers a conditioning and compression system for the injection and confinementof the captured carbon dioxide in the ocean at a depth of 1000 m. In order to assess the impactof this carbon dioxide ocean storage on the performances of the plant, it is assumed an electricalconsumption of 0.18 kWh/kg of CO2 injected in the ocean at a depth of 1000 m [5,6].
4. Methodology
A Cogeneration Time Simulation (SIHOCO) computer program was used to determine massand energy balances in the cogeneration plant. This program allows the performance of a cogener-ation plant integrated into an existing thermal power station (which in turn may consist of boilers,steam turbines, gas turbines, etc.) to be simulated. The program has the following features:
� Simulation of gas turbine performance as a function of varying environmental conditions onan hourly basis.
� Optimization of the cogeneration plant in accordance with the optimization criteria established.� Simulation of the load duty of the cogeneration plant and the rest of the power station generat-
615I. Garcı́a, J.V.M. Zorraquino / Energy 27 (2002) 607–623
ing equipment in terms of covering factory steam demand, determining electricity and steamproduction, efficiencies, fuel consumptions, gaseous emissions and so on.
� Possibility of determining plant balances on an hourly, weekly, monthly and annual basis; theprogram can also discriminate as a function of factory load duties and of different electricalenergy charge bands.
The SIHOCO program is structured as a set of data and calculation subroutine files, and isdeveloped in FORTRAN language.
Once the surrounding conditions external to the cogeneration plant have been defined, theprogram configures the generating elements (gas turbine, reciprocating engines, recovery boilers,conventional boilers, steam turbines, etc.) and any other elements involved in the water–steamcycle.
4.1. Water–steam cycle
Having established the load duty on an hourly basis for the gas turbines, boilers and steamturbine as a function of ambient temperature, factory working schedule (steam, hot water, coldwater and electricity consumptions) and the operating sequence of the thermal and electrical gener-ators (if more than one), the program establishes the mass and energy balances for the remainingcomponents in the water/steam cycle (de-aerator, boiler blowdown tank, natural gas preheater,condenser, makeup water tank, coolers, attemperators, etc.), and defines the mass flows and ther-modynamic properties of each of the streams established in the flow diagram.
The program uses an iterative procedure to consider and resolve a system with as many equa-tions as transfer sections considered, giving as a result steam production at each level of gener-ation, chimney stack flue gas temperature and the composition of outlet gases in the event ofthere being additional boiler combustion, as well as the evolution of gas temperatures throughoutthe boiler and the UA value in each section for each of the operating conditions contemplated.Integrating the above results for each of the 8760 h in the year gives the overall annual results.
5. Thermodynamic analysis of the combined cycle
5.1. Plant performance as a function of CO2 capture capacity
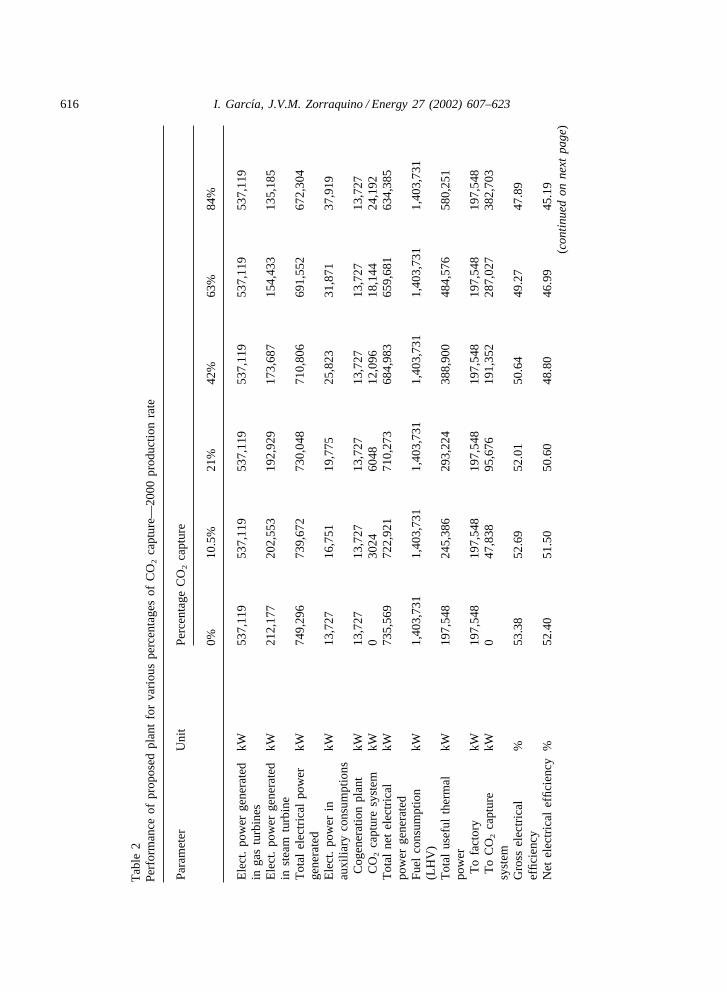
Table 2 shows the technical results for the proposed cogeneration plant for the medium factoryproduction rate (2000 rate) as a function of the percentage of carbon dioxide captured. Grosselectrical power of the plant without CO2 capture is 749.3 MW, a value which falls to 710.8 MWfor the plant configuration with a capture of the 42% of the total CO2 generated, and to 672.3MW for a capture of 84% of the CO2 generated. In turn, the net power generated passes from735.6 MW for the case without CO2 capture, to 685.0 MW for 42% capture and to 634.4 MWfor 84% capture.
Net efficiency of the plant without CO2 capture stands at 52.40%, dropping to 48.80% for thescenario with 42% of CO2 capture and 45.19% for the scenario with 84% capture. Specific CO2
616 I. Garcı́a, J.V.M. Zorraquino / Energy 27 (2002) 607–623
Tab
le2
Perf
orm
ance
ofpr
opos
edpl
ant
for
vari
ous
perc
enta
ges
ofC
O2
capt
ure—
2000
prod
uctio
nra
te
Para
met
erU
nit
Perc
enta
geC
O2
capt
ure
0%10
.5%
21%
42%
63%
84%
Ele
ct.
pow
erge
nera
ted
kW53
7,11
953
7,11
953
7,11
953
7,11
953
7,11
953
7,11
9in
gas
turb
ines
Ele
ct.
pow
erge
nera
ted
kW21
2,17
720
2,55
319
2,92
917
3,68
715
4,43
313
5,18
5in
stea
mtu
rbin
eT
otal
elec
tric
alpo
wer
kW74
9,29
673
9,67
273
0,04
871
0,80
669
1,55
267
2,30
4ge
nera
ted
Ele
ct.
pow
erin
kW13
,727
16,7
5119
,775
25,8
2331
,871
37,9
19au
xilia
ryco
nsum
ptio
nsC
ogen
erat
ion
plan
tkW
13,7
2713
,727
13,7
2713
,727
13,7
2713
,727
CO
2ca
ptur
esy
stem
kW0
3024
6048
12,0
9618
,144
24,1
92T
otal
net
elec
tric
alkW
735,
569
722,
921
710,
273
684,
983
659,
681
634,
385
pow
erge
nera
ted
Fuel
cons
umpt
ion
kW1,
403,
731
1,40
3,73
11,
403,
731
1,40
3,73
11,
403,
731
1,40
3,73
1(L
HV
)T
otal
usef
ulth
erm
alkW
197,
548
245,
386
293,
224
388,
900
484,
576
580,
251
pow
erT
ofa
ctor
ykW
197,
548
197,
548
197,
548
197,
548
197,
548
197,
548
To
CO
2ca
ptur
ekW
047
,838
95,6
7619
1,35
228
7,02
738
2,70
3sy
stem
Gro
ssel
ectr
ical
%53
.38
52.6
952
.01
50.6
449
.27
47.8
9ef
ficie
ncy
Net
elec
tric
alef
ficie
ncy
%52
.40
51.5
050
.60
48.8
046
.99
45.1
9(c
onti
nued
onne
xtpa
ge)
617I. Garcı́a, J.V.M. Zorraquino / Energy 27 (2002) 607–623
Tab
le2
(con
tinu
ed)
Para
met
erU
nit
Perc
enta
geC
O2
capt
ure
0%10
.5%
21%
42%
63%
84%
Tot
alco
gene
ratio
n%
66.4
768
.98
71.4
976
.50
81.5
286
.53
effic
ienc
yG
aseo
usem
issi
ons
Tot
alga
sflo
wkg
/h4,
080,
002
4,05
4,29
04,
028,
577
3,97
7,15
23,
925,
727
3,87
4,30
2T
otal
CO
2ca
ptur
edkg
/h0
25,7
1251
,425
102,
850
154,
275
205,
700
Com
posi
tion
ofex
haus
tga
ses
CO
2%
Vol
4.52
4.13
3.74
2.95
2.14
1.32
H2O
%V
ol8.
438.
478.
508.
578.
648.
72N
2%
Vol
75.7
076
.01
76.3
276
.95
77.5
978
.24
O2
%V
ol11
.35
11.3
911
.44
11.5
311
.63
11.7
3N
Ox
ppm
V�
25�
25�
25�
25�
25�
25SO
2pp
mV
00
00
00
Spec
ific
CO
2em
issi
on38
2.5
352.
732
2.1
258.
519
1.4
120.
3g
CO
2/k
Wh(
e)
618 I. Garcı́a, J.V.M. Zorraquino / Energy 27 (2002) 607–623
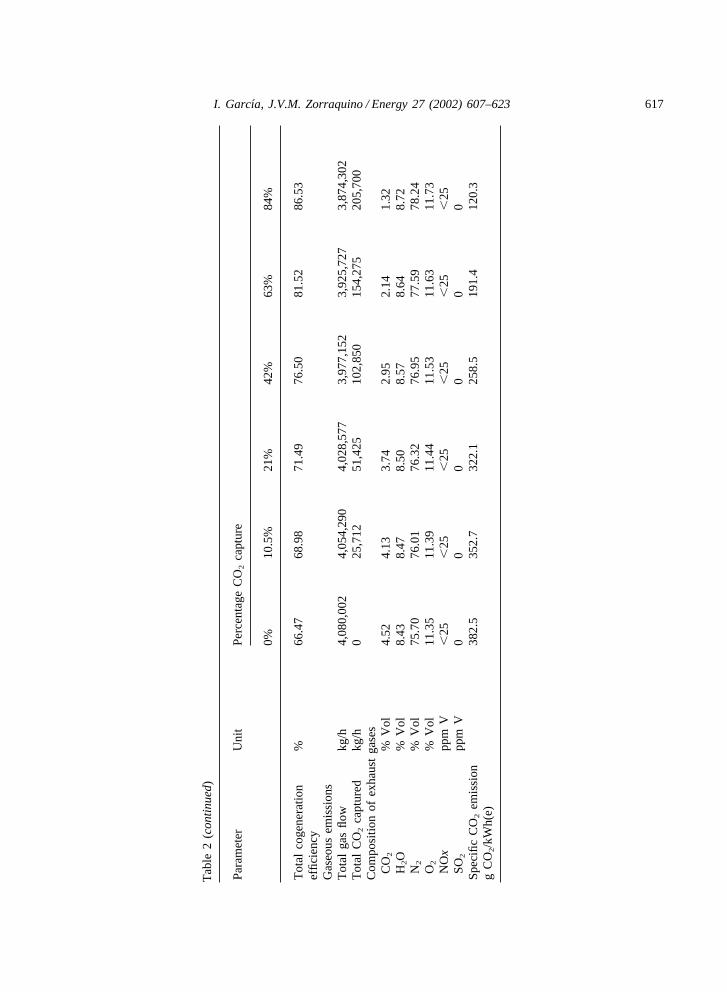
emission falls from 382.5 g CO2/kWh(e) with no CO2 capture down to 258.50 g CO2/kWh(e) for42% capture and 120.30 g CO2/kWh(e) for the case with 84% capture of the total CO2 generated.
5.2. Plant performance as a function of CO2 capture and 1000 m Ocean injection capacity
Table 3 shows the technical results for the proposed cogeneration plant for the medium factoryproduction rate (2000 rate) as a function of the percentage of carbon dioxide captured and injectedin the ocean at a depth of 1000 m for the scenarios with cero, 42 and 84% CO2 capture andinjection. The net electrical power generated passes from 735.6 MW for the case without CO2
capture and injection, to 665.7 MW for 42% CO2 capture and injection, and to 595.7 MW for84% CO2 capture and injection. Net efficiency of the plant without CO2 capture and injectionstands at 52.40%, dropping to 47.34% for the scenario with 42% of CO2 capture and injection,and to 42.44% for the scenario with 84% CO2 capture and injection.
5.3. Performance corresponding to the pure combined cycle
Plant performance corresponding to the plant configuration termed ‘pure combined cycle’ ,where there are no heat demands from the factory or carbon dioxide capture, is shown sub-sequently. This plant setup corresponds to the proposed plant in which the recovery boiler mediumpressure level has been optimized to coincide with the intermediate reheating level (29.5 bar).This case, therefore, allows optimum electrical efficiency from the installation.
The main performance data for this plant layout are:
Table 3Performance of proposed plant for various percentages of CO2 capture and 1000 m ocean injection—2000 pro-duction rate
Parameter Unit Percentage CO2 capture and injection
0% 42% 84%
Elect. power generated in gas turbines kW 537,119 537,119 537,119Elect. power generated in steam kW 212,177 173,687 135,185turbineTotal electrical power generated kW 749,296 710,806 672,304Elect. power in auxiliary consumptions kW 13,727 45,144 76,561
Cogeneration plant kW 13,727 13,727 13,727CO2 capture system kW 0 12,096 24,192CO2 injection system kW 0 19,321 38,642
Total net electrical power generated kW 735,569 665,662 595,743Fuel consumption (LHV) kW 1,403,731 1,403,731 1,403,731Gross electrical efficiency % 53.38 50.64 47.89Net electrical efficiency % 52.40 47.34 42.44Gaseous emissionsTotal gas flow kg/h 4,080,002 3,977,152 3,874,302Total CO2 captured and injected kg/h 0 102,850 205,700Specific CO2 emission g CO2/kWh(e) 382.5 258.5 120.3
619I. Garcı́a, J.V.M. Zorraquino / Energy 27 (2002) 607–623
� TOTAL ELECTRICAL POWER GENERATED: 790,472.2 kW� NET ELECTRICAL POWER: 776,786.1 kW� GROSS ELECTRICAL EFFICIENCY: 56.31%� NET ELECTRICAL EFFICIENCY: 55.34%� SPECIFIC CO2 EMISSION: 363.0 g CO2/kWh(e)
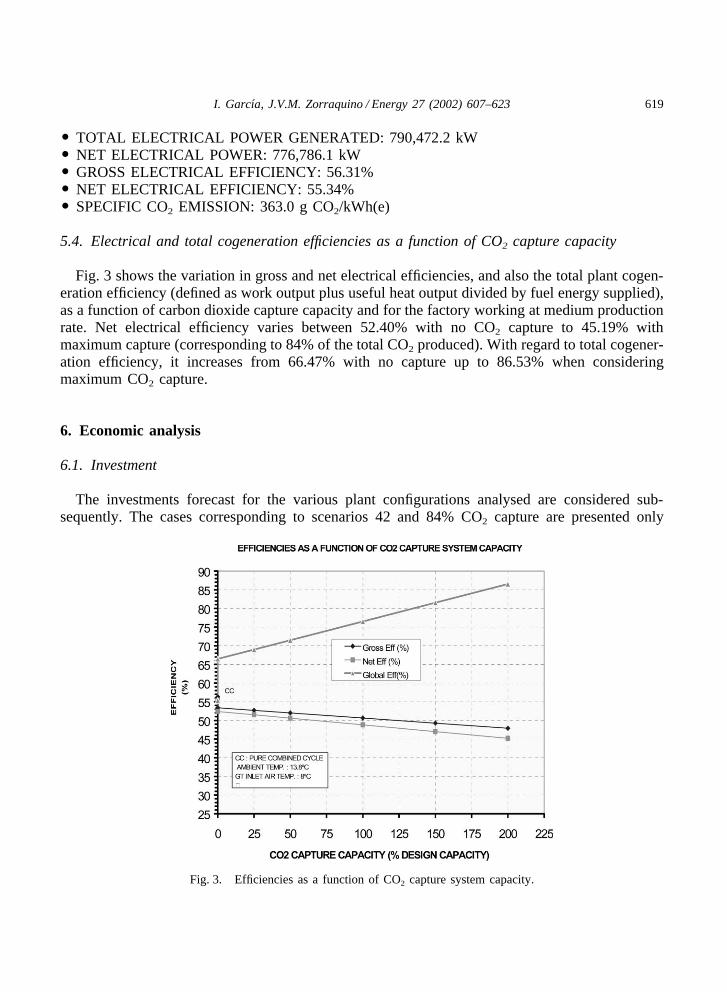
5.4. Electrical and total cogeneration efficiencies as a function of CO2 capture capacity
Fig. 3 shows the variation in gross and net electrical efficiencies, and also the total plant cogen-eration efficiency (defined as work output plus useful heat output divided by fuel energy supplied),as a function of carbon dioxide capture capacity and for the factory working at medium productionrate. Net electrical efficiency varies between 52.40% with no CO2 capture to 45.19% withmaximum capture (corresponding to 84% of the total CO2 produced). With regard to total cogener-ation efficiency, it increases from 66.47% with no capture up to 86.53% when consideringmaximum CO2 capture.
6. Economic analysis
6.1. Investment
The investments forecast for the various plant configurations analysed are considered sub-sequently. The cases corresponding to scenarios 42 and 84% CO2 capture are presented only
Fig. 3. Efficiencies as a function of CO2 capture system capacity.
620 I. Garcı́a, J.V.M. Zorraquino / Energy 27 (2002) 607–623
including the CO2 capture system, and including capture plus injection and storage of the capturedCO2 in the ocean bed at a depth of 1000 m.
The combined-cycle investment figures are based on tenders for similar plants brought up todate. The prices relating to the CO2 capture system and marine injection and storage are basedon updated bibliographic information [3,5].Other underlying bases are as follows.
� Annual plant operation period: 8325 h.� Average annual interest: 5%.� Amortization period: 20 years.� Price of natural gas: 2.85 ESP/THERMIE, LHV (1.71 cEURO/THERMIE, LHV).
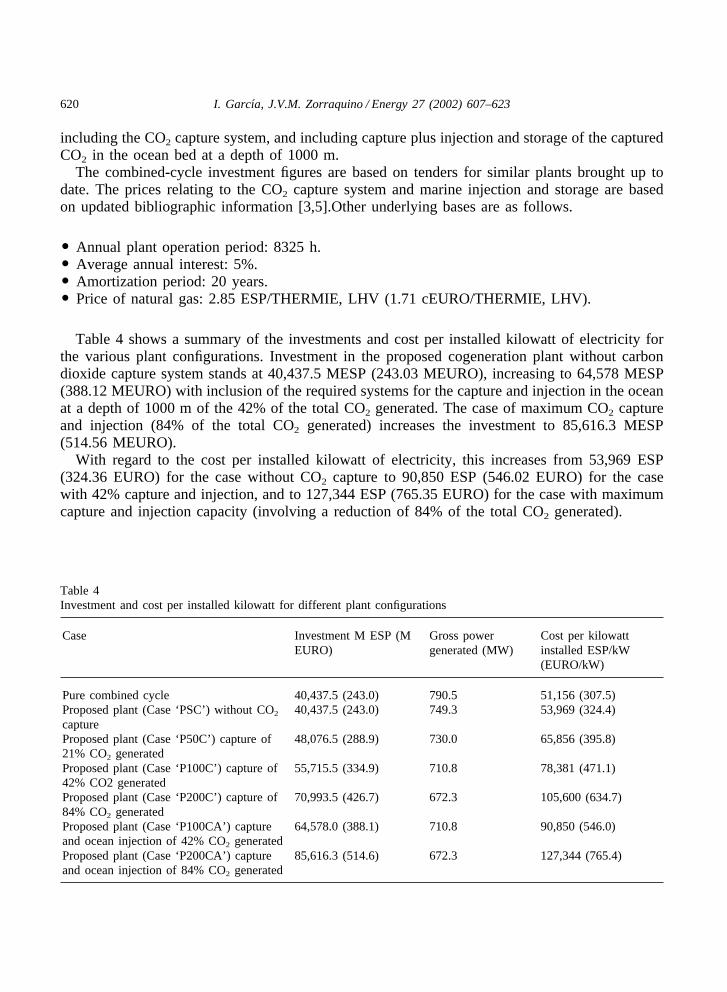
Table 4 shows a summary of the investments and cost per installed kilowatt of electricity forthe various plant configurations. Investment in the proposed cogeneration plant without carbondioxide capture system stands at 40,437.5 MESP (243.03 MEURO), increasing to 64,578 MESP(388.12 MEURO) with inclusion of the required systems for the capture and injection in the oceanat a depth of 1000 m of the 42% of the total CO2 generated. The case of maximum CO2 captureand injection (84% of the total CO2 generated) increases the investment to 85,616.3 MESP(514.56 MEURO).
With regard to the cost per installed kilowatt of electricity, this increases from 53,969 ESP(324.36 EURO) for the case without CO2 capture to 90,850 ESP (546.02 EURO) for the casewith 42% capture and injection, and to 127,344 ESP (765.35 EURO) for the case with maximumcapture and injection capacity (involving a reduction of 84% of the total CO2 generated).
Table 4Investment and cost per installed kilowatt for different plant configurations
Case Investment M ESP (M Gross power Cost per kilowattEURO) generated (MW) installed ESP/kW
(EURO/kW)
Pure combined cycle 40,437.5 (243.0) 790.5 51,156 (307.5)Proposed plant (Case ‘PSC’ ) without CO2 40,437.5 (243.0) 749.3 53,969 (324.4)captureProposed plant (Case ‘P50C’ ) capture of 48,076.5 (288.9) 730.0 65,856 (395.8)21% CO2 generatedProposed plant (Case ‘P100C’ ) capture of 55,715.5 (334.9) 710.8 78,381 (471.1)42% CO2 generatedProposed plant (Case ‘P200C’ ) capture of 70,993.5 (426.7) 672.3 105,600 (634.7)84% CO2 generatedProposed plant (Case ‘P100CA’ ) capture 64,578.0 (388.1) 710.8 90,850 (546.0)and ocean injection of 42% CO2 generatedProposed plant (Case ‘P200CA’ ) capture 85,616.3 (514.6) 672.3 127,344 (765.4)and ocean injection of 84% CO2 generated
621I. Garcı́a, J.V.M. Zorraquino / Energy 27 (2002) 607–623
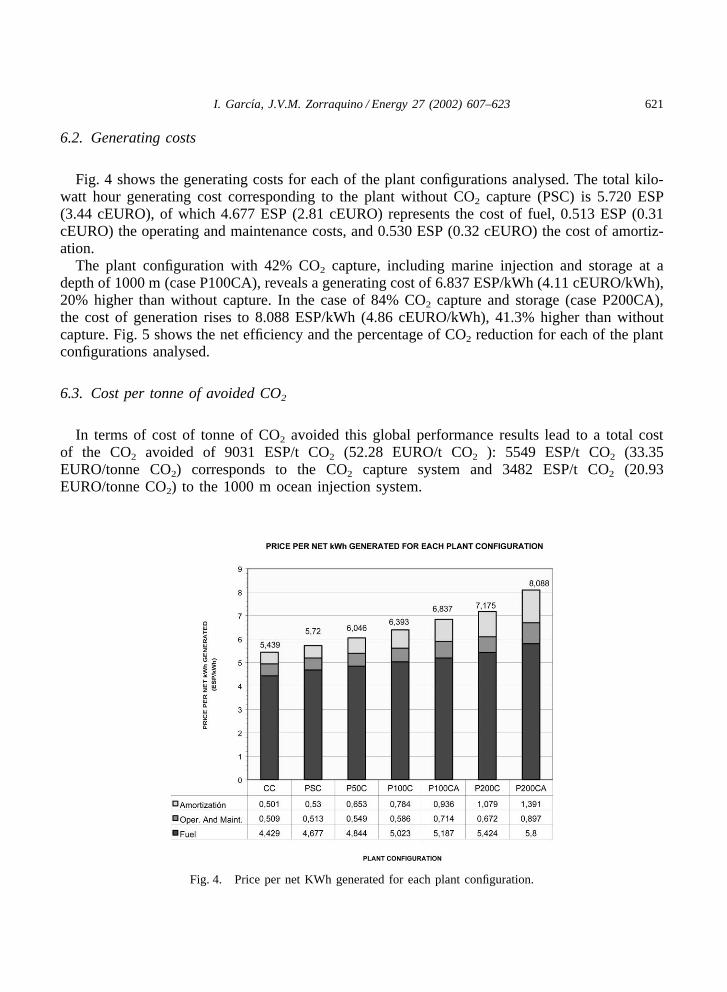
6.2. Generating costs
Fig. 4 shows the generating costs for each of the plant configurations analysed. The total kilo-watt hour generating cost corresponding to the plant without CO2 capture (PSC) is 5.720 ESP(3.44 cEURO), of which 4.677 ESP (2.81 cEURO) represents the cost of fuel, 0.513 ESP (0.31cEURO) the operating and maintenance costs, and 0.530 ESP (0.32 cEURO) the cost of amortiz-ation.
The plant configuration with 42% CO2 capture, including marine injection and storage at adepth of 1000 m (case P100CA), reveals a generating cost of 6.837 ESP/kWh (4.11 cEURO/kWh),20% higher than without capture. In the case of 84% CO2 capture and storage (case P200CA),the cost of generation rises to 8.088 ESP/kWh (4.86 cEURO/kWh), 41.3% higher than withoutcapture. Fig. 5 shows the net efficiency and the percentage of CO2 reduction for each of the plantconfigurations analysed.
6.3. Cost per tonne of avoided CO2
In terms of cost of tonne of CO2 avoided this global performance results lead to a total costof the CO2 avoided of 9031 ESP/t CO2 (52.28 EURO/t CO2 ): 5549 ESP/t CO2 (33.35EURO/tonne CO2) corresponds to the CO2 capture system and 3482 ESP/t CO2 (20.93EURO/tonne CO2) to the 1000 m ocean injection system.
Fig. 4. Price per net KWh generated for each plant configuration.
622 I. Garcı́a, J.V.M. Zorraquino / Energy 27 (2002) 607–623
Fig. 5. Net efficiency and CO2 reduction as a function of plant configuration.
7. Conclusions
The following conclusions have been reached based on the results obtained in this work.
� Applying cogeneration plants based on high-efficiency combined cycles in conjunction withcarbon dioxide capture systems to industrial production processes makes it possible to obtainnet electrical efficiencies in the range 45–55%, total cogeneration efficiencies in the range 66–86% [8,9] and reductions in specific CO2 emissions of up to 90%.
� In the case of the chemical factory analysed, application of a combined-cycle plant based ontri-generation and incorporating a carbon dioxide capture system with a capture capacity equiv-alent to 21% of the total CO2 generated makes it possible to achieve, on an annual basis, anet electrical efficiency of 50.15% and total cogeneration efficiency of 72.50%. Coupled to thisis a reduction of 72% in specific CO2 emission, compared with the existing power station basedon coal-fired boilers and back-pressure steam turbines.
� Suitable technology for capturing carbon dioxide from gas turbine exhaust gases is available,there being wide experience on an industrial level of capture systems based on chemical absorp-tion using a MEA solution as absorbing agent.
� Due to the limited capacity to reutilize carbon dioxide in comparison with the potential forcapturing it in thermal electricity generating stations, confinement in ocean beds and salineaquifers at depths of between 1000 and 3000 m is being proposed as the optimum storagemechanism due to its high physical–chemical stability, long retention period (retention periodsof over 500 years are predicted) and reduced biological impact. Industrial experience bears thisout, one example being the Sleipner natural gas platform in Norway, which from 1996 has
623I. Garcı́a, J.V.M. Zorraquino / Energy 27 (2002) 607–623
injected 2800 t per day of CO2 captured using absorption techniques into a saline aquiferlocated at a depth of 1000 m [10].
� Inclusion with the combined-cycle plant analysed of a CO2 capture system capable of reducingspecific emission of this gas by 84%, and injecting it into the ocean bed at a depth of 1000m, would involve a reduction in the plant’s net electrical efficiency of 10 percentage points,of which 7.2 points would be due to the CO2 capture system and 2.8 points to the marineinjection and storage system. The reduction in electrical efficiency associated with includingthe CO2 capture system is mainly due to heat consumption involved in the capture process.The impact of the injection and storage system on electrical efficiency is largely due to themechanical energy needed to pressurize the CO2 to pressures of the order of 120 bar.
� From the economic point of view, the proposed 84% CO2 capture and marine storage system(case P200CA) involves an increase in investment in the proposed combined-cycle plant ofapproximately 100%. This is accompanied by an increase in the cost of generating each kilowatthour of electricity of approximately 40%, from 5.72 ESP/kWh (3.44 cEURO/kWh) to 8.09ESP/kWh (4.86 cEURO/kWh).
� There is an important lack of protection on the part of the government institutions concerningthe application of environmentally friendly technologies which slows their industrial develop-ment. Therefore, the need for establishing taxes or other environmental incentives is put forwardin order to encourage such technologies [11].
References
[1] IEA Greenhouse Gas R&D Programme. Carbon dioxide capture from power stations. UK; 1995.[2] ABB Lummus Crest. The Kerr-Mcgree/Lummus crest technology for the recovery of CO2 from stack gases.
Houston, USA; 1992.[3] ABB Lummus Crest. CO2 recovery from flue Gas, Kerr-McGree/Lummus carbon dioxide recovery technology.
Houston, USA; 1993.[4] IEA Greenhouse Gas R&D Programme. Carbon dioxide utilisation. UK; 1995.[5] IEA Greenhouse Gas R&D Programme. Carbon dioxide disposal from power stations. UK; January1995.[6] Adams E, Akai M, Golmen L, Haugan P, Herzog H, Masuda S, et al. An international experiment on CO2
ocean sequestration. Presented at the fourth international conference on GHG control technologies. Switzerland:Interlaken; 1998.
[7] Orr JC, Aumont O. Exploring the capacity of the ocean to retain artificially sequestered CO2. Presented at thefourth international conference on GHG control technologies. Switzerland: Interlaken; August 1998.
[8] Kehlhofer R. Combined-cycle gas and steam turbine power plants. GA, USA: Fairmont Press Inc, 1991.[9] Horlock JH. Combined power plants. Whittle Laboratory, Cambridge, UK. Oxford: Pergamon Press, 1992.
[10] Chemical Engineering. Carbon dioxide gets grounded. 2000;p. 41–5.[11] Garcı́a I. Energy and environmental optimization in thermoelectrical generating processes. Application of a carbon
dioxide capture system. Doctoral Thesis, Department of Heat Machines and Engines, University of the BasqueCountry; 2000.


![Titanium dioxide and modified titanium dioxide by silver ...cdmf.org.br/wp-content/uploads/2019/02/Titanium-dioxide...zinc oxide [6,7], titanium dioxide [8,9], hydroxyapatite and chlorhexidine,](https://img.pdfslide.us/doc/110x75/60ff91e8d40a2e46c9475976/titanium-dioxide-and-modified-titanium-dioxide-by-silver-cdmforgbrwp-contentuploads201902titanium-dioxide.jpg)