Embed Size (px)
Citation preview

This document and trademark(s) contained herein are protected by law as indicated in a notice appearing later in this work. This electronic representation of RAND intellectual property is provided for non-commercial use only. Permission is required from RAND to reproduce, or reuse in another form, any of our research documents for commercial use.
Limited Electronic Distribution Rights
This PDF document was made available from www.rand.org as a public
service of the RAND Corporation.
6Jump down to document
THE ARTS
CHILD POLICY
CIVIL JUSTICE
EDUCATION
ENERGY AND ENVIRONMENT
HEALTH AND HEALTH CARE
INTERNATIONAL AFFAIRS
NATIONAL SECURITY
POPULATION AND AGING
PUBLIC SAFETY
SCIENCE AND TECHNOLOGY
SUBSTANCE ABUSE
TERRORISM AND HOMELAND SECURITY
TRANSPORTATION ANDINFRASTRUCTURE
WORKFORCE AND WORKPLACE
The RAND Corporation is a nonprofit research organization providing objective analysis and effective solutions that address the challenges facing the public and private sectors around the world.
Visit RAND at www.rand.org
Explore RAND Health
View document details
For More Information
Browse Books & Publications
Make a charitable contribution
Support RAND

This product is part of the RAND Corporation technical report series. Reports may
include research findings on a specific topic that is limited in scope; present discus-
sions of the methodology employed in research; provide literature reviews, survey
instruments, modeling exercises, guidelines for practitioners and research profes-
sionals, and supporting documentation; or deliver preliminary findings. All RAND
reports undergo rigorous peer review to ensure that they meet high standards for re-
search quality and objectivity.

Inpatient Rehabilitation Facility Care Use Before and After Implementation of the IRF Prospective Payment System
Melinda Beeuwkes Buntin, Grace M. Carter,
Orla Hayden, Carrie Hoverman,
Susan M. Paddock, Barbara O. Wynn
Supported by the Centers for Medicare and Medicaid Services

The RAND Corporation is a nonprofit research organization providing objective analysis and effective solutions that address the challenges facing the public and private sectors around the world. RAND’s publications do not necessarily reflect the opinions of its research clients and sponsors.
R® is a registered trademark.
© Copyright 2006 RAND Corporation
All rights reserved. No part of this book may be reproduced in any form by any electronic or mechanical means (including photocopying, recording, or information storage and retrieval) without permission in writing from RAND.
Published 2006 by the RAND Corporation1776 Main Street, P.O. Box 2138, Santa Monica, CA 90407-2138
1200 South Hayes Street, Arlington, VA 22202-5050201 North Craig Street, Suite 202, Pittsburgh, PA 15213-1516
RAND URL: http://www.rand.org/To order RAND documents or to obtain additional information, contact
Distribution Services: Telephone: (310) 451-7002; Fax: (310) 451-6915; Email: [email protected]
A profile of RAND Health, abstracts of its publications, and ordering information can be found on the RAND Health home page at www.rand.org/health.
The analyses upon which this publication is based were performed under Contract 500-2004-00033C, entitled “Inpatient Rehabilitation Facility Prospective Payment System Monitoring, Access, and Refinements,” funded by the Centers for Medicare & Medicaid Services, Department of Health and Human Services. The contents of this publication do not necessarily reflect the views or policies of the Department of Health and Human Services, nor does the mention of trades names, commercial products, or organizations imply endorsement by the U.S. government. The author assumes full responsibility for the accuracy and completeness of the ideas presented.
iii
Preface
Since the inception of the Inpatient Rehabilitation Facility Prospective Payment
System (IRF PPS) in 2002, the RAND Corporation has been contracted by the Centers
for Medicare and Medicaid Services (CMS) to support its efforts to monitor the effect of
the IRF PPS. To date, RAND has provided a number of analyses and reports on patient
access to and utilization of IRF services before and after the implementation of the IRF
PPS. Our reports address the Congressional mandate for a study of IRF patient access to
care.
This report focuses specifically on how the implementation of the IRF PPS has
affected the characteristics and resource use of patients seen in IRFs and IRF practice
patterns. This report was prepared for CMS, but should also be of interest to individuals
in the health care and policy-making arenas who are concerned about Medicare
beneficiaries' access to care.
This work was sponsored by CMS under contract 500-2004-00033c.1
Comments or inquiries should be sent to the first author of this report, Melinda Beeuwkes
Buntin ([email protected]). We would like to thank reviewers Dan Relles and Korbin
Liu, and our project officer Jeanette Kranacs for helpful comments and suggestions. The
research was conducted in RAND Health, a division of the RAND Corporation. A
profile of RAND Health, abstracts of its publications, and ordering information can be
found at www.rand.org/health.
1 Findings from related research that has been sponsored under this contract are described in Beeuwkes
Buntin et al. (2005); Carter and Paddock (2005); Paddock et al. (2005a); Paddock et al. (2005b); and Relles
et al. (2005).


v
Table of Contents
Preface ..........................................................................................................................iiiFigures and Tables ......................................................................................................viiAcronyms...................................................................................................................... ixChapter I. Background and Executive Summary........................................................ 1
1.1 Payment System Changes...................................................................................... 21.2 Provider Responses to PPS .................................................................................... 41.3 Monitoring the IRF PPS ........................................................................................ 51.4 IRF Utilization Patterns ......................................................................................... 61.5 Unusual Cases ....................................................................................................... 61.6 Resource Use......................................................................................................... 81.7 Limitations ............................................................................................................ 9
Chapter II. Data .......................................................................................................... 112.1 Data Sources ....................................................................................................... 112.2 Sample Selection and Sample Size ...................................................................... 15
Chapter III: Overall Utilization Patterns................................................................... 183.1 Overview............................................................................................................. 183.2 Methods .............................................................................................................. 183.3 Results................................................................................................................. 193.4 Conclusions......................................................................................................... 27
Chapter IV. Unusual Cases......................................................................................... 294.1 Very Short-Stay Discharges................................................................................. 304.2 Interrupted Stays ................................................................................................. 314.3 Short-Stay Transfers ............................................................................................ 354.4 High Cost Outliers............................................................................................... 394.5 Discussion and Conclusions ................................................................................ 42
Chapter V. Resource Use ........................................................................................... 455.1 Distribution of Length of Stay of IRF cases ......................................................... 455.2 Changes in Resource Use by Types of IRF .......................................................... 495.3 Payment-to-Cost Ratios in 2002 .......................................................................... 545.4 Conclusions......................................................................................................... 58
Appendix 1: CMI Calculation ................................................................................... 60References.................................................................................................................... 61


vii
Figures and Tables
Figures
3.1: Percent of IRF Cases by RIC, 1999 vs. 2002 .......................................................... 193.2: Mean Motor Score by RIC, 1999 vs. 2002.............................................................. 213.3: Mean Cognitive Score by RIC, 1999 vs. 2002 ........................................................ 213.4: Cumulative Distribution of All Cases in RIC 1 (Stroke) by CMG, 1999 vs. 2002 ... 233.5: Comorbidity Tier Assignments for All Hospitals, for All Cases in 1999
and 2002, and for IRF PPS Cases in 2002: by Freestanding/Unit Status.................. 255.1: Cumulative Distribution of LOS, by Year .............................................................. 475.2: Lengths of Stay in 1999 vs.2002, for Selected Large CMGs ................................... 48
Tables
2.1: Number of Cases in Each Year in the Longitudinal Analyses ................................. 132.2: Counts of IRF PPS Discharges During CY 2002 Excluded from Sample
and Remaining Sample, by Reason for Exclusion................................................... 142.3: Number of 1999 Bundled Discharges in Population and Sample with
Case Mix Data, by Unit and Freestanding .............................................................. 153.1: Increases in the Volume of IRF Facilities and Bundled Discharges,
1996-2002 (Excluding Maryland Hospitals) Versus Increases in theFee-For-Service Discharges ................................................................................... 19
3.2: Distribution of Cases Across RICs for All Cases in 1999 and 2002,and for IRF PPS Cases in 2002: by Freestanding/Unit Status.................................. 20
3.3: Mean Motor and Cognitive Scores for All Cases in 1999 and 2002, and for IRF PPSCases...................................................................................................................... 22
3.4: Percent of Cases by RIC in Each Comorbidity Tier: All Cases in 1999 and2002, and for IRF PPS Cases in 2002 .................................................................... 24
3.5: Change in Case Mix Index (CMI) Between 1999 and 2002 .................................... 253.6: Percent of Cases in Each Demographic Category by Year for the Sample,
1999 and 2002........................................................................................................ 264.1: Very Short-Stay Cases Discharged Alive by Length of Stay 1999-2002 ................. 314.2: Distribution of Interrupted Stays: 1999-2002.......................................................... 334.3: Distribution of Interrupted Stays by Hospital Characteristics.................................. 344.4: 2002 Bundled Stays by Hospital Characteristics ..................................................... 364.5: Changes in Transfers Measured by Post-IRF Status................................................ 384.6: Transfers by Discharge Destination ........................................................................ 384.7: Simulated IRF PPS Payments for All 2002 Bills Assuming 100percent Federal Rate
by Hospital Characteristics..................................................................................... 414.8: Simulated IRF PPS Payments for All 2002 Bills Assuming 100percent Federal Rate
by RIC and Comorbidity Tier................................................................................. 435.1: Mean LOS of Bundled Discharges Declined Each Year Between 1998 and
2002 and Recently Declined More in Freestanding Facilities Than in Units,Although LOS Within Most RICs Remains Higher in Freestanding Facilities ........ 46

viii
5.2: Mean Length of Stay Declined Between 1999 and 2002 in Almost All RICs andTypically Declined More in Freestanding Facilities Than in Units, Although LOSWithin Most RICs Remains Higher in Freestanding Facilities ................................ 48
5.3: Comparison of Volume, Cost, and LOS for 1999 and 2002 for the IRFPopulation, by Provider Characteristics .................................................................. 50
5.4: Comparison of LOS, Percentage of Costs for Therapy, and Average DailyTherapy Cost for 1999 and 2002, by Provider Characteristics................................. 53
5.5: PPS Payment, Average Case Weight, Cost and Payment-to-Cost Ratiosfor All 2002 Cases, by Hospital Characteristics ...................................................... 55
5.6: Average Standardized Cost in 2002 Was Highly Correlated Across Tierand RIC with Case Weight and Federal Payment, But Variations in thePayment-to-Cost Ratio Show the Need To Refine the CMGs and Tiers .................. 57

ix
Acronyms
CMG Case mix group
CMI Case mix index
DSH Disproportionate share
HHA Home Health Agency
IME Indirect Medical Education
IRF Inpatient Rehabilitation Facility
IRF PAI Inpatient Rehabilitation Facility Patient Assessment Instrument
IRF PPS Inpatient Rehabilitation Facility Prospective Payment System
LOS Length of stay
MDS Minimum Data Set
PTC Payment-to-cost
RIC Rehabilitation Impairment Category
SNF Skilled Nursing Facility

1
Chapter I. Background and Executive Summary
The Medicare program began to phase in the Inpatient Rehabilitation Facility
Prospective Payment System (IRF PPS) on January 1, 2002. IRFs are specialized
hospitals or hospital units that provide intensive rehabilitation (generally three or more
hours a day of therapy) in an inpatient setting. Under the IRF PPS, Medicare pays
facilities a predetermined rate per discharge that varies by case mix group (CMG). The
CMG depends on the patient’s age, impairment, functional status (motor and cognitive) at
admission, and comorbidities. In addition, facilities receive special rates for patients who
die in the hospital, short-stay transfer patients, atypically short-stay patients, and high
cost outliers. The rate also varies across facilities based on area wages, the share of a
facility’s patients that are low income, and rural location. Previously, inpatient
rehabilitation facilities were paid using a historical cost-based system.
The shift from cost-based to prospective payment gives facilities incentives to
provide care efficiently, since they can keep any difference between the prospectively set
payment amounts and their costs. However, it also gives facilities incentives to change
their care and practice patterns in other ways and to change their coding practices to
increase revenue. Changes could take the form of adjustments to the way patients are
assessed and their diagnoses and functional status are coded, changes in treatment
intensity and length of stay, changes in transfer policies, and changes in admissions
policies. In addition, some changes coinciding with the new PPS could be due to other
Medicare rules or other changes taking place in the health care system. These changes, no
matter what their cause, could have adverse or beneficial effects on patients and/or cause
unwarranted increases in Medicare expenditures.
In this chapter we describe changes in incentives due to the implementation of the
prospective payment system, and then briefly summarize the work presented in detail in
the following chapters on monitoring use of IRF care. Two related project reports
describe changes in the use of post-acute care generally and probe whether there are real
changes in the severity of patients seen in IRFs (Beeuwkes Buntin et al., 2005; Carter G
and Paddock SM, 2005).
2
1.1 Payment System Changes
Before looking at the results of monitoring IRFs’ responses to the IRF PPS, it is
important to understand how the payment system works and particularly the incentives
provided by the payment system. The Balanced Budget Act of 1997, as amended by the
Balanced Budget Refinement Act of 1999 and the Benefits Improvement Act of 2000
provided for a per discharge PPS. IRFs began to be paid under the prospective payment
system on the first day of their fiscal year following January 1, 2002. Thus, some
facilities fell under the system immediately, while the payment system was effective for
others as late as December 2002. Regardless of fiscal year, however, IRFs were required
to submit patient assessment forms beginning on January 1, 2002.
The IRF PPS payment system assigns cases to CMGs in order to establish
payment amounts. Each CMG has a relative weight reflecting the average cost per case
for Medicare patients assigned to the CMG relative to the average cost per case for all
Medicare patients receiving IRF care. To determine payment, the standard rate (adjusted
for the IRF’s geographic location and proportion of low-income patients) is multiplied by
the CMG relative weight. Payments are increased by an outlier supplement for very
expensive cases. Also, short-stay transfer cases are paid on a per diem basis, where the
amount of the per diem depends on CMG.
The data used to assign CMGs to each IRF patient come from the IRF Patient
Assessment Instrument (PAI). In order to assign a CMG, each case is first classified into
one of 21 Rehabilitation Impairment Categories (RICs). Most RICs are based on
particular body structures and/or causes of impairment.
Each RIC is subdivided into CMGs based on functional independence
and age. Functional independence is determined by the response to 17 questions on the
IRF PAI. The sum of 12 items is used to create a motor score, and the remaining five
items are summed for a cognitive score. The values of motor and cognitive scores and
patient age determine the patient’s CMG assignment within RIC. The CMG assignment
rules were derived in order to maximize the ability to predict cost under the constraint
that payment for care of a patient with a lower score (less independence) is never less
than for care of an otherwise similar patient with a higher score.
3
Comorbidities are used to split most CMGs into four payment subgroups: three
comorbidity tiers and a subgroup with no relevant comorbidity. Comorbidity tier affects
the relative weight used for payment in the CMGs. Tier 1 comorbidities are the
most costly and have the highest relative weight within the CMG followed in order by
tiers 2 and 3. The least expensive subgroup, which is the one with the lowest weight
within each CMG, consists of patients with no relevant comorbidity. Patients that have
comorbidities in more than one tier are assigned to the most expensive of those tiers.
Multiple comorbidities in the same or lower tiers do not affect payment.
Payment CMGs are calculated during bill processing and depend on the discharge
destination shown on the bill, the length of stay, and the admission CMG previously
assigned. The payment CMG is the same as the admission CMG for cases with a stay
more than three days in the hospital and who are discharged alive. Transfer cases who
stay 3 or fewer days also remain in the admission CMG. Non-transfer cases who stay 3
or fewer days and cases who die in the hospital are assigned to one of 5 special payment
CMGs.
One goal of the IRF PPS is to enhance access to IRF care by compensating IRFs
based on their case mix. Prior to the IRF PPS, payment for inpatient rehabilitation care
for Medicare beneficiaries had been made under the Tax Equity and Fiscal Responsibility
Act (TEFRA) of 1982 (as amended by subsequent legislation). TEFRA capped per
discharge payments to an inpatient rehabilitation facility at a facility-specific maximum
that was determined using the IRF’s base year of operation from which facility-specific
costs were estimated. Under TEFRA, there was no adjustment to payments due to
changes in a hospital’s case mix the base year. Updates to the rates did not keep up with
inflation, thus allowing new hospitals to obtain larger payments than existing hospitals.
The lack of case mix adjustment under TEFRA created incentives for providers to
preferentially admit relatively less expensive cases, thus raising concerns that TEFRA
limited beneficiary access. The IRF PPS was expected to enhance access by providing
greater levels of reimbursement for those with greater clinical needs (Stineman, 2002).
Another goal of the IRF PPS is to control Medicare’s inpatient rehabilitation
expenditures. Cases who did not fulfill an entire course of rehabilitation, such as short
stays and transfers, were fully compensated under TEFRA. IRFs took advantage of

4
incentives under TEFRA to maximize payment. This led to increased utilization and cost
during the base year(s), as well as afterward, relative to pre-TEFRA years, thus resulting
in increased expenditures for the Medicare program (Chan et al., 1997). By 1995,
payments exceeded costs by 7 percent in freestanding rehabilitation facilities and 4
percent in rehabilitation units (MedPAC, 1998).
1.2 Provider Responses to PPS
The implementation of prospective payment can trigger a range of effects among
providers (Ellis and McGuire, 1996). Providers can succumb to stinting on the amount of
care delivered, for example by reducing therapy intensity. Providers can engage in
selection behavior, such as changing their admission policies so as to restrict access for
patients not likely to be profitable and increase admission rates for patients who are likely
to be profitable. Providers can alter their coding practices for patient functional status in
order to increase payments without changing their case mix; this coding could occur in
the form of deliberate upcoding or in response to changes in coding instructions, better
training of coding staff, and incentives under the new payment system to thoroughly code
patients’ limitations. On the positive side, providers might respond to prospective
payment by becoming more efficient and produce equivalent health outcomes with fewer
inputs. Providers who experienced fiscal pressure under the former payment system
might be able to admit patients who are more medically complex or who have lower
functional status than before.
Provider responses to prospective payment across a variety of care settings have
been documented that highlight the potential for stinting. In a large, nationally
representative sample of Medicare beneficiaries from 297 hospitals, Kahn et al. (1992)
found that the length of stay (LOS) after implementation of the PPS for acute care
hospital inpatient services dropped significantly for all of the conditions studied despite
patients being sicker at admission post-PPS versus pre-PPS and that there was greater
instability among patients at discharge following implementation of the PPS. Neu and
Harrison (1988) found that this observed decrease in the average length of an acute care
stay was accompanied by increases in Skilled Nursing Facility (SNF) and Home Health
Agency (HHA) utilization following an acute care stay, indicating the potential for a shift
of care that had been previously provided by the acute care hospital to other settings. The

5
effect of the Balanced Budget Act (BBA) of 1997 on post-acute care has also been
examined. Angelelli et al. (2002) found that the lengths of stay and readmission rates of
the costliest, most medically complex patients discharged to nursing facilities in Ohio
post-BBA versus pre-BBA were quite steady over time, while Yip et al. (2002) found
decreases in the intensity and duration of physical and occupational therapies among
Medicare beneficiaries in three southern California SNFs. White (2003) similarly
concluded that the proportion of patients in freestanding SNFs receiving high levels of
therapy declined after the SNF PPS was implemented.
Selection behavior effects have been found as well. In a small sample of
Medicare beneficiaries in three southern California SNFs following implementation of
the SNF PPS, Yip et al. (2002) found that patients admitted post-PPS had conditions with
better-defined (i.e., more predictable) care protocols, though patients had worse scores on
health-related quality of life and functional status but better scores on emotional health.
Newhouse (1989) found that acute PPS discharges for which the payment was relatively
less generous increasingly were admitted to “last resort” public hospitals under the acute
PPS.
Coding change has been identified under prospective payment implementation.
One-half of the increase in the case mix index of Medicare patients at acute care hospitals
in FYs 1987 and 1988 was attributed to changes in coding and administrative practices,
resulting in increased Medicare expenditures (Carter, Newhouse, and Relles, 1991).
Coding changes were expected following the IRF PPS since providers did not previously
have an incentive to thoroughly code patient comorbidities; comorbidities garner
additional payment under the IRF PPS that did not exist under the TEFRA system. The
IRF PAI used under the IRF PPS to collect patient admission and discharge information
on functional status, was slightly modified from the FIM™ Instrument (Uniform Data
System for Medical Rehabilitation, 1997) that was used prior to the IRF PPS, which
could also cause coding change.
1.3 Monitoring the IRF PPS
The goals of the IRF PPS and the theoretical and observed effects of prospective
payment led to the analyses described in this report. It focuses on two areas: changes in
beneficiary access to and use of IRF care and responses to specific incentives created by

6
the payment system. In monitoring access to care it is important to describe trends in the
use of IRF care, monitor the types of beneficiaries accessing IRF care, and look for
evidence that payment changes affect beneficiary access to IRFs. As mentioned above,
the shift from cost-based to prospective payment gives facilities incentives to provide
care efficiently, since they can keep any difference between the prospectively set
payment amounts and their costs. However, it also gives facilities incentives to
selectively treat patients who are expected to have below-average costs within a payment
category and to change their coding practices. It was important to monitor, therefore,
IRF changes in utilization patterns, responses to special payments for atypical patients,
resource use in IRFs, and coding changes. This report also addresses the Congressional
mandate for a study of IRF patient access to care.
1.4 IRF Utilization Patterns
Patterns of utilization within IRFs were examined for evidence of changes.
Patterns in IRF care observed in the analysis of 2002 data were largely consistent with
the incentives created by the IRF PPS and with trends previously observed from 1996
through 1999. There was an increase in the number of IRFs caring for Medicare patients
and a larger increase in the number of Medicare beneficiaries seen in IRFs between 1999
and 2002 in both absolute terms and on a per eligible beneficiary basis. There was also a
shift in the composition and/or coding of patients seen in IRFs after the implementation
of the IRF PPS. A greater proportion of patients were coded as having comorbidities and
motor and cognitive functioning scores declined.2 More details can be found in Chapter
3 of this report.
1.5 Unusual Cases
Specific types of patients with atypical stays were examined to see if prospective
payment might shift patients across sites. Under the IRF PPS, typical cases are defined
as those who stay more than 3 days, receive a full course of inpatient rehabilitation, and
are discharged to the community. Special payment rules apply to most unusual cases who
deviate from this pattern. There are anticipated behavioral changes in response to these
rules that might occur under the IRF PPS if an IRF tries to maximize net revenue. The
2 Patients are coded into tiers based on their comorbidities. Tier 1 is the most expensive tier. A greater
ability to function independently is captured in higher functioning scores.

7
incentives are specific to the payment policies for unusual cases and may interact with
other incentives to reduce costs and increase revenues.
For the most part, IRF facilities responded in anticipated ways to the financial
incentives created by the various policies for very short-stay cases and interrupted stays.3
In particular, there is evidence of:
• A reduction in non-transfer stays lasting fewer than 3 days and an increase in non-transfer stays lasting 4-5 days. The proportion of non-transfer cases consideredvery short-stay cases declined about 10 percent.
• A reduction in the proportion of interrupted stays lasting fewer than 3 days and anincrease in the proportion lasting 4-5 days.
• A substantial increase in short-stay transfers that was largely offset by a decline inlonger stay transfers so that there was only a small increase in the overall transferrate. We assume that the increase in short-stay transfer rates largely reflects theoverall trend toward shorter stays.
• There was an increase in the transfer rates to acute care hospitals but anunexpected decline in transfer rates to SNFs and nursing homes.
Freestanding hospitals showed stronger behavioral responses than units to the
incentives created by the payment policies for very short stays and interrupted stays. For
interrupted stays, the payment-to-cost ratio for freestanding hospitals was 1.00 compared
to 0.88 for units of acute care hospitals.
Overall, outlier payments were 3.0 percent of total payments, which was the
percentage offset used to establish the initial outlier threshold. Consistent with having
lower costs per discharge, freestanding hospitals received 1.2 percent of total payments as
outlier payments compared to 4.0 percent for units of acute care hospitals. More details
can be found in Chapter 4 of this report.
1.6 Resource Use
Also mentioned above, providers can respond to prospective payment by
becoming more efficient and/or by stinting on care since they can keep differences
3A per diem rate applies to a short-stay transfer--a patient with a length of stay that is less than
the mean length of stay for the CMG minus 0.5 days who is transferred to another IRF, an acute care
hospital, a long-term care hospital, or a Medicare or Medicaid-certified nursing home. Long-stay transfers
are paid as a typical case. One CMG payment is made for an interrupted stay, which occurs when a patient
is discharged and returns to the same IRF within 3 consecutive calendar days. Precise estimates of changes
in transfer rates, and therefore also of atypically short-stay cases, are problematic because of
inconsistencies in the definitions used to report transfers and the under-reporting of short-stay cases in the
1999 baseline data.

8
between payments and costs as profit. These changes can be manifest in changes in
resource use including changes in IRF LOS, costs (including therapy costs), and
payment-to-cost ratios.
Length of stay in IRFs has been declining at least since 1998. There was a
particularly large decline in the number of cases with extremely long LOS and an
increase in the percentage of cases in most payment groups discharged at the average
LOS. The rate of decline increased throughout this period and average LOS declined 5.8
percent from 2001 to 2002, the first year of the PPS. Average LOS declined within each
RIC between 1999 and 2002, the two years for which case mix data were available. The
rate of decline in LOS varied across groups of hospitals. In general, hospitals that had a
relatively long LOS in 1999 had greater percentage declines between 1999 and 2002, thus
increasing the uniformity of IRF LOS across the country and across types of hospitals.
The average cost per case increased 1.6 percent between 1999 and 2002. Since
LOS declined by 13 percent over this period, the cost per day increased by 16.6 percent.
This exceeds the three-year rate of increase in the hospital market basket of 10.9 percent.
Therapy costs per day increased at a lower rate (10.6 percent) than other costs in the same
period, thus decreasing the percentage of costs devoted to therapy from 24.4 percent to
23.2 percent.
The rate of change in average case costs, daily costs, and payment-to-cost ratios
varied across groups of hospitals. In 1999, freestanding cases cost on average $187
more than units but in 2002 they cost $105 less. If all hospitals had been paid based on
100 percent of the PPS rates throughout all of 2002, PPS payments during 2002 would
have been 14 percent higher than cost. This is due to the lack of cost growth per case
since 1999, the increase in the payment rate by the CMS actuary to account for payment
trends under TEFRA, and changes in coding. Payment- to-cost (PTC) ratios varied
across groups of hospitals, with freestanding and proprietary hospitals having PTCs of
1.18. In contrast, units had a PTC ratio of only 1.11. Despite the fact that freestanding
hospitals had lower costs in 2002 than units, they had longer average LOS. Therefore, it
remains possible that the PTC ratio of units was affected in part by accounting practices
left over from the TEFRA era; TEFRA cost-based payments were determined through a

9
cost allocation process and hospitals had an incentive to shift costs from their acute care
services, paid under the acute prospective payment system, to the rehabilitation units.
The PTC ratios for other groups of IRFs show the effectiveness of the payment
adjustments, with only small variations between rural and urban areas, and by low-
income patient, or disproportionate share (DSH), categories. Although payment largely
followed costs by RIC and tier, variations in the PTC ratio across these categories show
the need to refine the payment parameters of the PPS. There also was a positive
correlation between PTC ratio and hospital Case Mix Index (CMI) quartile. In addition
to demonstrating that the current weights are inappropriate for the coding practices
prevalent in 2002, this may indicate that coding practices varied across hospitals with
those in the highest CMI quartile responding most completely to the PPS incentives, or
even upcoding. More details can be found in Chapter 5 of this report.
1.7 Limitations
It is important that all of the changes associated with the shift to the IRF PPS be
studied in the context of changes in overall patient care use, costs and outcomes. For
example, declines in lengths of stay may indicate increases in treatment efficiency if
patient outcomes remain steady. Similarly, increases in payments to IRFs could
theoretically be offset by decreases in the use of other types of care, such as home health
care, following discharge from IRFs. In addition, it should be noted that these analyses
reflect the latest data available, but that they cover only the early stages of the IRF PPS
implementation. Therefore, it is important to continuously monitor the impact of the
implementation of the IRF PPS as additional data, including data on Medicare costs and
outcomes, become available.


11
Chapter II. Data
In the analyses described in the following chapters, we examined characteristics
of IRF discharges between 1998 and 2002. The 1998 and 1999 data were previously
used to develop most parameters of the IRF PPS. The 2002 data are from the first year of
the implementation of the PPS. We used bills (or equivalently MEDPAR) for each of the
5 study years. For 1998, 1999, and 2002, we also used additional case mix data. Each of
these data sets and the role they play in our analyses are described further below.
2.1 Data Sources
2.1.1 Medicare Bills
The inpatient bills are submitted to the Fiscal Intermediaries by the IRFs. We
used the bills after standard analytic file processing. These bills contain provider
number, beneficiary number, age, admission date, and discharge date. We calculated
LOS as discharge date minus admission date, using 1 as the minimum LOS.
The bills contain charges for ancillary services, which we aggregated to MEDPAR
departmental charges. We then used cost-to-charge ratios and a routine per diem
calculated from the cost reports to estimate the cost of each case. To estimate 2002 costs,
we drew hospital cost reports from the public use files dated September 2003. For each
discharge we tried to use the cost report that contained the day of discharge. When this
was not available (as it was not for 38 percent of the 2002 discharges), we used the cost
report that was closest in time to the day of discharge and inflated the per diem
payments.
During the public comment period on the proposed rule updating the IRF PPS
effective October 1, 2005, HealthSouth, a large chain organization, notified CMS that its
IRFs did not include any home office costs in its cost reports for cost reporting periods
beginning on or after October 1, 2001 and before October 1, 2003. Home offices of chain
organizations such as Health South usually furnish central management and
administrative services such as centralized accounting, purchasing, personnel services,
management, and other services to support patient care services furnished by their
member providers. The reasonable costs of these services are normally included in the
providers’ cost report and reimbursed as part of the providers’ costs. Home office costs
12
for HealthSouth providers are about 13 percent of total costs. Since the omission of these
costs would distort the findings from analyses involving 2002 costs, we adjusted the 2002
costs by an adjustment factor. To derive the adjustment factor, we updated the latest
available IRF cost report data (generally, cost reports beginning in FY2003 that did not
include home office costs) to FY2004 using the estimated rate of increase in the hospital
market basket. We obtained FY 2004 home office cost data from CMS for individual
HealthSouth IRFs and added the home office costs to the estimated FY2004 IRF costs.
The adjustment factor is the ratio of estimated costs including home office costs to
estimated costs excluding home office costs. We then applied this adjustment factor to
the 2002 cost per case that we had estimated using the 2002 cost report data that did not
include home office costs. The FY2004 HealthSouth home office cost statement has
information on home office costs allocated to 92 of the 98 HealthSouth IRFs in our
analysis file. We used the average adjustment factor for the six IRFs for which we were
not able to compute a facility-specific adjustment factor. For further information on this
issue, see the IRF PPS final rule for FY2006 (CMS, 2005).
The bills also contain discharge destination, which is used to determine whether
the stay ended with a transfer or an in-hospital death. A flag on the bill is used to
determine whether the hospital was paid under PPS at the time of the discharge. For
cases paid under the PPS, the CMG and comorbidity tier are found on the bill.
The bills for CY 2002 were received in October 2003 and thus our bill file should
be essentially complete for all years from 2000 through 2002.
2.1.2 Case Mix Data
For 1998 and 1999 we used case mix data from the linked files that we had
created for our IRF PPS implementation work (Carter et al., 2002). For 2002 we used the
IRF PAI as the source of case mix data.
IRFs submit each patient’s IRF PAI record electronically to the national database
using the Inpatient Rehabilitation Validation and Entry System (IRVEN) or vendor
purchased software. The receiving system validates the provider’s identity and checks
certain items on the record for valid codes. In particular, it checks that the submitted

13
CMG and tier are consistent with information on impairment, age, functional status, and
comorbidities found on the IRF PAI.4
In this analysis we used the IRF PAI impairment group code at admission (item
i21a), the list of up to 10 comorbidities in IRF PAI item 24, and the functional
independence measures at admission in items 39Aa thru 39Ra. The IRF PAI file that we
used was drawn from the national file during November 2003 and should be complete for
discharges in CY 2002.
2.1.3 Matched Bill and Case Mix Data
As described in our implementation report, we attempted to match each 1998 and
1999 MEDPAR record from a participating provider to a case mix record using
demographic variables. For 2002, we also matched within provider (after cleaning this
field on the IRF PAI), using admission, discharge, transfer, and return dates and the
beneficiaries' encrypted identifier. We used patient demographics (age, sex, zip code)
only in cases where the identifiers did not match.
For cases paid under PPS, we used only records where the bill CMG is consistent
with the IRF PAI CMG.
2.1.4 Facility-Specific Payment Adjustments
We estimated payment under the PPS for cases in CY 2002. We used the wage
index from the final rule for the first year of the PPS (CMS, 2001). We took the low-
income adjustment and urban/rural status from CMS’s PRICER for the relevant period --
the FY 02 PRICER for cases discharged before October 1 and the FY 03 PRICER for
cases in the last calendar quarter. We also used the cost-to-charge ratio on the PRICER
to determine outlier payments.
2.1.5 Derived Variables
The RIC is determined from the second and third character on the IRF PAI's
CMG. Cases who experience atypically short stays (non-transfer cases with LOS <= 3
days) and in-hospital deaths are assigned to RIC 50 or 51. Tier is determined from the
first character of the same CMG variable, but is not assigned for cases in RICs 50 and 51.
4 We have independently verified that the CMGs on the IRF PAI are essentially always consistent with the
underlying data and that, when the bill contains a CMG, the CMG on the IRF PAI is practically always
consistent with the CMG on the bill.

14
The IRF PPS contains an interrupted stay rule. If a patient is discharged from an
IRF and then returns to the same IRF in three days (the day of discharge or either of the
following two calendar days), only a single payment will be made for both parts of the
stay. Separate bills for each part of interrupted stays were appropriate during the pre-PPS
portion of 2002 and earlier. We “bundled” multiple bills for records that would meet the
interrupted stay rule of the PPS into a single simulated stay for all admissions from 1998
through 2002. We took the admission date for the stay from the first bill in the bundle.
We took the discharge date and discharge destination for the stay from the last bill in the
bundle. We calculated LOS and cost for the bundle as the sum of the LOS and costs for
all discharges in the bundle. For cases matched to a case mix record, we used data from
the case mix record matched to the earliest bill in the bundle.
In-hospital deaths are defined as those with a discharge destination of 20.
Because of under-reporting of transfers and changes in the discharge destination codes in
2002, we did not use the discharge destination codes on the IRF bill to identify transfers.5
Instead, we defined a case as a transfer if there is a post-IRF bill for the beneficiary for a
stay that starts on the day of the IRF discharge or there is a Minimum Data Set (MDS)
record for a nursing home stay indicating that the beneficiary was in a nursing home on
the day of the IRF discharge.
5 Prior to October 2002, the following discharge destinations were relevant to defining a transfer case:
02 = to other short-term general hospital
03 = to skilled nursing facility
04 = to intermediate care facility
05 = to another type of institution for inpatient care (including distinct parts). This code was used prior to
1/1/2002 to include transfers to rehabilitation facilities and long-term hospitals.
61 = to a swing bed
Effective January 1, 2002, PM A-01-86 added to new patient status codes:
62 = to another rehabilitation facility
63 = to a long-term care hospital
IRF-PPS implementing instructions provided that patient status codes 02, 03, 61, 62 and 63 are to be used
to identify transfer cases. Before a new patient status code 64 was implemented effective 10/1/02 toidentify Medicaid-only facilities, IRFs were to use 03 if the beneficiary was transferred to a nursing home
that accepts payment under Medicare and/or Medicaid and 04 if the beneficiary was transferred to a to a
nursing facility that does not accept either Medicare or Medicaid. The 04 code does not constitute a transfer
under IRF-PPS.

15
2.1.6 Facility Characteristics
We report some findings by facility characteristics. There are a handful of IRFs
whose characteristics changed over the study period that would move them into a
different category for a particular characteristic. We held their categories constant across
our analyses. Generally, we used 2002 cost report data to categorize each IRF by key
characteristics (e.g., type of ownership, average daily census, and DSH ratio). For
example, a non-profit hospital in 1999 that had a change of ownership and became
proprietary in 2001 would be included in the proprietary category in our longitudinal
analyses.
2.2 Sample Selection and Sample Size
2.2.1 Longitudinal Analyses
For the longitudinal sample, we use all bills paid by Medicare with only two
exceptions. First, we drop all cases in Maryland because that state is not under the PPS.
Second, as described in more detail above, we treat all discharges in an interrupted stay
bundle as if they constituted a single discharge. Table 2.1 provides the number of cases
in the longitudinal analyses in each year.
Table 2.1Number of Cases in Each Year in the Longitudinal Analyses
2.2.2 Case Mix Data
For the analyses of case mix data, we are restricted to cases with matched case
mix data and bill data for 1998, 1999, and 2002. Our bill records show that 473,645 bills
for inpatient care of Medicare patients were submitted from IRFs during CY 2002.6 As
shown in Table 2.2, we eliminated 1,661 records that would not be paid under the PPS
because they were part of interrupted stays. This produces the same 471,984 cases shown
as bundles in Table 2.1.
6 This number excludes two duplicate bills and 49 bills that overlapped another bill.
Year Number of bundled Medicare bills1998 366,1451999 385,4572000 410,7322001 442,3792002 471,984

16
We matched 436,822 of the remaining bills to an IRF PAI record where the IRF
PAI data were consistent and the bill data were consistent with the IRF PAI (92.5 percent
of cases) resulting in the 436,822 records that are used for most analyses. Some analyses
eliminate in-hospital deaths and atypical short stays.
In Chapter 5 we analyze the estimated cost of the 2002 cases. As shown in the
bottom section of Table 2.2, we were missing cost data for 11,315 of the bundled cases
(2.4 percent). For analyses that use both case mix data and cost, we could use only
426,622 cases. To simulate PPS payments, the 2002 cases also needed to have covered
charges that were greater than zero.
Table 2.2Counts of IRF PPS Discharges During CY 2002 Excluded from Sample and RemainingSample, by Reason for Exclusion
For 1998 and 1999, we used the final analysis sample described in our
implementation report (Carter et al., 2002). In that paper we note that units are under-
represented in the matched sample and freestanding hospitals are over-represented. Table
2.3 shows, separately for units and freestanding hospitals, the number of bundles in the
population of IRF discharges in 1999 and in our case mix sample. We have only 55
percent of unit cases, but 83 percent of freestanding cases.
There are certain aspects of case mix and resource use that are strongly correlated
with being a unit. To avoid having the unrepresentativeness of our sample confound our
findings regarding how care patterns changed between 1999 and 2002, we used several
strategies. When possible, we used the bill data that contain all cases. Often we present
case mix data separately for units and freestanding hospitals. Finally, we sometimes used
weights as if we had a sample with 2 strata -- units and freestanding. Although we did
not have a random sample, in cases where we could check accuracy (e.g., LOS), we
Reason for Exclusion Excluded Records Remaining SampleTotal bills 0 473,645Interrupted stays not paid under PPS 1,661 471,984No good match to IRF PAI 35,299 436,822In-hospital death 948 435,676Atypical short stays 9,695 425,981Sample Excluding Atypical RICs 425,981All Bundles 471,984Missing cost data 11,315 460,669No good match to IRF PAI 34,047 426,622No covered charges 1,036 425,586Missing payment variables 10,417 415,169

17
found that the weighted estimates of population parameters are more accurate than the
unweighted estimates. The sample weights used in these analyses are shown in the last
column of Table 2.3.
Table 2.3Number of 1999 Bundled Discharges in Population and Sample with Case Mix Data, byUnit and Freestanding
Type of facility Population Sample % of Sample Sample weightUnit 258,326 142,337 55.10 1.164Freestanding 127,131 104,890 82.51 0.777Total 385,457 247,227 64.14 1.000

18
Chapter III: Overall Utilization Patterns
Patterns observed in our analysis of the 2002 IRF data are consistent with the
incentives created by the IRF PPS and with trends previously observed from 1996
through 1999. There was an increase in the number of IRFs caring for Medicare patients
and a large increase the number of Medicare beneficiaries seen in IRFs between 1999 and
2002. There was also a shift in the composition of patients seen in IRFs after the
implementation of the IRF PPS. A greater proportion of patients were coded as having
comorbidities and motor and cognitive functioning scores declined. The CMI increased
by approximately 4 percent between 1999 and 2002.
3.1 Overview
In this chapter we describe findings about changes in care patterns and patient
classification under the IRF PPS. We used the data from patient assessments and bills
described in Chapter 2 to examine patterns in the use of IRF care before and after the
implementation of the new payment system. Specifically, we examined trends in LOS,
CMG assignments, and comorbidities. We also looked at trends in the factors that are
used to assign CMGs, namely, patients’ impairments and functional status (motor and
cognitive scores). In addition, we assessed the overall case mix of IRF patients in 1999,
before the new payment system was implemented, and in 2002 when facilities were being
introduced to the new system.
3.2 Methods
We compared the number and composition of discharges in the years prior to the
IRF PPS to those in 2002. We examined the trends in these data over time, mostly in
terms of percentage increases and decreases. We also looked at trends in data submitted
by hospitals under the PPS in 2002, and trends in data submitted by hospitals not yet paid
under the PPS.
As described in Chapter 2, our 1996 through 1999 data cover only a sample of
facilities. A comparison of the sample with the population showed that the sample was
biased in two ways. First it over-represented freestanding hospitals and it under-
represented very short stays (Carter et al., 2002). To avoid confusing changes in the
sample with real changes in the cases cared for in IRFs, we repeated many analyses
separately for freestanding hospitals and for units. In addition, we calculated the overall
case mix index (CMI) for IRF patients seen in 2002 and compared it to the CMI in 1999.

19
A CMI is the average of the case weights assigned to some specified set of patients
(cases). The case weights are relative weights -- i.e., they provide expected cost of each
CMG relative to other CMGs. In the IRF PPS the weights were calculated from the
matched data set for 1999. They were normalized so that each weight gives the cost of a
case in the CMG relative to the average case in the data set. In calculating the CMI,
short-stay transfer cases are counted as only a fraction of a case. Thus, our 1999 national
CMI was 1.0 when short-stay cases are counted as only a fraction of a case. The methods
and formulas used to calculate the CMI are described in Appendix 1.
3.3 Results
Overall, changes observed in the data were consistent with IRF PPS incentives
and/or with ongoing trends in IRF care. There was a slight increase in the number of
IRFs caring for Medicare patients and a larger increase in the number of Medicare
beneficiaries seen in IRFs over the period examined. There was also a shift in the
composition of patients seen in IRFs. After the implementation of the IRF PPS a greater
number of patients were coded as having comorbidities and as having poor motor and
cognitive functioning. The overall CMI increased by approximately 4 percent. Each of
these changes is described in greater detail below.
3.3.1 Volume. Table 3.1 shows the increase in the number of IRFs serving
Medicare patients and in the number of Medicare discharges from IRFs over the period
1996 through 2002. The number of IRFs grew by 11.5 percent over this period, while the
number of bundled discharges grew by 39 percent. The annual growth rate in the number
of patients served between 1999 and 2002 is slightly larger than that seen in earlier years.
The number of bundled discharges per 100,000 fee-for-service (FFS) enrollees increased
in each year from 1996 to 2002, with the rate of increase lowest in 2001 and 2002.
3.3.2 Composition. Figure 3.1 shows the distribution of IRF patients across RICs
in 1999 and 2002. Atypical short stays and in-hospital deaths are excluded from this
composition analyses. The proportion of cases in RIC 1, the stroke RIC, decreased
markedly while the proportion in RIC 8, the lower extremity joint replacement RIC, and
RIC 14, the cardiac RIC, increased. Table 3.2 shows that these patterns held for both
freestanding and unit facilities. Table 3.2 also shows that this shift was generally more
pronounced for cases paid under the IRF PPS. Some of these RICs, specifically 18
(major multiple traumas with brain or spinal cord injury), 19 (Guillian Barre), and 21
(burns), are very small. Thus, changes in these RICs should be interpreted with caution.

20
Table 3.1Increases in the Volume of IRF Facilities and Bundled Discharges,1996-2002(Excluding Maryland Hospitals) Versus Increases in the Fee-For-Service Discharges
Note: Maryland hospitals excluded.
Figure 3.1Percent of IRF Cases by RIC, 1999 vs. 2002
Figures 3.2 and 3.3 show that there was a strong shift towards lower motor and
cognitive scores across RICs between 1999 and 2002. The mean motor score decreased from
42.8 to 40.2 between 1999 and 2002 and mean motor scores decreased in every RIC. Mean
cognitive scores decreased in every RIC except for RIC 2, traumatic brain injury.
Interestingly, however, the decreases in the cognitive scores occurred across all RICs except
for RIC 2 for which the mean cognitive score held steady, rather than increasing in only RICs
Year N Annual % increase N
Annual % increase N
Annual % increase
1996 1078 340,424 1000.3941997 1121 4.0 355,162 4.3 1064.507 6.41998 1153 2.9 366,145 3.1 1118.341 5.11999 1163 0.9 385,457 5.3 1183.327 5.82000 1169 0.5 410,732 6.6 1243.738 5.12001 1196 2.3 442,379 7.7 1298.785 4.42002 1202 0.5 471,984 6.7 1344.875 3.5
Bundled Discharges# Discharges per 100,000
FFS EnrolleesFacilities
0
5
10
15
20
25
1 2 3 4 5 6 7 8 9 10 11 12 13 14 15 16 17 18 19 20 21
RIC
Perc
en
t
1999
2002

Table 3.2Distribution of Cases Across RICs for All Cases in 1999 and 2002, and for IRF PPS Cases in 2002: by Freestanding/Unit Status
1999 2002 2002 1999 2002 2002 1999 2002 2002 1999 2002 2002
RIC All Cases All Cases PPS Cases All Cases All Cases PPS Cases All Cases All Cases PPS Cases All Cases All Cases PPS Cases
1 54846 75762 54333 22.1 17.8 17.5 20.1 15.7 15.6 23.6 19.0 18.8
2 3186 5587 4069 1.3 1.3 1.3 1.4 1.3 1.3 1.2 1.3 1.3
3 5463 8786 6456 2.2 2.1 2.1 1.9 1.7 1.7 2.5 2.3 2.4
4 1448 2320 1655 0.6 0.5 0.5 0.6 0.5 0.5 0.5 0.6 0.6
5 7682 14642 10154 3.1 3.4 3.3 2.4 2.5 2.3 3.6 4.0 4.0
6 12019 19132 14089 4.9 4.5 4.5 5.0 4.0 4.0 4.7 4.8 4.9
7 28984 52019 37558 11.7 12.2 12.1 11.6 11.5 11.6 11.8 12.6 12.5
8 49283 98771 72087 19.9 23.2 23.2 18.4 21.7 21.7 21.0 24.0 24.3
9 12312 20557 15822 5.0 4.8 5.1 5.6 6.2 6.5 4.5 4.0 4.1
10 8380 11318 7838 3.4 2.7 2.5 3.1 2.4 2.4 3.6 2.8 2.6
11 918 1144 794 0.4 0.3 0.3 0.4 0.3 0.3 0.4 0.3 0.3
12 6219 10034 6697 2.5 2.4 2.2 3.6 1.9 1.8 1.7 2.6 2.4
13 3016 4444 3163 1.2 1.0 1.0 1.7 1.1 1.1 0.8 1.0 1.0
14 10542 23893 18641 4.3 5.6 6.0 4.6 7.2 7.5 4.0 4.7 4.9
15 7147 10052 7706 2.9 2.4 2.5 4.3 3.7 3.8 1.9 1.6 1.5
16 3697 9415 6788 1.5 2.2 2.2 1.9 2.6 2.4 1.2 2.0 2.0
17 2334 4713 3405 0.9 1.1 1.1 0.9 1.1 1.1 1.0 1.1 1.1
18 379 855 655 0.2 0.2 0.2 0.2 0.3 0.3 0.2 0.2 0.2
19 414 566 382 0.2 0.1 0.1 0.1 0.1 0.1 0.2 0.1 0.1
20 29315 51948 38542 11.8 12.2 12.4 12.2 14.0 14.3 11.5 11.1 11.0
21 164 220 144 0.1 0.1 0.1 0.1 0.0 0.0 0.1 0.1 0.1
Total 247748 426178 310978 100 100 100 100 100 100 100 100 100
Percent of Cases -- Freestanding Percent of Cases -- UnitsNumber of Cases Percent of Cases -- All

22
for which cognitive functioning affects payment.7 Table 3.3 shows the overall decline in
motor and cognitive score: the decreases in motor and cognitive scores were less pronounced
in units. 1999 data for Figures 3.2 and 3.3 and Table 3.3 come from Carter et al. (2003).
Figure 3.2Mean Motor Score by RIC, 1999 vs. 2002
Figure 3.3Mean Cognitive Score by RIC, 1999 vs. 2002
7 The RICs in which cognitive score is a factor in payment are: 1, 2, 5, 8, 12, and 18.
0
10
20
30
40
50
60
1 2 3 4 5 6 7 8 9 10 11 12 13 14 15 16 17 18 19 20 21
RIC
Me
an
Mo
tor S
co
re
Mean Motor Score 1999
Mean Motor Score 2002
0
5
10
15
20
25
30
35
1 2 3 4 5 6 7 8 9 10 11 12 13 14 15 16 17 18 19 20 21
RIC
Me
an
Co
gn
itiv
e S
co
re
Mean Cognitive Score 1999
Mean Cognitive Score 2002

Table 3.3Mean Motor and Cognitive Scores for All Cases in 1999 and 2002, and for IRF PPS Cases
1999 2002 2002 1999 2002 2002 1999 2002 2002 1999 2002 2002 1999 2002 2002 1999 2002 2002RIC All Cases All Cases PPS Cases All Cases All Cases PPS Cases All Cases All Cases PPS Cases All Cases All Cases PPS Cases All Cases All Cases PPS Cases All Cases All Cases PPS Cases
1 37.5 35.2 34.9 21.8 21.0 20.8 36.8 32.1 31.7 20.7 19.0 18.7 37.9 36.7 36.8 22.4 22.0 22.02 38.0 36.6 36.2 19.1 19.1 18.9 37.2 34.1 33.6 18.5 17.4 17.2 38.7 38.1 38.0 19.6 20.1 20.03 39.3 37.0 36.9 20.5 20.2 20.0 38.1 34.5 34.1 19.3 18.2 17.8 40.0 38.2 38.3 21.2 21.1 21.14 33.5 31.4 31.2 29.3 28.4 28.6 33.5 27.9 27.5 29.3 28.1 28.1 33.4 33.5 33.7 29.2 28.6 28.95 41.4 39.4 39.3 30.7 29.5 29.4 40.8 36.7 36.5 30.3 28.9 28.6 41.7 40.4 40.4 30.8 29.7 29.76 41.4 38.8 38.6 26.9 25.8 25.6 41.4 36.7 36.6 26.3 24.6 24.4 41.4 39.9 39.7 27.4 26.4 26.37 41.1 37.3 36.9 28.8 26.8 26.5 40.7 34.8 34.2 28.2 25.5 25.1 41.3 38.6 38.6 29.3 27.5 27.58 48.0 45.3 45.0 32.2 31.1 30.9 48.5 43.9 43.4 32.1 30.4 30.2 47.7 46.0 46.0 32.3 31.4 31.49 43.9 40.2 39.6 30.1 28.1 27.8 44.2 37.9 37.5 29.7 26.7 26.4 43.7 42.2 42.1 30.4 29.4 29.4
10 43.7 40.1 39.8 29.9 28.4 28.3 44.3 38.7 38.4 29.5 27.6 27.3 43.4 40.8 40.7 30.1 28.9 28.911 45.4 41.6 41.3 30.1 28.3 28.0 45.3 38.7 38.5 29.8 26.3 26.0 45.6 43.4 43.3 30.3 29.5 29.412 46.2 42.8 42.3 29.7 28.0 27.6 46.3 40.0 39.5 29.7 26.2 26.0 46.0 44.0 43.7 29.7 28.7 28.513 44.5 41.3 40.7 30.2 28.3 27.9 45.0 39.5 38.9 30.2 27.0 26.6 43.7 42.4 42.2 30.3 29.1 29.114 47.6 43.4 43.2 29.2 27.5 27.2 48.1 41.4 41.1 29.0 26.1 25.7 47.1 45.1 45.5 29.5 28.7 28.815 47.8 44.5 44.5 29.3 27.8 27.5 48.4 44.1 43.9 29.2 27.2 26.8 46.8 45.1 45.6 29.6 28.6 28.716 47.2 43.8 43.6 30.2 29.0 28.7 47.9 42.7 42.1 30.3 28.4 27.9 46.5 44.7 44.8 30.2 29.4 29.417 39.4 35.8 35.3 29.2 27.9 27.6 39.4 33.2 32.6 28.8 26.7 26.4 39.4 37.4 37.2 29.4 28.6 28.518 34.2 31.5 31.3 23.4 21.3 21.0 34.0 30.1 30.1 23.9 20.0 19.9 34.3 32.8 32.7 23.1 22.5 22.319 38.9 34.4 34.0 30.5 29.1 28.8 39.8 32.3 32.5 30.4 27.9 28.0 38.5 35.6 35.1 30.6 29.8 29.320 43.5 40.4 40.1 27.9 26.4 26.0 43.7 38.4 38.0 27.4 24.9 24.6 43.4 41.9 42.0 28.3 27.4 27.421 40.1 35.5 34.3 26.3 24.8 24.2 41.2 32.3 31.4 25.9 24.5 24.0 38.8 37.0 35.9 26.8 24.9 24.3
Total 42.8 40.2 40.0 27.7 26.8 26.6 43.0 38.4 38.0 27.3 25.6 25.3 42.7 41.3 41.4 28.0 27.5 27.4
Mean Motor Score Mean Cognitive ScoreMean Motor Score Mean Cognitive Score Mean Motor Score Mean Cognitive ScoreAll Cases Freestanding Units

24
These decreases in motor and cognitive scores affected the proportion of patients
grouped into each CMG in all RICs. Figure 3.4 graphically illustrates the shift within the
stroke RIC from lower-weighted CMGs on the left-hand side of the chart to higher-
weighted CMGs on the right-hand side of the chart.
In addition to lower motor and cognitive scores, more patients were coded as
having comorbidities that qualified them for higher tier payments. Table 3.4 shows that
the proportion of patients in each of the 3 tiers increased, and it increased in most
combinations of RIC and tier. The proportion of patients not classified into a
comorbidity tier fell from 81 percent in 1999 to 75 percent in 2002. Figure 3.5 shows
that the increase in the proportion of patients in comorbidity tiers was most pronounced
in freestanding hospitals. This pattern was expected, since we thought that units would
have better coding practices in the pre-PPS period. Thus, a significant portion of this
increase in tier assignments may be due to better coding and adherence to Medicare rules.
3.3.3 Case Mix. Table 3.5 shows the net results of these changes in the
composition of patients seen in IRFs and in length of stay. For the sample of hospitals
that were in both our 1999 and 2002 matched data sets the CMI increased more – 5.8
percent.
Figure 3.4Cumulative Distribution of All Cases in RIC 1 (Stroke) by CMG, 1999 vs. 2002
0
10
20
30
40
50
60
70
80
90
100
1 2 3 4 5 6 7 8 9 10 11 12 13 14
CMG
Cu
mu
lati
ve P
erc
en
t
98/99
2002

Table 3.4Percent of Cases by RIC in Each Comorbidity Tier: All Cases in 1999 and 2002, and for IRF PPS Cases in 2002
1999 2002 2002 1999 2002 2002 1999 2002 2002 1999 2002 2002RIC All Cases All Cases PPS Cases All Cases All Cases PPS Cases All Cases All Cases PPS Cases All Cases All Cases PPS Cases
1 0.6 1.6 1.9 2.9 4.2 4.5 11.3 14.3 14.7 85.2 79.9 78.82 2.4 3.5 3.9 14.7 15.8 16.6 18.0 17.4 17.7 64.9 63.2 61.73 1.2 3.0 3.1 14.7 18.1 18.5 23.8 23.4 24.1 60.3 55.4 54.34 3.0 4.7 4.9 10.2 13.2 13.3 11.9 11.9 12.2 74.9 70.3 69.65 0.7 1.5 1.6 7.7 9.0 9.4 10.7 13.5 14.0 81.0 76.0 75.06 0.7 2.1 2.4 10.9 15.3 15.6 13.8 15.2 15.0 74.6 67.3 67.17 0.2 1.4 1.7 4.3 6.9 7.4 7.6 10.3 10.6 87.8 81.4 80.38 0.1 0.5 0.6 3.5 4.1 4.4 5.0 8.6 9.1 91.4 86.8 85.99 0.3 1.2 1.4 4.7 7.4 7.8 9.0 13.4 13.7 86.0 78.0 77.1
10 0.4 1.5 1.8 9.8 18.5 18.9 31.5 30.1 31.3 58.2 50.0 48.011 0.1 1.4 1.5 16.1 25.8 27.6 41.4 35.7 36.0 42.4 37.2 34.912 0.3 1.2 1.4 4.3 8.0 8.4 8.3 16.3 16.9 87.2 74.4 73.313 0.3 1.2 1.4 5.8 11.2 11.2 10.1 17.6 17.6 83.8 70.0 69.714 1.1 2.6 3.0 10.6 13.9 14.4 16.0 23.6 24.1 72.3 59.9 58.615 0.4 1.8 2.1 8.5 14.5 15.0 6.9 12.7 12.6 84.2 71.0 70.316 0.3 0.7 0.9 5.4 5.9 6.1 8.5 12.6 12.9 85.8 80.8 80.117 1.3 2.3 2.7 4.5 8.7 9.2 10.1 12.5 12.5 84.1 76.5 75.518 3.7 11.0 11.6 14.2 16.4 16.6 11.6 13.7 13.6 70.4 58.9 58.219 1.7 5.7 6.8 13.3 14.3 16.0 15.0 14.3 14.4 70.0 65.7 62.820 1.7 4.4 4.8 13.3 18.3 18.8 21.4 22.2 22.4 63.6 55.1 53.921 1.8 8.6 9.0 11.0 20.5 21.5 19.5 12.7 12.5 67.7 58.2 56.9
Total 0.6 1.8 2.0 6.4 9.0 9.5 11.9 14.6 15.0 81.0 74.5 73.4
Tier 2 Tier 3 NoneTier 1

26
Figure 3.5Comorbidity Tier Assignments for All Hospitals, for All Cases in 1999 and 2002,and for IRF PPS Cases in 2002: by Freestanding/Unit Status
Table 3.5Change in Case Mix Index (CMI) Between 1999 and 2002
In addition, in analyzing the non-sample data from 1999, we found that case mix
was actually lower than in the sample, predominantly because many cases with LOS of 3
days or less were not reported in the case mix data used for our IRF PPS implementation
work, but also because the sample underestimates units and these have a lower case mix.
In the formula that was used to set the payment rate, therefore, the rate was increased by
1.0 percent to account for the non-representativeness of our sample. This is
approximately equivalent to a 1 percent reduction in case mix or a true national CMI for
1999 of 1.00.8
8 We did not estimate the adjusted national case mix index, because it is the weighted average with short-
stay transfers counted as only a fraction of a case. To know the fraction of short-stay transfers we would
have needed to predict the CMG that non-sample patients would fall into. However, we did not feel we
could accurately predict CMG without any information on functional status.
1999 2002 1999 2002 1999 2002 1999 2002
694 1120 247,319 434,815 234,169 404,590 1.0000 1.0434 4.3%632 632 235,638 301,545 223,201 280,692 1.0002 1.0579 5.8%
All Facilities in SampleFacilities in Both Years' Data
Number of Facilities
Number of Discharges
Number of Equivalent Cases Case Mix Index
% Increase in CMI
0
10
20
30
40
50
60
70
80
90
All Cases
1999
All Hospitals
All Cases
2002
PPS Cases
2002
All Cases
1999
Units
All Cases
2002
PPS Cases
2002
All Cases
1999
Freestanding
All Cases
2002
PPS Cases
2002
Percen
t o
f C
ases
1
2
3
None

27
3.3.4 Demographics. Table 3.6 shows the percent of cases by demographic category for
the bundled discharges having functional status scores in 1999 and 2002. There is a
slightly greater prevalence of older cases in 1999 versus 2002. There are decreases in
each age category above 80 years of age in 2002. In contrast, the median age of
Medicare enrollees held almost steady between 1999 and 2002, with a median age of 74.6
years in 1999 and 74.7 in 2002.9 The distribution of cases by race category shows an
increase in the number of non-white cases (86.7 percent in 1999 versus 84.6 percent in
2002), which is a percentage point larger than the increase in non-white cases among all
Medicare beneficiaries during that time.10 The percent of married and female cases
remains steady through time.
Table 3.6Percent of Cases in Each Demographic Category byYear for the Sample, 1999 and 2002
3.4 Conclusions
While these trends are generally consistent with expectations about IRF responses
to the new payment system, they reflect a combination of factors. These factors include
9 http://www.cms.hhs.gov/researchers/pubs/datacompendium/2003/03pg3132.pdf.10 http://www.cms.hhs.gov/MCBS/CMSsrc/1999/Summary1.pdf and CMSsrc/2002/Section1.pdf.
1999 2002Sample size 254028 445167Age
<=44 1.55 1.3345 to 64 6.92 7.6465 to 69 12.72 13.2970 to 74 18.72 18.6375 to 79 23.11 22.9180 to 84 19.42 19.9585 to 89 12.31 11.5890 to 94 4.34 3.91>= 95 0.92 0.77
RaceWhite 86.66 84.57Black 9.81 9.25Other 1.29 0.18Asian 0.45 0.88Hispanic 1.23 3.3North American Native 0.14 0.29
Married 42.9 43.52Gender
Male 37.52 36.57Female 62.48 63.43

28
changes in coding, real changes in case mix, and other changes in incentives produced by
the IRF PPS.
Coding may have changed under the PPS for a number of reasons mentioned
above. First, the new IRF PAI manual changed the coding rules for some items and
clarified the rules for some impairment codes and functional status items. Second,
facilities might have increased their adherence to coding rules and improved the accuracy
of their coding. This is particularly true for comorbidities. Third, some portion of the
coding change is likely due to “upcoding” in order to maximize revenue.
In addition, the shift in the composition of patients that we saw may reflect a real
change in patient case mix. This could be due to changes in the broader health care
system, including discharge practices from acute care and the shift to a greater emphasis
on post-acute and outpatient care. In fact, there has been a decrease in the number of
stroke cases in the acute care population over time accompanied by an increase in the
number of joint replacement cases, which corresponds to the shifts seen within
rehabilitation cases during the same time window (Beeuwkes Buntin et al., 2005). It
could also reflect technological or practice changes in rehabilitation. Finally, it could
reflect the fact that some IRFs had been constrained by a low base cost under the
previous TEFRA system and can now afford to admit more complex patients. Further
work disentangling the effects of coding from real case mix change, see Carter and
Paddock (2005).

29
Chapter IV. Unusual Cases
Under the IRF PPS, typical cases are defined as those who stay more than 3 days, receive
a full course of inpatient rehabilitation, and are discharged to the community.11 Special payment
rules apply to unusual cases and there is a fear that these special rules may cause providers to
shift patients between settings or change practice patterns to maximize payments. These payment
rules are:
• Very short-stay discharges are all non-transfer discharges within 3 or fewer days ofadmission, including discharges of patients who died in the hospital within 3 days ofadmission. These discharges are assigned to a special CMG.12
• Short-stay transfers are patients with a length of stay that is no more than the mean length ofstay for the CMG minus 0.5 days, and are transferred to another IRF, an acute care hospital, along-term care hospital, or a nursing home that is certified by Medicare and/or Medicaid. Aper diem payment applies to these discharges. It is based on the CMG payment for a typicalcase divided by the average length of stay for patients assigned to the CMG. Total paymentequals the per diem payment multiplied by the number of days the patient was in the facilityplus an additional half-day per diem payment. Long-stay transfers are paid as a typical case.
• Interrupted stays occur when patients are discharged and return to the same IRF within 3consecutive calendar days. One CMG payment is made for these stays based on theassessment from the initial admission. The duration of the interrupted stay begins with theday of discharge from the IRF and ends on midnight of the third day. No DRG payment ismade to the acute care hospital when the beneficiary is discharged and returns to the sameIRF on the same day.
• High cost outliers receive additional payments. The additional payment equals 80 percent ofthe difference between the estimated cost for the case and the CMG payment plus an outlierthreshold. Estimated cost is determined by applying a cost-to-charge ratio to the charges onthe bill.
The chart below summarizes the incentives created by the payment policies for unusual
cases. These are anticipated behavioral changes that might occur under the IRF PPS if the IRF
tries to maximize net revenues. The incentives are specific to the payment policies for unusual
cases and may interact with other incentives to reduce costs and increase revenues.
11 Medicare counts an inpatient day if a beneficiary is in the hospital at midnight. The day of admission is countedbut the day of discharge is not counted unless the admission and discharge day are the same day. If a patient is
admitted with the expectation that the patient will remain overnight, but is discharged or dies before midnight, the
day is counted.12 Patients who expired in the hospital after 3 days are assigned to four other special CMGs based on their length of
stay relative to other patients who expired and whether the case is assigned to an orthopedic RIC.

30
Summary of IRF PPS Payment Incentives for Unusual Cases
Special Payment Rule IRF PPS IncentivesVery short-staydischarges
Reduce stays of 3 or fewer days and increase stays of 4 or moredays in order to receive full CMG payment.
Transfers Increase long-stay transfers to nursing homes in order to dischargethe patient more rapidly and to acute care hospitals to shift costs.
Interrupted stays Increase interrupted stays lasting 1 or more days as a means ofshifting costs to acute care hospitals; reduce relative proportion of0-3 day interruptions in order to receive two CMG payments insteadof a single bundled payment.
Our analysis of 2002 cases found that IRF facilities responded in anticipated ways to the
financial incentives created by the policies for very short stays and for interrupted stays.
• There was a reduction in non-transfer stays lasting fewer than 3 days and an increase in
non-transfer stays lasting 4-5 days (Section 4.2).
• There was a reduction in the proportion of interrupted stays lasting fewer than 3 days andan increase in the proportion lasting 4-5 days (Section 4.3).
However, there was an unanticipated increase in short-stay transfer rates and a decline in long-
stay transfers that are paid as typical cases. While transfer rates to acute care hospitals increased,
there was a decline in transfers to SNFs (Section 4.4).
Outlier payments were 3.0 percent of total payments, which is the percentage used to
establish the initial outlier threshold (Section 4.5).
In the remainder of this chapter, we discuss the financial incentives created by the
policies for unusual cases and the results of our analyses in greater detail. We conclude with
discussion of our findings and conclusions (Section 4.6).
4.1 Very Short-Stay Discharges
As defined above, very short-stay discharges are defined as all non-transfer discharges
within 3 or fewer days of admission, including discharges of patients who expired in the hospital
within 3 days of admission. These discharges are assigned to a unique CMG (CMG 5001) with a
relative weight of 0.1651 and no comorbidity tiers. Under the IRF PPS, hospitals have an
incentive to decrease the number of discharges within this category and increase the number of
discharges with LOS of 4 or 5 days. In doing so, they will receive a substantially higher full
CMG payment for a shorter than average length of stay.

31
To monitor the behavioral changes associated with very short-stay discharges, we
examined non-transfer discharges involving 3 or fewer days for 1999 through 2002 that would
have been assigned to CMG 5001 under the IRF PPS. Since functional status is not needed to
classify patients into CMG 5001, we used all bundled discharges in the analysis. We focused
only on patients who were discharged alive and did not include those who died within 3 days of
admission to the IRF.13 We found that the proportion of very short-stay discharges was
relatively stable in the years 1999-2001 but declined about 18 percent in 2002 (Table 4.1). In
1999, 2.6 percent of patients discharged alive would have been assigned to CMG 5001 compared
to 2.2 percent in 2002. The decline is evident for stays lasting 1 or 2 or 3 days and is not limited
to only those lasting 3 days. Improvement in reporting of transfers may bias our results. As
discussed below, there was improvement in the reporting of transfers under the IRF-PPS, so that
transfer cases in the pre-PPS period are under-reported relative to the post-PPS period. This
would mean that there might be an overstatement of CMG 5001 cases in the pre-PPS period
relative to 2002 and that the decline in CMG 5001 cases may be overestimated.
Table 4.1 Very Short-Stay Cases Discharged Alive by Length of Stay 1999-2002
4.2 Interrupted Stays
4.2.1 Interrupted Stay Policy and Incentives
The IRF PPS defines an interrupted stay as a stay in which the beneficiary is discharged
and returns to the same IRF within 3 consecutive calendar days. The duration of the interrupted
stay begins with the day of discharge from the IRF and ends on midnight of the third day. Thus,
if the beneficiary is away from the IRF 2 nights or less, the interrupted stay payment rules apply
13 Less than 0.1 percent of patients die within 3 days of admission.
1999 2000 2001 2002 1999 2000 2001 2002
Length of
Stay N Cases N Cases N Cases N Cases
% of Total
Cases
% of Total
Cases
% of Total
Cases
% of Total
Cases
1 Day 1,679 1,758 1,727 1,240 0.44% 0.43% 0.39% 0.28%
2 Days 2,637 2,987 3,238 2,255 0.68% 0.73% 0.73% 0.52%
3 Days 5,674 6,294 7,066 5,903 1.47% 1.53% 1.60% 1.35%
Total Very
Short Stay 9,990 11,039 12,031 9,696 2.59% 2.69% 2.72% 2.22%
Total Cases 385,457 410,732 442,379 436,822

32
and one CMG payment is made for both portions of the stay. If the interruption involves a same
day admission and discharge from an acute care hospital, no DRG payment is made to the acute
care hospital and the IRF is expected to assume the costs of the same-day acute care services.
However, a DRG payment is made if the beneficiary remains overnight at the acute care hospital.
Under the TEFRA system, an IRF, particularly if it was under financial pressure from its
TEFRA limit, had an incentive to discharge and re-admit a patient in order to reduce IRF costs
and receive “credit” for two discharges. The incentives under the IRF PPS are similar but contain
two added incentives: to shift interruptions involving acute care services from same day to
overnight stays so that the costs of the services are shifted from the IRF to the acute care hospital
and to increase the proportion of interruptions involving at 3 or more nights away from the IRF
so that two separate payments will be made for each portion of the stay. Monitoring trends in the
same day policies is problematic since pre-PPS policies were not clear regarding how a same day
admission and discharge from acute care services should have been billed.
4.2.2 Methods
To obtain an understanding of the trends that have occurred under IRF PPS, we compared
the distribution of 0-10 day interruptions in the 1999-2002 bill data (Table 4.2). For the 1999-
2001 stays, we used only the IRF bills to identify interruptions. That is, we counted a bundle
each time there was an IRF discharge and readmission to the same facility within 10 days. We
found that identifying interruptions in the 2002 data was somewhat problematic and indicative of
potential billing problems for these cases. In theory, interruptions that are bundled under the IRF
PPS interrupted stay policy should be identifiable only in the IRF PAI since a single bill should
be submitted that covers both portions of the stay. However, we also found multiple IRF bills
that indicated an interrupted stay that either did not match an IRF PAI or was not reported as an
interrupted stay on the IRF PAI. We have included in our counts all interruptions in 2002 that
were either reported on the IRF PAI or indicated by multiple bills, regardless of what was
reported on the IRF PAI. The discharge counts are independent of the IRF PPS bundling rules, so
that those cases with 0-2 nights away as well as other interruptions are counted as two discharges
in the table. Only the first discharge and readmission are shown for cases involving multiple
interruptions.

33
Table 4.2Distribution of Interrupted Stays: 1999-2002
Note: Each interruption is counted as two discharges.
4.2.3 Volume Trends
Overall, there has been a slight downward trend in the proportion of discharges involving
0-10 nights away from the IRF and readmission to the same facility, from 6.5 percent in 1999 to
5.8 percent in 2002. The distribution of the interruptions has shifted consistent with the PPS
bundling incentives. The proportion of interruptions involving two or fewer nights has been cut
in half, declining from about 26 percent of all 0-10 night interruptions in the pre-PPS years to
about 12 percent in 2002. The anticipated shift between same day and one-night interruptions is
not evident; the proportions of same day, one night and two night interruptions all declined.
We looked at the distribution of interruptions by type of provider to determine if there are
differences in interrupted stays by key provider characteristics (Table 4.3). Freestanding
hospitals have a higher percentage of interrupted stays lasting up to 10 days (6.7 percent) than
units of acute care hospitals (5.5 percent). However, freestanding rehabilitation hospitals have
relatively fewer interruptions lasting less than three nights. Interruptions lasting less than three
nights constituted 6.8 percent of the interruptions in freestanding hospitals compared to 13.6
percent in units.
Rural hospitals have relatively fewer interruptions (5.0 percent) than urban hospitals (6.0
percent), and a higher proportion of these interruptions are for less than three nights. The pattern
1999 2000 2001 2002 1999 2000 2001 2002
0 0.3% 0.3% 0.3% 0.1% 4.3% 3.7% 4.2% 1.8%
1 0.7% 0.7% 0.7% 0.3% 9.6% 9.2% 9.2% 4.3%
2 0.9% 0.8% 0.8% 0.3% 12.1% 11.6% 11.6% 5.8%
3 1.0% 0.9% 1.0% 1.0% 13.3% 12.9% 13.5% 16.4%
4 1.0% 1.0% 0.9% 1.0% 13.3% 13.4% 13.3% 16.3%
5 0.9% 0.9% 0.9% 0.8% 11.8% 12.4% 12.4% 13.8%
6 0.8% 0.8% 0.8% 0.7% 11.0% 10.9% 10.8% 11.8%
7 0.7% 0.7% 0.6% 0.6% 8.8% 9.0% 8.7% 10.3%
8 0.5% 0.5% 0.5% 0.5% 6.3% 7.0% 7.1% 8.2%
9 0.4% 0.4% 0.4% 0.4% 5.3% 5.3% 5.1% 6.5%
10 0.3% 0.3% 0.3% 0.3% 4.2% 4.3% 4.2% 4.9%
0-2 nights bundles 1.9% 1.8% 1.8% 0.7% 26.0% 24.6% 24.9% 11.9%
0-10 nights interruptions 6.5% 6.5% 6.3% 5.9% 100.0% 100.0% 100.0% 100.0%
Total Discharges 393,069 418,249 450,534 460,928
% of Total Discharges
% of Total Interruptions with 0-10
nights away
Interruptions By No. of Nights Away from IRF
No. of Nights Away From
IRF

Table 4.3Distribution of 2002 Interrupted Stays by Hospital Characteristics
*Missing type of ownership for 575 discharges.Note: Each interrupted stay is counted as two discharges.
AllIRFs Freestanding Units Urban Rural Non-Profit Proprietary Government
0 0.1% 0.0% 0.2% 0.1% 0.1% 0.1% 0.1% 0.2%1 0.3% 0.2% 0.3% 0.2% 0.3% 0.3% 0.2% 0.4%2 0.3% 0.2% 0.4% 0.3% 0.3% 0.4% 0.2% 0.4%3 1.0% 1.1% 0.9% 1.0% 0.8% 1.0% 1.0% 0.9%4 1.0% 1.2% 0.9% 1.0% 0.7% 0.9% 1.1% 0.9%5 0.8% 1.0% 0.7% 0.8% 0.7% 0.8% 0.8% 0.7%6 0.7% 0.9% 0.6% 0.7% 0.5% 0.7% 0.8% 0.6%7 0.6% 0.7% 0.5% 0.6% 0.5% 0.6% 0.7% 0.5%8 0.5% 0.6% 0.4% 0.5% 0.4% 0.5% 0.5% 0.4%9 0.4% 0.5% 0.3% 0.4% 0.3% 0.4% 0.4% 0.3%
10 0.3% 0.3% 0.3% 0.3% 0.3% 0.3% 0.3% 0.2%0-2 nights 0.7% 0.4% 0.9% 0.7% 0.8% 0.8% 0.4% 1.1%0-10 nights 5.9% 6.7% 5.5% 6.0% 5.1% 5.8% 6.2% 5.6%Total Discharges 100.0% 100.00% 100.00% 100.00% 100.00% 100.00% 100.00% 100.00%
0 1.8% 0.2% 2.8% 1.8% 2.1% 2.0% 0.9% 3.8%1 4.3% 2.2% 5.6% 4.1% 6.3% 4.9% 2.4% 7.5%2 5.8% 3.3% 7.4% 5.7% 6.6% 7.0% 3.3% 7.4%3 16.4% 16.5% 16.3% 16.4% 16.4% 16.4% 16.5% 15.7%4 16.3% 17.6% 15.4% 16.5% 14.0% 15.6% 17.4% 16.4%5 13.8% 14.6% 13.3% 13.8% 14.5% 14.1% 13.6% 12.7%6 11.8% 13.0% 10.9% 11.9% 10.4% 11.4% 12.7% 10.3%7 10.3% 11.1% 9.8% 10.4% 9.5% 9.6% 11.6% 9.7%8 8.2% 9.1% 7.6% 8.1% 8.8% 8.0% 8.8% 6.5%9 6.5% 7.1% 6.1% 6.6% 5.9% 6.3% 7.1% 5.5%
10 4.9% 5.1% 4.8% 4.9% 5.2% 4.6% 5.6% 4.4%0-2 nights away 11.9% 5.8% 15.8% 11.6% 15.0% 13.9% 6.6% 18.8% 0-10 nights away 100% 100% 100% 100% 100% 100% 100% 100%
No. of Nights Away from IRF
% of total discharges
No. of Nights Away from IRF
% of interruptions with 0-10 nights away from IRF
Type of Facility Location Type of Ownership*

35
of interrupted stays also varies by type of ownership. Proprietary hospitals have a somewhat
higher proportion of interruptions than non-profits (6.2 percent vs. 5. 8 percent) but a smaller
proportion of these last less than 3 nights (6.8 percent vs. 13.6 percent).
4.2.4 Cost Trends
RAND’s implementation report estimated payment-to-cost ratios for interrupted stays
under the bundling policies using sample 1998/1999 claims with all the data necessary for
simulation (Carter et al., 2002). The simulation suggested that the bundling policy would
underpay cases with interruptions lasting less than three nights by about 30 percent. To evaluate
how the bundled discharges have actually fared under IRF PPS, we simulated payment-to-cost
ratios for the 2002 bundled discharges for which we had the IRF PAI data needed to determine
payment. We show in Table 4.4 the number of bundles, length of stay for rehabilitation (that
includes both portions of the stay), and the estimated payment-to-cost ratio assuming all stays
had been paid under IRF PPS federal rates in 2002. The simulation indicates the expected
underpayment has not materialized. On average, the payment-to-cost ratio for cases receiving a
bundled payment is 0.93, considerably higher than the 0.70 projected using the 1998/1999
sample data. Nevertheless, there are differences within hospital classes. Despite longer lengths
of stay, bundled discharges are paid on average at about cost in freestanding hospitals (1.0) and
proprietary hospitals (.98) but are on average unprofitable in units (.88), non-profit (.87), and
government (.93) facilities.
4.3 Short-Stay Transfers
4.3.1 Transfer Policy and Incentives
Short-stay transfers are patients who are transferred to another IRF, an acute care
hospital, a long-term care hospital, or a nursing home that is certified by the Medicare and/or
Medicaid program with an IRF LOS that is less than the mean LOS for the CMG. The short-stay
transfer policy applies to patients who did not complete the full course of rehabilitation and is
intended to match payment with the resources required for the stay and to reduce the incentive
for premature discharge. Total payment for the stay equals the per diem payment multiplied by
the number of days the patient was in the facility plus an additional half-day per diem payment,
not to exceed the CMG payment for a typical case.

Table 4.4LOS and PTC Ratios for 2002 Bundled Stays by Hospital Characteristics
Note: Discharges are counted consistent with IRF PPS rules.
All Cases Non Profit Proprietary Government
Nights Away
N
Bundles
Length
of Stay
PTC
Ratio
N
Bundles
Length
of Stay
PTC
Ratio
N
Bundles
Length
of Stay
PTC
Ratio
N
Bundles
Length
of Stay
PTC
Ratio
0 102 19.7 0.99 38 18.8 0.97 59 20 0.98 5 23.8 1.17
1 1,141 20.4 0.90 574 19.1 0.86 486 21.7 0.97 81 21.3 0.76
2 1,221 19.9 0.90 660 19.0 0.84 489 21 1.00 72 20.9 0.85
Total Bundles
0-2 nights away 2,464 20 0.93 1,272 19.23 0.89 1,034 21 0.98 158 21.1 0.93
Urban Hospitals Rural Hospitals Freestanding Hospitals Units
Nights Away
N
Bundles
Length
of Stay
PTC
Ratio
N
Bundles
Length
of Stay
PTC
Ratio
N
Bundles
Length
of Stay
PTC
Ratio
N
Bundles
Length
of Stay
PTC
Ratio
0 96 20.1 0.99 6 14.1 1.12 52 20 1.03 50 19.5 0.96
1 1,063 20.4 0.91 78 19.9 0.79 502 21.9 0.97 639 19.2 0.85
2 1,118 20 0.90 103 18.4 0.88 495 21.3 0.99 726 18.9 0.84
Total Bundles
0-2 nights away 2,277 20.17 0.93 187 17.47 0.93 1,049 21.07 1.00 1,415 19.2 0.88

37
The per discharge payment applicable to long-stay transfers is likely to create an
incentive to increase the number of long-stay transfers to both SNFs and acute care hospitals.
The higher SNF transfer rate will occur because the IRF has an incentive to discharge patients as
soon as they no longer benefit from a hospital-level rehabilitation program; some of these
patients will not be ready for discharge to the community and will be transferred to a Medicare
or Medicaid-certified facility. Similarly, we would also expect the acute care transfer rate to
increase since IRFs will have an incentive to transfer patients who have acute care needs,
particularly if the acute need is likely to persist more than 3 days.
4.3.2 Methods
Our trend analysis of short-stay transfers is limited to the sample of hospitals with
functional status data since we must know the CMG LOS in order to determine whether a case is
a short-stay transfer. mparisons of transfer rates using the IRF bills are problematic for two
reasons. First, transfers were under-reported in 1999, when the discharge destination had no
effect on payment. As might be expected, when we compared the 2002 transfer rates determined
from the IRF bills with those that are identified using Medicare bills for the discharge
destinations that are included in the short-stay transfer definition and MDS records for nursing
home stays, we found some improvement in the coding between 1999 and 2002, which would
affect our comparisons. However, the IRF bills still reflected lower short-stay transfer rates than
the post-IRF Medicare bills and MDS data (15.1 percent vs. 15.9 percent) (Carter and Paddock,
2005). Second, using the IRF bills for the pre-PPS years (as well as part of the initial PPS year)
is problematic because the IRF bills for the pre-PPS years do not differentiate between transfers
to another rehabilitation facility or long-term hospital and discharges to other institutions such as
non-Medicare/Medicaid certified facilities that are not defined as transfers under the IRF PPS.
To address the under-reporting and comparability issues, we defined a case as a transfer if there
was a post-IRF Medicare bill for the beneficiary for which the stay starts on the day of IRF
discharge or if there is an MDS record indicating the beneficiary was in a nursing home on the
day of IRF discharge.
4.3.3 Findings
Taking the post-IRF Medicare data as our best measure of actual change in transfer cases,
Table 4.5 shows that the overall transfer rate was similar for a matched set of facilities between
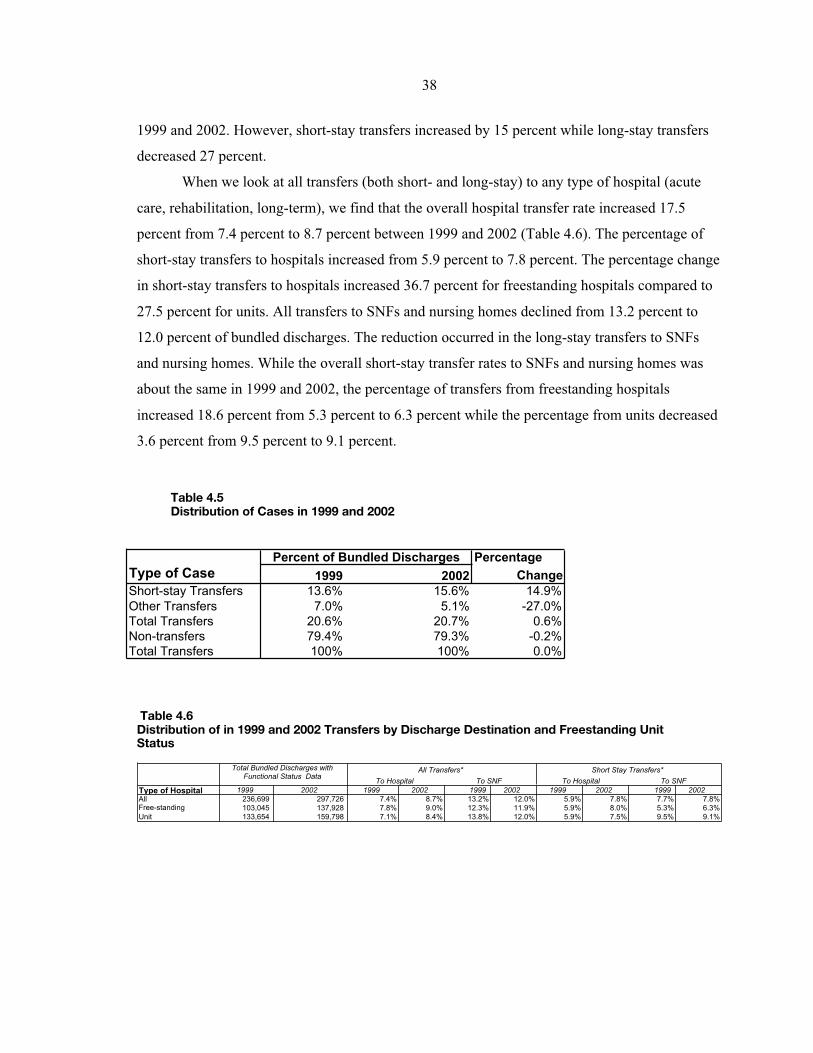
38
1999 and 2002. However, short-stay transfers increased by 15 percent while long-stay transfers
decreased 27 percent.
When we look at all transfers (both short- and long-stay) to any type of hospital (acute
care, rehabilitation, long-term), we find that the overall hospital transfer rate increased 17.5
percent from 7.4 percent to 8.7 percent between 1999 and 2002 (Table 4.6). The percentage of
short-stay transfers to hospitals increased from 5.9 percent to 7.8 percent. The percentage change
in short-stay transfers to hospitals increased 36.7 percent for freestanding hospitals compared to
27.5 percent for units. All transfers to SNFs and nursing homes declined from 13.2 percent to
12.0 percent of bundled discharges. The reduction occurred in the long-stay transfers to SNFs
and nursing homes. While the overall short-stay transfer rates to SNFs and nursing homes was
about the same in 1999 and 2002, the percentage of transfers from freestanding hospitals
increased 18.6 percent from 5.3 percent to 6.3 percent while the percentage from units decreased
3.6 percent from 9.5 percent to 9.1 percent.
Table 4.5Distribution of Cases in 1999 and 2002
Table 4.6Distribution of in 1999 and 2002 Transfers by Discharge Destination and Freestanding UnitStatus
Percentage
Type of Case 1999 2002 Change
Short-stay Transfers 13.6% 15.6% 14.9%
Other Transfers 7.0% 5.1% -27.0%
Total Transfers 20.6% 20.7% 0.6%
Non-transfers 79.4% 79.3% -0.2%
Total Transfers 100% 100% 0.0%
Percent of Bundled Discharges
To Hospital To SNF To Hospital To SNF
Type of Hospital 1999 2002 1999 2002 1999 2002 1999 2002 1999 2002
All 236,699 297,726 7.4% 8.7% 13.2% 12.0% 5.9% 7.8% 7.7% 7.8%
Free-standing 103,045 137,928 7.8% 9.0% 12.3% 11.9% 5.9% 8.0% 5.3% 6.3%
Unit 133,654 159,798 7.1% 8.4% 13.8% 12.0% 5.9% 7.5% 9.5% 9.1%
Total Bundled Discharges with Functional Status Data
All Transfers* Short Stay Transfers*

39
4.4 High Cost Outliers
4.4.1 Outlier Policy
The IRF PPS protects hospitals from substantial financial losses on atypically expensive
discharges through a high cost outlier policy. A case qualifies for an outlier payment equal to 80
percent of its estimated cost in excess of the standard IRF PPS payment plus an outlier threshold.
That is, the following formula is used for payment:
Outlier paymenti = .80 x (Estimated costi – (IRF PPS std. paymenti + outlier threshold)).
The FY2002-FY2004 standardized outlier payment threshold is $11,211.14 It is adjusted
for each IRF to account for the facility’s wage adjustment, DSH adjustment, and if applicable,
rural adjustment. In determining whether a case qualifies for a cost outlier payment, the
estimated cost of the stay is determined by applying an overall Medicare facility-specific cost-to-
charge ratio to the billed charges.
The cost outlier policy adopted in the IRF PPS final rule provided estimated outlier
payments equal to 3 percent of total estimated IRF PPS payments. One question is whether
actual outlier payments under the IRF PPS are substantially different from 3 percent of total
payments. There are two potentially offsetting factors that might affect outlier payments. First,
behavioral changes associated with implementation of the IRF PPS are likely to reduce outlier
payments. Coding improvements leading to case mix increases would result in higher standard
payments, and lower lengths of stay and elimination of unnecessary services would reduce costs
per case. Second, the use of the cost-to-charge ratio to estimate costs assumes that charges
increase in relation to costs. Industry-wide, hospital charges have been increasing more rapidly
than costs and some hospitals have had excessive charge increases. The PRICER used to pay for
Medicare stays under the IRF PPS in 2002 used a cost-to-charge ratio from the facility’s most
recently settled cost report -- which may have been several years old. Applying an outdated cost-
to-charge ratio to current billed charges overestimates the costs of an inpatient stay and produces
higher outlier payments.
14 66 FR (August 7, 2001), 41362.

40
4.4.2 Methods
To determine actual 2002 IRF PPS outlier payments, we simulated IRF PPS payments
using the cost-to-charge ratios and other payment parameters in the public use PRICER for FY02
(discharges occurring 1/1/02-9/30/02) and FY03 (discharges occurring 10/1/02-12/31/02). Since
actual outlier payments are sensitive to a number of factors, we examined the percentage of total
payments attributable to outlier payments using only the sample hospitals used to set the FY2002
threshold, only those discharges that were actually paid under the IRF PPS taking into account
the federal/hospital-specific blend, and all 2002 discharges. In the latter simulation, we assumed
all discharges were paid 100 percent of the federal rate throughout 2002. In all simulations, the
outlier percentage was very close to 3 percent of total IRF PPS payments; therefore, we present
only the results for the simulation assuming all 2002 discharges were paid 100 percent of the
federal rate in Table 4.7.
There were 415,169 cases in 2002 for which we have the IRF PAI and PRICER
information needed to simulate payment under the IRF PPS. We bundled the bills for pre-PPS
discharges involving interrupted stays for fewer than three nights, and we applied the payment
parameters in the FY02 PRICER if available; if the facility was not paid under the IRF PPS until
FY03, we used the payment parameters from the FY03 PRICER.15
4.4.3 Findings
Of the 2002 discharges in our simulation, we estimate 5.0 percent (n = 20,672) would
have qualified for additional payment as a high cost outlier. The average payment per outlier
case was $7,503 and aggregate outlier payments were 3.0 percent of total payments. The outlier
percentages for urban and rural facilities were 3.1 percent and 1.6 percent, respectively.
15Both PRICER programs were released as part of the rulemaking process and would have been updated
by the Medicare intermediaries as needed throughout the year. During FY02 and FY03, intermediaries were requiredto use the most recently settled cost report and to update the cost-to-charge ratio each time a cost report settlementwas made. Thus, a different cost-to-charge ratio may have been used to actually determine the estimated costs for acase than is reported in the public use PRICER. Since the cost-to-charge ratios to simulate 2002 payments weretaken from most recently settled cost reports (which we assume were for FY2001 and earlier), we have made noadjustments to account for the underreporting of HealthSouth home office costs in FY2002 and FY2003. We foundsome highly aberrant cost-to-charge ratios (plus or minus 3 std deviations from the geometric mean cost-to-chargeratio) that we assume the intermediary would have detected and corrected. We included the cases for these facilitiesbut substituted the more recent PRICER cost-to-charge ratio when available and the mean cost-to-charge ratio forurban or rural hospitals, as applicable, where it was not.

Table 4.7Simulated IRF-PPS Payments for All 2002 Bills Assuming 100% Federal Rate by Hospital Characteristics
Category
N
Facilities N Cases
Average
Std Pay
Average
Outlier
Pay
Average
Total Fed
Pay
N outlier
cases
Outlier Pay
Per Outlier
Case
Outlier Pay
as % Total
Pay
All facilities 1072 415,169 $12,185.69 $373.59 $12,559 $20,672.00 $7,503.04 2.97
Geographical Area
Urban 903 375,184 $12,181.14 $391.60 $12,573 $19,172.00 $7,663.33 3.11
Rural 169 39,985 $12,228.46 $204.61 $12,433 $1,500.00 $5,454.31 1.65
Census Region
New England 37 19,494 $14,074.31 $203.07 $14,277 $551.00 $7,184.63 1.42
Middle Atlantic 150 77,225 $12,118.94 $458.00 $12,577 $3,591.00 $9,849.33 3.64
South Atlantic 140 72,125 $12,161.56 $283.83 $12,445 $3,187.00 $6,423.35 2.28
East North Central 182 62,207 $11,878.91 $138.78 $12,018 $1,627.00 $5,306.26 1.15
East South Central 63 31,435 $12,031.28 $285.14 $12,316 $1,389.00 $6,453.19 2.32
West North Central 97 25,384 $11,286.75 $320.21 $11,607 $1,318.00 $6,167.05 2.76
West South Central 230 82,076 $11,479.67 $415.22 $11,895 $5,551.00 $6,139.34 3.49
Mountain 63 20,573 $11,821.14 $378.26 $12,199 $1,066.00 $7,300.12 3.10
Pacific 110 24,650 $15,523.82 $1,124.44 $16,648 $2,392.00 $11,587.59 6.75
Type of Hospital
Freestanding 201 154,503 $12,784.10 $161.47 $12,946 $4,283.00 $5,824.97 1.25
Unit 871 260,666 $11,831.01 $499.31 $12,330 $16,389.00 $7,941.57 4.05
Ownership
Non-Profit 678 243,523 $11,925.99 $370.32 $12,296 $11,747.00 $7,676.96 3.01
Proprietary 277 138,634 $12,624.54 $353.54 $12,978 $7,040.00 $6,961.98 2.72
Government 117 33,012 $12,258.56 $481.92 $12,740 $1,885.00 $8,439.87 3.78

42
There were considerable regional differences in the outlier percentages, ranging from 6.8
percent of total payments in the Pacific region to 1.4 percent in the New England region. Outlier
payments represented 1.2 percent of total payments to freestanding facilities compared to 4.0
percent to rehabilitation units.
We summarize outlier payments by RIC and comorbidity tier in Table 4.8. Outlier
payments represented more than 5 percent of total payments in five RICs: RIC 4 (Traumatic
Spinal Cord Injury), 7.0 percent; RIC 11 (Amputation, Other), 5.3 percent; RIC 18 (Major
Multiple Trauma, No Spinal or Brain Injury), 5.2 percent, RIC 19 (Major Multiple Trauma With
Spinal or Brain Injury), 5.1 percent and RIC 21 (Burns), 24.3 percent. The outlier percentages
increased across the comorbidity tiers. The outlier percentage was 2.5 percent for discharges
with no comorbidities compared to 6.0 percent for discharges with Tier 1 comorbidities.
4.5 Discussion and Conclusions
For the most part, IRF facilities have responded in anticipated ways to the financial
incentives created by the policies for very short-stay cases and interrupted stays.
In particular, they have responded with:
• A reduction in non-transfer stays lasting fewer than 3 days and an increase in non-transferstays lasting 4-5 days. The proportion of non-transfer cases considered very short-staycases declined about 18 percent.
• A reduction in the proportion of interrupted stays lasting fewer than 3 days and anincrease in the proportion lasting 4-5 days.
However, there was an unexpected 14.9 percent increase in short-stay transfers between 1999
and 2002 and a 27.0 percent decline in longer stay transfers so that there was only a small
increase in the overall transfer rate (0.6 percent). The increase in short-stay transfer rates relative
to longer stay transfers largely results from the general decline in LOS, although coding changes
also play a smaller part. Cases are being coded into CMGs with a longer average length of stay
than their 1999 CMG so that cases who were long-stay transfers in 1999 are short-stay transfers
in 2002. The 17.5 percent increase in transfers to acute care hospitals is not unexpected.
However, with the increase in transfer rates to acute care hospitals, we would have expected to
find a parallel increase in interrupted stays that are paid as separate discharges; contrary to
expectations, we found that the overall rate of interruptions lasting 10 or fewer days declined,
which indicates fewer of these patients return for additional IRF care. Additional analysis of
what happens to patients who are transferred back to acute care hospitals -- both with respect to

43
their acute care services and where they receive care after their second post-acute discharge -- is
needed to understand the implications of the increase in the acute care transfer rates.
Freestanding hospitals showed stronger behavioral responses than units to the incentives
created by the payment policies for very short stays and interrupted stays. For interrupted stays,
which our implementation report suggested would be underpaid about 30 percent, the payment-
to-cost ratio for freestanding hospitals was 1.00 compared to .88 for units of acute care hospitals.
Overall, outlier payments were 3.0 percent of total payments, which is the percentage
used to establish the initial outlier threshold and provides support for retaining the same
threshold until more recent data become available. It appears that the behavioral responses to the
IRF PPS were sufficient to offset increases in outlier payments attributable to using outdated
cost-to-charge ratios to estimate costs. Consistent with having lower costs per discharge,
freestanding hospitals received 1.2 percent of total payments as outlier payments compared to
4.0 percent for units of acute care hospitals. All other things being equal, outlier payments may
decline in the future as IRFs continue efforts to reduce costs per case and cost-to-charge ratios
reflect more current cost data.
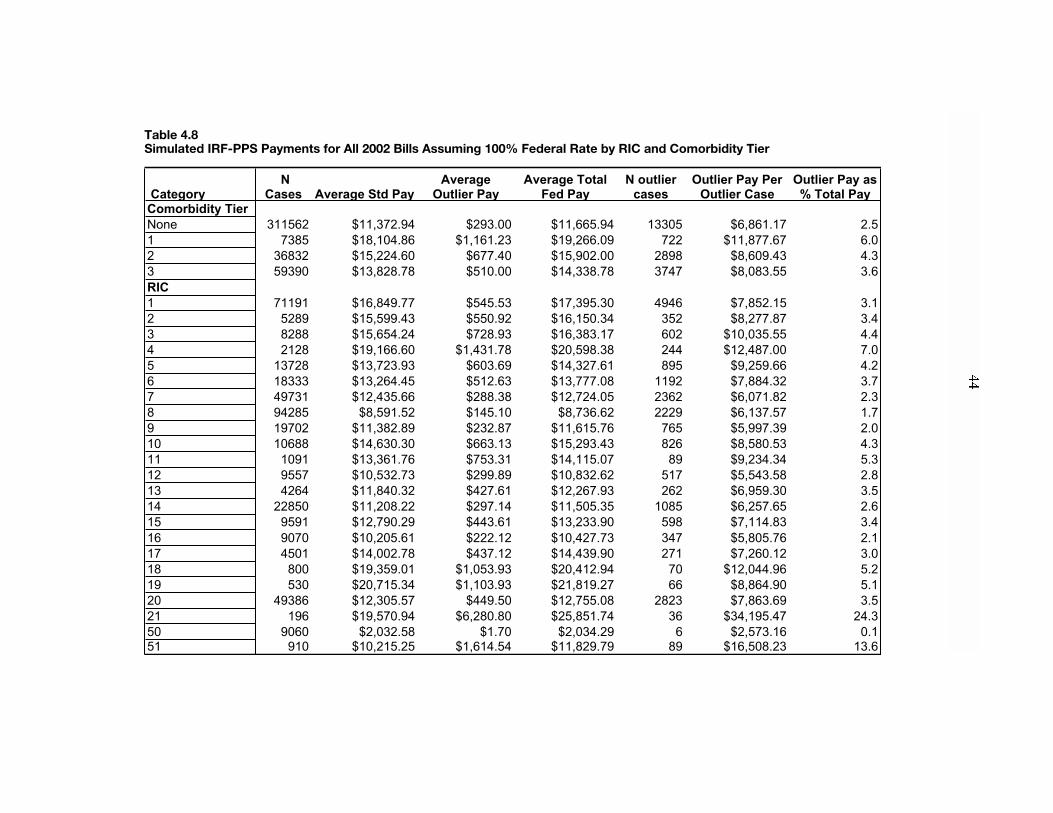
Table 4.8Simulated IRF-PPS Payments for All 2002 Bills Assuming 100% Federal Rate by RIC and Comorbidity Tier
Category
N
Cases Average Std Pay
Average
Outlier Pay
Average Total
Fed Pay
N outlier
cases
Outlier Pay Per
Outlier Case
Outlier Pay as
% Total Pay
Comorbidity Tier
None 311562 $11,372.94 $293.00 $11,665.94 13305 $6,861.17 2.5
1 7385 $18,104.86 $1,161.23 $19,266.09 722 $11,877.67 6.0
2 36832 $15,224.60 $677.40 $15,902.00 2898 $8,609.43 4.3
3 59390 $13,828.78 $510.00 $14,338.78 3747 $8,083.55 3.6
RIC
1 71191 $16,849.77 $545.53 $17,395.30 4946 $7,852.15 3.1
2 5289 $15,599.43 $550.92 $16,150.34 352 $8,277.87 3.4
3 8288 $15,654.24 $728.93 $16,383.17 602 $10,035.55 4.4
4 2128 $19,166.60 $1,431.78 $20,598.38 244 $12,487.00 7.0
5 13728 $13,723.93 $603.69 $14,327.61 895 $9,259.66 4.2
6 18333 $13,264.45 $512.63 $13,777.08 1192 $7,884.32 3.7
7 49731 $12,435.66 $288.38 $12,724.05 2362 $6,071.82 2.3
8 94285 $8,591.52 $145.10 $8,736.62 2229 $6,137.57 1.7
9 19702 $11,382.89 $232.87 $11,615.76 765 $5,997.39 2.0
10 10688 $14,630.30 $663.13 $15,293.43 826 $8,580.53 4.3
11 1091 $13,361.76 $753.31 $14,115.07 89 $9,234.34 5.3
12 9557 $10,532.73 $299.89 $10,832.62 517 $5,543.58 2.8
13 4264 $11,840.32 $427.61 $12,267.93 262 $6,959.30 3.5
14 22850 $11,208.22 $297.14 $11,505.35 1085 $6,257.65 2.6
15 9591 $12,790.29 $443.61 $13,233.90 598 $7,114.83 3.4
16 9070 $10,205.61 $222.12 $10,427.73 347 $5,805.76 2.1
17 4501 $14,002.78 $437.12 $14,439.90 271 $7,260.12 3.0
18 800 $19,359.01 $1,053.93 $20,412.94 70 $12,044.96 5.2
19 530 $20,715.34 $1,103.93 $21,819.27 66 $8,864.90 5.1
20 49386 $12,305.57 $449.50 $12,755.08 2823 $7,863.69 3.5
21 196 $19,570.94 $6,280.80 $25,851.74 36 $34,195.47 24.3
50 9060 $2,032.58 $1.70 $2,034.29 6 $2,573.16 0.1
51 910 $10,215.25 $1,614.54 $11,829.79 89 $16,508.23 13.6
45
Chapter V. Resource Use
In this chapter we examine the resources used to care for IRF cases between 1998 and
2002. We begin by describing changes in LOS in the population and in the sample with case
mix data. We then describe changes for groups of hospitals in resource use, including LOS, the
cost of care and the cost of therapy. We conclude by examining PTC ratios for groups of
hospitals during 2002.
Length of stay in IRFs has been declining at least since 1998. There was a particularly
large decline in the number of cases with extremely long LOS and an increase in the percentage
of cases in most payment groups discharged at the average LOS. Average LOS declined within
each RIC between 1999 and 2002, the two years for which we have case mix data. The rate of
decline in LOS varied across groups of hospitals. In general, hospitals that had longer LOS in
1999 had greater percentage declines between 1999 and 2002, thus increasing the uniformity of
IRF LOS across the country and across types of hospitals.
The average cost per case increased by 1.6 percent between 1999 and 2002. Since LOS
declined, the cost per day increased by 16.6 percent. Therapy costs increased 10.6 percent per
day in the same period, thus decreasing the percentage of costs devoted to therapy from 24.4
percent to 23.2 percent. We found that if all hospitals were 100 percent on the PPS throughout all
of 2002, PPS payments during 2002 would have been 14 percent higher than cost. The rate of
change in average case costs, PTC, daily costs, and PTC ratios varied across groups of hospitals.
The PTC ratios show the effectiveness of the payment adjustments, with only small
variations between rural and urban areas, and by DSH categories. Although payment largely
followed costs by RIC and tier, variations in the PTC ratio across these categories show the need
to refine the payment parameters of the PPS.16
5.1 Distribution of Length of Stay of IRF Cases
5.1.1 Trends over Time
Table 5.1 shows average LOS in the IRF population in each year. Average LOS has been
declining steadily throughout the period, but the rate of decline accelerated after 2000,
particularly in freestanding IRFs. The total decline in average LOS from 1999 to 2002 was 1.9
days or 12.8 percent. The decline was greater in freestanding IRFs -- 2.8 days or 15.8 percent.
16 See Paddock et al. (2005) for findings regarding possible refinements to the IRF PPS facility adjustments.

46
The last line in the table shows that the average LOS of 2002 cases on the PPS was quite similar
to that for all 2002 cases.
Table 5.1Mean LOS of Bundled Discharges 1998-2002 by Type of Facility
Figure 5.1 gives the cumulative distribution of LOS in the IRF population in each year
from 1998 through 2002. The horizontal axis is number of days and the vertical axis is the
percent of the year's cases. For the 2002 line, the point corresponding to day x gives the percent
of 2002 cases who had a LOS less than or equal to x. For example, almost 90 percent of 2002
cases had a LOS of 22 days or less. The other year's lines have a similar interpretation.
One can see from Figure 5.1 that LOS has been declining steadily in all ranges of LOS
throughout this period. If we pick any LOS greater than 7, we can clearly see the lines are
ascending: each year's point is higher than the previous year's point so each year there are a
higher percent of cases with LOS at least that small.
There was a relatively large decline in the number of cases with long LOS. For example,
in 1998, 24 percent of cases had LOS longer than 20 days, but by 2002 only 15 percent of cases
had an LOS of more than 20 days. The decline in long LOS cases accelerated in 2000 and was
greater between 2000 and 2002 than between 1998 and 2000.
Year Mean LOS
% change
from
previous
year Mean LOS
% change
from
previous
year Mean LOS
% change
from
previous
year
1998 15.48 14.16 18.18
1999 15.06 -2.69 13.75 -2.84 17.72 -2.52
2000 14.58 -3.18 13.28 -3.47 17.24 -2.69
2001 13.95 -4.35 12.72 -4.20 16.34 -5.24
2002 13.14 -5.81 12.16 -4.36 14.92 -8.68
2002 PPS 13.26 -4.93 12.08 -5.02 15.00 -8.19
All IRFs Units Freestanding

47
Figure 5.1Cumulative Distribution of LOS, by Year
5.1.2 Changes in LOS within RIC
We saw in Chapter 3 that the distribution of RICs changed between 2002 and 1999.
Since the RIC that increased the most has a shorter than average LOS, it is worthwhile to
examine whether declines in LOS occurred within RIC as well as overall. As shown in Table
5.2, there was a substantial decline in LOS in each RIC except the extremely small burn RIC
where LOS increased. There was also a shift in the LOS distribution, with a greater proportion of
cases being discharged at the ALOS for the payment group. Overall, the proportion of cases
discharged at the average LOS for their CMG increased from 5.3 percent in 1999 to 7.3 percent
in 2002. In many RICs the average LOS became the modal LOS. There was also an increase,
albeit a smaller one, in the proportion of cases discharged a day short of the average LOS and a
decrease in the proportion discharged a day after the average LOS. These patterns are consistent
with anecdotes about the average LOS being treated as a target or ceiling under the PPS.
However, these patterns are not inconsistent with the general decrease in LOS so it is important
to look at changes across the distribution. Figure 5.2 shows the shifts in the LOS distribution for
the largest CMG within each of the three largest RICs. In each CMG, the distribution in the
figure combines data from all 3 tiers as well as the cases with no relevant comorbidity. The
0
10
20
30
40
50
60
70
80
90
100
1 2 3 4 5 6 7 8 9 10 11 12 13 14 15 16 17 18 19 20 21 22 23 24 25 26 27 28 29 30
LOS
Percen
t o
f C
ases
1998
1999
2000
2001
2002

48
Table 5.2Change in Mean Length of Stay Between 1999 and 2002 by RIC by FreestandingUnit Status
Note: Data for 1999 All IRFs column is based on a weighted estimate from the case mix sample.
Figure 5.2Lengths of Stay in 1999 vs. 2002, for Selected Large CMGs
0
2
4
6
8
10
12
14
16
0 1 2 3 4 5 6 7 8 9 1011121314151617181920212223242526272829303132333435363738394041424344454647484950
Length of Stay
Percen
t
CMG 114, 1999
CMG 114, 2002
CMG 114, Average LOS
CMG 705, 1999
CMG 705, 2002
CMG 705, Average LOS
CMG 803, 1999
CMG 803, 2002
CMG 803, Average LOS
RIC 1999 2002
%
Change 1999 2002
%
Change 1999 2002 % Change
1 19.4 17.5 -9.8 17.7 16.3 -7.9 23.4 20.0 -14.6
2 18.8 15.9 -15.4 16.4 14.4 -12.0 23.3 18.4 -20.9
3 17.4 14.9 -14.6 15.7 13.7 -12.5 22.1 17.5 -20.8
4 22.8 19.9 -12.8 20.2 17.2 -15.0 27.2 24.4 -10.0
5 15.9 13.9 -13.1 14.7 12.9 -11.8 19.8 16.4 -17.0
6 16.3 14.3 -12.4 14.7 13.4 -9.2 19.4 16.2 -16.3
7 15.3 14.1 -7.4 13.7 13.1 -4.5 18.6 16.2 -12.9
8 10.6 9.5 -10.6 9.8 9.0 -8.7 12.4 10.5 -15.5
9 14.4 13.3 -8.0 13.0 11.7 -10.0 16.9 15.1 -10.9
10 17.0 15.4 -9.8 15.9 14.5 -8.7 19.8 17.1 -13.5
11 15.3 14.3 -6.7 14.0 12.7 -9.3 17.6 16.9 -4.0
12 14.3 12.4 -13.2 12.3 11.5 -6.3 16.2 14.4 -11.1
13 15.0 13.1 -12.4 13.0 11.9 -8.3 17.0 15.1 -10.9
14 13.6 12.3 -9.6 12.6 11.2 -11.3 15.5 13.6 -12.0
15 15.8 13.5 -14.6 13.7 11.9 -13.4 17.6 14.6 -16.9
16 13.7 11.7 -15.1 12.0 10.7 -10.5 16.1 12.9 -19.7
17 16.7 15.3 -8.4 15.3 14.0 -8.0 19.6 17.5 -11.0
18 20.4 18.8 -7.6 18.3 16.9 -7.9 24.9 21.0 -15.6
19 22.2 20.8 -6.0 21.2 19.3 -9.0 25.0 23.7 -5.5
20 14.8 13.4 -9.8 13.3 12.1 -8.9 17.8 15.1 -15.0
21 20.6 21.5 4.0 20.6 21.6 5.0 20.7 21.2 2.1
50 2.6 2.5 -4.6 2.6 2.5 -3.6 2.5 2.4 -7.0
51 14.7 12.5 -15.2 12.5 11.6 -7.0 17.2 13.9 -19.5
Total 15.1 13.1 -13.2 13.8 12.2 -11.6 17.7 14.9 -15.8
All IRFs Units Freestanding

49
expected average LOS for that CMG was calculated from the tier specific averages published in
the Federal Register and the distribution of the CMG by tiers.17 This average is shown as a
vertical line. In the largest stroke CMG (114) it is clear that rather than the LOS shifting to the
left, the percent at or just below the average LOS increased and the percent more than two days
above it decreased. The same is true of the largest hip fracture CMG (705). In the largest joint
replacement CMG (803), however, it does not appear that there was a shift toward the average
LOS. Rather, the number of cases discharged at the mode increased and fewer cases were
discharged with stays longer than the average LOS. Overall, the shifts are small but consistent
with expected reactions to the PPS.
Although we do not present details, the 2002 LOS for all PPS cases in each RIC was very
similar to the LOS for all 2002 cases in that RIC. Consistent with the data in Table 5.1, the PPS
LOS was very close to the non-PPS LOS -- typically 0.1 to 0.2 days longer.
The percentage decline between 1999 and 2002 was greater for freestanding hospitals
than for units. However the average LOS during 2002 remained substantially higher in
freestanding IRF than in units in almost all RICs.
5.2 Changes in Resource Use by Types of IRF
5.2.1 LOS and Case Cost
Table 5.3 gives data on the cases for whom we can estimate case cost using the
departmental accounting method. The hospitals used in Table 5.3 provided 98.7 percent of all
1999 bundled cases and 97.6 percent of all 2002 bundled cases and thus we expect that all the
means in the table adequately represent the entire population of Medicare IRF patients in these
two years.18
The first line in Table 5.3 shows that average cost per case increased by 1.6 percent
between 1999 and 2002. Since, as we saw above, LOS declined by a much greater percent (12.8
percent), the cost per day increased by 16.6 percent. This exceeds the three-year increase in the
17 The average LOS varies very little by tier in these CMGs, except for the few tier 1 cases. In the other tiers, andfor the no tier cases, the average LOS for CMG 114 is either 32, 33 or 34; for CMG 705, it is either 21 or 23; for
CMG 803 it is 10 or 11.18 IRFs that began operation in 2001 and 2002 are probably under-represented because cost report information may
not yet be available for them. However, while these IRFs may be more costly than others, given the small number
of cases in these facilities our results are highly unlikely to be affected.

Table 5.3Comparison of Volume, Cost, and LOS for 1999 and 2002 for the IRF Population, by Provider Characteristics
Number Number Avg. Avg. Daily Number Number Avg. Avg. Daily Number Number Avg. Avg. Daily
of IRF of cases cost LOS cost of IRF of cases cost LOS cost of IRF of cases cost LOS cost
All 1,137 380,513 10,929$ 15.07 725.37$ 1,139 460,669 11,104$ 13.13 845.66$ 0.2 21.1 1.6 -12.9 16.6
Provider in Both Years?
No 112 17,662 12,633$ 15.72 803.60$ 114 28,060 12,265$ 13.19 929.81$ 1.8 58.9 -2.9 -16.1 15.7
Yes 1,025 362,851 10,846$ 15.04 721.38$ 1,025 432,609 11,029$ 13.13 840.18$ 0 19.2 1.7 -12.7 16.5
Area
Urban 986 350,267 10,903$ 15.14 720.20$ 968 420,844 11,088$ 13.19 840.48$ -1.8 20.1 1.7 -12.9 16.7
Rural 151 30,246 11,236$ 14.24 788.99$ 170 39,410 11,313$ 12.41 911.25$ 12.6 30.3 0.7 -12.8 15.5
Type of Hospital
Unit 935 253,616 10,867$ 13.71 792.61$ 930 297,919 11,141$ 12.15 917.05$ -0.5 17.5 2.5 -11.4 15.7
Freestanding 202 126,897 11,054$ 17.78 621.73$ 209 162,750 11,036$ 14.93 739.31$ 3.5 28.3 -0.2 -16 18.9
Ownership
Government 106 24,642 12,073$ 14.83 814.01$ 113 33,294 12,046$ 13.01 925.82$ 6.6 35.1 -0.2 -12.3 13.7
Non-Profit 712 227,541 10,856$ 14.03 773.66$ 696 264,639 11,037$ 12.23 902.08$ -2.2 16.3 1.7 -12.8 16.6
Proprietary 319 128,330 10,839$ 16.95 639.56$ 330 162,736 11,020$ 14.61 754.24$ 3.4 26.8 1.7 -13.8 17.9
Unit of Acute Hospital
ADC less than 10 pts 299 35,697 11,392$ 12.27 928.42$ 289 43,308 11,495$ 10.88 1,056.19$ -3.3 21.3 0.9 -11.3 13.8
ADC 10-24 pts 495 138,392 10,513$ 13.42 783.28$ 504 164,007 10,890$ 12.00 907.52$ 1.8 18.5 3.6 -10.6 15.9
ADC 25 or more pts 141 79,527 11,247$ 14.86 756.93$ 137 90,604 11,427$ 13.02 877.37$ -2.8 13.9 1.6 -12.3 15.9
Freestanding Hospital
ADC less than 25 pts 53 9,255 15,276$ 17.16 890.40$ 51 11,318 13,643$ 13.91 980.63$ -3.8 22.3 -10.7 -18.9 10.1
ADC 25-49 pts 73 41,308 10,412$ 17.48 595.59$ 73 47,714 10,782$ 14.79 729.14$ 0 15.5 3.6 -15.4 22.4
ADC 50 or more pts 76 76,334 10,889$ 18.02 604.43$ 85 103,718 10,868$ 15.10 719.63$ 11.8 35.9 -0.2 -16.2 19.1
Census Region
New England 40 17,330 12,095$ 18.51 653.38$ 39 20,763 12,545$ 15.80 794.05$ -2.5 19.8 3.7 -14.7 21.5
Middle Atlantic 148 70,655 10,835$ 15.26 709.93$ 154 82,111 10,788$ 12.91 835.49$ 4.1 16.2 -0.4 -15.4 17.7
South Atlantic 145 65,798 10,325$ 14.72 701.29$ 140 77,824 10,630$ 13.15 808.51$ -3.4 18.3 2.9 -10.7 15.3
East North Central 218 63,817 10,840$ 13.76 787.63$ 212 75,102 10,948$ 11.98 914.12$ -2.8 17.7 1.0 -13.0 16.1
East South Central 57 29,096 10,053$ 15.84 634.74$ 63 34,255 10,331$ 14.05 735.14$ 10.5 17.7 2.8 -11.3 15.8
West North Central 100 23,875 10,341$ 14.04 736.46$ 97 27,366 10,948$ 12.57 871.30$ -3.0 14.6 5.9 -10.5 18.3
West South Central 233 68,932 11,258$ 15.90 707.90$ 238 90,347 10,978$ 13.40 819.13$ 2.1 31.1 -2.5 -15.7 15.7
Mountain 75 18,449 9,853$ 13.62 723.65$ 77 24,956 10,631$ 12.60 843.91$ 2.7 35.3 7.9 -7.5 16.6
Pacific 121 22,561 13,969$ 15.23 917.47$ 118 27,530 14,735$ 13.79 1,068.44$ -2.5 22.0 5.5 -9.4 16.5
DSH Patient Ratio
Less than .10 586 200,252 10,186$ 14.34 710.14$ 581 242,419 10,334$ 12.52 825.23$ -0.9 21.1 1.5 -12.7 16.2
.10-.19 361 125,419 11,175$ 15.53 719.52$ 335 144,193 11,448$ 13.74 833.03$ -7.2 15 2.4 -11.5 15.8
.20-.29 110 36,395 12,418$ 16.08 772.12$ 104 42,011 12,188$ 13.82 881.89$ -5.5 15.4 -1.9 -14.1 14.2
.30 or higher 77 18,192 14,350$ 17.68 811.65$ 66 20,091 14,842$ 14.93 994.36$ -14.3 10.4 3.4 -15.6 22.5
Missing 3 255 17,287$ 23.87 724.31$ 53 11,955 12,466$ 12.62 987.72$ 1666.7 4588.2 -27.9 -47.1 36.4
Note: Table restricted to cases with case cost data.
Hospital Group
1999 data 2002 data Percent change

51
market basket of 10.9 percent19, suggesting approximately a 5.7 percent increase in real
resources used per day. Thus, some of the savings from the decrease in LOS went to providing
more resources during the time the patient was in the IRF.
The rest of the table is arranged to compare cases at hospitals with specific
characteristics. In examining differences in cost and LOS across types of hospitals, it is
important to remember that the differences may be due to differences in case mix and/or wage
index. In discussing this table we will concentrate on the changes observed in each group, thus
allowing the group in the earlier period to be its own control. Changes we see may be due to
case mix changes, but are unlikely to be due to changes in input prices.
IRFs that ceased to care for Medicare beneficiaries under the same provider number had
substantially higher costs in 1999 than continuing IRFs. Similarly, IRFs that started after 1999
cost more than other IRFs in 2002. Continuing IRFs had less of a decline in LOS (12.7 percent).
Rural hospitals had a greater increase in Medicare volume than urban hospitals, similar
declines in LOS, and slightly lower increases in cost per day. There also were variations across
the census divisions. The greatest increase in volume occurred in the West South Central and
Mountain divisions. The largest declines in LOS occurred in New England, the Middle Atlantic,
and West South Central, all of which had higher than average LOS in 1999. Similarly, the
smallest decline in LOS occurred the Mountain Division, which had the shortest LOS in 1999.
Thus, the changes resulted in more uniformity in LOS across the country. The Pacific Division,
however, remained the most costly on both a per case and per day basis.
There were large differences in the changes made by units and freestanding IRFs during
this period, and by types of IRF ownership. Freestanding hospitals had greater increases in
volume, greater declines in LOS and a greater increase in daily cost. Despite the greater decline
in LOS, the average LOS was longer in freestanding hospitals than in units in 2002. The
differences between units and freestanding IRFs in daily cost decreased with units having a 24
percent greater daily cost than freestanding hospitals in 2002. Proprietary hospitals increased
volume more than average, decreased LOS more than average, increased daily cost more than
average and continued to have higher LOS and lower daily costs in 2002. These changes are
19 The market basket increase was calculated by us from the quarterly moving averages for 2000 through 2002 found
in www.cms.hhs.gov/statistics/market-basket/excluded-capital.asp.

52
related to the changes by freestanding status, as two-thirds of proprietary cases and of
freestanding cases are in facilities that are both freestanding and proprietary.
Facility size has a u-shaped relationship with the cost of a case. For both units and
freestanding hospitals, the smaller facilities are the most expensive, especially in terms of daily
cost. Larger freestanding facilities had the largest increase in volume. Among units, the smallest
units had the largest increase in volume. This difference in growth pattern had little effect on the
relative growth rate of daily cost in units and freestanding hospitals, however, because small
IRFs where costs are greater had only a small change in market share within either group.20
The data by DSH patient ratio categories show clearly that, within each year, costs and
LOS increase with the percentage of patients who are low income. (The statistics on changes
within DSH ratio categories may be slightly confounded by the percentage of cases for whom
DSH data are not available in 2002.)
5.2.2 Therapy Costs
Table 5.4 shows the percentage of costs that are due to therapy and the average daily
therapy costs in 1999 and 2002. The average LOS is repeated from Table 5.3 for ease of
comparison. Therapy accounted for 24.4 percent of 1999 costs and 23.2 percent of 2002 costs.21
This decline in the proportion of costs due to therapy was 5.2 percent for all cases and 4.8
percent for IRFs that operated in both years. The decline is less than the decline in LOS so
average daily therapy costs increased by 10.6 percent overall and 10.9 percent in hospitals
present in both years.
Differences in therapy costs between urban and rural areas are not large and did not
change much. There is a greater range across census divisions in the percentage of costs due to
therapy in 2002 than in 1999. The regions where we estimate the lowest proportion of costs
from therapy and lowest average therapy costs are New England and the Middle Atlantic in both
years, and those with the highest proportion are the East North Central and West South Central.
The Pacific Region, which had the highest daily cost in 1999, had the greatest percentage
increase in daily therapy costs.
20 Small units cared for 14.1 percent of unit cases in 1999 and 14.5 percent of unit cases in 2002; small freestanding
IRFs cared for 7.3 percent of freestanding cases in 1999 and 7.0 in 2002.21 The majority of non-therapy costs are for nursing care and other routine per diem services (meals, janitorial
service, linen, etc.). However, non-therapy ancillaries (such as diagnostic tests, pharmacy) cost about 70 percent as
much as therapy.

53
Table 5.4Comparison of LOS, Percentage of Costs for Therapy, and Average Daily Therapy Cost for 1999and 2002, by Provider Characteristics
Note; Sample is same as Table 5.3, except this table omits all cases from IRFs that charged for therapy for fewerthan 67percent of cases. This restriction omitted 13 hospitals with 4460 cases in 1999 and 4 hospitals with 1730cases in 2002.
The differences across other categories in percentage of costs from therapy are not nearly
as large as those for census divisions. Units had a higher percentage of costs for therapy in 1999
than freestanding facilities and this difference increased slightly in 2002. The proportion of costs
from therapy were similar for non-profit and proprietary hospitals in both years, with local
government-run hospitals having a slightly lower percentage. In 1999, the percentage of costs
1999 2002 Percent change
Hospital Group
Avg.
LOS
% of cost
from
therapy
Avg. daily
therapy
cost
Avg.
LOS
% of cost
from
therapy
Avg. daily
therapy
cost
Avg.
LOS
% of
cost
from
therapy
Avg. daily
therapy
cost
All 15.07 24.43% 176.83$ 13.13 23.16% 195.62$ -12.8 -5.2 10.6
Provider in both years?
No 15.72 23.28% 185.22$ 13.18 21.02% 195.27$ -16.1 -9.7 5.4
Yes 15.04 24.49% 176.40$ 13.13 23.32% 195.64$ -12.7 -4.8 10.9
Area
Urban 15.14 24.35% 174.98$ 13.19 23.08% 193.74$ -12.8 -5.2 10.7
Rural 14.24 25.28% 199.36$ 12.41 24.00% 218.74$ -12.8 -5.1 9.7
Type of Hospital
Unit 13.71 24.67% 195.10$ 12.15 23.73% 217.26$ -11.4 -3.8 11.4
Freestanding 17.78 23.96% 148.93$ 14.93 22.13% 163.55$ -16.0 -7.7 9.8
Ownership
goverment 14.83 24.07% 195.47$ 13.01 22.36% 207.03$ -12.3 -7.1 5.9
non-profit 14.03 24.41% 188.51$ 12.23 23.19% 208.83$ -12.8 -5.0 10.8
proprietary 16.95 24.54% 156.92$ 14.61 23.29% 175.65$ -13.8 -5.1 11.9
Unit of acute hospital
ADC less than 10 pts. 12.27 24.02% 222.47$ 10.88 22.05% 232.93$ -11.3 -8.2 4.7
ADC 10-24 pts. 13.42 25.77% 201.93$ 12.01 24.63% 223.59$ -10.5 -4.4 10.7
ADC 25 or more pts. 14.86 23.14% 173.89$ 13.01 22.97% 200.31$ -12.4 -0.8 15.2
Freestanding
ADC less than 25 17.16 24.31% 216.44$ 13.90 22.02% 215.65$ -19.0 -9.4 -0.4
ADC 25-49 17.48 25.57% 152.29$ 14.79 22.28% 162.44$ -15.4 -12.9 6.7
ADC 50 or higher 18.02 23.06% 139.26$ 15.10 22.07% 158.84$ -16.2 -4.3 14.1
Census Region
New England 18.51 21.63% 141.35$ 15.80 19.60% 155.65$ -14.7 -9.4 10.1
Middle Atlantic 15.26 20.97% 147.46$ 12.90 20.06% 166.33$ -15.5 -4.3 12.8
South Atlantic 14.72 25.22% 176.76$ 13.15 24.02% 194.20$ -10.7 -4.7 9.9
East North Central 13.76 25.12% 197.19$ 11.98 23.58% 215.51$ -13.0 -6.2 9.3
East South Central 15.84 27.48% 173.72$ 14.15 25.92% 190.19$ -10.7 -5.7 9.5
West North Central 14.04 26.33% 195.11$ 12.57 25.01% 217.88$ -10.5 -5.0 11.7
West South Central 15.90 25.02% 177.12$ 13.40 24.18% 198.03$ -15.7 -3.3 11.8
Mountain 13.62 24.61% 177.64$ 12.60 21.38% 180.45$ -7.5 -13.1 1.6
Pacific 15.23 25.25% 231.70$ 13.79 24.48% 261.54$ -9.4 -3.1 12.9
DSH Patient Ratio
Less than .10 14.34 25.00% 177.58$ 12.53 23.46% 193.56$ -12.6 -6.2 9.0
.10-.19 15.53 24.21% 173.42$ 13.74 22.87% 189.68$ -11.6 -5.5 9.4
.20-.29 16.08 23.49% 180.43$ 13.82 23.73% 209.31$ -14.1 1.0 16.0
.30 or higher 17.68 22.85% 185.94$ 14.93 22.36% 222.35$ -15.6 -2.2 19.6
Missing 23.87 14.20% 102.85$ 12.62 21.11% 208.52$ -47.1 48.7 102.7

54
from therapy declined with increasing low-income percentage, but by 2002 this relationship was
no longer evident.
5.3 Payment-to-Cost Ratios in 2002
5.3.1 Facility Characteristics
We next present the ratio of average payment to average cost for 2002 cases. The sample
differs from that in Table 5.3 in that it is restricted to cases with a good match to the IRF PAI and
for whom we have all necessary payment parameters (wage index, rural status, DSH fraction,
CCR, and covered charges) to calculate outlier payments.
The first row of Table 5.5 shows the average payment would have been $12,599 if all
Medicare cases discharged during CY 2002 had been paid 100 percent under the PPS. The
average weight per discharge was 0.97. The average bundled cost of $11,044 differs by less than
one percent from that of the population in Table 5.3. However, in this table we are able to
standardize costs with the parameters that are used for payment in the PPS -- case mix, area wage
index, rural status, and DSH. This column allows comparison of relatively costliness across
hospital groups after controlling for their patient mix and characteristics.
PPS payments are substantially higher than cost. This is not surprising given the lack of
cost growth per case since 1999, the increase in the payment rate by the actuary to account for
payment trends under TEFRA, and changes in coding which may have increased the weight per
discharge. The average payment is estimated to exceed average cost by 14 percent as shown in
the last column of Table 5.5, first row.
The remaining rows in the table compare groups of hospitals. The extra payment
provided to rural hospitals in the PPS equalized differences in costs as the PTC ratio for rural
hospitals only slightly lower than that for urban hospitals. Most census regions have PTC ratios
similar to the national average -- with the 2 North Central regions having the lowest and the East
South Central region having the highest. The Pacific region has the highest average bundled
cost, but also the highest average case mix weight and consequently a PTC ratio close to average.
Freestanding hospitals and proprietary hospitals have the highest PTC ratio, due in part to their
lower than average costs and in part to their higher than average case weight. There is
substantial overlap between these two groups –63 percent of freestanding IRFs are proprietary
and 45 percent of proprietary IRFs are freestanding. The very smallest freestanding facilities and
units have the lowest PTC ratios.

55
Table 5.5PPS Payment, Average Case Weight, Cost, and Payment-to-Cost Ratios for All 2002 Cases, by Hospital Characteristics
Category
N
Facilities N Cases
N Equivalent
Cases
Average
Total Fed
Pay
Average
Case
Weight
Average
Bundled
Cost
Average
Standardized
Cost
Payment to
Cost Ratio
All facilities 1,072 415,169 386,520 $12,559 0.97 $11,044 $10,858 1.14
Geographical Area
Urban 903 375,184 349,192 $12,573 0.98 $11,041 $10,853 1.14
Rural 169 39,985 37,328 $12,433 0.95 $11,074 $10,906 1.12
Census Region
New England 37 19,494 18,130 $14,277 1.03 $12,394 $10,650 1.15
Middle Atlantic 150 77,225 71,996 $12,577 0.91 $10,706 $10,545 1.17
South Atlantic 140 72,125 67,548 $12,445 0.99 $10,586 $10,397 1.18
East North Central 182 62,207 56,597 $12,018 0.95 $10,814 $10,880 1.11
East South Central 63 31,435 29,293 $12,316 1.03 $10,348 $10,355 1.19
West North Central 97 25,384 23,414 $11,607 0.95 $11,015 $11,612 1.05
West South Central 230 82,076 77,219 $11,895 0.98 $10,948 $11,466 1.09
Mountain 63 20,573 19,167 $12,199 0.97 $10,527 $10,660 1.16
Pacific 110 24,650 22,782 $16,648 1.06 $14,619 $11,301 1.14
Type of Hospital
Freestanding 201 154,503 143,764 $12,946 1.03 $10,930 $10,242 1.18
Unit 871 260,666 242,755 $12,330 0.94 $11,112 $11,223 1.11
Ownership
Non-Profit 651 243,523 218,467 $12,231 0.94 $10,967 $10,998 1.12
Proprietary 319 138,634 141,519 $12,956 1.02 $10,996 $10,500 1.18
Government 102 33,012 26,533 $12,607 0.96 $11,933 $11,613 1.06
Unit of acute hospital
ADC less than 10 pts. 297 42,647 39,653 $11,542 0.90 $11,409 $12,107 1.01
ADC 10-24 pts. 447 136,634 127,191 $12,265 0.94 $10,879 $11,077 1.13
ADC 25 or more pts. 127 81,385 75,912 $12,853 0.96 $11,346 $11,004 1.13
Freestanding hospital
ADC less than 25 46 9,762 9,073 $12,492 0.97 $13,272 $13,369 0.94
ADC 25-49 72 46,952 43,547 $12,759 1.04 $10,733 $10,158 1.19
ADC 50 or higher 83 97,789 91,145 $13,080 1.04 $10,790 $9,971 1.21
DSH Patient Ratio
Less than .10 573 239,079 222,922 $11,860 0.95 $10,324 $10,653 1.15
.10-.19 327 127,383 118,766 $12,907 1.00 $11,532 $11,078 1.12
.20-.29 101 32,097 29,637 $14,369 1.00 $12,701 $11,461 1.13
.30 or higher 71 16,610 15,194 $16,461 1.06 $14,456 $10,967 1.14
CMI Quartiles
Q1 268 93,615 87,675 $10,492 0.80 $9,454 $10,474 1.11
Q2 268 96,844 90,262 $11,912 0.92 $10,729 $11,040 1.11
Q3 268 116,107 108,176 $12,632 1.01 $10,962 $10,842 1.15
Q4 268 108,603 100,407 $14,841 1.13 $12,783 $11,063 1.16
Residents to ADC ratio
Non-teaching 961 368,195 343,066 $12,411 0.98 $10,854 $10,793 1.14
Less than .10 58 28,429 26,302 $13,539 0.97 $11,838 $10,843 1.14
.10-.19 34 14,442 13,390 $13,678 0.93 $13,373 $12,201 1.02
.20 or higher 19 4,103 3,761 $15,167 1.02 $14,419 $12,127 1.05

56
The last set of lines in the table, for DSH, CMI hospital quartiles, and teaching status,
provide information about aspects of the payment system. The PTC ratios by DSH categories
are roughly similar to the national average and exhibit no trend, suggesting that the relative
payments for low-income percentage are appropriate. However, the strong increase in PTC
ratios for the CMI quartiles indicates a need to recalibrate the weights.22
At the moment, there is no adjustment of PPS payments for the indirect cost of medical
education (IME). The last section of the table shows that PTC ratios were lower for teaching
hospitals, particularly those with more than 1 resident for every 10 patients, than for non-
teaching hospitals. This may indicate a need to provide an IME adjustment in a refined PPS.
5.3.2 Case Characteristics
Table 5.6 shows information on PPS payments, case weights, costs, and PTC ratios by
the tier and RIC assigned to the case. Although, as expected, costs are substantially higher for
the small number of tier 1 cases than for others, the increase in payments more than offsets the
higher tier 1 payment, and produces the highest PTC ratio of any tier group. The overpayment of
tier 1 cases and the smaller relative overpayment of the other tier cases show the need to refine
the definition of tier and recalibrate the weights. Average federal payment and average case
weight are correlated at 0.98 across RICs showing that the basic effect of impairment on the
payment system is appropriate. However, the data by RIC also show some variation in PTC and,
therefore, the need to recalibrate the weights and possibly refine the CMGs. The smaller RICs
tend to have the largest deviation from the average PTC ratios. Burns (RIC 21) and osteoarthritis
(RIC 12) are relatively underpaid; major multiple trauma with brain or spinal cord injury (RIC
18) and non-traumatic brain injury (RIC 3) are among those relatively overpaid.
The largest RIC, RIC 8 (lower extremity joint replacement), is the lowest cost of the
RICs with average payment, cost, and case weight being 70 percent of that of an average case. It
is also one of the least well-paid RICs, but still has a PTC ratio of 1.11.
22 CMG relative weights were recalibrated for FY2006 along with other CMG refinements. For related RAND
reports, see Carter (2005) and Relles (2005).

57
Table 5.6Average Total Federal Payments, Case Weights, Bundled Costs, Standardized Cost and Payment-to-Cost Ratio in 2002 By Comorbidity Tier and RIC
Category N Cases
N Equivalent
Cases
Average
Total Fed Pay
Average
Case
Weight
Average
Bundled
Cost
Average
Standardized
Cost
Payment- to-
Cost Ratio
All Cases
Comorbidity Tier
None 311,562 292,824 $11,666 0.91 $10,356 $10,875 1.13
1 7,385 6,471 $19,266 1.45 $16,206 $10,738 1.19
2 36,832 33,118 $15,902 1.21 $13,912 $10,780 1.14
3 59,390 54,106 $14,339 1.11 $12,230 $10,828 1.17
RIC
1 71,191 63,905 $17,395 1.34 $15,126 $11,049 1.15
2 5,289 4,646 $16,150 1.23 $13,838 $11,052 1.17
3 8,288 7,382 $16,383 1.22 $13,595 $11,019 1.21
4 2,128 1,863 $20,598 1.51 $18,046 $11,286 1.14
5 13,728 12,686 $14,328 1.09 $12,091 $11,036 1.18
6 18,333 17,011 $13,777 1.04 $12,113 $10,922 1.14
7 49,731 45,927 $12,724 1.00 $11,434 $10,839 1.11
8 94,285 92,228 $8,737 0.69 $7,837 $10,762 1.11
9 19,702 18,478 $11,616 0.92 $10,172 $10,686 1.14
10 10,688 9,729 $15,293 1.17 $13,505 $10,984 1.13
11 1,091 988 $14,115 1.05 $12,443 $10,756 1.13
12 9,557 9,017 $10,833 0.86 $10,112 $11,329 1.07
13 4,264 4,002 $12,268 0.94 $10,845 $11,046 1.13
14 22,850 20,828 $11,505 0.89 $10,078 $10,707 1.14
15 9,591 8,722 $13,234 1.01 $11,370 $10,588 1.16
16 9,070 8,594 $10,428 0.82 $9,299 $10,787 1.12
17 4,501 4,122 $14,440 1.12 $12,565 $10,937 1.15
18 800 707 $20,413 1.54 $16,432 $10,815 1.24
19 530 477 $21,819 1.65 $18,208 $11,202 1.20
20 49,386 45,055 $12,755 0.99 $11,090 $10,745 1.15
21 196 183 $25,852 1.53 $25,681 $11,837 1.01
50 9,060 9,060 $2,034 0.17 $2,261 $10,733 0.90
51 910 910 $11,830 0.81 $12,024 $10,829 0.98

58
5.4 Conclusions
Length of stay in IRFs has been declining at least since 1998. There was a particularly
large decline in the number of cases with extremely long LOS and an increase in the percentage
of cases in most payment groups discharged at the average LOS. The rate of decline increased
throughout this period and average LOS declined 5.8 percent from 2001 to 2002, the first year of
the PPS. Average LOS declined within each RIC between 1999 and 2002, the two years for
which we have case mix data.
The rate of decline in LOS varied across groups of hospitals. In general, hospitals that
had long LOS in 1999 had greater percentage declines between 1999 and 2002, thus increasing
the uniformity of IRF LOS across the country and across types of hospitals. For example,
freestanding hospitals’ LOS decreased by 16 percent between 1999 and 2002, while units’ LOS
decreased only 11.4 percent. But freestanding LOS was higher in both years and closer to unit
LOS in 2002 (14.9 vs. 12.2 days) than in 1999 (17.8 vs. 13.7 days).
The average cost per case increased 1.6 percent between 1999 and 2002. Since LOS
declined by a much greater percent, the cost per day increased by 16.6 percent. This exceeds the
three-year rate of increase in the market basket of 10.9 percent. Therapy costs increased 10.6
percent per day in the same period, thus decreasing the percentage of costs devoted to therapy
from 24.4 percent to 23.2 percent.
The rate of change in average case costs and daily costs varied across groups of hospitals.
Unlike LOS, case costs and daily costs did not become more uniform across hospital groups. For
example, in 1999, freestanding cases cost almost $200 more than units; by 2002, freestanding
cases cost about $615 less. If all hospitals were 100 percent on the PPS throughout all of 2002,
PPS payments during 2002 would have been 14 percent higher than costs. This is the combined
result of the lack of cost growth per case since 1999, the increase in the payment rate by the
actuary to account for payment trends under TEFRA, and changes in coding. PTC ratios varied
across groups of hospitals, with freestanding and proprietary hospitals having PTC ratios of 1.18.
The PTC ratios show the effectiveness of the payment adjustments, with only small
variations between rural and urban areas, and by DSH categories. Although payment largely
followed costs by RIC and tier, variations in the PTC ratio across these categories show the need

59
to refine the payment parameters of the PPS. There also was a positive correlation between PTC
ratio and hospital CMI quartile. In addition to demonstrating that the current weights are
inappropriate for the coding practices prevalent in 2002, this may indicate that coding practices
varied across hospitals with those in the highest CMI quartile responding most completely to the
PPS incentives, or even upcoding.23
23 For further discussion of coding changes, see Carter and Paddock (2005).
60
Appendix 1: CMI Calculation
A CMI is the average of the case weights assigned to some specified set of patients
(cases). The case weights are relative weights -- i.e., they provide expected cost of each CMG
relative to each other CMG. CMGs depend on patient age, impairment, functional status, tiers,
length of stay and whether the patient died in the hospital. In the IRF PPS the weights were
calculated from the matched data set for 1999. They were normalized so that each weight gives
the cost of a case in the CMG relative to the average case in the data set. In calculating the
average cost of a case, short-stay transfer cases are counted as only a fraction of a case. Thus, the
CMI in the data set is 1.0 when short-stay cases are counted as only a fraction of a case.
We calculated the CMI used here from the CMG assigned by IRVEN and the discharge
destination and LOS found on the hospital bill. However, one could calculate LOS from IRF
PAI data and impute the discharge destination from the discharge setting found on the IRF PAI.
The following values have been used in previous analyses:
• Values of i44a of (04, 05, 06, 07, 08, 09, 12, and 13) are transfers;• Values of i44a of 11 is a patient who expired in the hospital; and• All other values of i44a are deemed returned to community.
Using these data, the case mix index was calculated as described in the five steps below.
Step 1: Categorize cases into transfers, deaths, and other.Step 2: Assign the final CMGs.If the case is not a transfer and if the LOS is <=3 then assign the case to 5001,If the case is a death case with LOS > 3 use impairment code (or admission CMG) and LOS toassign the case to one of 5101, 5102, 5103, or 5104. (Orthopedic is RIC 7, 8, or 9. 5101 isorthopedic with 3 < LOS <=13; 5102 is orthopedic with LOS >= 14; 5103 is non-orthopedic 3 <LOS <= 15; 5104 is orthopedic with LOS >=16.)If neither of the above then assign the final CMG equal to the admission CMG (i.e., if the case isa transfer case with any LOS, or if LOS > 3 and either the case was deemed to have returned tothe community or expired).Step 3: Determine how much each case is counted in the CMI. For transfer cases only, comparethe LOS of the case with the average LOS in the final CMG (same as the admission CMG) fromTable 1 of the Addendum to the final regulations. Designate the case a short-stay transfer if andonly if LOS + 0.5 < average LOS in CMG. If case i is a short- stay transfer, set x(i) = (LOS +0.5)/average LOS in CMG. For cases who are not short-stay transfers, set x(i) = 1.Step 4: Retrieve the weight for the final CMG from Table 1 of the Addendum. Put the weightfor the ith case in w(i).Step 5: Calculate the CMI as:Sum(x(i)*w(i))/sum((x(i))) where the summation is over all cases with valid data in the data set.

61
References
Angelelli J, Gifford D, Intrator O, Gozalo P, Laliberte L, Mor V. (2002). Access To PostacuteNursing Home Care Before And After The BBA. Health Affairs, 21(5): 254-264.
Beeuwkes Buntin M, Escarce J, Hoverman C, Paddock SM, Totten M, Wynn BO. (2005).Effects of Payment Changes on Trends in Access to Post-Acute Care. TR-259-CMS, SantaMonica, CA: RAND Corporation.
Carter GM, Beeuwkes Buntin M, Hayden O, Kawata JH, Paddock SM, Relles DA, RidgewayGK, Totten M and Wynn BO. (2002). Analyses for the Initial Implementation of the InpatientRehabilitation Facility Prospective Payment System. MR-1500-CMS, Santa Monica, CA: RANDCorporation.
Carter GM, Newhouse JP, and Relles DA. (1991). Has DRG Creep Crept Up?: Decomposing theCase Mix Index Change Between 1987 and 1988. R-4098-HCFA/ProPAC, Santa Monica, CA:RAND Corporation.
Carter GM and Paddock SM (2005). Preliminary Analyses of Changes in Coding and Case Mixunder the Inpatient Rehabilitation Facility Prospective Payment System. TR-213-CMS, SantaMonica, CA: RAND Corporation.
Carter GM, Relles DA, Ridgeway GK, and Rimes CM. (2003). Measuring Function forMedicare Inpatient Rehabilitation Payment. Health Care Financing Review, 24(3): 25-44.
Chan L, Koepsell TD, Deyo RA, Esselman PC, Haeselkorn JK, Lowery JK, Stolov WC. (1997).The Effects of Medicare’s Payment System for Rehabilitation Hospitals on Length of Stay,Charges, and Total Payments. New England Journal of Medicine, 337(14): 978-985.
Centers for Medicare & Medicaid Services (CMS) (2001). Medicare Program; Changes to theHospital Inpatient Prospective Payment Systems and Fiscal Year 2003 Rates; Proposed Rule.Federal Register, 67(90): 31452.
Centers for Medicare and Medicaid Services, (CMS) (2005). Medicare Program; InpatientRehabilitation Facility Prospective Payment System for FY 2006; Final Rule, Federal Register,70(156): 47884.
Ellis RP and McGuire TG. (1996). Hospital Response to Prospective Payment: Moral Hazard,Selection, and Practice-Style Effects. Journal of Health Economics, 15: 257-277.
Kahn KL, Draper D, Keeler EB, Rogers WH, Rubenstein LV, Kosecoff JB, Sherwood MJ,Reinisch EJ, Carney M, Kamberg CJ, Bentow SS, Wells KB, Allen HM, Reboussin D, Roth CP,Chew CF, Brook RH. (1992). The effects of the DRG-based prospective payment system onquality of care for hospitalized Medicare patients: Final report. R-3931-HCFA, Santa Monica,CA: RAND Corporation.

62
Medicare Payment Advisory Commission (MedPAC). (1998). Health Care Spending and the
Medicare Program: A Data Book. Washington, DC: MedPAC.
Neu CR and Harrison S. (1988). Posthospital Care Before and After the Medicare ProspectivePayment System. R-3590-HCFA, Santa Monica, CA: RAND Corporation.
Newhouse JP. (1989). Do Unprofitable Patients Face Access Problems? Health Care Financing
Review, 11(2): 33-42.
Paddock SM, Carter GM, Wynn BO, Zhou AJ (2005a). Possible Refinements to the Facility-Level Payment Adjustments for the Inpatient Rehabilitation Facility Prospective PaymentSystem. TR-219-CMS, Santa Monica, CA: RAND Corporation.
Paddock SM, Escarce J, Hayden O, Beeuwkes Buntin M. (2005b). Changes in IRF PatientSeverity following Implementation of the IRF PPS. TR-258-CMS, Santa Monica, CA: RANDCorporation.
Relles DA, Ridgeway GK, Carter GM, Beeuwkes Buntin M (2005). Possible Refinements to theConstruction of Function-Related Groups for the Inpatient Rehabilitation Facility ProspectivePayment System. TR-259-CMS, Santa Monica, CA: RAND Corporation.
Stineman MG. (2002). Prospective Payment, Prospective Challenge. Archives of Physical
Medicine and Rehabilitation, 83:1802-1805.
Uniform Data System for Medical Rehabilitation (UDSMR). (1997). The Guide for the UniformData Set for Medical Rehabilitation (Including the FIMTM Instrument), Version 5.1 Buffalo:UDSMR.
White, C. (2003) Rehabilitation Therapy in Skilled Nursing Facilities: Effects of Medicare’sNew Prospective Payment System. Health Affairs 22(3): 214-223.
Yip JY, Wilber KH, Myrtle RC. (2002). The Impact of the 1997 Balanced Budget Amendment’sProspective Payment System on Patient Case Mix and Rehabilitation Utilization in SkilledNursing. The Gerontologist, 42(5): 653-660.