Embed Size (px)
Citation preview
energies
Review
Energy and Climate Policy—An Evaluation of GlobalClimate Change Expenditure 2011–2018
Coilín ÓhAiseadha 1,*, Gerré Quinn 2 , Ronan Connolly 3,4 , Michael Connolly 3
and Willie Soon 4
1 Department of Public Health, Health Service Executive, Dr Steevens’ Hospital, D08 W2A8 Dublin 8, Ireland2 Centre for Molecular Biosciences, Ulster University, Coleraine BT521SA, Northern Ireland, UK;
[email protected] Independent Scientists, Dublin 8, Ireland; [email protected] (R.C.); [email protected] (M.C.)4 Center for Environmental Research and Earth Sciences (CERES), Salem, MA 01970, USA;
[email protected]* Correspondence: [email protected]
Received: 15 August 2020; Accepted: 12 September 2020; Published: 16 September 2020�����������������
Abstract: Concern for climate change is one of the drivers of new, transitional energy policiesoriented towards economic growth and energy security, along with reduced greenhouse gas (GHG)emissions and preservation of biodiversity. Since 2010, the Climate Policy Initiative (CPI) hasbeen publishing annual Global Landscape of Climate Finance reports. According to these reports,US$3660 billion has been spent on global climate change projects over the period 2011–2018. Fifty-fivepercent of this expenditure has gone to wind and solar energy. According to world energy reports,the contribution of wind and solar to world energy consumption has increased from 0.5% to 3% overthis period. Meanwhile, coal, oil, and gas continue to supply 85% of the world’s energy consumption,with hydroelectricity and nuclear providing most of the remainder. With this in mind, we considerthe potential engineering challenges and environmental and socioeconomic impacts of the mainenergy sources (old and new). We find that the literature raises many concerns about the engineeringfeasibility as well as environmental impacts of wind and solar. However, none of the current orproposed energy sources is a “panacea”. Rather, each technology has pros and cons, and policy-makersshould be aware of the cons as well as the pros when making energy policy decisions. We urgepolicy-makers to identify which priorities are most important to them, and which priorities they areprepared to compromise on.
Keywords: climate mitigation; climate adaptation; renewable energy; solar energy; wind energy;biomass; biofuels; e-vehicles; energy poverty; energy justice
1. Introduction
In view of changes to the world climate system since the 1950s, the United Nations’Intergovernmental Panel on Climate Change (IPCC) has concluded that continued emission ofgreenhouse gases (GHG) will cause “further warming and long-lasting changes in all components ofthe climate system, increasing the likelihood of severe, pervasive and irreversible impacts for peopleand ecosystems” (p8, IPCC Synthesis Report (2014)) [1]. This conclusion, along with the conclusions ofthe UN Framework Convention on Climate Change (UNFCCC), has inspired the ongoing efforts of theUN Conference of the Parties (COP) since the 1990s to coordinate international agreements to urgentlyand substantially reduce greenhouse gas emissions, such as the 1996 Kyoto Protocol [2] and the 2015Paris Agreement [3].
Energies 2020, 13, 4839; doi:10.3390/en13184839 www.mdpi.com/journal/energies

Energies 2020, 13, 4839 2 of 49
The efforts that have been invested in achieving agreement on these major international negotiationsare a remarkable testament to international concern and support for these goals. However, greenhousegas emissions have continued to rise [4–6]. A key underlying problem is that most of the rise ingreenhouse gas emissions (chiefly carbon dioxide, CO2) since the 19th century is due to the use of fossilfuel-generated energy (coal, oil, natural gas, and peat), which has driven the Industrial Revolution [7].This cheap and abundant energy has facilitated unprecedented increases in standards of living, averagelifespan, technological advances, agriculture, and world population along with economic growth [7–9].It is clear that, historically, it was a key factor in enabling the development of the current high-incomenations [7–9]. Gupta (2014) noted that this has been a major source of contention between developingand developed nations in international attempts to reduce global greenhouse gas emissions [10].Specifically, if developing nations follow the same well-tested path that nations have historically takento become developed, this would dramatically increase greenhouse gas emissions, and this raises adebate as to whether international treaties to reduce greenhouse gas emissions are implicitly hinderingthe development of developing nations [10].
On the other hand, several researchers and opinion-makers have argued that a “zero-carbon”alternative post-industrial revolution, involving a transition towards wind- and solar-generatedelectricity, along with the widespread electrification of transport systems and improvements in energyefficiency (possibly also including bioenergy) is not only feasible, but desirable, e.g., Gore (2006,2017) [11,12], Jacobson et al. (2011, 2015, 2017, 2018) [13–16], Klein (2015) [17], and Goodall (2016) [18].Although these claims have been disputed in the scientific literature [19–24], they are eagerly promotedby environmental advocacy groups such as Greenpeace [25,26] and protest movements such as“Extinction Rebellion” [27] and “Fridays For Future” [28], achieving strong currency in both mainstreamand social media. This has prompted many political groups and governments to reshape their policyplatforms accordingly [29,30], e.g., in terms of a “Green New Deal” [31–33].
Given the popularity of this framing, it is unsurprising that many people assume that oppositionto these policies arise from ignorance, a lack of concern for the environment, and/or the lobbying ofvested interests calling for business as usual [34–37]. However, much of the opposition is voiced byenvironmentalists and researchers who are concerned about environmental and societal problemsassociated with these policies as well as the lack of critical discussion of the engineering and economicfeasibility of these policies [8,20,26,38–45].
Many criticisms of these “zero-carbon” proposals arise from simple engineering and economicpracticalities. Some have questioned whether the proposed “green technologies” are able to meet theenergy demands of the current population, let alone an increasing population [20,38,41,43,44,46,47].For example, from an evaluation of 24 studies of 100% renewable electricity, Heard et al. (2017) foundthat, “based on our criteria, none of the 100% renewable electricity studies we examined provideda convincing demonstration of feasibility” [21]. A major engineering problem with wind-, solar-,and also tidal-generated electricity is that these are “intermittent” (also called “non-dispatchable” or“variable”) electricity generation technologies. While it has been argued that this can in principle beovercome through a combination of energy storage [48,49] and/or a major continental-scale expansionin the electricity transmission networks [50], others have noted that the scale of these projects isenormous [19,21–24,45]. Many have asked why, if reducing greenhouse gas emissions is to be genuinelyconsidered as the top priority, solutions involving increases in nuclear energy and/or transitioningfrom coal/oil to natural gas are continually dismissed or sidelined [20,21,23,38,39,41–44,51,52]?
Ironically, given that these policies are framed as being environmentally desirable, many of thecriticisms are with their environmental impacts. Many researchers are concerned about the negativeimpacts that “green energies” have on biodiversity [51,53–56]. Some have noted that the transitionto these technologies would require a huge increase in the mining of limited resources [45,57,58],with Mills (2020) arguing that, “Compared with hydrocarbons, green machines entail, on average,a 10-fold increase in the quantities of materials extracted and processed to produce the same amountof energy” [45]. Some note that large-scale wind farms can cause significant local climate change

Energies 2020, 13, 4839 3 of 49
(as distinct from the global climate change from greenhouse gas emissions they are purported to bereducing) [59–66].
Pielke Jr. (2005) notes that there are two approaches to reducing the impacts of future climatechange: (i) “climate mitigation” and (ii) “climate adaptation” [67]. The first approach, “climatemitigation”, assumes that greenhouse gases are the primary driver of climate change and tries to“reduce future climate change” by reducing greenhouse gas emissions. The second approach, “climateadaptation”, involves developing better systems and infrastructure for dealing with climate changeand climate extremes. Pielke Jr. argues that by overemphasizing “climate mitigation”, the UNFCCCand the COP agreements, such as the Kyoto Protocol (and more recently the Paris Agreement), havecreated a bias against investment in climate adaptation. He also notes that climate mitigation policiesexplicitly assume that climate change is primarily driven by greenhouse gas emissions, whereas climateadaptation policies often make sense regardless of the causes of climate change. With that in mind, it isworth noting that several recent studies have argued that the IPCC reports have underestimated therole of natural factors in recent climate change (and hence overestimated the role of human-causedfactors) [68–71].
Furthermore, in this Special Issue of Energies, Connolly et al. (2020) have noted that, evenassuming climate change is primarily due to human-caused greenhouse gas emissions, the amount ofglobal warming expected under business-as-usual policies is heavily determined by a metric called the“climate sensitivity” [6]. The exact value of this metric is the subject of considerable ongoing scientificdebate, but Connolly et al. calculated that, if the value is at the higher end of the IPCC’s range ofestimates, then we can expect that the Paris Agreement’s stated goal of keeping human-caused globalwarming below 2 ◦C will be broken under business as usual by the mid-21st century, whereas, if theclimate sensitivity is at the lower end of the IPCC’s estimates, then the Paris Agreement will not bebroken under business-as-usual until at least the 22nd century. In other words, they showed that thescientific community has still not satisfactorily resolved whether reducing greenhouse gas emissionsis a problem for this century or the next. This has implications for establishing exactly how urgentthe proposed transitions to “low-carbon” policies are. This is important because, notwithstandingconcern over the climate change which the associated greenhouse gas emissions might be causing,the existing fossil fuel-driven energy policies have many benefits [8,9]. Indeed, it is worth noting thatthe main greenhouse gas of concern, carbon dioxide (CO2), is a key component of all carbon-based life,i.e., all known life, and that increasing atmospheric carbon dioxide concentrations have contributed toa partial “greening of the Earth”, i.e., increased plant growth over the last few decades [9,72].
In light of the above criticisms, the reader may wonder whether the current proposed “zero-carbon”energy transition policies based predominantly on wind- and solar-generated electricity are trulythe panacea that promoters of these technologies indicate [11–18,25,27,28]. This is a key questionwhich we aim to address in this review paper. We hope that, by the end of this review, the reader willappreciate that none of the current energy and electricity sources used by society are a “panacea”.Rather, each technology has its pros and cons, and policy-makers should be aware of the cons as wellas the pros when making energy policy decisions. We urge policy-makers to identify which prioritiesare most important to them, and which priorities they are prepared to compromise on. Sovacool andSaunders (2014) [73] provide a useful framework for this by comparing and contrasting five differentenergy security policy packages. They found that all five packages have advantages and disadvantages,and that “energy security is not an absolute state, and that achieving it only ‘works’ by prioritizingsome dimensions, or policy goals and packages, more than others” [73].
We argue that a key part of this process is recognition of the engineering, environmental,and socioeconomic problems associated with each technology. We stress that the purpose of thisreview is not to advocate for any particular energy technology, but rather to provide the readerwith a greater awareness of the pros and cons of each of the main technologies and energy policiesthat are currently being promoted. In order to identify these key energy technologies and policies,we have taken advantage of the detailed analysis carried out by the Climate Policy Initiative (https:
Energies 2020, 13, 4839 4 of 49
//www.climatepolicyinitiative.org/) in a series of annual/biennial “Global Landscape of Climate Finance”reports which have estimated the breakdown of the total global climate change expenditure for eachyear from 2010/2011 [74] to 2018 [75].
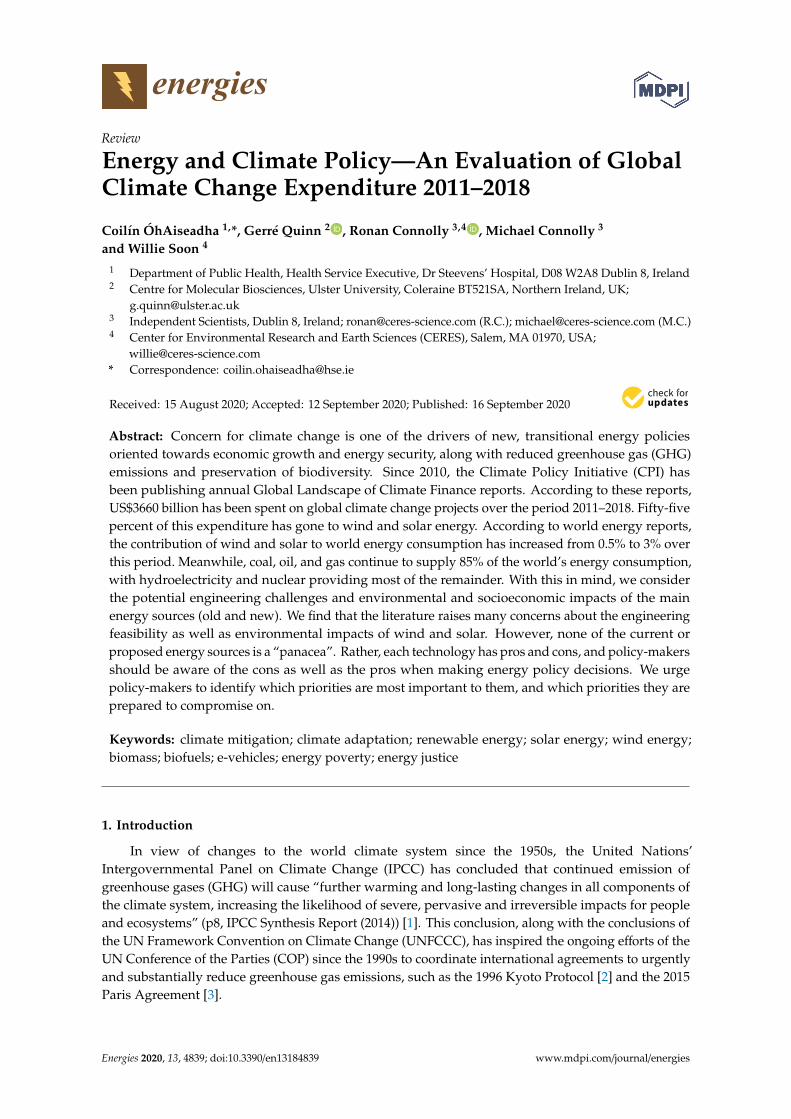
We have compiled the data for each year from these reports in Figure 1 and Table 1. We note thatthe Climate Policy Initiative also carried out an estimate for 2009/2010 in an early report [76], but theauthors advise that they significantly modified their methodology for subsequent reports, and sowe have not included these earlier estimates in our analysis. According to its website, the ClimatePolicy Initiative is a climate policy think tank that “was founded in 2009 to support nations buildinglow-carbon economies to develop and implement effective climate, energy, and land use policies”.In their reports, they explicitly acknowledge that their calculations likely underestimate the annualglobal expenditure, “due to methodological issues related to data coverage and data limitations,particularly domestic government expenditures on climate finance and private investments in energyefficiency, transport, land use, and adaptation” (Buchner et al. 2019, p8) [75]. Nonetheless, they appearto offer the most comprehensive estimates available at the time of writing. Therefore, we believe theyoffer a useful relative breakdown of global climate change expenditure over the period 2011–2018.
Table 1. Breakdown of global climate change expenditure during 2011–2018. Data from the ClimatePolicy Initiative’s Global Landscape of Climate Finance annual and biennial reports, accessed fromhttps://climatepolicyinitiative.org/.
Sector Total Expenditure,2011–2018 (8-Year Period)
Average AnnualExpenditure
Percentage of TotalExpenditure
Solar US$ 1220 billion US$ 152 billion 33%Wind US$ 810 billion US$ 101 billion 22%
Biomass & waste * US$ 75 billion US$ 9 billion 2%Hydroelectricity * US$ 75 billion US$ 9 billion 2%
Biofuels * US$ 25 billion US$ 3 billion 1%All other renewables * US$ 170 billion US$ 21 billion 5%
Sustainable transport US$ 375 billion US$ 47 billion 10%Energy efficiency US$ 250 billion US$ 31 billion 7%
Other climate mitigationpolicies US$ 430 billion US$ 54 billion 12%
Climate adaptation policies US$ 190 billion US$ 24 billion 5%
Dual benefits US$ 40 billion US$ 5 billion 1%
Total US$ 3660 billion US$ 458 billion 100%
* As solar and wind comprise the bulk of total renewables, the breakdown of “other renewables” is not given in allreports, so we estimated the items marked using figures provided in the 2012 and 2013 reports.
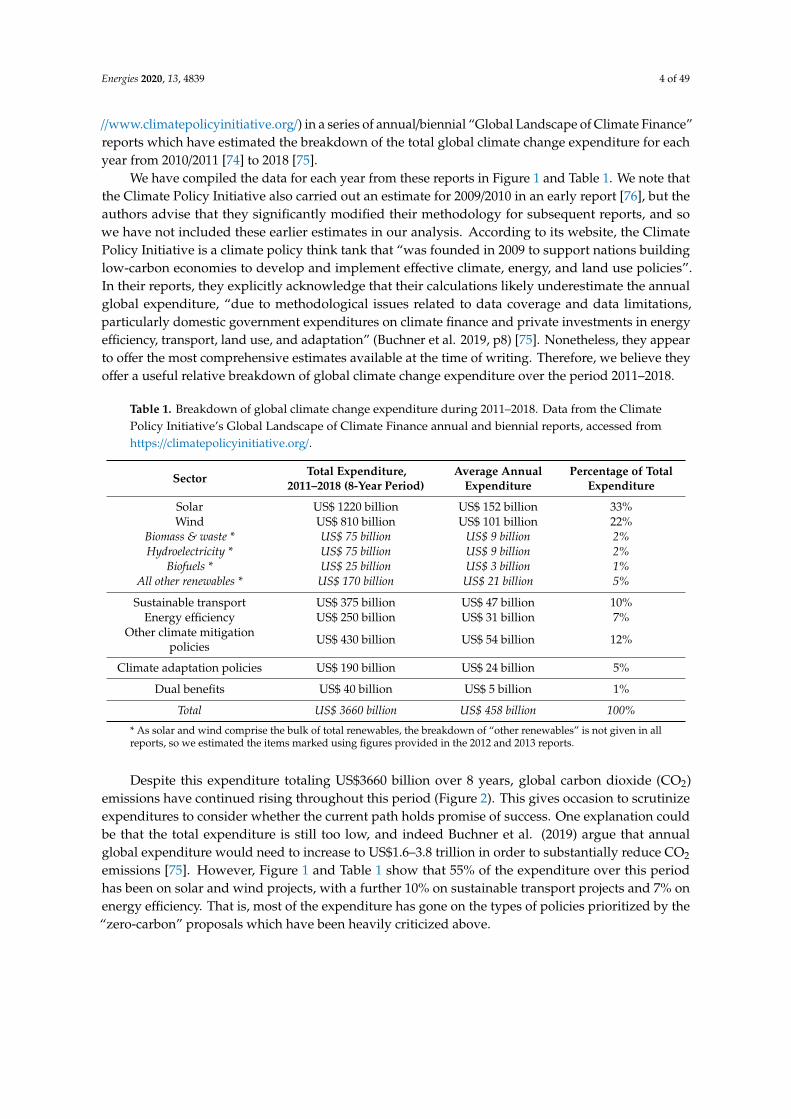
Despite this expenditure totaling US$3660 billion over 8 years, global carbon dioxide (CO2)emissions have continued rising throughout this period (Figure 2). This gives occasion to scrutinizeexpenditures to consider whether the current path holds promise of success. One explanation couldbe that the total expenditure is still too low, and indeed Buchner et al. (2019) argue that annualglobal expenditure would need to increase to US$1.6–3.8 trillion in order to substantially reduce CO2
emissions [75]. However, Figure 1 and Table 1 show that 55% of the expenditure over this periodhas been on solar and wind projects, with a further 10% on sustainable transport projects and 7% onenergy efficiency. That is, most of the expenditure has gone on the types of policies prioritized by the“zero-carbon” proposals which have been heavily criticized above.

Energies 2020, 13, 4839 5 of 49
Energies 2020, 13, x FOR PEER REVIEW 5 of 50
Figure 1. Breakdown of total global climate change expenditure over the period 2011–2018. Data from the Climate Policy Initiative’s Global Landscape of Climate Finance reports, accessed from https://climatepolicyinitiative.org/, as detailed in Table 1.
With that in mind, we propose to first describe the world’s current energy usage (Section 2). Then, we will consider some of the key engineering challenges associated with both the proposed energy transitions and current energy policies (Section 3). In Section 4, we will consider some of the key environmental concerns associated with these policies, while in Section 5 we consider some important socioeconomic concerns. In Section 6, we summarize the pros and cons of all the main energy sources—both those considered in Figure 1 and Table 1, and those not. In Section 7, we offer some recommendations for how to interpret these conflicting pros and cons.
Figure 1. Breakdown of total global climate change expenditure over the period 2011–2018. Datafrom the Climate Policy Initiative’s Global Landscape of Climate Finance reports, accessed fromhttps://climatepolicyinitiative.org/, as detailed in Table 1.
With that in mind, we propose to first describe the world’s current energy usage (Section 2).Then, we will consider some of the key engineering challenges associated with both the proposedenergy transitions and current energy policies (Section 3). In Section 4, we will consider some ofthe key environmental concerns associated with these policies, while in Section 5 we consider someimportant socioeconomic concerns. In Section 6, we summarize the pros and cons of all the mainenergy sources—both those considered in Figure 1 and Table 1, and those not. In Section 7, we offersome recommendations for how to interpret these conflicting pros and cons.
Energies 2020, 13, 4839 6 of 49
Energies 2020, 13, x FOR PEER REVIEW 6 of 50
Figure 2. Historic trends in global CO2 emissions and global climate change expenditure over the 2011–2018 period. (a) Expenditure figures are as in Figure 1. Data from the Climate Policy Initiative’s Global Landscape of Climate Finance annual and biennial reports, accessed from https://climatepolicyinitiative.org/. (b) Global CO2 emissions. Data from Boden et al. (2018) [4], https://energy.appstate.edu/CDIAC, updated to 2018 by Friedlingstein et al. (2019) [5], https://www.globalcarbonproject.org/.
2. Current Energy Policies
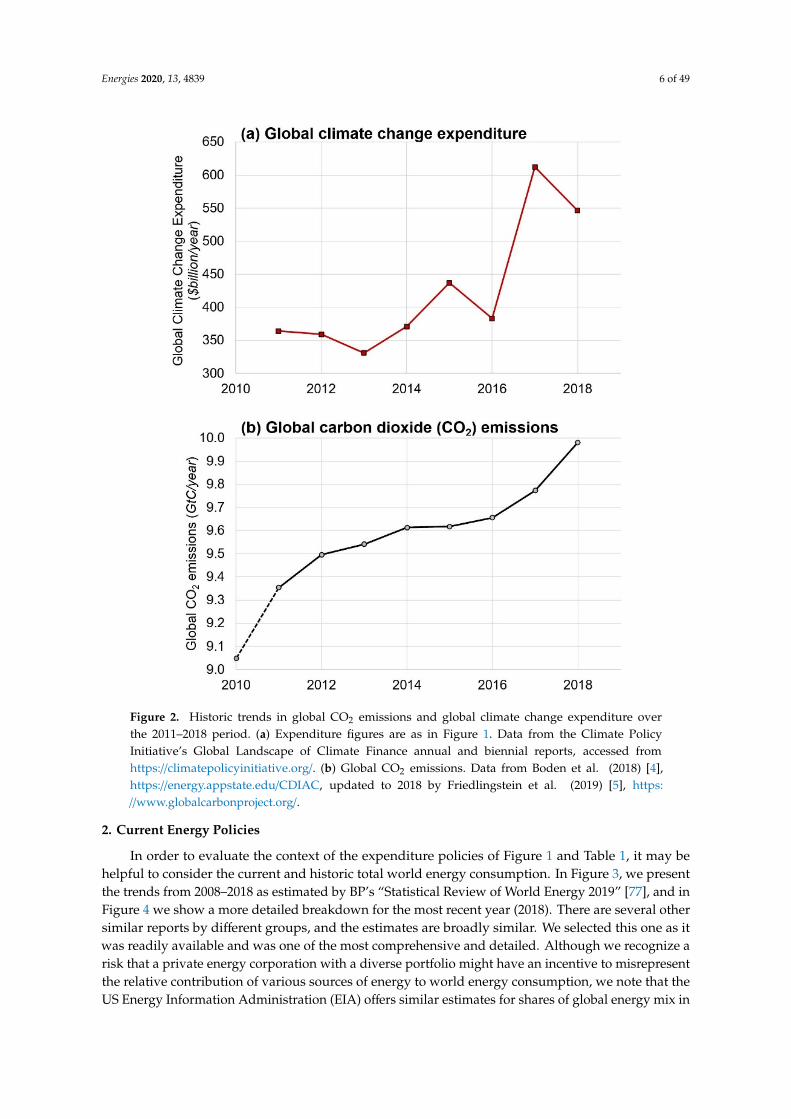
In order to evaluate the context of the expenditure policies of Figure 1 and Table 1, it may be helpful to consider the current and historic total world energy consumption. In Figure 3, we present the trends from 2008–2018 as estimated by BP’s “Statistical Review of World Energy 2019” [77], and in Figure 4 we show a more detailed breakdown for the most recent year (2018). There are several other similar reports by different groups, and the estimates are broadly similar. We selected this one as it was readily available and was one of the most comprehensive and detailed. Although we recognize a risk that a private energy corporation with a diverse portfolio might have an incentive to misrepresent the relative contribution of various sources of energy to world energy consumption, we note that the US Energy Information Administration (EIA) offers similar estimates for shares of global energy mix in 2018: fossil fuels 80.4%, renewables 15.4%, and nuclear 4.2% [78]. For a comparison of the BP reports to the other world energy reports, see Newell et al. (2019) [79].
Figure 2. Historic trends in global CO2 emissions and global climate change expenditure overthe 2011–2018 period. (a) Expenditure figures are as in Figure 1. Data from the Climate PolicyInitiative’s Global Landscape of Climate Finance annual and biennial reports, accessed fromhttps://climatepolicyinitiative.org/. (b) Global CO2 emissions. Data from Boden et al. (2018) [4],https://energy.appstate.edu/CDIAC, updated to 2018 by Friedlingstein et al. (2019) [5], https://www.globalcarbonproject.org/.
2. Current Energy Policies
In order to evaluate the context of the expenditure policies of Figure 1 and Table 1, it may behelpful to consider the current and historic total world energy consumption. In Figure 3, we presentthe trends from 2008–2018 as estimated by BP’s “Statistical Review of World Energy 2019” [77], and inFigure 4 we show a more detailed breakdown for the most recent year (2018). There are several othersimilar reports by different groups, and the estimates are broadly similar. We selected this one as itwas readily available and was one of the most comprehensive and detailed. Although we recognize arisk that a private energy corporation with a diverse portfolio might have an incentive to misrepresentthe relative contribution of various sources of energy to world energy consumption, we note that theUS Energy Information Administration (EIA) offers similar estimates for shares of global energy mix in
Energies 2020, 13, 4839 7 of 49
2018: fossil fuels 80.4%, renewables 15.4%, and nuclear 4.2% [78]. For a comparison of the BP reportsto the other world energy reports, see Newell et al. (2019) [79].
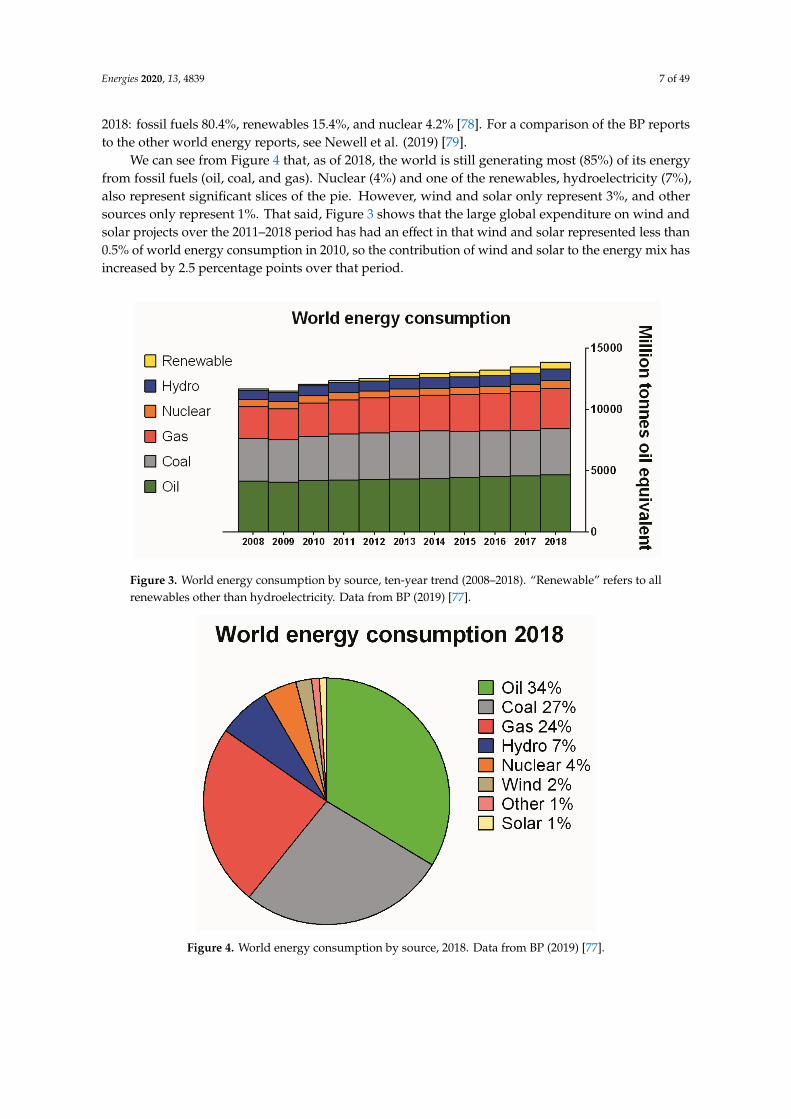
We can see from Figure 4 that, as of 2018, the world is still generating most (85%) of its energyfrom fossil fuels (oil, coal, and gas). Nuclear (4%) and one of the renewables, hydroelectricity (7%),also represent significant slices of the pie. However, wind and solar only represent 3%, and othersources only represent 1%. That said, Figure 3 shows that the large global expenditure on wind andsolar projects over the 2011–2018 period has had an effect in that wind and solar represented less than0.5% of world energy consumption in 2010, so the contribution of wind and solar to the energy mix hasincreased by 2.5 percentage points over that period.
Energies 2020, 13, x FOR PEER REVIEW 7 of 50
We can see from Figure 4 that, as of 2018, the world is still generating most (85%) of its energy from fossil fuels (oil, coal, and gas). Nuclear (4%) and one of the renewables, hydroelectricity (7%), also represent significant slices of the pie. However, wind and solar only represent 3%, and other sources only represent 1%. That said, Figure 3 shows that the large global expenditure on wind and solar projects over the 2011–2018 period has had an effect in that wind and solar represented less than 0.5% of world energy consumption in 2010, so the contribution of wind and solar to the energy mix has increased by 2.5 percentage points over that period.
Figure 3. World energy consumption by source, ten-year trend (2008–2018). “Renewable” refers to all renewables other than hydroelectricity. Data from BP (2019) [77].
Figure 4. World energy consumption by source, 2018. Data from BP (2019) [77].
3. Engineering Challenges of the Various Energy Technologies
3.1. The Intermittency Problem (of Wind, Solar, and Tidal-Generated Electricity)
Historically, national electricity grids have been almost exclusively powered by “baseload” electricity producers (sometimes called “dispatchable”). While demand for electricity tends to fluctuate at various time scales, mains suppliers are required to provide a steady supply of electricity
Figure 3. World energy consumption by source, ten-year trend (2008–2018). “Renewable” refers to allrenewables other than hydroelectricity. Data from BP (2019) [77].
Energies 2020, 13, x FOR PEER REVIEW 7 of 50
We can see from Figure 4 that, as of 2018, the world is still generating most (85%) of its energy from fossil fuels (oil, coal, and gas). Nuclear (4%) and one of the renewables, hydroelectricity (7%), also represent significant slices of the pie. However, wind and solar only represent 3%, and other sources only represent 1%. That said, Figure 3 shows that the large global expenditure on wind and solar projects over the 2011–2018 period has had an effect in that wind and solar represented less than 0.5% of world energy consumption in 2010, so the contribution of wind and solar to the energy mix has increased by 2.5 percentage points over that period.
Figure 3. World energy consumption by source, ten-year trend (2008–2018). “Renewable” refers to all renewables other than hydroelectricity. Data from BP (2019) [77].
Figure 4. World energy consumption by source, 2018. Data from BP (2019) [77].
3. Engineering Challenges of the Various Energy Technologies
3.1. The Intermittency Problem (of Wind, Solar, and Tidal-Generated Electricity)
Historically, national electricity grids have been almost exclusively powered by “baseload” electricity producers (sometimes called “dispatchable”). While demand for electricity tends to fluctuate at various time scales, mains suppliers are required to provide a steady supply of electricity
Figure 4. World energy consumption by source, 2018. Data from BP (2019) [77].

Energies 2020, 13, 4839 8 of 49
3. Engineering Challenges of the Various Energy Technologies
3.1. The Intermittency Problem (of Wind, Solar, and Tidal-Generated Electricity)
Historically, national electricity grids have been almost exclusively powered by “baseload”electricity producers (sometimes called “dispatchable”). While demand for electricity tends to fluctuateat various time scales, mains suppliers are required to provide a steady supply of electricity to meet‘baseload’ power needs, defined as “minimum demands based on reasonable expectations of customerrequirements” [80]. The following are the most common baseload electricity generation technologies:coal, natural gas, oil, peat, nuclear, hydropower, geothermal, and biomass. As can be seen fromFigure 4, these energy sources currently account for more than 96% of the world’s energy.
On the other hand, as discussed in the introduction, many of the current proposed energy transitionsare heavily reliant on some combination of three “intermittent” (sometimes called “non-dispatchable”)electricity generation technologies, i.e., wind, solar, and tidal. Some have even claimed that it ispossible (and desirable) to provide 100% of society’s energy needs using only renewable energy basedmostly on wind and solar [11–18,25–28,32]. Indeed, Jacobson et al. [13–16] advocate for a transitionto energy systems that generate 100% of their electricity from wind, water, and sunlight (WWS), i.e.,wind and solar supplemented with tidal and hydro. From Figure 1 and Table 1, we can see that 55%of the total global climate change expenditure over the period 2011–2018 has been spent on two ofthese technologies, i.e., solar and wind. Therefore, it is worth considering the implications of “theintermittency problem”. We stress that this is not a problem which has applied in the past to electricitygrids using exclusively dispatchable power stations.
In contrast to the steady or on-demand production of baseload power stations, the intermittenttechnologies only provide energy on an intermittent basis, i.e., only when the wind blows (for wind) oronly when the sun shines (for solar) or depending on the tides (for tidal). However, the consumptionof electricity by the consumers does not follow these production times. This leads to mismatchesbetween the supply and demand of electricity that become increasingly problematic the greater theamount of intermittent electricity generators connected to the grid. At some times, too much electricityis generated and needs to be “curtailed”, i.e., dumped or diminished, while at other times too little isgenerated, leading to blackouts.
A steady supply of energy on a 24-h basis is indispensable to the safe and reliable operationof systems such as water treatment plants, hospitals, domestic heating/air-conditioning systems,manufacturing plants, and mass transit systems. In addition, ready availability of energy is aprerequisite for the operation of emergency services, e.g., medical resuscitation equipment. From theperspective of the householder, reliable energy is necessary to keep a refrigerator running round theclock, and it must be available at the flick of a switch to provide lighting as needed at any time of night.Without it, the householder is likely to suffer food wastage from refrigeration failures, accidents forwant of light, and loss of temperature control due to failure of heating or air-conditioning [81].
Peak electricity demand is subject to a range of uncertainties, including population growth,changing technologies, economic conditions, prevailing weather conditions, and random variationin individual usage. It also follows patterns of variation by time of day, day of the week, season ofthe year, and public holidays [82]. The pattern of electricity use in an individual household is highlydependent upon the activities of the occupants and their associated use of electrical appliances [83].Figure 5 illustrates the variations in energy consumption for an individual household by time of day ornight. Note in particular the very low consumption by night, with occasional spikes as appliances areturned on for short periods, and generally higher consumption during the day, with brief spikes ofeven higher consumption at irregular intervals. Although these demand patterns are quite noisy on anindividual basis, when averaged over an entire country, the national demand is relatively predictable.

Energies 2020, 13, 4839 9 of 49Energies 2020, 13, x FOR PEER REVIEW 9 of 50
Figure 5. Sample measured daily demand profile for domestic electricity, in one-minute intervals, from a dwelling in the East Midlands, UK. (Adapted from Figure 5 of Richardson et al. (2010) [83]).
For example, the blue curve in Figure 6 shows weekly and seasonal variation in electricity demand in the Republic of Ireland throughout a full year (2013). Note the regular pattern of high demand on weekdays and lower demand at the weekend, with seasonal variation imposed over this. Minimum demand was approximately 2500 MW in summer and approximately 3000 MW in the winter months of 2013. Compare this with the red curve in Figure 6 which shows the fluctuating character of wind energy generation in the Republic of Ireland for the same year (2013). Wind turbines produced more than 1000 MW on 14% of the days and less than 100 MW on 10% of the days. Note in particular, the low levels of electricity generated in the last week of February, the second week of July and the last few days of November.
Figure 6. Annual variation in daily electricity demand (blue) and electricity generated by wind (red) Republic of Ireland, 2013. (Data from: time series downloaded from http://www.eirgrid.com/ in January 2014.).
Solar power is a bit more predictable in that most of the intermittency occurs from the day/night cycle, although variability in cloud cover creates an additional chaotic component. However, for mid-to-high latitudes, a major problem arises because of the seasonal changes in total sunlight between winter and summer. For instance, as can be seen from Figure 7, the available solar energy in Ireland varies by a factor of ten between December (0.46 kWh/day) and June (4.66 kWh/day). Furthermore, the length of day in December (~8 h) is only half that in June (~16 h).
In addition to the variability at the scale of days and weeks, outlined above, local climates also vary from year-to-year, and climate change can introduce long-term climatic trends which could alter the expected electricity generation even further.
Figure 5. Sample measured daily demand profile for domestic electricity, in one-minute intervals, froma dwelling in the East Midlands, UK. (Adapted from Figure 5 of Richardson et al. (2010) [83]).
For example, the blue curve in Figure 6 shows weekly and seasonal variation in electricity demandin the Republic of Ireland throughout a full year (2013). Note the regular pattern of high demand onweekdays and lower demand at the weekend, with seasonal variation imposed over this. Minimumdemand was approximately 2500 MW in summer and approximately 3000 MW in the winter monthsof 2013. Compare this with the red curve in Figure 6 which shows the fluctuating character of windenergy generation in the Republic of Ireland for the same year (2013). Wind turbines produced morethan 1000 MW on 14% of the days and less than 100 MW on 10% of the days. Note in particular, the lowlevels of electricity generated in the last week of February, the second week of July and the last fewdays of November.
Energies 2020, 13, x FOR PEER REVIEW 9 of 50
Figure 5. Sample measured daily demand profile for domestic electricity, in one-minute intervals, from a dwelling in the East Midlands, UK. (Adapted from Figure 5 of Richardson et al. (2010) [83]).
For example, the blue curve in Figure 6 shows weekly and seasonal variation in electricity demand in the Republic of Ireland throughout a full year (2013). Note the regular pattern of high demand on weekdays and lower demand at the weekend, with seasonal variation imposed over this. Minimum demand was approximately 2500 MW in summer and approximately 3000 MW in the winter months of 2013. Compare this with the red curve in Figure 6 which shows the fluctuating character of wind energy generation in the Republic of Ireland for the same year (2013). Wind turbines produced more than 1000 MW on 14% of the days and less than 100 MW on 10% of the days. Note in particular, the low levels of electricity generated in the last week of February, the second week of July and the last few days of November.
Figure 6. Annual variation in daily electricity demand (blue) and electricity generated by wind (red) Republic of Ireland, 2013. (Data from: time series downloaded from http://www.eirgrid.com/ in January 2014.).
Solar power is a bit more predictable in that most of the intermittency occurs from the day/night cycle, although variability in cloud cover creates an additional chaotic component. However, for mid-to-high latitudes, a major problem arises because of the seasonal changes in total sunlight between winter and summer. For instance, as can be seen from Figure 7, the available solar energy in Ireland varies by a factor of ten between December (0.46 kWh/day) and June (4.66 kWh/day). Furthermore, the length of day in December (~8 h) is only half that in June (~16 h).
In addition to the variability at the scale of days and weeks, outlined above, local climates also vary from year-to-year, and climate change can introduce long-term climatic trends which could alter the expected electricity generation even further.
Figure 6. Annual variation in daily electricity demand (blue) and electricity generated by wind (red) Republicof Ireland, 2013. (Data from: time series downloaded from http://www.eirgrid.com/ in January 2014.).
Solar power is a bit more predictable in that most of the intermittency occurs from theday/night cycle, although variability in cloud cover creates an additional chaotic component. However,for mid-to-high latitudes, a major problem arises because of the seasonal changes in total sunlightbetween winter and summer. For instance, as can be seen from Figure 7, the available solar energyin Ireland varies by a factor of ten between December (0.46 kWh/day) and June (4.66 kWh/day).Furthermore, the length of day in December (~8 h) is only half that in June (~16 h).
In addition to the variability at the scale of days and weeks, outlined above, local climates alsovary from year-to-year, and climate change can introduce long-term climatic trends which could alterthe expected electricity generation even further.

Energies 2020, 13, 4839 10 of 49Energies 2020, 13, x FOR PEER REVIEW 10 of 50
Figure 7. Monthly mean daily solar radiation per m2 on a horizontal surface at Dublin Airport, 1976–1984 (Adapted from Table 36 of Rohan (1986).) [84].
When the percentage of intermittent electricity is relatively low, the remaining baseload generators can reduce some of the problem by ramping up or down production in response to the intermittency. However, this raises several problems. First, the electricity grid now requires a much higher total capacity because it still needs to have near 100% capacity as before in order to be on standby to provide electricity when the intermittent generators are not in operation. Moreover, the need to switch back and forth is very wasteful (as well as reducing energy efficiency). Carnegie et al. (2013) note that balancing electricity generation and load using traditional baseload power plants (fossil fuel, hydroelectric, and nuclear) can be “costly in terms of capital life expectancy and operational inefficiencies. Frequent adjustment of generation output increases the wear and tear on generators, reduces their expected lifetimes and increases maintenance expenses. This operational scheme also results in both cost and productivity inefficiencies” [85]. Meanwhile, if a gas turbine is designed for baseload power generation but subsequently used for load balancing in conjunction with intermittent energy sources, the constant acceleration and deceleration of the shaft severely shortens the lifespan of the turbine [20].
Various solutions have been proposed to solve the problem of intermittency. A utility company can attempt to balance power supply from intermittent sources over very large areas by constructing an extended transmission network and coordinating energy production from the different sources, e.g., solar and wind installations, but this requires significant capital investment [50]. This approach increases the minimum capacity needed and can give rise to “bottlenecks”, i.e., delays in energy transmission to large centers of demand, often distant from sites of energy generation [80]. Moreover, weather patterns tend to affect quite large geographic areas at similar times, e.g., if it is unusually windy or calm in France, it is likely to be the same in Germany. Other options include “demand-side management, electricity storage, and enhanced coordination or forecasting of power plants” [80].
Some researchers have argued that, in principle, the intermittency problem could be reduced through energy storage [48,49]. That is, when a wind farm or solar farm is producing too much for demand, it could store the excess electricity using some form of energy storage technology. Then, when demand increases above supply, this stored energy could be returned. However, others have pointed out that the storage capacity required would be unrealistically enormous, and satisfactory resolutions to this problem have not yet been demonstrated with available technologies [19,21–24,45].
For instance, van Kooten et al. (2020) note that, although Tesla have recently “built what is considered to be a gigantic, 100-MW (MW)/129-MW-hour (MWh) capacity battery in South Australia to address blackouts resulting from renewable energy intermittency” [24], they calculate that, if the state of Alberta (Canada) were to rely solely on intermittent electricity sources for
Figure 7. Monthly mean daily solar radiation per m2 on a horizontal surface at Dublin Airport,1976–1984 (Adapted from Table 36 of Rohan (1986).) [84].
When the percentage of intermittent electricity is relatively low, the remaining baseload generatorscan reduce some of the problem by ramping up or down production in response to the intermittency.However, this raises several problems. First, the electricity grid now requires a much higher totalcapacity because it still needs to have near 100% capacity as before in order to be on standby to provideelectricity when the intermittent generators are not in operation. Moreover, the need to switch back andforth is very wasteful (as well as reducing energy efficiency). Carnegie et al. (2013) note that balancingelectricity generation and load using traditional baseload power plants (fossil fuel, hydroelectric,and nuclear) can be “costly in terms of capital life expectancy and operational inefficiencies. Frequentadjustment of generation output increases the wear and tear on generators, reduces their expectedlifetimes and increases maintenance expenses. This operational scheme also results in both cost andproductivity inefficiencies” [85]. Meanwhile, if a gas turbine is designed for baseload power generationbut subsequently used for load balancing in conjunction with intermittent energy sources, the constantacceleration and deceleration of the shaft severely shortens the lifespan of the turbine [20].
Various solutions have been proposed to solve the problem of intermittency. A utility companycan attempt to balance power supply from intermittent sources over very large areas by constructingan extended transmission network and coordinating energy production from the different sources,e.g., solar and wind installations, but this requires significant capital investment [50]. This approachincreases the minimum capacity needed and can give rise to “bottlenecks”, i.e., delays in energytransmission to large centers of demand, often distant from sites of energy generation [80]. Moreover,weather patterns tend to affect quite large geographic areas at similar times, e.g., if it is unusuallywindy or calm in France, it is likely to be the same in Germany. Other options include “demand-sidemanagement, electricity storage, and enhanced coordination or forecasting of power plants” [80].
Some researchers have argued that, in principle, the intermittency problem could be reducedthrough energy storage [48,49]. That is, when a wind farm or solar farm is producing too much fordemand, it could store the excess electricity using some form of energy storage technology. Then, whendemand increases above supply, this stored energy could be returned. However, others have pointedout that the storage capacity required would be unrealistically enormous, and satisfactory resolutionsto this problem have not yet been demonstrated with available technologies [19,21–24,45].
For instance, van Kooten et al. (2020) note that, although Tesla have recently “built what isconsidered to be a gigantic, 100-MW (MW)/129-MW-hour (MWh) capacity battery in South Australiato address blackouts resulting from renewable energy intermittency” [24], they calculate that, if thestate of Alberta (Canada) were to rely solely on intermittent electricity sources for generating electricity,it would need the equivalent of 100 such batteries. Shaner et al. (2018) calculated that even to meetthe lesser target of 80% wind/solar for the United States would require enormous and unprecedented

Energies 2020, 13, 4839 11 of 49
infrastructural investments. The exact requirements would depend on whether the grid was mostlywind or mostly solar. For a solar-heavy grid, enough energy storage would be required to overcome thedaily solar cycle, i.e., 12 h worth of energy storage (~5.4 TW h). For a wind-heavy grid, it would requirea continental-scale electricity transmission network “to exploit the geographic diversity of wind” [22].They further calculated that, “to reliably meet 100% of total annual electricity demand, seasonalcycles and unpredictable weather events require several weeks’ worth of energy storage and/or theinstallation of much more capacity of solar and wind power than is routinely necessary to meet peakdemand [ . . . ] Today this would be very costly” [22]. More generally, Heard et al. (2017) criticize the“near-total lack of historical evidence for the technical feasibility of 100% renewable-electricity systemsoperating at regional or larger scales. The only industrialized nation today with electricity from 100%renewable sources is Iceland, thanks to a unique endowment of shallow geothermal aquifers, abundanthydropower, and a population of only 0.3 million people” [21].
3.2. The Power Density Problem
In comparing energy options, it is useful to calculate how much land is required for each energytechnology and how much energy this can supply. This calculation is known as the power densityand is defined as the energy generation rate per time per unit ground area (expressed as W/m2).Smil (2005) points out that the proposed energy transition to renewables calls for “an order of magnitudelarger displacement of dominant resources than during the last major energy transition” [86], i.e.,the transition from burning biomass to fossil fuels. The inherently low efficiency of photosynthesismeans that biomass harvests do not surpass 1 W/m2, while most fossil fuel extraction proceeds at ratesexceeding 1000 W/m2. Replacing crude oil-derived fuels by less energy-dense biofuels would alsorequire commonly 1000-fold and often 10,000-fold larger areas under crops than the land claimed byoilfield infrastructures.
Figure 8 compares the average power densities for most of the main energy sources as estimatedby Zalk et al. (2018) [87]. It can be seen that the power densities of nonrenewable energy (non-RE)sources are up to three orders of magnitude greater than those of renewable energy (RE) sources.In other words, they produce about a thousand times as much power for any given land surface area.Natural gas yields the highest median power density by far. Of the renewable energy sources, solarenergy yields the highest median power density, but is still orders of magnitude lower than eithernuclear or the fossil fuels. However, the lowest of all nine of the technologies is biomass.
In Section 4.4, we will discuss the negative implications of the increased reliance on low powerdensity sources (particularly biomass/biofuels) have for biodiversity, including increases in deforestationrates. Moreover, in Section 5, we will discuss some of the associated negative socioeconomic effects.However, in this subsection, we stress the simple logistical problems that this implies from anengineering perspective. Indeed, arguably, this is the most challenging of the engineering problemswe discuss in this paper in terms of a proposed energy transition from a society that currently gets 89%of its energy from fossil fuels and nuclear (85% from fossil fuels alone) to one that relies mostly on therenewable energy sources (see Figures 3 and 4). It is true that before the Industrial Revolution, societyderived most of its energy from low power density renewable technologies similar to those in Figure 8(much of the energy usage came from human or animal labor, indirectly fueled by biomass, i.e., food).However, the world’s population in 1800 was only ~1 billion compared to ~7.8 billion today, and mostof those ~7.8 billion people would probably not be satisfied with a return to pre-industrial standards ofliving [7–9].
Therefore, as high power density energy sources are replaced with low power density energysources, the land area required to be set aside for energy production dramatically increases. As a result,the average energy footprint per capita (and as will be discussed in Section 4.4, the correspondingecological footprint) [88] will rise accordingly. This should be particularly concerning for thosewho believe we are currently “overpopulated” (see Section 3.3.1). It should also be concerning toreaders who believe that societies in developing nations that currently have very low energy footprints

Energies 2020, 13, 4839 12 of 49
(including the ~1 billion people without access to electricity) should be encouraged to increase theirenergy footprint (see Section 5).
Energies 2020, 13, x FOR PEER REVIEW 12 of 50
concerning to readers who believe that societies in developing nations that currently have very low energy footprints (including the ~1 billion people without access to electricity) should be encouraged to increase their energy footprint (see Section 5).
Figure 8. Power densities for most of the main electricity generation sources. Hatched areas indicate values between minimum and maximum estimates. (Adapted from van Zalk (2018) [87] 3.3. The limited resources problem.).
3.3.1. The Neo-Malthusian Debate; “Sustainable” Versus “Renewable”
Malthus (1798) warned that the growth in the world’s population (then ~1 billion) would quickly lead to catastrophic consequences as he argued that food production could not keep pace with population growth. He concluded that unless birth rates decreased significantly and urgently this would lead to famine and devastation [89]. Although the population is currently ~7.8 billion, more than two centuries later, suggesting that his predictions were badly flawed, his logic was compelling to many at the time.
Equivalent logic has led many researchers to make updated predictions along similar lines over the years since [90–92]. Essentially, the logic suggests that, all else being equal, if per capita consumption of some limited resource is constant or increasing, but the population continues to increase, at some point demand will outstrip supply. If society is reliant on this resource, this could potentially have devastating effects. Analogies with the human population are sometimes made with ecological systems that go through boom/bust cycles, e.g., bacterial growth on a Petri dish with nutrient agar can be rapid until all of the nutrients are consumed, at which stage the colony can completely collapse [90,92]. Due to the similarity of the logic to that underlying Malthus’ predictions, this is often referred to as the “neo-Malthusian argument”.
Intuitively, the logic behind the neo-Malthusian argument is initially compelling. However, critics invariably point to the fact that, empirically, the observed trends are often contrary to the
Figure 8. Power densities for most of the main electricity generation sources. Hatched areas indicatevalues between minimum and maximum estimates. (Adapted from van Zalk (2018) [87]).
3.3. The Limited Resources Problem
3.3.1. The Neo-Malthusian Debate; “Sustainable” Versus “Renewable”
Malthus (1798) warned that the growth in the world’s population (then ~1 billion) would quicklylead to catastrophic consequences as he argued that food production could not keep pace withpopulation growth. He concluded that unless birth rates decreased significantly and urgently thiswould lead to famine and devastation [89]. Although the population is currently ~7.8 billion, more thantwo centuries later, suggesting that his predictions were badly flawed, his logic was compelling tomany at the time.
Equivalent logic has led many researchers to make updated predictions along similar lines over theyears since [90–92]. Essentially, the logic suggests that, all else being equal, if per capita consumptionof some limited resource is constant or increasing, but the population continues to increase, at somepoint demand will outstrip supply. If society is reliant on this resource, this could potentially havedevastating effects. Analogies with the human population are sometimes made with ecological systemsthat go through boom/bust cycles, e.g., bacterial growth on a Petri dish with nutrient agar can berapid until all of the nutrients are consumed, at which stage the colony can completely collapse [90,92].Due to the similarity of the logic to that underlying Malthus’ predictions, this is often referred to as the“neo-Malthusian argument”.
Intuitively, the logic behind the neo-Malthusian argument is initially compelling. However,critics invariably point to the fact that, empirically, the observed trends are often contrary to the
Energies 2020, 13, 4839 13 of 49
trends predicted by the neo-Malthusian theories [44,93–95]. Critics note that a key weakness in theneo-Malthusian argument is the assumption that society does not modify its usage of a resourcein response to the supply/demand ratios. Moreover, that humans can invent new approaches andtechnologies. A common pithy counter to the neo-Malthusian argument is to note that “the Stone Agedidn’t end because we ran out of stone”. Simon, noting that human ingenuity distinguishes us frombacteria on a Petri dish, went so far as to refer to humanity as the “ultimate resource” [93].
Some critics of the neo-Malthusian argument have even argued that the underlying logic is soflawed as to propose the opposite, i.e., that humanity can keep growing for the foreseeable future,provided we allow our citizens the opportunity to avail of their ingenuity. This has led some to refer tocriticism of neo-Malthusian arguments as “cornucopianism” [96].
We will not comment here on which side in this debate is closest to the truth, but merely note, first,that the debate seems to have been recurring in slightly different forms for more than two centuriesnow [94]. Second, despite the fact that neo-Malthusians often express their predictions of future trendswith remarkable confidence [90–92], these predictions are frequently found retrospectively to havebeen opposite to reality [95], indeed the world’s population is now nearly 8 times as large as duringMalthus’ original predictions.
This has important implications for what we regard as “sustainable”. Societies differ in theirconceptualizations of sustainability, as defined by numerous disciplines and applied to a varietyof contexts. These range from the concept of maximum sustainable yield in forestry and fisheriesmanagement to the vision of a sustainable society with a steady-state economy. Brown et al. (1987) [97]proposed that indefinite human survival on a global scale requires certain basic support systems, “whichcan be maintained only with a healthy environment and a stable human population”, which correspondswith the neo-Malthusian perspective in explicitly incorporating human population trends into the mix.However, given that the “energy footprint”, “ecological footprint”, etc. of individuals can vary overtime and from region to region [88,98], we argue that it is meaningless to define an arbitrary “ideal”population size above which the world becomes “overpopulated”. Instead, we suggest we should avoiddefining “sustainability” explicitly or implicitly in terms of population trends (i.e., the neo-Malthusianparadigm). For instance, Gomiero (2015) argues that, “In order to be termed sustainable, the use of anenergy source should be technically feasible, economically affordable, environmentally and sociallyviable, considering society as a whole” [99]. This definition does not explicitly depend on populationtrends, although clearly the size of the population is an important factor to consider.
The literature offers several definitions of renewable energy (RE) supplies. For example, a specialreport from the IPCC on renewable energy sources and climate change mitigation offers the following.“Renewable energy is any form of energy from solar, geophysical or biological sources that is replenishedby natural processes at a rate that equals or exceeds its rate of use” [100]. Verbruggen et al. (2010) pointout that this definition can be refined, for example, by adding the notion that some renewable sourcescan be exhausted by overexploitation. Conversely, they caution, “qualifying the various renewableenergy supplies for measuring their degree of sustainability is an unsolved issue” [101]. Moreover,Acosta (2013) cautions that intensive resource extraction may blur the distinction between renewableand non-renewable sources of energy: “Because of the huge scale of extraction, many ‘renewable’resources, such as forests or soil fertility, are becoming non-renewable. This is because the resource isdepleted when the rate of extraction is much higher than the rate at which the environment is able torenew the resource. Thus, at the current pace of extraction, the problems of non-renewable naturalresources may affect all resources equally” [102].
Thus, we suggest that there may be unsustainable exploitation of a renewable energy source (e.g.,clearance of a forest for the manufacture of wood pellets) and, conversely, there may be sustainableexploitation of a non-renewable source (e.g., scheduled management of a finite reserve of natural gasto last over a planning period of 10 or 20 years). Therefore, the sustainability of a resource is notmerely a question of whether it is finite or renewable, but of how it is managed with regard to itslifespan or life cycle. For instance, in history, we can see that the use of fossil fuels (a non-renewable
Energies 2020, 13, 4839 14 of 49
resource) for energy arose precisely because the continued burning of wood (a renewable resource)was unsustainable. The use of coal was found to be more sustainable than continued deforestation [8].
3.3.2. “Peak Oil”, “Peak Gas”, and “Peak Coal”
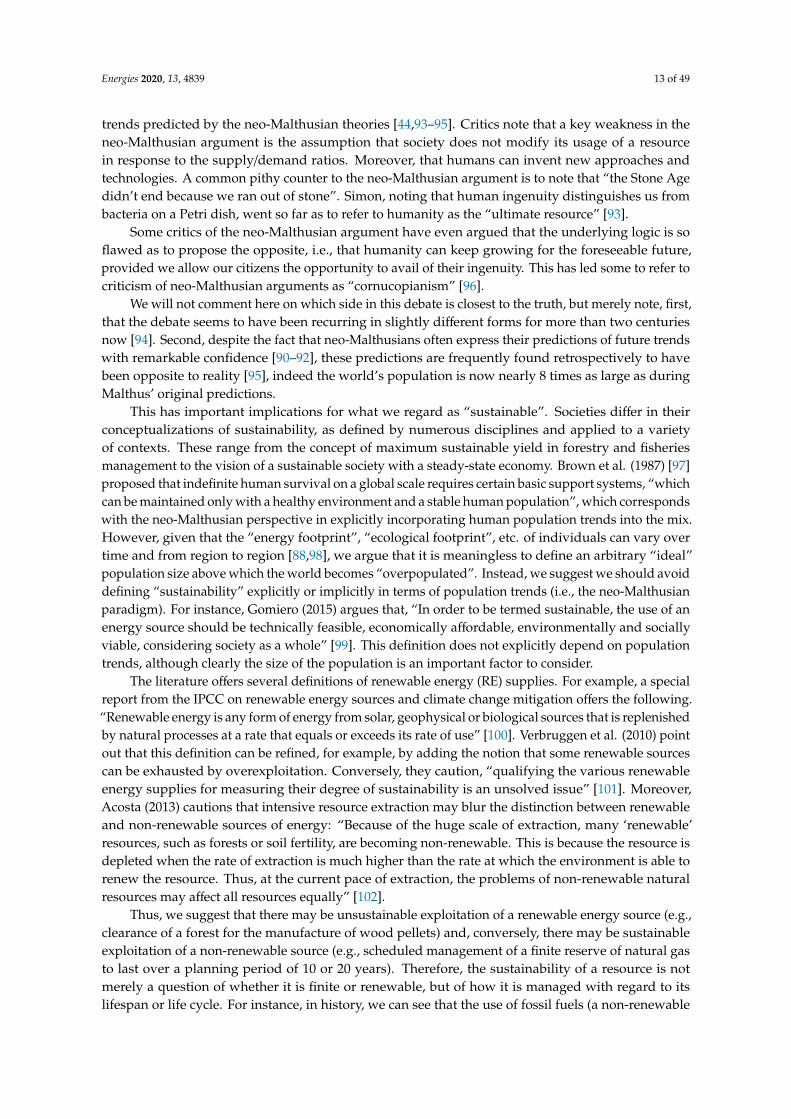
Since M.K. Hubbert first coined the term “peak oil” in the 1950s, the argument that resourcessuch as oil are finite has been a recurring motif in energy policy discussions [103–107]. The argumentis that, if society relies too heavily on oil (or gas), then there may be catastrophic consequences ifdemand suddenly outstrips supply, because we have reached “peak oil” or “peak gas”. Readers maynote this argument overlaps with the neo-Malthusian arguments described above. Indeed, concernsabout “peak oil” have been particularly prominent in neo-Malthusian analyses since the 1970s [90–92].However, as we noted above with regards to the neo-Malthusian debate, predictions of imminent“peak oil”, “peak gas”, and “peak coal” are continually being revised forwards as time progresses.
Indeed, Lior (2008) noted, “An interesting global phenomenon is that despite the rise inconsumption of fossil fuels, the quantities of proven reserves rises with time too, where theresources/production (R/P) ratio has remained nearly constant for decades at R/P = 40 for oil, 60 forgas and about 150 for coal” [108]. This implied that there was at least 40 years (oil), 60 years (gas),and 150 years (coal) of reserves at 2006 consumption rates, but that we should not be surprised ifseveral decades from now, the future predictions for peak oil, gas, and coal will have moved forward intandem. Shafiee and Topal (2009) disputed whether this empirical observation is a reliable assumptionfor projecting forward and estimated that the reserves would only last 35 years (oil), 37 years (gas),and 107 years (coal) at 2006 consumption rates [109]. At present, i.e., 10 years later, BP (2019) estimatethe total world reserves-to-production ratios (R/P) are 50 years (oil), 51 years (gas), and 132 years (coal)at 2019 consumption rates [77].
We will not attempt to resolve these conflicting estimates in this paper. Nor are we suggestingthat coal, oil, and gas should be assumed to be “inexhaustible” resources (although we refer interestedreaders to Kutcherov and Krayushkin (2010) for an intriguing review on the controversial hypothesisthat oil and gas may be “abiotic” in origin, implying that possibility [110]). Rather, we suggest thatenergy policies which are based on specific predictions of the timings of “peak oil/gas/coal” shouldbe treated with considerable caution. For instance, partially on the basis of predictions of “peak oil”,expensive liquefied natural gas (LNG) terminals were developed in the U.S. In the first decade of the2000s, to import major quantities of gas by developers anticipating a looming shortage of supply inthe country. Yet, by the time these terminals were in operation, technological advances in hydraulicfracturing (“fracking” for short) had dramatically increased U.S. gas accessible reserves, switching thecountry to a net exporter of gas [105,107]. It has been suggested that, if the large-scale extraction of gasfrom underwater methane hydrate reserves becomes economically viable in the future, even greaterincreases in “gas reserves” would occur [110,111].
Therefore, there is considerable uncertainty over when exactly we should expect “peak” oil, gas, orcoal, but certainly there seem to be enough known reserves of all three of these for the next few decadesat least. This has led to conflicting perspectives from researchers concerned about anthropogenic globalwarming from CO2 emissions over whether we should continue to use fossil fuels as long as they arereadily available on the basis that there is not much left [112] or actively campaign to keep fossil fuels“unused” on the basis that there is too much left [113].
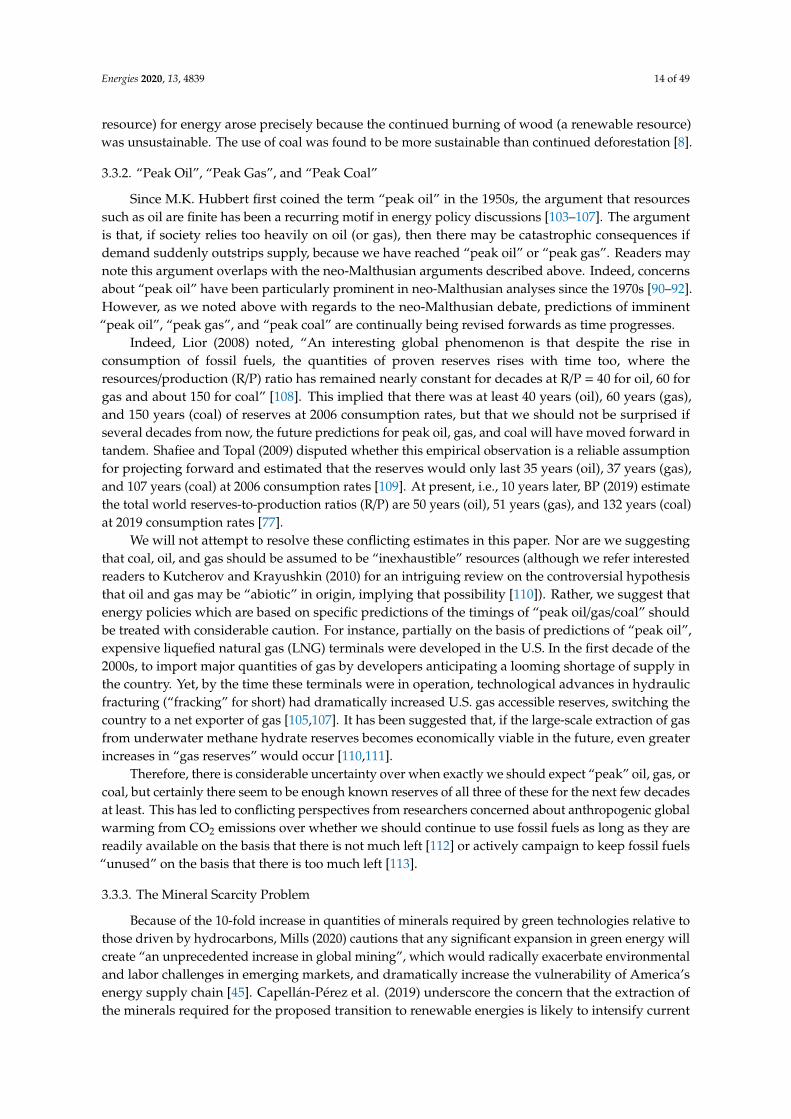
3.3.3. The Mineral Scarcity Problem
Because of the 10-fold increase in quantities of minerals required by green technologies relative tothose driven by hydrocarbons, Mills (2020) cautions that any significant expansion in green energy willcreate “an unprecedented increase in global mining”, which would radically exacerbate environmentaland labor challenges in emerging markets, and dramatically increase the vulnerability of America’senergy supply chain [45]. Capellán-Pérez et al. (2019) underscore the concern that the extraction ofthe minerals required for the proposed transition to renewable energies is likely to intensify current
Energies 2020, 13, 4839 15 of 49
socio-environmental conflicts associated with resource extraction [114]. As we will outline in thefollowing section, this gives rise to concern regarding potential uncertainty of supply. In contrast tothe concerns about hydrocarbon peaks outlined above, projected mineral requirements seem likelyto exceed current reserves within the very short time frame to the year 2030. This concern appearsparticularly pressing with regard to e-vehicles, which we discuss next, followed by related concernsregarding solar and wind energy.
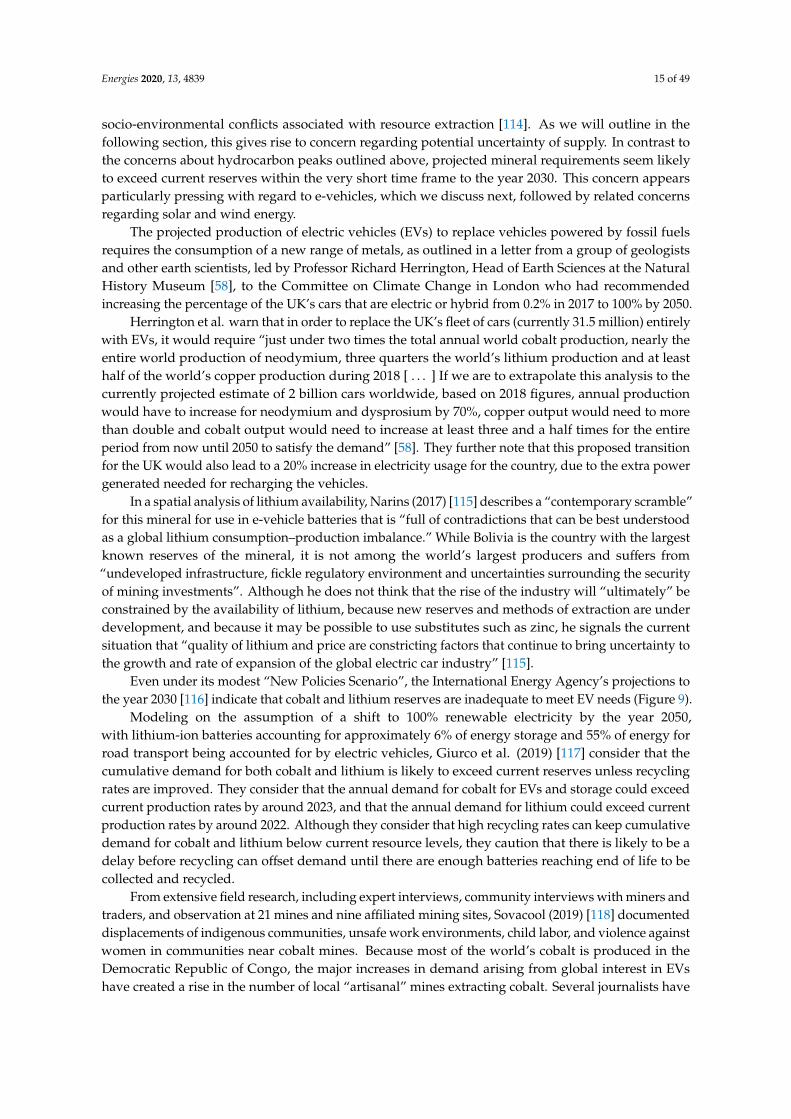
The projected production of electric vehicles (EVs) to replace vehicles powered by fossil fuelsrequires the consumption of a new range of metals, as outlined in a letter from a group of geologistsand other earth scientists, led by Professor Richard Herrington, Head of Earth Sciences at the NaturalHistory Museum [58], to the Committee on Climate Change in London who had recommendedincreasing the percentage of the UK’s cars that are electric or hybrid from 0.2% in 2017 to 100% by 2050.
Herrington et al. warn that in order to replace the UK’s fleet of cars (currently 31.5 million) entirelywith EVs, it would require “just under two times the total annual world cobalt production, nearly theentire world production of neodymium, three quarters the world’s lithium production and at leasthalf of the world’s copper production during 2018 [ . . . ] If we are to extrapolate this analysis to thecurrently projected estimate of 2 billion cars worldwide, based on 2018 figures, annual productionwould have to increase for neodymium and dysprosium by 70%, copper output would need to morethan double and cobalt output would need to increase at least three and a half times for the entireperiod from now until 2050 to satisfy the demand” [58]. They further note that this proposed transitionfor the UK would also lead to a 20% increase in electricity usage for the country, due to the extra powergenerated needed for recharging the vehicles.
In a spatial analysis of lithium availability, Narins (2017) [115] describes a “contemporary scramble”for this mineral for use in e-vehicle batteries that is “full of contradictions that can be best understoodas a global lithium consumption–production imbalance.” While Bolivia is the country with the largestknown reserves of the mineral, it is not among the world’s largest producers and suffers from“undeveloped infrastructure, fickle regulatory environment and uncertainties surrounding the securityof mining investments”. Although he does not think that the rise of the industry will “ultimately” beconstrained by the availability of lithium, because new reserves and methods of extraction are underdevelopment, and because it may be possible to use substitutes such as zinc, he signals the currentsituation that “quality of lithium and price are constricting factors that continue to bring uncertainty tothe growth and rate of expansion of the global electric car industry” [115].
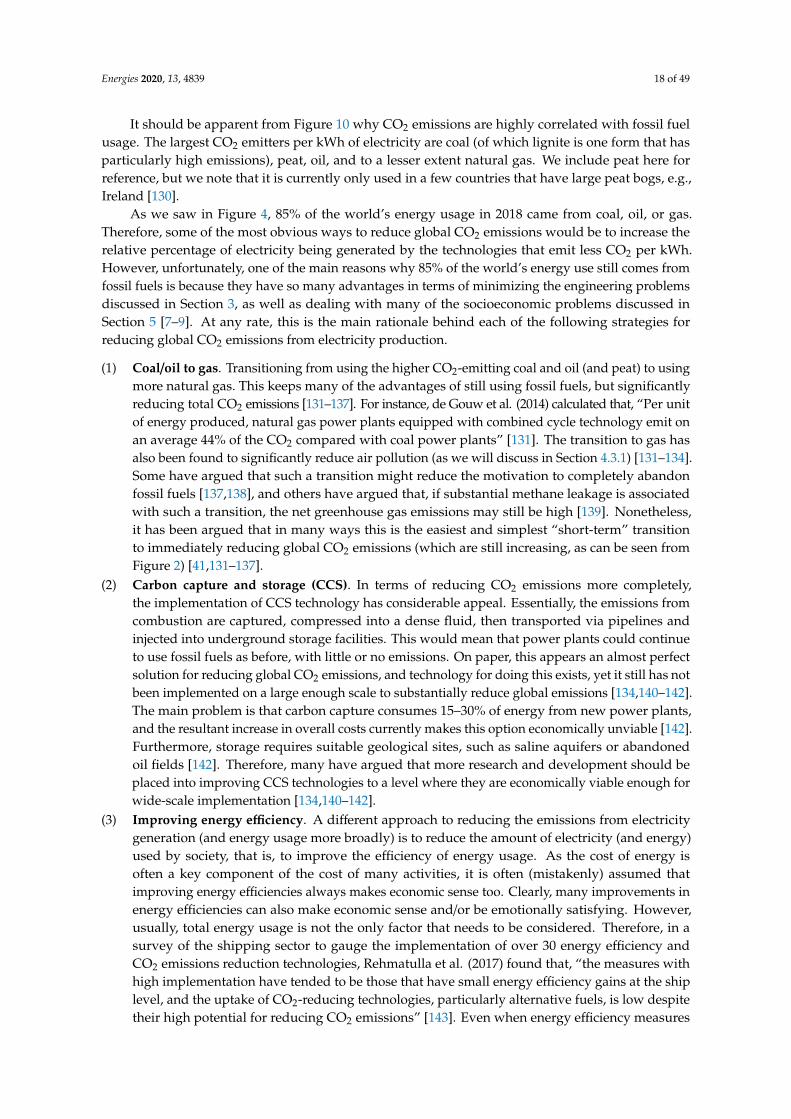
Even under its modest “New Policies Scenario”, the International Energy Agency’s projections tothe year 2030 [116] indicate that cobalt and lithium reserves are inadequate to meet EV needs (Figure 9).
Modeling on the assumption of a shift to 100% renewable electricity by the year 2050,with lithium-ion batteries accounting for approximately 6% of energy storage and 55% of energy forroad transport being accounted for by electric vehicles, Giurco et al. (2019) [117] consider that thecumulative demand for both cobalt and lithium is likely to exceed current reserves unless recyclingrates are improved. They consider that the annual demand for cobalt for EVs and storage could exceedcurrent production rates by around 2023, and that the annual demand for lithium could exceed currentproduction rates by around 2022. Although they consider that high recycling rates can keep cumulativedemand for cobalt and lithium below current resource levels, they caution that there is likely to be adelay before recycling can offset demand until there are enough batteries reaching end of life to becollected and recycled.
From extensive field research, including expert interviews, community interviews with miners andtraders, and observation at 21 mines and nine affiliated mining sites, Sovacool (2019) [118] documenteddisplacements of indigenous communities, unsafe work environments, child labor, and violence againstwomen in communities near cobalt mines. Because most of the world’s cobalt is produced in theDemocratic Republic of Congo, the major increases in demand arising from global interest in EVshave created a rise in the number of local “artisanal” mines extracting cobalt. Several journalists have

Energies 2020, 13, 4839 16 of 49
warned that these are often poorly regulated and sometimes involve the use of child labor [119,120].These socioenvironmental issues give rise to further concern regarding security of supply.
Capellán-Pérez et al. (2019) identify the technologies most vulnerable to mineral scarcity to besolar PV technologies (tellurium, indium, silver, and manganese), solar CSP (silver and manganese),and Li batteries (lithium and manganese) [114]. The transition to alternative technologies will alsointensify global copper demand by requiring 10–25% of current global reserves and 5–10% of currentglobal resources. The authors report that “other studies considering a full transition to 100% RES andconsidering the material requirements for transportation of electricity reach higher levels, e.g., 60–70%of estimated current reserves”.
Energies 2020, 13, x FOR PEER REVIEW 16 of 50
labor [119,120]. These socioenvironmental issues give rise to further concern regarding security of supply.
Capellán-Pérez et al. (2019) identify the technologies most vulnerable to mineral scarcity to be solar PV technologies (tellurium, indium, silver, and manganese), solar CSP (silver and manganese), and Li batteries (lithium and manganese) [114]. The transition to alternative technologies will also intensify global copper demand by requiring 10–25% of current global reserves and 5–10% of current global resources. The authors report that “other studies considering a full transition to 100% RES and considering the material requirements for transportation of electricity reach higher levels, e.g., 60–70% of estimated current reserves”.
Figure 9. Increased annual demand for materials for batteries from deployment of electric vehicles by scenario, 2018–2030. Green dots indicate current supply. NPS = New Policies Scenario. EV30@30 = 30% sales share for EVs by 2030. (Adapted from Figure 7 of IEA, 2019) [116].
Modeling on the assumption of a shift to 100% renewable electricity by the year 2050, with solar PV accounting for more than one-third of capacity and the remainder being generated by wind and other renewables, Giurco et al. (2019) calculate that to generate one-third of the world’s energy from solar power by 2050, this would require ~50% of the current reserves of silver [117]. They consider that increasing efficiency of material use has the greatest potential to offset the demand for metals for solar PV, while recycling has less potential because of the long lifespan of solar PV metals and their lower potential for recycling. They also caution that declining ore grades may have a significant influence on energy consumption in the mining sector, associated with polymetallic ore processing and the mining of deeper ore bodies. They note that, although silver has an overall recycling rate of 30–50% almost no recycling of silver from PV panels occurs, because most recycling of PV panels focuses on recycling the glass, aluminum, and copper.
Several types of wind turbine, such as the permanent magnet synchronous generator (PMSG), require magnets that orient wind turbines into the wind. These magnets contain rare metals such as neodymium (Nd), praseodymium (Pr), terbium (Tb), and dysprosium (Dy) [121]. The estimated
Figure 9. Increased annual demand for materials for batteries from deployment of electric vehicles byscenario, 2018–2030. Green dots indicate current supply. NPS = New Policies Scenario. EV30@30 = 30%sales share for EVs by 2030. (Adapted from Figure 7 of IEA, 2019) [116].
Modeling on the assumption of a shift to 100% renewable electricity by the year 2050, with solarPV accounting for more than one-third of capacity and the remainder being generated by wind andother renewables, Giurco et al. (2019) calculate that to generate one-third of the world’s energy fromsolar power by 2050, this would require ~50% of the current reserves of silver [117]. They consider thatincreasing efficiency of material use has the greatest potential to offset the demand for metals for solarPV, while recycling has less potential because of the long lifespan of solar PV metals and their lowerpotential for recycling. They also caution that declining ore grades may have a significant influence onenergy consumption in the mining sector, associated with polymetallic ore processing and the miningof deeper ore bodies. They note that, although silver has an overall recycling rate of 30–50% almost norecycling of silver from PV panels occurs, because most recycling of PV panels focuses on recycling theglass, aluminum, and copper.
Several types of wind turbine, such as the permanent magnet synchronous generator (PMSG),require magnets that orient wind turbines into the wind. These magnets contain rare metals suchas neodymium (Nd), praseodymium (Pr), terbium (Tb), and dysprosium (Dy) [121]. The estimateddemand for Nd is projected to increase from 4000 to 18,000 tons by 2035, and for Dy from 200 to

Energies 2020, 13, 4839 17 of 49
1200 tons [122]. These values represent a quarter to a half of current world output [122]. There are alsoconcerns over the amount of toxic and radioactive waste generated by these mining activities. Currentresearch is focusing on lowering the dependence on these materials by reducing and recycling [123,124].
The construction of extensive wind and solar energy installations will require large quantities ofbase metals such as copper, iron and aluminum, which will be unavailable for recycling for the lifetimeof the installation, thus exacerbating scarcities (Vidal et al., 2013) [125].
4. Environmental Concerns Associated with the Various Energy Technologies
4.1. Reducing Greenhouse Gas Emissions
As stated above, the IPCC defines climate mitigation as an intervention to reduce the sources orenhance the sinks of greenhouse gases (GHG). This might be accomplished inter alia by switchingfrom carbon-intensive to less carbon-intensive energy sources.
In Figure 10, we have compiled together estimates of the average GHG emissions from eachof the main electricity generation technologies from several sources [126–130]. “Direct emissions”are those arising from power plant operation. “Indirect emissions” (indicated by an “*” in thefigure) include all processes and associated emissions except power plant operation, categorizedas “upstream” (e.g., oil extraction and refining, coal mining, and fuel transport) or “downstream”(e.g., decommissioning and waste disposal). Note that, while Weisser (2007) [126] considered windturbines and solar energy operation to be emissions-free, a meta-survey by Nugent and Sovacool(2014) [127] found a range of operational emissions. We do not consider here the potential additionalincrease in biological CO2 emissions from wind farms, which will be discussed in Section 4.2.4.
Energies 2020, 13, x FOR PEER REVIEW 17 of 50
demand for Nd is projected to increase from 4000 to 18,000 tons by 2035, and for Dy from 200 to 1200 tons [122]. These values represent a quarter to a half of current world output [122]. There are also concerns over the amount of toxic and radioactive waste generated by these mining activities. Current research is focusing on lowering the dependence on these materials by reducing and recycling [123,124].
The construction of extensive wind and solar energy installations will require large quantities of base metals such as copper, iron and aluminum, which will be unavailable for recycling for the lifetime of the installation, thus exacerbating scarcities (Vidal et al., 2013) [125].
4. Environmental Concerns Associated with the Various Energy Technologies
4.1. Reducing Greenhouse Gas Emissions
As stated above, the IPCC defines climate mitigation as an intervention to reduce the sources or enhance the sinks of greenhouse gases (GHG). This might be accomplished inter alia by switching from carbon-intensive to less carbon-intensive energy sources.
In Figure 10, we have compiled together estimates of the average GHG emissions from each of the main electricity generation technologies from several sources [126–130]. “Direct emissions” are those arising from power plant operation. “Indirect emissions” (indicated by an “*” in the figure) include all processes and associated emissions except power plant operation, categorized as “upstream” (e.g., oil extraction and refining, coal mining, and fuel transport) or “downstream” (e.g., decommissioning and waste disposal). Note that, while Weisser (2007) [126] considered wind turbines and solar energy operation to be emissions-free, a meta-survey by Nugent and Sovacool (2014) [127] found a range of operational emissions. We do not consider here the potential additional increase in biological CO2 emissions from wind farms, which will be discussed in Section 4.2.4.
Figure 10. Direct and indirect (*) greenhouse gas emissions from electricity supply technologies in grams of CO2-equivalent greenhouse gases per kWh of electricity produced (gCO2eq/kWhe). Hatched areas indicate values between minimum and maximum estimates. Data from various sources, as follows. Most values are from Weisser (2007) [126], but additional estimates for individual
Figure 10. Direct and indirect (*) greenhouse gas emissions from electricity supply technologies ingrams of CO2-equivalent greenhouse gases per kWh of electricity produced (gCO2eq/kWhe). Hatchedareas indicate values between minimum and maximum estimates. Data from various sources, as follows.Most values are from Weisser (2007) [126], but additional estimates for individual technologies are fromNugent and Sovacool (2014) [127]; Eberle et al. (2017) [128]; Paredes et al. (2019) [129]; Murphy et al.(2015) [130].
Energies 2020, 13, 4839 18 of 49
It should be apparent from Figure 10 why CO2 emissions are highly correlated with fossil fuelusage. The largest CO2 emitters per kWh of electricity are coal (of which lignite is one form that hasparticularly high emissions), peat, oil, and to a lesser extent natural gas. We include peat here forreference, but we note that it is currently only used in a few countries that have large peat bogs, e.g.,Ireland [130].
As we saw in Figure 4, 85% of the world’s energy usage in 2018 came from coal, oil, or gas.Therefore, some of the most obvious ways to reduce global CO2 emissions would be to increase therelative percentage of electricity being generated by the technologies that emit less CO2 per kWh.However, unfortunately, one of the main reasons why 85% of the world’s energy use still comes fromfossil fuels is because they have so many advantages in terms of minimizing the engineering problemsdiscussed in Section 3, as well as dealing with many of the socioeconomic problems discussed inSection 5 [7–9]. At any rate, this is the main rationale behind each of the following strategies forreducing global CO2 emissions from electricity production.
(1) Coal/oil to gas. Transitioning from using the higher CO2-emitting coal and oil (and peat) to usingmore natural gas. This keeps many of the advantages of still using fossil fuels, but significantlyreducing total CO2 emissions [131–137]. For instance, de Gouw et al. (2014) calculated that, “Per unitof energy produced, natural gas power plants equipped with combined cycle technology emit onan average 44% of the CO2 compared with coal power plants” [131]. The transition to gas hasalso been found to significantly reduce air pollution (as we will discuss in Section 4.3.1) [131–134].Some have argued that such a transition might reduce the motivation to completely abandonfossil fuels [137,138], and others have argued that, if substantial methane leakage is associatedwith such a transition, the net greenhouse gas emissions may still be high [139]. Nonetheless,it has been argued that in many ways this is the easiest and simplest “short-term” transitionto immediately reducing global CO2 emissions (which are still increasing, as can be seen fromFigure 2) [41,131–137].
(2) Carbon capture and storage (CCS). In terms of reducing CO2 emissions more completely,the implementation of CCS technology has considerable appeal. Essentially, the emissions fromcombustion are captured, compressed into a dense fluid, then transported via pipelines andinjected into underground storage facilities. This would mean that power plants could continueto use fossil fuels as before, with little or no emissions. On paper, this appears an almost perfectsolution for reducing global CO2 emissions, and technology for doing this exists, yet it still has notbeen implemented on a large enough scale to substantially reduce global emissions [134,140–142].The main problem is that carbon capture consumes 15–30% of energy from new power plants,and the resultant increase in overall costs currently makes this option economically unviable [142].Furthermore, storage requires suitable geological sites, such as saline aquifers or abandonedoil fields [142]. Therefore, many have argued that more research and development should beplaced into improving CCS technologies to a level where they are economically viable enough forwide-scale implementation [134,140–142].
(3) Improving energy efficiency. A different approach to reducing the emissions from electricitygeneration (and energy usage more broadly) is to reduce the amount of electricity (and energy)used by society, that is, to improve the efficiency of energy usage. As the cost of energy isoften a key component of the cost of many activities, it is often (mistakenly) assumed thatimproving energy efficiencies always makes economic sense too. Clearly, many improvements inenergy efficiencies can also make economic sense and/or be emotionally satisfying. However,usually, total energy usage is not the only factor that needs to be considered. Therefore, in asurvey of the shipping sector to gauge the implementation of over 30 energy efficiency andCO2 emissions reduction technologies, Rehmatulla et al. (2017) found that, “the measures withhigh implementation have tended to be those that have small energy efficiency gains at the shiplevel, and the uptake of CO2-reducing technologies, particularly alternative fuels, is low despitetheir high potential for reducing CO2 emissions” [143]. Even when energy efficiency measures

Energies 2020, 13, 4839 19 of 49
might be cost-effective, it has been well-recognized that they are often only slowly adopted—aphenomenon referred to as “the energy efficiency paradox” [144,145].
We can convey the general concepts of the compromises involved in energy efficiency policies byconsidering the question of how well insulated a house in a mid-to-high-latitude country should be.Historically, many houses were built without much insulation in mind—especially for older houseswhen internal heating was limited or nonexistent. Therefore, for a relatively small economic outlay,it can be straightforward to reconvert a poorly insulated house into a moderately insulated house.The economic return on investment (ROI) can be substantial, and easily justified. However, after these“low-hanging fruits” have been removed, the ROI on further efforts to improve the insulation falls asthe costs and efforts involved tend to increase, while the savings tend to become smaller. At somepoint, the ROI in increasing insulation may become too low to justify. Moreover, it is often cheaperand easier to incorporate improved insulation techniques and features into a new building than anold building. Therefore, at some point, the ROI involved in “refurbishing” an old building may makeless sense than building a highly insulated building from scratch. See MacKay (2009) for a highlyinformative discussion on these issues [146].
Meanwhile, economists have long debated a separate problem associated with energy efficiency,known as the “rebound effect” [147,148]. It is also sometimes called the “Jevons paradox” [148] afterW.S. Jevons suggested in 1865 that this could lead to “peak coal” by the late-19th century (Section 3.3.2).Herring (2006) explains the argument as follows, “that improving energy efficiency lowers the implicitprice of energy and hence makes its use more affordable, thus leading to greater use—an effect termedthe ‘rebound’ or ‘takeback’ effect” [147]. If the improvements are large enough, this may even leadto a “backfire” effect where total energy consumption actually increases as a result of the improvedefficiencies. A classic historic example of such an effect is that of the light bulb. A series of energyefficiency improvements in the late 19th century/early 20th century methods of electric lighting were sosubstantial that it led to a mass market for electric lighting [147,148]. Although these “backfire effects”tend to be rare, many energy efficiency improvements appear to lead to at least some “rebound effect”,which partially reduces the expected reduction in emissions [147,148].
(4) Increased nuclear usage. Advocates for nuclear power note that nuclear power generationshares many of the advantages of fossil fuel-generated electricity (see Section 3), without theconcerns about peak oil/gas/coal (Section 3.3.2) or emissions [20,21,23,39,41–44,51,52]. Moreover,by studying the energy transitions to nuclear made by both Sweden and France from the 1960s to1990s, Qvist and Brook (2015) argue that, “if the world built nuclear power at no more than theper capita rate of these exemplar nations during their national expansion, then coal- and gas-firedelectricity could be replaced worldwide in less than a decade” [52]. However, even among thosecalling for the urgent reduction in CO2 emissions, there seems to be considerable public resistanceto nuclear energy.
Much of the public concern about nuclear energy seems to be based on concern over these twoseparate issues: (i) the disposal of radioactive waste and (ii) the risk of accidents [149,150]. With regardto the risk of accidents, Sovacool et al. [151,152] have compiled large databases of major accidentsassociated with all of the main energy sectors. From analyzing 1085 major accidents related to11 different energy sectors over the period 1874–2014, Sovacool et al. (2015) found that, althoughnuclear accidents represented 69.9% of the property damages, they only represented 15.9% of the totalaccidents and 2.3% of all the associated deaths [151]. The problem of disposal of radioactive waste canbe mitigated in at least two ways: third-generation reactors which recycle the fuel, and the use of deepgeological repositories (DGRs) [150]. Generation IV reactors currently in development apparentlyfeature further safety, reliability and economic advantages [150].
Another concern is the risk of project overruns in the development of new plants, although this isa concern with any megaproject [153]. In this Special Issue of Energies, Zawalinska et al. (2020) [154]modeled the effects of building a new nuclear power plant in one of four regions in Poland. They
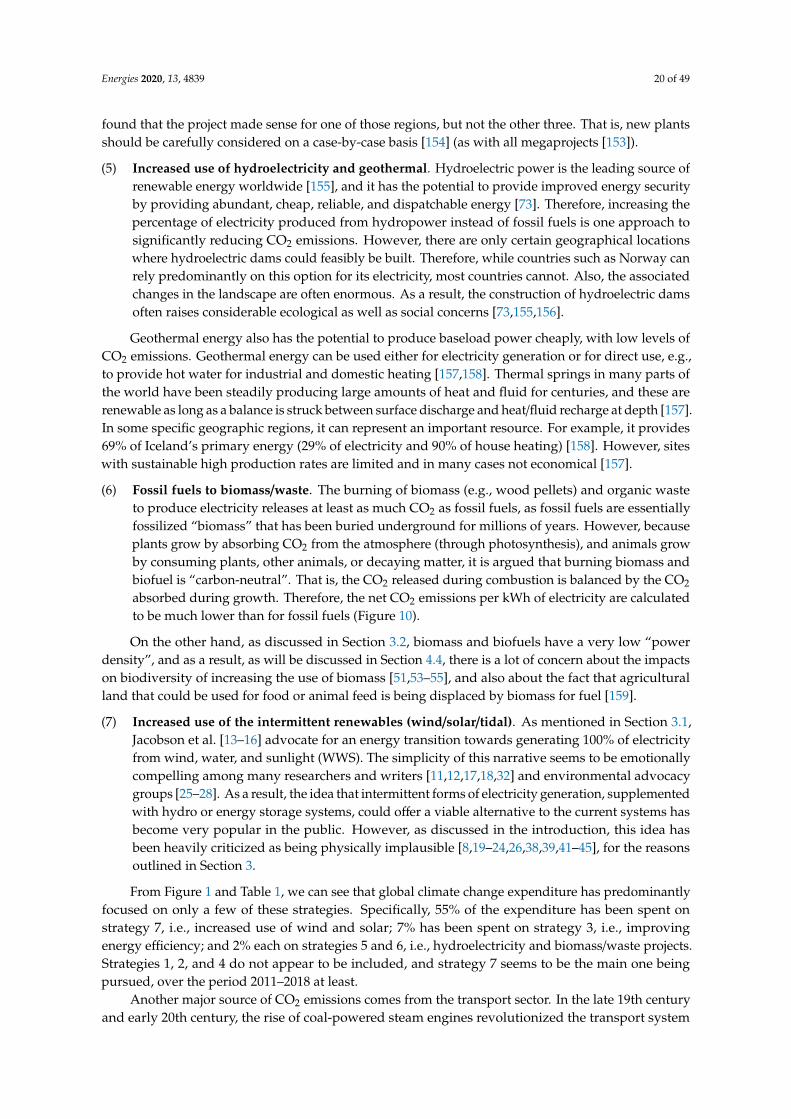
Energies 2020, 13, 4839 20 of 49
found that the project made sense for one of those regions, but not the other three. That is, new plantsshould be carefully considered on a case-by-case basis [154] (as with all megaprojects [153]).
(5) Increased use of hydroelectricity and geothermal. Hydroelectric power is the leading source ofrenewable energy worldwide [155], and it has the potential to provide improved energy securityby providing abundant, cheap, reliable, and dispatchable energy [73]. Therefore, increasing thepercentage of electricity produced from hydropower instead of fossil fuels is one approach tosignificantly reducing CO2 emissions. However, there are only certain geographical locationswhere hydroelectric dams could feasibly be built. Therefore, while countries such as Norway canrely predominantly on this option for its electricity, most countries cannot. Also, the associatedchanges in the landscape are often enormous. As a result, the construction of hydroelectric damsoften raises considerable ecological as well as social concerns [73,155,156].
Geothermal energy also has the potential to produce baseload power cheaply, with low levels ofCO2 emissions. Geothermal energy can be used either for electricity generation or for direct use, e.g.,to provide hot water for industrial and domestic heating [157,158]. Thermal springs in many parts ofthe world have been steadily producing large amounts of heat and fluid for centuries, and these arerenewable as long as a balance is struck between surface discharge and heat/fluid recharge at depth [157].In some specific geographic regions, it can represent an important resource. For example, it provides69% of Iceland’s primary energy (29% of electricity and 90% of house heating) [158]. However, siteswith sustainable high production rates are limited and in many cases not economical [157].
(6) Fossil fuels to biomass/waste. The burning of biomass (e.g., wood pellets) and organic wasteto produce electricity releases at least as much CO2 as fossil fuels, as fossil fuels are essentiallyfossilized “biomass” that has been buried underground for millions of years. However, becauseplants grow by absorbing CO2 from the atmosphere (through photosynthesis), and animals growby consuming plants, other animals, or decaying matter, it is argued that burning biomass andbiofuel is “carbon-neutral”. That is, the CO2 released during combustion is balanced by the CO2
absorbed during growth. Therefore, the net CO2 emissions per kWh of electricity are calculatedto be much lower than for fossil fuels (Figure 10).
On the other hand, as discussed in Section 3.2, biomass and biofuels have a very low “powerdensity”, and as a result, as will be discussed in Section 4.4, there is a lot of concern about the impactson biodiversity of increasing the use of biomass [51,53–55], and also about the fact that agriculturalland that could be used for food or animal feed is being displaced by biomass for fuel [159].
(7) Increased use of the intermittent renewables (wind/solar/tidal). As mentioned in Section 3.1,Jacobson et al. [13–16] advocate for an energy transition towards generating 100% of electricityfrom wind, water, and sunlight (WWS). The simplicity of this narrative seems to be emotionallycompelling among many researchers and writers [11,12,17,18,32] and environmental advocacygroups [25–28]. As a result, the idea that intermittent forms of electricity generation, supplementedwith hydro or energy storage systems, could offer a viable alternative to the current systems hasbecome very popular in the public. However, as discussed in the introduction, this idea hasbeen heavily criticized as being physically implausible [8,19–24,26,38,39,41–45], for the reasonsoutlined in Section 3.
From Figure 1 and Table 1, we can see that global climate change expenditure has predominantlyfocused on only a few of these strategies. Specifically, 55% of the expenditure has been spent onstrategy 7, i.e., increased use of wind and solar; 7% has been spent on strategy 3, i.e., improvingenergy efficiency; and 2% each on strategies 5 and 6, i.e., hydroelectricity and biomass/waste projects.Strategies 1, 2, and 4 do not appear to be included, and strategy 7 seems to be the main one beingpursued, over the period 2011–2018 at least.
Another major source of CO2 emissions comes from the transport sector. In the late 19th centuryand early 20th century, the rise of coal-powered steam engines revolutionized the transport system
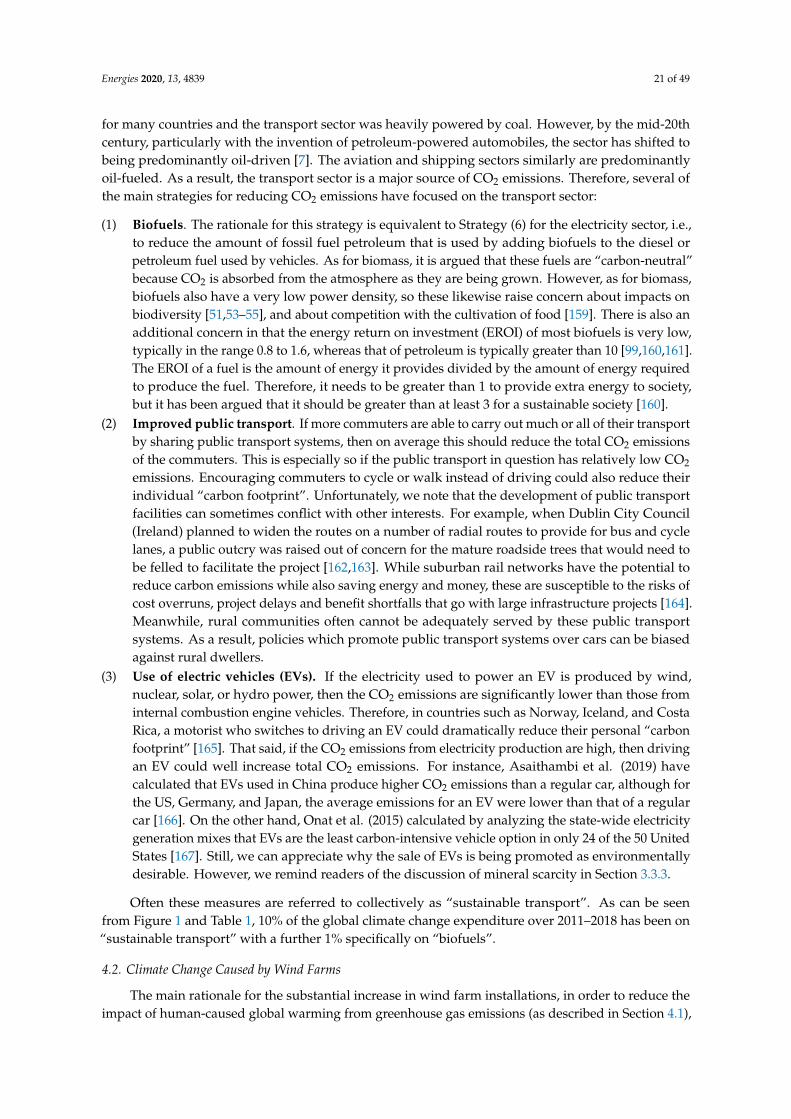
Energies 2020, 13, 4839 21 of 49
for many countries and the transport sector was heavily powered by coal. However, by the mid-20thcentury, particularly with the invention of petroleum-powered automobiles, the sector has shifted tobeing predominantly oil-driven [7]. The aviation and shipping sectors similarly are predominantlyoil-fueled. As a result, the transport sector is a major source of CO2 emissions. Therefore, several ofthe main strategies for reducing CO2 emissions have focused on the transport sector:
(1) Biofuels. The rationale for this strategy is equivalent to Strategy (6) for the electricity sector, i.e.,to reduce the amount of fossil fuel petroleum that is used by adding biofuels to the diesel orpetroleum fuel used by vehicles. As for biomass, it is argued that these fuels are “carbon-neutral”because CO2 is absorbed from the atmosphere as they are being grown. However, as for biomass,biofuels also have a very low power density, so these likewise raise concern about impacts onbiodiversity [51,53–55], and about competition with the cultivation of food [159]. There is also anadditional concern in that the energy return on investment (EROI) of most biofuels is very low,typically in the range 0.8 to 1.6, whereas that of petroleum is typically greater than 10 [99,160,161].The EROI of a fuel is the amount of energy it provides divided by the amount of energy requiredto produce the fuel. Therefore, it needs to be greater than 1 to provide extra energy to society,but it has been argued that it should be greater than at least 3 for a sustainable society [160].
(2) Improved public transport. If more commuters are able to carry out much or all of their transportby sharing public transport systems, then on average this should reduce the total CO2 emissionsof the commuters. This is especially so if the public transport in question has relatively low CO2
emissions. Encouraging commuters to cycle or walk instead of driving could also reduce theirindividual “carbon footprint”. Unfortunately, we note that the development of public transportfacilities can sometimes conflict with other interests. For example, when Dublin City Council(Ireland) planned to widen the routes on a number of radial routes to provide for bus and cyclelanes, a public outcry was raised out of concern for the mature roadside trees that would need tobe felled to facilitate the project [162,163]. While suburban rail networks have the potential toreduce carbon emissions while also saving energy and money, these are susceptible to the risks ofcost overruns, project delays and benefit shortfalls that go with large infrastructure projects [164].Meanwhile, rural communities often cannot be adequately served by these public transportsystems. As a result, policies which promote public transport systems over cars can be biasedagainst rural dwellers.
(3) Use of electric vehicles (EVs). If the electricity used to power an EV is produced by wind,nuclear, solar, or hydro power, then the CO2 emissions are significantly lower than those frominternal combustion engine vehicles. Therefore, in countries such as Norway, Iceland, and CostaRica, a motorist who switches to driving an EV could dramatically reduce their personal “carbonfootprint” [165]. That said, if the CO2 emissions from electricity production are high, then drivingan EV could well increase total CO2 emissions. For instance, Asaithambi et al. (2019) havecalculated that EVs used in China produce higher CO2 emissions than a regular car, although forthe US, Germany, and Japan, the average emissions for an EV were lower than that of a regularcar [166]. On the other hand, Onat et al. (2015) calculated by analyzing the state-wide electricitygeneration mixes that EVs are the least carbon-intensive vehicle option in only 24 of the 50 UnitedStates [167]. Still, we can appreciate why the sale of EVs is being promoted as environmentallydesirable. However, we remind readers of the discussion of mineral scarcity in Section 3.3.3.
Often these measures are referred to collectively as “sustainable transport”. As can be seenfrom Figure 1 and Table 1, 10% of the global climate change expenditure over 2011–2018 has been on“sustainable transport” with a further 1% specifically on “biofuels”.
4.2. Climate Change Caused by Wind Farms
The main rationale for the substantial increase in wind farm installations, in order to reduce theimpact of human-caused global warming from greenhouse gas emissions (as described in Section 4.1),

Energies 2020, 13, 4839 22 of 49
is called into question by the fact that not all climate change is global climate change; there can alsobe local and regional climate change. Furthermore, there is more to climate change than merelytemperature change, and there are other drivers of climate change, beside atmospheric concentrationsof greenhouse gases. It is widely acknowledged that land use and land cover changes (LULCC),such as deforestation, and land management changes (LMC), such as irrigation, can affect climate fromlocal to global scale through physical and chemical interactions between land and atmosphere [168].Thus, there is a risk that any large-scale energy installation that involves changes in land use, landcover or land management can potentially cause local, regional, and global climate change.
In particular, recent years’ research has produced considerable theoretical and empirical evidencethat wind turbines can have significant local or regional effects on climate. For example, Abbasi et al.(2016) [59] explain that “large-scale wind farms with tall wind turbines can have an influence on theweather, possibly on climate, due to the combined effects of the wind velocity deficit they create,changes in the atmospheric turbulence pattern they cause, and landscape roughness they enhance”.
Therefore, before assuming that increasing the deployment of wind farms will “reduce climatechange” by only considering the expected reduction in carbon dioxide emissions relative to fossil fuelusage, it is important to compare this expected reduction in “global climate change” to the extra localand regional climate changes it causes. By their very nature, wind turbines have an impact on at leastthree aspects of the local weather, and thus climate: (1) temperature, (2) wind, and (3) precipitation.In this subsection, we will briefly review what is currently known about the local and regional climatechanges caused by wind farms. However, we stress that this is still an emerging subject of research,partially because the increase in wind farm developments in recent years is unprecedented, and theenvironmental impacts of wind farms have only recently started to garner significant research attention.
Further research is required to extend the evidence base for the impacts of other energy technologiessuch as large solar power plants [169] and hydroelectric dams [170] on climate through their effects onLULCC and/or LMC.
4.2.1. Local Temperature Changes Caused by Wind Farms
Wind farms cause an increase in the average ground and soil temperature downwind from theturbines at night, through a mechanism described schematically in Figure 11, which is adapted fromArmstrong et al. (2014) [171]. In essence, increased turbulence causes increased mixing of the upperand lower atmosphere on the lee side of the turbines. This tends to cause a slight cooling at groundlevel by day and a warming effect at night.
Several studies have attempted to simulate the climate changes caused by wind farms bycomparing a simulation with a large hypothetical wind farm to a control simulation without thefarm [60,61,64,172,173]. Although Fitch (2015) argued that the globally averaged mean temperatureeffects would be very small and the annually averaged local warming modest [173], Wang andPrinn (2010) found that “using wind turbines to meet 10% or more of global energy demand in 2100,could cause surface warming exceeding 1 ◦C over land installations” [61]. Similarly, Miller and Keith(2018) [64] found that, if the US were to meet all of its current electricity usage with wind-generatedelectricity, it would lead to an average warming of 0.54 ◦C for the wind farm regions, and 0.24 ◦C whenaveraged over the entire US continent. By comparing this to US temperature projections accordingto IPCC climate models, they argued this would imply that, “if US electricity demand was met withUS-based wind power, the wind farm array would need to operate for more than a century before thewarming effect over the Continental US caused by [the wind farms] would be smaller than the reducedwarming effect from lowering [CO2] emissions” [64].

Energies 2020, 13, 4839 23 of 49
Energies 2020, 13, x FOR PEER REVIEW 23 of 50
Figure 11. “Schematic of the potential effects of wind turbines on air flow, temperature and evapotranspiration during the day with a stable atmospheric boundary layer and at night with an unstable atmospheric boundary layer. The pink (lighter grey) background represents warmer air and blue (darker grey) cooler air. Pink dashed arrows indicate warmer air eddies, which downwind of the turbine are mixed into the cooler air, thus increasing night-time surface temperature. Conversely, the blue solid arrows symbolize cooler air eddies which cause a cooling at the surface during the day-time. The horizontal arrows symbolize the wind speed up and downwind of the turbines, with a reduction in wind speed during the day and night. The vertical arrows suggest hypothesized changes in evapotranspiration, with increases under stable conditions and decreases under unstable conditions downwind of the turbine.”—Caption and figure adapted from Figure 1a of Armstrong et al. (2014). Reproduced under Creative Commons copyright license CC BY 3.0; https://creativecommons.org/licenses/by/3.0/.
To complement these modeling-based studies, several studies in recent years have tried to estimate the temperature changes caused by wind farms experimentally, e.g., using field studies and/or satellite-based comparisons. We refer to Abbasi et al. (2016) [59] and Miller and Keith (2018) [64] for summaries of the literature. Figure 12 illustrates one case study, which is adapted from a satellite-based analysis of a region in West Texas (US) by Zhou et al. (2012, 2013) [62,63]. Over an 8-year period, the installation of a large number of wind farms in the region led to a long-term night-time warming of ~0.72 °C/decade in the summer and ~0.46 °C/decade in the winter, for the wind farm regions relative to the surrounding regions. Equivalent studies in Iowa (US) [65] and northwestern China [66] obtained similar results.
Figure 11. “Schematic of the potential effects of wind turbines on air flow, temperature andevapotranspiration during the day with a stable atmospheric boundary layer and at night withan unstable atmospheric boundary layer. The pink (lighter grey) background represents warmer air andblue (darker grey) cooler air. Pink dashed arrows indicate warmer air eddies, which downwindof the turbine are mixed into the cooler air, thus increasing night-time surface temperature.Conversely, the blue solid arrows symbolize cooler air eddies which cause a cooling at the surfaceduring the day-time. The horizontal arrows symbolize the wind speed up and downwind of theturbines, with a reduction in wind speed during the day and night. The vertical arrows suggesthypothesized changes in evapotranspiration, with increases under stable conditions and decreasesunder unstable conditions downwind of the turbine.”—Caption and figure adapted from Figure 1aof Armstrong et al. (2014). Reproduced under Creative Commons copyright license CC BY 3.0;https://creativecommons.org/licenses/by/3.0/.
To complement these modeling-based studies, several studies in recent years have tried toestimate the temperature changes caused by wind farms experimentally, e.g., using field studies and/orsatellite-based comparisons. We refer to Abbasi et al. (2016) [59] and Miller and Keith (2018) [64] forsummaries of the literature. Figure 12 illustrates one case study, which is adapted from a satellite-basedanalysis of a region in West Texas (US) by Zhou et al. (2012, 2013) [62,63]. Over an 8-year period,the installation of a large number of wind farms in the region led to a long-term night-time warming of~0.72 ◦C/decade in the summer and ~0.46 ◦C/decade in the winter, for the wind farm regions relative tothe surrounding regions. Equivalent studies in Iowa (US) [65] and northwestern China [66] obtainedsimilar results.
Energies 2020, 13, 4839 24 of 49
Energies 2020, 13, x FOR PEER REVIEW 24 of 50
Figure 12. Summary of some key results from the Zhou et al. (2012) [62]; (2013) [63] studies on the effects of wind farms on regional land surface temperatures in west-central Texas (US). The top panel shows the approximate location of the study region which was ~10,005 km2 (~112.8 km × ~88.7 km) in area. Reproduced in accordance with the attribution guidelines for Google Maps and Google Earth, https://www.google.com/permissions/geoguidelines/attr-guide/, Google, 2020. The middle and bottom panels show the increasing average night-time soil temperatures of the wind farm regions relative to the surrounding regions over the period 2003–2011 for winter and summer respectively. Adapted from Figure 1 of Zhou et al. (2012) [62].
4.2.2. Changes in Wind Patterns Induced by Wind Farms
The fact that wind farms influence local wind patterns is, intuitively, the most obvious. The “wake” of a wind turbine, i.e., the wind on the lee side (i.e., downstream) of the turbine, is generally associated with an increase in turbulence and with a decreased wind speed. Although accurate modeling of these effects is surprisingly challenging [174–176], the existence of the “wake effect” is now empirically well established [177–181]. Particularly for off-shore wind farms (which have lower surface roughness than land-based wind farms), this wake effect can cover quite long distances. For instance, Platis et al. (2018) found evidence of significantly reduced wind speeds up to 70 km downwind of a German off-shore wind farm [179]. This can cause significant economic problems when multiple wind farms are built in the same region, as neighboring farms can end up competing for the same wind [180].
Figure 12. Summary of some key results from the Zhou et al. (2012) [62]; (2013) [63] studies on theeffects of wind farms on regional land surface temperatures in west-central Texas (US). The top panelshows the approximate location of the study region which was ~10,005 km2 (~112.8 km × ~88.7 km) inarea. Reproduced in accordance with the attribution guidelines for Google Maps and Google Earth,https://www.google.com/permissions/geoguidelines/attr-guide/, Google, 2020. The middle and bottompanels show the increasing average night-time soil temperatures of the wind farm regions relative tothe surrounding regions over the period 2003–2011 for winter and summer respectively. Adapted fromFigure 1 of Zhou et al. (2012) [62].
4.2.2. Changes in Wind Patterns Induced by Wind Farms
The fact that wind farms influence local wind patterns is, intuitively, the most obvious. The “wake”of a wind turbine, i.e., the wind on the lee side (i.e., downstream) of the turbine, is generally associatedwith an increase in turbulence and with a decreased wind speed. Although accurate modeling of theseeffects is surprisingly challenging [174–176], the existence of the “wake effect” is now empirically wellestablished [177–181]. Particularly for off-shore wind farms (which have lower surface roughness thanland-based wind farms), this wake effect can cover quite long distances. For instance, Platis et al. (2018)found evidence of significantly reduced wind speeds up to 70 km downwind of a German off-shore

Energies 2020, 13, 4839 25 of 49
wind farm [179]. This can cause significant economic problems when multiple wind farms are built inthe same region, as neighboring farms can end up competing for the same wind [180].
It has also been suggested that these local wake effects might lead to mesoscale changes in weathercirculation patterns, especially if wind farms continue to increase in size and number. For instance,Barrie and Kirk-Davidoff (2010) [60] ran a general circulation model simulation in which they simulatedwhat might happen if a hypothetical super-sized wind farm were installed with a 2.48 TW capacity.Their modeled farm would occupy 23% of North America and so was strictly hypothetical. However,this would still only meet 6% of the estimated world electricity usage by 2100 [61], and so is worthconsidering if the idea of providing a large fraction of the world’s electricity from wind farms is tobe taken seriously. Their simulations suggest that “the induced perturbations involve substantialchanges in the track and development of cyclones over the North Atlantic, and the magnitude ofthe perturbations rises above the level of forecasting uncertainty” [60]. That is, their hypotheticalwind farm could potentially lead to substantial changes in weather circulation patterns. Fiedler andBukovsky (2011) also found substantial effects in their simulation using a much smaller hypotheticalwind farm with a 0.457 TW capacity [172]. They even suggested that with such large wind farmsmight be capable of altering the paths of hurricanes, but warned that the effects could be somewhatunpredictable without substantial improvements in weather forecasting capability.
4.2.3. Local Precipitation Changes Caused by Wind Farms
The effects of wind turbines on local precipitation patterns are less intuitive and have not receivedas much research attention as yet. However, we can get an intuitive understanding of some of themechanisms by first considering that the purpose of a wind turbine is to extract mechanical energyfrom the incoming wind, for conversion into electricity. In other words, the wind downstream containsless energy. Meanwhile, the relative humidity of air is also a function of the energy content of the air,i.e., air temperature. Therefore, by extracting mechanical energy from the incoming wind, the turbineshave the potential to alter the relative humidity of the downstream wind. Two visual examples of thiscan be seen in Figure 13, corresponding to two substantially different atmospheric conditions over theNorth Sea, off the coast of Denmark [177,178].
We have been unable to identify much research in the literature systematically quantifyingthe effects of wind farms on local precipitation. However, anecdotally, we have been informed ofseveral incidents of flash-flooding events occurring near wind farms, which were uncharacteristic ofprecipitation patterns in the area before the construction of the wind farms. From their simulationof the effects of a large-scale 0.457 TW hypothetical wind farm (mentioned above), Fiedler andBukovsky (2011) [172] noted that, at a local level, “the presence of a wind farm can trigger differencebetween drought and deluge for the season”, but they noted that these effects were less pronouncedwhen averaged over larger regional areas. Nonetheless, they simulated an average 1% increase inprecipitation in an area spanning multiple states. Therefore, the effects of wind farms on local andregional precipitation could be quite substantial, and are worthy of more field research.
4.2.4. Increase in Biological CO2 Emissions Caused by Wind Farms
Although the warming effects of wind farms described in Section 4.2.1 are mostly localized andtend to be confined to night-time temperatures, we note that they introduce a problematic complicationfor those proposing to use wind farms to reduce global CO2 emissions. It is true that electricitygeneration is currently a major component of the anthropogenic CO2 emissions, and therefore reducingthe amount of electricity generated using fossil fuels should reduce that component. However,the annual biological CO2 emissions from soil respiration are at least ten times greater than the totalannual anthropogenic CO2 emissions [6,182,183].
Typically, the annual emissions from soil respiration are roughly balanced by the absorption ofCO2 via photosynthesis through the Net Primary Production (NPP) of the terrestrial plants and trees.However, the total emissions from soil respiration are known to increase with temperature. Estimates of
Energies 2020, 13, 4839 26 of 49
the exact rates of increase vary between studies, and there are many complexities in extrapolating fromthe results of e.g., a mid-latitude forest [184] or a tropical region [185] to global estimates (see Davidsonand Janssens (2006) for a good review of the challenges involved) [186]. Nonetheless, most studiessuggest that the warming of soils generally leads to an increase in biological CO2 emissions from soilrespiration [182–187]. Therefore, given that the global CO2 emissions from soil respiration are an orderof magnitude greater than anthropogenic emissions, we suggest that the increase in biological CO2
emissions caused by wind farms warming the night-time soil temperatures could potentially be similarin magnitude to the reduction in anthropogenic CO2 emissions from the wind farms.Energies 2020, 13, x FOR PEER REVIEW 26 of 50
Figure 13. Visually striking examples of two different versions of the "wake effect" as observed on separate dates at two neighboring off-shore wind farms off the shores of Denmark, i.e., Horns Rev 1 and 2. (a) Photograph by Christian Steiness of an example of a wake effect caused by cold humid air passing over a warmer sea surface, adapted from Figure 2 of Hasager et al. (2013) [177]. Reproduced under Creative Commons copyright license CC BY 3.0; https://creativecommons.org/licenses/by/3.0/. (b) Photograph by Bel Air Aviation Denmark—Helicopter Services of an example of a wake effect caused by warm humid air passing over a cooler sea surface, adapted from Figure 2 of Hasager et al. (2017) [178]. Reproduced under Creative Commons copyright license CC BY 4.0; https://creativecommons.org/licenses/by/4.0/.
Typically, the annual emissions from soil respiration are roughly balanced by the absorption of CO2 via photosynthesis through the Net Primary Production (NPP) of the terrestrial plants and trees. However, the total emissions from soil respiration are known to increase with temperature. Estimates of the exact rates of increase vary between studies, and there are many complexities in extrapolating from the results of e.g., a mid-latitude forest [184] or a tropical region [185] to global estimates (see Davidson and Janssens (2006) for a good review of the challenges involved) [186]. Nonetheless, most studies suggest that the warming of soils generally leads to an increase in biological CO2 emissions from soil respiration [182–187]. Therefore, given that the global CO2 emissions from soil respiration are an order of magnitude greater than anthropogenic emissions, we suggest that the increase in biological CO2 emissions caused by wind farms warming the night-time
Figure 13. Visually striking examples of two different versions of the “wake effect” as observed onseparate dates at two neighboring off-shore wind farms off the shores of Denmark, i.e., Horns Rev 1 and 2.(a) Photograph by Christian Steiness of an example of a wake effect caused by cold humid air passing overa warmer sea surface, adapted from Figure 2 of Hasager et al. (2013) [177]. Reproduced under CreativeCommons copyright license CC BY 3.0; https://creativecommons.org/licenses/by/3.0/. (b) Photograph byBel Air Aviation Denmark—Helicopter Services of an example of a wake effect caused by warm humidair passing over a cooler sea surface, adapted from Figure 2 of Hasager et al. (2017) [178]. Reproducedunder Creative Commons copyright license CC BY 4.0; https://creativecommons.org/licenses/by/4.0/.

Energies 2020, 13, 4839 27 of 49
4.3. Reducing Air Pollution
Most of the energy technologies, especially those based on combustion processes, also producesmall amounts of undesirable air pollution during their usage. The main forms of air pollution ofconcern are as follows.
• Particulate matter (PM). This includes larger soot and smoke particles as well as microscopicparticles which are often divided into particles less than 10µm in size (PM10) and those less than2.5µm in size (PM2.5). The term “black carbon (BC)” is used to refer to PM that is composed ofonly carbon.
• Various oxides of nitrogen, collectively referred to as NOx
• Sulfur dioxide (SO2)• Carbon monoxide (CO)—not to be confused with CO2
• Ground-level ozone (O3)—not to be confused with the stratospheric ozone which is found in the“ozone layer”
• Volatile organic compounds (VOCs)
We believe it is important to stress the difference between air pollution and greenhouse gasemissions, because in popular culture they are often mistakenly conflated. As a result, many peopleassume that policies which aim to reduce greenhouse gas emissions are synonymous with reducingair pollution, and vice versa. Indeed, we note that media articles and reports on climate changeand/or greenhouse gas emissions will often include images or video footage of scenes of air pollution(or sometimes footage of steam exhausts coming from industry), see, e.g., in [188]. This may be becausemedia images or footage of carbon dioxide (CO2) are physically impossible as CO2 is an invisible,odorless, tasteless gas. We also stress that due to its role in the photosynthesis/respiration cycle, CO2 isa source of fertilization driving an increase in global greening [72,189], regardless of its relevance as adriver of climate change. Therefore, in this subsection, we are explicitly excluding the greenhousegases discussed in Section 4.1 from what we consider “air pollution”.
A lot of literature exists collectively arguing that all of the forms of air pollution listed above areharmful to human health [190–194]. However, the reliability, reproducibility, and/or statistical robustnessof many of the studies that claim to have identified causal links with disease outcomes have beenquestioned [194–196]. For example, from a review of meta-analyses to elucidate associations betweenambient air pollutants and various health outcomes, Sheehan et al. (2016) list 30 meta-analyses indicatingonly modest if any increases in mortality associated with exposure to the pollutants above [194]. Mindfulthat multiple hypothesis testing and multiple modeling, p-hacking, and publication bias can resultin false-positive effects becoming established fact, Young and Kindzierski (2019) evaluated a highlycited meta-analysis paper examining whether air quality exposure triggers heart attacks. They foundthat the conclusions of that paper did not withstand critical scrutiny because the shapes of the p-valueplots were consistent with analysis manipulation in some of the base papers [196]. From time seriesanalysis of a large dataset for air quality and acute deaths in California, Young et al. (2017) foundno association between ozone or PM2.5 and acute deaths, and therefore no evidence of causal effectin California. They found that daily death variability was mostly explained by season or weathervariables [195]. Therefore, we advise the reader to treat cautiously the many claims to have identifiedcausal links between air pollution and human disease outcomes.
Given the fact that all of the above air pollutants are naturally occurring, policy-makers shouldbe wary of so-called “zero tolerance” policies with regards to air pollution. All of the above forms of“air pollution” would be present in the atmosphere to some degree even in the absence of the humanspecies, so measures to attempt to completely eradicate all “air pollution” are physically impossible.
Nonetheless, most people would probably agree that severe pollution is at the very least unpleasant.For this alone, policies that reduce air pollution in regions with air quality concerns can often haveconsiderable public support. We have identified three key sources of air pollution which seem to beparticularly relevant for energy policy:

Energies 2020, 13, 4839 28 of 49
(1) Air pollution from electricity generation (chiefly from coal-burning plants) and industry(2) Air pollution arising from transport, particularly during traffic(3) Air pollution from the household burning of solid fuels (chiefly biomass, but also coal)
All three are issues that can cause air quality problems in urban areas, but the third issue is also amajor concern for many rural communities in the developing world, due to indoor air pollution.
4.3.1. Air Pollution from Electricity Generation
Electricity generation is often associated with some air pollution from the exhausts of the generatingplants, e.g., oxides of nitrogen (NOx), sulfur dioxide (SO2), particulate matter (PM) including soot, volatileorganic compounds (VOCs), and ozone. Turconi et al. (2013) [197] carried out a detailed meta-analysisreview of 167 studies to estimate the life cycle average emissions of the first two of these (NOx and SO2)from most of the main forms of electricity generation. We have plotted the results in Figure 14.
Energies 2020, 13, x FOR PEER REVIEW 28 of 50
Nonetheless, most people would probably agree that severe pollution is at the very least unpleasant. For this alone, policies that reduce air pollution in regions with air quality concerns can often have considerable public support. We have identified three key sources of air pollution which seem to be particularly relevant for energy policy:
(1) Air pollution from electricity generation (chiefly from coal-burning plants) and industry (2) Air pollution arising from transport, particularly during traffic (3) Air pollution from the household burning of solid fuels (chiefly biomass, but also coal)
All three are issues that can cause air quality problems in urban areas, but the third issue is also a major concern for many rural communities in the developing world, due to indoor air pollution.
4.3.1. Air Pollution from Electricity Generation
Electricity generation is often associated with some air pollution from the exhausts of the generating plants, e.g., oxides of nitrogen (NOx), sulfur dioxide (SO2), particulate matter (PM) including soot, volatile organic compounds (VOCs), and ozone. Turconi et al. (2013) [197] carried out a detailed meta-analysis review of 167 studies to estimate the life cycle average emissions of the first two of these (NOx and SO2) from most of the main forms of electricity generation. We have plotted the results in Figure 14.
Figure 14. Estimates of the (a) NOx and (b) SO2 emissions from electricity generation using different types of generation. Data from Table 2 of Turconi et al. (2013) [197]. Figure 14. Estimates of the (a) NOx and (b) SO2 emissions from electricity generation using differenttypes of generation. Data from Table 2 of Turconi et al. (2013) [197].
Turconi et al. (2013) compared the emissions of NOx and SO2 of electricity generation from fossilfuels, nuclear, and renewable energy. According to their data, coal (whether lignite or hard coal) andoil produce both NOx and SO2 in considerable quantities, while natural gas and biomass produceconsiderable quantities of NOx, but not as much SO2. On the other hand, nuclear power, hydropower,

Energies 2020, 13, 4839 29 of 49
and wind produce very low emissions of both pollutants, and the emissions associated with solarenergy are modest.
The use of coal, oil, natural gas (i.e., the fossil fuels), and to a lesser extent biomass (one of therenewables) for electricity production is associated with air pollution from NOx and SO2. Therefore,one approach to reducing these emissions could be to transition to some combination of nuclear power,hydropower, wind, and to some extent solar power. However, another approach is to reduce thepollutants that are emitted before they leave the plant [134]. Several technologies have been developedto remove air pollutants from emissions from coal-fired thermal power plants, including wet scrubbers,electrostatic precipitators (ESP), and fabric filters to remove particulate matter; selective catalyticreduction (SCR) and selective non-catalytic reduction (SNCR) to remove oxides of nitrogen (NOx);and wet flue gas desulphurization (WFGD) to remove sulfur dioxide [198]. Scrubber systems for useon smaller-scale biomass combustion and gasification systems have also been developed [199,200].
Therefore, air pollution can be largely avoided, even when using fossil fuels or biomass, providedthat such scrubber-type systems are installed and operated. However, these systems do increase thecost of electricity generation, and so they are still not widely implemented in developing nations thatare prioritizing minimizing cost over minimizing pollution. With that in mind, an alternative methodto reducing (but not eradicating) air pollution could be to transition from coal to natural gas. As canbe seen from Figure 14, this substantially reduces SO2 emissions and can sometimes partially reduceNOx emissions [131,132]. It has also been shown to substantially reduce emissions of PM, smoke andsmog [133]. Another approach to reducing SO2 emissions is to use low-sulfur content coal instead ofthe more common (and typically cheaper) high-sulfur content coal [201].
4.3.2. Urban Air Pollution from Transport
One of the main sources of air pollution in urban areas is that arising from the transportationsector, e.g., cars, trucks, as well as public transport [202–206]. We note that pollution from traffic hasprobably always been an issue for urban areas, although its form can change. For instance, in the19th century, the build-up of horse manure from horse-powered transport was a growing concern,particularly for busy cities [207]. Therefore, many of the main policies for reducing urban air pollutionfocus on the transport sector.
In industrialized countries, regulatory controls on vehicle exhaust fumes have successfullyreduced emissions of nitrogen oxides, carbon monoxide, volatile organic compounds and particulatematter [204]. However, in many developing countries, air pollutant emissions have been growingstrongly (Uherek et al., 2010) [202]. Furthermore, even in developed countries with regulatory controlson emissions, the large quantity of vehicles in built-up areas (particularly those with traffic problems)can reduce the air quality.
One approach is to encourage commuters and urban dwellers to walk or cycle more often insteadof driving. This may also have added health co-benefits by encouraging people who might otherwisehave relatively sedentary lifestyles to exercise more. A related approach is to encourage more use ofpublic transport. As discussed in Section 4.1, if large numbers of commuters are able to carry out muchof their travel via shared public transport (e.g., buses, trams, or trains), then this may reduce the totalhourly emissions for the area. That said, it is worth remembering that if, for example, too many roadsor road lanes are set aside for bicycle lanes or bus corridors, this may increase traffic congestion amongthe remaining motorists, potentially increasing emissions, because exhaust emissions per kilometertravelled can increase when cars or trucks are idling and stopping/starting due to traffic congestion.
With that in mind, there is much focus on reducing the emissions from vehicles through, e.g.,changing fuel types. However, changing fuel type can often reduce one form of air pollution only toincrease others [203–206].
Another approach might be to encourage motorists to switch to using electric vehicles orhybrid vehicles [165–167]. However, again, we remind readers of the discussion in Section 3.3.3,and particularly the observations of Herrington et al. (2019) [58] and Mills (2020) [45] that the amount
Energies 2020, 13, 4839 30 of 49
of limited materials such as cobalt and lithium which would be required to switch even a small fractionof the ~2 billion cars to EVs is enormous.
4.3.3. Air Pollution from the Household Burning of Solid Fuels
If a large number of houses in an urban area rely on burning solid fuel (e.g., coal) for heatingand/or cooking, then this can significantly contribute to urban air pollution, including haze and smogevents [193,208,209]. It can also cause substantial indoor air pollution, and this is a major problemfor many rural communities, especially in the developing world. Approximately 3 billion people inthe world rely on solid fuels most of their household energy needs, of which ~2.4 billion use biomass(mostly wood, charcoal, animal dung, or crop wastes), while the rest use coal [190,191,210–213].The majority of these people are in rural communities in developing nations.
The reliance of these households on biomass for most of their energy needs means that nominallythey may appear to be major “renewable energy” advocates. However, mostly the reality is that it is notan intentional choice. Approximately 1.3 billion people still do not have a connection to electricity [213],and for many in poverty, the use of biomass as a fuel for cooking, heating, and/or lighting is a pragmaticnecessity [210]. For instance, Gupta (2020) notes that, “In Ethiopia, more than 95% of the householdsdepend on biomass energy for cooking and over 70% do not have access to reliable electrical energy atleast for basic purposes (lighting and appliances)” [210]. This use of wood and charcoal as a primaryfuel is a significant contributor to tropical deforestation, especially on the African continent [214,215].This reliance on the burning of solid fuel indoors also means that many rural householders are exposedto considerable amounts of indoor air pollution on a daily basis [190,191,210–213].
One way to reduce the amount of this indoor air pollution would be to help householders withlow-quality cookers and/or fuels to switch to improved products which generate less pollution [210,212,213].However, broadly, the main problem is one of poverty and/or lack of access to electricity. It has beensuggested that there is a ladder of the main household energy source with increasing income, roughly asfollows, crop residue/animal dung→wood→ charcoal→ kerosene→ liquefied petroleum gas (LPG)→electricity [213]. Therefore, we suggest that the most straightforward policies for reducing the worldwideproblem of indoor air pollution would be those that help developing nations out of poverty and/or provideelectricity supplies to those who do not yet have one.
4.4. Protecting Biodiversity
McDonald et al. (2009) [53] caution that, while many studies have quantified the likely impacts ofclimate-driven habitat loss on biodiversity, relatively few studies have evaluated the habitat impact ofspatial extent of energy production, or “energy sprawl”. Biodiversity is defined as a contraction of theterm: biological diversity”, referring to the range of variety among and between living organisms [216].The places, spaces, or zones where organisms live are known as “habitats” [217]. In general, energyproduction can have impacts on biodiversity through land use and land cover change (LULCC), airquality, and water quality [53]. LULCC tends to give rise to habitat replacement and habitat fragmentation,which tend to scale with areal impact, while air quality and water quality impacts tend not to.
Energy sprawl is defined as the product of annual energy production (e.g., TWh/yr) and landuse intensity of energy production (e.g., km2 per TWh/yr). Since land use intensity is the inverse ofpower density, energy sprawl is inversely proportional to power density and varies by three ordersof magnitude. Thus, the energy sprawl associated with nuclear power and coal is least, while thatassociated with biomass-generated electricity and biofuels is several hundred times greater, and thatassociated with wind, hydro and solar power is intermediate [53].
In addition, McDonald et al. (2009) [53] point out that some energy production technologiesinvolve clearance of all natural habitat within their area of impact. This is true for nuclear, coal,solar, hydro power, and growth of biomass or biofuel crops. Other energy production technologieshave a relatively small infrastructure footprint, with larger areas impacted by habitat fragmentation.This is true of techniques that involve wells, e.g., geothermal, natural gas, and oil, for which about

Energies 2020, 13, 4839 31 of 49
5% of the impact area is due to direct land clearance, while 95% is due to habitat fragmentation andspecies avoidance behaviors. Similarly, ~3–5% of the impact area of wind turbines is due to directland clearance, while 95% is due to habitat fragmentation, species avoidance behaviors, and bat andbird mortality.
Through an extensive review of the literature regarding the impacts of renewable energies onecosystems and biodiversity, citing hundreds of earlier authors, Gasparatos et al. (2017) [55] identifiedthe main mechanisms of ecosystem change and biodiversity loss for renewable energy pathwaysincluding solar, wind, and bioenergy, along with interventions to mitigate their adverse impacts.These are outlined with regard to bioenergy, hydro, solar, and wind, below.
Direct and indirect land use change from the expansion of biomass feedstock for energy productionhave resulted in habitat and biodiversity loss, especially when large-scale land conversion usingmonocultural feedstock production is adopted [55]. In addition, the authors cite several life cycleassessments (LCAs) which have demonstrated that most biomass energy production pathways emitair and water pollutants that can have negative effects on biodiversity via eutrophication, acidificationand toxicity. Atmospheric emissions from key biomass energy species such as eucalyptus, poplar andwillow contribute to tropospheric ozone formation, which is harmful to plant life.
They cite several studies that offer examples of negative biodiversity outcomes of biofuel-drivenhabitat loss and change around the world. For example, oil palm cultivation in Southeast Asia hasmainly replaced primary/secondary tropical forests rather than agricultural land. In the US, soybeanfor biodiesel and corn/sugarcane for bioethanol will have a consistently larger effect on future land usechange than other renewable energy pathways [55]. Fargione et al. (2010) estimate that biodiversity isreduced by ~60% in US corn and soybean fields, and by ~85% in Southeast Asian palm oil plantations,relative to unconverted habitat [54].
The use of fertilizers/agrochemical runoff and industrial effluents from biofuel production aremajor sources of water pollution in Brazil and Southeast Asia. Ecotoxicity effects due to pesticide usecan also pose risks to biodiversity [55].
The New York Times Magazine’s 2018 coverage of palm oil grown to meet a US biofuels mandateillustrates the controversy that can befall the policy-maker advocating in favor of biofuels [218].The feature is headed: “Palm oil was supposed to help save the planet. Instead it unleashed acatastrophe.” While the office of Nancy Pelosi, Speaker of the House of Representatives, has defendedthe mandate, arguing that biodiesels are cleaner than fossil fuels, Representative Henry Waxmanargues that Congress was so focused on domestic climate policy that it failed to see the repercussionsof its climate policies around the world. “We’re doing more harm to the environment,” Waxman says.“It was a mistake” [218].
The environmental impacts of hydro power depend on the scale and type of power installationinvolved. Large hydro, involving a reservoir created by damming a river, has much greater impactthan “run-of-river” (ROR) installations, which may use a small dam to generate a head of water,or installations using in-stream turbine technology, which do not rely on damming the river [155].River dams constructed for hydro power or other uses have impacts on seasonal variation indownstream flow and on the transport and transformation of nutrients including carbon (C), nitrogen(N), phosphorus (P), and silicon (Si) along the length of the river from the reservoir to the ocean.The interruption of seasonal flows can have adverse impacts on aquatic and estuarine flora and faunathrough alterations in water depth, salinity, and temperature. Alterations in nutrient concentrationsand ratios can cause eutrophication and harmful algal blooms (HAB’s) in coastal zones [219].
Finer and Jenkins (2012) lament a lack of strategic planning with regard to the regional andbasin-scale assessment of potential ecological impacts of hydropower [156]. From an ecological impactanalysis of 151 dams of greater than 2 MW planned to be constructed over the following 20 years,they classified 47% as high-impact and just 19% as low-impact, and they estimated that 80% woulddrive deforestation due to new roads, transmission lines or flooding of reservoirs. Sixty percent of

Energies 2020, 13, 4839 32 of 49
the dams would cause the first ever major break in connectivity between Andean headwaters and thelowland Amazon.
Mitigation measures to reduce the impacts of hydropower installations on ecosystems andbiodiversity include (a) selecting hydropower technologies that have less severe impacts, (b) usingbiodiversity-friendly elements such as bypass flows, and (c) implementing innovative policies suchas regulatory measures [55]. Moran et al. (2018) indicate that the environmental impacts of hydrodams can be mitigated through hydropower installations that utilize in-stream turbine technology, alsoknown as “zero-head”, sited in rivers with flow velocity exceeding 1 m/s to produce steady baseloadpower and avoid intermittency associated with variation in seasonal flows [155]. For best outcomes,they recommend that environmental impact assessments (EIA) and social impact assessments (SIA)be conducted by independent firms rather than dam construction companies. Almeida et al. (2019)point out that steeper topography favors higher power densities [220]. Dams in mountainous areas ofBolivia, Ecuador, and Peru tend to have higher power densities than lowland Amazon dams of Brazil.
Utility-scale solar energy (USSE) can affect ecosystems in multiple ways throughout its life cycle(i.e., construction, operation, and decommissioning) [55]. Habitat loss can arise from solar powerinfrastructure, particularly USSE, as it occupies substantial tracts of land. Supporting infrastructure(e.g., access roads and electrical equipment) and spacing between panels can result in actual spacerequirements being approximately 2.5 times the total area of the panels themselves. Solar energyinstallations have also been associated with pollution of land and water because cleared land is oftenmaintained with dust suppressants and herbicides [55].
Proposed mitigation measures to reduce the impacts from the deployment of solar energy onecosystems and biodiversity include (a) locating USSE installations in areas with little biodiversityand (b) developing biodiversity-friendly operational procedures. USSE installations can sometimes bedeveloped in desert areas that combine high levels of solar insolation with relatively little cloud coverand biodiversity. However, some desert ecosystems host highly specialized and rare species that areknown to be particularly vulnerable to human activity [55]. Some of the impacts on habitats can bereduced by mounting solar PVs on rooftops and building facades, e.g., in urban settings, because solarpanels mounted on existing structures do not convert or fragment habitats [55].
Wind energy installations can have a number of ecological impacts on avian and aquatic species,depending largely on whether they are located on shore or off shore [55]. Despite many improvementsin wind turbine design, wildlife mortality, especially among birds of prey, remains high [221,222].On-shore habitat loss may arise through bird and bat species avoiding areas containing wind generators.Habitat change can arise from the collision of birds (particularly raptors) and bats with the windgenerators [221–224]. An estimated 234,000 birds are killed annually from wind turbines in theUnited States alone [222]. Bats suffer more than birds, with the impact estimated to be to the orderof tens of bat fatalities per turbine per year. The construction of offshore turbines is hazardous tomarine mammals, especially because of noise generated during pile-driving which can be heard atdistances of up to 80 km under water [225,226]. Marine mammals often avoid areas of underwaterconstruction, only slowly returning after construction is completed [225]. On a more positive note,once established, the foundations of the turbines can be colonized by marine life creating an artificialreef or sanctuary [227].
Common mitigation measures to reduce the impact of wind energy generation on ecosystemsand biodiversity include (a) locating wind power installations in areas of little biodiversity and (b)developing biodiversity-friendly operational procedures for wind energy generation. In contrast tosolar power, the most suitable places to locate wind turbines may also be places that could cause mostdamage to avian biodiversity. For example, while most proposed sites for on-shore wind farms inthe UK are located in upland areas, these remote windy locations are also areas of high conservationimportance for birds. Biodiversity-friendly operational procedures include minimizing the overalldevelopment footprint, e.g., by installing transmission cables underground, and minimizing the risk

Energies 2020, 13, 4839 33 of 49
of collision, e.g., by making blades more visible or grouping them in configurations aligned with themain flight pathways [55].
On assessing the current and likely future extent of RE production infrastructure associated withonshore wind, solar, and hydropower within conservation areas, Rehbein et al. (2020) identified2206 fully operational RE facilities located within protected areas, key biodiversity areas, and Earth’sremaining wilderness, with another 922 facilities under development [228]. However, Sonter et al.(2020) caution that the impacts of mining activities associated with RE production infrastructure maybe more extensive than those of their spatial footprint or other environmental risks. On mapping theglobal extent of areas potentially impacted by mining, they find that habitat losses associated withfuture mining for RE could present threats to biodiversity that surpass those averted by climate changemitigation [229].
The fossil fuels and nuclear power likewise have various biodiversity impacts. Acar and Dincer(2019) ranked a range of power sources according to a number of environmental impacts, includingbiodiversity [230]. They found that coal has a high impact, via its impacts on air quality, water qualityand land contamination, while gas has low impact, and nuclear has moderate to high impact onbiodiversity. Brook and Bradshaw (2015) [51] concur that, because of its very high power densityand small land requirements, nuclear power offers good prospects for baseload power with modestbiodiversity impacts.
5. Socioeconomic Concerns Associated with the Various Energy Technologies
In Section 4.3.3, we noted that, in the developing world, ~1.3 billion people still do not haveaccess to an electricity supply. Moreover, we noted that ~3 billion people rely on the householdburning of solid fuel for most of their energy needs (cooking, heating, and lighting), and that formost of these (~2.4 billion), this fuel usually consists of wood, charcoal, animal dung, or cropwastes [190,191,210–213]. Technically, these “biomass” fuels are “renewable energies”, but as discussedin Section 3.3.1, this does not imply that their use is “sustainable”. Technically, biomass is considered“carbon-neutral”, and therefore the promotion of the use of biomass (and the related “biofuels”) is oneof the strategies for reducing greenhouse gas emissions (Section 4.1). Indeed, from Table 1, we see thatat least 3% of the US$3.66 trillion of global climate change expenditure over the 2011–2018 period hasbeen spent on “biomass and waste” and “biofuels” projects.
Therefore, nominally, it could be argued that, in terms of keeping CO2 emissions low, thesedeveloping nations are among the most successful. As discussed in Section 4.1, many currently considerreducing CO2 emissions to be one of the top priorities for the world, especially in terms of preservingthe environment. However, the reality is that this apparent “success” has nothing to do with policiesto protect the environment, but is chiefly a result of poverty, especially in rural communities. Indeed,the use of biomass as solid fuel in rural communities has been shown to be a significant driver oftropical deforestation, especially on the African continent [214,215].
More broadly, a substantial body of literature has found empirical evidence that the so-called”environmental Kuznets curve” (EKC) appears to apply to many environmental indicators, althoughnot all [136,231–234]. The EKC hypothesis developed in the 1990s partly out of earlier debates betweenthe neo-Malthusians and cornucopians in the 1970s (Section 3.3.1). In 1955, Simon Kuznets proposedan “inverted U curve” relationship between income inequality and economic growth, i.e., that as acountry developed economically, income inequality would initially increase, but after some turningpoint, further economic growth would begin to reduce income inequality again. This became knownas the Kuznets curve.
Starting in the 1990s, numerous studies found considerable empirical evidence that for manyenvironmental indicators, particularly those associated with local air pollution (Section 4.3); there appearsto be a similar relationship between economic growth and environmental impacts [136,231–234], i.e.,the environmental Kuznets curve (EKC). This implies that, in the short-term, encouraging developingnations to develop may lead to environmental degradation, but that, in the long-term, once they have passed

Energies 2020, 13, 4839 34 of 49
the relevant “turning points”, further development will reduce environmental degradation. However,the same analyses which reveal that the EKC applies to local forms of pollution also show that it does notapply to issues that are more global in nature, e.g., CO2 emissions [10,231,232,234].
On the contrary, on average, CO2 emissions appear to increase with economic development. Thishas led those prioritizing reducing global CO2 emissions to explicitly warn that we should not rely onthe EKC to automatically lead to CO2 emissions reductions. Instead, they argue that new paths fordevelopment need to be designed which explicitly incorporate CO2 reduction as an additional toppriority [10,232,234].
We want to emphasize some important corollaries of the above:
(1) The goal of reducing global CO2 emissions is directly opposed to the standard pathways ofeconomic development which have been followed historically.
(2) We stress that this does not in itself preclude the possibility that alternative pathways to economicdevelopment which also reduce global CO2 emissions could exist. Indeed, as discussed inSection 4.1, France and Sweden are two notable examples of developed nations that combinedeconomic growth with relatively low CO2 emissions through investment in nuclear [52]. Therefore,research into exploring the possibilities of new pathways to economic development is justifiableand laudable [10,52,232,234]. However, we should acknowledge that new pathways by their verynature will not have been tested to the extent of the standard historic pathways.
(3) Aside from CO2 emissions, and despite the neo-Malthusian predictions discussed in Section 3.3.1,the EKC studies confirm that the standard pathways to economic development actually lead toreductions in environmental degradation for many aspects of the environment, especially thoseassociated with local pollution.
In other words, the most straightforward routes for helping nations develop and/or reducingworld poverty fundamentally conflict with the goal of reducing CO2 emissions. We suggest that evenwithin developed nations, policies to reduce CO2 emissions similarly are often at odds with improvingthe livelihoods of the less affluent in society.
For example, one policy tool which is often promoted as being potentially useful for reducing CO2
emissions is the implementation of “carbon taxes”. Carbon taxes can take many forms, but typically penalizethe use of forms of energy that are associated with relatively high CO2 emissions. Researchers studyingthe socioeconomic implications of various carbon taxes in multiple countries have found that carbon taxes“tend to be regressive”, i.e., the burden tends to be greatest on the poorest households [235–240]. That is,while the absolute tax paid by richer households is often greater, as a percentage of their income it tendsto be much lower. Suggestions have been made about how to partially mitigate against this regressivenature by, e.g., explicitly coupling the carbon tax with additional tax breaks for lower income groups forother taxes, or redistributing some of the tax revenue directly to lower-income groups via social welfaresupplements [235–240]. However, it indicates that carbon taxes have an underlying tendency towardsgreater income inequality.
Carbon taxes also may be biased against rural dwellers [239–242], e.g., if the carbon tax is designedto encourage the use of public transport systems which do not adequately service rural communities.Indeed, the “Mouvement des Gilets Jaunes” (“Yellow Vest Movement”) protest movement in Francewhich began in late 2018 appears to have been motivated by resentment over increasing carbontaxes on motor fuel, which were perceived to be unfairly biased against rural communities that weremore reliant on motor transport [241,242]. (The name refers to the yellow high-visibility jacketsthat car-owners are obliged to keep in their car under recent regulations, and hence were worn asa symbol of the movement.) Prud’homme (2019) notes the irony that France happens to already beone of the most decarbonized developed nations, since the French electricity grid is 85% nuclear andhydroelectric [242].
Chancel and Piketty (2015) note that there is an additional regressive nature to carbon taxes whenconsidered on an international basis [243]. That is, the introduction of the same carbon tax to multiple
Energies 2020, 13, 4839 35 of 49
countries will tend to create greater burdens on lower income countries. With that in mind, they haveproposed the possibility of creating a global “carbon tax” towards a “climate adaptation fund” wherethe taxes would be greater for higher-emissions countries, and the funds would be mostly distributedto developing nations [243].
There is an additional irony in this conflict between the standard pathways to economicdevelopment and reducing CO2 emissions in that developing nations are often the least well-adaptedto dealing with climate change and/or weather extremes. For instance, while hurricanes can causeconsiderable damage when they make landfall in the United States [244], many neighboring nationsin the Caribbean or along the Gulf of Mexico are particularly vulnerable [245,246]. Although recentresearch has confirmed that there has been no long-term trend in the number or intensity of hurricanesmaking landfall in the area [244,247], the destructive nature of these extreme weather events coupledwith the infrequency with which they strike any given region can cause devastating effects. Therefore,investment into “climate adaptation” infrastructure, e.g., improved resilience for hurricanes [245] alongwith better hurricane response systems can be worthwhile investments in at-risk hurricane zones [67,248].However, these often require substantial economic investment which can be out of reach for lower-incomecountries. With that in mind, it is surprising that only 5% of the global climate change expenditure overthe 2011–2018 period has been spent on “climate adaptation” projects (Figure 1 and Table 1).
We agree with Pielke Jr. [67,248] and Chancel and Piketty (2015) [243] that greater investment in“climate adaptation” makes sense if society wants to better respond to climate change and extremeweather. However, we also note from the discussion above that one of the key ways to help developingnations to improve their resilience to weather extremes is to encourage their economic development.In particular, having continuous access to an affordable and reliable electricity and energy infrastructureis essential. With that in mind, Epstein (2014) has made the “moral case for fossil fuels” [8], arguing thatthe standard pathways to economic development making extensive use of coal, oil, and/or gas havebeen well tested and should be encouraged. Others caution that this would lead to substantial increasesin CO2 emissions, and favor the development of nuclear instead [20,21,23,42–44,51,52]. Helm (2018)argues that a temporary transition from coal and oil to gas for a few decades could offer a compromisebetween the two approaches that would allow time for a slower long-term energy transition [41].
Finally, we note that there are often societal conflicts associated with energy policies when theyimpact on indigenous peoples without adequate consultation. Klein (2015) describes the struggles ofindigenous peoples in Canada and Australia to restrain the fossil fuel industry from degrading theirlands and waters [17], but the materials needed for other energy sources also pose a threat of severeadverse impacts on indigenous peoples, such as
• silver mining on the Xinca indigenous peoples of Guatemala [117]• lithium mining on Atacama communities in Argentina [249]• cobalt mining on indigenous peoples in Katanga, Democratic Republic of Congo [250]• uranium mining on the Mirarr people of Australia’s Northern Territory [251].
Hydroelectric dams can likewise have severe impacts on the Munduruku [252] and otherindigenous peoples throughout the Amazon Basin [156].
Additionally, Gilio-Whitaker (2019) [253] and Estes (2019) [254] have detailed the impacts onNative American land rights of a range of energy industries. Gilio-Whitaker frames the contaminationof Indian lands and waters for uranium mining and fossil fuel extraction, along with the flooding ofancestral lands to construct hydropower dams, as processes in the displacement and colonization ofNative Americans. Estes [254] similarly documents the history of construction of hydroelectric damsas a driver of dispossession of Lakota people and of coerced population shifts from their traditionallands to urban centers. Both authors have detailed the series of events by which the Dakota AccessPipeline was laid through Native American lands in North Dakota, without the consent of the StandingRock Sioux Tribe, whose lands and waters are placed at risk of contamination by pipeline leaks. Fromthe perspective of these indigenous scholars, it seems that the settler state consistently engages in

Energies 2020, 13, 4839 36 of 49
coercive practices to impinge on indigenous lands, regardless of which energy technology is underdevelopment. Kelly (2016) notes failure to consult as one of the causes of failure of ambitious projects,and this seems relevant in the context: regardless of which energy technologies we choose, consultationwith indigenous peoples is required to safeguard land rights, social equity, and wellbeing [20].
6. Discussion
In the introduction, we argued that none of the main energy sources currently available orcurrently used (Section 2) should be considered as a “panacea”. Instead, each energy source has itspros and cons and we recommend that energy policy-makers consider both. In Table 2, we summarizethe key engineering and environmental concerns which we considered in Sections 3 and 4, respectively,for each of the main energy sources. For brevity, we have not included the socioeconomic concernswhich were discussed in Section 5, but we recommend these also be explicitly considered.
In Section 3.1, we noted that the three “intermittent” (or “non-dispatchable”) energy sources, i.e.,wind, solar, and tidal, are very unsuitable for societies that require a continuous, on-demand, electricitysupply. This is indeed what has been the norm since the age of electrification began in the early 20thcentury. We urge policy-makers to recognize that policies which rely on any of these three sourcesas part of their grid will face increasing problems of grid instability with increasing penetration ofthe network. Although advocates of these three sources imply that these problems can be partiallyovercome through the use of energy storage technologies and/or major continental-scale transmissionnetworks, this appears to be based more on wishful thinking than pragmatism.
We note that wind farms also cause considerable local climate change (Section 4.2) and can causeproblems for biodiversity (Section 4.4). Although wind farms are associated with relatively low directCO2 emissions (Section 4.1), we suggest that the local night-time soil heating effect of wind farms maybe leading to an increase in biological CO2 emissions, which may cancel some (or perhaps all) of thesavings relative to other energy sources (Section 4.2.4).
In terms of power density, the three main fossil fuels (coal, oil and gas) and nuclear are orders ofmagnitude better than any of the renewables (Section 3.2). Currently, those four technologies accountfor 89% of the world’s energy usage (Section 2), so policies which significantly reduce that percentagemay potentially lead to engineering problems due to the reduction in power density. We note that thepower density of biomass and biofuels is by far the lowest. As a result, policies which significantlyincrease the use of biomass and/or biofuels will require particularly large land areas. In Section 4.4,we note that this can lead to increased deforestation and major biodiversity impacts.
In Section 4.4, we also note that hydroelectricity can lead to threats to biodiversity as well ascontribute to deforestation. There can also be socioeconomic concerns associated with hydroelectricity,due to the displacement of people in the area. In Section 5, we noted that this is a particular concernfor indigenous peoples in certain regions, such as the Amazon River Basin.
One of the main limitations of hydroelectricity and of geothermal is that both technologiesare heavily dependent on local geography requirements (Section 4.1). Geothermal can be veryeffective in regions with thermal springs (e.g., Iceland), and hydroelectricity can be very effective incertain mountainous regions with large local rivers (e.g., Norway). However, suitable sites are quitelimited geographically.
The three main fossil fuels (coal, oil, and gas) have collectively powered most of the IndustrialRevolution since the 19th century, and, as of 2018, they still provide 85% of the world’s energy. Becausethese are finite resources, there is concern about how long society can continue to rely on them.However, as discussed in Section 3.3.2, the estimated known reserves of coal, oil, and gas shouldprovide enough energy at current rates for several more decades at least, and historically the knownreserves have continued to expand over time to surprise commentators that have predicted “peak oil”,“peak gas”, or “peak coal”. Therefore, while we should recognize them as finite resources, they are stillin plentiful supply—for now, at least.

Energies 2020, 13, 4839 37 of 49
Table 2. Summary of the engineering and environmental concerns associated with each of the main energy sources which were discussed in this review. This table is notmeant to be comprehensive or definitive, but merely to provide a quick overview of the main topics described in more detail in the text. For brevity, the socioeconomicconcerns discussed in the review were not included.
Engineering Concerns Environmental Concerns
Intermittency Power Density Resource Depletion Greenhouse Gas(GHG) Emissions
AirPollution
BiodiversityConcerns Other Environmental Concerns
ElectricityCoal No High Finite, but substantial reserves High High Moderate Mining impactsPeat No High Finite High High High Unique biomesOil No High See “Peak oil” debate High Moderate Low Possibility of oil spills
Natural gas No High See “Peak gas” debate Moderate Low Low Potential impacts from “fracking”Nuclear No High Finite, but substantial reserves Low Low Low Waste disposal, possible meltdowns
Hydroelectricity No Low Limited by geography Low Low Moderate Alters local environmentBiomass No Very low Requires large land areas “Carbon-neutral” High Very high Competition with agriculture
Geothermal No Low Limited by geography Low Low LowSolar Yes Low Resource-heavy construction Low Low Moderate Disposal of wasteWind Yes Very low Resource-heavy construction Low Low Moderate Causes local climate changeTidal Yes Low Resource-heavy construction Low Low Low
TransportOil No High See “Peak oil” debate High High Low Possibility of oil spills
Biofuels No Very low Requires large land areas “Carbon-neutral” Moderate Very high Competition with agricultureEVs * * Major concern Very low Very low Low Disposal of waste
* The relevance of intermittency and power density to EVs depends on the source of electricity.
Energies 2020, 13, 4839 38 of 49
On the other hand, in Section 4.1, we saw that these fossil fuels are the highest net emitters ofCO2 per kWh of electricity, and in Section 4.3, we noted that their use is associated with air pollution,although various approaches have been proposed to reduce the amount of air pollution.
As an aside, we do not include peat among the three fossil fuels mentioned above, as peat resourcesare relatively limited and only comprise a significant fraction of energy usage in a few places, e.g.,Ireland [130], although De Decker (2011) has noted that peat was an important fuel in the pre-industrialMiddle Ages for The Netherlands [255].
Finally, nuclear energy has created a lot of public concern, chiefly about potential accidents and/orthe safe disposal and management of waste. That said, in Section 4.1, we noted that, while nuclearaccidents have on average been the most expensive, they were responsible for only 2.3% of the deathsin energy-related accidents. Moreover, supporters of nuclear argue that the disposal and managementof waste can be, and is, satisfactorily resolved.
7. Conclusions
Given that all of the energy sources have their advantages and disadvantages, the reader maybe wondering which ones to use. We suggest that policy-makers who are trying to decide betweenvarious energy policies should consider what their main priorities are, and which priorities they areprepared to compromise on. This may be different for different countries, and may change over time.
For example, suppose a government considers reducing CO2 emissions one of its top priorities.In Section 4.1, we suggested seven different approaches for this, but noted that each conflicts withother priorities (also summarized in Section 6). If protecting biodiversity is also a top priority, then theuse of biomass should be avoided, and that of hydroelectricity or wind energy should be treated warily.Meanwhile, if having a stable and reliable electricity supply is also a top priority, then the use of anyof the intermittent sources (wind, solar, or tidal) should be minimized, and governments may wantto prioritize the use of nuclear, or transition from coal or oil to gas, or invest in carbon capture andstorage (CCS) technology.
On the other hand, suppose a government is trying to increase economic growth and/or toimprove social equity. In that case, cheap, affordable, and reliable electricity is probably a top priority.Therefore, some combination of coal, oil, gas, and nuclear would probably make sense. If geothermalor hydroelectricity are suitable for the area, they may also be worth considering. If reducing CO2
emissions is also a top priority, then they may want to reduce the amount of fossil fuels they use anddevelop more nuclear (as France and Sweden have done, for instance), whereas if avoiding the use ofnuclear is a higher priority, then they might want to consider using more fossil fuels instead.
Looking at the breakdown in the US$3.66 trillion which has been spent on global climate changeexpenditure over the period 2011–2018, as described in Figure 1 and Table 1, we saw that 55% wasallocated to solar and wind energy projects. This is a very large allocation for two energy sourceswhich have many disadvantages, as summarized in Section 6. Meanwhile, only 5% has been spent onclimate adaptation, even though investing in climate adaptation can dramatically improve the abilityof societies to deal with climate change and weather extremes. This suggests that global climate changeexpenditure is not being allocated using a critical assessment of the pros and cons of the key policies.We hope that the analysis in this review can remedy this in time.
Author Contributions: All authors contributed to the conceptualization, writing—original draft preparation,review and editing of this paper. All authors have read and agreed to the published version of the manuscript.
Funding: C.Ó., G.Q., and M.C. received no external funding for works on this paper. R.C. and W.S. receivedfinancial support from the Center for Environmental Research and Earth Sciences (CERES), while carrying outthe research for this paper. The aim of CERES is to promote open-minded and independent scientific inquiry.For this reason, donors to CERES are strictly required not to attempt to influence either the research directions orthe findings of CERES. Readers interested in supporting CERES can find details at https://ceres-science.com/.
Acknowledgments: We would like to compliment the Climate Policy Initiative for their efforts in compiling itsannual Global Landscape of Climate Finance reports whose results we used for generating Figure 1 and Table 1,and for providing easy access to these reports on the https://www.climatepolicyinitiative.org/website.

Energies 2020, 13, 4839 39 of 49
Conflicts of Interest: The authors declare no conflict of interest.
References
1. Intergovernmental Panel on Climate Change (IPCC); Pachauri, R.K.; Meyer, L. Climate Change 2014: SynthesisReport; IPCC: Geneva, Switzerland, 2015.
2. UNFCCC. Kyoto Protocol to the United Nations Framework Convention on Climate Change; UNFCCC: New York,NY, USA, 1997.
3. UNFCCC. Addendum. Part two: Action taken by the Conference of the Parties at its twenty-first session.In Proceedings of the Conference of the Parties on Its Twenty-First Session, Paris, France, 30 November–13December 2015; UNFCCC: New York, NY, USA, 2016.
4. Boden, T.A.; Marland, G.; Andres, R.J. Global, Regional, and National Fossil-Fuel CO2 Emissions; Carbon DioxideInformation Analysis Center, Oak Ridge National Laboratory, U.S. Department of Energy: Oak Ridge, TN,USA; Available online: https://doi.org/10.3334/CDIAC/00001_V2017 (accessed on 26 January 2020).
5. Friedlingstein, P.; Jones, M.W.; O’Sullivan, M.; Andrew, R.M.; Hauck, J.; Peters, G.P.; Peters, W.; Pongratz, J.;Sitch, S.; Quéré, C.L.; et al. Global Carbon Budget 2019. Earth Syst. Sci. Data 2019, 11, 1783–1838. [CrossRef]
6. Connolly, R.; Connolly, M.; Carter, R.M.; Soon, W. How Much Human-Caused Global Warming Should WeExpect with Business-As-Usual (BAU) Climate Policies? A Semi-Empirical Assessment. Energies 2020, 13,1365. [CrossRef]
7. Smil, V. Energy and Civilization: A History; Reprint ed.; MIT Press: Cambridge, MA, USA, 2018; ISBN978-0-262-53616-5.
8. Epstein, A. Moral Case for Fossil Fuels; Portfolio Hardcover: New York, NY, USA, 2014; ISBN 978-1-59184-744-1.9. Bezdek, R.; Idso, C.D.; Legates, D.R.; Singer, S.F. Climate Change Reconsidered II: Fossil Fuels; Bast, J.L.,
Bast, D.C., Eds.; The Heartland Institute: Arlington Heights, IL, USA, 2019; ISBN 978-1-934791-45-5.10. Gupta, J. The History of Global Climate Governance, 1st ed.; Cambridge University Press: Cambridge, UK;
New York, NY, USA, 2014; ISBN 978-1-107-04051-9.11. Gore, A. An Inconvenient Truth: The Planetary Emergency of Global Warming and What We Can Do about It, 1st ed.;
Bloomsbury Publishing PLC: New York, NY, USA, 2006; ISBN 978-0-7475-8906-8.12. Gore, A. Inconvenient Sequel, An; Rodale: New York, NY, USA, 2017; ISBN 978-1-63565-108-9.13. Jacobson, M.Z.; Delucchi, M.A. Providing all global energy with wind, water, and solar power, Part I:
Technologies, energy resources, quantities and areas of infrastructure, and materials. Energy Policy 2011, 39,1154–1169. [CrossRef]
14. Jacobson, M.Z.; Delucchi, M.A.; Cameron, M.A.; Frew, B.A. Low-cost solution to the grid reliability problemwith 100% penetration of intermittent wind, water, and solar for all purposes. Proc. Natl. Acad. Sci. USA2015, 112, 15060–15065. [CrossRef]
15. Jacobson, M.Z.; Delucchi, M.A.; Cameron, M.A.; Frew, B.A. The United States can keep the grid stable at lowcost with 100% clean, renewable energy in all sectors despite inaccurate claims. Proc. Natl. Acad. Sci. USA2017, 114, E5021–E5023. [CrossRef]
16. Jacobson, M.Z.; Cameron, M.A.; Hennessy, E.M.; Petkov, I.; Meyer, C.B.; Gambhir, T.K.; Maki, A.T.; Pfleeger, K.;Clonts, H.; McEvoy, A.L.; et al. 100% clean and renewable Wind, Water, and Sunlight (WWS) all-sectorenergy roadmaps for 53 towns and cities in North America. Sustain. Cities Soc. 2018, 42, 22–37. [CrossRef]
17. Klein, N. This Changes Everything: Capitalism vs. The Climate, 1st ed.; Penguin: London, UK, 2015; ISBN978-0-241-95618-2.
18. Goodall, C. The Switch: How Solar, Storage and New Tech Means Cheap Power for All; Main edition; Profile Books:London, UK, 2016; ISBN 978-1-78125-635-0.
19. Clack, C.T.M.; Qvist, S.A.; Apt, J.; Bazilian, M.; Brandt, A.R.; Caldeira, K.; Davis, S.J.; Diakov, V.;Handschy, M.A.; Hines, P.D.H.; et al. Evaluation of a proposal for reliable low-cost grid power with100% wind, water, and solar. Proc. Natl. Acad. Sci. USA 2017, 114, 6722–6727. [CrossRef]
20. Kelly, M.J. Lessons from technology development for energy and sustainability. MRS Energy Sustain. 2016, 3.[CrossRef]
21. Heard, B.P.; Brook, B.W.; Wigley, T.M.L.; Bradshaw, C.J.A. Burden of proof: A comprehensive review of thefeasibility of 100% renewable-electricity systems. Renew. Sustain. Energy Rev. 2017, 76, 1122–1133. [CrossRef]

Energies 2020, 13, 4839 40 of 49
22. Shaner, M.R.; Davis, S.J.; Lewis, N.S.; Caldeira, K. Geophysical constraints on the reliability of solar andwind power in the United States. Energy Environ. Sci. 2018, 11, 914–925. [CrossRef]
23. Brook, B.W.; Blees, T.; Wigley, T.M.L.; Hong, S. Silver Buckshot or Bullet: Is a Future “Energy Mix” Necessary?Sustainability 2018, 10, 302. [CrossRef]
24. Van Kooten, G.C.; Withey, P.; Duan, J. How big a battery? Renew. Energy 2020, 146, 196–204. [CrossRef]25. Greenpeace Canada. Energy Revolution 2015—The Latest Documentation. 2015, p. 364.
Available online: https://www.greenpeace.org/canada/en/press-release/1555/energy-revolution-2015-the-latest-documentation/ (accessed on 14 September 2020).
26. Connolly, M.; Connolly, R.; Soon, W.; Moore, P.; Connolly, I. Analysis of Greenpeace Business Model; HeartlandInstitute: Arlington Heights, IL, USA, 2018; p. 74.
27. Extinction Rebellion. This Is not A Drill: An Extinction Rebellion Handbook, 1st ed.; Penguin: New York, NY, USA,2019; ISBN 978-0-14-199144-3.
28. Thunberg, G. No One Is Too Small to Make a Difference, 1st ed.; Penguin: London, UK, 2019;ISBN 978-0-14-199174-0.
29. DiEM25. European New Deal. DiEM25, 2017; p. 101. Available online: https://diem25.org/wp-content/uploads/2017/03/European-New-Deal-Complete-Policy-Paper.pdf (accessed on 14 September 2020).
30. Friedman, L. What Is the Green New Deal? A Climate Proposal, Explained. New York Times. 2019. Availableonline: https://www.nytimes.com/2019/02/21/climate/green-new-deal-questions-answers.html (accessed on14 September 2020).
31. Rifkin, J. Green New Deal; The St. Martin’s Press: New York, NY, USA, 2019; ISBN 978-1-250-25320-0.32. Klein, N. On Fire: The Burning Case for a Green New Deal; Allen Lane: London, UK, 2019; ISBN 978-0-241-41072-1.33. UNEP. Towards a Green Economy: Pathways to Sustainable Development and Poverty Eradication; United Nations
Environmental Platform: Nairobi, Kenya, 2011.34. Hoggan, J.; Littlemore, R. Climate Cover-Up: The Crusade to Deny Global Warming; Greystone Books: Vancouver,
BC, Canada, 2009.35. Conway, E.M.; Oreskes, N. Merchants of Doubt: How a Handful of Scientists Obscured the Truth on
Issues from Tobacco Smoke to Global Warming; UK edition; Bloomsbury Paperbacks: London, UK, 2012;ISBN 978-1-4088-2483-2.
36. Mann, M. The Hockey Stick and the Climate Wars: Dispatches from the Front Lines; Reprint edition; ColumbiaUniversity Press: New York, NY, USA, 2013; ISBN 978-0-231-15255-6.
37. Marshall, G. Don’t Even Think About It: Why Our Brains Are Wired to Ignore Climate Change; Bloomsbury:London, UK, 2015; ISBN 978-1-63286-102-3.
38. Prins, G.; Galiana, I.; Green, C.; Grundmann, R.; Korhola, A.; Laird, F.; Nordhaus, T. The HartwellPaper: A New Direction for Climate Policy after the Crash of 2009. LSE, 2010. Available online: http://eprints.lse.ac.uk/27939/ (accessed on 14 September 2020).
39. Moore, P.A. Confessions of a Greenpeace Dropout: The Making of a Sensible Environmentalist; Revised, Updateded.; Beatty Street Publishing, Inc.: Vancouver, BC, Canada, 2010; ISBN 978-0-9864808-2-9.
40. Prud’homme, R. Le Mythe des Énergies Renouvelables: Quand on Aime on ne Compte Pas; ARTILLEUR:Paris, France, 2017; ISBN 978-2-8100-0791-2.
41. Helm, D. Burn Out: The Endgame for Fossil Fuels; Revised edition; Yale University Press: London, UK, 2018;ISBN 978-0-300-23448-0.
42. Harjanne, A.; Korhonen, J.M. Abandoning the concept of renewable energy. Energy Policy 2019, 127, 330–340.[CrossRef]
43. Shellenberger, M. Apocalypse Never: Why Environmental Alarmism Hurts Us All; Harper: New York, NY, USA,2020.
44. Lomborg, B. False Alarm: How Climate Change Panic Costs Us Trillions, Hurts the Poor, and Fails to Fix the Planet;Basic Books: New York, NY, USA, 2020.
45. Mills, M.P. Green Energy Reality Check: It’s not as Clean as You Think; Manhattan Institute: New York, NY, USA,2020; p. 20.
46. Murphy, D.J.; Hall, C.A.S. Year in review–EROI or energy return on (energy) invested. Ann. N. Y. Acad. Sci.2010, 1185, 102–118. [CrossRef]
47. Hall, C.A.S.; Lambert, J.G.; Balogh, S.B. EROI of different fuels and the implications for society. Energy Policy2014, 64, 141–152. [CrossRef]

Energies 2020, 13, 4839 41 of 49
48. Denholm, P.; Hand, M. Grid flexibility and storage required to achieve very high penetration of variablerenewable electricity. Energy Policy 2011, 39, 1817–1830. [CrossRef]
49. Weitemeyer, S.; Kleinhans, D.; Vogt, T.; Agert, C. Integration of Renewable Energy Sources in future powersystems: The role of storage. Renew. Energy 2015, 75, 14–20. [CrossRef]
50. Joskow, P.L. Transmission Capacity Expansion Is Needed to Decarbonize the Electricity Sector Efficiently.Joule 2020, 4, 1–3. [CrossRef]
51. Brook, B.W.; Bradshaw, C.J.A. Key role for nuclear energy in global biodiversity conservation. Conserv. Biol.2015, 29, 702–712. [CrossRef]
52. Qvist, S.A.; Brook, B.W. Potential for Worldwide Displacement of Fossil-Fuel Electricity by Nuclear Energyin Three Decades Based on Extrapolation of Regional Deployment Data. PLoS ONE 2015, 10, e0124074.[CrossRef]
53. McDonald, R.I.; Fargione, J.; Kiesecker, J.; Miller, W.M.; Powell, J. Energy Sprawl or Energy Efficiency:Climate Policy Impacts on Natural Habitat for the United States of America. PLoS ONE 2009, 4, e6802.[CrossRef] [PubMed]
54. Fargione, J.E.; Plevin, R.J.; Hill, J.D. The Ecological Impact of Biofuels. Ann. Rev. Ecol. Evol. Syst. 2010, 41,351–377. [CrossRef]
55. Gasparatos, A.; Doll, C.N.H.; Esteban, M.; Ahmed, A.; Olang, T.A. Renewable energy and biodiversity:Implications for transitioning to a Green Economy. Renew. Sustain. Energy Rev. 2017, 70, 161–184. [CrossRef]
56. Capellán-Pérez, I.; de Castro, C.; Arto, I. Assessing vulnerabilities and limits in the transition to renewableenergies: Land requirements under 100% solar energy scenarios. Renew. Sustain. Energy Rev. 2017, 77,760–782. [CrossRef]
57. Herrington, R. Road map to mineral supply. Nat. Geosci. 2013, 6, 892–894. [CrossRef]58. Herrington, R.; Boyce, A.; Lusty, P.; Murton, B.; Naden, J.; Roberts, S.; Smith, D.; Wall, F. Leading scientists set out
resource challenge-of meeting net zero emissions in the UK by 2050. Available online: https://www.nhm.ac.uk/
press-office/press-releases/leading-scientists-set-out-resource-challenge-of-meeting-net-zer.html (accessedon 14 July 2019).
59. Abbasi, S.A.; Abbasi, T. Impact of wind-energy generation on climate: A rising spectre. Renew. Sustain.Energy Rev. 2016, 59, 1591–1598. [CrossRef]
60. Barrie, D.B.; Kirk-Davidoff, D.B. Weather response to a large wind turbine array. Atmos. Chem. Phys. 2010,10, 769–775. [CrossRef]
61. Wang, C.; Prinn, R.G. Potential climatic impacts and reliability of very large-scale wind farms. Atmos. Chem.Phys. 2010, 10, 2053–2061. [CrossRef]
62. Zhou, L.; Tian, Y.; Baidya Roy, S.; Thorncroft, C.; Bosart, L.F.; Hu, Y. Impacts of wind farms on land surfacetemperature. Nat. Clim. Chang. 2012, 2, 539–543. [CrossRef]
63. Zhou, L.; Tian, Y.; Baidya Roy, S.; Dai, Y.; Chen, H. Diurnal and seasonal variations of wind farm impacts onland surface temperature over western Texas. Clim. Dyn. 2013, 41, 307–326. [CrossRef]
64. Miller, L.M.; Keith, D.W. Climatic Impacts of Wind Power. Joule 2018, 2, 2618–2632. [CrossRef]65. Harris, R.A.; Zhou, L.; Xia, G. Satellite Observations of Wind Farm Impacts on Nocturnal Land Surface
Temperature in Iowa. Remote Sens. 2014, 6, 12234–12246. [CrossRef]66. Chang, R.; Zhu, R.; Guo, P. A Case Study of Land-Surface-Temperature Impact from Large-Scale Deployment
of Wind Farms in China from Guazhou. Remote Sens. 2016, 8, 790. [CrossRef]67. Pielke, R.A. Misdefining “climate change”: Consequences for science and action. Environ. Sci. Policy 2005, 8,
548–561. [CrossRef]68. Soon, W.; Connolly, R.; Connolly, M. Re-evaluating the role of solar variability on Northern Hemisphere
temperature trends since the 19th century. Earth-Sci. Rev. 2015, 150, 409–452. [CrossRef]69. Lüning, S.; Vahrenholt, F. Paleoclimatological Context and Reference Level of the 2 ◦C and 1.5 ◦C Paris
Agreement Long-Term Temperature Limits. Front. Earth Sci. 2017, 5. [CrossRef]70. Le Mouël, J.-L.; Lopes, F.; Courtillot, V. A Solar Signature in Many Climate Indices. J. Geophys. Res. Atmos.
2019, 124, 2600–2619. [CrossRef]71. Scafetta, N.; Willson, R.C.; Lee, J.N.; Wu, D.L. Modeling Quiet Solar Luminosity Variability from TSI Satellite
Measurements and Proxy Models during 1980–2018. Remote Sens. 2019, 11, 2569. [CrossRef]72. Dayaratna, K.D.; McKitrick, R.; Michaels, P.J. Climate sensitivity, agricultural productivity and the social cost
of carbon in FUND. Environ. Econ. Policy Stud. 2020. [CrossRef]

Energies 2020, 13, 4839 42 of 49
73. Sovacool, B.K.; Saunders, H. Competing policy packages and the complexity of energy security. Energy 2014,67, 641–651. [CrossRef]
74. Falconer, A.; Buchner, B.; Trabacchi, C.; Hervé-Mignucci, M. Global Landscape of Climate Finance 2012—CPI.Climate Policy Initiative, 2012. Available online: https://www.climatepolicyinitiative.org/publication/global-landscape-of-climate-finance-2012/ (accessed on 14 September 2020).
75. Buchner, B.; Clark, A.; Falconer, A.; Macquarie, R.; Meattle, C.; Wetherbee, C.; Tolentino, R. GlobalLandscape of Climate Finance 2019—CPI. Climate Policy Initiative, 2019. Available online: https://www.climatepolicyinitiative.org/publication/global-landscape-of-climate-finance-2019/ (accessed on 14 September2020).
76. Falconer, A.; Buchner, B.; Trabacchi, C.; Hervé-Mignucci, M. The Landscape of Climate Finance. ClimatePolicy Initiative, 2011. Available online: https://www.climatepolicyinitiative.org/wp-content/uploads/2011/
10/The-Landscape-of-Climate-Finance-120120.pdf (accessed on 14 September 2020).77. BP. BP Statistical Review of World Energy. BP, 2019. Available online: https://www.bp.com/content/dam/
bp/business-sites/en/global/corporate/pdfs/energy-economics/statistical-review/bp-stats-review-2019-full-report.pdf (accessed on 14 September 2020).
78. U.S. Energy Information Administration. International Energy Outlook 2019; U.S. Energy InformationAdministration, Office of Energy Analysis, U.S. Department of Energy: Washington, DC, USA, 2019; p. 85.
79. Newell, R.; Raimi, D.; Aldana, G. Global Energy Outlook 2019: The Next Generation of Energy. Availableonline: https://www.rff.org/publications/reports/global-energy-outlook-2019/ (accessed on 11 August 2020).
80. Matek, B.; Gawell, K. The Benefits of Baseload Renewables: A Misunderstood Energy Technology. Electr. J.2015, 28, 101–112. [CrossRef]
81. Jessel, S.; Sawyer, S.; Hernández, D. Energy, Poverty, and Health in Climate Change: A ComprehensiveReview of an Emerging Literature. Front. Public Health 2019, 7, 357. [CrossRef] [PubMed]
82. Hyndman, R.J.; Fan, S. Density Forecasting for Long-Term Peak Electricity Demand. IEEE Trans. Power Syst.2010, 25, 1142–1153. [CrossRef]
83. Richardson, I.; Thomson, M.; Infield, D.; Clifford, C. Domestic electricity use: A high-resolution energydemand model. Energy Build. 2010, 42, 1878–1887. [CrossRef]
84. Rohan, P.K.; Rohan, P.K. The Climate of Ireland; Stationery Office: Dublin, Ireland, 1986.85. Carnegie, R.; Gotham, D.; Nderitu, D.; Preckel, P.V. Utility Scale Energy Storage Systems, Benefits, Application,
and Technologies; State Utility Forecasting Group: West Lafayette, IN, USA, 2013.86. Smil, V. Energy at the Crossroads: Global Perspectives and Uncertainties; New edition; The MIT Press: Cambridge,
MA, USA, 2005; ISBN 978-0-262-69324-0.87. Van Zalk, J.; Behrens, P. The spatial extent of renewable and non-renewable power generation: A review and
meta-analysis of power densities and their application in the U.S. Energy Policy 2018, 123, 83–91. [CrossRef]88. Arto, I.; Capellán-Pérez, I.; Lago, R.; Bueno, G.; Bermejo, R. The energy requirements of a developed world.
Energy Sustain. Dev. 2016, 33, 1–13. [CrossRef]89. Malthus, T.R.; Thomas, R. An Essay on the Principle of Population, as it Affects the Future Improvement of Society.
With Remarks on the Speculations of Mr. Godwin, M. Condorcet and other Writers; J. Johnson: London, UK, 1798;Available online: http://name.umdl.umich.edu/004860797.0001.000 (accessed on 14 September 2020).
90. Ehrlich, P.R. The Population Bomb; Rev. expanded edition; Ballantine Books: New York, NY, USA, 1971;ISBN 978-0-345-02171-7.
91. Meadows, D.H.; Meadows, D.L.; Randers, J.; Behrens, W.W. The Limits to Growth; A Report for the Club ofRome’s Project on the Predicament of Mankind; Universe Books: New York, NY, USA, 1972.
92. Ehrlich, P.R.; Ehrlich, A.H. The Betrayal of Science and Reason: How Anti-Environmental Rhetoric Threatens OurFuture; New edition edition; Island Press: Washington, DC, USA, 1998; ISBN 978-1-55963-484-7.
93. Simon, J.L. The Ultimate Resource 2: No. 2; New edition; Princeton University Press: Princeton, NJ, USA, 1998;ISBN 978-0-691-00381-8.
94. Desrochers, P.; Szurkmak, J. Population Bombed! Exploding the Link between Overpopulation and Climate Change;GWPF Books: London, UK, 2018; ISBN 978-0-9931190-3-3.
95. Sabin, P. The Bet: Paul Ehrlich, Julian Simon, and Our Gamble over Earth’s Future; Yale University Press: NewHaven, CT, USA, 2014; ISBN 978-0-300-19897-3.
96. Jonsson, F.A. The Origins of Cornucopianism: A Preliminary Genealogy. Crit. Hist. Stud. 2014, 1, 151–168.[CrossRef]

Energies 2020, 13, 4839 43 of 49
97. Brown, B.J.; Hanson, M.E.; Liverman, D.M.; Merideth, R.W., Jr. Global sustainability: Toward definition.Environ. Manag. 1987, 11, 713–719. [CrossRef]
98. Jones, N.F.; Pejchar, L.; Kiesecker, J.M. The Energy Footprint: How Oil, Natural Gas, and Wind Energy AffectLand for Biodiversity and the Flow of Ecosystem Services. BioScience 2015, 65, 290–301. [CrossRef]
99. Gomiero, T. Are Biofuels an Effective and Viable Energy Strategy for Industrialized Societies? A ReasonedOverview of Potentials and Limits. Sustainability 2015, 7, 8491–8521. [CrossRef]
100. Edenhofer, O.; Pichs-Madruga, R.; Sokana, Y.; Seyboth, P.M.; Kadner, S.; Zwickel, T.; Eickemeier, P.; Hansen, G.;Schloemer, S.; von Stechow, C. Renewable Energy Sources and Climate Change Mitigation—Special Report of theIPCC; Cambridge University Press: Cambridge, UK; New York, NY, USA, 2011; ISBN 978-1-107-60710-1.
101. Verbruggen, A.; Fischedick, M.; Moomaw, W.; Weir, T.; Nadaï, A.; Nilsson, L.J.; Nyboer, J.; Sathaye, J.Renewable energy costs, potentials, barriers: Conceptual issues. Energy Policy 2010, 38, 850–861. [CrossRef]
102. Acosta, A. Extractivism and Neoextractivism: Two sides of the same curse. In Beyond Development: AlternativeVisions from Latin America; Rosa Luxemburg Foundation: Quito, Ecuador; Transnational Institute: Amsterdam,the Netherlands, 2013; pp. 61–86.
103. Bardi, U. Peak oil: The four stages of a new idea. Energy 2009, 34, 323–326. [CrossRef]104. Murphy, D.J.; Hall, C.A.S. Energy return on investment, peak oil, and the end of economic growth. Ann. N.
Y. Acad. Sci. 2011, 1219, 52–72. [CrossRef]105. Helm, D. Peak oil and energy policy—A critique. Oxf. Rev. Econ. Policy 2011, 27, 68–91. [CrossRef]106. Chapman, I. The end of Peak Oil? Why this topic is still relevant despite recent denials. Energy Policy 2014,
64, 93–101. [CrossRef]107. Zuckerman, G. The Frackers: The Outrageous Inside Story of the New Energy Revolution; Penguin: London, UK,
2014; ISBN 978-0-670-92368-7.108. Lior, N. Energy resources and use: The present situation and possible paths to the future. Energy 2008, 33,
842–857. [CrossRef]109. Shafiee, S.; Topal, E. When will fossil fuel reserves be diminished? Energy Policy 2009, 37, 181–189. [CrossRef]110. Kutcherov, V.G.; Krayushkin, V.A. Deep-seated abiogenic origin of petroleum: From geological assessment
to physical theory. Rev. Geophys. 2010, 48. [CrossRef]111. Mann, C.C. What If We Never Run Out of Oil? Available online: https://www.theatlantic.com/magazine/
archive/2013/05/what-if-we-never-run-out-of-oil/309294/ (accessed on 11 August 2020).112. Nel, W.P.; Cooper, C.J. Implications of fossil fuel constraints on economic growth and global warming.
Energy Policy 2009, 37, 166–180. [CrossRef]113. McGlade, C.; Ekins, P. The geographical distribution of fossil fuels unused when limiting global warming to
2 ◦C. Nature 2015, 517, 187–190. [CrossRef]114. Capellán-Pérez, I.; de Castro, C.; Miguel González, L.J. Dynamic Energy Return on Energy Investment (EROI)
and material requirements in scenarios of global transition to renewable energies. Energy Strateg. Rev. 2019,26, 100399. [CrossRef]
115. Narins, T.P. The battery business: Lithium availability and the growth of the global electric car industry.Extr. Ind. Soc. 2017, 4, 321–328. [CrossRef]
116. IEA. Global EV Outlook 2019—Analysis; IEA: Paris, France, 2019.117. Giurco, D.; Dominish, E.; Florin, N.; Watari, T.; McLellan, B. Requirements for Minerals and Metals for 100%
Renewable Scenarios. In Achieving the Paris Climate Agreement Goals: Global and Regional 100% RenewableEnergy Scenarios with Non-energy GHG Pathways for +1.5 ◦C and +2 ◦C; Teske, S., Ed.; Springer InternationalPublishing: Cham, Switzerland, 2019; pp. 437–457. ISBN 978-3-030-05843-2.
118. Sovacool, B.K. The precarious political economy of cobalt: Balancing prosperity, poverty, and brutality inartisanal and industrial mining in the Democratic Republic of the Congo. Extr. Ind. Soc. 2019, 6, 915–939.[CrossRef]
119. Sanderson, H. Congo, Child Labour and Your Electric Car; Financial Times: London, UK, 2019.120. André, G.; Godin, M. Child labour, agency and family dynamics: The case of mining in Katanga (DRC).
Childhood 2014, 21, 161–174. [CrossRef]121. Pavel, C.C.; Lacal-Arántegui, R.; Marmier, A.; Schüler, D.; Tzimas, E.; Buchert, M.; Jenseit, W.; Blagoeva, D.
Substitution strategies for reducing the use of rare earths in wind turbines. Resour. Policy 2017, 52, 349–357.[CrossRef]
Energies 2020, 13, 4839 44 of 49
122. Buchholz, P.; Brandenburg, T. Demand, Supply, and Price Trends for Mineral Raw Materials Relevant to theRenewable Energy Transition Wind Energy, Solar Photovoltaic Energy, and Energy Storage. Chem. Ing. Tech.2018, 90, 141–153. [CrossRef]
123. Dajaku, G.; Gerling, D. PM Wind Generator with Reduced Amount of Rare-Earth Magnet Material.In Proceedings of the 2019 International Conference on Clean Electrical Power (ICCEP), Otranto, Italy,2–4 July 2019; pp. 15–21.
124. Balaram, V. Rare earth elements: A review of applications, occurrence, exploration, analysis, recycling,and environmental impact. Geosci. Front. 2019, 10, 1285–1303. [CrossRef]
125. Vidal, O.; Goffé, B.; Arndt, N. Metals for a low-carbon society. Nat. Geosci. 2013, 6, 894–896. [CrossRef]126. Weisser, D. A guide to life-cycle greenhouse gas (GHG) emissions from electric supply technologies. Energy
2007, 32, 1543–1559. [CrossRef]127. Nugent, D.; Sovacool, B.K. Assessing the lifecycle greenhouse gas emissions from solar PV and wind energy:
A critical meta-survey. Energy Policy 2014, 65, 229–244. [CrossRef]128. Eberle, A.; Heath, G.A.; Carpenter Petri, A.C.; Nicholson, S.R. Systematic Review of Life Cycle Greenhouse Gas
Emissions from Geothermal Electricity; National Renewable Energy Lab. (NREL): Golden, CO, USA, 2017.129. Paredes, M.G.; Padilla-Rivera, A.; Güereca, L.P. Life Cycle Assessment of Ocean Energy Technologies:
A Systematic Review. J. Mar. Sci. Eng. 2019, 7, 322. [CrossRef]130. Murphy, F.; Devlin, G.; McDonnell, K. Benchmarking Environmental Impacts of Peat Use for Electricity
Generation in Ireland—A Life Cycle Assessment. Sustainability 2015, 7, 6376–6393. [CrossRef]131. De Gouw, J.A.; Parrish, D.D.; Frost, G.J.; Trainer, M. Reduced emissions of CO2, NOx, and SO2 from U.S.
power plants owing to switch from coal to natural gas with combined cycle technology. Earth’s Future 2014,2, 75–82. [CrossRef]
132. Gielen, D.; Changhong, C. The CO2 emission reduction benefits of Chinese energy policies and environmentalpolicies: A case study for Shanghai, period 1995–2020. Ecol. Econ. 2001, 39, 257–270. [CrossRef]
133. Nan, Y.; Fan, X.; Bian, Y.; Cai, H.; Li, Q. Impacts of the natural gas infrastructure and consumption on fineparticulate matter concentration in China’s prefectural cities: A new perspective from spatial dynamic panelmodels. J. Clean. Prod. 2019, 239, 117987. [CrossRef]
134. Chen, W.; Xu, R. Clean coal technology development in China. Energy Policy 2010, 38, 2123–2130. [CrossRef]135. Dong, K.; Sun, R.; Hochman, G. Do natural gas and renewable energy consumption lead to less CO2 emission?
Empirical evidence from a panel of BRICS countries. Energy 2017, 141, 1466–1478. [CrossRef]136. Dong, K.; Sun, R.; Li, H.; Liao, H. Does natural gas consumption mitigate CO2 emissions: Testing the
environmental Kuznets curve hypothesis for 14 Asia-Pacific countries. Renew. Sustain. Energy Rev. 2018, 94,419–429. [CrossRef]
137. Dong, K.; Sun, R.; Dong, X. CO2 emissions, natural gas and renewables, economic growth: Assessing theevidence from China. Sci. Total Environ. 2018, 640–641, 293–302. [CrossRef]
138. Shearer, C.; Bistline, J.; Inman, M.; Davis, S.J. The effect of natural gas supply on US renewable energy andCO2 emissions. Environ. Res. Lett. 2014, 9, 094008. [CrossRef]
139. Qin, Y.; Tong, F.; Yang, G.; Mauzerall, D.L. Challenges of using natural gas as a carbon mitigation option inChina. Energy Policy 2018, 117, 457–462. [CrossRef]
140. Haszeldine, R.S. Carbon Capture and Storage: How Green Can Black Be? Science 2009, 325, 1647–1652.[CrossRef] [PubMed]
141. Scott, V.; Gilfillan, S.; Markusson, N.; Chalmers, H.; Haszeldine, R.S. Last chance for carbon capture andstorage. Nat. Clim. Chang. 2013, 3, 105–111. [CrossRef]
142. Wilberforce, T.; Baroutaji, A.; Soudan, B.; Al-Alami, A.H.; Olabi, A.G. Outlook of carbon capture technologyand challenges. Sci. Total Environ. 2019, 657, 56–72. [CrossRef] [PubMed]
143. Rehmatulla, N.; Calleya, J.; Smith, T. The implementation of technical energy efficiency and CO2 emissionreduction measures in shipping. Ocean Eng. 2017, 139, 184–197. [CrossRef]
144. Van Soest, D.P.; Bulte, E.H. Does the Energy-Efficiency Paradox Exist? Technological Progress and Uncertainty.Environ. Resour. Econ. 2001, 18, 101–112. [CrossRef]
145. Kim, K.; Kim, Y. International comparison of industrial CO2 emission trends and the energy efficiencyparadox utilizing production-based decomposition. Energy Econ. 2012, 34, 1724–1741. [CrossRef]
146. MacKay, D.J.C. Sustainable Energy—Without the Hot Air; Green Books: Cambridge, UK, 2009;ISBN 978-0-9544529-3-3.

Energies 2020, 13, 4839 45 of 49
147. Herring, H. Energy efficiency—A critical view. Energy 2006, 31, 10–20. [CrossRef]148. Sorrell, S. Jevons’ Paradox revisited: The evidence for backfire from improved energy efficiency. Energy
Policy 2009, 37, 1456–1469. [CrossRef]149. Prăvălie, R.; Bandoc, G. Nuclear energy: Between global electricity demand, worldwide decarbonisation
imperativeness, and planetary environmental implications. J. Environ. Manag. 2018, 209, 81–92. [CrossRef]150. Michalski, M.Ł. Development of nuclear power as an alternative to fossil fuels. Acta Innov. 2019, 38–47.
[CrossRef]151. Sovacool, B.K.; Kryman, M.; Laine, E. Profiling technological failure and disaster in the energy sector:
A comparative analysis of historical energy accidents. Energy 2015, 90, 2016–2027. [CrossRef]152. Sovacool, B.K.; Andersen, R.; Sorensen, S.; Sorensen, K.; Tienda, V.; Vainorius, A.; Schirach, O.M.;
Bjørn-Thygesen, F. Balancing safety with sustainability: Assessing the risk of accidents for modern low-carbonenergy systems. J. Clean. Prod. 2016, 112, 3952–3965. [CrossRef]
153. Flyvbjerg, B. What you Should Know about Megaprojects and Why: An Overview. Proj. Manag. J. 2014, 45,6–19. [CrossRef]
154. Zawalinska, K.; Kinnunen, J.; Gradziuk, P.; Celinska-Janowicz, D. To whom should we grant a power plant?Economic effects of investment in nuclear energy in Poland. Energies 2020, 13, 2687. [CrossRef]
155. Moran, E.F. Sustainable hydropower in the 21st century. Proc. Natl. Acad. Sci. USA 2018, 115, 11891–11898.[CrossRef]
156. Finer, M.; Jenkins, C.N. Proliferation of Hydroelectric Dams in the Andean Amazon and Implications forAndes-Amazon Connectivity. PLoS ONE 2012, 7, e35126. [CrossRef]
157. Rybach, L. Geothermal energy: Sustainability and the environment. Geothermics 2003, 32, 463–470. [CrossRef]158. Paulillo, A.; Striolo, A.; Lettieri, P. The environmental impacts and the carbon intensity of geothermal energy:
A case study on the Hellisheiði plant. Environ. Int. 2019, 133, 105226. [CrossRef]159. Muscat, A.; de Olde, E.M.; de Boer, I.J.M.; Ripoll-Bosch, R. The battle for biomass: A systematic review of
food-feed-fuel competition. Glob. Food Secur. 2019, 100330. [CrossRef]160. Hall, C.A.S.; Balogh, S.; Murphy, D.J.R. What is the Minimum EROI that a Sustainable Society Must Have?
Energies 2009, 2, 25–47. [CrossRef]161. Murphy, D.J.; Hall, C.A.S.; Powers, B. New perspectives on the energy return on (energy) investment (EROI)
of corn ethanol. Environ. Dev. Sustain. 2011, 13, 179–202. [CrossRef]162. O’Keeffe, A. Thousands of Trees May be Axed for Bus Connects Routes, Warns Professor; Irish Independent:
Dublin, Ireland, 2019; Available online: https://www.independent.ie/irish-news/thousands-of-trees-may-be-axed-for-bus-connects-routes-warns-professor-38222651.html (accessed on 14 September 2020).
163. Burns, S. Dublin Bus Corridors: 2449 Trees Would Go under Latest Plans; The Irish Times: Dublin, Ireland, 2020;Available online: https://www.irishtimes.com/news/ireland/irish-news/dublin-bus-corridors-2-449-trees-would-go-under-latest-plans-1.4192428 (accessed on 14 September 2020).
164. Love, P.E.D.; Zhou, J.; Edwards, D.J.; Irani, Z.; Sing, C.-P. Off the rails: The cost performance of infrastructurerail projects. Transp. Res. Part A Policy Pract. 2017, 99, 14–29. [CrossRef]
165. Bahamonde-Birke, F.J. Who will bell the cat? On the environmental and sustainability risks of electricvehicles. Transp. Res. Part A Policy Pract. 2020, 133, 79–81. [CrossRef]
166. Asaithambi, G.; Treiber, M.; Kanagaraj, V. Life Cycle Assessment of Conventional and Electric Vehicles.In International Climate Protection; Palocz-Andresen, M., Szalay, D., Gosztom, A., Sípos, L., Taligás, T., Eds.;Springer International Publishing: Cham, Switzerland, 2019; pp. 161–168. ISBN 978-3-030-03816-8.
167. Onat, N.C.; Kucukvar, M.; Tatari, O. Conventional, hybrid, plug-in hybrid or electric vehicles? State-basedcomparative carbon and energy footprint analysis in the United States. Appl. Energy 2015, 150, 36–49.[CrossRef]
168. Massad, R.S.; Lathière, J.; Strada, S.; Perrin, M.; Personne, E.; Stéfanon, M.; Stella, P.; Szopa, S.; deNoblet-Ducoudré, N. Reviews and syntheses: Influences of landscape structure and land uses on local toregional climate and air quality. Biogeosciences 2019, 16, 2369–2408. [CrossRef]
169. Millstein, D.; Menon, S. Regional climate consequences of large-scale cool roof and photovoltaic arraydeployment. Environ. Res. Lett. 2011, 6, 034001. [CrossRef]
170. Hossain, F.; Degu, A.M.; Yigzaw, W.; Burian, S.; Niyogi, D.; Shepherd, J.M.; Pielke, R. Climate Feedback–BasedProvisions for Dam Design, Operations, and Water Management in the 21st Century. J. Hydrol. Eng. 2012, 17,837–850. [CrossRef]
Energies 2020, 13, 4839 46 of 49
171. Armstrong, A.; Waldron, S.; Whitaker, J.; Ostle, N.J. Wind farm and solar park effects on plant-soil carboncycling: Uncertain impacts of changes in ground-level microclimate. Glob. Chang. Biol. 2014, 20, 1699–1706.[CrossRef]
172. Fiedler, B.H.; Bukovsky, M.S. The effect of a giant wind farm on precipitation in a regional climate model.Environ. Res. Lett. 2011, 6, 045101. [CrossRef]
173. Fitch, A.C. Climate Impacts of Large-Scale Wind Farms as Parameterized in a Global Climate Model. J. Clim.2015, 28, 6160–6180. [CrossRef]
174. Lundquist, J.K.; Bariteau, L. Dissipation of Turbulence in the Wake of a Wind Turbine. Bound.-Layer Meteorol.2015, 154, 229–241. [CrossRef]
175. Meneveau, C. Big wind power: Seven questions for turbulence research. J. Turbul. 2019, 20, 2–20. [CrossRef]176. Porté-Agel, F.; Bastankhah, M.; Shamsoddin, S. Wind-Turbine and Wind-Farm Flows: A Review. Bound.-Layer
Meteorol. 2020, 174, 1–59. [CrossRef] [PubMed]177. Hasager, C.B.; Rasmussen, L.; Peña, A.; Jensen, L.E.; Réthoré, P.-E. Wind Farm Wake: The Horns Rev Photo
Case. Energies 2013, 6, 696–716. [CrossRef]178. Hasager, C.B.; Nygaard, N.G.; Volker, P.J.H.; Karagali, I.; Andersen, S.J.; Badger, J. Wind Farm Wake: The 2016
Horns Rev Photo Case. Energies 2017, 10, 317. [CrossRef]179. Platis, A.; Siedersleben, S.K.; Bange, J.; Lampert, A.; Bärfuss, K.; Hankers, R.; Cañadillas, B.; Foreman, R.;
Schulz-Stellenfleth, J.; Djath, B.; et al. First in situ evidence of wakes in the far field behind offshore windfarms. Sci. Rep. 2018, 8, 1–10. [CrossRef]
180. Lundquist, J.K.; DuVivier, K.K.; Kaffine, D.; Tomaszewski, J.M. Costs and consequences of wind turbinewake effects arising from uncoordinated wind energy development. Nat. Energy 2019, 4, 26–34. [CrossRef]
181. Howland, M.F.; Lele, S.K.; Dabiri, J.O. Wind farm power optimization through wake steering. Proc. Natl.Acad. Sci. USA 2019, 116, 14495–14500. [CrossRef]
182. Raich, J.W.; Schlesinger, W.H. The global carbon dioxide flux in soil respiration and its relationship tovegetation and climate. Tellus B Chem. Phys. Meteorol. 1992, 44, 81–99. [CrossRef]
183. Jenkinson, D.S.; Adams, D.E.; Wild, A. Model estimates of CO2 emissions from soil in response to globalwarming. Nature 1991, 351, 304–306. [CrossRef]
184. Melillo, J.M.; Frey, S.D.; DeAngelis, K.M.; Werner, W.J.; Bernard, M.J.; Bowles, F.P.; Pold, G.; Knorr, M.A.;Grandy, A.S. Long-term pattern and magnitude of soil carbon feedback to the climate system in a warmingworld. Science 2017, 358, 101. [CrossRef]
185. Nottingham, A.T.; Whitaker, J.; Ostle, N.J.; Bardgett, R.D.; McNamara, N.P.; Fierer, N.; Salinas, N.;Ccahuana, A.J.Q.; Turner, B.L.; Meir, P. Microbial responses to warming enhance soil carbon loss followingtranslocation across a tropical forest elevation gradient. Ecol. Lett. 2019, 22, 1889–1899. [CrossRef] [PubMed]
186. Davidson, E.A.; Janssens, I.A. Temperature sensitivity of soil carbon decomposition and feedbacks to climatechange. Nature 2006, 440, 165–173. [CrossRef]
187. Crowther, T.W.; Todd-Brown, K.E.O.; Rowe, C.W.; Wieder, W.R.; Carey, J.C.; Machmuller, M.B.; Snoek, B.L.;Fang, S.; Zhou, G.; Allison, S.D.; et al. Quantifying global soil carbon losses in response to warming. Nature2016, 540, 104–108. [CrossRef]
188. Deutsche Welle CO2 Emissions Gap: UN Report Warns of “Collective Failure to Act” | DW | 26.11.2019.Available online: https://www.dw.com/en/co2-emissions-gap-un-report-warns-of-collective-failure-to-act/a-51407286 (accessed on 4 September 2020).
189. Zhu, Z.; Piao, S.; Myneni, R.B.; Huang, M.; Zeng, Z.; Canadell, J.G.; Ciais, P.; Sitch, S.; Friedlingstein, P.;Arneth, A.; et al. Greening of the Earth and its drivers. Nat. Clim. Chang. 2016, 6, 791–795. [CrossRef]
190. Ezzati, M.; Kammen, D.M. The health impacts of exposure to indoor air pollution from solid fuels indeveloping countries: Knowledge, gaps, and data needs. Environ. Health Perspect. 2002, 110, 1057–1068.[CrossRef] [PubMed]
191. Perez-Padilla, R.; Schilmann, A.; Riojas-Rodriguez, H. Respiratory health effects of indoor air pollution[Review article]. Int. J. Tuberc. Lung Dis. 2010, 14, 1079–1086.
192. Khan, R.R.; Siddiqui, M.J.A. Review on effects of particulates; sulfur dioxide and nitrogen dioxide on humanhealth. Int. Res. J. Environ. Sci. 2014, 3, 70–73.
193. Gao, J.; Woodward, A.; Vardoulakis, S.; Kovats, S.; Wilkinson, P.; Li, L.; Xu, L.; Li, J.; Yang, J.; Li, J.; et al.Haze, public health and mitigation measures in China: A review of the current evidence for further policyresponse. Sci. Total Environ. 2017, 578, 148–157. [CrossRef]

Energies 2020, 13, 4839 47 of 49
194. Sheehan, M.C.; Lam, J.; Navas-Acien, A.; Chang, H.H. Ambient air pollution epidemiology systematicreview and meta-analysis: A review of reporting and methods practice. Environ. Int. 2016, 92–93, 647–656.[CrossRef] [PubMed]
195. Young, S.S.; Smith, R.L.; Lopiano, K.K. Air quality and acute deaths in California, 2000–2012. Regul. Toxicol.Pharmacol. 2017, 88, 173–184. [CrossRef] [PubMed]
196. Young, S.S.; Kindzierski, W.B. Evaluation of a meta-analysis of air quality and heart attacks, a case study.Crit. Rev. Toxicol. 2019, 49, 85–94. [CrossRef] [PubMed]
197. Turconi, R.; Boldrin, A.; Astrup, T. Life cycle assessment (LCA) of electricity generation technologies:Overview, comparability and limitations. Renew. Sustain. Energy Rev. 2013, 28, 555–565. [CrossRef]
198. Tian, H.; Wang, Y.; Cheng, K.; Qu, Y.; Hao, J.; Xue, Z.; Chai, F. Control strategies of atmospheric mercuryemissions from coal-fired power plants in China. J. Air Waste Manag. Assoc. 2012, 62, 576–586. [CrossRef]
199. Bartocci, A.C.; Patterson, R.G. Wet Scrubber Technology for Controlling Biomass Gasification Emissions. IT32007, 7, 14–18.
200. Bianchini, A.; Cento, F.; Golfera, L.; Pellegrini, M.; Saccani, C. Performance analysis of different scrubbersystems for removal of particulate emissions from a small size biomass boiler. Biomass Bioenergy 2016, 92,31–39. [CrossRef]
201. Ellerman, A.D.; Montero, J.-P. The Declining Trend in Sulfur Dioxide Emissions: Implications for AllowancePrices. J. Environ. Econo. Manag. 1998, 36, 26–45. [CrossRef]
202. Uherek, E.; Halenka, T.; Borken-Kleefeld, J.; Balkanski, Y.; Berntsen, T.K.; Borrego, C.; Gauss, M.; Hoor, P.;Juda-Rezler, K.; Lelieveld, J.; et al. Transport impacts on atmosphere and climate: Land transport.Atmos. Environ. 2010, 44, 4772–4816. [CrossRef]
203. Zhang, X.; Wu, Z.; Li, L. Characteristics of Soot and Particle Size Distribution in the Exhaust of a CommonRail Light-Duty Diesel Engine Fuelled with Biodiesel. Energy Fuels 2012, 26, 5954–5961. [CrossRef]
204. Pirjola, L.; Dittrich, A.; Niemi, J.V.; Saarikoski, S.; Timonen, H.; Kuuluvainen, H.; Järvinen, A.; Kousa, A.;Rönkkö, T.; Hillamo, R. Physical and Chemical Characterization of Real-World Particle Number and MassEmissions from City Buses in Finland. Environ. Sci. Technol. 2016, 50, 294–304. [CrossRef] [PubMed]
205. Shahir, S.A.; Masjuki, H.H.; Kalam, M.A.; Imran, A.; Ashraful, A.M. Performance and emission assessment ofdiesel–biodiesel–ethanol/bioethanol blend as a fuel in diesel engines: A review. Renew. Sustain. Energy Rev.2015, 48, 62–78. [CrossRef]
206. Wang, M.; Li, S.; Zhu, R.; Zhang, R.; Zu, L.; Wang, Y.; Bao, X. On-road tailpipe emission characteristics andozone formation potentials of VOCs from gasoline, diesel and liquefied petroleum gas fueled vehicles. Atmos.Environ. 2020, 223, 117294. [CrossRef]
207. Davies, S. The Great Horse-Manure Crisis of 1894 | Stephen Davies. Available online: https://fee.org/articles/the-great-horse-manure-crisis-of-1894/ (accessed on 14 August 2020).
208. Davis, D.L. A Look Back at the London Smog of 1952 and the Half Century Since. Environ. Health Perspect.2002, 110, A734–A735. [CrossRef]
209. Kerimray, A.; Rojas-Solórzano, L.; Amouei Torkmahalleh, M.; Hopke, P.K.; Ó Gallachóir, B.P. Coal use forresidential heating: Patterns, health implications and lessons learned. Energy Sustain. Dev. 2017, 40, 19–30.[CrossRef]
210. Gupta, A. Where there is smoke: Solid fuel externalities, gender, and adult respiratory health in India.Popul. Environ. 2019, 41, 32–51. [CrossRef]
211. Sinha, S.N. Air Pollution from Solid FuelsI. In Encyclopedia of Environmental Health, 2nd ed.; Nriagu, J., Ed.;Elsevier: Oxford, UK, 2019; pp. 49–60. ISBN 978-0-444-63952-3.
212. Jeuland, M.A.; Pattanayak, S.K.; Samaddar, S.; Shah, R.; Vora, M. Adoption and impacts of improved biomasscookstoves in rural Rajasthan. Energy Sustain. Dev. 2020, 57, 149–159. [CrossRef]
213. Tucho, G.T. The Impacts of Policy on Energy Justice in Developing Countries. In Energy Justice acrossBorders; Bombaerts, G., Jenkins, K., Sanusi, Y.A., Guoyu, W., Eds.; Springer International Publishing:Cham, Switzerland, 2020; pp. 137–154. ISBN 978-3-030-24021-9.
214. Fisher, B. African exception to drivers of deforestation. Nat. Geosci. 2010, 3, 375–376. [CrossRef]215. Jagger, P.; Kittner, N. Deforestation and biomass fuel dynamics in Uganda. Biomass Bioenergy 2017, 105, 1–9.
[CrossRef]216. Swingland, I.R. Biodiversity, definition of. In Encyclopedia of Biodiversity; Levin, S., Ed.; Academic Press:
Cambridge, MA, USA, 2013; pp. 377–391.
Energies 2020, 13, 4839 48 of 49
217. Bunce, R.G.H.; Bogers, M.M.B.; Evans, D.; Halada, L.; Jongman, R.H.G.; Mucher, C.A.; Bauch, B.; de Blust, G.;Parr, T.W.; Olsvig-Whittaker, L. The significance of habitats as indicators of biodiversity and their links tospecies. Ecol. Indic. 2013, 33, 19–25. [CrossRef]
218. Lustgarten, A. Palm Oil Was Supposed to Help Save the Planet. Instead It Unleashed a Catastrophe. The NewYork Times. 2018. Available online: https://www.nytimes.com/2018/11/20/magazine/palm-oil-borneo-climate-catastrophe.html (accessed on 14 September 2020).
219. Maavara, T.; Akbarzadeh, Z.; Cappellen, P.V. Global Dam-Driven Changes to Riverine N:P:Si Ratios Deliveredto the Coastal Ocean. Geophys. Res. Lett. 2020, 47, e2020GL088288. [CrossRef]
220. Almeida, R.M.; Shi, Q.; Gomes-Selman, J.M.; Wu, X.; Xue, Y.; Angarita, H.; Barros, N.; Forsberg, B.R.;García-Villacorta, R.; Hamilton, S.K.; et al. Reducing greenhouse gas emissions of Amazon hydropower withstrategic dam planning. Nat. Commun. 2019, 10, 4281. [CrossRef] [PubMed]
221. Morinha, F.; Travassos, P.; Seixas, F.; Martins, A.; Bastos, R.; Carvalho, D.; Magalhães, P.; Santos, M.; Bastos, E.;Cabral, J.A. Differential mortality of birds killed at wind farms in Northern Portugal. Bird Study 2014, 61,255–259. [CrossRef]
222. Loss, S.R.; Will, T.; Marra, P.P. Estimates of bird collision mortality at wind facilities in the contiguous UnitedStates. Biol. Conserv. 2013, 168, 201–209. [CrossRef]
223. Thaxter, C.B.; Buchanan, G.M.; Carr, J.; Butchart, S.H.M.; Newbold, T.; Green, R.E.; Tobias, J.A.; Foden, W.B.;O’Brien, S.; Pearce-Higgins, J.W. Bird and bat species’ global vulnerability to collision mortality at windfarms revealed through a trait-based assessment. Proc. Biol. Sci. 2017, 284, 20170829. [CrossRef]
224. Fernández-Bellon, D.; Wilson, M.W.; Irwin, S.; O’Halloran, J. Effects of development of wind energy andassociated changes in land use on bird densities in upland areas. Conserv. Biol. 2019, 33, 413–422. [CrossRef]
225. Stöber, U.; Thomsen, F. Effect of impact pile driving noise on marine mammals: A comparison of differentnoise exposure criteria. J. Acoust. Soc. Am. 2019, 145, 3252–3259. [CrossRef] [PubMed]
226. Graham, I.M.; Merchant, N.D.; Farcas, A.; Barton, T.R.; Cheney, B.; Bono, S.; Thompson, P.M. Harbourporpoise responses to pile-driving diminish over time. R. Soc. Open Sci. 2019, 6, 190335. [CrossRef]
227. Coolen, J.W.P.; van der Weide, B.; Cuperus, J.; Blomberg, M.; Van Moorsel, G.W.N.M.; Faasse, M.A.; Bos, O.G.;Degraer, S.; Lindeboom, H.J. Benthic biodiversity on old platforms, young wind farms, and rocky reefs.ICES J. Mar. Sci. 2018. [CrossRef]
228. Rehbein, J.A.; Watson, J.E.M.; Lane, J.L.; Sonter, L.J.; Venter, O.; Atkinson, S.C.; Allan, J.R. Renewable energydevelopment threatens many globally important biodiversity areas. Glob. Chang. Biol. 2020, 26, 3040–3051.[CrossRef]
229. Sonter, L.J.; Dade, M.C.; Watson, J.E.M.; Valenta, R.K. Renewable energy production will exacerbate miningthreats to biodiversity. Nat. Commun. 2020, 11, 4174. [CrossRef] [PubMed]
230. Acar, C.; Dincer, I. Review and evaluation of hydrogen production options for better environment.J. Clean. Product. 2019, 218, 835–849. [CrossRef]
231. Dinda, S. Environmental Kuznets Curve Hypothesis: A Survey. Ecol. Econ. 2004, 49, 431–455. [CrossRef]232. Kaika, D.; Zervas, E. The Environmental Kuznets Curve (EKC) theory—Part A: Concept, causes and the CO2
emissions case. Energy Policy 2013, 62, 1392–1402. [CrossRef]233. Al-mulali, U.; Weng-Wai, C.; Sheau-Ting, L.; Mohammed, A.H. Investigating the environmental Kuznets
curve (EKC) hypothesis by utilizing the ecological footprint as an indicator of environmental degradation.Ecol. Indic. 2015, 48, 315–323. [CrossRef]
234. Rashid Gill, A.; Viswanathan, K.K.; Hassan, S. The Environmental Kuznets Curve (EKC) and theenvironmental problem of the day. Renew. Sustain. Energy Rev. 2018, 81, 1636–1642. [CrossRef]
235. Wier, M.; Birr-Pedersen, K.; Jacobsen, H.K.; Klok, J. Are CO2 taxes regressive? Evidence from the Danishexperience. Ecol. Econ. 2005, 52, 239–251. [CrossRef]
236. Callan, T.; Lyons, S.; Scott, S.; Tol, R.S.J.; Verde, S. The distributional implications of a carbon tax in Ireland.Energy Policy 2009, 37, 407–412. [CrossRef]
237. Grainger, C.A.; Kolstad, C.D. Who Pays a Price on Carbon? Environ. Resour. Econ. 2010, 46, 359–376.[CrossRef]
238. Liang, Q.-M.; Wei, Y.-M. Distributional impacts of taxing carbon in China: Results from the CEEPA model.Appl. Energy 2012, 92, 545–551. [CrossRef]

Energies 2020, 13, 4839 49 of 49
239. Berri, A.; Vincent Lyk-Jensen, S.; Mulalic, I.; Zachariadis, T. Household transport consumption inequalitiesand redistributive effects of taxes: A repeated cross-sectional evaluation for France, Denmark and Cyprus.Transp. Policy 2014, 36, 206–216. [CrossRef]
240. Jiang, Z.; Shao, S. Distributional effects of a carbon tax on Chinese households: A case of Shanghai.Energy Policy 2014, 73, 269–277. [CrossRef]
241. Rubin, A.J.; Sengupta, S. ‘Yellow Vest’ Protests Shake France. Here’s the Lesson for Climate Change; The New YorkTimes: New York, NY, USA, 2018.
242. Prud’homme, R. La Transition Énergétique: “Pointless, Costly and Unfair” | The Global Warming Policy Foundation(GWPF); The Global Warming Policy Foundation: London, UK, 2019; p. 25.
243. Chancel, L.; Piketty, T. Carbon and Inequality: From Kyoto to Paris Trends in the Global Inequality of CarbonEmissions (1998–2013) & Prospects for an Equitable Adaptation Fund World Inequality Lab 2015. Availableonline: https://halshs.archives-ouvertes.fr/halshs-02655266/document (accessed on 14 September 2020).
244. Klotzbach, P.J.; Bowen, S.G.; Pielke, R.; Bell, M. Continental, U.S. Hurricane Landfall Frequency andAssociated Damage: Observations and Future Risks. Bull. Am. Meteorol. Soc. 2018, 99, 1359–1376. [CrossRef]
245. Prevatt, D.O.; Dupigny-Giroux, L.-A.; Masters, F.J. Engineering Perspectives on Reducing Hurricane Damageto Housing in CARICOM Caribbean Islands. Nat. Hazards Rev. 2010, 11, 140–150. [CrossRef]
246. De Beurs, K.M.; McThompson, N.S.; Owsley, B.C.; Henebry, G.M. Hurricane damage detection on four majorCaribbean islands. Remote Sens. Environ. 2019, 229, 1–13. [CrossRef]
247. Loehle, C.; Staehling, E. Hurricane trend detection. Nat Hazards 2020. [CrossRef]248. Pielke, R.A., Jr. The Climate Fix: What Scientists and Politicians Won’t Tell You About Global Warming; Basic Books:
New York, NY, USA, 2010; ISBN 978-0-465-02052-2.249. Marchegiani, P.; Morgera, E.; Parks, L. Indigenous peoples’ rights to natural resources in Argentina:
The challenges of impact assessment, consent and fair and equitable benefit-sharing in cases of lithiummining. Int. J. Hum. Rights 2020, 24, 224–240. [CrossRef]
250. Tsurukawa, N.; Prakash, S.; Manhart, A. Social Impacts of Artisanal Cobalt Mining in Katanga, DemocraticRepublic of Congo; Öko-Institut eV: Freiburg, Germany, 2011.
251. Duff, A.; Hanchant-Nichols, D.; Bown, B.; Gamage, S.H.P.W.; Nixon, B.; Nisi, P.; Boase, J.; Smith, E. A RightWay, Wrong Way and Better Way for Energy Engineers to Work with Aboriginal Communities. In EnergyJustice across Borders; Bombaerts, G., Jenkins, K., Sanusi, Y.A., Guoyu, W., Eds.; Springer InternationalPublishing: Cham, Switzerland, 2020; pp. 45–68. ISBN 978-3-030-24021-9.
252. Hess, C.E.E.; Costa Ribeiro, W.; Wieprecht, S. Assessing Environmental Justice in Large Hydropower Projects:The Case of São Luiz do Tapajós in Brazil. Desenvolv. e Meio Ambiente 2016, 37, 91–109. [CrossRef]
253. Gilio-Whitaker, D. As Long as Grass Grows The Indigenous Fight for Environmental Justice, from Colonization toStanding Rock; Beacon Press: Boston, MA, USA, 2019; ISBN 978-080707378-0.
254. Estes, N. Our History Is the Future Standing Rock Versus the Dakota Access Pipeline, and the Long Tradition ofIndigenous Resistance; Verso: Brooklyn, NY, USA, 2019.
255. De Decker, K. Medieval Smokestacks: Fossil Fuels in Pre-Industrial Times. Available online: https://www.lowtechmagazine.com/2011/09/peat-and-coal-fossil-fuels-in-pre-industrial-times.html (accessed on14 August 2020).
© 2020 by the authors. Licensee MDPI, Basel, Switzerland. This article is an open accessarticle distributed under the terms and conditions of the Creative Commons Attribution(CC BY) license (http://creativecommons.org/licenses/by/4.0/).