Embed Size (px)
Citation preview
Energy Analysis and Comparison of Advanced Vapour
Compression Heat Pump Arrangements
Stuart Self 1, Marc Rosen
1, and Bale Reddy
1
1 University of Ontario Institute of Technology, Oshawa, Ontario
Abstract
Reductions in fossil fuel use and increases in system efficiency are re-
quired to make space heating more environmentally benign. Ground
loop heat pumps offer an alternative heating solution that is more en-
vironmentally benign than conventional methods. Past studies of these
heat pumps have usually focused on basic system arrangements, but
new advanced systems are being developed. Here, energy analyses
and comparisons are reported for conventional and advanced heat
pump arrangements including a basic vapour compression cycle, a va-
pour compression cycle including electric motor cooling, and a vapour
compression cycle with an economizer. The results show that heat
pump designs with an economizer have potential for increased coeffi-
cients of performance (COPs). A cycle with motor cooling is found to
have the same heat pump COP and lower system COP compared to
the basic cycle.
1 Introduction
Energy is often utilized in the form of electricity and heat, usually produced using fossil fuels,
which comprise most of the global energy supply. However, fossil fuels are finite resources
and their combustion is harmful to the environment and contributes to climate change through
greenhouse gas emissions. Demand for energy is increasing and future fossil fuel shortages
are predicted (Ediger et al. 2007). Fossil fuel depletion along with pollutant emissions and
global warming are important factors affecting the degree to which energy systems are sus-
tainable and environmentally benign (Hammond 2000). Such concerns have motivated efforts
to reduce society’s dependence on fossil fuels, by reducing demand and substituting alterna-
tive energy sources that are more environmentally benign than fossil fuels yet economically
viable.
Beyond fossil fuels, the Earth’s crust stores a large amount of thermal energy. Geo-
thermal energy systems are relatively benign environmentally, with the emissions much lower
than for conventional fossil fueled systems (Office of Energy Efficiency and Renewable En-
ergy 2004; Wu 2009). Low (i.e., near environmental) temperature geothermal resources are
abundant and can be utilized in most locations around the world. Heat pumps (HPs) extract
low temperature thermal energy and raise its temperature to provide an environmentally and
economically advantageous option for space heating.
Most reports on ground source heat pumps focus on use and operation, with the ma-
jority for devices that utilize the basic vapour compression cycle. Comparisons of ground- and
air-source heat pumps are common. Energy and exergy analyses have been carried out for the
basic heat pump arrangement, using simulation and experimental methods. For instance, Hep-
basli and Balta (2007) use energy and exergy approaches and experimental data to assess the
performance of a heat pump system using low temperature geothermal resources, including
determination of the COP and identification of the locations of the greatest irreversibilities
http://esim.ca Page 463 of 614 May 1-4, Halifax Nova Scotia
Proceedings of eSim 2012: The Canadian Conference on Building Simulation
within the system. Akdemir and Hepbasli (2004) thermodynamically analyze ground source
heat pump systems with a U-bend ground heat exchanger for district heating purposes, derive
energy and exergy relations and apply them to a geothermal heat pump (GHP) system provid-
ing heat. Healy and Ugursal (1997) investigate computationally the effect of various system
parameters on GHP performance with a horizontal loop arrangement, and compare economi-
cally a GHP with a conventional heating/cooling system and an air source heat pump. Kara
(2007) experimentally determines the performance of a GHP system in heating mode in the
city of Erzurum, Turkey, while Wang et al. (2008) investigate the effects of compressor and
motor cooling on a heat pump system. Ma and Chai (2004) develop an alternative heat pump
cycle that incorporates an economizer into the vapour compression cycle with two compres-
sion processes between the condenser and the evaporator. Ma and Zhao (2008) continue the
work of Ma and Chai (2004) by experimentally comparing the new heat pump cycle with a
similar cycle that employs a flash tank with vapour separation and two compression proc-
esses.
The previous studies suggest that assessments of advanced heat pump arrangements,
including a HP cycle with motor cooling and a HP cycle using an economizer, and compari-
sons to basic vapour compression cycles, are lacking. Application of advanced HP cycles
within geothermal heat pumps and the effect on the ground loop heat exchanger also has not
been adequately explored. The present study aims to improve the understanding of advanced
vapor compression cycles and their use in geothermal applications. This study seeks insights
into the operation of these systems and describes their benefits and challenges. The research
aims to provide a foundation for more advanced transient simulations using comprehensive
building simulation methods. Economic aspects of the systems are not investigated here.
2 Approach and Methodology
We carry out a preliminary analysis to compare advanced geothermal heat pump cycles, and
utilize a non-transient approach for simplicity and clarity (although comprehensive building
simulation methods are expected to be used in subsequent investigations). Energy analyses are
performed for three ground source heat pump arrangements with identical heating loads: 1) a
basic vapour compression cycle, 2) a vapour compression cycle including electric motor cool-
ing, and 3) a vapour compression cycle with an economizer. There are two loops within each
system: the heat pump cycle and the ground loop heat exchanger. The ground loop heat ex-
changer is also commonly referred to as the ground loop (GL). The arrangement and analysis
for the ground loop is identical for each of the three systems.
Mass and energy balances are developed for each system, for steady state with steady
flow conditions. Some state conditions are assumed common to all systems. A model and
analysis tool is thereby developed for each system, using Engineering Equation Solver (EES)
software. The heat pump systems are compared for static operating assumptions. Heat pump
and system COPs and ground loop characteristics are evaluated and compared.
Several general simplifying assumptions are made: pressure drops within heat pumps
and elevation changes are negligible, and all processes are adiabatic. Also, assumptions spe-
cific to the heat pump and ground loop parts of the systems are made, as noted below.
Heat pump cycle assumptions and data
Natural Resources Canada (2003) presents an average heating load of 100 kW for commercial
and small institutional buildings within their document “Survey 2000, Commercial and Insti-
tutional Building Energy Use: Summary Report”; this heating load is used here for all system
http://esim.ca Page 464 of 614 May 1-4, Halifax Nova Scotia
Proceedings of eSim 2012: The Canadian Conference on Building Simulation
arrangements. Many other system parameters are determined from a set of initial simulations
performed to determine suitable parameter ranges (see Table 1).
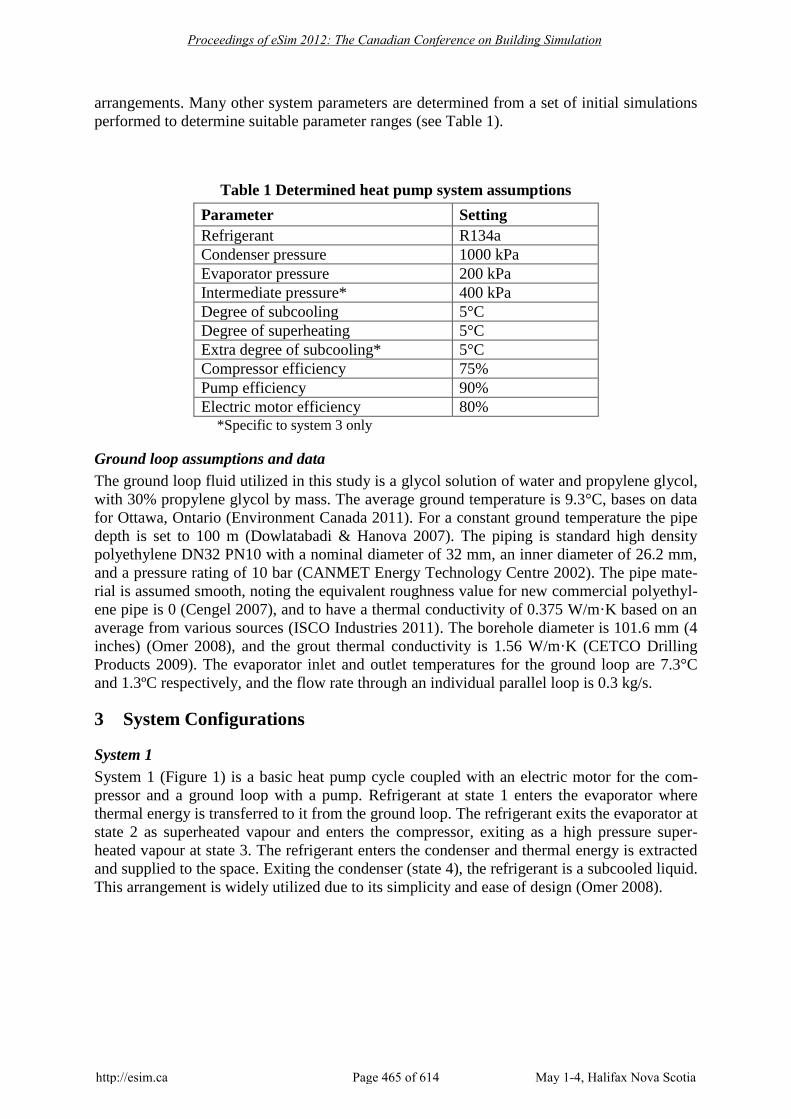
Table 1 Determined heat pump system assumptions
Parameter Setting
Refrigerant R134a
Condenser pressure 1000 kPa
Evaporator pressure 200 kPa
Intermediate pressure* 400 kPa
Degree of subcooling 5°C
Degree of superheating 5°C
Extra degree of subcooling* 5°C
Compressor efficiency 75%
Pump efficiency 90%
Electric motor efficiency 80% *Specific to system 3 only
Ground loop assumptions and data
The ground loop fluid utilized in this study is a glycol solution of water and propylene glycol,
with 30% propylene glycol by mass. The average ground temperature is 9.3°C, bases on data
for Ottawa, Ontario (Environment Canada 2011). For a constant ground temperature the pipe
depth is set to 100 m (Dowlatabadi & Hanova 2007). The piping is standard high density
polyethylene DN32 PN10 with a nominal diameter of 32 mm, an inner diameter of 26.2 mm,
and a pressure rating of 10 bar (CANMET Energy Technology Centre 2002). The pipe mate-
rial is assumed smooth, noting the equivalent roughness value for new commercial polyethyl-
ene pipe is 0 (Cengel 2007), and to have a thermal conductivity of 0.375 W/m·K based on an
average from various sources (ISCO Industries 2011). The borehole diameter is 101.6 mm (4
inches) (Omer 2008), and the grout thermal conductivity is 1.56 W/m·K (CETCO Drilling
Products 2009). The evaporator inlet and outlet temperatures for the ground loop are 7.3°C
and 1.3ºC respectively, and the flow rate through an individual parallel loop is 0.3 kg/s.
3 System Configurations
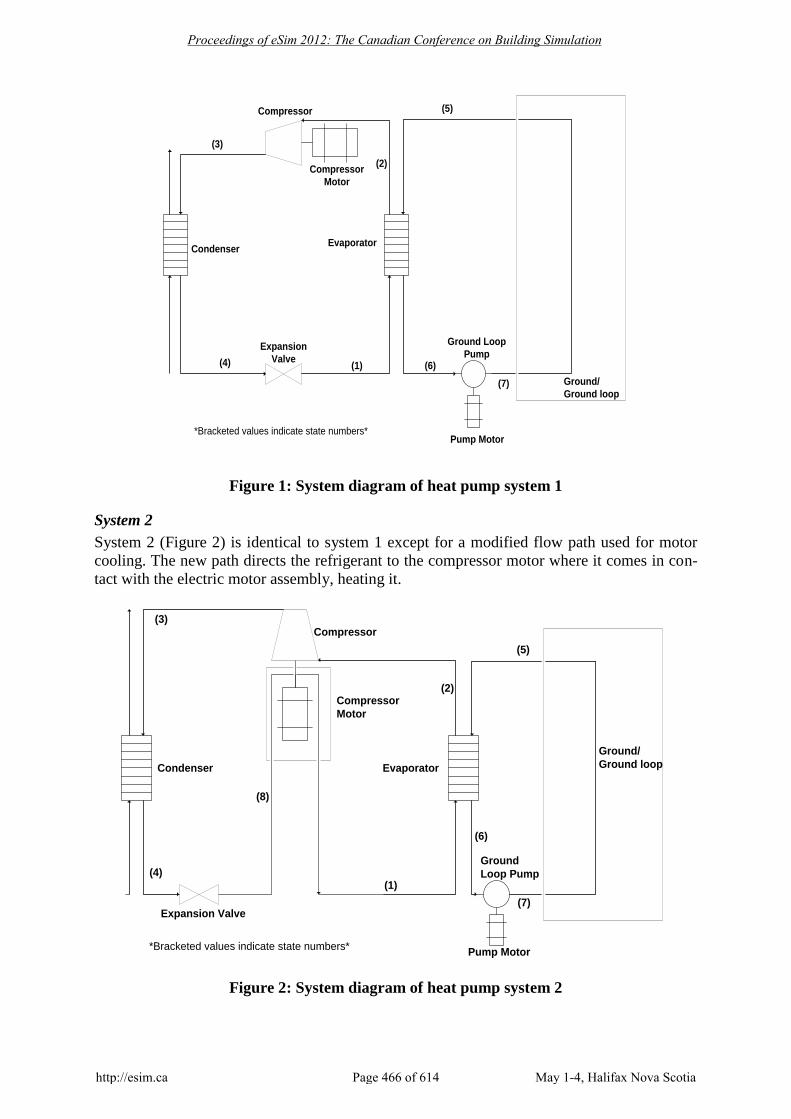
System 1
System 1 (Figure 1) is a basic heat pump cycle coupled with an electric motor for the com-
pressor and a ground loop with a pump. Refrigerant at state 1 enters the evaporator where
thermal energy is transferred to it from the ground loop. The refrigerant exits the evaporator at
state 2 as superheated vapour and enters the compressor, exiting as a high pressure super-
heated vapour at state 3. The refrigerant enters the condenser and thermal energy is extracted
and supplied to the space. Exiting the condenser (state 4), the refrigerant is a subcooled liquid.
This arrangement is widely utilized due to its simplicity and ease of design (Omer 2008).
http://esim.ca Page 465 of 614 May 1-4, Halifax Nova Scotia
Proceedings of eSim 2012: The Canadian Conference on Building Simulation
(3)
(2)
(4) (1) (6)
(5)
(7)
Evaporator
Compressor
Compressor
Motor
Condenser
Expansion
Valve
Ground Loop
Pump
Pump Motor
Ground/
Ground loop
*Bracketed values indicate state numbers*
Figure 1: System diagram of heat pump system 1
System 2
System 2 (Figure 2) is identical to system 1 except for a modified flow path used for motor
cooling. The new path directs the refrigerant to the compressor motor where it comes in con-
tact with the electric motor assembly, heating it.
(3)
(2)
(4)(1)
(6)
(5)
(7)
(8)
Evaporator
Compressor
Compressor
Motor
Condenser
Expansion Valve
Ground
Loop Pump
Pump Motor
Ground/
Ground loop
*Bracketed values indicate state numbers*
Figure 2: System diagram of heat pump system 2
http://esim.ca Page 466 of 614 May 1-4, Halifax Nova Scotia
Proceedings of eSim 2012: The Canadian Conference on Building Simulation
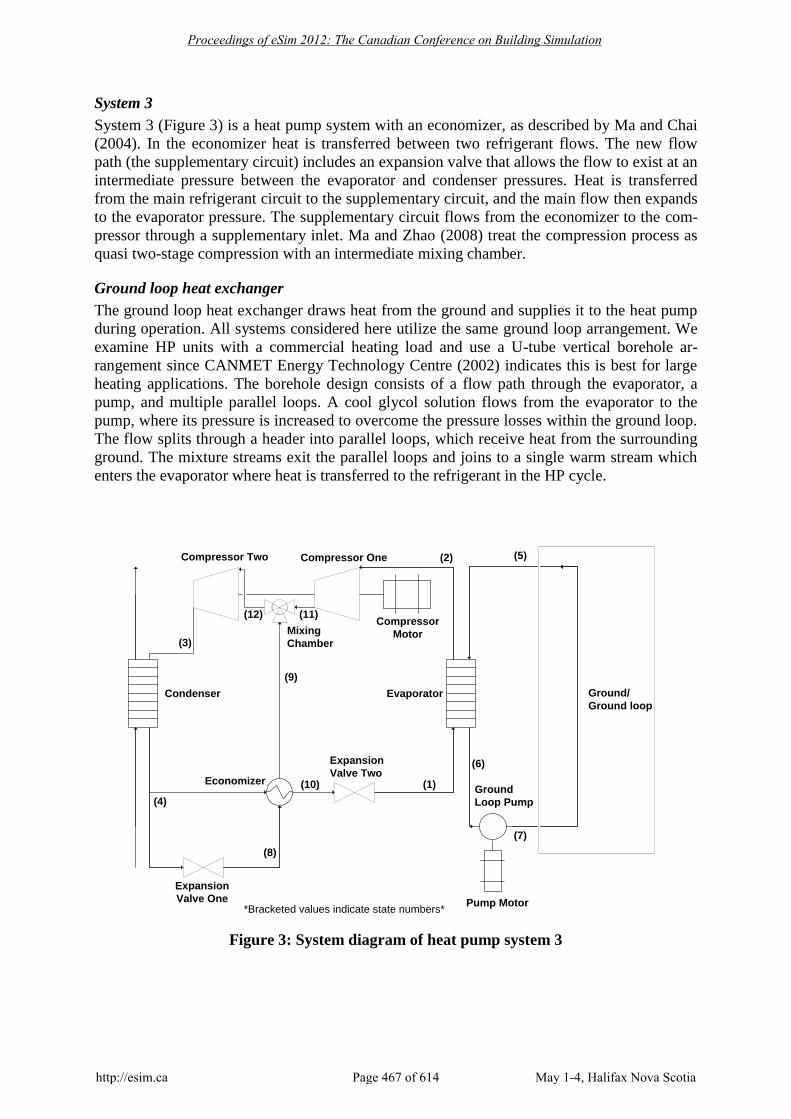
System 3
System 3 (Figure 3) is a heat pump system with an economizer, as described by Ma and Chai
(2004). In the economizer heat is transferred between two refrigerant flows. The new flow
path (the supplementary circuit) includes an expansion valve that allows the flow to exist at an
intermediate pressure between the evaporator and condenser pressures. Heat is transferred
from the main refrigerant circuit to the supplementary circuit, and the main flow then expands
to the evaporator pressure. The supplementary circuit flows from the economizer to the com-
pressor through a supplementary inlet. Ma and Zhao (2008) treat the compression process as
quasi two-stage compression with an intermediate mixing chamber.
Ground loop heat exchanger
The ground loop heat exchanger draws heat from the ground and supplies it to the heat pump
during operation. All systems considered here utilize the same ground loop arrangement. We
examine HP units with a commercial heating load and use a U-tube vertical borehole ar-
rangement since CANMET Energy Technology Centre (2002) indicates this is best for large
heating applications. The borehole design consists of a flow path through the evaporator, a
pump, and multiple parallel loops. A cool glycol solution flows from the evaporator to the
pump, where its pressure is increased to overcome the pressure losses within the ground loop.
The flow splits through a header into parallel loops, which receive heat from the surrounding
ground. The mixture streams exit the parallel loops and joins to a single warm stream which
enters the evaporator where heat is transferred to the refrigerant in the HP cycle.
(3)
(2)
(1)
(6)
(5)
(7)
(8)
(12) (11)
(9)
(10)
(4)
Evaporator
Compressor One
Mixing
Chamber
Compressor Two
Compressor
Motor
Condenser
Expansion
Valve One
Expansion
Valve TwoEconomizer
Ground
Loop Pump
Pump Motor
Ground/
Ground loop
*Bracketed values indicate state numbers*
Figure 3: System diagram of heat pump system 3
http://esim.ca Page 467 of 614 May 1-4, Halifax Nova Scotia
Proceedings of eSim 2012: The Canadian Conference on Building Simulation
4 Analysis
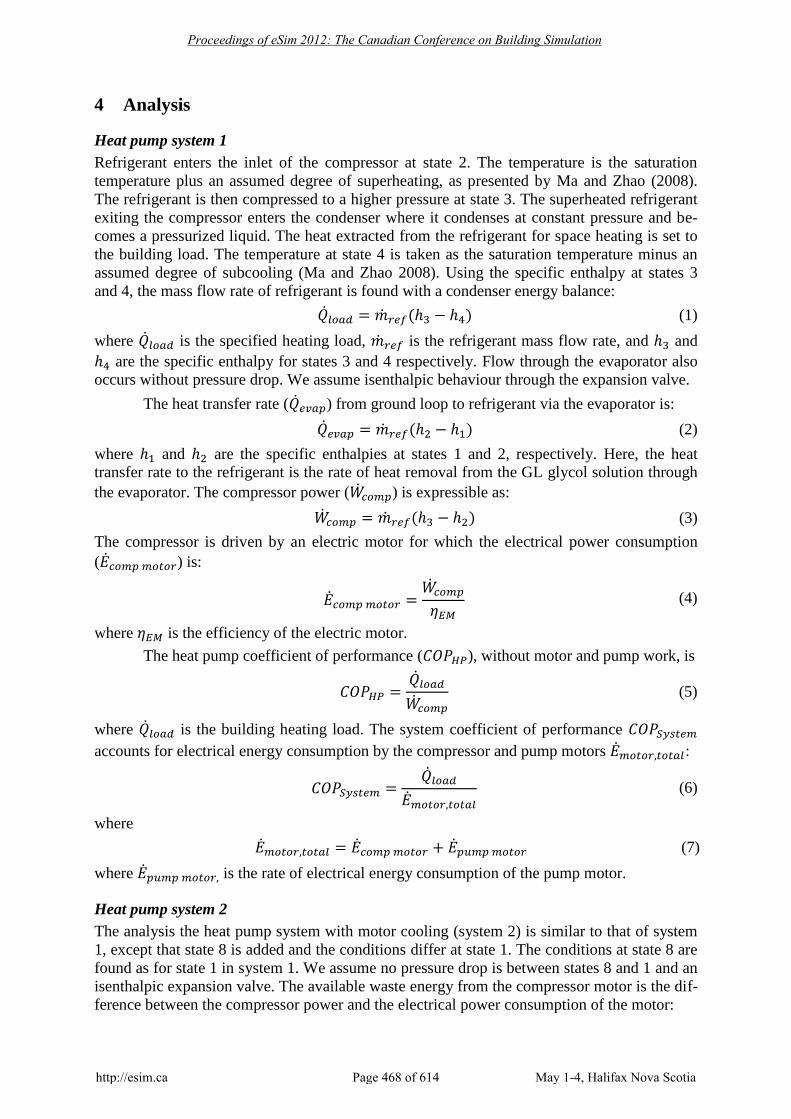
Heat pump system 1
Refrigerant enters the inlet of the compressor at state 2. The temperature is the saturation
temperature plus an assumed degree of superheating, as presented by Ma and Zhao (2008).
The refrigerant is then compressed to a higher pressure at state 3. The superheated refrigerant
exiting the compressor enters the condenser where it condenses at constant pressure and be-
comes a pressurized liquid. The heat extracted from the refrigerant for space heating is set to
the building load. The temperature at state 4 is taken as the saturation temperature minus an
assumed degree of subcooling (Ma and Zhao 2008). Using the specific enthalpy at states 3
and 4, the mass flow rate of refrigerant is found with a condenser energy balance:
(1)
where is the specified heating load, is the refrigerant mass flow rate, and and
are the specific enthalpy for states 3 and 4 respectively. Flow through the evaporator also
occurs without pressure drop. We assume isenthalpic behaviour through the expansion valve.
The heat transfer rate ( ) from ground loop to refrigerant via the evaporator is:
(2)
where and are the specific enthalpies at states 1 and 2, respectively. Here, the heat
transfer rate to the refrigerant is the rate of heat removal from the GL glycol solution through
the evaporator. The compressor power ( ) is expressible as:
(3)
The compressor is driven by an electric motor for which the electrical power consumption
( ) is:
(4)
where is the efficiency of the electric motor.
The heat pump coefficient of performance ( ), without motor and pump work, is
(5)
where is the building heating load. The system coefficient of performance
accounts for electrical energy consumption by the compressor and pump motors :
(6)
where
(7)
where is the rate of electrical energy consumption of the pump motor.
Heat pump system 2
The analysis the heat pump system with motor cooling (system 2) is similar to that of system
1, except that state 8 is added and the conditions differ at state 1. The conditions at state 8 are
found as for state 1 in system 1. We assume no pressure drop is between states 8 and 1 and an
isenthalpic expansion valve. The available waste energy from the compressor motor is the dif-
ference between the compressor power and the electrical power consumption of the motor:
http://esim.ca Page 468 of 614 May 1-4, Halifax Nova Scotia
Proceedings of eSim 2012: The Canadian Conference on Building Simulation
(8)
where is the rate waste energy associated with the compressor motor. It is as-
sumed that all waste energy from the electric motor is converted to thermal energy and trans-
ferred to the refrigerant. That is,
(9)
The expressions for coefficient of performance for system 2 are the same as for system 1.
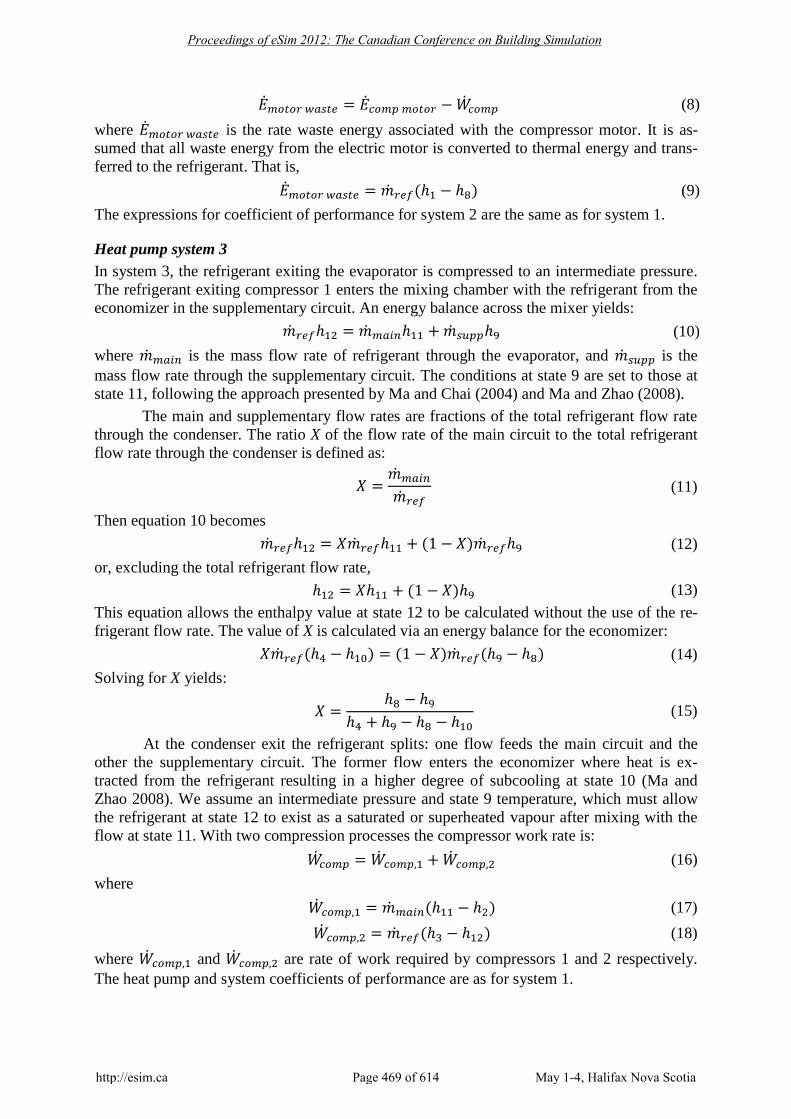
Heat pump system 3
In system 3, the refrigerant exiting the evaporator is compressed to an intermediate pressure.
The refrigerant exiting compressor 1 enters the mixing chamber with the refrigerant from the
economizer in the supplementary circuit. An energy balance across the mixer yields:
(10)
where is the mass flow rate of refrigerant through the evaporator, and is the
mass flow rate through the supplementary circuit. The conditions at state 9 are set to those at
state 11, following the approach presented by Ma and Chai (2004) and Ma and Zhao (2008).
The main and supplementary flow rates are fractions of the total refrigerant flow rate
through the condenser. The ratio X of the flow rate of the main circuit to the total refrigerant
flow rate through the condenser is defined as:
(11)
Then equation 10 becomes
(12)
or, excluding the total refrigerant flow rate,
(13)
This equation allows the enthalpy value at state 12 to be calculated without the use of the re-
frigerant flow rate. The value of X is calculated via an energy balance for the economizer:
(14)
Solving for X yields:
(15)
At the condenser exit the refrigerant splits: one flow feeds the main circuit and the
other the supplementary circuit. The former flow enters the economizer where heat is ex-
tracted from the refrigerant resulting in a higher degree of subcooling at state 10 (Ma and
Zhao 2008). We assume an intermediate pressure and state 9 temperature, which must allow
the refrigerant at state 12 to exist as a saturated or superheated vapour after mixing with the
flow at state 11. With two compression processes the compressor work rate is:
(16)
where
(17)
(18)
where and
are rate of work required by compressors 1 and 2 respectively.
The heat pump and system coefficients of performance are as for system 1.
http://esim.ca Page 469 of 614 May 1-4, Halifax Nova Scotia
Proceedings of eSim 2012: The Canadian Conference on Building Simulation
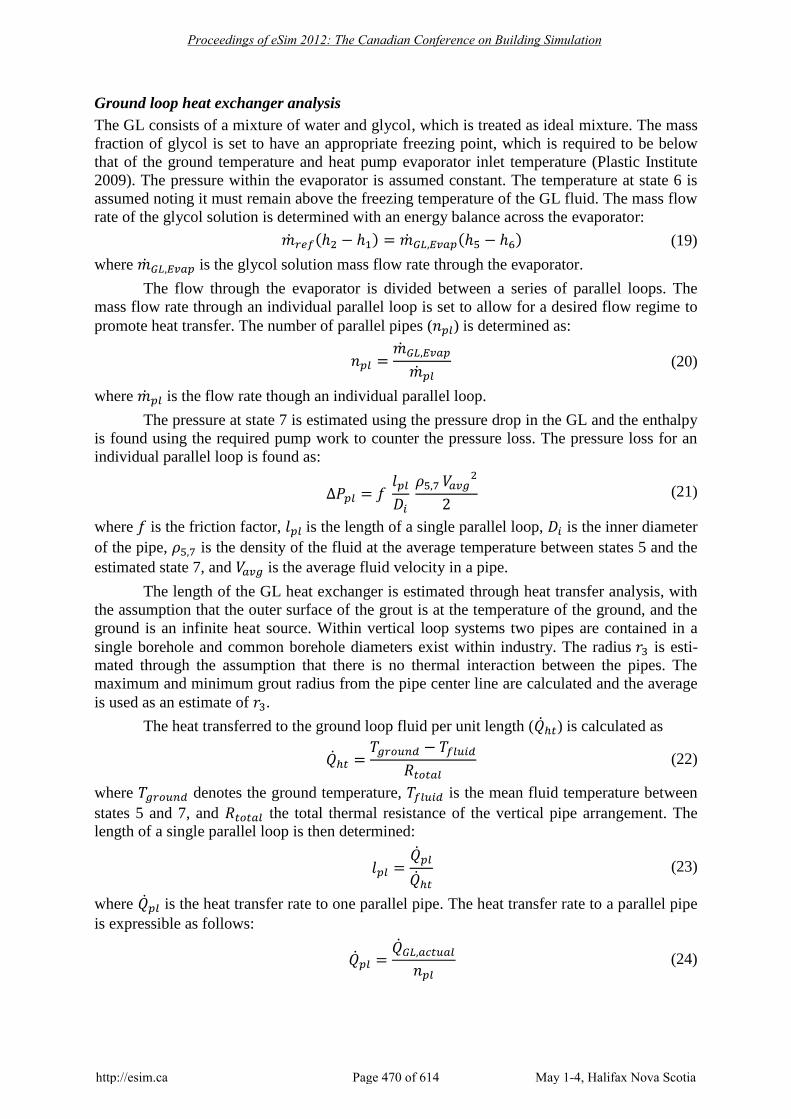
Ground loop heat exchanger analysis
The GL consists of a mixture of water and glycol, which is treated as ideal mixture. The mass
fraction of glycol is set to have an appropriate freezing point, which is required to be below
that of the ground temperature and heat pump evaporator inlet temperature (Plastic Institute
2009). The pressure within the evaporator is assumed constant. The temperature at state 6 is
assumed noting it must remain above the freezing temperature of the GL fluid. The mass flow
rate of the glycol solution is determined with an energy balance across the evaporator:
(19)
where is the glycol solution mass flow rate through the evaporator.
The flow through the evaporator is divided between a series of parallel loops. The
mass flow rate through an individual parallel loop is set to allow for a desired flow regime to
promote heat transfer. The number of parallel pipes ( ) is determined as:
(20)
where is the flow rate though an individual parallel loop.
The pressure at state 7 is estimated using the pressure drop in the GL and the enthalpy
is found using the required pump work to counter the pressure loss. The pressure loss for an
individual parallel loop is found as:
(21)
where is the friction factor, is the length of a single parallel loop, is the inner diameter
of the pipe, is the density of the fluid at the average temperature between states 5 and the
estimated state 7, and is the average fluid velocity in a pipe.
The length of the GL heat exchanger is estimated through heat transfer analysis, with
the assumption that the outer surface of the grout is at the temperature of the ground, and the
ground is an infinite heat source. Within vertical loop systems two pipes are contained in a
single borehole and common borehole diameters exist within industry. The radius is esti-
mated through the assumption that there is no thermal interaction between the pipes. The
maximum and minimum grout radius from the pipe center line are calculated and the average
is used as an estimate of .
The heat transferred to the ground loop fluid per unit length ( ) is calculated as
(22)
where denotes the ground temperature, is the mean fluid temperature between
states 5 and 7, and the total thermal resistance of the vertical pipe arrangement. The
length of a single parallel loop is then determined:
(23)
where is the heat transfer rate to one parallel pipe. The heat transfer rate to a parallel pipe
is expressible as follows:
(24)
http://esim.ca Page 470 of 614 May 1-4, Halifax Nova Scotia
Proceedings of eSim 2012: The Canadian Conference on Building Simulation
where is the actual heat transfer rate required from the ground. When pump work is
taken into account the heat rate required from the ground differs from the rate required by the
HP through the evaporator. The following energy rate balance for the GL system is utilized:
(25)
where is the pump work rate, calculated as:
(26)
where is the specific pump work. Here, the pump is not assumed isentropic, so:
(27)
The isentropic efficiency of the pump is assumed for calculation of actual pump work rate.
The ideal specific pump work is found using the pressure difference across the pump:
(28)
where P7 is found through the use of the pressure drop that occurs in a parallel loop using:
(29)
The conditions at state 7 are required to find the pressure drop but these are initially
unknown. To begin, the temperature at state 7 is assumed to be that of state 6 in order to esti-
mate the fluid properties between state 5 and 7. An iterative approach is necessary in order to
obtain the conditions at state 7. Then, the pump work rate is obtained, and the electrical power
required from the motor for pump operation is found as
(30)
where is the rate of electrical energy consumed by the electric motor, is
the rate of pump work required within the GL, and is the motor efficiency.
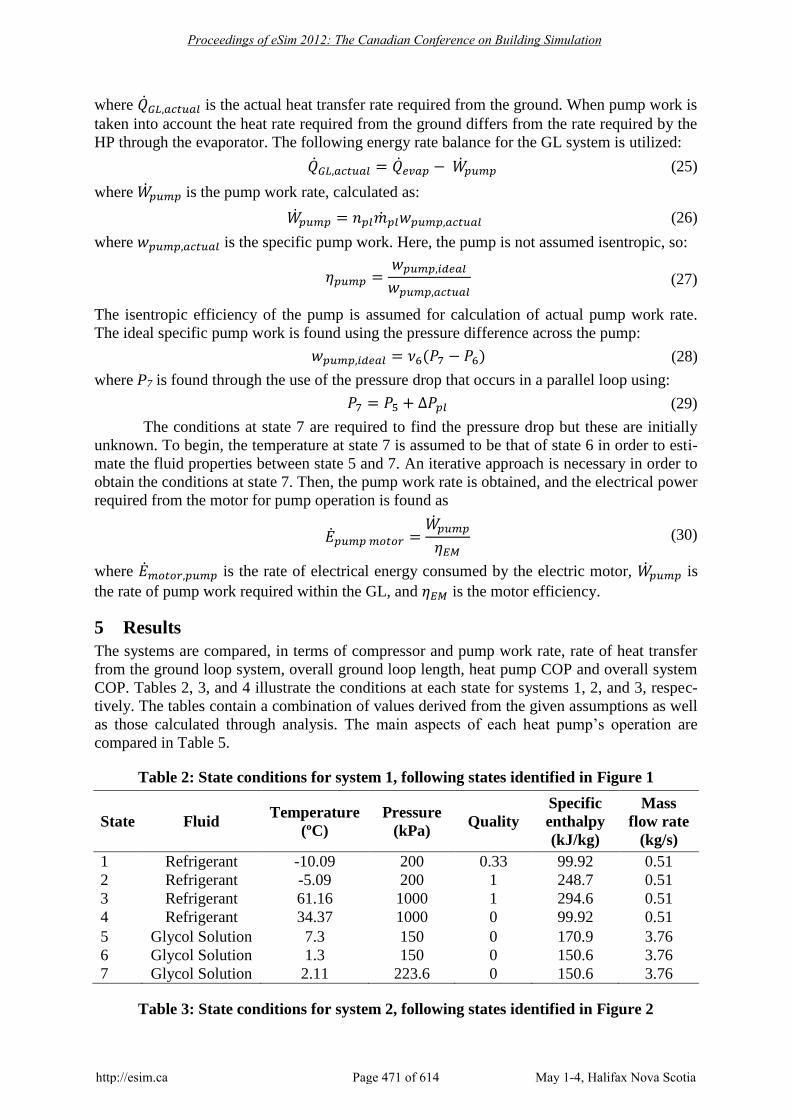
5 Results
The systems are compared, in terms of compressor and pump work rate, rate of heat transfer
from the ground loop system, overall ground loop length, heat pump COP and overall system
COP. Tables 2, 3, and 4 illustrate the conditions at each state for systems 1, 2, and 3, respec-
tively. The tables contain a combination of values derived from the given assumptions as well
as those calculated through analysis. The main aspects of each heat pump’s operation are
compared in Table 5.
Table 2: State conditions for system 1, following states identified in Figure 1
State Fluid Temperature
(ºC)
Pressure
(kPa) Quality
Specific
enthalpy
(kJ/kg)
Mass
flow rate
(kg/s)
1 Refrigerant -10.09 200 0.33 99.92 0.51
2 Refrigerant -5.09 200 1 248.7 0.51
3 Refrigerant 61.16 1000 1 294.6 0.51
4 Refrigerant 34.37 1000 0 99.92 0.51
5 Glycol Solution 7.3 150 0 170.9 3.76
6 Glycol Solution 1.3 150 0 150.6 3.76
7 Glycol Solution 2.11 223.6 0 150.6 3.76
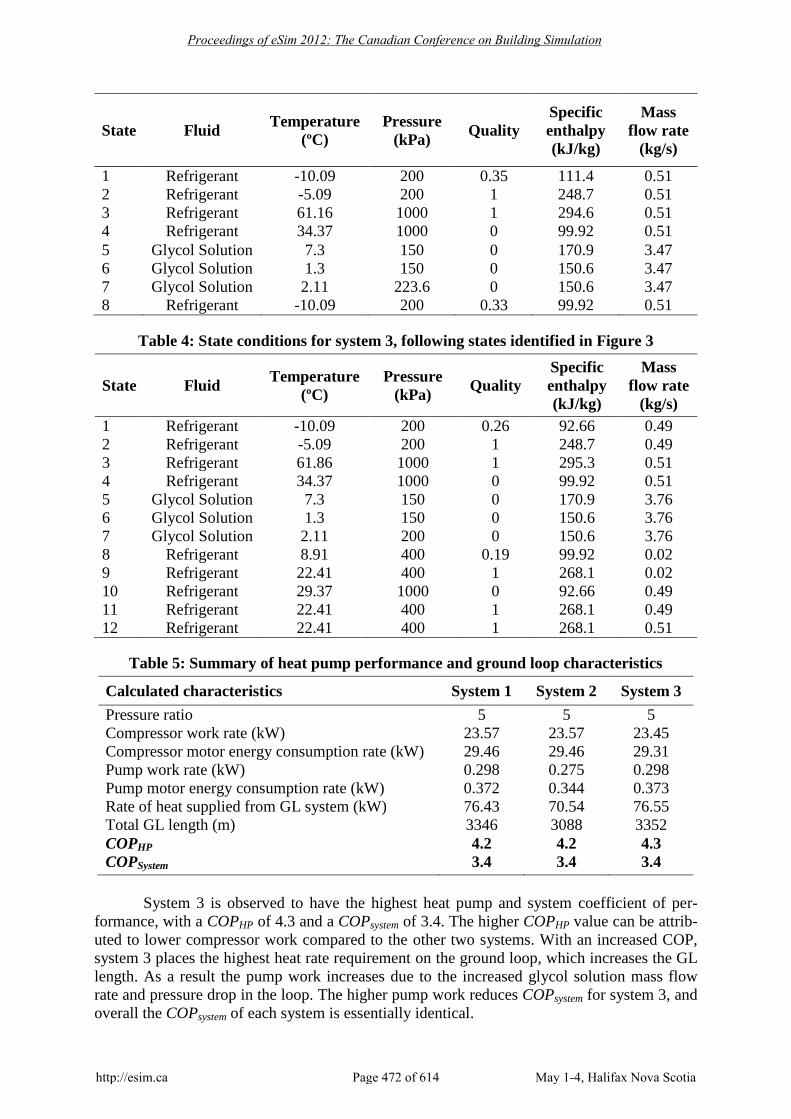
Table 3: State conditions for system 2, following states identified in Figure 2
http://esim.ca Page 471 of 614 May 1-4, Halifax Nova Scotia
Proceedings of eSim 2012: The Canadian Conference on Building Simulation
State Fluid Temperature
(ºC)
Pressure
(kPa) Quality
Specific
enthalpy
(kJ/kg)
Mass
flow rate
(kg/s)
1 Refrigerant -10.09 200 0.35 111.4 0.51
2 Refrigerant -5.09 200 1 248.7 0.51
3 Refrigerant 61.16 1000 1 294.6 0.51
4 Refrigerant 34.37 1000 0 99.92 0.51
5 Glycol Solution 7.3 150 0 170.9 3.47 6 Glycol Solution 1.3 150 0 150.6 3.47
7 Glycol Solution 2.11 223.6 0 150.6 3.47
8 Refrigerant -10.09 200 0.33 99.92 0.51
Table 4: State conditions for system 3, following states identified in Figure 3
State Fluid Temperature
(ºC) Pressure
(kPa) Quality
Specific
enthalpy
(kJ/kg)
Mass
flow rate (kg/s)
1 Refrigerant -10.09 200 0.26 92.66 0.49 2 Refrigerant -5.09 200 1 248.7 0.49 3 Refrigerant 61.86 1000 1 295.3 0.51 4 Refrigerant 34.37 1000 0 99.92 0.51 5 Glycol Solution 7.3 150 0 170.9 3.76 6 Glycol Solution 1.3 150 0 150.6 3.76 7 Glycol Solution 2.11 200 0 150.6 3.76 8 Refrigerant 8.91 400 0.19 99.92 0.02 9 Refrigerant 22.41 400 1 268.1 0.02 10 Refrigerant 29.37 1000 0 92.66 0.49 11 Refrigerant 22.41 400 1 268.1 0.49 12 Refrigerant 22.41 400 1 268.1 0.51
Table 5: Summary of heat pump performance and ground loop characteristics
Calculated characteristics System 1 System 2 System 3
Pressure ratio 5 5 5
Compressor work rate (kW) 23.57 23.57 23.45
Compressor motor energy consumption rate (kW) 29.46 29.46 29.31
Pump work rate (kW) 0.298 0.275 0.298
Pump motor energy consumption rate (kW) 0.372 0.344 0.373 Rate of heat supplied from GL system (kW) 76.43 70.54 76.55
Total GL length (m) 3346 3088 3352 COPHP 4.2 4.2 4.3
COPSystem 3.4 3.4 3.4
System 3 is observed to have the highest heat pump and system coefficient of per-
formance, with a COPHP of 4.3 and a COPsystem of 3.4. The higher COPHP value can be attrib-
uted to lower compressor work compared to the other two systems. With an increased COP,
system 3 places the highest heat rate requirement on the ground loop, which increases the GL
length. As a result the pump work increases due to the increased glycol solution mass flow
rate and pressure drop in the loop. The higher pump work reduces COPsystem for system 3, and
overall the COPsystem of each system is essentially identical.
http://esim.ca Page 472 of 614 May 1-4, Halifax Nova Scotia
Proceedings of eSim 2012: The Canadian Conference on Building Simulation
The COPHP for system 3 is greater than that of system 1 by 2.4%. The increase is due
to the fact that the compressor work is lower. In system 3 not all the refrigerant, which flows
through the condenser, is compressed from the lowest to highest pressure. The system allows
for a fraction of the refrigerant to be compressed from an intermediate pressure to high pres-
sure, reducing the work required by the first compressor. From Tables 2, 3, and 4 it can be
seen that the refrigerant temperature at the inlet of the condenser in system 3 is slightly higher
than that of systems 1 and 2 with the same pressure ratio. If the refrigerant temperature at the
exit of the compressor of each system were assumed equal it would be seen that system 3
would have a lower pressure ratio between the evaporator and condenser, which would result
in lower compressor work rate and further increase in COPHP.
Systems 1 and 2 have the same compressor work rates and therefore the same COPHP.
Within system 1 the entire thermal requirement of the system is accommodated by the ground
loop. In system 2 a portion of the thermal requirement is covered through recovery of waste
heat generated by the compressor electric motor. Thermal energy is extracted from the ground
for system 1 at a rate of 76.43 kW compared to only 70.54 kW for system 2. The reduction in
the heat requirement rate from the ground means that there is a reduction in the required GL
length of approximately 260 meters (8%) for the same heating load. System 2 has a shorter
GL length resulting in reduced pump power requirements, which should theoretically increase
COPsystem.
From the results shown in Table 5 it can be seen that the compressor work rate is sig-
nificantly larger than the pump work rate, where the pump work rate for each system is only
about 1% of the total power consumed by the systems. Having compression contribute such a
large amount to the total energy consumption renders the effect of varying pump work rate on
COPsystem, through different GL lengths, minor. Through simulation it is found that COPsystem
for systems 2 and 3 increase by 0.09% and 0.5%, respectively, compared to system 1. These
increases are sufficiently small that COPsystem can be considered to be the same for each case.
The GL length can be measured in terms of length per unit heat supplied to the build-
ing space. Systems 1, 2 and 3 exhibit values of 33.46 m/kW, 30.88 m/kW and 33.52 m/kW,
respectively. The values coincide with the vertical GL sizing guidelines of 17 to 39 m of ver-
tical loop length per kW heating load for GL layouts utilizing a nominal pipe size between
25.4 and 50.8 mm, illustrated by CANMET Energy Technology Centre (2002). Kara (2007)
calculates a length of 33.6 m/kW for the basic vapour compression cycle with similar operat-
ing conditions.
During the early stages of analysis it was found that multiple parallel loops are re-
quired for a system that involves high heat rates from the GL. Originally a single loop was
employed and it was found that the pressure drop that occurs with the corresponding length of
the pipe is substantial, which requires the pump to have a very high pressure outlet that ap-
proaches the upper limit of the pipe material. Employing multiple parallel loops allows for the
total pressure drop in the system to be distributed between each loop.
6 Discussion
The comparison of the three systems shows that a heat pump system with the economizer ar-
rangement (system 3) has the highest heat pump and system COPs. The inclusion of an
economizer reduces compressor work, contributing directly to higher heat pump COP values.
Alternatively the economizer arrangement has the highest GL and pump work requirements.
The heat pump COP values for the basic vapour compression cycle (system 1) and
motor cooling (system 2) are identical through having the same compressor work rates. The
system COP of the heat pump arrangement with motor cooling is the same as that of the basic
vapour compression cycle since the impact of varying pump work rate on system COP is
http://esim.ca Page 473 of 614 May 1-4, Halifax Nova Scotia
Proceedings of eSim 2012: The Canadian Conference on Building Simulation
small. Compared to the basic vapour compression cycle the use of motor cooling reduces the
heat required from the ground loop, which leads to a decrease in GL length and pump work.
If there is abundant space available for the installation of the ground loop it is favour-
able to install an economizer based heat pump as it provides the greatest performance. The
use of an economizer increases the COP values, which means that it has the lowest energy
input to provide an identical degree space heating.
When a heat pump system is designed for a location where limited land is available,
the motor cooling arrangement would provide the greatest benefits. Although the heat pump
COP value of this system is lower than for the economizer arrangement, the benefits of re-
duced ground loop length are necessary in some system designs.
To develop a high performance system that does not have large ground loop require-
ments we suggest a combination of the economizer arrangement and the motor cooling ar-
rangement. This type of setup would allow for the compressor work rate and possibly the
ground loop length to be reduced over the basic vapour compression cycle. Compared to the
economizer arrangement the ground loop length would be reduced, which would result in a
reduction in pump work rate and increase in system COP. Alternatively the combination of
these systems would increase system complexity. Further studies into the type of arrangement
would be required to determine its feasibility.
The amount of pump work required for the systems is minor compared to the com-
pressor work for the heat pump. The pump is responsible for approximately 1.0% of the total
mechanical work input to the system, with the economizer arrangement requiring the greatest
contribution of pump work and the motor cooling arrangement requiring the lowest due to an
increase and decrease in GL requirements, respectively.
7 Conclusions
Three heat pump designs (basic vapour compression cycle, a vapour compression cycle in-
cluding electric motor cooling, and a vapour compression cycle with an economizer) are ana-
lyzed for identical heating loads and pressure ratios, and compared in terms of COP and
ground loop requirements. The main conclusions follow:
Heat pump designs that include an economizer have the greatest potential for high ef-
ficiency, based on the heat pump COPs attained in the present study.
A heat pump system that utilizes motor cooling can reduce ground loop requirements
without sacrificing performance relative to the basic vapour compression cycle.
Heat pump COP and ground loop length are directly related.
When the heat pump COP increases the required ground loop length also increases.
The ground loop pump can be excluded from the analysis, at least during preliminary
studies, of heat pump systems with a little inaccuracy.
This study is the first step in analyzing and developing detailed simulations that reflect system
operation and feasibility for various situations. Future work is expected to involve transient
assessments to allow for enhanced understanding of these systems and the associated benefits
they offer.
8 Acknowledgements
The authors acknowledge the financial support of the Natural Sciences and Engineering Re-
search Council of Canada.
http://esim.ca Page 474 of 614 May 1-4, Halifax Nova Scotia
Proceedings of eSim 2012: The Canadian Conference on Building Simulation
9 Nomenclature
Coefficient of performance for heat pump cycle
Coefficient of performance for entire system
Inner diameter of ground loop piping, m
Electrical power consumed by compressor motor, kW
Electrical power consumed by pump motor, kW
Sum of the electrical power consumed by compressor and pump motors, kW
Rate of waste energy available for transfer from compressor motor, kW
Friction factor
Specific enthalpy at state i, kJ/kg
Length of a single parallel loop, m
Mass flow rate of glycol solution through the evaporator, kg/s
Mass flow rate of glycol solution through a parallel loop, kg/s
Mass flow rate through the main circuit in system 3, kg/s
Mass flow rate of refrigerant through condenser, kg/s
Mass flow rate of refrigerant through the supplementary circuit, kg/s
Number of parallel loops within ground loop
Pressure at state i, kPa
Heat input of evaporator to refrigerant, kW
Actual rate of heat transfer required from the ground, kW
Rate of heat transfer to each parallel loop, kW
Rate of heat transfer from ground to glycol solution fluid, kW
Heating load of building, kW/m
Rate of heat transfer from the compressor motor to the refrigerant, kW
Total thermal resistance, °C/W
Ground temperature, ºC
Average fluid temperature between states 7 and 5, ºC
Average fluid velocity through a parallel ground loop, m/s
Specific volume at state i, m3/kg
Power consumption of compressor, kW
Power consumption of compressor i, kW
Power consumption of pump, kW
Actual pump specific work, kJ/kg
Ideal pump specific work, kJ/kg
Ratio of mass flow rates in the main and supplementary circuits
Pressure drop within a parallel loop, kPa
Electric motor efficiency
Pump isentropic efficiency
Density at state i, kg/m
3
Subscripts
avg Average
comp Compressor
EM Electric motor
evap Evaporator
GL Ground loop
http://esim.ca Page 475 of 614 May 1-4, Halifax Nova Scotia
Proceedings of eSim 2012: The Canadian Conference on Building Simulation
HP Heat pump
ht Heat transfer
pl Parallel loop
ref Refrigerant
supp Supplimentary
Acronyms
COP Coefficient of performance
GHP Geothermal heat pump
GL Ground loop
HP Heat pump
10 References
Akdemir, O. & Hepbasli, A., 2004. Energy and Exergy Analysis of a Ground Source (Geo-
thermal) Heat Pump System, Energy Conversion and Management, Vol. 45, pp. 737–
753.
CANMET Energy Technology Centre, 2002. Commercial Earth Energy Systems: A Buyer’s
Guide. Available at: http://publications.gc.ca/collections/Collection/M92-251-
2002E.pdf [Accessed December 2, 2011]
Cengel, Y.A., 2007. Heat and Mass Transfer: A Practical Approach 3rd ed., New York, NY:
McGraw Hill.
CETCO Drilling Products, 2009. Geothermal Grout- enhanced thermally conductive grout,
Grouts and Sealants: Technical Data, Rev. 1/09.
Dowlatabadi, H. & Hanova, J., 2007. Strategic GHG Reduction Through the use of Ground
Source Heat Pump Technology. Environ. Res. Lett., Vol. 2, pp. 1-8.
Ediger, V.S., Hosgor, E., Surmeli, A.N., & Tatlidil H., 2007. Fossil fuel sustainability index:
An application of resource management, Energy Policy, Vol. 35, No 5, pp. 2969–
2977.
Environment Canada, 2011. National Climate Data and Information Archive: Canadian Cli-
mate Normals 1971-2000, Ottawa. Available at:
CDAhttp://www.climate.weatheroffice.gc.ca/climate_normals/results_e.html?stnID=4
333&lang=e&dCode=1&StationName=OTTAWA&SearchType=Contains&province
=ALL&provBut=&month1=0&month2=12, last visited November [Accessed Decem-
ber 2, 2011]
Hammond, G.P., 2000. Energy, environment and sustainable development: A UK perspective,
Transactions of the Institution of Chemical Engineers, Part B: Process Safety and En-
vironmental Protection, Vol. 78, No 4, pp. 304–323.
Healy, P.F. & Ugursal V.I., 1997. Performance and Economic Feasibility of Ground Source
Heat Pumps in Cold Climates, International Journal of Energy Research, Vol. 21, pp.
857-870.
Hepbaslia, A. & Balta, M.T., 2007. A study on Modeling and Performance assessment of a
Heat Pump System for Utilizing Low Temperature Geothermal Resources in Build-
ings, Building and Environment, Vol. 42, pp. 3747–3756.
ISCO Industries, 2011. High Density Polyethylene: Typical Properties. Available at:
http://www.isco-pipe.com/products_services/hdPE_pipe_2typical.asp, last visited
[Accessed November 25, 2011].
http://esim.ca Page 476 of 614 May 1-4, Halifax Nova Scotia
Proceedings of eSim 2012: The Canadian Conference on Building Simulation
Kara, Y.A., 2007. Experimental Performance Evaluation of a Closed-Loop Vertical Ground
Source Heat Pump in the Heating Mode using Energy Analysis Method, International
Journal of Energy Research, Vol. 31, 2007, pp. 1504–1516.
Ma, G.Y. & Chai, Q.H., 2004. Characteristics of an Improved Heat-Pump Cycle for Cold Re-
gions, Applied Energy, Vol. 77, 2004, pp. 235–247.
Ma, G.Y. & Zhao, H.X., 2008. Experimental Study of a Heat Pump System with Flash-Tank
Coupled with Scroll Compressor, Energy and Buildings, Vol. 40, 2008, pp. 697–701.
Natural Resources Canada, 2003. Survey 2000, Commercial and Institutional Building En-
ergy Use: Summary Report. Available at:
http://faq.nrcan.gc.ca/corporate/statistics/neud/dpa/data_e/Cibeus2/CIBEUS2_ENG.p
df [Accessed December 2, 2011].
Office of Energy Efficiency and Renewable Energy, 2004. Geothermal Today: 2003 Geo-
thermal Technologies Program Highlights, Washington, DC: US Department of En-
ergy.
Omer, A.M., 2008. Ground-source heat pumps systems and applications, Renewable and Sus-
tainable Energy Reviews, Vol. 12, pp. 344–371.
The Plastic Institute, 2009. HVAC Applications for PE Pipe, PPI handbook of polyethylene
pipe, pp. 463-472
Wang, X., Hwang, Y., & Radermacher, R., 2008. Investigation of Potential Benefits of Com-
pressor Cooling, Applied Thermal Engineering, Vol. 28, pp. 1791–1797.
Wu, R., 2009. Energy Efficiency Technologies – Air Source Heat Pump vs. Ground Source
Heat Pump, Journal of Sustainable Development, Vol. 2, No 2, pp. 14-23.
http://esim.ca Page 477 of 614 May 1-4, Halifax Nova Scotia
Proceedings of eSim 2012: The Canadian Conference on Building Simulation