Embed Size (px)
Citation preview

Energy Access Situation and Scenarios
in West Africa: Access Rates, National
Approaches and Policies in different
ECOWAS Countries
M’Gbra N’Guessan
V-P Africa, Econoler
ECREEE/UNDP/PREP Consultant
Team Leader
Accra, October 24 2011

OVERVIEW
1. General Background
2. Energy Access Situation in West Africa
Strategic Objective
Access Rates
National Approaches and Policies
3. Achievement at Country Level in ECOWAS
4. The Challenges Ahead
5. Opportunities
6. Conclusion
2

HIGHLIGHTS
Energy Issues in ECOWAS Region
1. Huge demand and supply gap (more than 40 %) in modern energy services
2. 64 % of the total energy supply are covered by thermal power plants
3. 31 % are generated with Hydro Power
4. 5 % come from imports and other energy resources such as RE
5. Traditional biomass constitutes a vital part of the primary energy consumption (especially in the rural areas), with a total contribution of 80 %
3

HIGHLIGHTS (2)
Proposed Approaches 6. Translate the White Paper into actions such as
reorienting national funding to energy access policy goals
7. National Task Force for fund raising relating to universal
access (taking advantage of existing and upcoming
financing mechanisms at the global level)
8. Private sector could play a critical role in Regional Energy
Access agenda (national governments to adopt strong
governance and regulatory frameworks and engage in
capacity building)
9. Public sector needs to leverage greater private sector
investment where the commercial case is not attractive
4

HIGHLIGHTS (3)
10.Public subsidies must be well used to reach the poorest
to switch from traditional biomass to modern bioenergy
for cooking (rural and peri-urban)
11.Operating consumer and business finance through local
banks and microfinance institutions for renewables
12.Establishment of a comprehensive database on Energy
Access for monitoring purposes (from ECOWAS regional
model to national and local tools)
13.Policy platform for information sharing at national and
regional level (ECREEE must play a leading role)
14.Setting targets is a necessary step to provide a
framework for tracking progress and accountability
5

1 - GENERAL BACKGROUND
6

POPULATION: IN 2009, WORLD POPULATION
STOOD AT 6.8 BILLION, UP ABOUT 83 MILLION FROM 2008
SSA: 836 M VS AFRICA: 999 (MID-2009 FIGURE)
7

POPULATION CLOCK, 2009
More
Developed
Countries
Less Developed
Countries World
Population 1 232 100 000 5 577 872 000 6 809 972 000
Births per Year 14 359 000 124 590 000 138 949 000
Day 39 340 341 343 380 683
Death per Year 12 277 000 43 806 000 56 083 000
Day 33 635 120 018 153 653
Natural Year 2 082 000 80 784 000 82 866 000
Increase Day 5 705 221 325 227 030
8

THE TOTAL POPULATION OF ECOWAS WAS ABOUT 300
MILLION IN 2010 (TECHNICAL PAPER – P.7)
Country Population in
million (2010)
Rural
Population (%
of total
population)
Population
Below Poverty
Line (%)
GDP Current
(100000 US $
in 2010
GDP Growth
(% in 2010)
HDI Rank
(2010
ranking)
Benin 8.8 58 37.4 6,633 3 134
Burkina Faso 16.5 80 46.4 8,820 9.2 161
Cape Verde 0.5 39 30 1,648 5.4 118
Côte d'Ivoire 19.7 50 42 22,780 3 149
Gambia 1.7 42 39.6 807 5 151
Guinea 10.0 65 30.5 4,511 1.9 156
Guinea-Bissau 1.5 70 51.6 879 3.5 164
Ghana 24.4 49 29 31,306 6.6 130
Liberia 4.0 39 80 986 5.5 162
Mali 15.4 67 25.5 9,251 4.5 160
Niger 15.5 83 63 5,549 8.8 167
Nigeria 158.4 50 43.1 193,669 7.9 142
Senegal 12.4 57 35.1 12,954 4.2 144
Sierra Leone 5.9 62 47 1,905 4.9 158
Togo 6.0 57 36.8 3,153 3.4 139
ECOWAS 300 (325 yr15) 57.87 42 5.1
SSA 856 60
World 6,900 44
Most of the poor
living in rural &
periurban 9

2 - ENERGY ACCESS SITUATION
10

ELECTRICITY ACCESS
OVERVIEW IN THE WORLD
0
25
50
75
100
1970 1990 2004 2020
(Forecast)
Latin
America
Mid-East/
North
AfricaEast Asia
& Pacific
South
Asia
Africa
Year
% of population with
access to electricity
• 585 million in sub-Saharan Africa lack access to electricity
• Connection rates as low as 8% in rural areas
• Figures from IEA, 2010
• Forecast by the WB, 2006
11

ELECTRICITY ACCESS IN 2009 -
REGIONAL AGGREGATES (P.8)
Population
without
electricity
millions
Electrification
rate
%
Urban
electrification
rate
%
Rural
electrification
rate
%
Africa 587 41,9 68,9 25,0
North Africa 2 99,0 99,6 98,4
Sub-Saharan Africa 585 30,5 59,9 14,3 Developing Asia 799 78,1 93,9 68,8
China & East Asia 186 90,8 96,4 86,5
South Asia 612 62,2 89,1 51,2
Latin America 31 93,4 98,8 74,0
Middle East 22 89,5 98,6 72,2
Developing countries 1 438 73,0 90,7 60,2
Transition economies & OECD 3 99,8 100,0 99,5
World 1 441 78,9 93,6 65,1 12
THE SITUATION IN WEST AFRICA
› Attaining the MDGs by 2015 in
ECOWAS Member Countries
requires that at least half the
population of rural and peri-
urban areas have access to
modern energy services
› (ECOWAS White Paper)
› External shocks have
contributed
to deepen Energy Poverty
MAURITANIA MALI
SENEGAL
GUINEA
BISSAU GUINEA
SIERRA
LEONE
LIBERIA
COTE D ’ IVOIRE
BURKINA FASO
TOGO
NIGERIA
NIGER CHAD SUDAN
CENTRAL AFRICAN REPUBLIC
ERITREA
ETHIOPIA
DJIBOUTI
KENYA
UGANDA DEMOCRATIC
REPUBLIC OF CONGO
RWANDA
BURUNDI
GABON
EQUATORIAL GUINEA
SAO TOME AND PRINCIPE
ANGOLA
NAMIBIA
BOTSWANA
ZAMBIA
TANZANIA
MALAWI
ZIMBABWE
SOUTH AFRICA
SWAZILAND
LESOTHO
MAURITIUS
COMOROS
MAYOTTE
(Fr.)
CAPE
VERDE
GAMBIA
Main Cause or Trigger Natural Causes (Droughts)
Financial Shocks (Unaffordable Oil Prices)
System Disrupted by Conflict/Other
Almost 23 out of 48 SSA countries are currently vulnerable according to the World Bank Group
13

STRATEGIC OBJECTIVE
Support ECOWAS member
countries to scale up “real” access
to the less privileged populations
of the region, so as to ensure
affordable, reliable and sustainable
supplies of modern energy
services, as part of broader efforts
to stimulate growth, and reduce
poverty in order to achieve the
MDGs by 2015.
14

15
…STRATEGIC APPROACH…
Improved Enabling
Environment
Realistic costed government strategy (via PRSP)
Funding commitments
Improved Management
Capacity
Financially Healthy Utilities
Balance between affordability for consumers & for governments
Robust regulation
Multiple forms of access provision
Enhanced supplier and consumer incentives
Opportunistic approach to private sector participation
Cost-recovery for O&M costs at minimum
Effective subsidy transfer mechanisms for grid scale-up
Capacity-building for project management & good governance
Expand use of low-cost approaches & technologies
Develop energy SMEs and cooperatives
Effective Policy & Regulatory Framework
15

16
THIS STRATEGIC APPROACH TRANSLATES
INTO A RANGE OF OUTCOMES FOR COUNTRIES
− Progress towards the MDGs through expanded scope and quality of social services
− Meeting basic consumer needs for modern energy services including electricity
− Enhanced growth, productivity and competitiveness
− Reduced vulnerability to shocks - greater security of energy supply including basic household fuels
− Decreased fiscal impact of energy sector
− Reduced environmental impact
16

3 - ACHIEVEMENT AT NATIONAL
LEVEL BY ECOWAS COUNTRIES:
ASSESSMENT THROUGH
ECOWAS POLICY PILLARS
17

ACCESS / PILLAR 1: ELECTRIFICATION
North Africa Africa SS Africa ECOWAS
91,80%
19% 8% 8%
95,50%
37,80% 25,90%
20%
98,70%
67,90% 58,30%
40%
ELECTRICITY ACCESS RATES Rural (%)
National (%)
Urban (%)
18
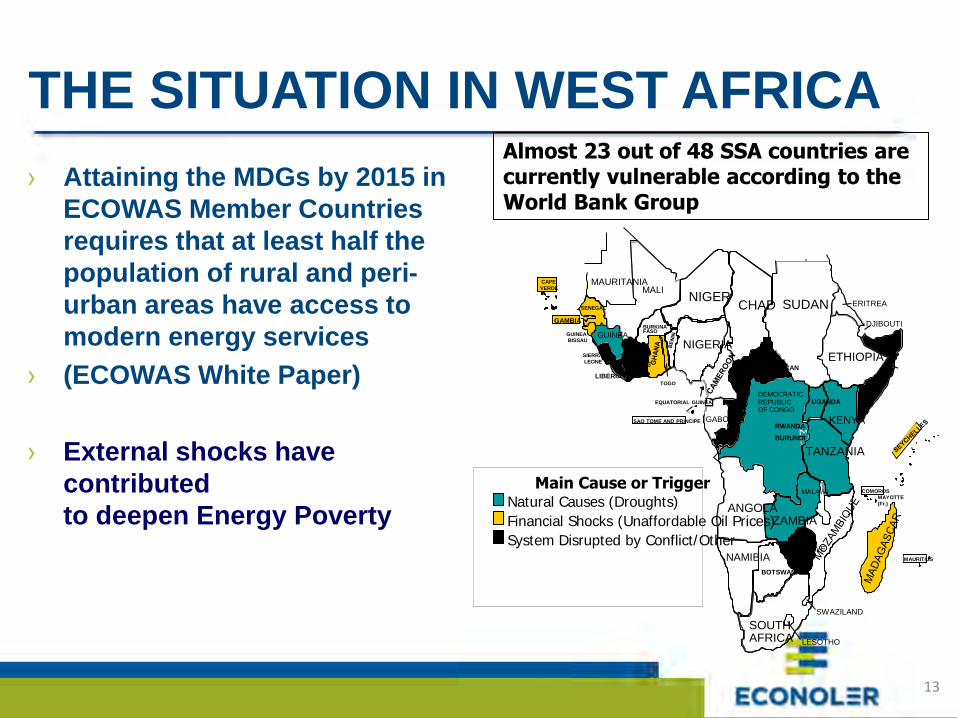
ELECTRICITY ACCESS 2009 – FOR SELECTED
ECOWAS COUNTRIES VS SSA COUNTRIES
Electrification rate
(%)
Population without
electricity millions
Benin 24,8 6,7
Burkina Faso 14,6 13,5
Cote d'Ivoire 47,3 11,1
Ghana 60,5 9,4
Nigeria 50,6 76,4
Senegal 42,0 7,3
Togo 20,0 5,3
Other Africa 17,0 85,2
Sub-Saharan Africa 30,5 585,2
IEA, World Energy Outlook 2010
19

• DISPARITY IN ACCESS RATES BETWEEN COUNTRIES
GHANA AND CAPE VERDE: HIGHEST ACCESS RATES
23 25 10 15
87 67
46 35
22 15
Electricity Access Rates for Selected ECOWAS Member Countries (ENDA / 2009)
Average rural electrification rate is around 8% in ECOWAS
20

APPROACHES AND POLICIES (P.10)
› National Policies :
› Many countries are engaged in the development of policies and
legislation to support energy sector enhancement
› Example: Creation of rural electrification agencies (ASER,
AMADER, SOPIE, ABERME, the late combining both energy
conservation and rural electrification mandate)
› Access to energy services is made through access to
electricity: (Benin, BF, Ghana; Nigeria; Mali, Senegal, Niger …)
(See: Ghana National Energy Policy, 2010)
› Projects and programs aims to reinforce grid extension and
connection of consumers with capacity to paid electricity bills
› Major risk: Power shortage that is limiting the impact of such
approach on socio-economic development in ECOWAS region
21
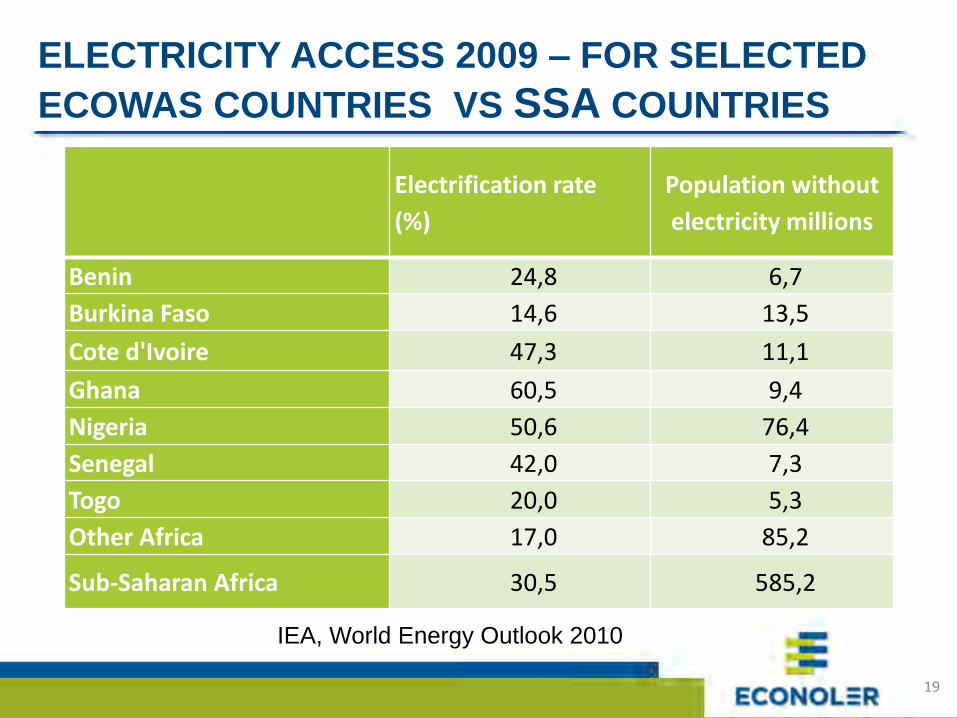
ACHIEVEMENT (P.11)
› National Programs on Energy Access :
› At national level, programmes such as the national
electricity scheme (NES) in Ghana and the
butanization programme in Senegal have
substantially improved energy access for the
population
› Ghana NES was established in 1989 and included an
electrification master plan for 4,221 communities;
packages of 69 grid-based electrification projects
over six phases of five years and the connection of 64
district capitals for phase 1.
› Such programs exist in other ECOWAS countries
22
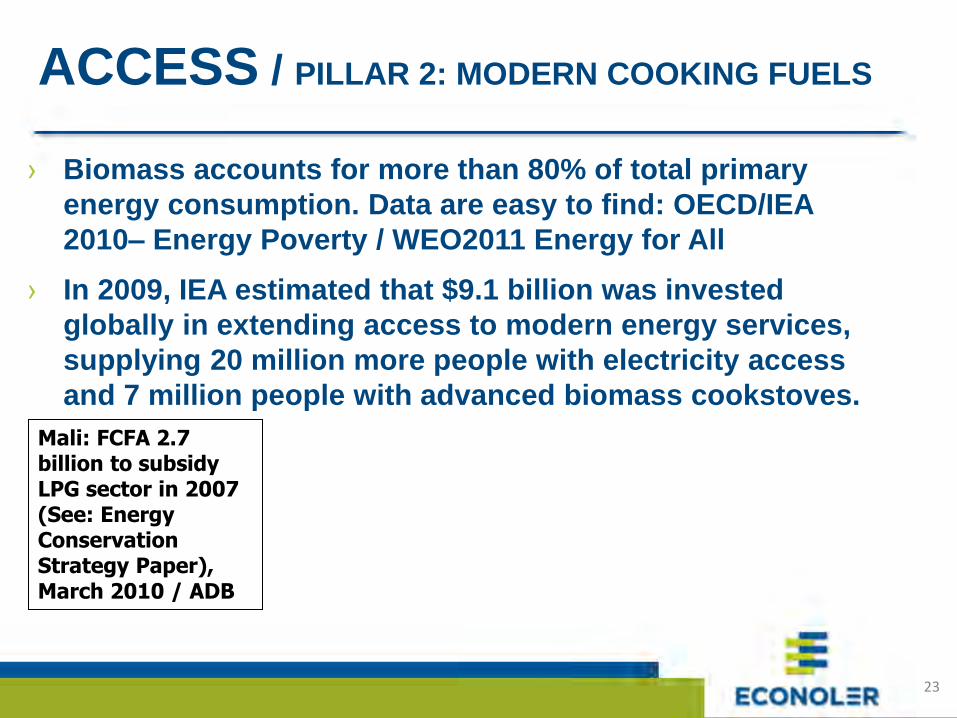
ACCESS / PILLAR 2: MODERN COOKING FUELS
Mali: FCFA 2.7 billion to subsidy LPG sector in 2007 (See: Energy Conservation Strategy Paper), March 2010 / ADB
› Biomass accounts for more than 80% of total primary
energy consumption. Data are easy to find: OECD/IEA
2010– Energy Poverty / WEO2011 Energy for All
› In 2009, IEA estimated that $9.1 billion was invested
globally in extending access to modern energy services,
supplying 20 million more people with electricity access
and 7 million people with advanced biomass cookstoves.
23

NEGATIVE IMPACTS ON HEALTH
24

BIOMASS IN ECOWAS REGION 2009
% DE BIOMASSE DANS LES CONSOMMATIONS ENERGETIQUES FINALES
35%
60%
74%
81%
89,12%
90%
0% 10% 20% 30% 40% 50% 60% 70% 80% 90% 100%
Sénégal
Côte d'Ivoire
Togo
Mali
Niger
Guinée
25

COMPARISON 2009 VS 2005: LIMITED PROGRESS
ACHIEVED AROUND THE WORLD
In 2005 Biomass accounted for almost 80% of residential energy consumption in SSA compared to 70% in Developing Countries. Data for 2009 in ECOWAS region is quite similar to 2005 figures.
26

APPROACHES TO REDUCE RELIANCE ON
TRADITIONAL BIOMASS AT NATIONAL LEVEL
› There are an increased number of National Policies and
Programs in ECOWAS member countries to promote improved
cook stoves (Burkina, Senegal, Benin, Niger...)
› Improved charcoal production techniques from biomass are
also being developed
› Country like Burkina is engaged in the promotion of biogas for
domestic cooking
› Solar cookers could be considered in the future as a viable
option to substitute wood fuel for cooking in the Sahel region.
Impact women quality of life and deaths reduction
› LPG is the most popular option in many countries particularly
in the Sahel region.
› Niger is promoting mineral coal as alternative to wood fuel
27

COUNTRY EDI RANK EDI value
Commercial
energy use per
capita index
Electrification
index
Electricity
consumption
index
Modern
fuels for
cooking
index
Togo 58 0,058 0,014 0,10 0,057 0,059
Benin 52 0,111 0,038 0,15 0,031 0,219
Côte d'Ivoire 47 0,142 0,037 0,41 0,060 0,065
Nigeria 46 0,144 0,059 0,44 0,065 0,008
Senegal 45 0,157 0,040 0,35 0,054 0,188
Ghana 43 0,195 0,054 0,56 0,098 0,073
South Africa 10 0,742 0,873 0,72 0,902 0,474
Libya 1 0,949 1,000 1,00 0,907 0,892
SITUATION OF MODERN FUELS FOR COOKING
The IEA Energy & Development Index (World Energy Outlook 2010) can be used
28

APPROACHES AND POLICIES
› Regional Policy for Energy Access:
› ECOWAS WHITE PAPER FOR A REGIONAL POLICY ON ENERGY
ACCESS IN RURAL AND PERI-URBAN AREAS (Jan. 2009)
1) Turning point in the regional co-operation
2) Inspiring model for the rest of sub-Saharan Africa
› National Policies :
› Based on the White Paper, many countries started the
development of policies and legislation to support energy
access
› The aim is to translate the regional policy objective into national
policies and actions
› GTZ Renewable Energies in West Africa Study provides
reference to national efforts: Benin, Burkina, Mali, Niger...
29

SUCCESSES IN ENERGY ACCESS
POLICY IMPLEMENTATION
› Some examples include:
› Senegal LPG project for fuel switching
› AREED Programme sponsored by UNEP that
provided seed-capital to rural energy enterprises
to promote LPG in Mali, Senegal and Ghana
› LPG promotion program in Côte d’Ivoire with
PETROCI using small and medium sized
enterprises as partners for distribution of LPG
› Such approaches should be more strengthened
through public and private partnerships
30

ACCESS / PILLAR 3: MOTIVE POWER (P.17)
› No real economic activity can be promoted without access to
mechanical or electrical motive power.
› Such power makes it possible to run, for example, water pumps
and mills. Experiments carried out show that the costs of fitting
a diesel motor and some key accessories is around 15,000$ for
a village
› For all of the ECOWAS countries, 100% of the villages with
more than 1000 habitants is expected to have access to motive
power by the year 2030.
› UNDP Multi-Functional Platform (MFP) program is one of the
most successful experience in some ECOWAS countries
(Senegal, Mali, Burkina Faso, Niger)
› Motive power is the area where a general assessment should
be conducted at the regional level for comparison purposes
31

4 – THE CHALLENGES AHEAD
32
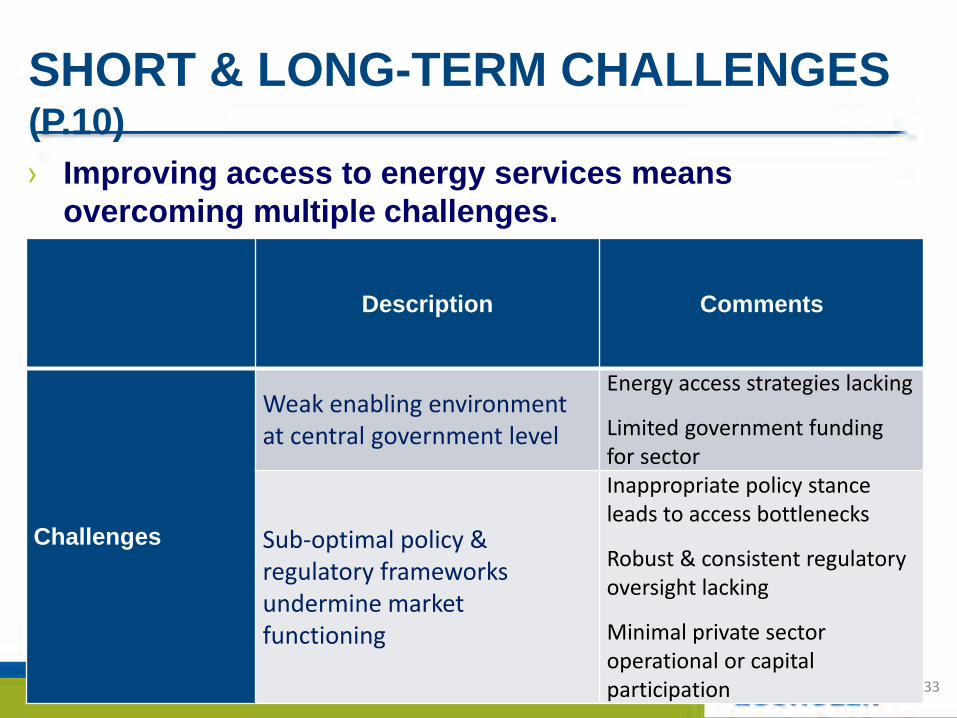
SHORT & LONG-TERM CHALLENGES (P.10)
› Improving access to energy services means
overcoming multiple challenges.
Description Comments
Challenges
Weak enabling environment at central government level
Energy access strategies lacking
Limited government funding for sector
Sub-optimal policy & regulatory frameworks undermine market functioning
Inappropriate policy stance leads to access bottlenecks
Robust & consistent regulatory oversight lacking
Minimal private sector operational or capital participation 33
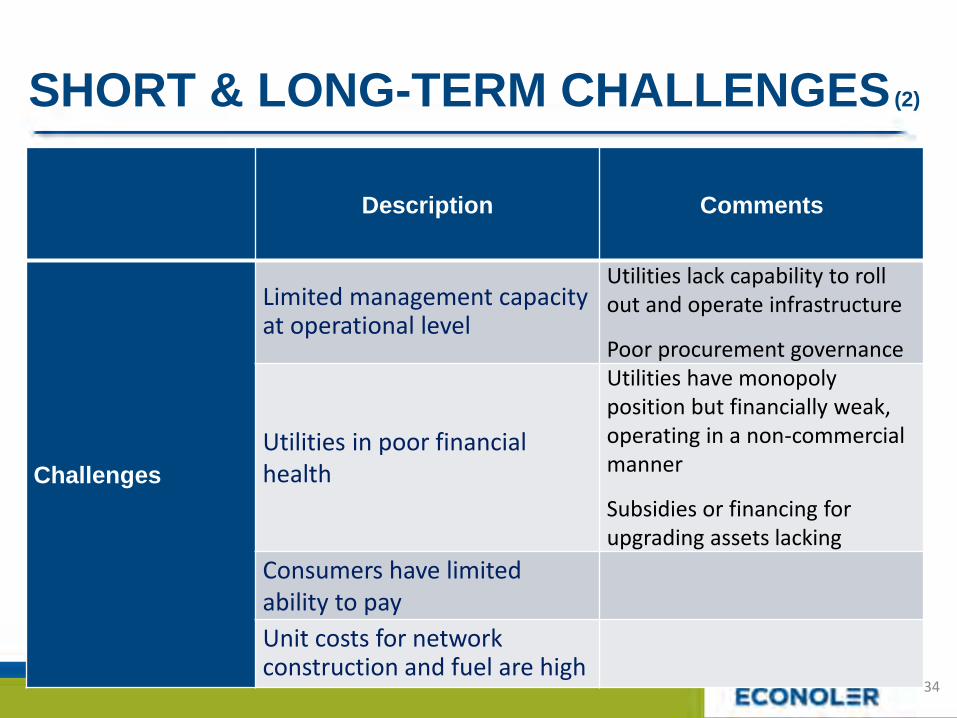
SHORT & LONG-TERM CHALLENGES (2)
Description Comments
Challenges
Limited management capacity at operational level
Utilities lack capability to roll out and operate infrastructure
Poor procurement governance
Utilities in poor financial health
Utilities have monopoly position but financially weak, operating in a non-commercial manner
Subsidies or financing for upgrading assets lacking
Consumers have limited ability to pay
Unit costs for network construction and fuel are high
34

ACCESS TO MODERN COOKING FUELS PRESENTS ADDITIONAL CHALLENGES
− Traditional biomass use is widespread • 80% of SSA depends on fuel-wood and charcoal for cooking and
water heating
− Traditional cooking stoves endanger health • Over 95% of households in SSA cook with biomass on open fires
or traditional inefficient stoves
• Smoke from cooking fires is leading cause of acute respiratory disease – a major killer
− Biomass is harvested unsustainably • Results in loss of forest cover and river silting
35

OPPORTUNITIES TO MEET
ECOWAS ENERGY ACCESS GOAL
1) POLICY LEVEL
2) TECHNOLOGY LEVEL
3) FINANCING LEVEL
36
37
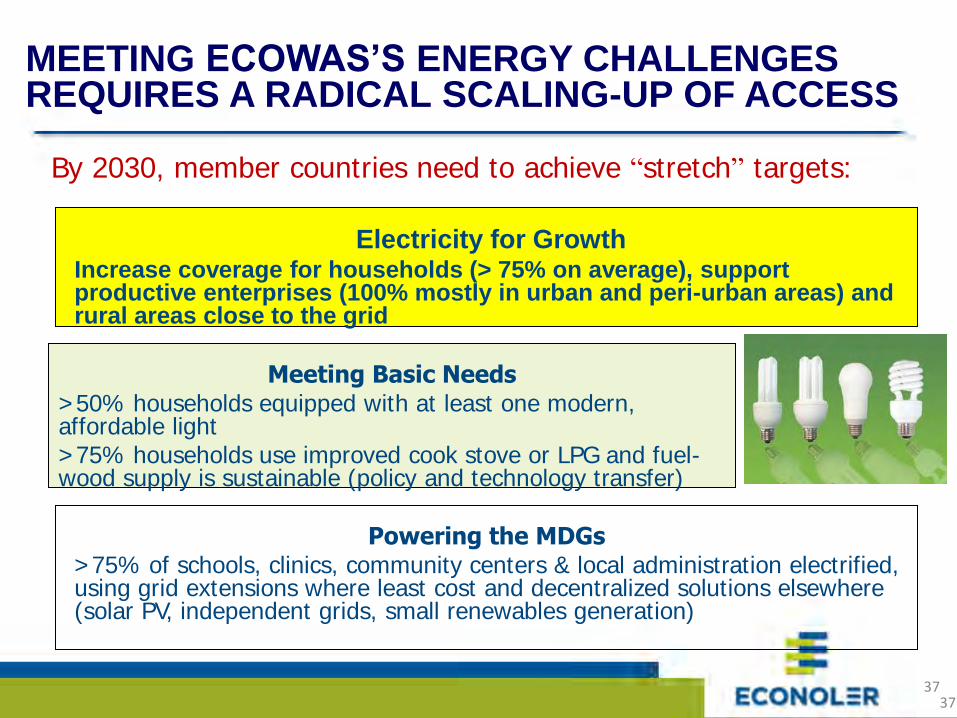
MEETING ECOWAS’S ENERGY CHALLENGES REQUIRES A RADICAL SCALING-UP OF ACCESS
Electricity for Growth Increase coverage for households (> 75% on average), support productive enterprises (100% mostly in urban and peri-urban areas) and rural areas close to the grid
Powering the MDGs >75% of schools, clinics, community centers & local administration electrified, using grid extensions where least cost and decentralized solutions elsewhere (solar PV, independent grids, small renewables generation)
Meeting Basic Needs >50% households equipped with at least one modern, affordable light >75% households use improved cook stove or LPG and fuel-wood supply is sustainable (policy and technology transfer)
By 2030, member countries need to achieve “stretch” targets:
37

ROLE OF RENEWABLE ENERGY
› ECREEE Renewable Energy Project Pipeline contains
almost 100 projects relating to Renewables,
particularly solar energy (PV) for off-grid and mini-
grids.
› But hydro and wind are also playing a critical role in
the region (Guinea; Gambia, Cape Verde, Ghana, etc.)
› The Global Environment Facility (GEF-4) has set a
Framework for Regional Program in the energy sector.
Some projects being developed are focusing on
Renewable energy (RE)
› RE for power on-grid, mini-grid & off-grid has a
potential for successful commercial development
38

RENEWABLE ENERGY TECHNOLOGY
(RET) OPTIONS FOR ECOWAS Energy Source
Present Near term Medium term
Long term
Electricity Grid or no Grid
Biomas-based
generation using gasifier coupled to internal combustion engines
Biomas-based generation using gasifier coupled to micro-turbines and integrated gasifier
Grid connected photovoltaic using gasifiers coupled to fuel cells
Fuel Wood, charcoal, dung, crop residue
NG, LPG, producer gas, biogas
Syngas, DME Biomass derived DME
Cogeneration In agro-industry
sector for heat
and power
Internal combustion engines, etc
Micro-turbines & integrated gasifiers
Fuel cells, fuel cell/turbine hybrid
39

RET OPTIONS FOR ECOWAS (2)
TASK
Energy Source Present Near term Medium term Long term
Cooking Woodstove Improved
woodstove
DME stoves,
NG and PG
Electric stoves,
catalytic burners
Lighting Oil/kerosene
lamps
Electric lights Florescent
lamps
Improved
florescent lamps
Motive power Human/
animal
powered
devices
Internal
combustion
engines, electric
motors
Bio-fueled
prime movers,
improved
motors
Fuel cells
Process heat Wood,
biomass
Electric furnaces,
NG, PG
Solar thermal
furnaces
Solar thermal
furnaces with
heat storage
40

ECOWAS REGIONAL CENTRE: AN
INSTRUMENT FOR SUPPORTING RE & EE PROMOTION
The ECOWAS Regional Centre for Renewable Energy and Energy Efficiency (ECREEE) could be considered a an asset for all the region to assist member countries in EE and RE Recently ECREEE set-up the ECOWAS Renewable Energy Facility (EREF) which aims at co-funding small and medium scale RE&EE projects in accordance with the ECOWAS White Papers on Energy Access.
41
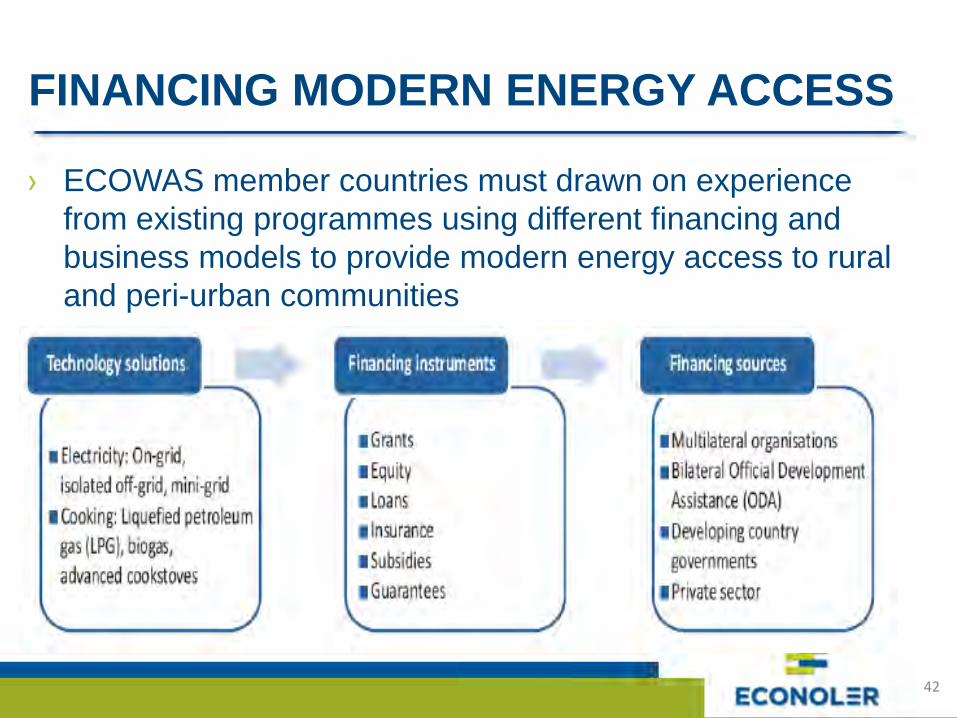
FINANCING MODERN ENERGY ACCESS
› ECOWAS member countries must drawn on experience
from existing programmes using different financing and
business models to provide modern energy access to rural
and peri-urban communities
42

Country Population
in 2010 (in
million)
Population
in 2030 (in
million)
Current
Electricity
Access Rate
(%)
Additional
Households that
would receive
Electricity
Between 2011-
2030
Investment per
annum between
2011-2030
Benin 8.8 13.9 24.8 2,307,772 126,927,471
Burkina Faso 16.5 26.0 14.6 4,294,520 236,198,613
Cape Verde 0.5 0.8 87% 7,113,748
Côte d'Ivoire 19.7 31.1 47.3 5,146,995 283,084,701
The Gambia 1.7 2.7 15 450,711 24,789,080
Guinea 10.0 15.7 15 2,602,883 143,158,580
Guinea-Bissau 1.5 2.4 15 395,123 21,731,740
Ghana 24.4 38.4 66.7 6,360,617 349,833,919
Liberia 4.0 6.3 n.a 1,041,541** 57,284,745
Mali 15.4 24.2 18 4,007,961 220,437,829
Niger 15.5 24.4 8 4,045,027 222,476,496
Nigeria 158.4 249.6 50.6 41,311,760 2,272,146,802
Senegal 12.4 19.6 42 3,242,323 178,327,786
Sierra Leone 5.9 9.2 15 1,530,068 84,153,739
Togo 6.0 9.5 22 1,571,859 86,452,259
ECOWAS 300.8 474.0 27.23 78,438,500 4,314,117,507
Investment requirement for 100 % electricity access in ECOWAS between 2011-30:
43

6 - CONCLUSION
44
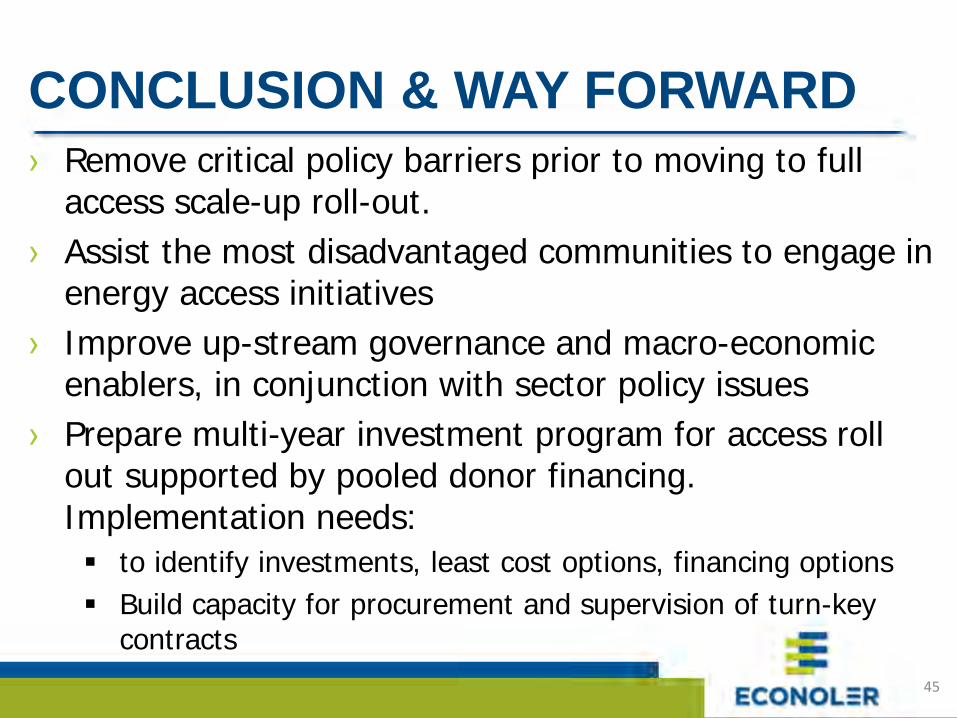
CONCLUSION & WAY FORWARD
› Remove critical policy barriers prior to moving to full access scale-up roll-out.
› Assist the most disadvantaged communities to engage in energy access initiatives
› Improve up-stream governance and macro-economic enablers, in conjunction with sector policy issues
› Prepare multi-year investment program for access roll out supported by pooled donor financing. Implementation needs:
to identify investments, least cost options, financing options
Build capacity for procurement and supervision of turn-key contracts
45

Questions?
46

INFORMATION ABOUT THE TEAM
› Dr M’Gbra N’Guessan (Email: [email protected])
› Dr Oyenike Adeyemo (Email: [email protected] )
› Mr Secou Sarr (Email: [email protected] )
47


![Rapport pays Comoros English Translation def.Vdochabitat3.org/wp-content/uploads/National-Reports-Comoros...HABITAT III COUNTRY-REPPORT : UNION OF COMOROS [Date]" I" UNION OF THE COMOROS](https://img.pdfslide.us/doc/110x75/5e6ea1e22954bd2e3e41bf15/rapport-pays-comoros-english-translation-def-habitat-iii-country-repport-.jpg)