Embed Size (px)
Citation preview
1
www.encana.com
The New Encana:the clear energy choice
EnerCom 2010 The Oil and Gas ConferenceExpanding Markets for Natural Gas
Wayne Geis |Vice President, Natural Gas Economy
Denver | August 25, 2010
www.encana.com
Future Oriented Information
In the interest of providing Encana Corporation (“Encana” or the “Company”) shareholders and potential investors with information regarding the Company, its subsidiaries, including management’s assessment of the Company’s future plans and operations, certain statements and graphs throughout this presentation contain “forward-looking statements” within the meaning of the United States Private Securities Litigation Reform Act of 1995 or “forward-looking information” within the meaning of applicable Canadian securities legislation. Forward-looking statements in this presentation include, but are not limited to, statements and tables with respect to: projection to doubling production per share over the next five years, including projected production from various resource plays in the U.S. and Canadian divisions; estimated drilling inventory and locations; projected 2010 exit rate production; expected 2010 supply costs; expected increase in North American gas supply and demand per day; expected long-term price of natural gas and years of supply; demand opportunities for natural gas in power generation and transportation; projected North American opportunities for natural gas; estimated reductions in emission with greater use of natural gas in transportation and power generation; estimated Canadian and U.S. fuel displacement potential; future Encana projects to support increase in demand for natural gas; and expected areas where Encana can expand gas demand North America.
Readers are cautioned not to place undue reliance on forward-looking statements, as there can be no assurance that the plans, intentions or expectations upon which they are based will occur. By their nature, forward-looking statements involve numerous assumptions, known and unknown risks and uncertainties, both general and specific, that contribute to the possibility that the predictions, forecasts, projections and other forward-looking statements will not occur, which may cause the company’s actual performance and financial results in future periods to differ materially from any estimates or projections of future performance or results expressed or implied by such forward-looking statements. These assumptions, risks and uncertainties include, among other things: volatility of and assumptions regarding oil and gas prices; assumptions based upon the company’s current guidance, as well as assumptions based upon 2010 Encana guidance; fluctuations in currency and interest rates; product supply and demand; market competition; risks inherent in the company’s and its subsidiaries’ marketing operations, including credit risks; imprecision of reserves estimates and estimates of recoverable quantities of natural gas and liquids from resource plays and other sources not currently classified as proved, probable or possible reserves or economic contingent resources; marketing margins; potential disruption or unexpected technical difficulties in developing new facilities; unexpected cost increases or technical difficulties in constructing or modifying processing facilities; risks associated with technology; the company’s ability to replace and expand gas reserves; its ability to generate sufficient cash flow from operations to meet its current and future obligations; its ability to access external sources of debt and equity capital; the timing and the costs of well and pipeline construction; the company’s ability to secure adequate product transportation; changes in royalty, tax, environmental, greenhouse gas, carbon, accounting and other laws or regulations or the interpretations of such laws or regulations; political and economic conditions in the countries in which the company operates; terrorist threats; risks associated with existing and potential future lawsuits and regulatory actions made against the company; and other risks and uncertainties described from time to time in the reports and filings made with securities regulatory authorities by Encana. Although Encana believes that the expectations represented by such forward-looking statements are reasonable, there can be no assurance that such expectations will prove to be correct. Readers are cautioned that the foregoing list of important factors is not exhaustive. Forward-looking statements with respect to anticipated production, reserves and production growth, including over the next five years, are based upon numerous facts and assumptions which are discussed in further detail in this presentation, including a projected capital program averaging approximately $6 billion per year from 2011 to 2014, achieving an average rate of approximately 2,500 net wells per year from 2011 to 2014, Encana’s current net drilling location inventory, natural gas price expectations over the next few years, production expectations made in light of advancements in horizontal drilling, multi-stage fracture stimulation and multi-well pad drilling, the current and expected productive characteristics of various existing and emerging resource plays, Encana’s estimates of proved, probable and possible reserves and economic contingent resources, expectations for rates of return which may be available at various prices for natural gas and current and expected cost trends. In addition, assumptions relating to such forward-looking statements generally include Encana’s current expectations and projections made in light of, and generally consistent with, its historical experience and its perception of historical trends, including the conversion of resources into proved reserves and production as well as expectations regarding rates of advancement and innovation, generally consistent with and informed by its past experience, all of which are subject to the risk factors identified elsewhere in this presentation.
Forward-looking information respecting anticipated 2010 cash flow for Encana is based upon achieving average production of oil and gas for 2010 approximately 3.365 Bcfe/d, commodity prices for natural gas of NYMEX $5.00/Mcf, crude oil (WTO) $75 for commodity prices and an estimated U.S./Canadian dollar foreign exchange rate of $0.94, net divestitures of $0.0 to $1.0 billion, and an average number of outstanding shares for Encana of approximately 740 million. Furthermore, the forward-looking statements contained in this presentation are made as of the date of this presentation, and, except as required by law, Encana does not undertake any obligation to update publicly or to revise any of the included forward-looking statements, whether as a result of new information, future events or otherwise. The forward-looking statements contained in this presentation are expressly qualified by this cautionary statement.
2
www.encana.com
Advisory Regarding Reserves Data & Other Oil & Gas InformationDisclosure Protocols
Encana's disclosure of reserves data and other oil and gas information is made in reliance on an exemption granted to Encana by Canadian securities regulatory authorities which permits it to provide certain of such disclosure in accordance with the relevant legal requirements of the U.S. Securities and Exchange Commission (the "SEC"). Some of the information provided by Encana may differ from the corresponding information prepared in accordance with Canadian disclosure standards under National Instrument 51-101 (NI 51-101). Information about the differences between the U.S. requirements and the NI 51- 101 requirements is set forth under the heading "Note Regarding Reserves Data and Other Oil and Gas Information" in Encana's Annual Information Form dated February 18, 2010. The reserves numbers contained in these presentations represent estimates of Encana's reserves prepared using SEC definitions and standards, applying forecast prices. Encana has used Henry Hub forecast prices of $5.50 per MMbtu for 2010 and $6.50 per MMbtu for 2011 and beyond.The estimates of economic contingent resources contained in these presentations are based on definitions contained in the Canadian Oil and Gas Evaluation Handbook. Contingent resources do not constitute, and should not be confused with, reserves. Contingent resources are defined as those quantities of petroleum estimated, on a given date, to be potentially recoverable from known accumulations using established technology or technology under development, but which are not currently considered to be commercially recoverable due to one or more contingencies. Economic contingent resources are those contingent resources that are currently economically recoverable. In examining economic viability, the same fiscal conditions have been applied as in the estimation of reserves. There is a range of uncertainty of estimated recoverable volumes. A low estimate is considered to be a conservative estimate of the quantity that will actually be recovered. It is likely that the actual remaining quantities recovered will exceed the low estimate, which under probabilistic methodology reflects a 90% confidence level. A best estimate is considered to be a realistic estimate of the quantity that will actually be recovered. It is equally likely that the actual remaining quantities recovered will be greater or less than the best estimate, which under probabilistic methodology reflects a 50% confidence level. A high estimate is considered to be an optimistic estimate. It is unlikely that the actual remaining quantities recovered will exceed the high estimate, which under probabilistic methodology reflects a 10% confidence level.There is no certainty that it will be economically viable or technically feasible to produce any portion of the volumes currently classified as economic contingent resources. The primary contingencies which currently prevent the classification of Encana's disclosed economic contingent resources as reserves are the lack of a reasonable expectation that all internal and external approvals will be forthcoming and the lack of a documented intent to develop the resources within a reasonable time frame.The estimates of various classes of reserves (proved, probable, possible) and of contingent resources (low, best, high) in these presentations represent arithmetic sums of multiple estimates of such classes for different properties, which statistical principles indicate may be misleading as to volumes that may actually be recovered. Readers should give attention to the estimates of individual classes of reserves and contingent resources and appreciate the differing probabilities of recovery associated with each class.In these presentations, certain crude oil and NGLs volumes have been converted to cubic feet equivalent (cfe) on the basis of one barrel (bbl) to six thousand cubic feet (Mcf). Cfe may be misleading, particularly if used in isolation. A conversion ratio of one bbl to six Mcf is based on an energy equivalency conversion method primarily applicable at the burner tip and does not represent value equivalency at the well head.Encana uses the terms resource play and estimated ultimate recovery, total petroleum initially-in-place, original gas-in-place, natural gas-in-place, and crude oil-in-place. Resource play is a term used by Encana to describe an accumulation of hydrocarbons known to exist over a large areal expanse and/or thick vertical section, which when compared to a conventional play, typically has a lower geological and/or commercial development risk and lower average decline rate. Total petroleum initially-in-place (“PIIP”) is defined by the Society of Petroleum Engineers - Petroleum Resources Management System (“SPE-PRMS”) as that quantity of petroleum that is estimated to exist originally in naturally occurring accumulations. It includes that quantity of petroleum that is estimated, as of a given date, to be contained in known accumulations prior to production plus those estimated quantities in accumulations yet to be discovered (equivalent to “total resources”). Original gas-in-place (“OGIP”), natural gas-in-place (“NGIP”) and crude oil-in-place (“COIP”) are defined in the same manner, with the substitution of “original”, “natural gas” and “crude oil” where appropriate for the word “petroleum”. As used by Encana, estimated ultimate recovery (“EUR”) has the meaning set out jointly by the Society of Petroleum Engineers and World Petroleum Congress in the year 2000, being those quantities of petroleum which are estimated, on a given date, to be potentially recoverable from an accumulation, plus those quantities already produced therefrom. In these presentations, Encana has provided information with respect to certain of its Key Resource Plays and emerging opportunities which is “analogous information” as defined in NI 51-101. This analogous information includes estimates of PIIP, OGIP, NGIP or COIP and/or EUR, all as defined in the Canadian Oil & Gas Evaluation Handbook (“COGEH”) or by the SPE-PRMS, and/or production type curves. This analogous information is presented on a basin, sub-basin or area basis utilizing data derived from Encana's internal sources, as well as from a variety of publicly available information sources which are predominantly independent in nature. Some of this data may not have been prepared by qualified reserves evaluators or auditors and the preparation of any estimates may not be in strict accordance with COGEH. Regardless, estimates by engineering and geo-technical practitioners may vary and the differences may be significant. Encana believes that the provision of this analogous information is relevant to Encana's oil and gas activities, given its acreage position and operations (either ongoing or planned) in the areas in question.Finding, development and acquisition cost is calculated by dividing total capital invested in finding, development and acquisition activities by additions to proved reserves, before divestitures, which is the sum of revisions, extensions, discoveries and acquisitions. Proved reserves added in 2009 included both developed and undeveloped quantities. Encana’s finding and development costs per Mcfe for (i) its most recent financial year (ended December 31, 2009) was $1.62; (ii) its second most recent financial year (ended December 31, 2008) was $2.50; and (iii) the average of its three most recent financial years was $1.92. For certain prospects, the Company calculates and discloses a full cycle F & D cost, which is defined to be the estimated total capital investment required over the full economic life of the prospect divided by the estimated ultimate recovery (EUR) of the prospect.For convenience, references in these presentations to “Encana”, the “Company”, “we”, “us” and “our” may, where applicable, refer only to or include any relevant direct and indirect subsidiary corporations and partnerships (“Subsidiaries”) of Encana Corporation, and the assets, activities and initiatives of such Subsidiaries.All information included in these presentations is shown on aU.S.dollar, after royalties basis unless otherwise noted. Sales forecasts reflect the mid-point of current public guidance on an after royalties basis.
www.encana.com
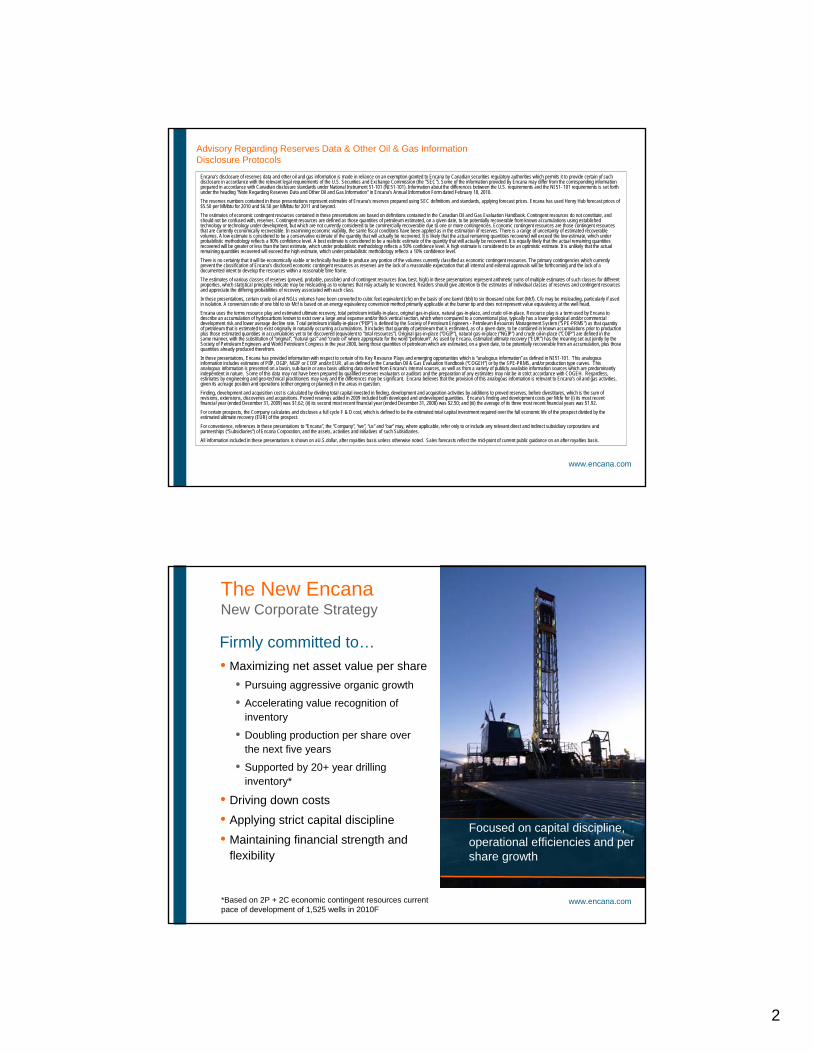
• Maximizing net asset value per share• Pursuing aggressive organic growth
• Accelerating value recognition of inventory
• Doubling production per share over the next five years
• Supported by 20+ year drilling inventory*
• Driving down costs• Applying strict capital discipline• Maintaining financial strength and
flexibility
The New EncanaNew Corporate Strategy
Firmly committed to…
Focused on capital discipline, operational efficiencies and per share growth
*Based on 2P + 2C economic contingent resources current pace of development of 1,525 wells in 2010F
3
www.encana.com
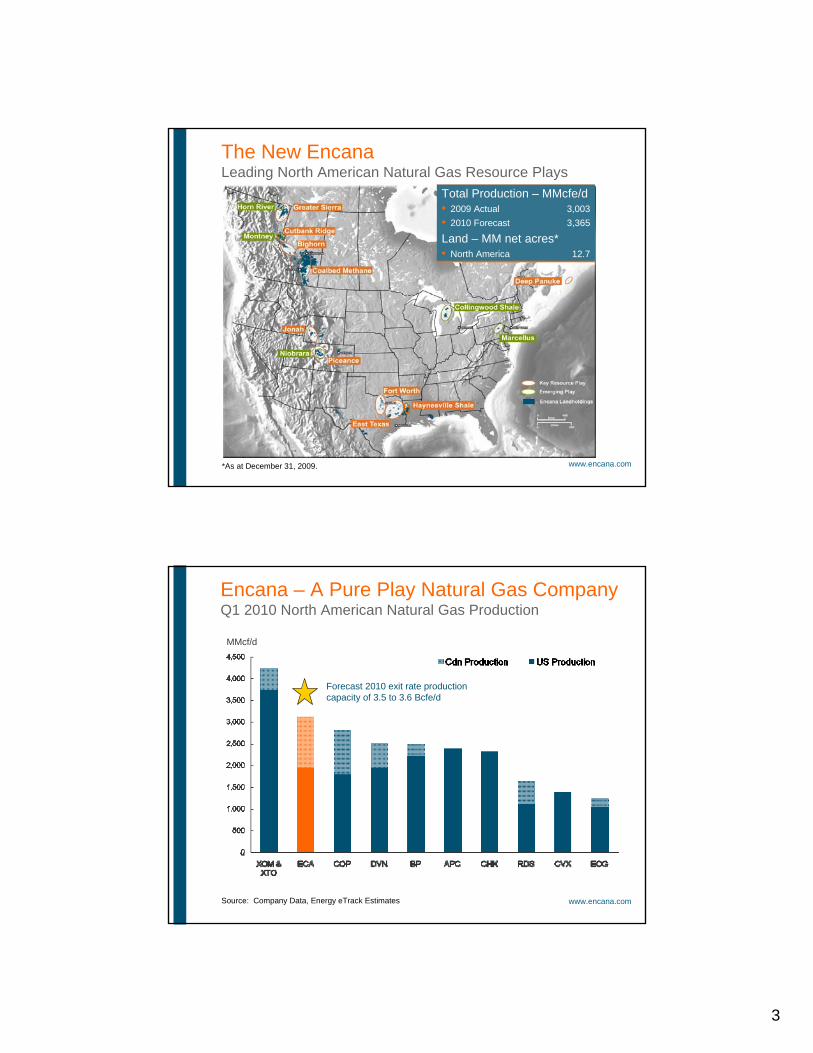
The New EncanaLeading North American Natural Gas Resource Plays
*As at December 31, 2009.
Total Production – MMcfe/d• 2009 Actual 3,003• 2010 Forecast 3,365
Land – MM net acres*• North America 12.7
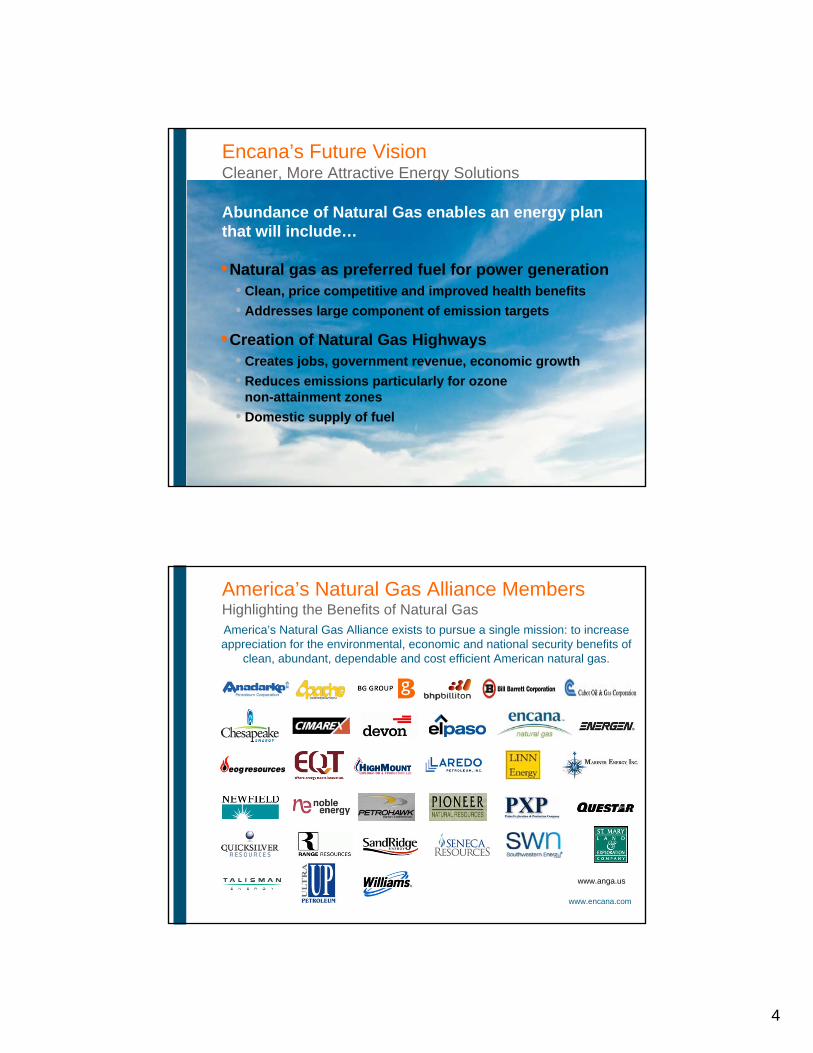
www.encana.comSource: Company Data, Energy eTrack Estimates
MMcf/d
Encana – A Pure Play Natural Gas CompanyQ1 2010 North American Natural Gas Production
Forecast 2010 exit rate production capacity of 3.5 to 3.6 Bcfe/d
4
www.encana.com
Encana’s Future VisionCleaner, More Attractive Energy Solutions
•Natural gas as preferred fuel for power generation• Clean, price competitive and improved health benefits• Addresses large component of emission targets
•Creation of Natural Gas Highways• Creates jobs, government revenue, economic growth• Reduces emissions particularly for ozone
non-attainment zones• Domestic supply of fuel
Abundance of Natural Gas enables an energy plan that will include…
www.encana.com
America’s Natural Gas Alliance MembersHighlighting the Benefits of Natural GasAmerica’s Natural Gas Alliance exists to pursue a single mission: to increase appreciation for the environmental, economic and national security benefits of
clean, abundant, dependable and cost efficient American natural gas.
www.anga.us
5
The New Encana:the clear energy choice
North American Natural Gas Supply
www.encana.com
Vast Energy Resource in North America Technology Continues to Unlock Shale Gas
*Source: EIA, CSUG, IHS, Encana
North American Natural Gas BasinsAbundant and Widespread
0
20
40
60
80
100
120
PGC/NEB20 0 6
EIA/NEB2 0 07
ICF2 00 8
NAV/NEB20 08
EIA/NEB2 00 9
PGC/NEB20 0 9
0
500
1,000
1,500
2,000
2,500
3,000Resource
Reserves
• ~2,500 Tcf of Total Resource• ~ 100 Year Supply at 70 Bcf/d• ~70 Year Supply at 100 Bcf/d
North America Resource Estimates
Years of Supply Tcf
Target New Demand Market 25 Bcf/d or 30% Increase
6
www.encana.com
Gra
nite
Was
h (H
oriz
onta
l)
Hayn
esvi
lle
Mar
cellu
s
Pine
dale
(Cre
st)
Faye
ttevi
lle (2
.6 B
cf)
Horn
Riv
er
Woo
dfor
d (A
nada
rko)
Barn
ett (
Tier
1)
Huro
n Sh
ale
Pine
dale
(Fla
nk)
War
wic
k (W
. Tex
as O
verth
rust
)
Mon
tney
(8 s
tage
frac
)
Pice
nace
(Val
ley-
Core
)
Nora
(CBM
)
Faye
ttevi
lle (2
.2 B
cf)
Uint
a (S
hallo
w)
Eagl
efor
d
Jona
h
Pow
der R
iver
(CBM
)
Albe
rta S
hallo
w G
as
Hors
esho
e Ca
nyon
(CBM
)
Rato
n (C
BM)
Woo
dfor
d (A
rkom
a)
Mon
tney
(4 s
tage
frac
)
Wat
tenb
erg
(Cor
e)
Albe
rta D
eep
Basi
n
Jean
Mar
ie (T
ight
Gas
)
Barn
ett (
Tier
2)
Pice
ance
(Hig
hlan
ds)
Man
nvill
e (C
BM)
Nbar
nett
(Tie
r 3)
$0.00
$1.00
$2.00
$3.00
$4.00
$5.00
$6.00
$7.00
$8.00
$9.00
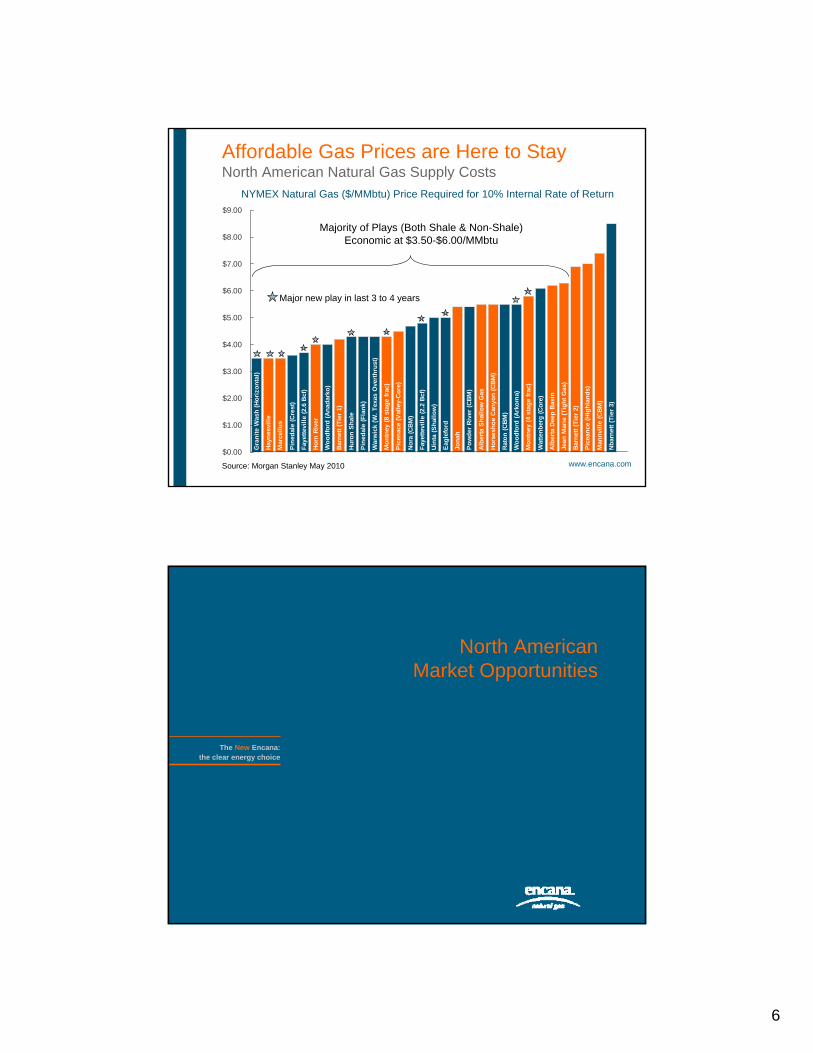
Affordable Gas Prices are Here to StayNorth American Natural Gas Supply Costs
Source: Morgan Stanley May 2010
NYMEX Natural Gas ($/MMbtu) Price Required for 10% Internal Rate of Return
Majority of Plays (Both Shale & Non-Shale) Economic at $3.50-$6.00/MMbtu
Major new play in last 3 to 4 years
The New Encana:the clear energy choice
North American Market Opportunities
7
www.encana.com
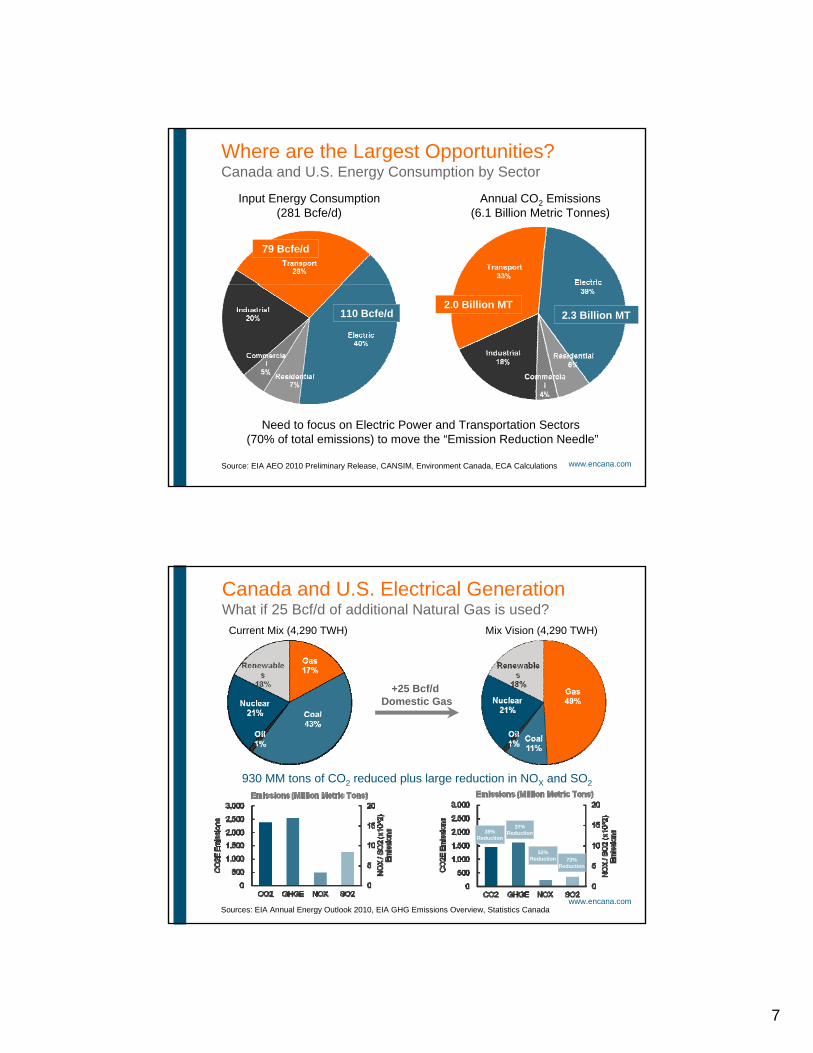
Where are the Largest Opportunities?Canada and U.S. Energy Consumption by Sector
Input Energy Consumption(281 Bcfe/d)
Source: EIA AEO 2010 Preliminary Release, CANSIM, Environment Canada, ECA Calculations
Annual CO2 Emissions(6.1 Billion Metric Tonnes)
Need to focus on Electric Power and Transportation Sectors (70% of total emissions) to move the “Emission Reduction Needle”
79 Bcfe/d
110 Bcfe/d2.0 Billion MT
2.3 Billion MT
www.encana.comSources: EIA Annual Energy Outlook 2010, EIA GHG Emissions Overview, Statistics Canada
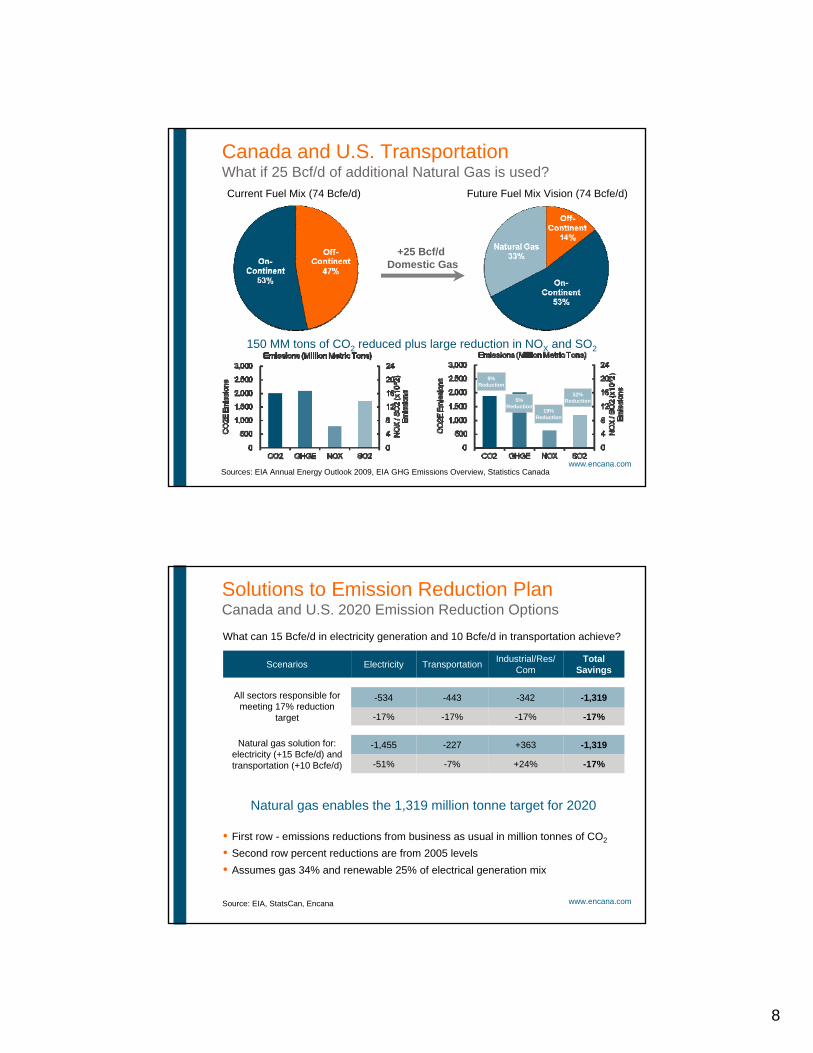
+25 Bcf/d Domestic Gas
Current Mix (4,290 TWH) Mix Vision (4,290 TWH)
39% Reduction
37% Reduction
52% Reduction 73%
Reduction
Canada and U.S. Electrical GenerationWhat if 25 Bcf/d of additional Natural Gas is used?
930 MM tons of CO2 reduced plus large reduction in NOX and SO2
8
www.encana.comSources: EIA Annual Energy Outlook 2009, EIA GHG Emissions Overview, Statistics Canada
+25 Bcf/d Domestic Gas
Current Fuel Mix (74 Bcfe/d) Future Fuel Mix Vision (74 Bcfe/d)
8% Reduction
5% Reduction
19% Reduction
32% Reduction
150 MM tons of CO2 reduced plus large reduction in NOX and SO2
Canada and U.S. TransportationWhat if 25 Bcf/d of additional Natural Gas is used?
www.encana.com
Solutions to Emission Reduction PlanCanada and U.S. 2020 Emission Reduction Options
Scenarios Electricity Transportation Industrial/Res/Com
Total Savings
All sectors responsible for meeting 17% reduction
target
-534 -443 -342 -1,319
-17% -17% -17% -17%
Natural gas solution for: electricity (+15 Bcfe/d) and transportation (+10 Bcfe/d)
-1,455 -227 +363 -1,319
-51% -7% +24% -17%
Natural gas enables the 1,319 million tonne target for 2020
• First row - emissions reductions from business as usual in million tonnes of CO2
• Second row percent reductions are from 2005 levels• Assumes gas 34% and renewable 25% of electrical generation mix
Source: EIA, StatsCan, Encana
What can 15 Bcfe/d in electricity generation and 10 Bcfe/d in transportation achieve?
9
The New Encana:the clear energy choice
North American Natural Gas for Transportation
www.encana.com
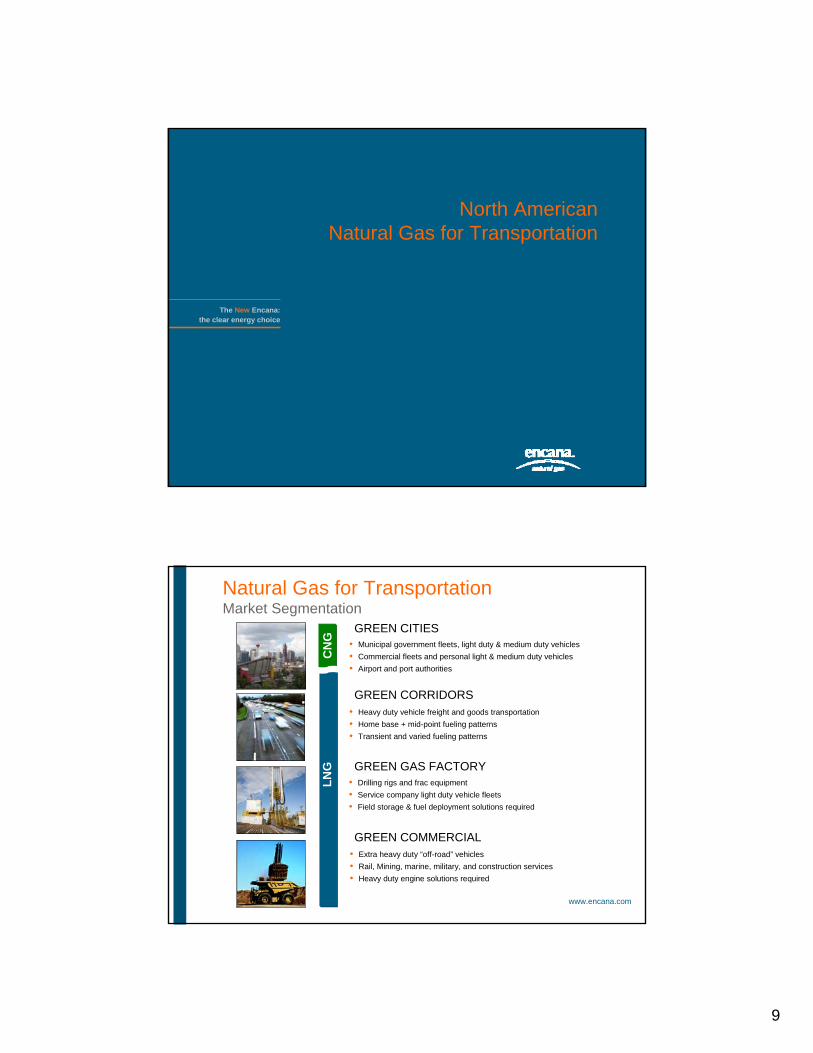
Natural Gas for Transportation Market Segmentation
GREEN CITIES
GREEN CORRIDORS
GREEN GAS FACTORY
GREEN COMMERCIAL
CN
GLN
G
• Municipal government fleets, light duty & medium duty vehicles• Commercial fleets and personal light & medium duty vehicles• Airport and port authorities
• Heavy duty vehicle freight and goods transportation• Home base + mid-point fueling patterns• Transient and varied fueling patterns
• Drilling rigs and frac equipment• Service company light duty vehicle fleets• Field storage & fuel deployment solutions required
• Extra heavy duty “off-road” vehicles• Rail, Mining, marine, military, and construction services• Heavy duty engine solutions required
10
www.encana.com
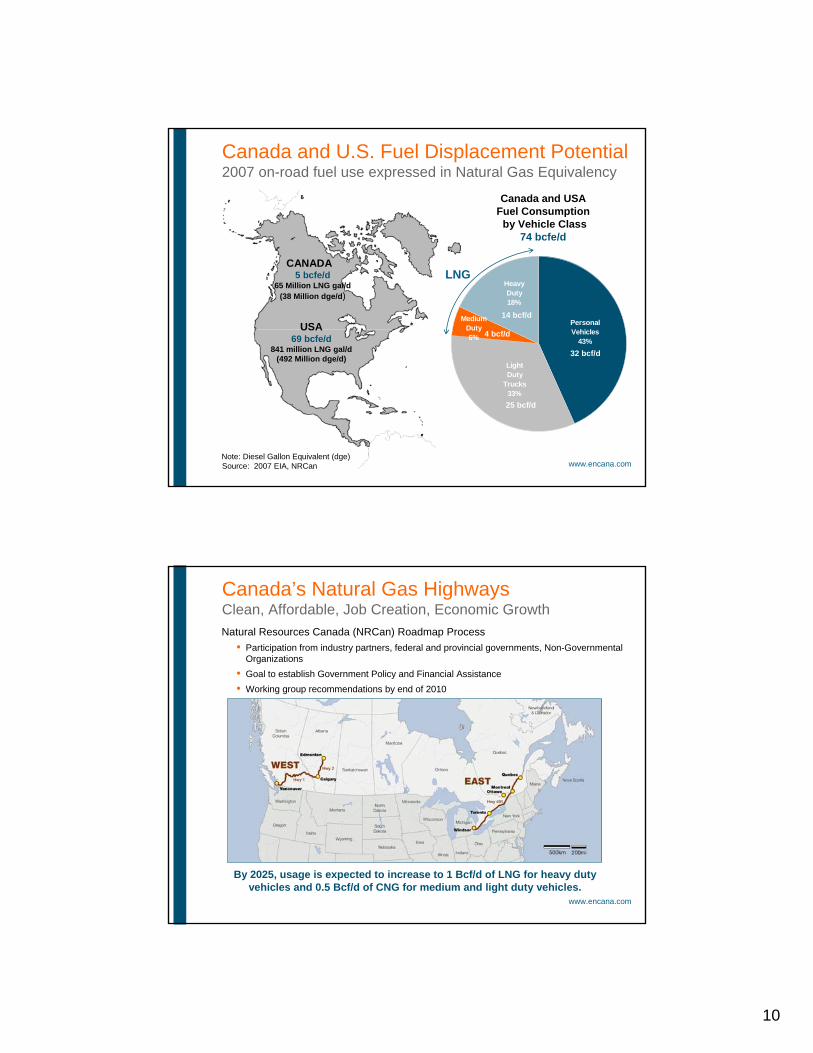
Canada and U.S. Fuel Displacement Potential2007 on-road fuel use expressed in Natural Gas Equivalency
5 bcfe/d65 Million LNG gal/d
(38 Million dge/d)
69 bcfe/d841 million LNG gal/d
(492 Million dge/d)Light Duty
Trucks33%
Medium Duty6%
Personal Vehicles
43%
Heavy Duty18%
CANADA
USA
Canada and USAFuel Consumption
by Vehicle Class74 bcfe/d
14 bcf/d
4 bcf/d
25 bcf/d
32 bcf/d
LNG
Source: 2007 EIA, NRCanNote: Diesel Gallon Equivalent (dge)
www.encana.com
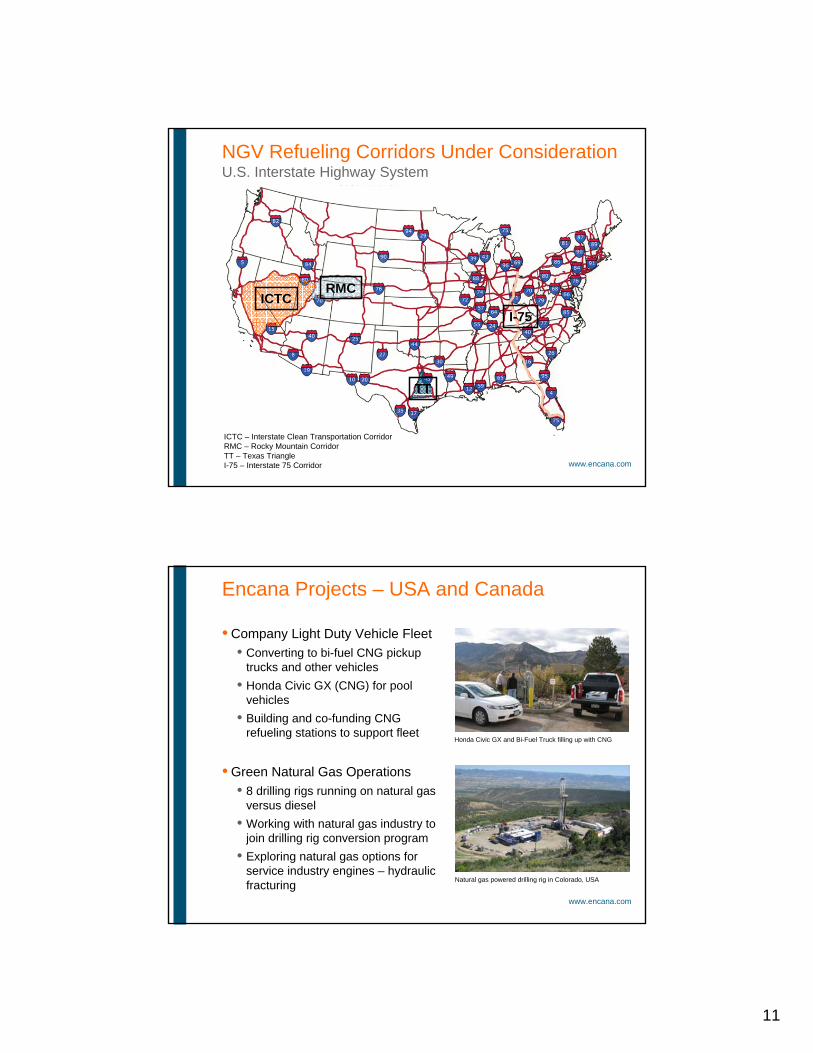
Canada’s Natural Gas HighwaysClean, Affordable, Job Creation, Economic GrowthNatural Resources Canada (NRCan) Roadmap Process
• Participation from industry partners, federal and provincial governments, Non-Governmental Organizations
• Goal to establish Government Policy and Financial Assistance• Working group recommendations by end of 2010
By 2025, usage is expected to increase to 1 Bcf/d of LNG for heavy duty vehicles and 0.5 Bcf/d of CNG for medium and light duty vehicles.
11
www.encana.com
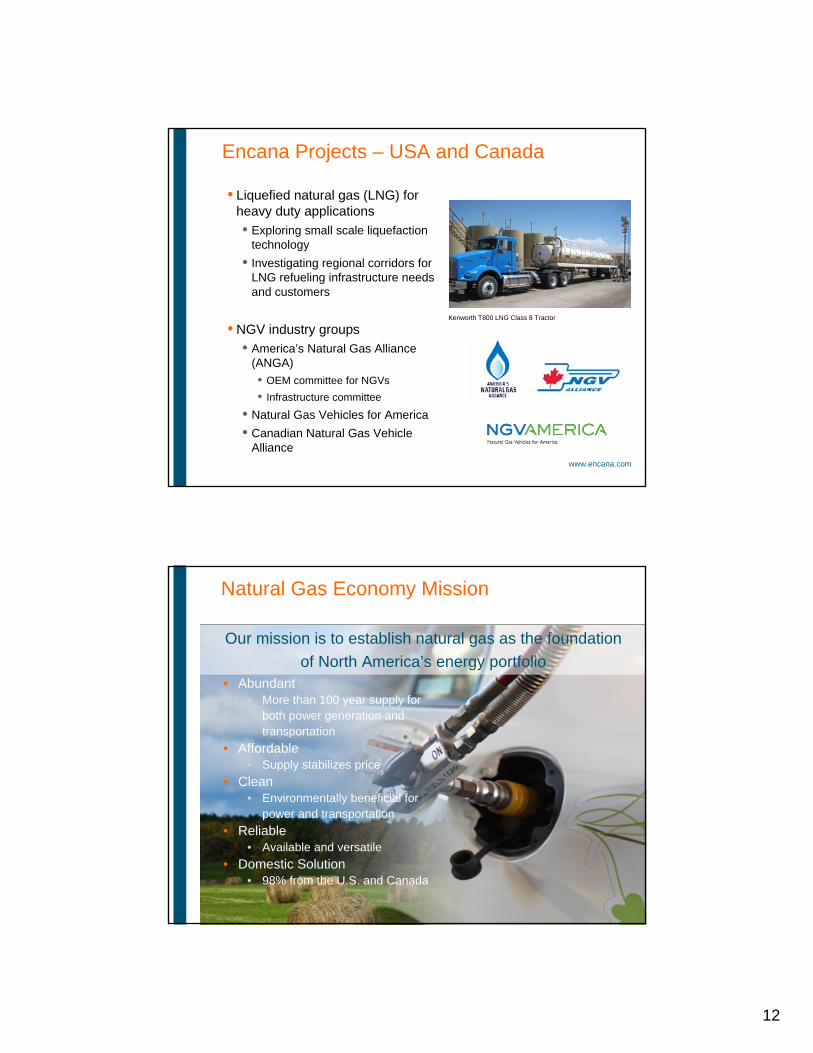
ICTCRMC
TT
I-75
ICTC – Interstate Clean Transportation CorridorRMC – Rocky Mountain CorridorTT – Texas TriangleI-75 – Interstate 75 Corridor
NGV Refueling Corridors Under ConsiderationU.S. Interstate Highway System
www.encana.com
Encana Projects – USA and Canada
• Company Light Duty Vehicle Fleet• Converting to bi-fuel CNG pickup
trucks and other vehicles• Honda Civic GX (CNG) for pool
vehicles• Building and co-funding CNG
refueling stations to support fleet
• Green Natural Gas Operations• 8 drilling rigs running on natural gas
versus diesel• Working with natural gas industry to
join drilling rig conversion program• Exploring natural gas options for
service industry engines – hydraulic fracturing Natural gas powered drilling rig in Colorado, USA
Honda Civic GX and Bi-Fuel Truck filling up with CNG
12
www.encana.com
Encana Projects – USA and Canada
• Liquefied natural gas (LNG) for heavy duty applications• Exploring small scale liquefaction
technology• Investigating regional corridors for
LNG refueling infrastructure needs and customers
• NGV industry groups• America’s Natural Gas Alliance
(ANGA)• OEM committee for NGVs• Infrastructure committee
• Natural Gas Vehicles for America• Canadian Natural Gas Vehicle
Alliance
Kenworth T800 LNG Class 8 Tractor
www.encana.com
Natural Gas Economy Mission
• Abundant• More than 100 year supply for
both power generation and transportation
• Affordable• Supply stabilizes price
• Clean• Environmentally beneficial for
power and transportation• Reliable
• Available and versatile• Domestic Solution
• 98% from the U.S. and Canada
Our mission is to establish natural gas as the foundation of North America’s energy portfolio
13
The New Encana:the clear energy choice
Investor Relations Contacts
Ryder McRitchie | Vice-President, Investor Relations403.645.2007 | [email protected]
Lorna Klose | Manager, Investor Relations403.645.6977 | [email protected]


![New Page 1 [api.ning.com]api.ning.com/files/w9JIhnUgjg-Lf0kSkTaGPVx7pAjEthi... · Scheduled Castes, Scheduled Tribes, Other Backward Classes (Central List), Persons with Disabilities,](https://img.pdfslide.us/doc/110x75/5e41988f49acf2078b11c6ac/new-page-1-apiningcomapiningcomfilesw9jihnugjg-lf0ksktagpvx7pajethi.jpg)