Embed Size (px)
Citation preview
#EndUrbanPoverty
@USCPriceCSI
@BedrosianCenter
2
From War to Hope: Reinvigorating America’s Efforts to End Urban Poverty

50-year Poverty Trends
3
15%
46.5 MM

Source: U.S. Census Bureau | Social, Economic, and Housing Statistics Division: Poverty | Last Revised: January 28, 2014
2013 Poverty Thresholds
4

% in Poverty by Age
5
21.8%
13.7%
9.1%

22%
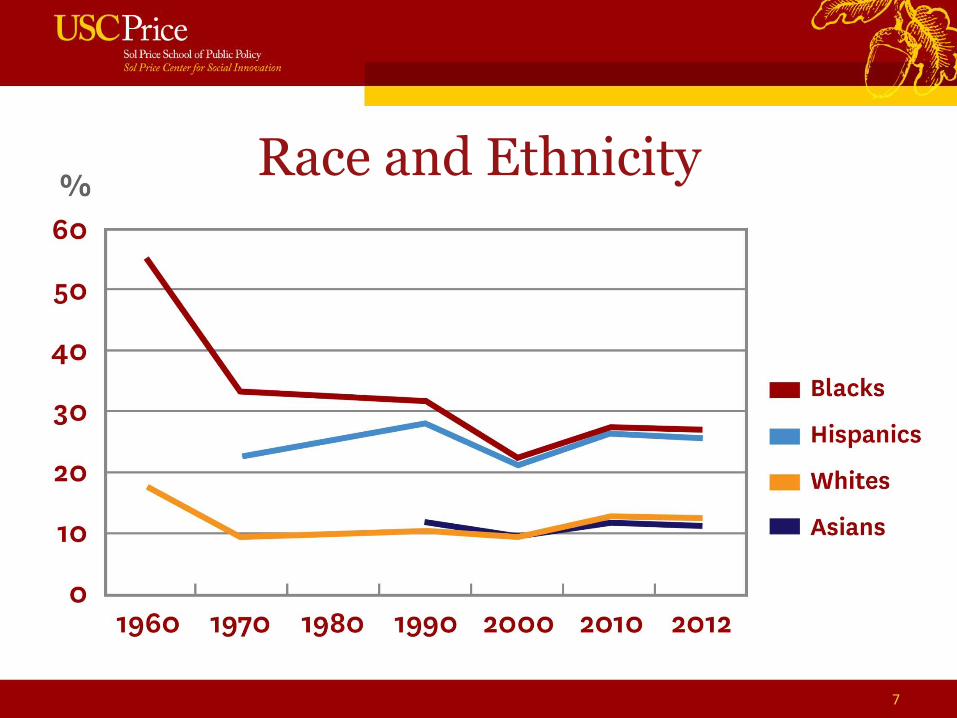
Race and Ethnicity
7

Race and Ethnicity
8
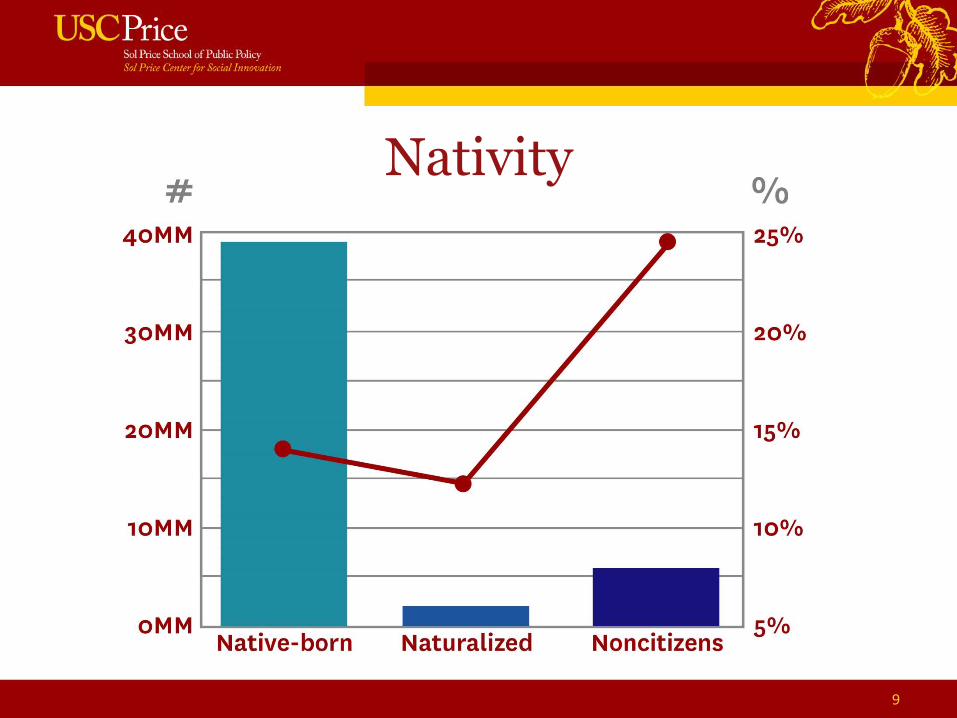
Nativity
9

Poverty 2000 to 2012
10
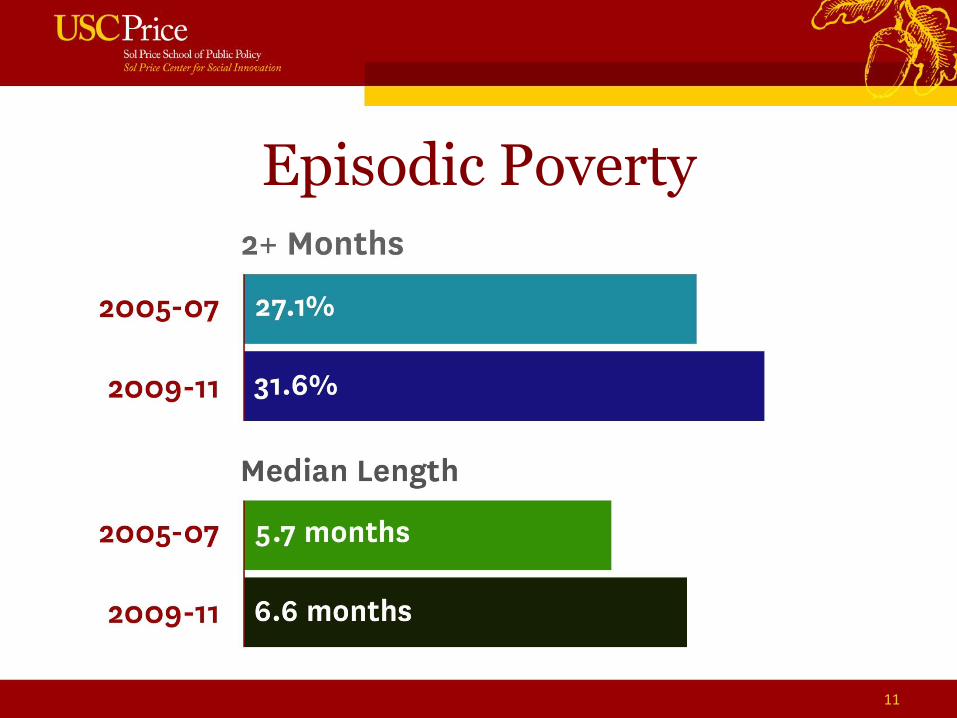
Episodic Poverty
11

Poverty by Region
12
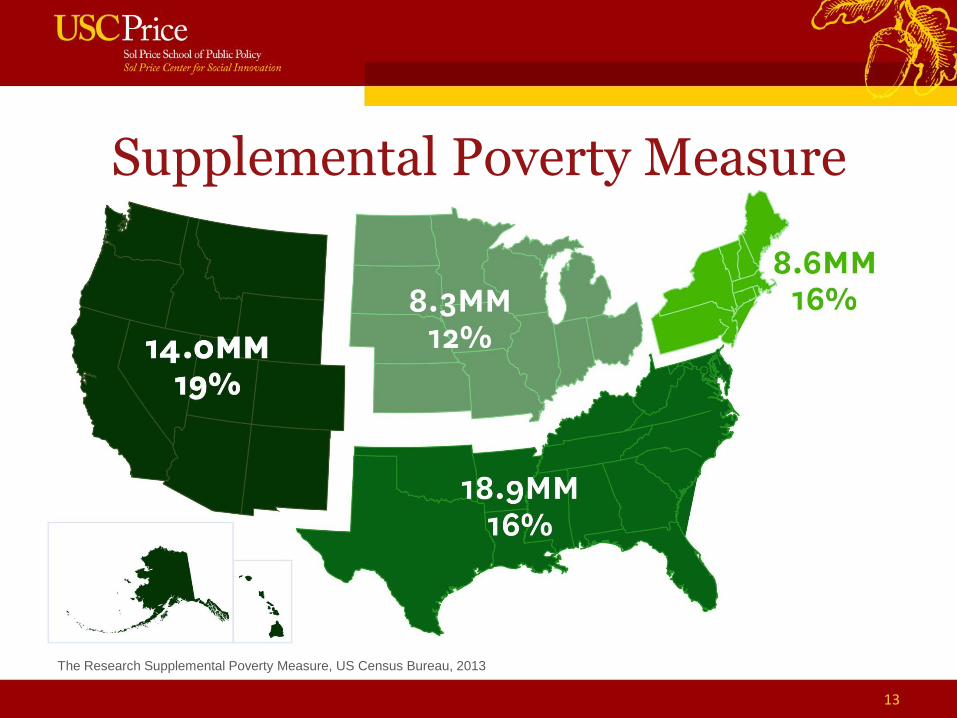
The Research Supplemental Poverty Measure, US Census Bureau, 2013
Supplemental Poverty Measure
13

Supplemental Poverty Measure
The Research Supplemental Poverty Measure: 2012, US Census Bureau, 2013 & The California Poverty Measure: A New Look at the Social Safety Net, PPIC 2013
14
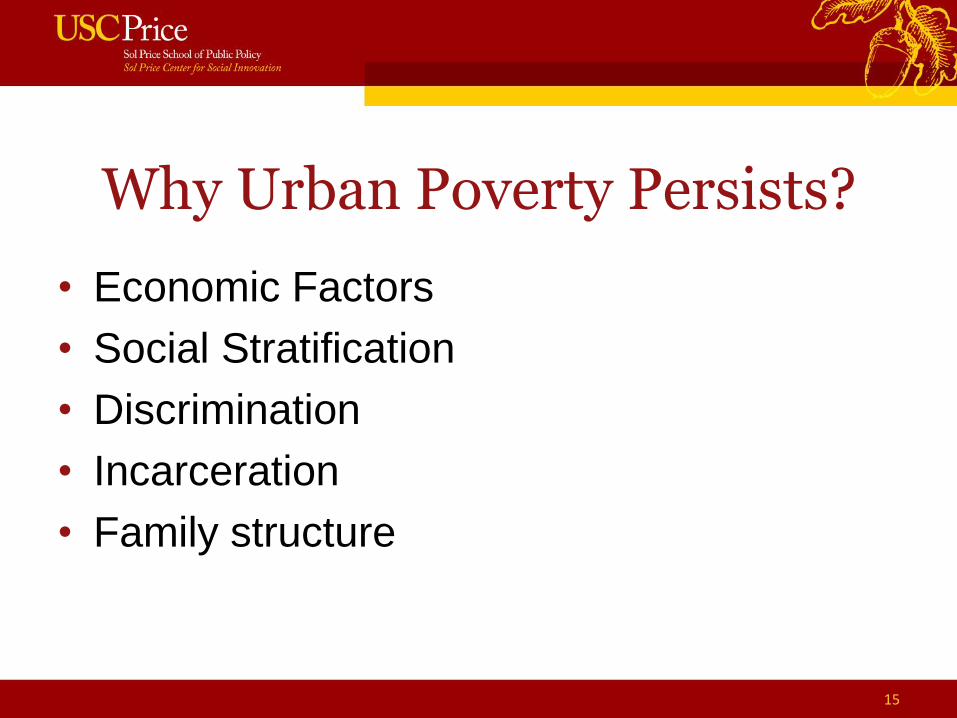
Why Urban Poverty Persists?
• Economic Factors
• Social Stratification
• Discrimination
• Incarceration
• Family structure
15

16

Source: Census Bureau
17

Employment After Recession
18


50% live in
concentrated or
extreme poverty
Population in extreme poverty
1/3

Concentrated Poverty
• Magnifies disadvantage
• Neighborhood effects persist into
adulthood
• Children inherit disadvantage


Discrimination
• Education
• Employment
• Housing
• Sentencing

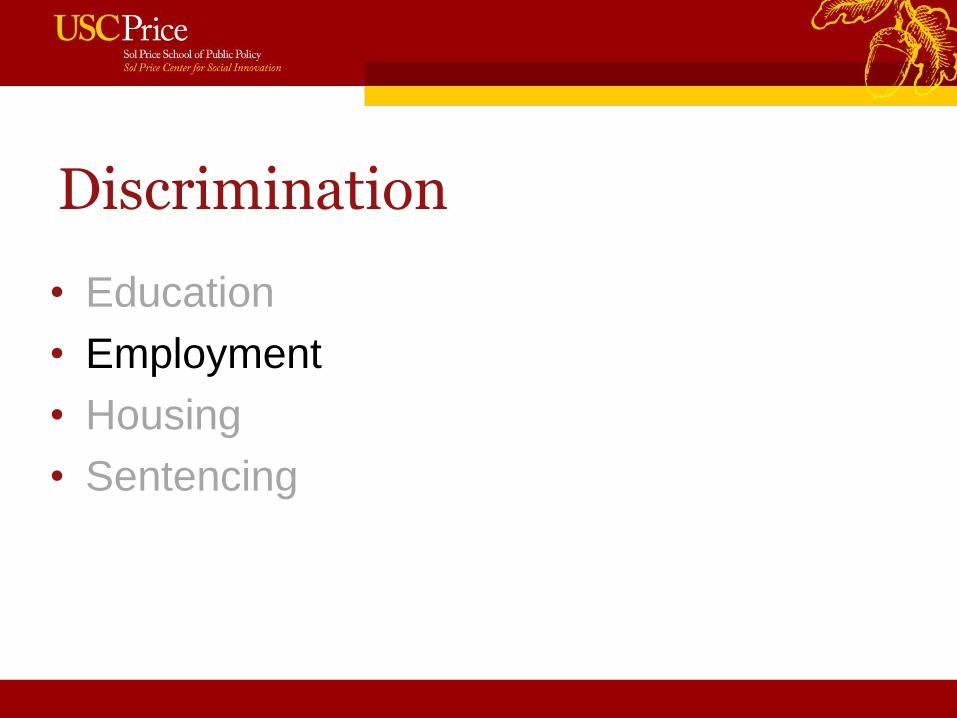
Discrimination
• Education
• Employment
• Housing
• Sentencing


Sentencing

Incarceration
28
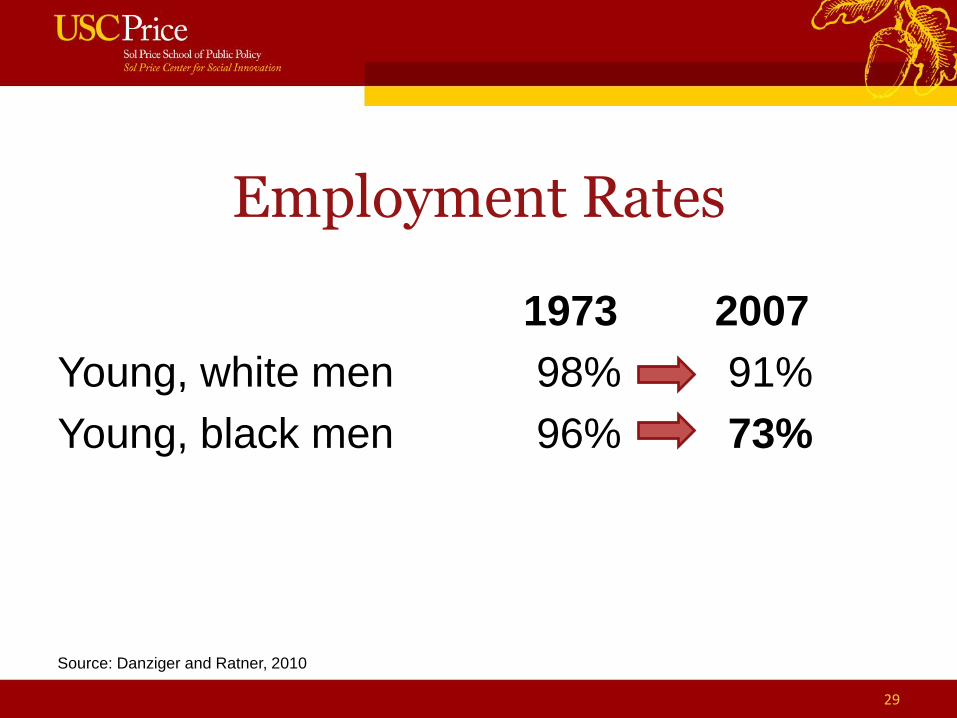
Employment Rates
1973 2007
Young, white men 98% 91%
Young, black men 96% 73%
Source: Danziger and Ratner, 2010
29

2011 Poverty Rate for Children in
30
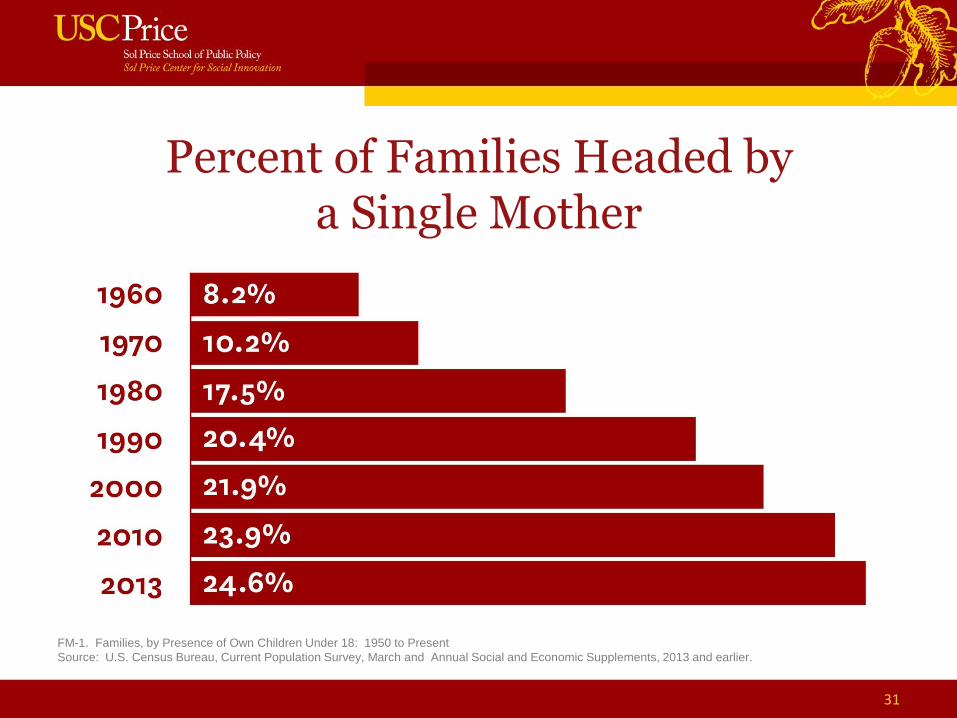
Percent of Families Headed by a Single Mother
FM-1. Families, by Presence of Own Children Under 18: 1950 to Present
Source: U.S. Census Bureau, Current Population Survey, March and Annual Social and Economic Supplements, 2013 and earlier.
31