Embed Size (px)
Citation preview
Bruce A Ramsay
October 2011
ENDING OVER-LENDING Applying Debt to Cash Flow Ratios to Nations as a means of Avoiding Financial Calamities
Copyright © Bruce A Ramsay, 2011. All rights reserved.
The following charities are recommended in consideration of the download or sharing of this document: Foodcupboard.org | KootenayKids.ca | NelsonMuseum.ca
Library and Archives Canada Cataloguing in Publication
Ramsay, Bruce A., 1956-‐ Ending over-‐lending : applying debt to cash flow ratios to nations as a means of avoiding financial calamities / Bruce A Ramsay.
Includes bibliographical references. ISBN 978-‐0-‐9878197-‐0-‐3 1. Debts, Public. 2. Cash flow. 3. Monetary policy. 4. International finance. 5. Economic forecasting. 6. Financial crises—Prevention. I. Cascadia Monetary Research. II Title. HJ8015.R34 2011 336.3’4 C2011-‐906957-‐1 Published by Cascadia Monetary Research, Chestermere, Alberta, Canada. October, 2011 [email protected] www.EndingOverLending.com
The author would like to acknowledge the valuable efforts of Michael F. Hill, without whose assistance this paper would not have been completed. Thank you as well to Annelise L. Spafford and to several test readers who assisted in the process. This paper is best considered a work-‐in-‐progress and the author accepts responsibility for errors, oversights, incomplete footnotes, and other shortcomings.
October 2011
Bruce A Ramsay Copyright © 2011
Abstract The purpose of this research is to explore how the Debt to Cash Flow ratio (“Debt/CF”) can be applied to a nation as a monitor of its fiscal health. Debt/CF is known to be an effective predictor of corporate loan covenant violations and bankruptcy. Ending Over-‐Lending examines the merits of this tool in measuring the indebtedness of nations, the debt-‐carrying capacity of nations, and the early warning signals to avert financial crises of nations. Motivation to conduct this research was found in on-‐going financial crises globally and the resulting search for new approaches to these events. A second motivating factor was that prior papers contemplating the use of Debt/CF ratios for nations were not located. Ending Over-‐Lending is intended to present a unique and potentially far-‐reaching approach to understanding the debt loads of nations. Further motivation for this paper arose from observation of limitations in current popular debt statistics. The commonly available % Government Deficit / GDP and % Government Debt/GDP only account for government debt, while ignoring Household, Corporate and Banking sector debt. Additionally, debt-‐to-‐GDP contrasts the debt against the ‘revenue’ of the economy. In financial analysis, debts are normally compared to another accounting measure-‐-‐cash flow-‐-‐which is more directly linked to an entity’s leverage. If Cash Flow has a well-‐known direct connection to the ability to service and repay debt, can relating the cash flow generated by a nation to its total debt provide a meaningful metric? Addressing this research question involved gathering time series data for measures of cash flow and debt for corporations, utilities, banks, industries, households, and nations. The paper explains how the Debt/CF metric is calculated. Debt/CF ratios for the data groups are then examined historically to assess levels of optimum versus problematic leverage. Next, the paper provides a sample calculation of a Debt/CF ratio for a nation. Debt/CF ratios and statistical trends for 20 countries are then examined. Finally, the 20 nations are grouped into 4 categories of leverage-‐-‐Inefficient, Optimum, Warning, and Calamity-‐-‐according to a Four Zone Framework proposed by the author. Based on the research, Ending Over-‐Lending characterizes the Debt/CF ratio as a simple, reliable, predictive metric that should be considered in assessing the financial health of a nation.
October 2011
Bruce A Ramsay Copyright © 2011
Table of Contents
PART 1 – Debt/Cash Flow – General Background and Corporate Brand Name Analysis ............................. 2 PART 2 – Debt/CF Analysis Applied to Industry Groups ............................................................................... 5 PART 3 – Macroeconomic Impacts .............................................................................................................. 7 PART 4 – Financial Sector ............................................................................................................................. 8 PART 5 –Defining Debt/CF Zones ............................................................................................................... 10 PART 6 – Entering the Calamity Zone ........................................................................................................ 12 PART 7 – US Household Borrowing Capacity ............................................................................................. 16 PART 8 – Debt/CF Applied to Nations ........................................................................................................ 18 PART 9 – Determining the Debt/CF for a Nation ....................................................................................... 23 Part 10 – Debt/CF Analysis of Nations ....................................................................................................... 27 PART 11 -‐ Summary and Conclusions ........................................................................................................ 36 References ................................................................................................................................................. 38 Notes .......................................................................................................................................................... 41
List of Figures Figure 1 -‐ Debt/CF Ratios for US Industry Leaders ....................................................................................... 3 Figure 2 -‐ Historical Debt/CF Ratios for US Industry Groups ....................................................................... 5 Figure 3 -‐ Historical Median Debt/CF for S&P Industry Groups ................................................................... 6 Figure 4 -‐ Impact of Recessionary Periods on Debt/CF of S&P Industrial Groups ....................................... 7 Figure 5 -‐ Debt/CF History of US Domestic Financial Sector ........................................................................ 8 Figure 6 -‐ Debt/CF Ratios with Four Zone Framework for Selected US Electric Utility Companies ........... 11 Figure 7 -‐ US Electric Utility Companies Entering the Calamity Zone and Surviving .................................. 12 Figure 8 -‐ Financially Distressed Utility Companies Entering the Calamity Zone and Failing .................... 14 Figure 9 -‐ Debt/CF Ratio of US Households and Non-‐profit Institutions ................................................... 16 Figure 10 -‐ Gross Savings Margins for Selected Countries ......................................................................... 20 Figure 11 -‐ Net Lending/Borrowing of Selected Countries ........................................................................ 21 Figure 12 -‐ Historical Debt/CF Ratio for the United States ........................................................................ 24 Figure 13 -‐ Historical Debt/CF for 20 Selected Nations ............................................................................. 27 Figure 14 -‐ Nations in the Inefficient Zone ................................................................................................ 29 Figure 15 -‐ Nations in the Optimum Zone ................................................................................................. 30 Figure 16 -‐ Nations in the Warning Zone ................................................................................................... 32 Figure 17 -‐ Nations in the Calamity Zone ................................................................................................... 34
October 2011
Bruce A Ramsay Copyright © 2011 Page 1
INTRODUCTION
Aggregate Debt/Cash Flow as a Practical Measure of the Financial Health of a Nation
Recent financial crises have spurred considerable analysis, research, inquiries and publications, addressing not only what precipitated the events, but also how to avoid such crises in the future. Authors such as Reinhart & Rogoff i and Shiller, ii as well as international agencies responsible for economic and financial oversight,iii have explored or expressed interest in alternative measures to assess the fiscal health of countries. Several studies and commentaries concluded that traditional indicators and methods did not adequately forewarn of the 2008 financial crisis.iv In response, there has been an invitation by various organizations to identify new ‘early warning signals’. Measures such as % Government Debt/GDP and % Deficit/GDP are frequently used indicators of the fiscal health of a country. The extent of underlying historical data for these measures is significant, but only accounts for government debt, not household, corporate nor financial sector debt. More recently, % Total Country Debt/GDP has been usedv (captures all four sectors’ debts), although this data is much less extensive and more difficult to obtain. Each of these debt-‐to-‐GDP indicators relates debt against the total revenue (GDP) of an economy. Revenue may not compare to an economy’s total debt as well as other accounting measures. Alternatively, relating the aggregate cash flow generated by a nation to its Total Country Debt may intuitively provide a more meaningful metric. Cash Flow has a well known direct connection to the ability of an entity to service or repay debt. Cash flow also accounts for the savings margins of a nation (GDP does not). A nation’s cash flow is known as Gross Savings and the data is readily available. Debt to Cash Flow (“Debt/CF”) has been a long standing and common measure to assess the borrowing capacity and financial health of corporations. The author proposes that the Debt/CF ratio for a nation is a simple, reliable predictive metric that should be considered in assessing its financial health: Total Country Debt / Gross Savings. The purpose of this document is to share this concept with experts, solicit feedback regarding the extent to which this approach has merit, and contemplate next steps to further develop the concept. Ending Over-‐Lending explores how the Debt/CF ratio can be applied to nations as a monitor of fiscal health. To set context for the analysis on nations, the early sections of the paper explain how the Debt/CF metric is calculated and then compile Debt/CF ratios for individual corporations, industry groups, banks and households. Next, the paper provides a sample calculation of a Debt/CF ratio for a nation. Debt/CF ratios and statistical trends for 20 countries are then examined. Finally, the 20 nations are grouped into 4 categories of leverage—Inefficient, Optimum, Warning, and Calamity—according to a Four Zone Framework proposed by the author. Discussion concerning early warning indicators is presented, along with some concluding remarks.
October 2011
Bruce A Ramsay Copyright © 2011 Page 2
PART 1 – Debt/Cash Flow – General Background and Corporate Brand Name Analysis The Debt/CF ratio expresses the total third party debts owed by an entity, in relation to the amount of cash flow generated by the entity. The higher the ratio, the more ‘levered’ the entity. In its most simplistic form, the Debt/CF ratio measures the number of years of cash flow required to retire outstanding debt (assuming 100% of cash flow is applied to this purpose).1 To calculate the Debt/CF ratio, the initial sections of this paper utilize balance sheet “Total Liabilities” for the debt measurement, and “Cash Flow From Operations” for the cash flow measurement. In a corporate entity context, Total Liabilities includes all short and long term debt, payables, and may include certain other items such as tax obligations. Equity capital and net worth are not included. Cash Flow from Operations is generally expressed as the sum of net after-‐tax profit plus depreciation and amortization, and other non-‐cash items.2 This aggregate cash flow generated by the entity is available to service principal repayment obligations on debt, invest back into the business as capital expenditures, or return to shareholders. Certain variations are possible in the calculation of the Debt/CF ratio, such as whether cash on hand is deducted to arrive at a ‘net debt’ rather than using total debt. Similarly, there are alternate measures of cash flow which could be incorporated. Such variations have only been considered to a limited degree in researching this paper.3 1 Applying 100% of cash flow to debt retirement means that no capital expenditures of any form are made towards new or replacement structures (except by way of incremental borrowing). 2 Changes in working capital are normally included. 3 Total Liabilities was selected as the analysis parameter due to data availability and to ensure comparative consistency across companies and industries. Most variations in the calculation of the ratio have the effect of lowering the resulting Debt/CF ratio. Utilizing Total Liabilities for debts portion of the Debt/CF calculation in the corporate sections of this paper may present a more stringent form of the Debt/CF results (somewhat higher).
October 2011
Bruce A Ramsay Copyright © 2011 Page 3
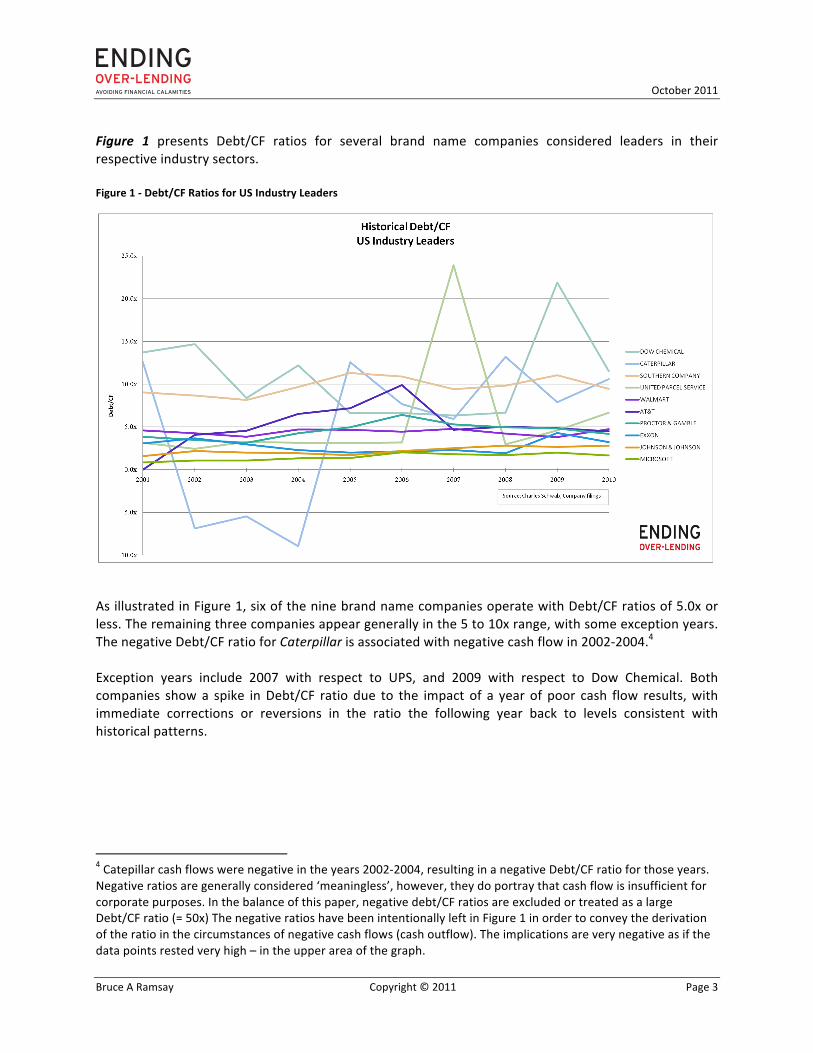
Figure 1 presents Debt/CF ratios for several brand name companies considered leaders in their respective industry sectors. Figure 1 -‐ Debt/CF Ratios for US Industry Leaders
As illustrated in Figure 1, six of the nine brand name companies operate with Debt/CF ratios of 5.0x or less. The remaining three companies appear generally in the 5 to 10x range, with some exception years. The negative Debt/CF ratio for Caterpillar is associated with negative cash flow in 2002-‐2004.4 Exception years include 2007 with respect to UPS, and 2009 with respect to Dow Chemical. Both companies show a spike in Debt/CF ratio due to the impact of a year of poor cash flow results, with immediate corrections or reversions in the ratio the following year back to levels consistent with historical patterns.
4 Catepillar cash flows were negative in the years 2002-‐2004, resulting in a negative Debt/CF ratio for those years. Negative ratios are generally considered ‘meaningless’, however, they do portray that cash flow is insufficient for corporate purposes. In the balance of this paper, negative debt/CF ratios are excluded or treated as a large Debt/CF ratio (= 50x) The negative ratios have been intentionally left in Figure 1 in order to convey the derivation of the ratio in the circumstances of negative cash flows (cash outflow). The implications are very negative as if the data points rested very high – in the upper area of the graph.
October 2011
Bruce A Ramsay Copyright © 2011 Page 4
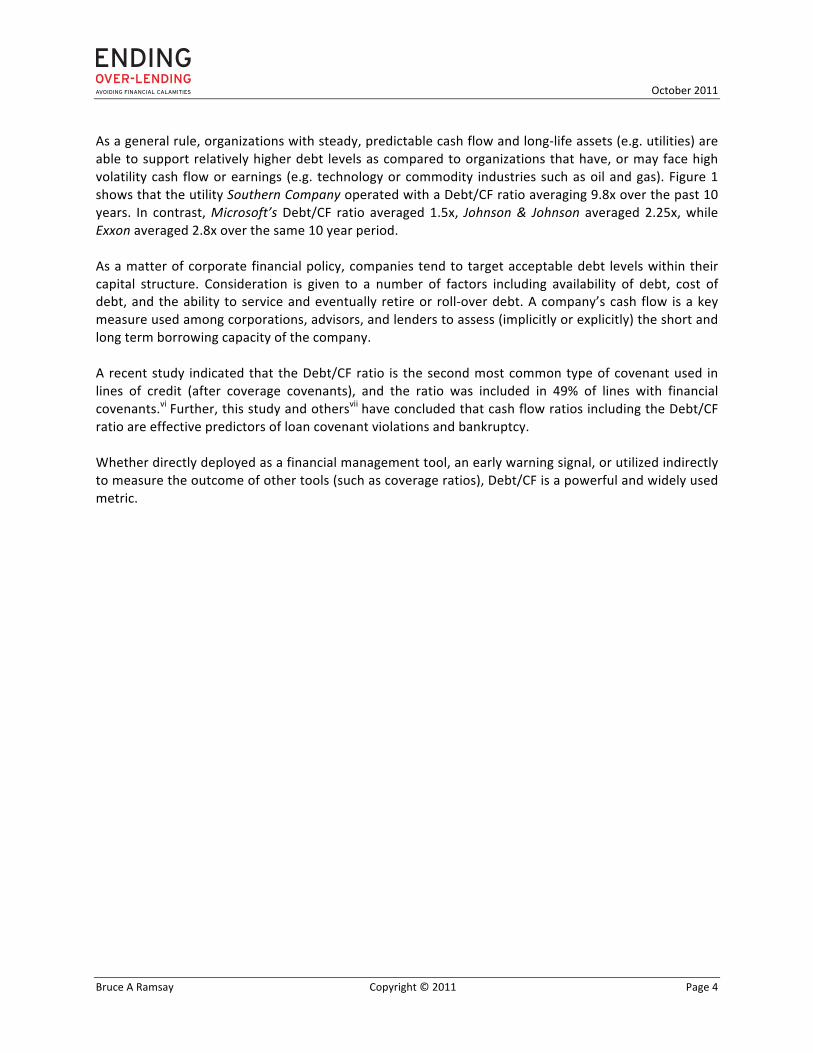
As a general rule, organizations with steady, predictable cash flow and long-‐life assets (e.g. utilities) are able to support relatively higher debt levels as compared to organizations that have, or may face high volatility cash flow or earnings (e.g. technology or commodity industries such as oil and gas). Figure 1 shows that the utility Southern Company operated with a Debt/CF ratio averaging 9.8x over the past 10 years. In contrast, Microsoft’s Debt/CF ratio averaged 1.5x, Johnson & Johnson averaged 2.25x, while Exxon averaged 2.8x over the same 10 year period. As a matter of corporate financial policy, companies tend to target acceptable debt levels within their capital structure. Consideration is given to a number of factors including availability of debt, cost of debt, and the ability to service and eventually retire or roll-‐over debt. A company’s cash flow is a key measure used among corporations, advisors, and lenders to assess (implicitly or explicitly) the short and long term borrowing capacity of the company. A recent study indicated that the Debt/CF ratio is the second most common type of covenant used in lines of credit (after coverage covenants), and the ratio was included in 49% of lines with financial covenants.vi Further, this study and othersvii have concluded that cash flow ratios including the Debt/CF ratio are effective predictors of loan covenant violations and bankruptcy. Whether directly deployed as a financial management tool, an early warning signal, or utilized indirectly to measure the outcome of other tools (such as coverage ratios), Debt/CF is a powerful and widely used metric.
October 2011
Bruce A Ramsay Copyright © 2011 Page 5
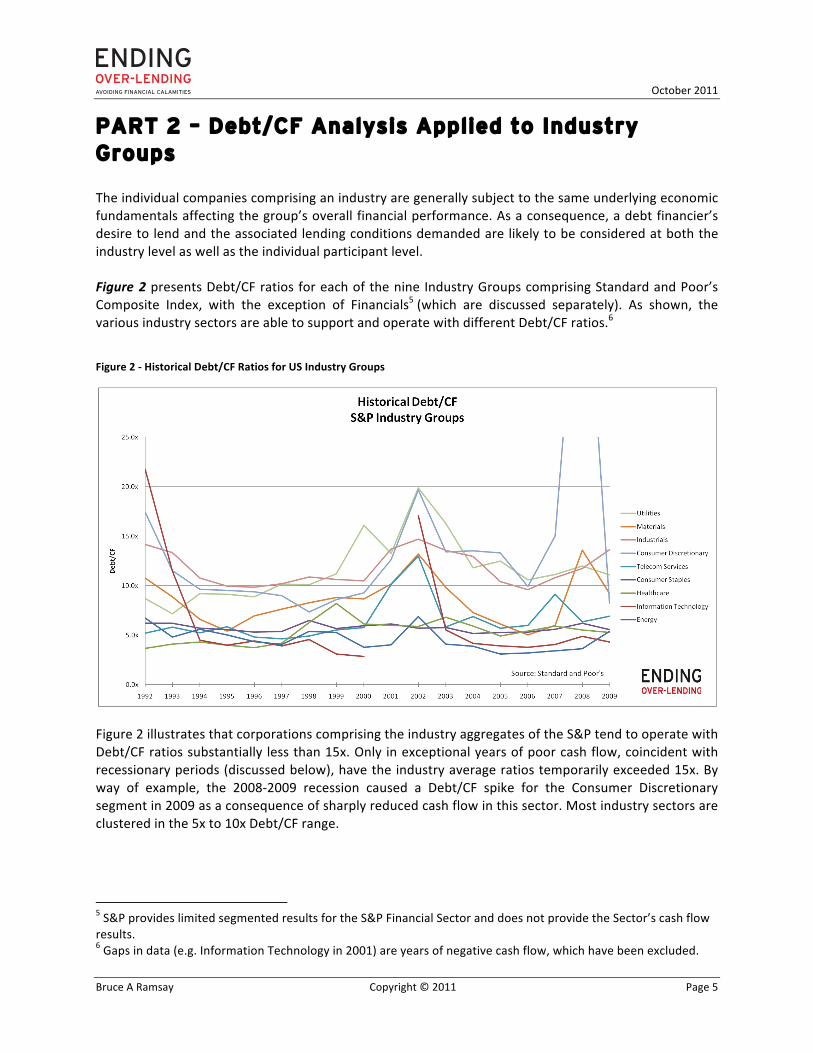
PART 2 – Debt/CF Analysis Applied to Industry Groups The individual companies comprising an industry are generally subject to the same underlying economic fundamentals affecting the group’s overall financial performance. As a consequence, a debt financier’s desire to lend and the associated lending conditions demanded are likely to be considered at both the industry level as well as the individual participant level. Figure 2 presents Debt/CF ratios for each of the nine Industry Groups comprising Standard and Poor’s Composite Index, with the exception of Financials5 (which are discussed separately). As shown, the various industry sectors are able to support and operate with different Debt/CF ratios.6
Figure 2 -‐ Historical Debt/CF Ratios for US Industry Groups
Figure 2 illustrates that corporations comprising the industry aggregates of the S&P tend to operate with Debt/CF ratios substantially less than 15x. Only in exceptional years of poor cash flow, coincident with recessionary periods (discussed below), have the industry average ratios temporarily exceeded 15x. By way of example, the 2008-‐2009 recession caused a Debt/CF spike for the Consumer Discretionary segment in 2009 as a consequence of sharply reduced cash flow in this sector. Most industry sectors are clustered in the 5x to 10x Debt/CF range.
5 S&P provides limited segmented results for the S&P Financial Sector and does not provide the Sector’s cash flow results. 6 Gaps in data (e.g. Information Technology in 2001) are years of negative cash flow, which have been excluded.
October 2011
Bruce A Ramsay Copyright © 2011 Page 6
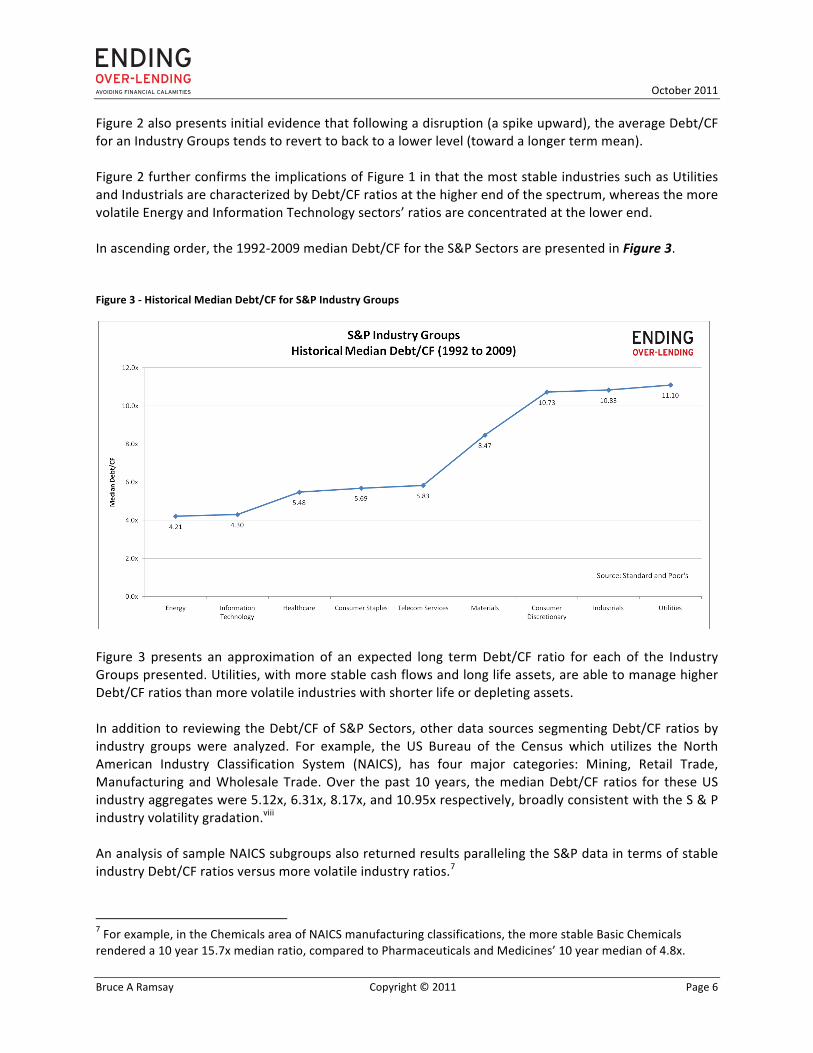
Figure 2 also presents initial evidence that following a disruption (a spike upward), the average Debt/CF for an Industry Groups tends to revert to back to a lower level (toward a longer term mean). Figure 2 further confirms the implications of Figure 1 in that the most stable industries such as Utilities and Industrials are characterized by Debt/CF ratios at the higher end of the spectrum, whereas the more volatile Energy and Information Technology sectors’ ratios are concentrated at the lower end. In ascending order, the 1992-‐2009 median Debt/CF for the S&P Sectors are presented in Figure 3.
Figure 3 -‐ Historical Median Debt/CF for S&P Industry Groups
Figure 3 presents an approximation of an expected long term Debt/CF ratio for each of the Industry Groups presented. Utilities, with more stable cash flows and long life assets, are able to manage higher Debt/CF ratios than more volatile industries with shorter life or depleting assets. In addition to reviewing the Debt/CF of S&P Sectors, other data sources segmenting Debt/CF ratios by industry groups were analyzed. For example, the US Bureau of the Census which utilizes the North American Industry Classification System (NAICS), has four major categories: Mining, Retail Trade, Manufacturing and Wholesale Trade. Over the past 10 years, the median Debt/CF ratios for these US industry aggregates were 5.12x, 6.31x, 8.17x, and 10.95x respectively, broadly consistent with the S & P industry volatility gradation.viii An analysis of sample NAICS subgroups also returned results paralleling the S&P data in terms of stable industry Debt/CF ratios versus more volatile industry ratios.7
7 For example, in the Chemicals area of NAICS manufacturing classifications, the more stable Basic Chemicals rendered a 10 year 15.7x median ratio, compared to Pharmaceuticals and Medicines’ 10 year median of 4.8x.
21
October 2011
Bruce A Ramsay Copyright © 2011 Page 7
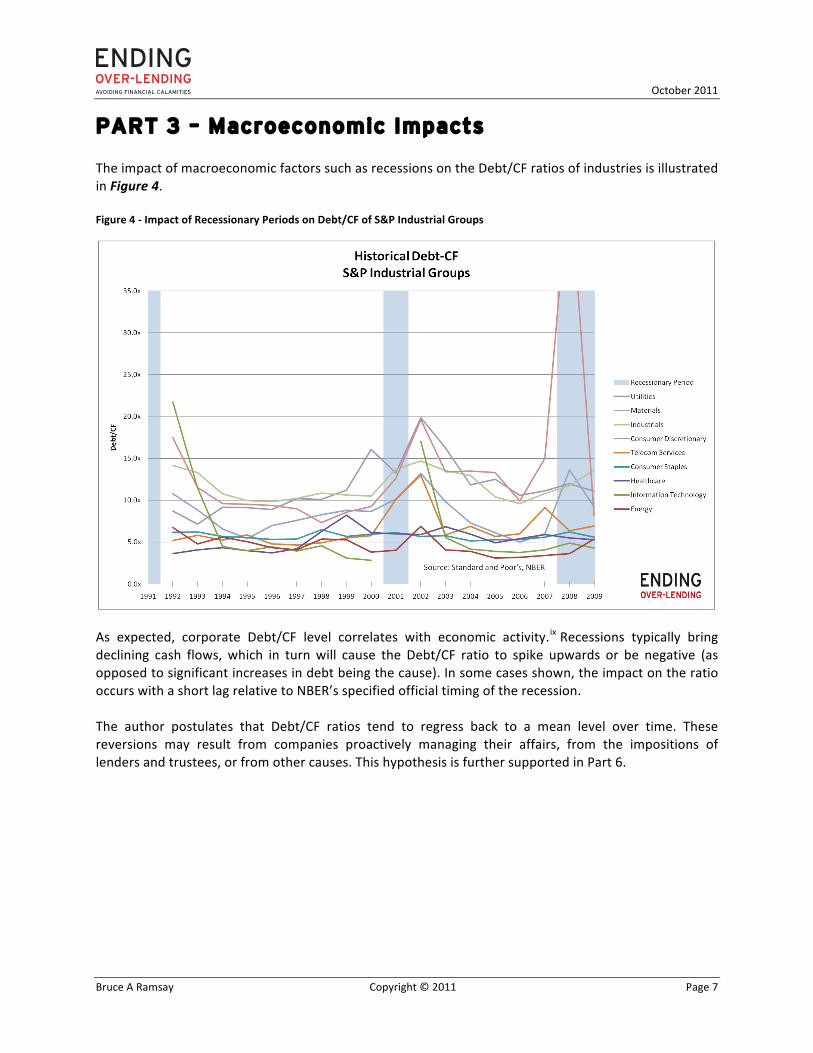
PART 3 – Macroeconomic Impacts The impact of macroeconomic factors such as recessions on the Debt/CF ratios of industries is illustrated in Figure 4. Figure 4 -‐ Impact of Recessionary Periods on Debt/CF of S&P Industrial Groups
As expected, corporate Debt/CF level correlates with economic activity.ix Recessions typically bring declining cash flows, which in turn will cause the Debt/CF ratio to spike upwards or be negative (as opposed to significant increases in debt being the cause). In some cases shown, the impact on the ratio occurs with a short lag relative to NBER’s specified official timing of the recession. The author postulates that Debt/CF ratios tend to regress back to a mean level over time. These reversions may result from companies proactively managing their affairs, from the impositions of lenders and trustees, or from other causes. This hypothesis is further supported in Part 6.
October 2011
Bruce A Ramsay Copyright © 2011 Page 8
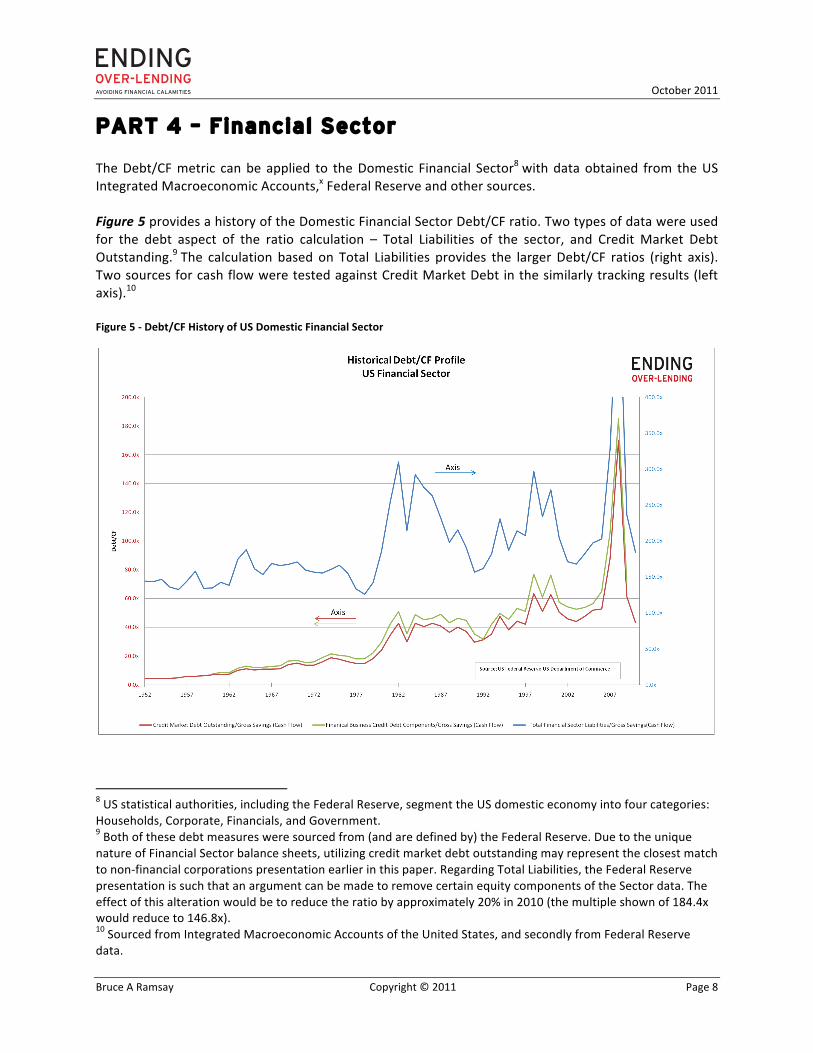
PART 4 – Financial Sector The Debt/CF metric can be applied to the Domestic Financial Sector8 with data obtained from the US Integrated Macroeconomic Accounts,x Federal Reserve and other sources. Figure 5 provides a history of the Domestic Financial Sector Debt/CF ratio. Two types of data were used for the debt aspect of the ratio calculation – Total Liabilities of the sector, and Credit Market Debt Outstanding.9 The calculation based on Total Liabilities provides the larger Debt/CF ratios (right axis). Two sources for cash flow were tested against Credit Market Debt in the similarly tracking results (left axis).10 Figure 5 -‐ Debt/CF History of US Domestic Financial Sector
8 US statistical authorities, including the Federal Reserve, segment the US domestic economy into four categories: Households, Corporate, Financials, and Government. 9 Both of these debt measures were sourced from (and are defined by) the Federal Reserve. Due to the unique nature of Financial Sector balance sheets, utilizing credit market debt outstanding may represent the closest match to non-‐financial corporations presentation earlier in this paper. Regarding Total Liabilities, the Federal Reserve presentation is such that an argument can be made to remove certain equity components of the Sector data. The effect of this alteration would be to reduce the ratio by approximately 20% in 2010 (the multiple shown of 184.4x would reduce to 146.8x). 10 Sourced from Integrated Macroeconomic Accounts of the United States, and secondly from Federal Reserve data.
October 2011
Bruce A Ramsay Copyright © 2011 Page 9
The period from 1952 until the end of the 1970s shows significant Debt/CF stability in the US financial sector on a Total Liabilities basis (approximately 150x), while a standard Debt/CF ratio rose gradually (ie. based on Credit Market Debt Outstanding). A series of US financial mishaps are graphically evident in the latter portion (post 1970s) of Figure 5. Periods of significant escalation and volatility in the ratio occurred in the 1980s (concurrent with the S&L crisis) and again in the 1990s (Long Term Capital failure and technology boom-‐bust). The collapse of the US banking system in 2008 is clearly indicated as a sharp spike and preliminary reversion. As outlined in this document, these high Debt/CF features are commonly associated with distress and collapse situations irrespective of entity.11 The closing of the US Gold Window in 1971,12 the blurring of the lines between the traditional four financial pillars in the 1980s, 13 and the 2004 relaxation in financial holding company capital requirements14 could be further researched for impact on Financial Sector Debt/CF. The author postulates that Financial entities are subject to long run Debt/CF ratio ranges related not only to the entity, but also to the stability of a nation’s financial systems. Several processes of mean reversion appear evident in Figure 515 and further research could substantiate and delineate this tendency.
11 The Financial Sector Debt/CF ratios based on Credit Market Debt Outstanding are on a basis roughly equivalent to non-‐financial corporations (and sectors). Further research assessing the gap between the Financials (which are much higher Debt/CF) and the Debt/CF of other sectors may be useful, particularly concerning the similarity of multiples from 1952 to the 1970s, and the subsequent divergence. Financial sector Debt/CF may be able to remain higher during periods of credit expansion than in periods of stability or deleveraging. 12 Under President Nixon, the United States terminated the convertibility of the US dollar into gold pursuant to Bretton Woods currency arrangements. 13 The four traditional pillars of the financial services sector were banks, trust companies, insurers, and securities dealers. 14 In 2004, the SEC relaxed capital requirements for certain large financial corporations. 15For example, Total Liabilities/Cash Flow is reasonably consistent during the 1952 to 1979 period, averaging 152.2x. Following the bulges and spikes in the latter years, the ratio returned to 156.6x in 1991, to 167.9 in 2003, and to 184.2 in 2010 (and may continue falling as Basil and other regulatory capital rules are implemented).
October 2011
Bruce A Ramsay Copyright © 2011 Page 10
PART 5 –Defining Debt/CF Zones Within a particular industry, the Debt/CF ratios of the participant companies can be categorized into four “Zones” as follows:
• Inefficient Zone – the corporation is operating with too conservative a capital structure (i.e., is under-‐levered). Capital is inefficiently deployed and the corporation is thereby producing suboptimal returns for its stakeholders.
• Optimum Zone – the corporation’s capital structure carries an optimum level of debt (i.e., is appropriately levered). The returns to stakeholders are maximized to the extent possible, while still properly and prudently mitigating against risks that may lead to debt default. The concept of an optimal capital structure has been well explored in academic literature.xi
• Warning Zone – the corporation’s capital structure is over weighted to debt (i.e., is over-‐levered). The corporation is likely carrying a greater level of debt relative to its industry peers, and the ability to service its debt is starting to be called into question. Corporations in this Zone would be expected to have lower bond ratings than companies in the Optimum Zone.
• Calamity Zone – the corporation’s capital structure is considerably over leveraged. The entity is now at serious financial risk or indeed experiences a financial calamity (i.e. enters Chapter 11). Whether or not a clear and reasonably quick path back to appropriate leverage levels is available will in part determine if a collapse is avoidable.
A peer group of twenty US electric utilities were plotted based on Debt/CF ratios using the above Zone framework. The levels of the demarcations between Zones are illustrative only. More definitive Zone ranges could be determined based on further analysis. The Zones defined for an individual company should be evaluated based on that company’s unique circumstances, but also can be referenced to industry-‐wide Debt/CF Zones.
October 2011
Bruce A Ramsay Copyright © 2011 Page 11
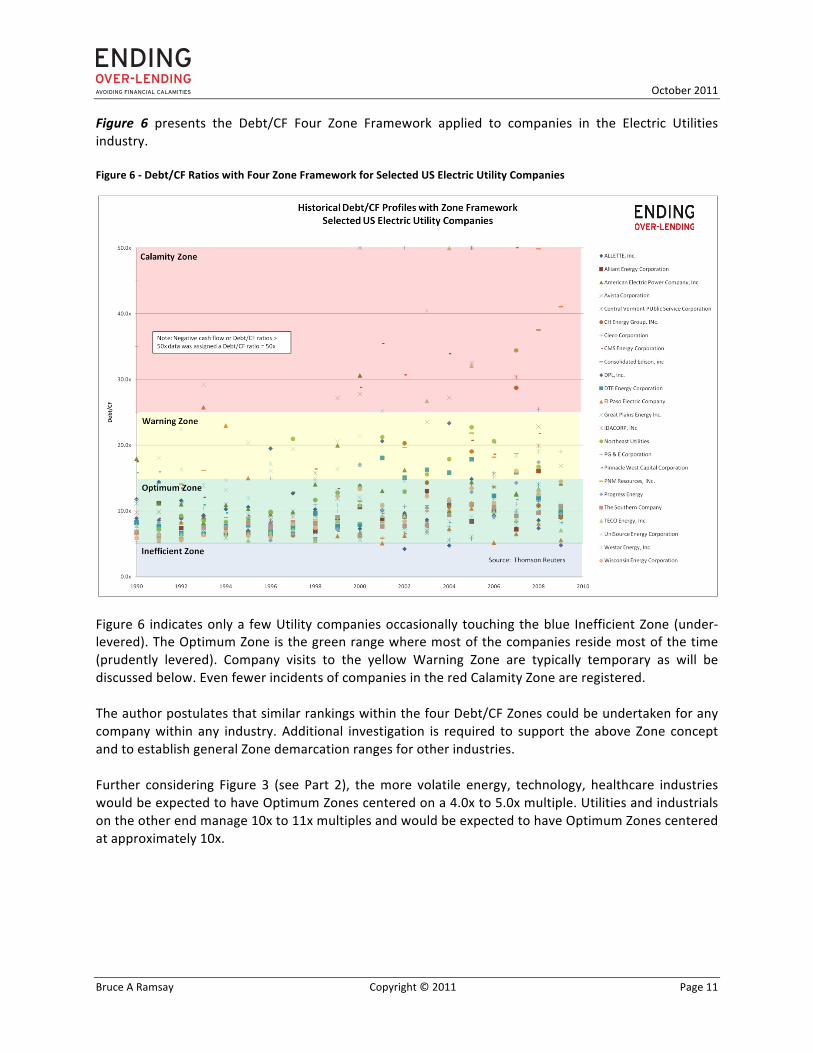
Figure 6 presents the Debt/CF Four Zone Framework applied to companies in the Electric Utilities industry. Figure 6 -‐ Debt/CF Ratios with Four Zone Framework for Selected US Electric Utility Companies
Figure 6 indicates only a few Utility companies occasionally touching the blue Inefficient Zone (under-‐levered). The Optimum Zone is the green range where most of the companies reside most of the time (prudently levered). Company visits to the yellow Warning Zone are typically temporary as will be discussed below. Even fewer incidents of companies in the red Calamity Zone are registered. The author postulates that similar rankings within the four Debt/CF Zones could be undertaken for any company within any industry. Additional investigation is required to support the above Zone concept and to establish general Zone demarcation ranges for other industries. Further considering Figure 3 (see Part 2), the more volatile energy, technology, healthcare industries would be expected to have Optimum Zones centered on a 4.0x to 5.0x multiple. Utilities and industrials on the other end manage 10x to 11x multiples and would be expected to have Optimum Zones centered at approximately 10x.
October 2011
Bruce A Ramsay Copyright © 2011 Page 12
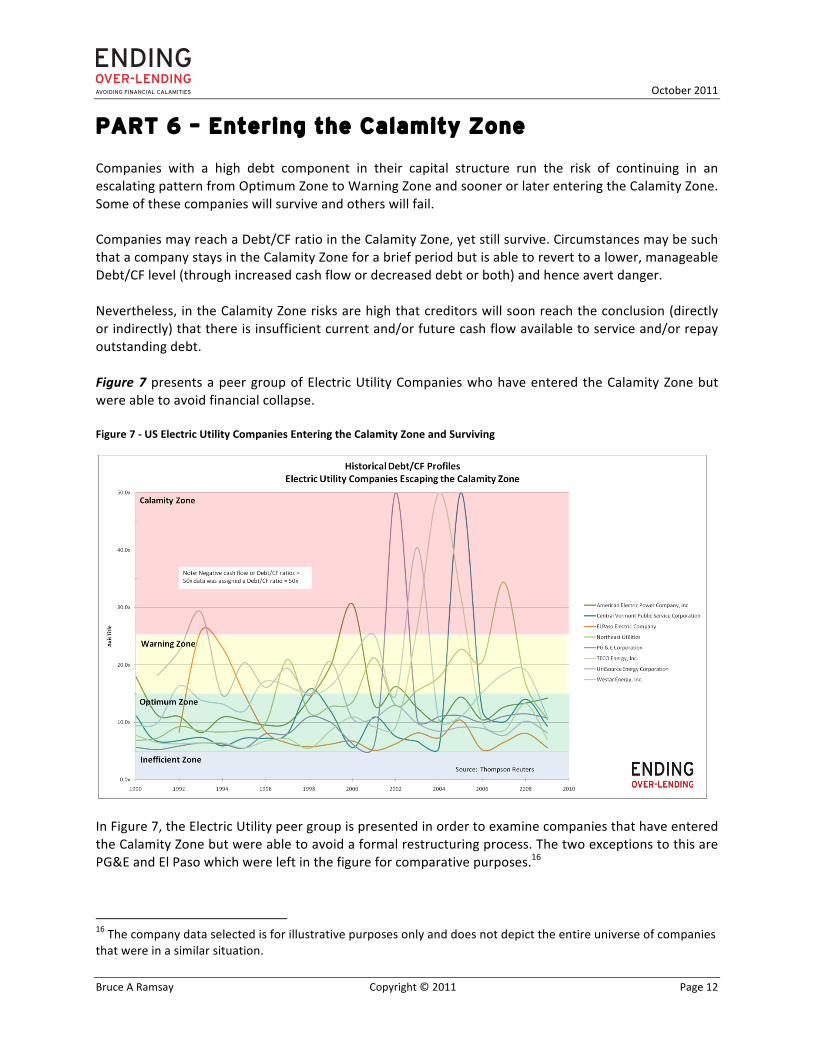
PART 6 – Entering the Calamity Zone Companies with a high debt component in their capital structure run the risk of continuing in an escalating pattern from Optimum Zone to Warning Zone and sooner or later entering the Calamity Zone. Some of these companies will survive and others will fail. Companies may reach a Debt/CF ratio in the Calamity Zone, yet still survive. Circumstances may be such that a company stays in the Calamity Zone for a brief period but is able to revert to a lower, manageable Debt/CF level (through increased cash flow or decreased debt or both) and hence avert danger. Nevertheless, in the Calamity Zone risks are high that creditors will soon reach the conclusion (directly or indirectly) that there is insufficient current and/or future cash flow available to service and/or repay outstanding debt. Figure 7 presents a peer group of Electric Utility Companies who have entered the Calamity Zone but were able to avoid financial collapse.
Figure 7 -‐ US Electric Utility Companies Entering the Calamity Zone and Surviving
In Figure 7, the Electric Utility peer group is presented in order to examine companies that have entered the Calamity Zone but were able to avoid a formal restructuring process. The two exceptions to this are PG&E and El Paso which were left in the figure for comparative purposes.16
16 The company data selected is for illustrative purposes only and does not depict the entire universe of companies that were in a similar situation.
October 2011
Bruce A Ramsay Copyright © 2011 Page 13
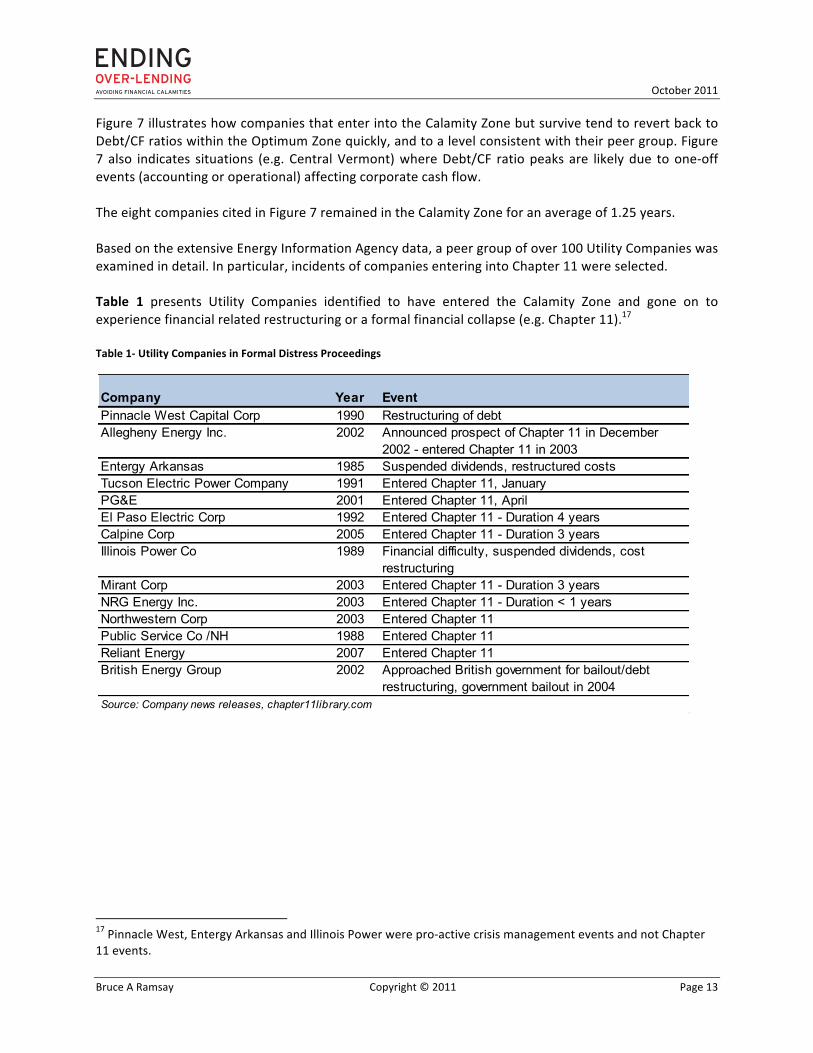
Figure 7 illustrates how companies that enter into the Calamity Zone but survive tend to revert back to Debt/CF ratios within the Optimum Zone quickly, and to a level consistent with their peer group. Figure 7 also indicates situations (e.g. Central Vermont) where Debt/CF ratio peaks are likely due to one-‐off events (accounting or operational) affecting corporate cash flow. The eight companies cited in Figure 7 remained in the Calamity Zone for an average of 1.25 years. Based on the extensive Energy Information Agency data, a peer group of over 100 Utility Companies was examined in detail. In particular, incidents of companies entering into Chapter 11 were selected. Table 1 presents Utility Companies identified to have entered the Calamity Zone and gone on to experience financial related restructuring or a formal financial collapse (e.g. Chapter 11).17 Table 1-‐ Utility Companies in Formal Distress Proceedings
17 Pinnacle West, Entergy Arkansas and Illinois Power were pro-‐active crisis management events and not Chapter 11 events.
Company Year EventPinnacle West Capital Corp 1990 Restructuring of debtAllegheny Energy Inc. 2002 Announced prospect of Chapter 11 in December
2002 - entered Chapter 11 in 2003Entergy Arkansas 1985 Suspended dividends, restructured costsTucson Electric Power Company 1991 Entered Chapter 11, JanuaryPG&E 2001 Entered Chapter 11, AprilEl Paso Electric Corp 1992 Entered Chapter 11 - Duration 4 yearsCalpine Corp 2005 Entered Chapter 11 - Duration 3 yearsIllinois Power Co 1989 Financial difficulty, suspended dividends, cost
restructuringMirant Corp 2003 Entered Chapter 11 - Duration 3 yearsNRG Energy Inc. 2003 Entered Chapter 11 - Duration < 1 yearsNorthwestern Corp 2003 Entered Chapter 11Public Service Co /NH 1988 Entered Chapter 11Reliant Energy 2007 Entered Chapter 11British Energy Group 2002 Approached British government for bailout/debt
restructuring, government bailout in 2004Source: Company news releases, chapter11library.com
October 2011
Bruce A Ramsay Copyright © 2011 Page 14
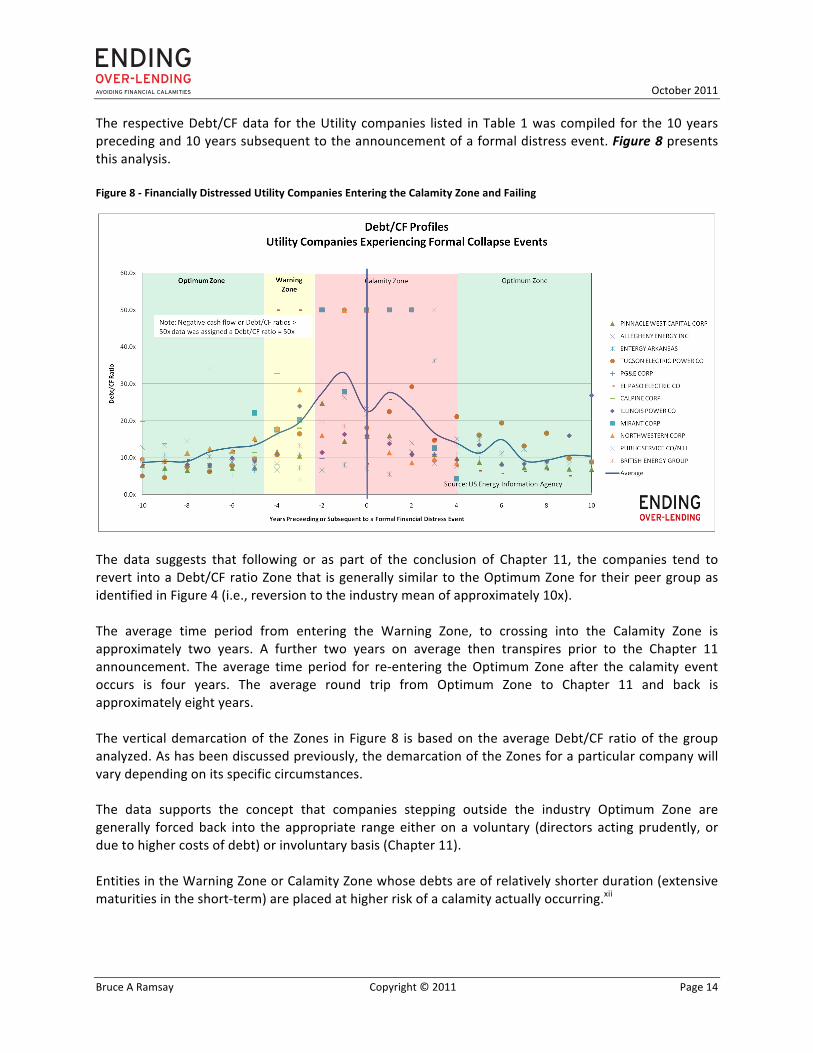
The respective Debt/CF data for the Utility companies listed in Table 1 was compiled for the 10 years preceding and 10 years subsequent to the announcement of a formal distress event. Figure 8 presents this analysis. Figure 8 -‐ Financially Distressed Utility Companies Entering the Calamity Zone and Failing
The data suggests that following or as part of the conclusion of Chapter 11, the companies tend to revert into a Debt/CF ratio Zone that is generally similar to the Optimum Zone for their peer group as identified in Figure 4 (i.e., reversion to the industry mean of approximately 10x). The average time period from entering the Warning Zone, to crossing into the Calamity Zone is approximately two years. A further two years on average then transpires prior to the Chapter 11 announcement. The average time period for re-‐entering the Optimum Zone after the calamity event occurs is four years. The average round trip from Optimum Zone to Chapter 11 and back is approximately eight years. The vertical demarcation of the Zones in Figure 8 is based on the average Debt/CF ratio of the group analyzed. As has been discussed previously, the demarcation of the Zones for a particular company will vary depending on its specific circumstances. The data supports the concept that companies stepping outside the industry Optimum Zone are generally forced back into the appropriate range either on a voluntary (directors acting prudently, or due to higher costs of debt) or involuntary basis (Chapter 11). Entities in the Warning Zone or Calamity Zone whose debts are of relatively shorter duration (extensive maturities in the short-‐term) are placed at higher risk of a calamity actually occurring.xii
October 2011
Bruce A Ramsay Copyright © 2011 Page 15
The author postulates that the fact a company enters a Warning Zone may, in itself, represent a reasonable indication of the need to consider potential revitalization or restructuring actions. An increasing Debt/CF trend is a potential indicator of declining fiscal health. In addition, the rate of change of the Debt/CF ratio may be indicative of the severity of potential problems.
October 2011
Bruce A Ramsay Copyright © 2011 Page 16
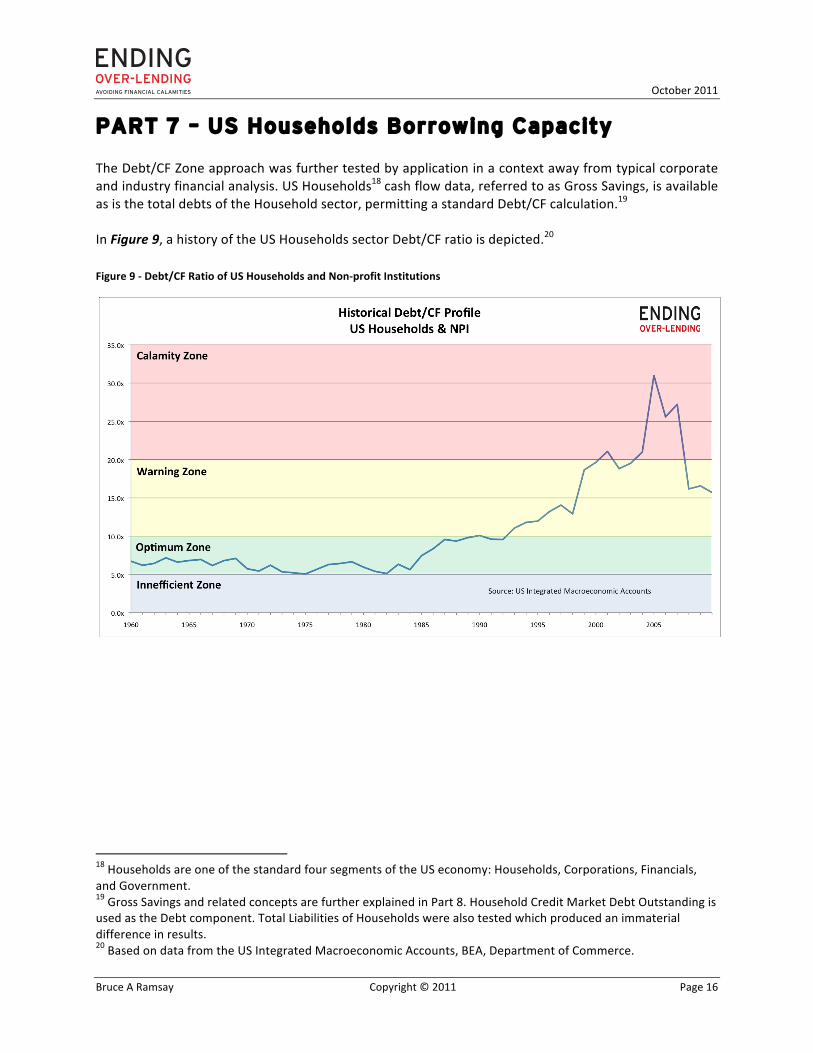
PART 7 – US Households Borrowing Capacity The Debt/CF Zone approach was further tested by application in a context away from typical corporate and industry financial analysis. US Households18 cash flow data, referred to as Gross Savings, is available as is the total debts of the Household sector, permitting a standard Debt/CF calculation.19 In Figure 9, a history of the US Households sector Debt/CF ratio is depicted.20 Figure 9 -‐ Debt/CF Ratio of US Households and Non-‐profit Institutions
18 Households are one of the standard four segments of the US economy: Households, Corporations, Financials, and Government. 19 Gross Savings and related concepts are further explained in Part 8. Household Credit Market Debt Outstanding is used as the Debt component. Total Liabilities of Households were also tested which produced an immaterial difference in results. 20 Based on data from the US Integrated Macroeconomic Accounts, BEA, Department of Commerce.
October 2011
Bruce A Ramsay Copyright © 2011 Page 17
The figure illustrates the plausibility of applying a Debt/CF Zone approach to the Households sector.21 US Households maintained a position in a suggested Optimum Zone for the three decades 1960s to 1980s. Households entered the Warning Zone in 1993 (depicted as 10x and higher), and 8 years later crossed to the Calamity Zone in 2001 (20x and higher). The resulting calamity and other events underlying this data have been covered extensively in the press. Based on the timing of Households crossing Zone boundaries, the Zone approach may have merit as an early warning tool against impending financial difficulties. Approximately 7 years transpired from Households entering the Calamity Zone to the crises of 2008. In sum, the duration from leaving the Optimum Zone until the calamities occurred was approximately 15 years. The Zones applied to Households were adjusted downward from the Utility sector analyzed earlier (i.e. with the Optimum Zone centered on 7.5x instead of 10x). The Warning Zone is depicted as 10x to 20x, although ongoing severe difficulties for the US Household sector in years subsequent to 2008 suggest the boundary between Warning and Calamity Zones could potentially be set lower (15x for example). Zones specific to the Households sector could be identified through further research.22 The quick return by Households to a Debt/CF of approximately 16x in recent years suggests a process of reversion to mean may be underway. In this case the reversion is likely the result of both write-‐offs of mortgage and consumer debts by banks (reducing the numerator), and increased savings on the part of Households (increasing the denominator). Government income and housing programs may also affect (overstate) the speed at which the Households sector is indicated to revert towards stable long-‐term mean ratios. Further research and data would be required to further validate these observations. The Debt/CF history of the US Households sector also speaks to the ubiquitous nature of the Debt/CF ratio as a measure of financial health. The analysis supports the use of the Four Zone Framework as a means of delineating Debt/CF levels as prudent or problematic.
21 A commonly used Households leverage indicator is % Debt/Disposable Income. This metric is prior to consumption decisions made by Households. The Households Debt/Gross Savings ratio takes into account all consumption decisions and hence may be a useful additional metric. 22 The author postulates that the Optimum Zone for Households is likely centered at a lower Debt/CF level than for Utilities. The Households sector is an aggregate of individual households, and issues such as income and wealth distribution would be expected to affect the determination of appropriate Zones.
October 2011
Bruce A Ramsay Copyright © 2011 Page 18
PART 8 – Debt/CF Applied to Nations The author hypothesizes that the Debt/CF ratio has merit as a tool to measure the relative indebtedness of nations, the ongoing debt-‐carrying capacity of nations, and as early warning signals to avert financial crises of nations. A reasonably thorough review of published literature was conducted but prior papers which contemplate the use of Debt/CF ratios for nations were not located.xiii While literature citing the use of the Debt/CF metric for nations may indeed exist, this concept would certainly not appear to be in common usage.23 Similar to corporate analysis, lenders can assess the perceived security of a country’s cash flow. A nation’s ability to generate a steady, reliable cash flow is a function of the underlying strength or dynamics of its economy. As a nation’s cash flow and stability of cash flow increases, the debt carrying capability of that nation also increases. Rating Agencies apparently do not utilize the Debt/CF ratio in the evaluation of sovereign debt.xiv The Debt/CF ratio for a nation is derived by compiling the aggregate outstanding indebtedness for the nation, and dividing by the aggregate cash flow produced by that country. A nation’s Total Country Debt consists primarily of the credit market debt obligations,24 while cash flow is measured by the Gross Savings generated by that country. Various authors have complained about the limited availability of aggregate debt data internationally,xv however the provision of this data, although in its infancy, is now becoming available.xvi Gross Savings, on the other hand, has been a long standing concept internationally (in the National Income and Product Accounts), and the data is widely available. The OECD, for example, tracks Gross Savings for countries in the National Accounts data.xvii 23 The author would appreciate being apprised of such materials, as well as other material directly or indirectly of interest, please use [email protected]. 24 Other items can include trade payables, taxes payable, security credit and miscellaneous.
October 2011
Bruce A Ramsay Copyright © 2011 Page 19
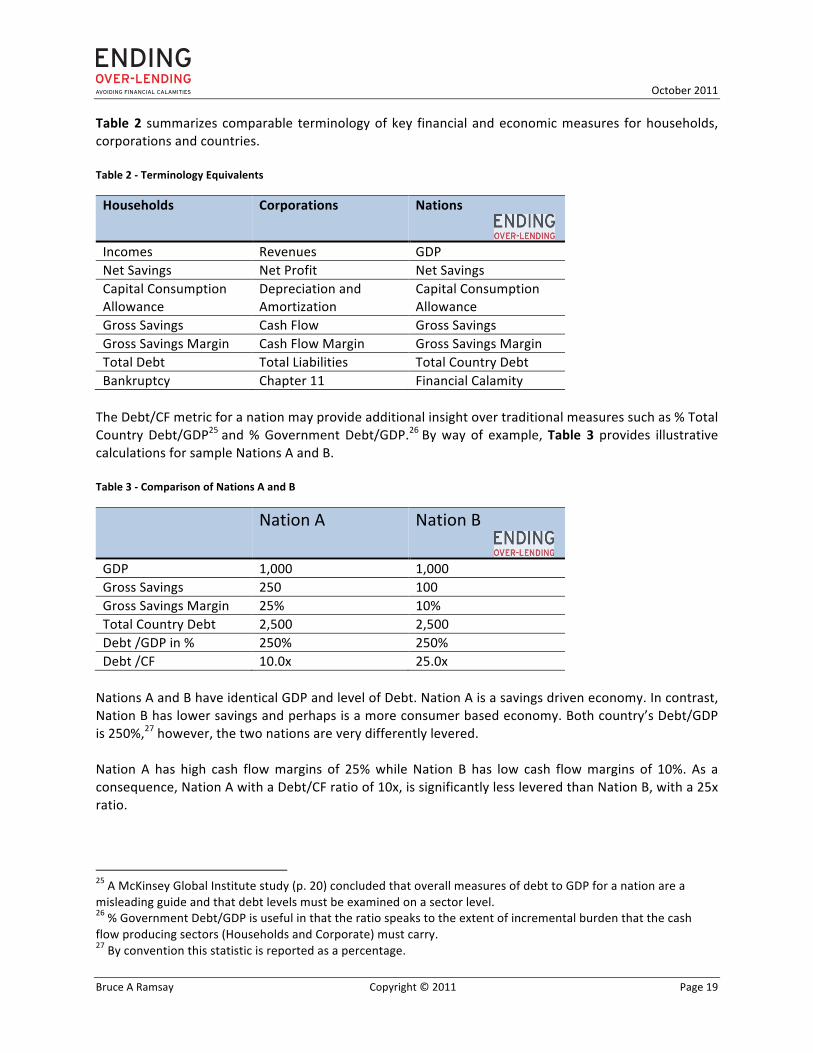
Table 2 summarizes comparable terminology of key financial and economic measures for households, corporations and countries. Table 2 -‐ Terminology Equivalents
Households Corporations Nations
Incomes Revenues GDP Net Savings Net Profit Net Savings Capital Consumption Allowance
Depreciation and Amortization
Capital Consumption Allowance
Gross Savings Cash Flow Gross Savings Gross Savings Margin Cash Flow Margin Gross Savings Margin Total Debt Total Liabilities Total Country Debt Bankruptcy Chapter 11 Financial Calamity The Debt/CF metric for a nation may provide additional insight over traditional measures such as % Total Country Debt/GDP25 and % Government Debt/GDP.26 By way of example, Table 3 provides illustrative calculations for sample Nations A and B. Table 3 -‐ Comparison of Nations A and B
Nation A Nation B
GDP 1,000 1,000 Gross Savings 250 100 Gross Savings Margin 25% 10% Total Country Debt 2,500 2,500 Debt /GDP in % 250% 250% Debt /CF 10.0x 25.0x Nations A and B have identical GDP and level of Debt. Nation A is a savings driven economy. In contrast, Nation B has lower savings and perhaps is a more consumer based economy. Both country’s Debt/GDP is 250%,27 however, the two nations are very differently levered. Nation A has high cash flow margins of 25% while Nation B has low cash flow margins of 10%. As a consequence, Nation A with a Debt/CF ratio of 10x, is significantly less levered than Nation B, with a 25x ratio.
25 A McKinsey Global Institute study (p. 20) concluded that overall measures of debt to GDP for a nation are a misleading guide and that debt levels must be examined on a sector level. 26 % Government Debt/GDP is useful in that the ratio speaks to the extent of incremental burden that the cash flow producing sectors (Households and Corporate) must carry. 27 By convention this statistic is reported as a percentage.
October 2011
Bruce A Ramsay Copyright © 2011 Page 20
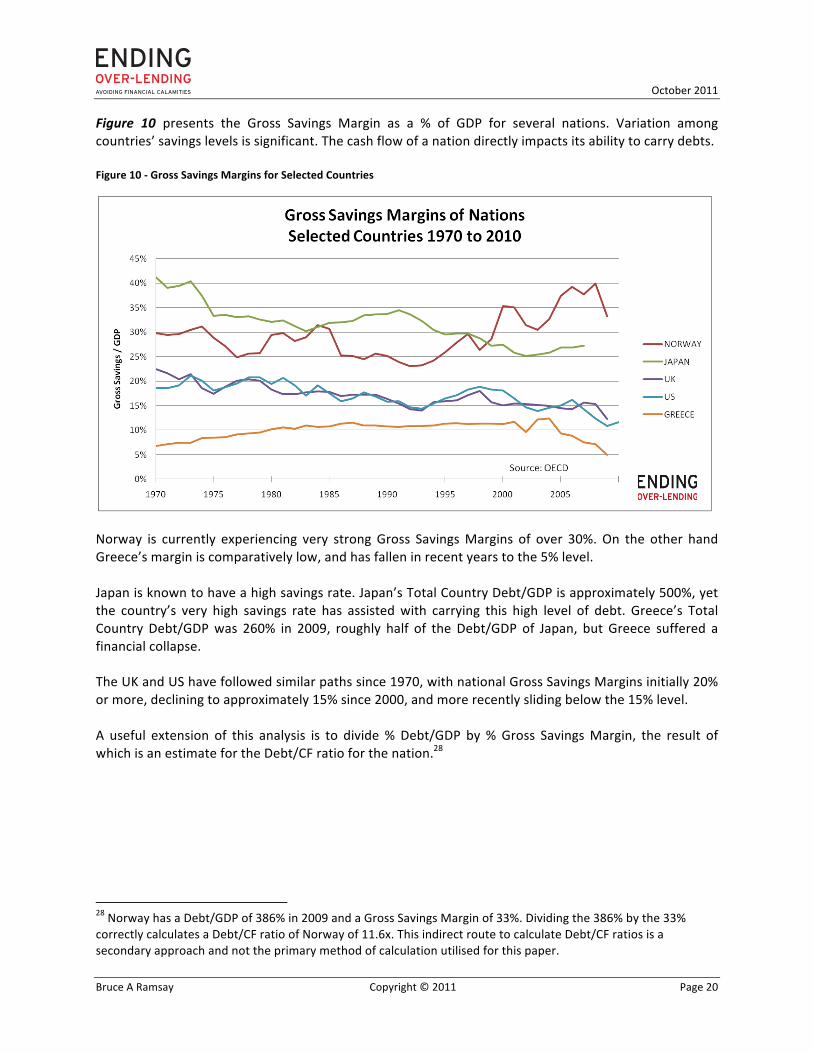
Figure 10 presents the Gross Savings Margin as a % of GDP for several nations. Variation among countries’ savings levels is significant. The cash flow of a nation directly impacts its ability to carry debts.
Figure 10 -‐ Gross Savings Margins for Selected Countries
Norway is currently experiencing very strong Gross Savings Margins of over 30%. On the other hand Greece’s margin is comparatively low, and has fallen in recent years to the 5% level. Japan is known to have a high savings rate. Japan’s Total Country Debt/GDP is approximately 500%, yet the country’s very high savings rate has assisted with carrying this high level of debt. Greece’s Total Country Debt/GDP was 260% in 2009, roughly half of the Debt/GDP of Japan, but Greece suffered a financial collapse. The UK and US have followed similar paths since 1970, with national Gross Savings Margins initially 20% or more, declining to approximately 15% since 2000, and more recently sliding below the 15% level. A useful extension of this analysis is to divide % Debt/GDP by % Gross Savings Margin, the result of which is an estimate for the Debt/CF ratio for the nation.28 28 Norway has a Debt/GDP of 386% in 2009 and a Gross Savings Margin of 33%. Dividing the 386% by the 33% correctly calculates a Debt/CF ratio of Norway of 11.6x. This indirect route to calculate Debt/CF ratios is a secondary approach and not the primary method of calculation utilised for this paper.
October 2011
Bruce A Ramsay Copyright © 2011 Page 21
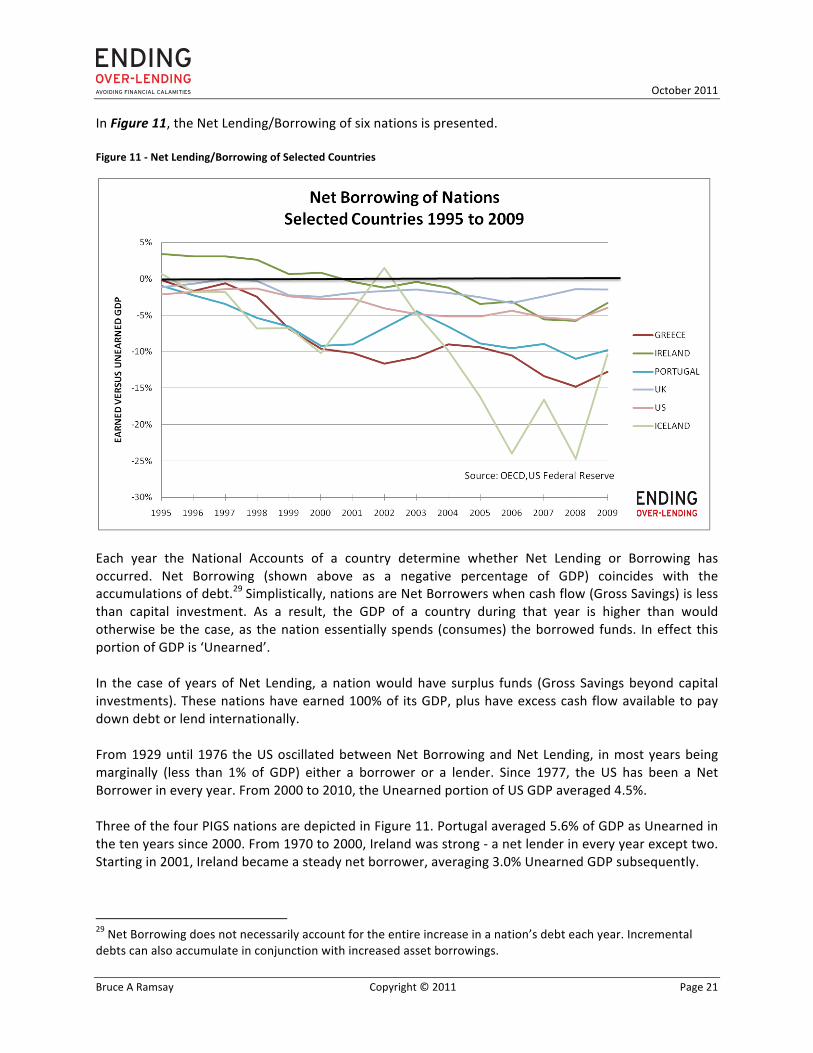
In Figure 11, the Net Lending/Borrowing of six nations is presented. Figure 11 -‐ Net Lending/Borrowing of Selected Countries
Each year the National Accounts of a country determine whether Net Lending or Borrowing has occurred. Net Borrowing (shown above as a negative percentage of GDP) coincides with the accumulations of debt.29 Simplistically, nations are Net Borrowers when cash flow (Gross Savings) is less than capital investment. As a result, the GDP of a country during that year is higher than would otherwise be the case, as the nation essentially spends (consumes) the borrowed funds. In effect this portion of GDP is ‘Unearned’. In the case of years of Net Lending, a nation would have surplus funds (Gross Savings beyond capital investments). These nations have earned 100% of its GDP, plus have excess cash flow available to pay down debt or lend internationally. From 1929 until 1976 the US oscillated between Net Borrowing and Net Lending, in most years being marginally (less than 1% of GDP) either a borrower or a lender. Since 1977, the US has been a Net Borrower in every year. From 2000 to 2010, the Unearned portion of US GDP averaged 4.5%. Three of the four PIGS nations are depicted in Figure 11. Portugal averaged 5.6% of GDP as Unearned in the ten years since 2000. From 1970 to 2000, Ireland was strong -‐ a net lender in every year except two. Starting in 2001, Ireland became a steady net borrower, averaging 3.0% Unearned GDP subsequently. 29 Net Borrowing does not necessarily account for the entire increase in a nation’s debt each year. Incremental debts can also accumulate in conjunction with increased asset borrowings.
October 2011
Bruce A Ramsay Copyright © 2011 Page 22
Greece has historically been a Net Borrower, with only seven years since 1970 as a lender. In the ten years from 2000 to 2009, Greece borrowed an average of 11.2% (i.e. Unearned GDP of 11.2 % per year). The ten year (2000-‐2009) average Unearned GDP for Spain was 5.6% (not depicted). Iceland had a very significant portion of its GDP Unearned, as illustrated in Figure 11. The UK on the other hand, has been a steady, but minor Net Borrower in the past with an average of 2.1 % of Unearned GDP in the ten years from 2000 to 2009. Sweden, Norway, Switzerland, and Germany are all examples of nations whose GDP has been 100% Earned in recent years (these countries have been Net Lenders and do not experience Unearned GDP). 30
30 Nations relying on Unearned GDP are more likely to have unstable Gross Savings, in turn subjecting the Debt/CF to risks of a spiking ratio.
October 2011
Bruce A Ramsay Copyright © 2011 Page 23
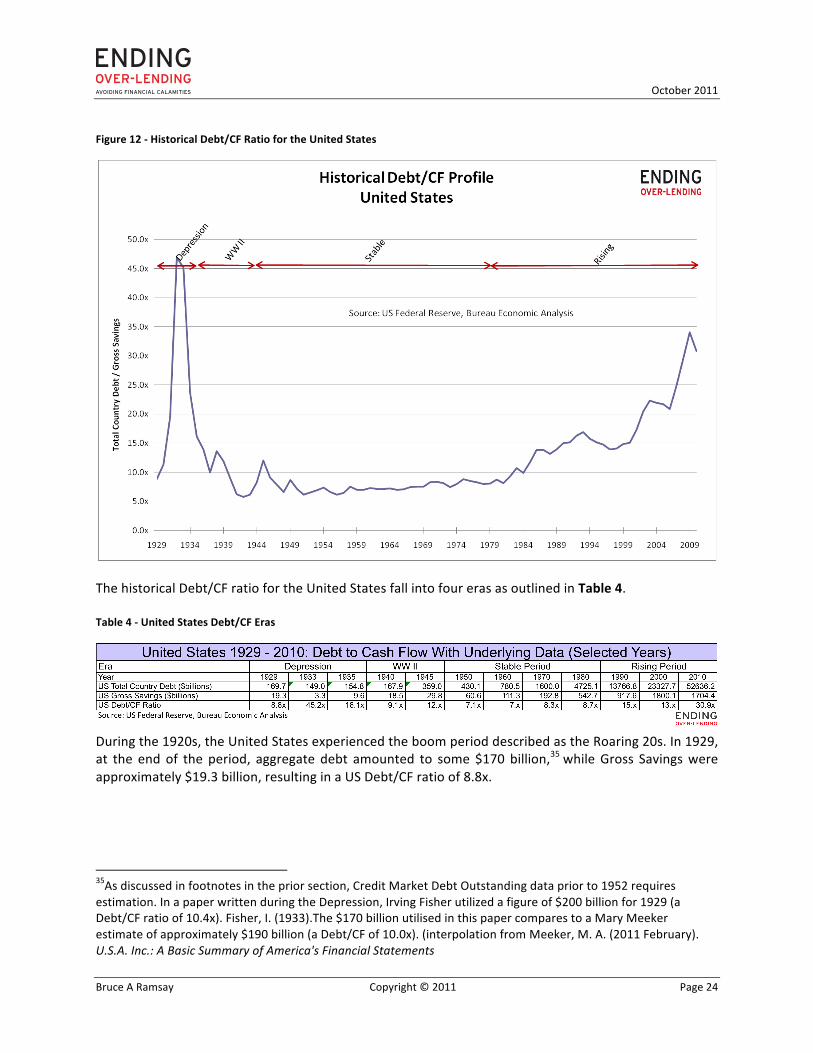
PART 9 – Determining the Debt/CF for a Nation The following compilation of a Debt/CF ratio history of the United States serves to demonstrate the process of computing and analyzing a country’s Debt/CF ratio. In the United States, Table L1 of the Federal Reserve Board Flow of Funds Accountsxviii reports “Total Credit Market Debt Outstanding”.31 The data has been reported in this format since 1952.32 xix The domestic portion of Total Country Debt data is typically segmented into four categories: Household Debt, Corporate Debt, Financial Sector Debt, and Government Debt. Several prior reports have discussed and demonstrated the accumulations of debts among these sectors.xx While other nations’ reporting methodology may differ somewhat, comparative international debt data has become available in recent years through the OECD Financial Accounts, EU Accounts, and direct from central banks.33 In the United States, Table 5.1 of the Bureau of Economic Analysis Survey of Current Business reports Gross Savings. The data is reported in this form dating from 1929. The Gross Savings calculation first adds the nation’s corporate and banking profits together with household savings, and deducts government deficits (a government surplus would be added). To this Net Savings amount for the nation, a capital consumption allowance (i.e., a depreciation equivalent) is added to arrive at Gross Savings. An analogy for a nation’s cash flow calculation is the corporate realm (see Table 2) where net profit after tax plus depreciation equals the operating cash flow of the business.34 The Gross Savings of a nation represents the cash generated from all sectors combined. Conceptually, these funds are available to repay current debt principal repayments, construct physical assets, rebuild structures needing replacement, and so forth. Figure 12 presents the historical Debt/CF for the United States. 31Unfunded Liabilities are not included. 32 The typical source for pre-‐1952 data has been Department of Commerce data cited in Economic Report of the President (1970s). Utilizing this particular historical data was challenged as “technically wrong and analytically meaningless” by Credit-‐Suisse, who offered a ‘spliced’ version of the data providing some marginal differences. For the purposes of this paper, the years of overlap (1952-‐1973) were compared to determine a median differential of 13.8% (average was 13.1%, with a range of 11.9% to 17.3%) between the two data streams. This differential was then applied to the pre-‐1952 data in order to emulate (by lowering the pre-‐1952 data) the Credit Market Liabilities Outstanding basis. 33 Total Country Debt has been proposed to include items which go beyond Credit Market Debt obligations such as trade payables, taxes owing or other items, depending on the detail of the definition. This broader figure is becoming cited as Domestic Debt. Haver Analytics, for example, publishes Domestic Debt and Domestic Debt/GDP in % in collaboration with certain Central Banks. 34 Changes in working capital are typically incorporated, which tend to ‘average out’ over time frames and are thus not considered material for purposes of this paper.
October 2011
Bruce A Ramsay Copyright © 2011 Page 24
Figure 12 -‐ Historical Debt/CF Ratio for the United States
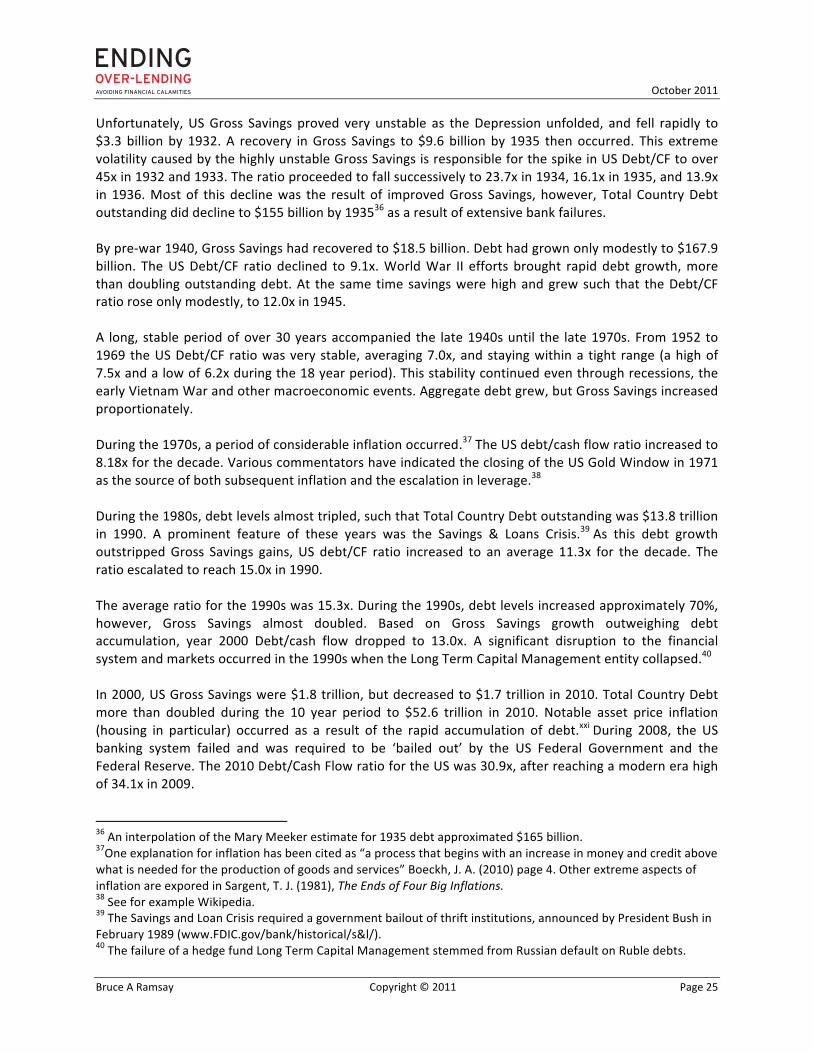
The historical Debt/CF ratio for the United States fall into four eras as outlined in Table 4. Table 4 -‐ United States Debt/CF Eras
During the 1920s, the United States experienced the boom period described as the Roaring 20s. In 1929, at the end of the period, aggregate debt amounted to some $170 billion,35 while Gross Savings were approximately $19.3 billion, resulting in a US Debt/CF ratio of 8.8x.
35As discussed in footnotes in the prior section, Credit Market Debt Outstanding data prior to 1952 requires estimation. In a paper written during the Depression, Irving Fisher utilized a figure of $200 billion for 1929 (a Debt/CF ratio of 10.4x). Fisher, I. (1933).The $170 billion utilised in this paper compares to a Mary Meeker estimate of approximately $190 billion (a Debt/CF of 10.0x). (interpolation from Meeker, M. A. (2011 February). U.S.A. Inc.: A Basic Summary of America's Financial Statements
October 2011
Bruce A Ramsay Copyright © 2011 Page 25
Unfortunately, US Gross Savings proved very unstable as the Depression unfolded, and fell rapidly to $3.3 billion by 1932. A recovery in Gross Savings to $9.6 billion by 1935 then occurred. This extreme volatility caused by the highly unstable Gross Savings is responsible for the spike in US Debt/CF to over 45x in 1932 and 1933. The ratio proceeded to fall successively to 23.7x in 1934, 16.1x in 1935, and 13.9x in 1936. Most of this decline was the result of improved Gross Savings, however, Total Country Debt outstanding did decline to $155 billion by 193536 as a result of extensive bank failures. By pre-‐war 1940, Gross Savings had recovered to $18.5 billion. Debt had grown only modestly to $167.9 billion. The US Debt/CF ratio declined to 9.1x. World War II efforts brought rapid debt growth, more than doubling outstanding debt. At the same time savings were high and grew such that the Debt/CF ratio rose only modestly, to 12.0x in 1945. A long, stable period of over 30 years accompanied the late 1940s until the late 1970s. From 1952 to 1969 the US Debt/CF ratio was very stable, averaging 7.0x, and staying within a tight range (a high of 7.5x and a low of 6.2x during the 18 year period). This stability continued even through recessions, the early Vietnam War and other macroeconomic events. Aggregate debt grew, but Gross Savings increased proportionately. During the 1970s, a period of considerable inflation occurred.37 The US debt/cash flow ratio increased to 8.18x for the decade. Various commentators have indicated the closing of the US Gold Window in 1971 as the source of both subsequent inflation and the escalation in leverage.38 During the 1980s, debt levels almost tripled, such that Total Country Debt outstanding was $13.8 trillion in 1990. A prominent feature of these years was the Savings & Loans Crisis.39 As this debt growth outstripped Gross Savings gains, US debt/CF ratio increased to an average 11.3x for the decade. The ratio escalated to reach 15.0x in 1990. The average ratio for the 1990s was 15.3x. During the 1990s, debt levels increased approximately 70%, however, Gross Savings almost doubled. Based on Gross Savings growth outweighing debt accumulation, year 2000 Debt/cash flow dropped to 13.0x. A significant disruption to the financial system and markets occurred in the 1990s when the Long Term Capital Management entity collapsed.40 In 2000, US Gross Savings were $1.8 trillion, but decreased to $1.7 trillion in 2010. Total Country Debt more than doubled during the 10 year period to $52.6 trillion in 2010. Notable asset price inflation (housing in particular) occurred as a result of the rapid accumulation of debt.xxi During 2008, the US banking system failed and was required to be ‘bailed out’ by the US Federal Government and the Federal Reserve. The 2010 Debt/Cash Flow ratio for the US was 30.9x, after reaching a modern era high of 34.1x in 2009. 36 An interpolation of the Mary Meeker estimate for 1935 debt approximated $165 billion. 37One explanation for inflation has been cited as “a process that begins with an increase in money and credit above what is needed for the production of goods and services” Boeckh, J. A. (2010) page 4. Other extreme aspects of inflation are expored in Sargent, T. J. (1981), The Ends of Four Big Inflations. 38 See for example Wikipedia. 39 The Savings and Loan Crisis required a government bailout of thrift institutions, announced by President Bush in February 1989 (www.FDIC.gov/bank/historical/s&l/). 40 The failure of a hedge fund Long Term Capital Management stemmed from Russian default on Ruble debts.
October 2011
Bruce A Ramsay Copyright © 2011 Page 26
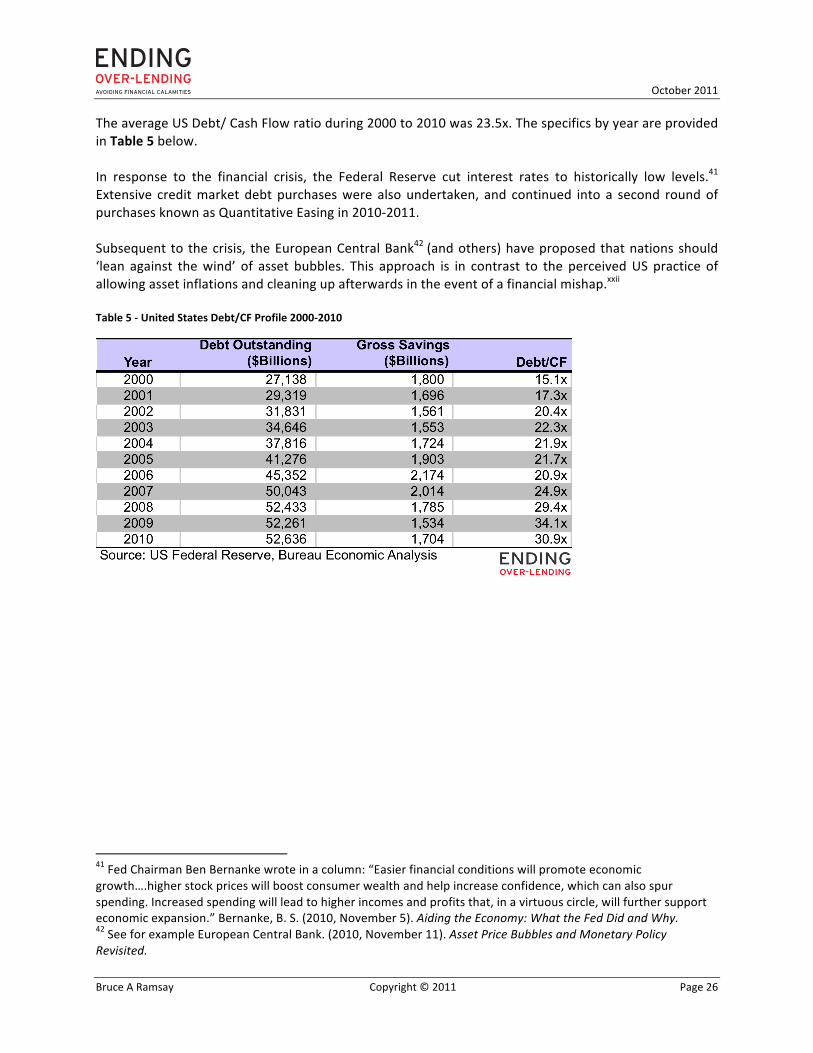
The average US Debt/ Cash Flow ratio during 2000 to 2010 was 23.5x. The specifics by year are provided in Table 5 below. In response to the financial crisis, the Federal Reserve cut interest rates to historically low levels.41 Extensive credit market debt purchases were also undertaken, and continued into a second round of purchases known as Quantitative Easing in 2010-‐2011. Subsequent to the crisis, the European Central Bank42 (and others) have proposed that nations should ‘lean against the wind’ of asset bubbles. This approach is in contrast to the perceived US practice of allowing asset inflations and cleaning up afterwards in the event of a financial mishap.xxii Table 5 -‐ United States Debt/CF Profile 2000-‐2010
41 Fed Chairman Ben Bernanke wrote in a column: “Easier financial conditions will promote economic growth….higher stock prices will boost consumer wealth and help increase confidence, which can also spur spending. Increased spending will lead to higher incomes and profits that, in a virtuous circle, will further support economic expansion.” Bernanke, B. S. (2010, November 5). Aiding the Economy: What the Fed Did and Why. 42 See for example European Central Bank. (2010, November 11). Asset Price Bubbles and Monetary Policy Revisited.
October 2011
Bruce A Ramsay Copyright © 2011 Page 27
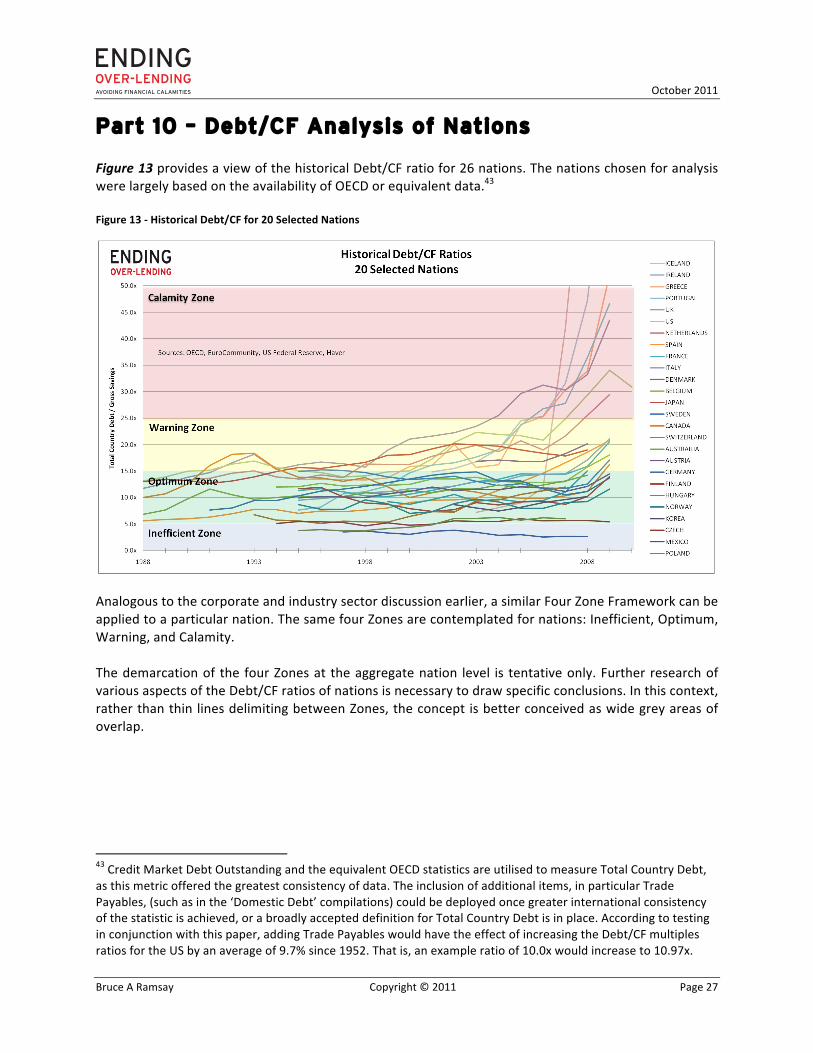
Part 10 – Debt/CF Analysis of Nations Figure 13 provides a view of the historical Debt/CF ratio for 26 nations. The nations chosen for analysis were largely based on the availability of OECD or equivalent data.43
Figure 13 -‐ Historical Debt/CF for 20 Selected Nations
Analogous to the corporate and industry sector discussion earlier, a similar Four Zone Framework can be applied to a particular nation. The same four Zones are contemplated for nations: Inefficient, Optimum, Warning, and Calamity. The demarcation of the four Zones at the aggregate nation level is tentative only. Further research of various aspects of the Debt/CF ratios of nations is necessary to draw specific conclusions. In this context, rather than thin lines delimiting between Zones, the concept is better conceived as wide grey areas of overlap.
43 Credit Market Debt Outstanding and the equivalent OECD statistics are utilised to measure Total Country Debt, as this metric offered the greatest consistency of data. The inclusion of additional items, in particular Trade Payables, (such as in the ‘Domestic Debt’ compilations) could be deployed once greater international consistency of the statistic is achieved, or a broadly accepted definition for Total Country Debt is in place. According to testing in conjunction with this paper, adding Trade Payables would have the effect of increasing the Debt/CF multiples ratios for the US by an average of 9.7% since 1952. That is, an example ratio of 10.0x would increase to 10.97x.
October 2011
Bruce A Ramsay Copyright © 2011 Page 28
As with a corporation, the Zones defined for a particular country would be related to that country’s particular circumstances. Contributing factors could include the country’s size, liquidity of its markets, stability of regime, savings versus consumption orientation, among other factors. Intuitively, countries with more diversified economies may be able to carry higher Debt/CF ratios than countries with narrower economies (e.g. commodity based countries like Canada and Australia). The Zone ranges chosen for the presentation of nations are those of the utility peer groups analyzed earlier. The argument for the similarity is based on utilities having relatively stable and consistent cash flow levels. Nations presumably enjoy some benefit of diversification of component cash flows, with the attendant benefit of reduced volatility of aggregate Gross Savings. Further study in this regard is required. For example, an argument could be advanced that the appropriate D/CF for a nation should reflect the weighted average D/CF of the component industry sectors. In the interim, adopting the Utility sector Zones as a ‘peer’ comparison to a nation is functional. Further ‘peers’ can be referenced for appropriate Zones for nations. Berkshire Hathaway, considered one of the best-‐managed companies in the world, averaged a Debt/CF ratio of 12.5x over the 10 years since 2001, and in 2010 the ratio was 11.7x.44 A nation may not be capable to manage affairs as well as Warren Buffet and his team, and therefore a more conservative (lower) Debt/CF target than 12.5x for a nation may be prudent. In Figures 14 through 17 the Debt/CF ratios for various countries are presented over time and segmented according to Zone.
44 Bershire Hathaway financial statements.
October 2011
Bruce A Ramsay Copyright © 2011 Page 29
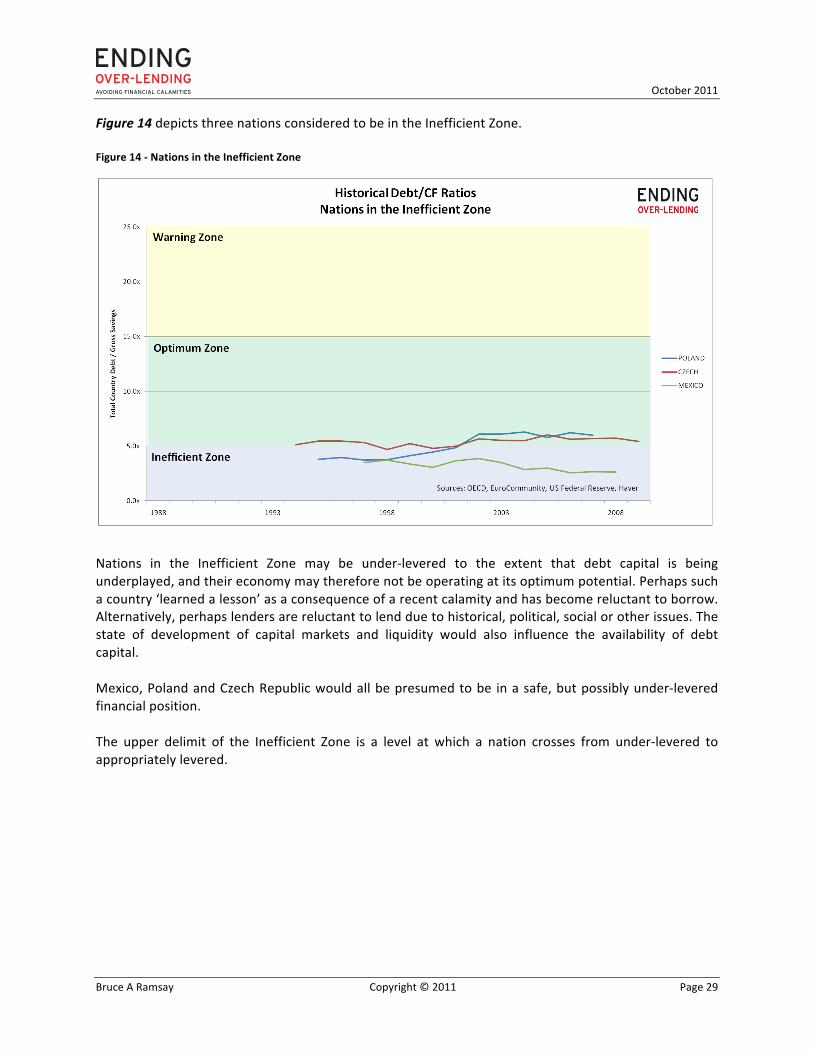
Figure 14 depicts three nations considered to be in the Inefficient Zone. Figure 14 -‐ Nations in the Inefficient Zone
Nations in the Inefficient Zone may be under-‐levered to the extent that debt capital is being underplayed, and their economy may therefore not be operating at its optimum potential. Perhaps such a country ‘learned a lesson’ as a consequence of a recent calamity and has become reluctant to borrow. Alternatively, perhaps lenders are reluctant to lend due to historical, political, social or other issues. The state of development of capital markets and liquidity would also influence the availability of debt capital. Mexico, Poland and Czech Republic would all be presumed to be in a safe, but possibly under-‐levered financial position. The upper delimit of the Inefficient Zone is a level at which a nation crosses from under-‐levered to appropriately levered.
October 2011
Bruce A Ramsay Copyright © 2011 Page 30
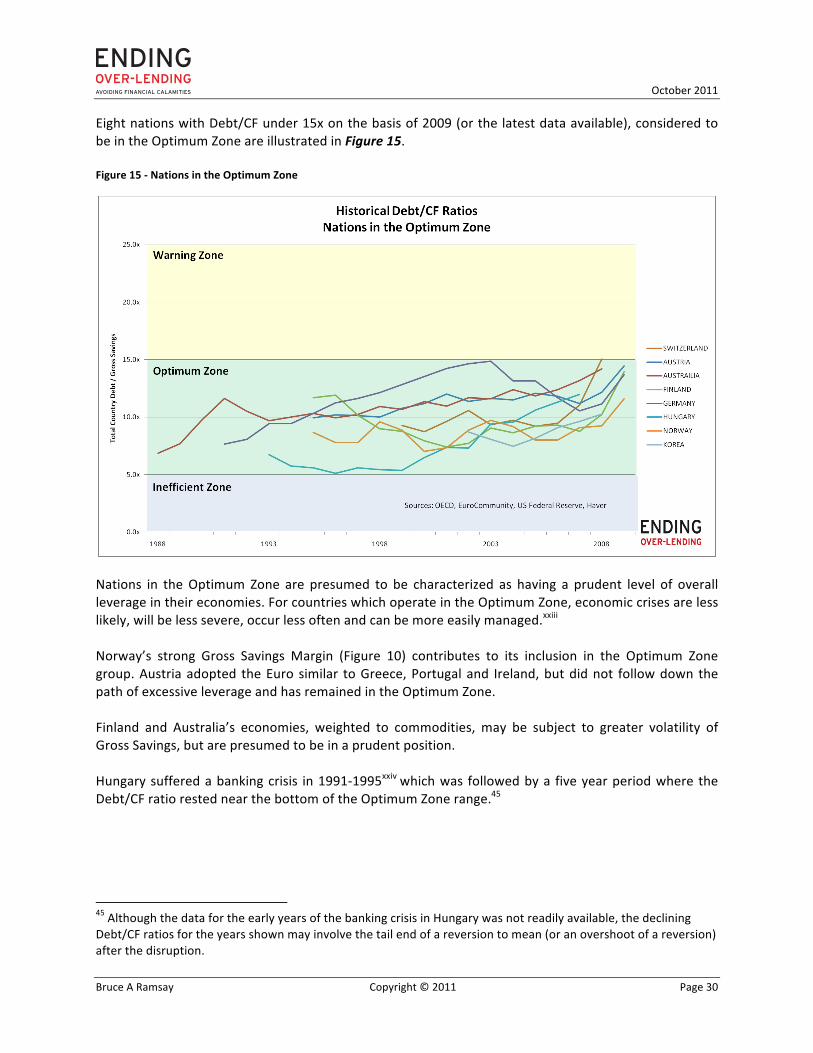
Eight nations with Debt/CF under 15x on the basis of 2009 (or the latest data available), considered to be in the Optimum Zone are illustrated in Figure 15. Figure 15 -‐ Nations in the Optimum Zone
Nations in the Optimum Zone are presumed to be characterized as having a prudent level of overall leverage in their economies. For countries which operate in the Optimum Zone, economic crises are less likely, will be less severe, occur less often and can be more easily managed.xxiii Norway’s strong Gross Savings Margin (Figure 10) contributes to its inclusion in the Optimum Zone group. Austria adopted the Euro similar to Greece, Portugal and Ireland, but did not follow down the path of excessive leverage and has remained in the Optimum Zone. Finland and Australia’s economies, weighted to commodities, may be subject to greater volatility of Gross Savings, but are presumed to be in a prudent position. Hungary suffered a banking crisis in 1991-‐1995xxiv which was followed by a five year period where the Debt/CF ratio rested near the bottom of the Optimum Zone range.45
45 Although the data for the early years of the banking crisis in Hungary was not readily available, the declining Debt/CF ratios for the years shown may involve the tail end of a reversion to mean (or an overshoot of a reversion) after the disruption.
October 2011
Bruce A Ramsay Copyright © 2011 Page 31
Although allocated to the Optimum Zone, at least two of these nations’ banking systems needed to be rescued at the peak of the 2008 financial crisis (Germany and Switzerland). Individual sectors within a country can be struggling, but the nation may be able to withstand a shock from a single segment. Germany and Switzerland experienced calamities within the financial sector (the international transmission of credit unworthiness), but were well enough positioned within the Optimum Zone to escape nation-‐wide calamity. The upper delimit of the Optimum Zone is a level at which a nation crosses from appropriately leveraged to being somewhat over-‐levered. Crossing this level acts as a nation’s first warning stage in the guard against adverse events. Part 3 reviewed the impacts of recessionary periods on Industry Groups. As is visibly evident in Figure 15, the recent Great Recession and 2008 financial collapse impacted nations in a similar macro fashion.xxv The countries depicted appear to collectively migrate from the 10x level pre-‐crisis, towards the 15x level.
October 2011
Bruce A Ramsay Copyright © 2011 Page 32
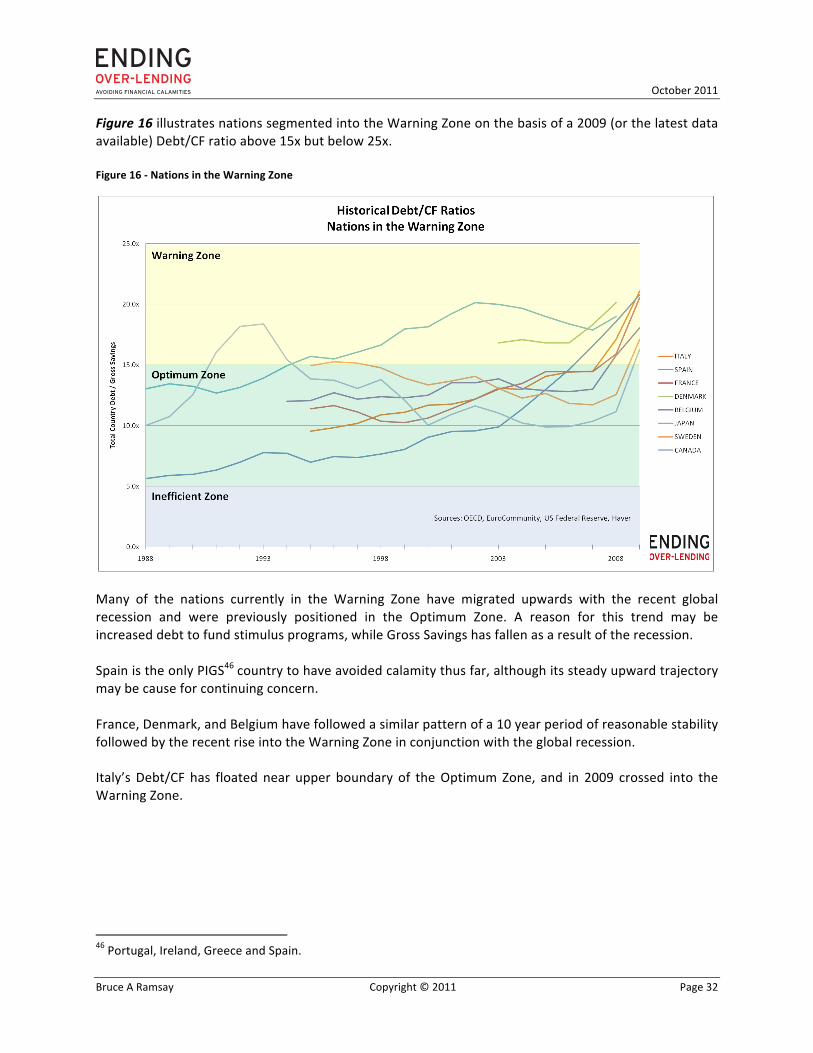
Figure 16 illustrates nations segmented into the Warning Zone on the basis of a 2009 (or the latest data available) Debt/CF ratio above 15x but below 25x. Figure 16 -‐ Nations in the Warning Zone
Many of the nations currently in the Warning Zone have migrated upwards with the recent global recession and were previously positioned in the Optimum Zone. A reason for this trend may be increased debt to fund stimulus programs, while Gross Savings has fallen as a result of the recession. Spain is the only PIGS46 country to have avoided calamity thus far, although its steady upward trajectory may be cause for continuing concern. France, Denmark, and Belgium have followed a similar pattern of a 10 year period of reasonable stability followed by the recent rise into the Warning Zone in conjunction with the global recession. Italy’s Debt/CF has floated near upper boundary of the Optimum Zone, and in 2009 crossed into the Warning Zone.
46 Portugal, Ireland, Greece and Spain.
October 2011
Bruce A Ramsay Copyright © 2011 Page 33
Japan was the first nation in the post war period to experience a ‘balance sheet recession’.xxvi Well documented corporate deleveraging in the mid-‐1990s xxvii assisted Japan in containing debt loads, however government debts continued to escalate. Throughout the period, Japan has maintained relatively high Gross Savings Margins (above 25%, see Figure 10) which has assisted in carrying the nation’s debt load. Canada previously entered the Warning Zone in the early 1990s. During this period, Canada’s federal government debt was roughly 70% of GDP and the budget deficit had peaked at 9.2% of GDP.xxviii The country lost its triple A debt rating with references made to Canada’s currency as a ‘northern peso’.47 Although depicted above as in a Warning Zone, Canada’s specific Zones may be relatively lower due to the commodity orientation of the economy (potential higher volatility) – the implication being that Canada may actually have been closer to the Calamity Zone than appears in Figure 16. Counter measures were taken in the mid-‐1990s and Canada steadied into the Optimum Zone for approximately 15 years. Canada re-‐entered the Warning Zone in conjunction with the 2008-‐2009 recession. Further research could assess whether a country is able to survive extended periods in the Warning Zone, with no further hardship. While the expectation for a collapse is progressively greater in the Warning and Calamity Zones, a financial calamity could in fact occur to a country in any Zone. Several authors have compiled tables listing nations which experienced financial calamity events through time.xxix These lists are very long, keep growing and show that the calamities of nations are not black swan events.xxx Some countries are able to support higher debt levels relative to others. At some point, however, excessive debt relative to cash flow may reach a tipping point,xxxi characterizing the ‘Minsky Moment’ when a country fails or falls into crisis, particularly after an extended period of speculation and unsustainable growth.xxxii
47 In reference to severe financial difficulties in Mexico in the same time frames.
October 2011
Bruce A Ramsay Copyright © 2011 Page 34
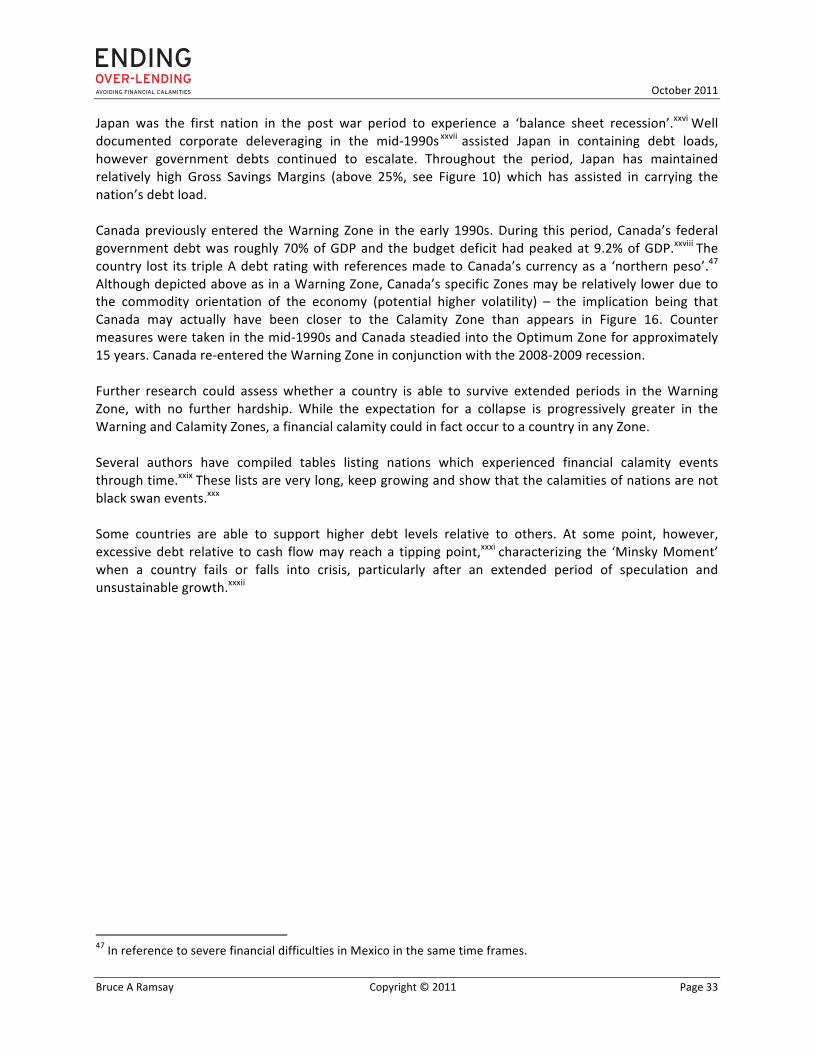
Figure 17 provides a grouping of countries with Debt/CF ratios of 25+, considered to be in the Calamity Zone. Figure 17 -‐ Nations in the Calamity Zone
All seven Nations allocated to the Calamity Zone have experienced calamities within the preceding three years.48 Iceland collapsed in dramatic fashion in 2008 as a result of an over extended banking system. Prophetically, three of the named PIGS nations are now fully engulfed in financial calamity (Greece, Ireland, and Portugal).49 These nations had gained a new level of credibility with the adoption of the Euroxxxiii as currency, and with eager investment banking assistance accumulated unsustainable debts.50 The remaining three Calamity Zone countries – Netherlands, UK and US – were all forced to rescue banking systems in the 2008 financial crisis, although a sovereign debt calamity has not occured.
48 Further research on Total Country Debts (all sectors) and Gross Savings of nations who historically have experienced a calamity, would provide useful data regarding the reversion to mean hypothesis proposed in this paper. (Sweden in the early 1990s for example). 49 In these cases, the European Union and International Monetary Fund have provided emergency funding, while forcing the implementation of austerity measures. 50 A stipulation to maintain deficits of not greater than 3% as part of adopting the Euro proved to be inadequate defence against over-‐leverage. Concepts of over-‐borrowing and over-‐lending may be exemplified here.
October 2011
Bruce A Ramsay Copyright © 2011 Page 35
The Netherlands is unique in this Calamity Zone group as the only nation to consistently have been a Net Lender rather than Net Borrower in recent years.51 The commonality of the remaining six nations suggests the usefulness of the Net Lending/Borrowing as a predictor of sovereign debt defaults. Another common factor among the group of nations are low or declining Gross Savings Margins. The United Kingdom has had a trend of escalating Debt/CF since the country departed the Optimum Zone in 1992. After twelve years in the Warning Zone, the UK became the first nation to cross into the Calamity Zone in 2004. The UK has been argued to have a high component of Financials sector debt as a proportion of overall debt, attributed to its off-‐shore banking role. As a consequence, a study by McKinsey Global Institute provided an alternate calculation for UK debt in which an amount equal to the banks foreign assets was deducted.xxxiv This methodology had the effect of reducing UK debt by 18%. Further study is required concerning this approach, but under such assumptions, the 2009 UK Debt/CF ratio would be reduced from 44.2x to 36.0x (i.e., still in the Calamity Zone).52 In the case of the US, as noted in Part 4, banking system Debt/CF ratios retrenched in the 2000-‐2002 period but began escalating again in 2003. Coincidentally, as the obverse of the same coin, Household debt levels expanded beyond prudent levels, as presented in Part 7. The US corporate sectors were largely prudently levered at the time, but the simultaneous collapse of the banking and housing sectors was catastrophic. The US crossed into the Warning Zone in 2000, and experienced its Calamity eight years later in 2008. Note that the US Debt/CF ratio declined from 2009 to 2010 and perhaps further declines could be attained. On average, 8.7 years transpired between the nations leaving the Optimum Zone until the Calamity occurred. The shortest of these was Iceland which collapsed within two years of departing the Optimum Zone.53 The longest running was the UK, which exited the Optimum Zone in 1992.54 Further research in this regard could assist in the development of more specific early warning tools. Beyond the monitoring and early warning attributes of the Debt/CF ratio, macro-‐prudential policies could be devised and deployed.55
51 Discussed in Part 8. 52 McKinsey itself presented counter arguments relating to the appropriateness of the adjustment. 53 Iceland implemented relaxed banking regulations in 2003, which set off a banking and borrowing bubble. The collapse occurred in 2008. Iceland’s Debt/CF was only 11.9x in 2006. The Gross Savings underlying this ratio were unsustainable and unstable, being based on the consumption of rapidly expanding credit and rely on high levels of Unearned GDP (Figure 11). 54 The most dangerous bubbles may tend to be those that accumulate slowly over long time periods. 55 Following the 2008 financial crisis, the need for new macro-‐prudential policies aimed to prevent bubbles has been called for by several groups, see for example Vinals, J. et al, (2010 October). IMF Staff Position Notes. www.imf.org
October 2011
Bruce A Ramsay Copyright © 2011 Page 36
PART 11 - Summary and Conclusions Debt/CF has been a long standing measurement tool to assess the borrowing capacity and financial health of corporations. Cash flow ratios including the Debt/CF ratio are known to be effective predictors of loan covenant violations and bankruptcy. The Debt/CF history of the US Household Sector presented in this document demonstrates the ubiquitous nature of the Debt/CF ratio as a measure of financial health. The author proposes the hypothesis that Debt/CF ratios can be applied to nations. Based on the results presented, the Debt/CF can be characterized as a simple, reliable, predictive metric that should be considered in assessing the financial health of a nation. The Four Zone Framework provides scope for the financial management of Households, Corporations, Financials, and Nations.56 The analysis supports the use of the Four Zone Framework as a means of delineating Debt/CF levels as prudent or problematic. The Debt/CF ratio can be used as a leading indicator to assess whether an entity is nearing a financial distress situation. The slope of the trajectory and level within the Zone framework should forewarn as to the severity of potential risks. The author also proposes that Debt/CF ratios tend to regress back to a mean level over time. These reversions may result from entities proactively managing their affairs (e.g. Households saving more and borrowing less), from the impositions of lenders and trustees (e.g. corporate Chapter 11 events), or from other causes. A study of utility companies has verified this hypothesis. The paper has shown a tendency for the time periods for Debt/CF cycles and reversions to be longer on average for nations than for corporations. Each country should consider establishing a target Optimum Zone. The lower bound of the Optimum Zone would be set at the Debt/CF ratio viewed as prudent and conservative leverage, but not under-‐levered. The upper bound would be determined by the country’s ability to safely mitigate the potential implications of an economic or monetary shock. Like other prudential macroeconomic tools, the Debt/CF ratio can be managed at the country level using policy levers (interest rates for example). Macro-‐prudential policies could be implemented to influence the Debt/CF of a nation to remain in an Optimum Zone of leverage. The author proposes that the Debt/CF ratio can be used to better manage the limits on the elasticity57 of the monetary system58. Further work will be undertaken by the author to put forth and substantiate this hypothesis. 56 Governments can be added to this list. 57 In 1913 President Woodrow Wilson signed into law the Federal Reserve Act to furnish an “elastic currency”. (The Federal Reserve System. Purposes & Functions June 2005, page 2). In essence, no macro-‐prudential policies have been implemented by the US to limit the stretching of the elastic system. 58 The monetary system includes both the money supply and credit. See for example Boeckh, J. A. (2010).
October 2011
Bruce A Ramsay Copyright © 2011 Page 37
The conclusions presented herein are preliminary and subject to further research and peer review. The author would appreciate the opportunity to review this concept with economic and monetary research organizations to solicit feedback and assess interest in furthering this research.
October 2011
Bruce A Ramsay Copyright © 2011 Page 38
References Bernanke, B. S. (2010 йил 5-‐November). Aiding the Economy: What the Fed Did and Why. From Federal Reserve: www.federalreserve.gov
Bernanke, B. S. (2000). Essays on The Great Depression. Princeton, NJ: Princeton University Press.
Blodget, H. (2009 йил 6-‐February). Debt-‐to-‐GDP Chart "Wrong," US Debt Levels Fine. From Business Insider, Clusterstock: www.businessinsider.com
Boeckh, J. A. (2010). The Great Reflation -‐ How Investors Can Profit From The New World of Money. Hoboken, New Jersey, US: John Wiley & Sons, Inc.
Bureau of Economic Analysis -‐ United States Department of Commerce. (n.d.). Integrated Macroeconomic Accounts for the Unitied States. From Bureau of Economic Analysis: www.bea.gov/National/nipaweb/Ni_FedBeaSna/Index.asp
Bureau of Economic Analysis -‐ United States Department of Commerce. (2010 йил November). Survey of Current Business. From Bureau of Economic Analysis: www.bea.gov/scb/
Bureau of the Census. (n.d.). Quarterly Financial Report. From U.S. Census Bureau: www.census.gov
Cook, D. M. (1995 йил 22-‐March). From AllBusiness, a D & B Company: www.allbusiness.com
Economic Report of the President. (1975). The Annual Report of the Council of Economic Advisors 1975. From www.fraser.stlouisfed.org/publications
European Central Bank. (2010 йил November). Asset Price Bubbles and Monetary Policy Revisited. From European Central Bank Montly Bullletin: www.ecb.int
Ferguson, N. (2008). The Ascent of Money A Financial Hostory of The World. New York, New York, US: The Penguin Group.
Financial Crisis Inquiry Commission. (2011). The Financial Crisis Inquiry Report. Washington, DC: U.S. Government Printing Office.
Fisher, I. (1933). The Debt-‐Deflation Theory of Great Depressions. From Fraser: Federal Reserve Archival System fro Economic Research: fraser.stlouisfed.org
Friedman, M., & Schwartz, A. J. (1963). A Monetary History Of The United Stated, 1867-‐1960. Princeton, NJ: Princeton University Press.
Friend, I., Minsky, H. P., & Andrews, V. L. (1964). Private Capital Markets -‐ A Series of Research Studies Prepared for The Commission On Money And Credit. Englewoods Cliff, NJ: Prentice Hall Inc.
October 2011
Bruce A Ramsay Copyright © 2011 Page 39
Gilbert, G., & Guengant, A. (2002). The Public Debt of Local Governments in France. In B. Dafflon (Ed.), Local Public Finance in Europe. Cheltenham, UK: Edward Elgar Publishing Limited.
Gros, D. (2010 йил 29-‐Jan). Greek burdens ensure some Pigs won't fly. Financial Times .
Heaney, V. (2010 йил 28-‐March). Ask not what to cut, but what to keep. From FT.com Financial Times: www.ft.com
International Monetary Fund. (2010 йил Oct). Global Financial Stability Report -‐ Sovereigns, Funding, and Systemic Liquidity. From International Monetary Fund: www.imf.org/external/pubs/ft/gfsr/2010/02
Johnson, S. (2011 йил 28-‐July). Which Is in Worse Shape, U.S. or Europe? From The New York Times, Economix: www.economix.blogs.nytimes.com
Keen, S. (2004). Debunking Economics -‐ The Naked Emperor Of The Social Sciences. New York, NY: Zed Books Ltd.
Koo, R. C. (2008). The Holy Grail of Macro Economics -‐ Lessons From Japan's Great Recession. Singapore: John Wiley & Sons (Asia) Pte. Ltd.
Krugman, P. (2009 йил 6-‐September). How Did Economists Get It So Wrong. From The New York Times: www.nytimes.com/2009/09/06/magazine/06Economic-‐t.html?_r+1&em
Krugman, P. (2009). The Return of Depression Economics and the Crisis of 2008. New York, New York, US: W.W. Norton & Company, Inc.
McKinsey Global Institute. (2010 йил January). Debt and deleveraging: The global credit bubble and its economic consequences. From McKinsey Global Institute: http://www.mckinsey.com/mgi/
Meeker, M. A. (2011 йил February). U.S.A. Inc.: A Basic Summary of America's Financial Statements. From KCPB: http://www.kpcb.com/usainc/USA_Inc.pdf
Miller, M. (2002). Selected Works of Meton H. Miller: A Celebration of Markets: Volume 1: Finance. (B. D. Grundy, Ed.) Chicago, Illinois, U.S.: University of Chicago Press, 1 Edition.
Minsky, H. P. (1992 йил May). The Financial Instability Hypothesis. From Levy Economics Institute of Bard Colege: www.levyinstitute.org/pubs/wp74.pd
Noland, D. (2003 йил 21-‐February). Fiat Money and Credit Inflation in America. From Safehaven: www.safehaven.com
OECD. (n.d.). Statistics. From OECD: www.oecd.org via haverselect.com
Reinhard, C. M., & Rogoff, K. S. (2009). This Time is Different -‐ Eight Centuries of Financial Folly. Princton, NJ: Princeton University Press.
October 2011
Bruce A Ramsay Copyright © 2011 Page 40
Sargent, T. J. (1981 йил May). The Ends of Four Big Inflations. From Federal Reserve Bank of Minneapolis: www.minneapolisfed.org
Shiller, R. J. (2011 йил 30-‐April). Needed: A Clearer Crystal Ball. The New York Times .
Shilling, A. G. (2011). The Age of Deleveraging: Investment Strategies for a Decade of Slow Growth and Deflation. Hoboken, New Jersey, U.S.: John Wiley & Sons, Inc.
Sufi, A. (2007 йил 31-‐January). Bank Lines of Credit in Corporate Finance: An Empirical Analysis. From Oxford Journals: www.rfs.oxfordjournals.org
Taleb, N. N. (2007). The Black Swan: The Impact of the Highly Improbable. New York, NY: Random House Inc.
The Federal Reserve System. (2011). Flow of Funds Accounts of the United States -‐ Flows and Outstandings Fourth Quarter 2010. From Board of Governors of the Federal Reserve System: www.federalreserve.gov
The Federal Reserve System. (2005 йил June). The Federal Reserve System Purposes & Functions. From Board of Governors of the Federal Reserve System: www.federalreserve.gov/pf/pdf/pf_1.pdf
The National Bureau of Economic Research. (2010 йил 20-‐September). US Business Cycle Expansions and Contractions. From www.nber.org/cycles/cyclesmain.html
Transcript. (2008 йил 24-‐September). President Bush's Speech to the Nation on the Economic Crisis. From The New York Times: www.nytimes.com
Vinals, J. (2010 йил 20-‐July). A Marriage Mede in Heaven or Hell: Monetary and Financial Stability. From The International Monetary Fund's Global Economy Forum: www.blog-‐imfdirect.imf.org
Vinals, J., Fiechter, J., Pararbasioglu, C., Kodress, L., Narain, A., & Moretti, M. (2010 йил 3-‐October). IMF Staff Position Notes. From International Monetary Fund: www.imf.org
White, W. (2009 йил December). Finance & Development Dec 2009. From International Monetary Fund: www.imf.org/external/pubs/ft/fandd/2009/12/white.htm
October 2011
Bruce A Ramsay Copyright © 2011 Page 41
Notes i (Reinhard & Rogoff, 2009) ii (Shiller, 2011) iiiSee for example (European Central Bank, 2010), page 76 ivSee for example (Krugman, How Did Economists Get It So Wrong, 2009) . Also see, The US Financial Crisis Inquiry Report, which concluded “the failures of credit rating agencies were essential cogs in the wheel of financial destruction” (Financial Crisis Inquiry Commission, 2011), page xxv v (McKinsey Global Institute, 2010) vi (Sufi, 2007) vii See for example (Cook, 1995) viii (Bureau of the Census) ix(Bernanke, Essays on The Great Depression, 2000), page 47 x (Bureau of Economic Analysis -‐ United States Department of Commerce) xi (Miller, 2002) xii (Reinhard & Rogoff, 2009), p. 59 xiii One publication located included an analysis utilizing, in part, the debt to gross savings ratios of municipalities in France (Gilbert & Guengant, 2002). A Financial Times article by Daniel Gross entitled ‘Greek burdens ensure some PIGS won’t fly’ commented that gross national savings rates are relevant to the ability to service debts. (Gros, 2010) xiv (International Monetary Fund, 2010), page 100 xv See for example (Reinhard & Rogoff, 2009), page 277 xvi See for example (McKinsey Global Institute, 2010) xvii (OECD) xviii (The Federal Reserve System, 2011) xix (Blodget, 2009) xx See for example (McKinsey Global Institute, 2010), page 59. xxi See for example (Boeckh, 2010) page 101 xxii (European Central Bank, 2010), page 72 xxiii Source subject to confirmation xxiv (Reinhard & Rogoff, 2009), page 367 xxv (Bernanke, Essays on The Great Depression, 2000), page 47 xxvi (Koo, 2008), page 173 xxvii (Koo, 2008), page 12 xxviii (Heaney, 2010) xxix See for example (Reinhard & Rogoff, 2009) xxx (Taleb, 2007) xxxi (Fisher, 1933) page 339 xxxii Investopedia.com xxxiii Concept from (Reinhard & Rogoff, 2009). xxxiv (McKinsey Global Institute, 2010) page 56