Embed Size (px)
Citation preview
PNNL-24043
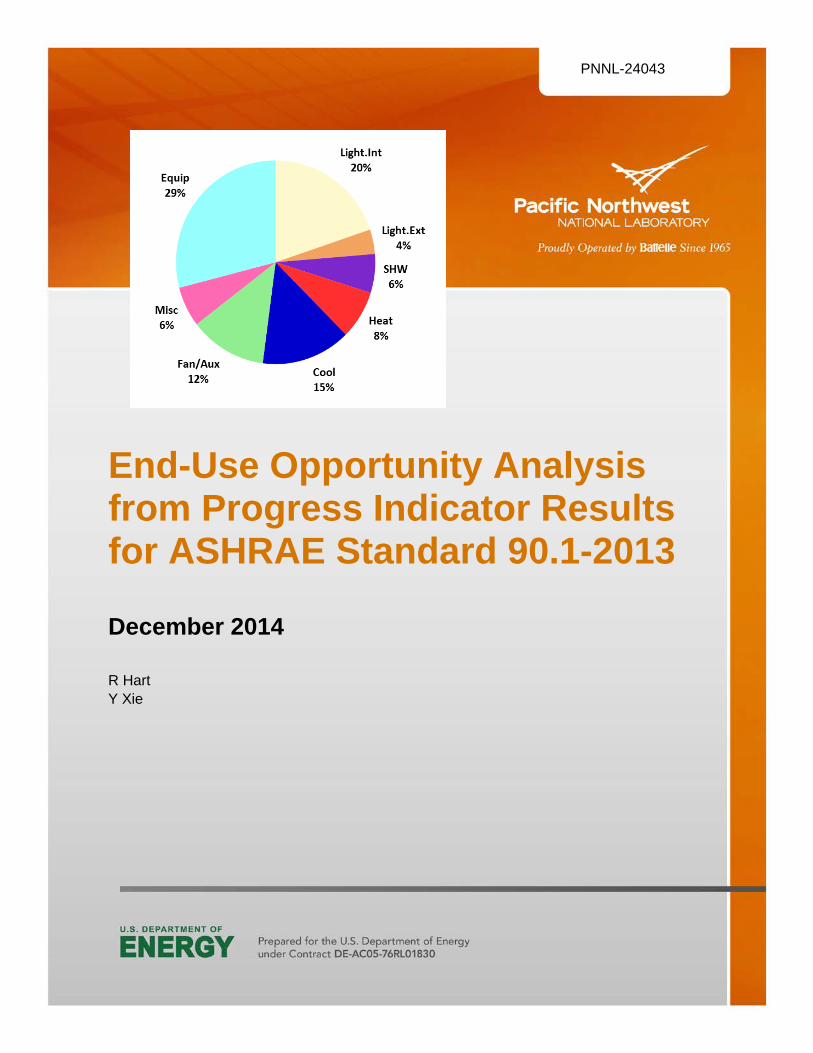
End-Use Opportunity Analysis from Progress Indicator Results for ASHRAE Standard 90.1-2013
December 2014
R Hart Y Xie


PNNL-24043
End-Use Opportunity Analysis from Progress Indicator Results for ASHRAE Standard 90.1-2013 R Hart Y Xie December 2014 Prepared for the U.S. Department of Energy under Contract DE-AC05-76RL01830 Pacific Northwest National Laboratory Richland, Washington 99352


iii
Summary
This report and an accompanying spreadsheet posted online1 compile the end use building simulation results for prototype buildings throughout the United States. The results represent the energy use of each edition of ANSI/ASHRAE/IES2 Standard 90.1, Energy Standard for Buildings Except Low-Rise Residential Buildings. Pacific Northwest National Laboratory examined the simulation results to determine how the remaining energy was used.
Figure S.1 shows end-use cost data by building type weighted by national construction by climate zone. Prototype results are grouped by similar type, including Office, Warehouse (Wh), Retail, Hotel, Apartment (Apt), School, Medical, and Food Service (Food Svc). The widths of the building type (vertical) bars are scaled to represent each building type’s share of impact on national building energy cost. The end uses include heating, ventilation, and air conditioning (HVAC) fans and pumps (Fan Aux), Cooling (Cool), Heating (Heat), service hot water (SHW), interior lighting (Light Int), exterior lighting (Light Ext), miscellaneous loads including refrigeration, elevators and transformers (Misc), and plug loads, cooking, and information technology (IT) equipment (Equip). The area of each block represents the proportion of national energy cost for each end use. The entire width of the plot matches national building energy use based on Standard 90.1-2013.
1 PNNL. 2014. 2013EndUseTables.xlsx. Pacific Northwest National Laboratory, Richland, WA. Available at http://www.energycodes.gov/sites/default/files/documents/2013EndUseTables.zip. 2 ANSI – American National Standards Institute; ASHRAE – American Society of Heating, Refrigerating, and Air- Conditioning Engineers; IES – Illuminating Engineering Society

iv
Figure S.1. Commercial energy cost impact by end use U.S. weighted, after 90.1-2013

v
Acknowledgments
The data that was used as the basis for this end use analysis was developed by the Pacific Northwest National Laboratory codes team for the 2013 progress indicator that measured improvements in the ANSI/ASHRAE/IES Standard 90.1-2013 vs. earlier editions of Standard 90.1. Their long-term work on development and enhancement of the building prototypes used in that analysis made this report possible. Team members include Michael Rosenberg, Mark Halverson, Raul Athalye, YuLong Xie, Weimin Wang, Jian Zhang, Supriya Goel, and Vrushali Mendon, with team leadership by Bing Liu and Jamie Holladay. Editing was provided by Mike Parker and Matt Wilburn. Members of the ASHRAE Standing Standards Project Committee 90.1 provided valuable feedback to development of the prototypes and typical buildings, and funding was provided by the U.S. Department of Energy.


vii
Acronyms and Abbreviations
ANSI American National Standards Institute ASHRAE American Society of Heating, Refrigerating, and Air-Conditioning Engineers BECP Building Energy Codes Program CZ climate zone ECI energy cost index EUI energy use index HVAC heating, ventilation, and air conditioning IES Illuminating Engineering Society IT information technology MHC McGraw-Hill Construction PNNL Pacific Northwest National Laboratory SSPC Standing Standard Project Committee WBCI weighted building cost index


ix
Contents
Summary ...................................................................................................................................................... iii Acknowledgments ......................................................................................................................................... v Acronyms and Abbreviations ..................................................................................................................... vii Background and Method ............................................................................................................................... 1
End Uses Analyzed ............................................................................................................................... 1 Prototype Buildings for the Progress Indicator .................................................................................... 1 Detailed Tables and Lists ..................................................................................................................... 3
Cost Breakdown Results ............................................................................................................................... 4 U.S. End-Use Cost Breakdown, 90.1-2013 .......................................................................................... 5
U.S. Weighted Cost by End Use, 2004 vs. 2013 .......................................................................... 6 U.S. Weighted Cost Impact by Building Type and End Use, 2013 Base ..................................... 7 U.S. Weighted Cost Impact by Building Type and End Use, 2004 Base ..................................... 8
U.S. Weighted End-Use Prioritization .................................................................................................. 9 Segment Graphs .................................................................................................................................. 10
Segment Graphs, ECI Weighted for Climate ............................................................................. 10 Segment Graphs, ECI by Climate with Scaled Food Equipment ............................................... 11 Segment Graphs, ECI Weighted for U.S. Construction ............................................................. 12
U.S. Weighted Sorted End Use ECI, with Building Splits ................................................................. 13 Total U.S. Energy Cost by Building Type .......................................................................................... 14 Focus Potential Score ......................................................................................................................... 14 HVAC by Climate Zone ..................................................................................................................... 16
HVAC Building ECI by Numerical Climate Zone and Space Conditioning Category .............. 17 HVAC Weighted Cost Impact by Numerical Climate Zone and Space Conditioning Category 18 Heating ECI Detail by Climate Zone ......................................................................................... 19 Cooling ECI Detail by Climate Zone ......................................................................................... 20
Construction Weightings by Building Type and Climate Zone ......................................................... 21 References ................................................................................................................................................... 22 Appendix A – Heat Maps ......................................................................................................................... A.1 Appendix B – End-Use Energy Cost by Building Type ............................................................................B.1

x
Figures
Figure 1. Prototypes analyzed for the end-use dataset ................................................................................. 3 Figure 2. End-use cost for buildings in all U.S. climate zones .................................................................... 5 Figure 3. Detailed end-use cost for buildings in all U.S. climate zones ...................................................... 5 Figure 4. Standard 90.1 end-use cost improvement ..................................................................................... 6 Figure 5. Commercial energy cost impact by end use U.S. weighted, after 90.1-2013 ............................... 7 Figure 6. Commercial energy cost impact by end use U.S. weighted (90.1-2004). ..................................... 8 Figure 7. U.S. building energy cost by end use prioritized by post-2013 cost ............................................ 9 Figure 8. U.S. ECI of building end uses, after 90.1-2013 .......................................................................... 10 Figure 9. U.S. ECI of building end uses, after 90.1-2013 (Cooking NTS). ............................................... 11 Figure 10. U.S. WBCI of building end uses, after 90.1-2013. ................................................................... 12 Figure 11. U.S. commercial energy cost impact by end use ...................................................................... 13 Figure 12. Total Standard 90.1-2013 vs 90.1-2004; U.S. energy cost ....................................................... 14 Figure 13. Total end-use “Focus Potential Scores,” prioritized ................................................................. 15 Figure 14. Building ECI heating and cooling by climate zone (CZ) ......................................................... 16 Figure 15. Weighted impact of climate zone heating and cooling on U.S. heating and cooling costs ...... 16 Figure 16. Total (a) heating and (b) cooling ECI by climate zone............................................................. 17 Figure 17. Weighted impacts on total U.S. (a) heating and (b) cooling costs ............................................ 18
Tables
Table 1. Simple and detailed end-use category descriptions ....................................................................... 1 Table 2. ASHRAE commercial prototype building models ......................................................................... 2 Table 3. Impact percent of U.S. building energy cost remaining after 90.1-2013 ....................................... 9 Table 4. Focus potential scoring method factors ....................................................................................... 14 Table 5. Total end-use “Focus Potential Scores” ....................................................................................... 15 Table 6. Heating ECI detail by climate zone ............................................................................................. 19 Table 7. Cooling ECI detail by climate zone ............................................................................................. 20 Table 8. U.S. new construction weighting (basis 2003 to 2007 MHC database) ....................................... 21

1
Background and Method
End Uses Analyzed
Pacific Northwest National Laboratory (PNNL) conducts analysis to project the energy use of each edition of ANSI/ASHRAE/IES1 Standard 90.1, Energy Standard for Buildings Except Low-Rise Residential Buildings (ASHRAE 2004, 2007, 2010, 2013). The comparison of the savings of each edition to the prior edition is called the “progress indicator.” Based on analysis of the Standard 90.1-2013 (ASHRAE 2013) progress indicator, PNNL examined the detailed results to determine how the remaining energy was used. Where helpful, miscellaneous (e.g., elevator) and equipment (cooking and information technology [IT] equipment) results were extracted to increase the precision of end-use categories. This report provides analysis results using the simple and detailed breakdowns as shown in Table 1.
Table 1. Simple and detailed end-use category descriptions
Simple Breakdown
Abbreviation
Color Code
Detailed Breakdown
Abbreviation End-Use Description Light.int Light.int Interior lighting Light.ext Light.ext Exterior lighting SHW SHW Service hot water Heat Heat Space heating
Humidify Humidification (dehumidification in heat and cool) Cool Cool Mechanical cooling (including unitary heat rejection)
Ht.Rej Heat rejection, cooling towers (unitary is in cool) Fan.Aux Fans Heating, ventilation, and air conditioning (HVAC) supply, return and
exhaust fans Ht.Rcvy Heat recovery fan and wheel energy Pumps Hydronic pumping, including SHW recirculation
Misc Refrig Refrigeration equipment and kitchen refrigerators and freezers Elevator Elevators Txfmr In-building transformers
Equip Cook Cooking equipment IT Computer room IT and telephone equipment Equip Other plug loads and equipment including non-kitchen refrigerators
The graphs in this report are based on energy cost index (ECI) and most use the simple breakdown.
Prototype Buildings for the Progress Indicator
To determine the savings impact from various editions of ANSI/ASHRAE/IES Standard 90.1, PNNL developed prototype commercial building models. They have been described in detail previously in Achieving the 30% Goal: Energy and Cost Savings Analysis of ASHRAE Standard 90.1-2010 (Thornton et al. 2011). As noted in that report, PNNL developed a suite of 16 prototype buildings covering the majority of the commercial building stock and mid-rise to high-rise buildings. The prototypes used in the
1 American National Standards Institute/American Society of Heating, Refrigerating, and Air-Conditioning Engineers/Illuminating Engineering Society of North America.

2
simulations are intended to represent a cross section of common commercial building types and cover the building types that comprise 80% of new commercial construction floor area. The 16 prototype building models were reviewed extensively by building industry experts on the ASHRAE Standing Standard Project Committee (SSPC) 90.1 during development and assessment of multiple editions of Standard 90.1. These prototype models, their detailed characteristics, and their development are described in detail on the Building Energy Codes Program (BECP) web site.2 A detailed description of the prototypes may also be found in the completed savings analysis of Standard 90.1-2010: Energy and Cost Savings Analysis of ASHRAE Standard 90.1-2010, which can be found on the BECP web site.3 The prototype models described in that report have since been modified as described in the document Enhancements to ASHRAE Standard 90.1 Prototype Building Models (PNNL 2014b), also available at the same web site.
The energy analysis of the 16 prototype buildings shown in Table 2 was completed with the EnergyPlus building simulation program (DOE 2013). The results from that analysis are further analyzed to produce this end-use analysis. Each prototype building model is defined as characteristic of a certain class of buildings, mostly corresponding to a classification scheme established in the 2003 DOE/Energy Information Administration Commercial Building Energy Consumption Survey (EIA 2003). Building configurations of the prototype models are shown in Figure 1.
Table 2. ASHRAE commercial prototype building models
Building Type Prototype building Prototype
Abbreviation
Prototype Floor Area
(ft2)
Office Small Office OfcS 5,502 Medium Office OfcM 53,628
Large Office OfcL 498,588 Retail Stand-Alone Retail RtlB 24,692
Strip Mall RtlS 22,500 School Primary School SchP 73,959
Secondary School SchS 210,887 Medical Outpatient Health Care MedC 40,946
Hospital MedH 241,501 Hotel Small Hotel HotS 43,202
Large Hotel HotL 122,120 Warehouse Non-Refrigerated Warehouse Whse, Wh 52,045 Food Service Fast Food Restaurant Fast 2,501
Sit-Down Restaurant Rest 5,502 Apartment Mid-Rise Apartment AptM 33,741
High-Rise Apartment AptH 84,360
2 Prototype detail on BECP web site at www.energycodes.gov/development/commercial/90.1_models. 3 BECP web site at www.energycodes.gov/achieving-30-goal-energy-and-cost-savings-analysis-ashrae-ASHRAE Standard-901-2010.

3
Figure 1. Prototypes analyzed for the end-use dataset
Detailed Tables and Lists
In addition to the graphs included here, an Excel workbook with detailed results for each prototype at the detailed end-use level is available online (PNNL 2014a).4 That workbook contains a worksheet for each prototype and a matrix of tables with summary national results and detailed results for each climate zone. In addition to ECI, site energy use index (EUI) results, source EUI results, and gas and electric end-use results are included. The workbook also contains the following tables:
• U.S. average summary results, based on construction weighting,
• climate zone detail for Standard 90.1 in 2004, 2007, 2010, and 2013, and
• percentage savings from Standard 90.1-2004 to 90.1-2013.
The workbook also includes a worksheet (i.e., the “DetPri” tab) that provides all detailed ECIs by end use and prototype, sorted by remaining use after Standard 90.1-2013 and sorted by savings from Standard 90.1-2013 when compared to 90.1-2004.
4 Available at http://www.energycodes.gov/sites/default/files/documents/2013EndUseTables.zip.

4
Cost Breakdown Results
The resulting data from the analysis is presented in one of several ways:
• Weighted by U.S. 2003-2007 new construction to give an idea of the impact on total U.S. commercial energy cost (Jarnagin and Bandyopadhyay 2010). Such weightings are usually for the nation as a whole, but may focus on energy cost for a particular climate zone. The weightings are based on factors shown in Table 8. Where results are noted as weighted by building type, this data is used. While the data is from early in the first decade of this millennium, it avoids the economic and construction downturn that would be inherent in more recent data.
• Partial weighting is applied to subset building prototypes to arrive at the use and cost breakdown for a building type. For instance, to find the end-use costs for the Office type, the end-use costs for the large, medium, and small offices are weighted proportionally by the individual prototype construction weightings.
• Unweighted results represent the end-use cost experienced by a particular building type and provide a good idea of the ECI on a floor area basis.
Throughout, the cost is based on the energy rates from the Scalar Method for Standard 90.1-2013 proposal analysis: 0.1032/kWh for electricity and $0.99/therm for fossil fuels.5
5 The ASHRAE Scalar Method identifies a fossil fuel rate that is primarily applied to heating energy use. For this reason, the fossil fuel rate is a blended heating rate and includes proportional (relative to national heating fuel use) costs for natural gas, propane, heating oil, and electric heat. Heating energy use in the prototypes for fossil fuel equipment is calculated in therms based on natural gas equipment, but in practice, natural gas equipment may be operated on propane, or boilers that are modeled as natural gas may use oil in some regions.
5
U.S. End-Use Cost Breakdown, 90.1-2013
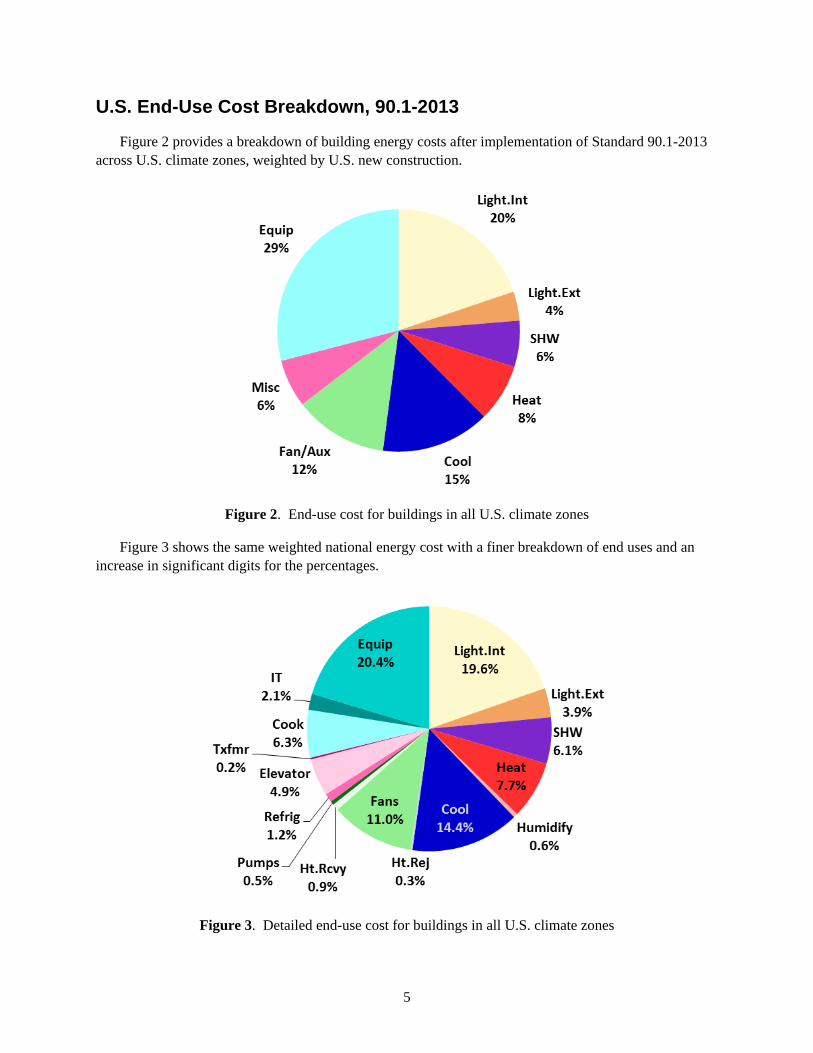
Figure 2 provides a breakdown of building energy costs after implementation of Standard 90.1-2013 across U.S. climate zones, weighted by U.S. new construction.
Figure 2. End-use cost for buildings in all U.S. climate zones
Figure 3 shows the same weighted national energy cost with a finer breakdown of end uses and an increase in significant digits for the percentages.
Figure 3. Detailed end-use cost for buildings in all U.S. climate zones

6
U.S. Weighted Cost by End Use, 2004 vs. 2013
Total U.S. weighted end-use building energy costs can be directly compared for Standards 90.1-2004 and 90.1-2013 (see Figure 4). Most categories show significant reduction; however, the cost reductions for equipment, miscellaneous, and service hot water were not significant.
Figure 4. Standard 90.1 end-use cost improvement
7
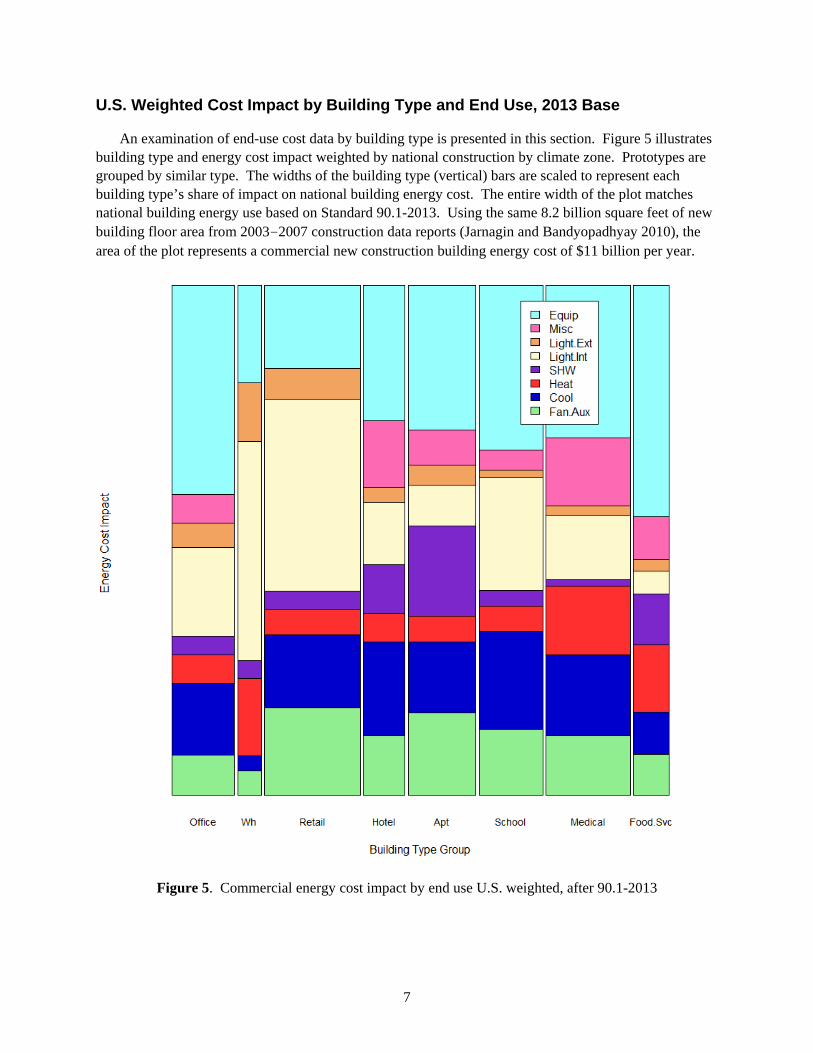
U.S. Weighted Cost Impact by Building Type and End Use, 2013 Base
An examination of end-use cost data by building type is presented in this section. Figure 5 illustrates building type and energy cost impact weighted by national construction by climate zone. Prototypes are grouped by similar type. The widths of the building type (vertical) bars are scaled to represent each building type’s share of impact on national building energy cost. The entire width of the plot matches national building energy use based on Standard 90.1-2013. Using the same 8.2 billion square feet of new building floor area from 2003-2007 construction data reports (Jarnagin and Bandyopadhyay 2010), the area of the plot represents a commercial new construction building energy cost of $11 billion per year.
Figure 5. Commercial energy cost impact by end use U.S. weighted, after 90.1-2013

8
U.S. Weighted Cost Impact by Building Type and End Use, 2004 Base
Figure 6 shows the same nationally weighted results after Standard 90.1-2013 against a base of Standard 90.1-2004. Again, the widths of the building type (vertical) bars are scaled to represent each building type’s share of impact on national building energy cost. The entire area of the plot matches national building energy cost based on Standard 90.1-2004, or $15.5 billion. The white savings blocks show the difference for 90.1-2013 compared to 90.1-2004, which amounts to $4.5 billion per year. So, we can see both the savings from the stable 2004 baseline and the remaining energy cost after 90.1-2013.
Figure 6. Commercial energy cost impact by end use U.S. weighted (90.1-2004).
White area represents savings from 90.1-2004 to 2013

9
U.S. Weighted End-Use Prioritization
Figure 7 shows overall progress by detailed end use, measured as cost savings from Standard 90.1-2004 to Standard 90.1-2013. The information is prioritized for end uses by national weighted building energy impact or percentage of U.S. total building use after Standard 90.1-2013.
Figure 7. U.S. building energy cost by end use prioritized by post-2013 cost
Table 3 shows the breakdown by building type, with remaining energy cost after Standard 90.1-2013. Red indicates highest remaining cost impact, and white represents lowest remaining cost impact. Appendix A includes more detailed heat maps of costs and cost savings from Standard 90.1-2004 to Standard 90.1-2013.
Table 3. Impact percent of U.S. building energy cost remaining after 90.1-2013
Light.Int Light.Ext SHW Heat Cool Fan.Aux Misc Equip
Total
Office 2.3% 0.6% 0.5% 0.7% 1.8% 1.0% 0.7% 5.4%
13.1% Warehouse 2.1% 0.6% 0.2% 0.8% 0.1% 0.2% 0.0% 0.9%
5.0%
Retail 7.6% 1.2% 0.7% 1.0% 2.9% 3.5% 0.0% 3.3%
20.2% Hotel 1.1% 0.3% 0.8% 0.5% 1.6% 1.0% 1.1% 2.3%
8.8%
Apt 1.1% 0.6% 2.5% 0.7% 2.0% 2.3% 1.0% 4.0%
14.3% School 3.0% 0.2% 0.4% 0.6% 2.6% 1.7% 0.5% 4.3%
13.5%
Medical 2.2% 0.3% 0.2% 2.4% 2.8% 2.1% 2.3% 5.3%
17.6% Food.Svc 0.3% 0.2% 0.8% 1.0% 0.6% 0.6% 0.6% 3.4%
7.6%
U.S. Weighted 19.8% 3.9% 6.2% 7.7% 14.5% 12.5% 6.4% 29.0%
100%

10
Segment Graphs
Segment Graphs, ECI Weighted for Climate
The segment graphs for each building type (see Figure 8) show the relative end uses based on individual building ECI. Because they are weighted by climate zone construction, they represent national averages. The radius of each segment is proportional to the end-use ECI ($/ft2/yr) for the building type shown, relative to the largest building end-use ECI in the data set. On this graph, most building graphs are quite small, but we can see the very high equipment, heating, and service water heating intensity in the food service sector. Following graphs show the other buildings and uses at a more readable scale.
Figure 8. U.S. ECI of building end uses, after 90.1-2013

11
Segment Graphs, ECI by Climate with Scaled Food Equipment
Figure 9 is based on the same data as Figure 8 and shows the food service equipment (primarily cooking) at one-fourth the scale of the other segments. The radius of each segment is proportional to the end-use ECI for the building type shown, relative to the largest full-scale building end-use ECI in the data set (Food.Svc heat).
Figure 9. U.S. ECI of building end uses, after 90.1-2013 (Cooking NTS).
(Food service equipment is shown at 25% of actual scale.)

12
Segment Graphs, ECI Weighted for U.S. Construction
When individual building ECI results are weighted by each building’s share of new construction floor area (see Figure 10), the impact on total U.S. commercial building cost by type and end use becomes apparent. This result can be referred to as the weighted building cost index (WBCI). Retail interior lighting has the largest contributing end use. Equipment dominates in most other areas; however, service water heating captures a large segment of contributing end use for apartments.
Figure 10. U.S. WBCI of building end uses, after 90.1-2013.
(WBCI = weighted building cost impact or contribution to total energy cost)
13
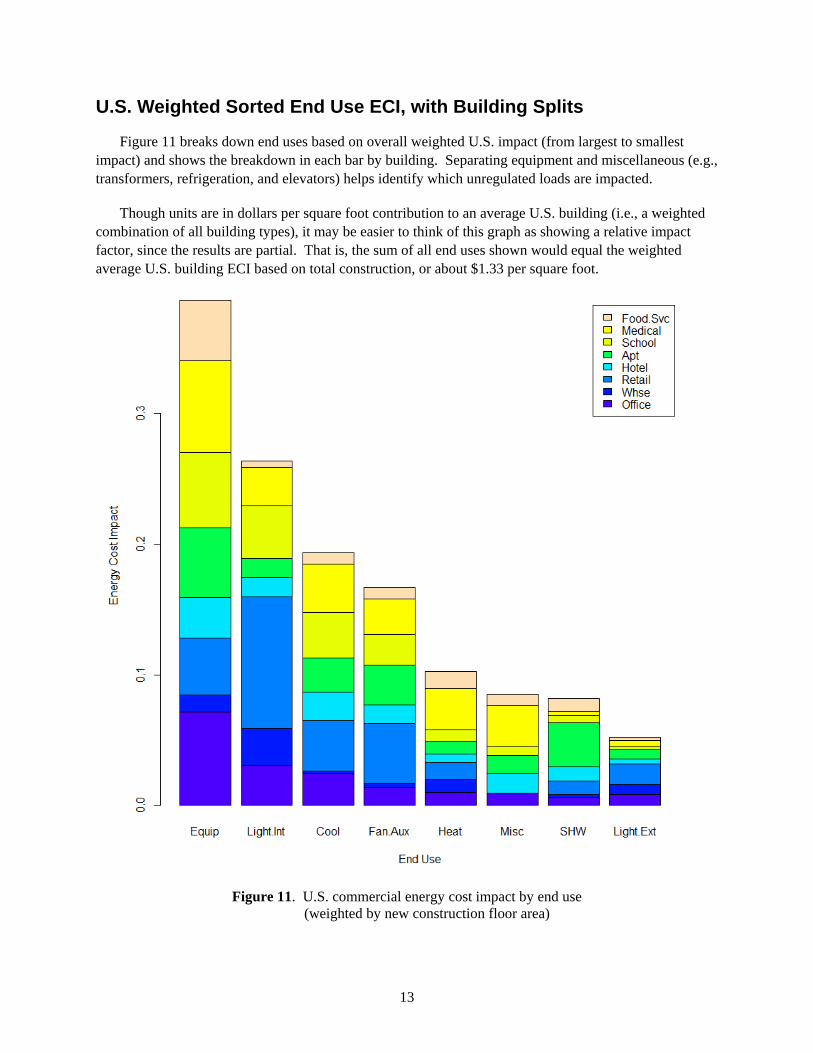
U.S. Weighted Sorted End Use ECI, with Building Splits
Figure 11 breaks down end uses based on overall weighted U.S. impact (from largest to smallest impact) and shows the breakdown in each bar by building. Separating equipment and miscellaneous (e.g., transformers, refrigeration, and elevators) helps identify which unregulated loads are impacted.
Though units are in dollars per square foot contribution to an average U.S. building (i.e., a weighted combination of all building types), it may be easier to think of this graph as showing a relative impact factor, since the results are partial. That is, the sum of all end uses shown would equal the weighted average U.S. building ECI based on total construction, or about $1.33 per square foot.
Figure 11. U.S. commercial energy cost impact by end use
(weighted by new construction floor area)

14
Total U.S. Energy Cost by Building Type
Figure 12 shows energy costs following the implementation of Standard 90.1-2013 by building type group weighted for all climate zones. Energy cost savings from Standard 90.1-2004 vs. 90.1-2013 are also shown. Figure 12 indicates that energy cost intensity for food service is highest, based primarily on the high energy density of fast food restaurants. Medical is next, followed by hotel, retail, and office. Appendix B provides separate graphs for each end use to better illustrate the distribution of individual end-use costs by building type.
Figure 12. Total Standard 90.1-2013 vs 90.1-2004; U.S. energy cost
Focus Potential Score
The focus potential scoring method was developed, using a somewhat arbitrary numerical approach, to help focus on end uses where there may be future savings potential. While scores are simply numerical and do not include judgment about what is possible or an analysis of maximum technical potential, they provide a second look at end uses we might have dismissed. For example, the equipment end-use scores high, even though it has been considered an “unregulated” load. The focus potential scoring method combines the three factors shown in Table 4.
Table 4. Focus potential scoring method factors
Weight Focus Low score High score 6 Savings from 90.1-2004 to 90.1-2013 Low (2) if high previous savings High (6) if little previous savings 3 Individual building end-use cost (ECI) Low (0) if building ECI low High (3) if building ECI high 3 National end-use cost (ECI) Low (0) if national ECI low High (3) if national ECI high
15
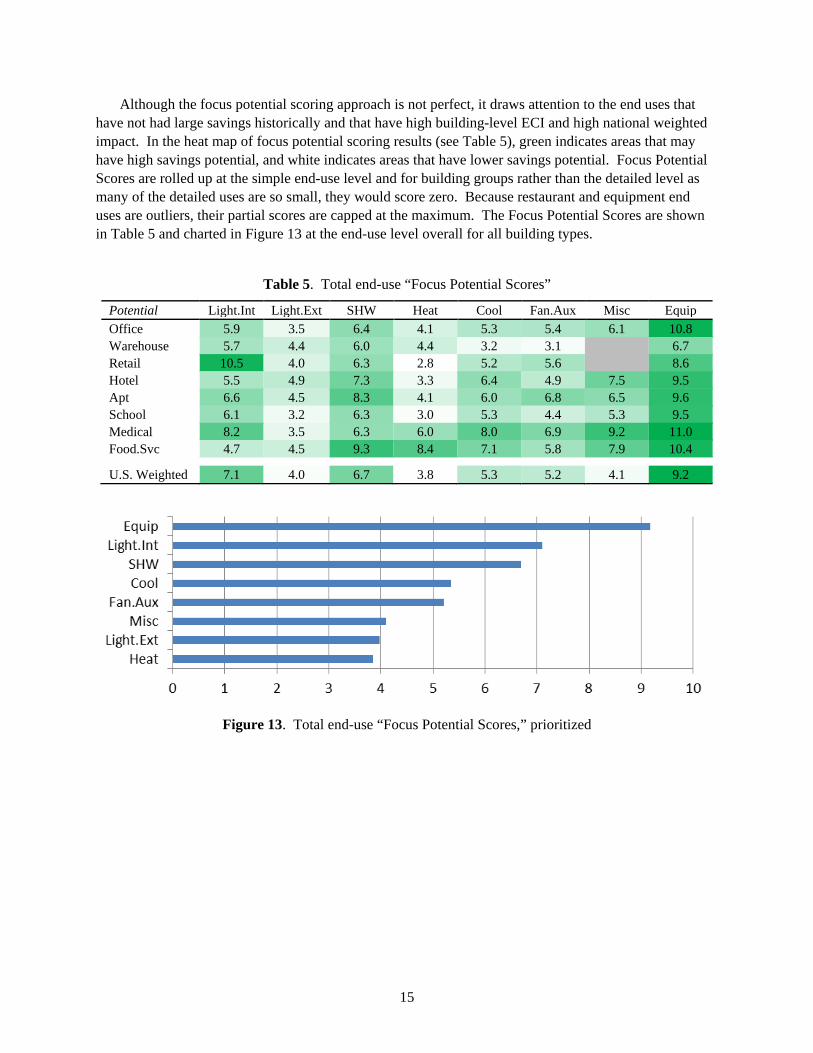
Although the focus potential scoring approach is not perfect, it draws attention to the end uses that have not had large savings historically and that have high building-level ECI and high national weighted impact. In the heat map of focus potential scoring results (see Table 5), green indicates areas that may have high savings potential, and white indicates areas that have lower savings potential. Focus Potential Scores are rolled up at the simple end-use level and for building groups rather than the detailed level as many of the detailed uses are so small, they would score zero. Because restaurant and equipment end uses are outliers, their partial scores are capped at the maximum. The Focus Potential Scores are shown in Table 5 and charted in Figure 13 at the end-use level overall for all building types.
Table 5. Total end-use “Focus Potential Scores”
Potential Light.Int Light.Ext SHW Heat Cool Fan.Aux Misc Equip Office 5.9 3.5 6.4 4.1 5.3 5.4 6.1 10.8 Warehouse 5.7 4.4 6.0 4.4 3.2 3.1 6.7 Retail 10.5 4.0 6.3 2.8 5.2 5.6 8.6 Hotel 5.5 4.9 7.3 3.3 6.4 4.9 7.5 9.5 Apt 6.6 4.5 8.3 4.1 6.0 6.8 6.5 9.6 School 6.1 3.2 6.3 3.0 5.3 4.4 5.3 9.5 Medical 8.2 3.5 6.3 6.0 8.0 6.9 9.2 11.0 Food.Svc 4.7 4.5 9.3 8.4 7.1 5.8 7.9 10.4 U.S. Weighted 7.1 4.0 6.7 3.8 5.3 5.2 4.1 9.2
Figure 13. Total end-use “Focus Potential Scores,” prioritized

16
HVAC by Climate Zone
The heating and cooling ECIs by climate zone (weighted by building type construction within each climate zone) are shown in Figure 14. Climate zones are grouped by moisture regime, and climate zones 1B and 5C are excluded because they have no U.S. construction. Heat rejection is included with cooling, but humidification is not included.
Figure 14. Building ECI heating and cooling by climate zone (CZ)
While Figure 14 shows individual climate zone ECIs, Figure 15 shows the relative contribution of each climate zone’s heating and cooling to the total U.S. energy cost. This graph indicates that reducing heating in climate zone 5A is more important than reducing heating in climate zones 6, 7, or 8.
Figure 15. Weighted impact of climate zone heating and cooling on U.S. heating and cooling costs
17
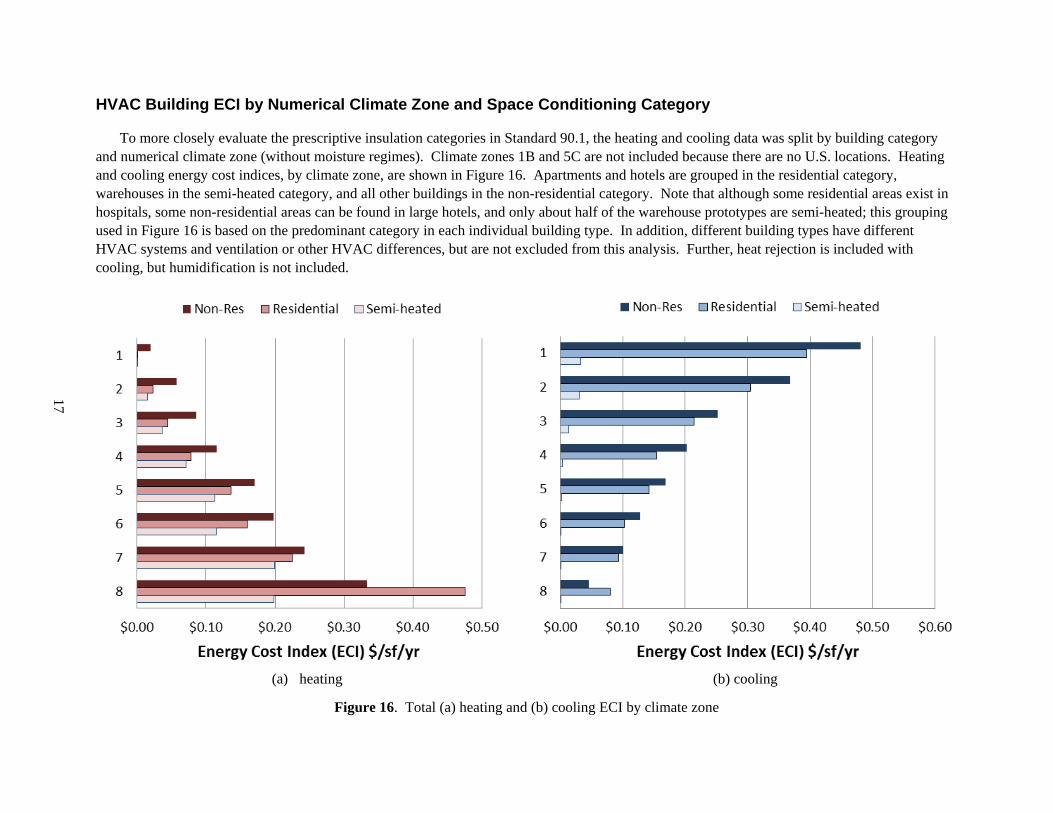
HVAC Building ECI by Numerical Climate Zone and Space Conditioning Category
To more closely evaluate the prescriptive insulation categories in Standard 90.1, the heating and cooling data was split by building category and numerical climate zone (without moisture regimes). Climate zones 1B and 5C are not included because there are no U.S. locations. Heating and cooling energy cost indices, by climate zone, are shown in Figure 16. Apartments and hotels are grouped in the residential category, warehouses in the semi-heated category, and all other buildings in the non-residential category. Note that although some residential areas exist in hospitals, some non-residential areas can be found in large hotels, and only about half of the warehouse prototypes are semi-heated; this grouping used in Figure 16 is based on the predominant category in each individual building type. In addition, different building types have different HVAC systems and ventilation or other HVAC differences, but are not excluded from this analysis. Further, heat rejection is included with cooling, but humidification is not included.
(a) heating (b) cooling
Figure 16. Total (a) heating and (b) cooling ECI by climate zone
18
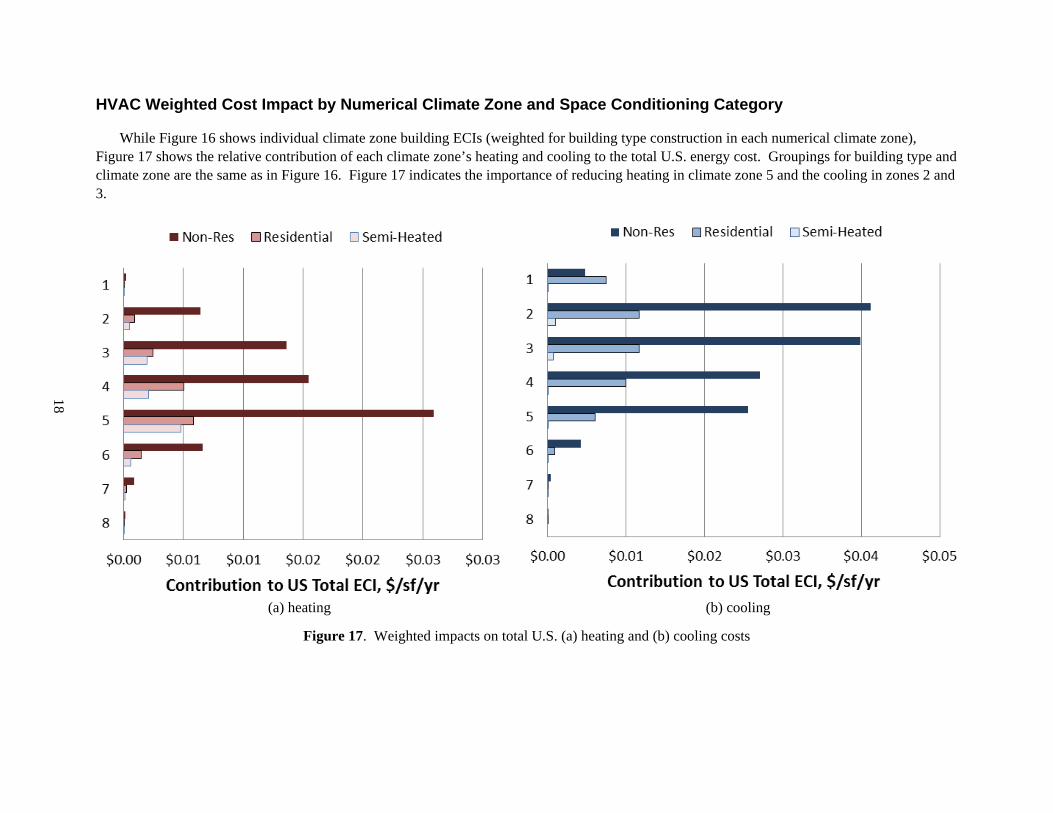
HVAC Weighted Cost Impact by Numerical Climate Zone and Space Conditioning Category
While Figure 16 shows individual climate zone building ECIs (weighted for building type construction in each numerical climate zone), Figure 17 shows the relative contribution of each climate zone’s heating and cooling to the total U.S. energy cost. Groupings for building type and climate zone are the same as in Figure 16. Figure 17 indicates the importance of reducing heating in climate zone 5 and the cooling in zones 2 and 3.
(a) heating (b) cooling
Figure 17. Weighted impacts on total U.S. (a) heating and (b) cooling costs

19
Heating ECI Detail by Climate Zone
A heat map (see Table 6) is used to display detailed heating ECI by climate zone. Darker red indicates a higher heating cost for the building type and climate zone. Because these values are not weighted, all climate zones are included. Heat map shading is provided separately for the medical and restaurant groups because their heating costs are much higher than the other building prototypes. Again, humidification energy is not included with heating.
Table 6. Heating ECI detail by climate zone
Building
Moist Climates Marine Climates Dry Climates Cold
CZ 1A CZ 2A CZ 3A CZ 4A CZ 5A CZ 6A CZ 3C CZ 4C CZ 5C CZ 1B CZ 2B CZ 3B CZ 4B CZ 5B CZ 6B CZ 7 CZ 8
AptH $0.000 $0.021 $0.080 $0.089 $0.175 $0.202 $0.018 $0.059 $0.095 $0.001 $0.002 $0.016 $0.022 $0.069 $0.112 $0.270 $0.373 AptM $0.000 $0.011 $0.043 $0.057 $0.108 $0.126 $0.010 $0.040 $0.061 $0.001 $0.002 $0.011 $0.020 $0.048 $0.079 $0.171 $0.250 HotL $0.016 $0.059 $0.101 $0.096 $0.143 $0.167 $0.078 $0.096 $0.115 $0.031 $0.029 $0.044 $0.059 $0.101 $0.141 $0.200 $0.398 HotS $0.001 $0.023 $0.072 $0.119 $0.211 $0.249 $0.016 $0.079 $0.106 $0.004 $0.009 $0.026 $0.057 $0.109 $0.181 $0.339 $0.547 OfcL $0.000 $0.012 $0.042 $0.057 $0.101 $0.121 $0.004 $0.023 $0.033 $0.005 $0.004 $0.008 $0.016 $0.035 $0.089 $0.159 $0.248 OfcM $0.004 $0.043 $0.105 $0.087 $0.160 $0.188 $0.029 $0.079 $0.108 $0.011 $0.019 $0.032 $0.039 $0.092 $0.146 $0.184 $0.342 OfcS $0.000 $0.009 $0.030 $0.031 $0.055 $0.071 $0.007 $0.019 $0.027 $0.001 $0.003 $0.013 $0.018 $0.031 $0.056 $0.102 $0.173 RtlB $0.002 $0.011 $0.028 $0.039 $0.069 $0.082 $0.031 $0.081 $0.114 $0.014 $0.014 $0.027 $0.050 $0.106 $0.052 $0.123 $0.255 RtlS $0.003 $0.036 $0.095 $0.134 $0.228 $0.278 $0.039 $0.111 $0.164 $0.008 $0.015 $0.030 $0.047 $0.129 $0.206 $0.362 $0.577 SchP $0.017 $0.058 $0.095 $0.117 $0.145 $0.172 $0.064 $0.120 $0.093 $0.018 $0.025 $0.053 $0.082 $0.130 $0.130 $0.212 $0.388 SchS $0.001 $0.010 $0.027 $0.021 $0.039 $0.050 $0.048 $0.107 $0.049 $0.011 $0.016 $0.044 $0.076 $0.130 $0.038 $0.075 $0.228 Whse $0.000 $0.016 $0.044 $0.073 $0.120 $0.118 $0.045 $0.062 $0.073 $0.004 $0.011 $0.026 $0.048 $0.070 $0.084 $0.199 $0.199 MedC $0.233 $0.317 $0.394 $0.316 $0.384 $0.415 $0.225 $0.279 $0.292 $0.236 $0.220 $0.224 $0.250 $0.315 $0.381 $0.459 $0.711 MedH $0.159 $0.222 $0.279 $0.323 $0.375 $0.412 $0.234 $0.285 $0.318 $0.189 $0.191 $0.213 $0.200 $0.321 $0.360 $0.461 $0.653 Rest $0.052 $0.308 $0.616 $0.916 $1.333 $1.584 $0.566 $0.911 $1.093 $0.101 $0.185 $0.349 $0.586 $0.971 $1.353 $2.047 $3.119 Fast $0.181 $0.645 $1.144 $1.530 $2.143 $2.501 $1.057 $1.478 $1.753 $0.284 $0.443 $0.773 $1.104 $1.641 $2.223 $3.193 $4.718

20
Cooling ECI Detail by Climate Zone
A heat map (Table 7) is also used to show detailed cooling ECI by climate zone. Darker blue indicates a higher cooling cost for the building type and climate zone. Because these values are not weighted, all climate zones are included. Heat map shading is provided separately for the medical and restaurant groups because their cooling costs are much higher than the other building prototypes.
Table 7. Cooling ECI detail by climate zone
Building
Moist Climates Marine Climates Dry Climates Cold
CZ 1A CZ 2A CZ 3A CZ 4A CZ 5A CZ 6A CZ 3C CZ 4C CZ 5C CZ 1B CZ 2B CZ 3B CZ 4B CZ 5B CZ 6B CZ 7 CZ 8
AptH $0.381 $0.245 $0.182 $0.146 $0.113 $0.070 $0.007 $0.076 $0.040 $0.344 $0.294 $0.168 $0.157 $0.112 $0.077 $0.059 $0.055 AptM $0.275 $0.185 $0.141 $0.108 $0.086 $0.058 $0.021 $0.060 $0.036 $0.280 $0.235 $0.132 $0.115 $0.083 $0.059 $0.045 $0.038 HotL $0.862 $0.611 $0.464 $0.318 $0.260 $0.183 $0.116 $0.163 $0.105 $0.775 $0.603 $0.371 $0.272 $0.201 $0.142 $0.145 $0.098 HotS $0.405 $0.299 $0.229 $0.170 $0.139 $0.106 $0.116 $0.116 $0.087 $0.364 $0.323 $0.213 $0.164 $0.124 $0.096 $0.086 $0.062 OfcL $0.473 $0.365 $0.309 $0.268 $0.173 $0.133 $0.083 $0.118 $0.073 $0.449 $0.352 $0.250 $0.187 $0.144 $0.109 $0.103 $0.070 OfcM $0.362 $0.270 $0.202 $0.151 $0.131 $0.088 $0.052 $0.084 $0.046 $0.359 $0.309 $0.178 $0.139 $0.098 $0.068 $0.065 $0.035 OfcS $0.190 $0.142 $0.107 $0.083 $0.070 $0.051 $0.038 $0.051 $0.037 $0.193 $0.170 $0.105 $0.087 $0.060 $0.046 $0.040 $0.029 RtlB $0.442 $0.279 $0.214 $0.156 $0.124 $0.079 $0.036 $0.074 $0.027 $0.515 $0.365 $0.205 $0.148 $0.104 $0.070 $0.053 $0.031 RtlS $0.435 $0.328 $0.220 $0.147 $0.113 $0.073 $0.028 $0.073 $0.029 $0.472 $0.391 $0.185 $0.134 $0.100 $0.064 $0.048 $0.022 SchP $0.435 $0.319 $0.242 $0.189 $0.158 $0.111 $0.070 $0.095 $0.073 $0.396 $0.350 $0.202 $0.139 $0.106 $0.086 $0.084 $0.049 SchS $0.487 $0.356 $0.276 $0.205 $0.167 $0.113 $0.075 $0.104 $0.064 $0.452 $0.384 $0.233 $0.162 $0.128 $0.085 $0.085 $0.042 Whse $0.033 $0.021 $0.014 $0.004 $0.002 $0.000 $0.000 $0.000 $0.000 $0.130 $0.073 $0.014 $0.004 $0.002 $0.000 $0.000 $0.000 MedC $1.159 $0.909 $0.721 $0.546 $0.456 $0.361 $0.357 $0.341 $0.262 $0.937 $0.850 $0.577 $0.440 $0.337 $0.260 $0.303 $0.209 MedH $0.785 $0.584 $0.449 $0.339 $0.299 $0.228 $0.158 $0.187 $0.150 $0.456 $0.425 $0.312 $0.218 $0.192 $0.145 $0.177 $0.116 Rest $1.532 $1.077 $0.766 $0.422 $0.314 $0.173 $0.037 $0.161 $0.029 $1.528 $1.284 $0.659 $0.332 $0.239 $0.132 $0.096 $0.035 Fast $1.932 $1.380 $0.977 $0.537 $0.396 $0.210 $0.046 $0.194 $0.032 $1.908 $1.606 $0.775 $0.425 $0.305 $0.164 $0.114 $0.038

21
Construction Weightings by Building Type and Climate Zone
To estimate the energy savings impact on a national scale, PNNL acquired disaggregated construction volume data from McGraw-Hill Construction (MHC) Project Starts Database. The MHC database contains the floor area of new construction in the United States for the years 2003 to 2007. PNNL analyzed this MHC database to develop detailed construction weights by climate zones, subzones, and states (Jarnagin and Bandyopadhyay 2010). These weights were used in developing a weighted national energy savings estimate for the impact of ASHRAE standards. Table 8 summarizes the percentage weights by building type and climate zone. The 16 prototypes cover 80% of new construction floor area and percentages; however, percentages in Table 8 have been normalized to result in 100% coverage. Weightings have been applied in the following three ways:
• For national results, weightings in Table 8 were applied to individual results for each building type and climate zone.
• For average building type results, normalized climate zone weightings, totaling 100% for each building type or group, were applied.
• For heating and cooling results within each climate zone, normalized building type results were applied.
Table 8. U.S. new construction weighting (basis 2003 to 2007 MHC database)
Building Moist Climates Marine Climates Dry Climates General U.S. Type CZ 1A CZ 2A CZ 3A CZ 4A CZ 5A CZ 6A CZ 3C CZ 4C CZ 5C CZ 1B CZ 2B CZ 3B CZ 4B CZ 5B CZ 6B CZ 7 CZ 8 All CZ AptH 1.5% 1.5% 0.7% 2.5% 1.2% 0.1% 0.2% 0.4% 0.0% 0.0% 0.1% 0.7% 0.0% 0.1% 0.0% 0.0% 0.0% 9.0% AptM 0.3% 1.1% 0.8% 1.7% 1.1% 0.3% 0.3% 0.4% 0.0% 0.0% 0.1% 0.9% 0.0% 0.3% 0.1% 0.0% 0.0% 7.3% HotL 0.1% 0.6% 0.6% 1.0% 0.9% 0.2% 0.1% 0.1% 0.0% 0.0% 0.1% 0.8% 0.0% 0.2% 0.1% 0.0% 0.0% 5.0% HotS 0.0% 0.3% 0.3% 0.3% 0.4% 0.1% 0.0% 0.0% 0.0% 0.0% 0.0% 0.1% 0.0% 0.1% 0.0% 0.0% 0.0% 1.7% OfcL 0.1% 0.3% 0.4% 1.1% 0.4% 0.1% 0.1% 0.2% 0.0% 0.0% 0.1% 0.3% 0.0% 0.1% 0.0% 0.0% 0.0% 3.3% OfcM 0.1% 0.8% 0.8% 1.2% 1.1% 0.3% 0.1% 0.2% 0.0% 0.0% 0.3% 0.7% 0.0% 0.3% 0.0% 0.0% 0.0% 6.0% OfcS 0.1% 1.1% 1.0% 0.9% 0.9% 0.2% 0.1% 0.1% 0.0% 0.0% 0.3% 0.5% 0.0% 0.3% 0.0% 0.0% 0.0% 5.6% RtlB 0.2% 2.2% 2.4% 2.5% 3.4% 0.9% 0.2% 0.4% 0.0% 0.0% 0.5% 1.3% 0.1% 0.8% 0.1% 0.1% 0.0% 15.3% RtlS 0.1% 1.0% 1.0% 1.0% 1.0% 0.2% 0.1% 0.1% 0.0% 0.0% 0.3% 0.6% 0.0% 0.2% 0.0% 0.0% 0.0% 5.7% SchP 0.1% 0.9% 0.9% 0.9% 0.9% 0.2% 0.0% 0.1% 0.0% 0.0% 0.2% 0.4% 0.0% 0.2% 0.0% 0.0% 0.0% 5.0% SchS 0.2% 1.5% 1.9% 2.0% 2.3% 0.4% 0.1% 0.2% 0.0% 0.0% 0.2% 0.8% 0.1% 0.4% 0.1% 0.1% 0.0% 10.4% Whse 0.3% 2.6% 3.0% 2.4% 3.6% 0.5% 0.2% 0.4% 0.0% 0.0% 0.6% 2.3% 0.1% 0.7% 0.0% 0.0% 0.0% 16.7% MedC 0.0% 0.6% 0.6% 0.8% 1.1% 0.3% 0.1% 0.2% 0.0% 0.0% 0.1% 0.3% 0.0% 0.2% 0.0% 0.0% 0.0% 4.4% MedH 0.0% 0.5% 0.5% 0.6% 0.8% 0.2% 0.0% 0.1% 0.0% 0.0% 0.1% 0.3% 0.0% 0.2% 0.0% 0.0% 0.0% 3.4% Rest 0.0% 0.1% 0.1% 0.1% 0.1% 0.0% 0.0% 0.0% 0.0% 0.0% 0.0% 0.0% 0.0% 0.0% 0.0% 0.0% 0.0% 0.7% Fast 0.0% 0.1% 0.1% 0.1% 0.1% 0.0% 0.0% 0.0% 0.0% 0.0% 0.0% 0.1% 0.0% 0.0% 0.0% 0.0% 0.0% 0.6% All Bldg 3.2% 15.2% 15.0% 19.3% 19.4% 4.2% 1.6% 3.0% 0.0% 0.0% 3.0% 10.1% 0.5% 4.3% 0.6% 0.5% 0.1% 100%
22
References
ASHRAE (American Society of Heating, Refrigerating, and Air-Conditioning Engineers). 2004. ANSI/ASHRAE/IESNA Standard 90.1-2004. Energy Standard for Buildings Except Low-Rise Residential Buildings. ASHRAE, Atlanta, Georgia.
ASHRAE. 2007. ANSI/ASHRAE/IESNA Standard 90.1-2007. Energy Standard for Buildings Except Low-Rise Residential Buildings. ASHRAE, Atlanta, Georgia.
ASHRAE. 2010. ANSI/ASHRAE/IES Standard 90.1-2010. Energy Standard for Buildings Except Low-Rise Residential Buildings. ASHRAE, Atlanta, Georgia.
ASHRAE. 2013. ANSI/ASHRAE/IES Standard 90.1-2013. Energy Standard for Buildings Except Low-Rise Residential Buildings. ASHRAE, Atlanta, Georgia.
Briggs RS, RG Lucas, and ZT Taylor. 2003. “Climate Classification for Building Energy Codes and Standards: Part 2—Zone Definitions, Maps, and Comparisons.” ASHRAE Transactions 109(2).
DOE (U.S. Department of Energy). 2013. Energy Plus Energy Simulation Software, Version 8.0. U.S. Department of Energy, Washington, D.C. Available at http://apps1.eere.energy.gov/buildings/EnergyPlus/.
EIA (Energy Information Administration). 2003. Commercial Buildings Energy Consumption Survey 2003. Energy Information Administration of U.S. Department of Energy, Washington, D.C. Available at http://www.eia.doe.gov/emeu/cbecs/contents.html.
Jarnagin RE and GK Bandyopadhyay. 2010. Weighting Factors for the Commercial Building Prototypes Used in the Development of ANSI/ASHRAE/IES 90.1-2010. PNNL-19116, Pacific Northwest National Laboratory, Richland, Washington. Available at www.pnl.gov/main/publications/external/technical_reports/ PNNL-19116.pdf.
PNNL. 2014a. 2013EndUseTables.xlsx. Pacific Northwest National Laboratory, Richland, WA. Available at http://www.energycodes.gov/sites/default/files/documents/2013EndUseTables.zip.
PNNL. 2014b. Enhancements to ASHRAE Standard 90.1 Prototype Building Models. Pacific Northwest National Laboratory, Richland, Washington. Available at https://www.energycodes.gov/development/commercial/90.1_models.
Thornton BA, M Rosenberg, EE Richman, W Wang, Y Xie, J Zhang, H Cho, VV Mendon, RA Athalye, and B Liu. 2011. Achieving the 30% Goal: Energy and Cost Savings Analysis of ASHRAE Standard 90.1-2010. PNNL-20405, Pacific Northwest National Laboratory, Richland, Washington.

Appendix A –
Heat Maps


A.1
Appendix A
Heat Maps
The heat maps presented in this appendix provide multiple views of prototypes by end use. The term “heat map” does not relate to the heating end use, but to a representation of relative intensity of a factor by color. Two types of heat maps (i.e., cost and savings) are used here:
• Cost heat maps: In the cost heat maps, red indicates the highest remaining cost impact and white indicates lowest remaining cost impact. Darker reds indicate higher remaining cost and, thus, a higher potential for future savings.
• Savings heat maps: In the savings heat maps, green indicates the higher cost savings from Standard 90.1-2004 to Standard 90.1-2013 and red indicates lower cost savings. Darker reds indicate a lower savings to date and, thus, a possible higher potential for future savings.
Some of the heat maps are weighted by construction and some represent individual building constructions. The weighting conditions are noted with each map. Likewise, building types and end uses presented as detailed or in groups, as noted.

A
.2
Energy Cost Index by Building Type and End Use
Table A.1 shows ECI results grouped by building and end use after Standard 90.1-2013; Table A.2 shows the detailed results. Results in this section relate to the prototype independently except the last row (U.S. Weighted), which is weighted for both climate and prototype. The results are national, weighted by relative construction of each prototype in each climate zone.
Table A.1. ECI ($/ft2/yr) remaining after 90.1-2013, by building group and end use
Light.Int Light.Ext SHW Heat Cool Fan.Aux Misc Equip
Total
Office $0.203 $0.055 $0.043 $0.066 $0.164 $0.093 $0.065 $0.479
$1.167 Warehouse $0.170 $0.045 $0.014 $0.060 $0.012 $0.019 $0.075
$0.395
Retail $0.482 $0.076 $0.047 $0.063 $0.184 $0.219 $0.209
$1.281 Hotel $0.215 $0.052 $0.166 $0.099 $0.322 $0.205 $0.229 $0.463
$1.750
Apt $0.092 $0.046 $0.207 $0.058 $0.163 $0.189 $0.081 $0.329
$1.165 School $0.259 $0.016 $0.037 $0.056 $0.225 $0.151 $0.046 $0.376
$1.166
Medical $0.381 $0.054 $0.037 $0.404 $0.476 $0.352 $0.398 $0.897
$3.000 Food.Svc $0.371 $0.175 $0.806 $1.078 $0.668 $0.656 $0.690 $3.679
$8.124
U.S. Weighted $0.263 $0.052 $0.082 $0.103 $0.193 $0.166 $0.085 $0.386
$1.330
Table A.2. ECI ($/ft2/yr) remaining after 90.1-2013, by building type and detailed end use
Light.Int Light.Ext SHW Heat Humidfy Cool Ht.Rej Fans Ht.Rcvy Pumps Refrig Elevator Txfmr Equip Cook IT Total Sm Office 0.238 0.064 0.094 0.029 0.100 0.104 0.252 0.880 Md Office 0.175 0.056 0.013 0.089 0.174 0.045 0.000 0.000 0.088 0.009 0.313 0.962 Lg Office 0.196 0.039 0.010 0.048 0.037 0.230 0.023 0.126 0.006 0.031 0.109 0.005 0.307 0.858 2.023 Warehouse 0.170 0.045 0.014 0.060 0.012 0.019 0.075 0.395 Retail Store 0.432 0.071 0.035 0.046 0.178 0.215 0.018 0.226 1.221 Strip Mall 0.618 0.090 0.080 0.109 0.200 0.183 0.163 1.443 Sm Hotel 0.214 0.044 0.127 0.116 0.190 0.185 0.000 0.166 0.296 1.336 Lg Hotel 0.215 0.055 0.179 0.093 0.367 0.151 0.044 0.017 0.020 0.223 0.007 0.205 0.316 1.893 Pri School 0.274 0.018 0.025 0.099 0.216 0.123 0.032 0.000 0.047 0.009 0.362 0.104 1.311 Sec School 0.252 0.016 0.042 0.035 0.229 0.111 0.032 0.007 0.026 0.009 0.006 0.259 0.073 1.096 Mid Apartment 0.094 0.034 0.322 0.049 0.121 0.171 0.106 0.328 1.226 Hi Apartment 0.091 0.055 0.113 0.065 0.187 0.009 0.186 0.017 0.054 0.007 0.330 1.115 Clinic 0.353 0.078 0.028 0.340 0.076 0.570 0.261 0.013 0.011 0.448 0.876 3.055 Hospital 0.417 0.024 0.049 0.306 0.082 0.299 0.058 0.345 0.028 0.064 0.025 0.298 0.012 0.632 0.291 2.930 Fast Food 0.371 0.177 0.673 1.373 0.751 0.762 0.977 4.469 9.553 Restaurant 0.372 0.173 0.925 0.816 0.594 0.560 0.002 0.435 2.977 6.854
U.S. Weighted 0.263 0.052 0.082 0.095 0.007 0.189 0.004 0.148 0.012 0.007 0.016 0.066 0.003 0.273 0.084 0.029 1.330

A
.3
National Energy Cost Impact, by Building Type and End Use, U.S. New Construction
Table A.3 shows grouped national new construction energy cost impact results after Standard 90.1-2013; Table A.4 shows the detailed results. Results in this section are weighted by prototype and climate zone based on 8.2 billion square feet of new construction. The numerical results represent the contribution to national new construction energy cost and red shading indicates the greatest national impacts.
Table A.3. Million $/y-U.S. spend on new commercial building energy; after 90.1-2013
Light.Int Light.Ext SHW Heat Cool Fan.Aux Misc Equip Total Office $252M $69M $53M $81M $202M $115M $80M $593M $1,446M Warehouse $235M $63M $19M $83M $16M $26M $104M $546M Retail $834M $132M $82M $109M $318M $380M $361M $2,216M Hotel $118M $29M $91M $55M $177M $113M $126M $255M $965M Apt $124M $62M $279M $78M $219M $254M $109M $443M $1,568M School $329M $21M $46M $71M $286M $192M $58M $477M $1,480M Medical $246M $35M $24M $261M $308M $228M $257M $580M $1,939M Food.Svc $38M $18M $83M $111M $69M $68M $71M $379M $837M U.S. Weighted $2,177M $428M $678M $848M $1,596M $1,375M $702M $3,192M $10,997M
Table A.4. Detailed million $/y-U.S. spend on new commercial building energy; after 90.1-2013
Light.Int Light.Ext SHW Heat Humidify Refrig Elevator Txfmr Equip Cook IT Cool Ht.Rej Fans Ht.Rcvy Pumps Total Sm Office $110M $30M $43M $13M $117M $46M $48M $408M Md Office $88M $28M $6M $45M $44M $5M $156M $87M $22M $0M $0M $481M Lg Office $54M $11M $3M $13M $10M $30M $1M $84M $236M $63M $6M $35M $2M $8M $556M Warehouse $235M $63M $19M $83M $104M $16M $26M $546M Retail Store $545M $90M $45M $58M $284M $225M $271M $23M $1,540M Strip Mall $290M $42M $37M $51M $77M $94M $86M $676M Sm Hotel $30M $6M $18M $16M $24M $42M $27M $26M $0M $190M Lg Hotel $88M $23M $73M $38M $8M $91M $3M $84M $129M $150M $62M $18M $7M $775M Pri School $113M $7M $10M $41M $20M $4M $150M $43M $89M $51M $13M $0M $541M Sec School $216M $13M $36M $30M $22M $8M $5M $222M $63M $196M $95M $27M $6M $939M Mid Apt $57M $21M $195M $30M $64M $199M $73M $104M $742M Hi Apt $67M $41M $84M $48M $40M $5M $245M $139M $7M $138M $12M $827M Clinic $128M $28M $10M $123M $28M $162M $317M $206M $94M $5M $4M $1,104M Hospital $119M $7M $14M $87M $23M $7M $85M $3M $180M $83M $85M $17M $98M $8M $18M $835M Fast Food $18M $9M $33M $67M $47M $217M $36M $37M $463M Restaurant $20M $9M $50M $45M $24M $162M $32M $31M $0M $374M
All Buildings $2,177M $428M $678M $787M $61M $128M $547M $26M $2,260M $697M $236M $1,566M $30M $1,224M $95M $56M $10,997M

A
.4
Energy Cost Savings, by Building Type and End Use
Table A.5 shows grouped results and Table A.6 shows the detailed results. These results are for savings from Standard 90.1-2004 to 2013 and are weighted by climate zone based on new construction. The percentages represent independent savings for each individual end use.
Table A.5. Percentage cost savings by end use and building type, 90.1-2004 to 90.1-2013 (% savings per individual end use)
Light.Int Light.Ext SHW Heat Cool Fan.Aux Misc Equip
Total
Office 37.1% 50.4% 0.3% 42.2% 39.5% 25.7% 10.0% 5.5%
25.4% Warehouse 36.0% 33.1% 3.2% 36.4% 46.3% 50.6% 2.0%
31.8%
Retail 24.0% 48.0% 5.1% 64.2% 50.1% 49.9% 0.4%
36.7% Hotel 36.6% 25.0% 0.3% 56.5% 35.7% 45.2% 5.8% 4.4%
27.2%
Apt 6.7% 32.4% 0.1% 41.3% 29.2% 21.0% 6.3% 0.3%
14.2% School 43.0% 47.1% 0.9% 58.1% 50.0% 52.5% 19.2% 9.7%
38.5%
Medical 16.8% 47.0% 0.8% 54.8% 33.1% 33.4% 3.3% 1.5%
26.0% Food.Svc 59.5% 43.3% 0.7% 15.9% 34.5% 55.7% 21.6% 0.0%
21.7%
U.S. Weighted 30.9% 43.2% 1.0% 50.4% 41.4% 42.5% 8.6% 3.4%
29.0%
Table A.6. Detailed percentage cost savings by end use and building type, 90.1-2004 to 90.1-2013 (% savings per individual end use)
Light.Int Light.Ext SHW Heat Humidify Cool Ht.Rej Fans Ht.Rcvy Pumps Refrig Elevator Txfmr Equip Cook IT Total Sm Office 35.6% 52.1% 0.2% 43.3% 50.2% 24.2% 8.5% 30.2% Md Office 40.6% 53.6% 1.5% 52.0% 36.1% 30.9% 0.0% 5.5% 49.5% 8.8% 31.6% Lg Office 33.6% 30.9% 0.2% 42.2% -685% 31.6% 54.8% 12.9% 56.7% 2.8% 44.5% 9.1% 0.0% 14.6% Warehouse 36.0% 33.1% 3.2% 36.4% 46.3% 50.6% 2.0% 31.8% Retail Store 24.4% 46.7% 2.1% 73.7% 50.4% 54.4% 0.4% 38.1% Strip Mall 23.3% 50.6% 8.3% 39.3% 49.3% 47.7% 0.4% 33.3% Sm Hotel 35.4% 30.9% 0.1% 45.5% 30.8% 6.7% 0.0% 3.6% 7.3% 21.3% Lg Hotel 37.0% 23.2% 0.3% 60.0% 36.5% 44.0% 59.8% 70.1% 17.5% 2.8% 45.6% 9.1% 0.0% 28.5% Pri School 41.6% 46.0% 3.5% 42.0% 45.6% 37.1% 37.7% 2.7% 10.0% 49.6% 14.7% 0.0% 32.6% Sec School 43.7% 47.7% 0.1% 69.6% 51.7% 55.4% 57.4% 77.9% 9.1% 13.1% 48.5% 10.2% 0.0% 41.5% Mid Apartment 8.5% 45.0% 0.1% 38.5% 36.8% 20.2% 3.6% 0.5% 13.2% Hi Apartment 5.1% 23.7% 0.1% 42.9% 24.7% 22.0% 20.2% 33.7% 2.8% 42.5% 0.2% 15.1% Clinic 17.5% 51.0% 1.2% 58.6% 50.1% 31.0% 36.9% 17.7% 2.0% 0.9% 27.0% Hospital 16.0% 21.3% 0.6% 47.0% 61.1% 38.8% 25.2% 34.6% 50.7% 21.9% 1.3% 40.6% 3.2% 0.0% 24.6% Fast Food 56.9% 43.6% -0.1% 8.1% 32.1% 48.4% 21.3% 0.0% 17.9% Restaurant 61.6% 43.0% 1.2% 25.4% 37.1% 62.3% 0.0% 22.0% 0.0% 26.0%

Appendix B –
End-Use Energy Cost by Building Type


B.1
Appendix B
End-Use Energy Cost by Building Type
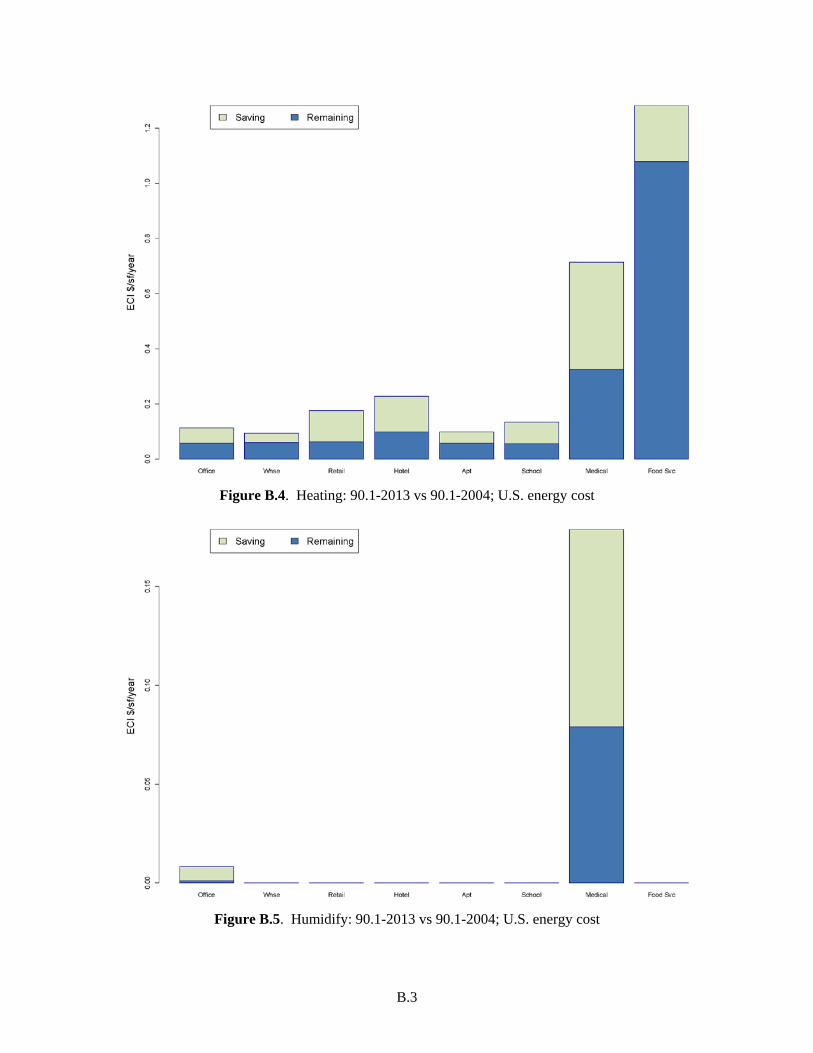
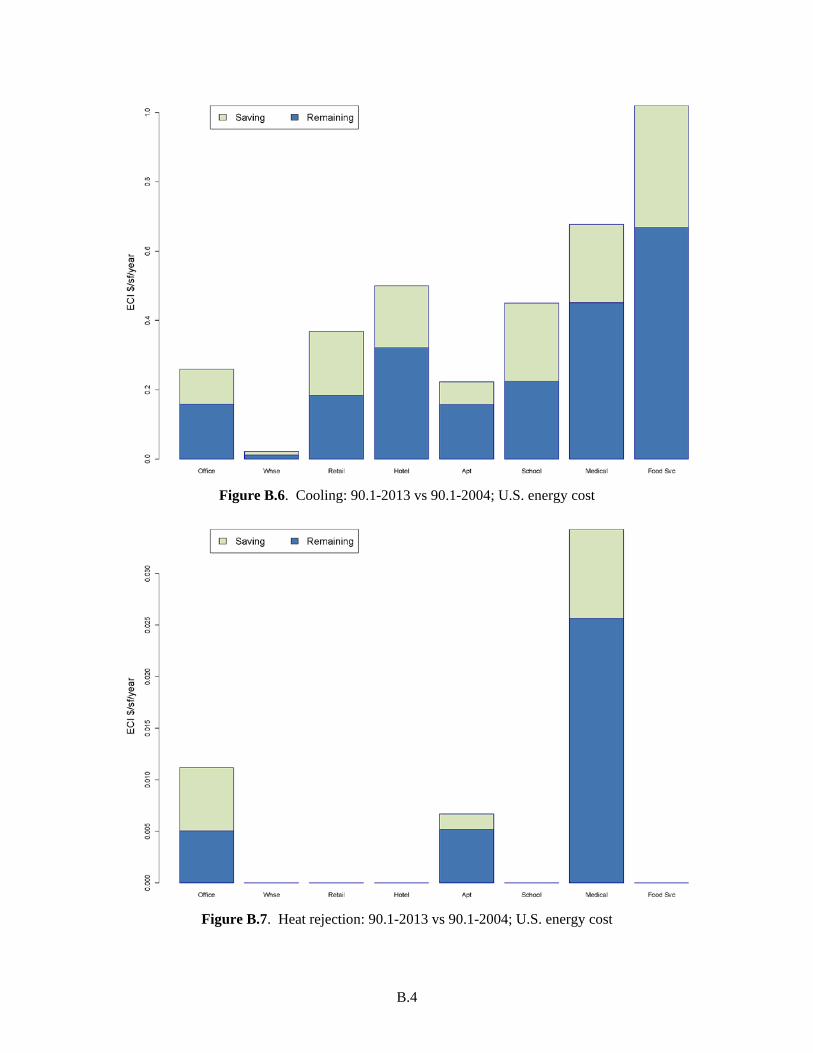
The following figures show the energy cost (ECI, $/ft2/yr) for each end use on a separate graph with a bar for each building type group. These figures show use after Standard 90.1-2013 and are weighted for the building type across all U.S. climate zones. Energy cost savings from 90.1-2004 to 90.1-2013 are also shown to indicate which building types have the highest energy cost intensity for a particular end use. These figures also show the distribution of individual end-use costs by building type.
Figure B.1. Interior lighting: 90.1-2013 vs. 90.1-2004; U.S. energy cost

B.2
Figure B.2. Exterior lighting: 90.1-2013 vs 90.1-2004; U.S. energy cost
Figure B.3. Service hot water: 90.1-2013 vs. 90.1-2004; U.S. energy cost
B.3
Figure B.4. Heating: 90.1-2013 vs 90.1-2004; U.S. energy cost
Figure B.5. Humidify: 90.1-2013 vs 90.1-2004; U.S. energy cost
B.4
Figure B.6. Cooling: 90.1-2013 vs 90.1-2004; U.S. energy cost
Figure B.7. Heat rejection: 90.1-2013 vs 90.1-2004; U.S. energy cost
B.5
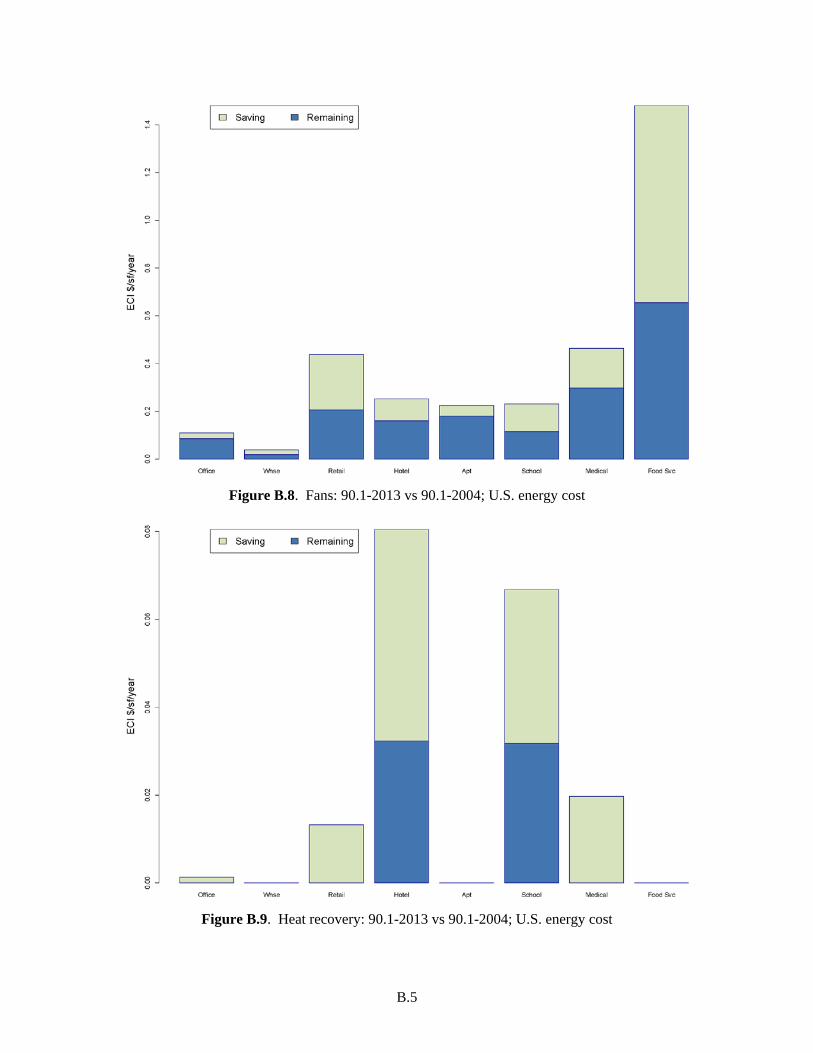
Figure B.8. Fans: 90.1-2013 vs 90.1-2004; U.S. energy cost
Figure B.9. Heat recovery: 90.1-2013 vs 90.1-2004; U.S. energy cost

B.6
Figure B.10. Refrigeration: 90.1-2013 vs 90.1-2004; U.S. energy cost
Figure B.11. Pumps: 90.1-2013 vs 90.1-2004; U.S. energy cost

B.7
Figure B.12. Elevator: 90.1-2013 vs 90.1-2004; U.S. energy cost
Figure B.13. Transformer loss: 90.1-2013 vs 90.1-2004; U.S. energy cost

B.8
Figure B.14. Cooking: 90.1-2013 vs 90.1-2004; U.S. energy cost
Figure B.15. IT: 90.1-2013 vs 90.1-2004; U.S. energy cost
B.9
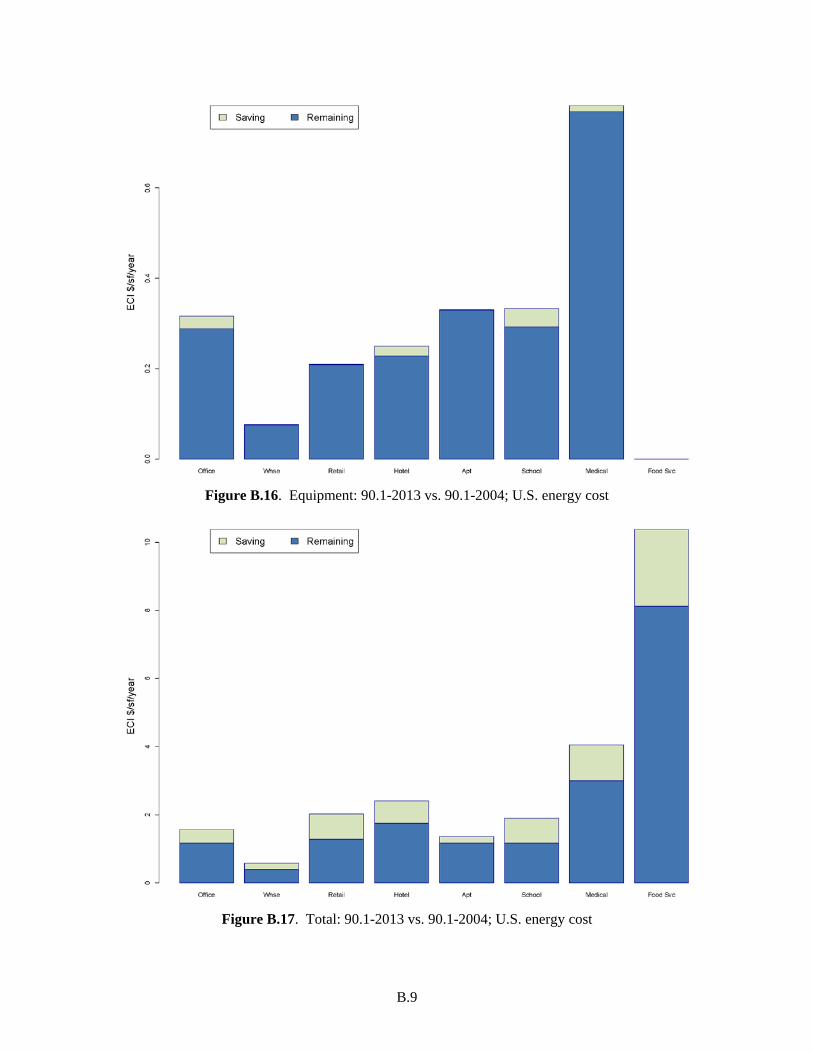
Figure B.16. Equipment: 90.1-2013 vs. 90.1-2004; U.S. energy cost
Figure B.17. Total: 90.1-2013 vs. 90.1-2004; U.S. energy cost