Embed Size (px)
Citation preview

End-to-end Management with Grid Control
John AbrahamsTechnology Sales Consultant
Oracle Nederland B.V.

Agenda
� End-to-end management with Grid Control� Database Performance Management

Challenges
� Complexity of applications– Heterogeneous and distributed systems– Expensive and time consuming to manage
� Optimize application service levels– Better availability– Superior performance
� Drive down labor costs – Manage more with less– Eliminate human error

What is Enterprise Manager 10g Grid Control?
� Oracle’s grid-ready framework, allowing IT professionals to manage the entire Oracle eco-system through one integrated management console.

Oracle Eco-System
Application Performance Management
AvailabilityManagement
Oracle Enterprise Manager 10g
NotificationsModeling End-UserCommunities
Root Cause Analysis
Alerts Trending
TransactionPerformance
End-User Performance
Cross-TierTracing
Application Performance Management
SLA Management
Non-Oracle Systems
Impact Analysis
��������������
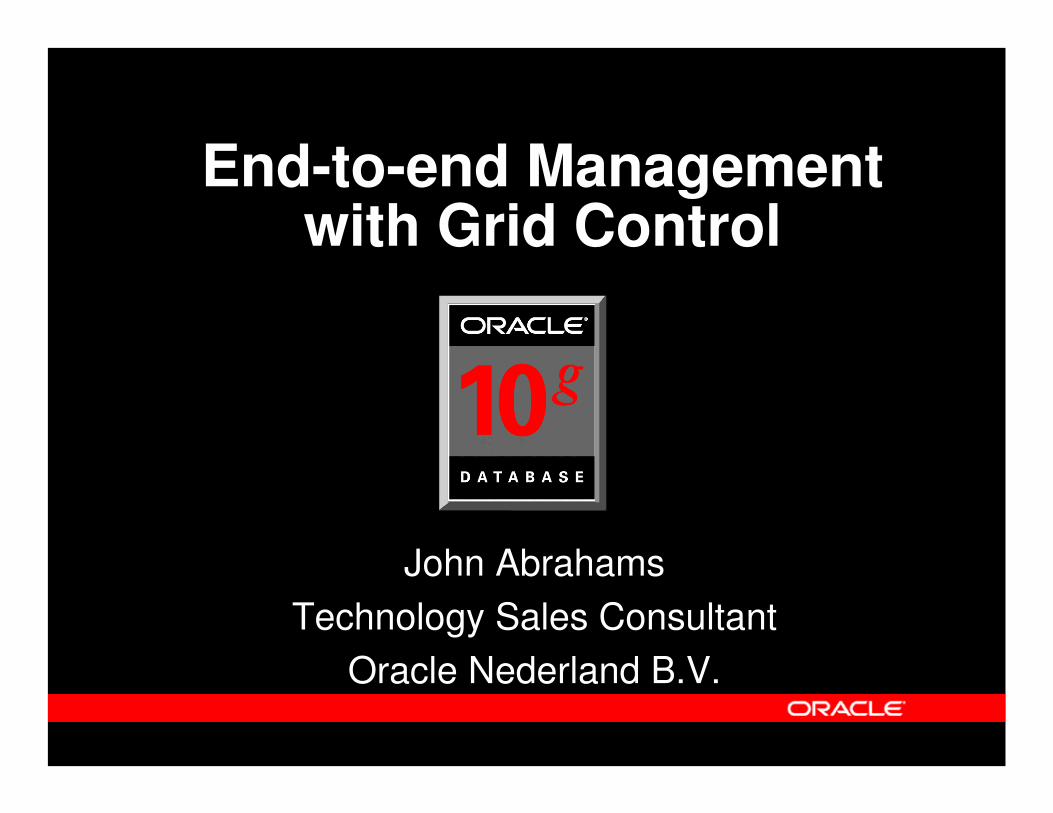
IntegratedOne Tool Lowers Learning Curve, Improves Quality of Service
���� ���
�������
������
����������������������
������������
AdministrationMonitoring
ProvisioningSecurity
EnterpriseManager

Managing Groups
� Logical modeling of sets of systems
– Applications, Clusters– Leveraged by all services –
Jobs, Policies, …
� Managed from a single-view– Monitoring and automated
operations
� Membership-based inheritance
Applications
Sets of Systems
Manage Groups of Systems as a Single Unit

Task Automation
� Designed for large number of targets
� Multiple job types– OS command, SQL, …
� Pre-packaged jobs– Backup, startup/shutdown, patch,
clone, …
� Ad hoc job creation – Custom scripts
EM 10g
Job System
Automate Operations Across Large Sets of Systems
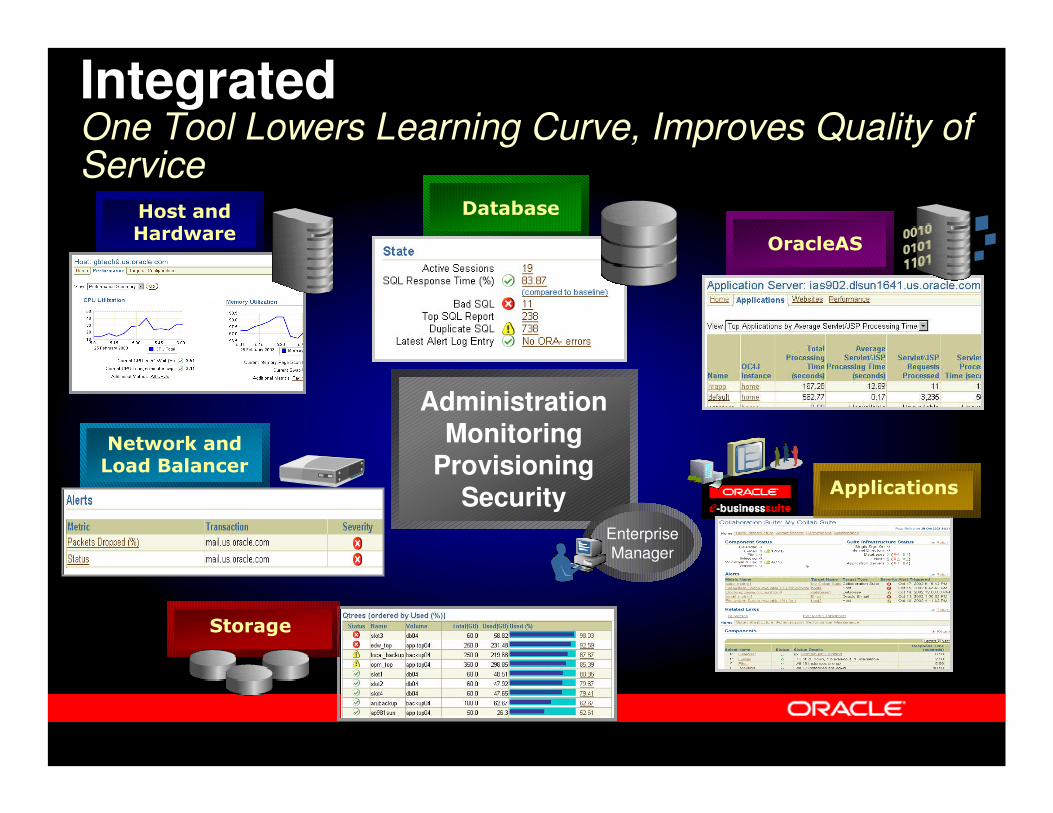
Policy-Based Standardization
� Policy Management– Rule definitions
– Violation detection
– Corrective action
� Types– Performance policies
– Security policies
– Configuration policies
Drives Consistency and Automation
Policy

Grid Control
Repository
• Policy Manager
• Job System
• Group Manager
• Configuration Management
• Performance Monitoring
Grid-ready FrameworkManages Large Sets of Systems with Minimal Incremental Cost
Grid-ready Framework

Architecture Goals
� Zero-implementation, Zero time-to-value� Access by Anybody, Anywhere� Open Repository Schema� Easy extensibility and customization� Support of Standards� Scalability, robustness and self-maintenance

Architecture: Overall design
Fire
wal
l
Mobile Device
HTML Console
Portals
HTTP/S
HTTP/S
HTTP/S
HTTP/S
Open Repository
������������� ����

LiveLink
Oracle.com
Product Updates
Patches
ProductConfiguration
EnterpriseManager
View/Search
Compare/Diff
Change Tracking
ReferenceConfigurations
Analyze
OracleInventory
SoftwareConfigurations
HardwareConfigurations
Discover
Install/Clone
Configure
Patch
Secure
Provision
Deployment Life-Cycle

Provisioning
� Capacity-on-Demand– Automated addition/reallocation of servers– Grid Deployments
� Key operations– Software cloning– Software patching– Cluster configuration management– Security

Software Cloning
� Reduce manual labor in software life-cycle– From hours to minutes
� Automate mass provisioning of reference systems� Intelligent Cloning makes context-specific
adjustments– DB: home, host name, listener– iAS: IP address, host name, web listener
UpdateInventory
Clone to Selected Targets
2
3
Select Software (and Instances) to Clone1

Cloning – Database
� Clone an Entire Database– Including software
� Data+Schema Cloning– Schema and data (sub-
set) cloning– Version and platform
independent
� Add/Remove nodes from RAC clusters

Automated Patch Application
Repository
Enterprise Manager
Patch Published1
DetermineApplicability
2
Apply Patch3
UpdateInventory
4
� Real-time discovery of new patches� Security patch rapid deployment dramatically reduces vulnerabilities
� Grid-wide automated application reduces down-time from human error

Automated Patching

DemonstrationGrid Control

Agenda
� End-to-end management with Grid Control� Database Performance Management

Ongoing System Management
55% of DBA’s time is spent in ongoing management, monitoring and tuning
#1 Cause:Performance Diagnosis & TroubleshootingResource Tuning
Source: IOUG 2001 DBA Survey

Traditional Performance Tuning
� Performance and Workload Data Capture– System Statistics, Wait Information, SQL Statistics, etc.
� Analysis– What types of operations database is spending most time
on?– Which resources is the database bottlenecked on?– What is causing these bottlenecks?– What can be done to resolve the problem?
� Problem Resolution– If multiple problems identified, which is most critical?– How much performance gain expected if is solution
implemented?Oracle10g Database and Diagnostics Pack Automates All Steps
and Addresses All Issues & Challenges!

..and a lot moreAutomatic Backup
Management
Oracle 10g Manageability Out of Box
InstallationFast, lightweight install
including Automated Pre and Post Install Steps
Installation Media Optimization
Easy, fast client installEnhanced silent install
for ISVs
Simplified Creation & Configuration
Pre-configured Database
90% Reduction in Configuration parameters
Automatic setup of common tasks, backups, stats gathering etc
Out of of Box Database ConsoleData Load
Data PumpCross-Platform
Transportable TSRestartable Data Load
Ongoing System ManagementAutomatic Storage ManagementAutomatic Shared Memory TuningAdvisors Out of the Box
Segment AdvisorUndo AdvisorRedo Log file Size AdvisorAutomatic Undo Retention
Alert generation, out of the box thresholds
Resource Manager
* Not a comprehensive list

� Automatic Performance Diagnosis– Self Diagnostic engine built into core database kernel,
Automatic Database Diagnostic Monitor (ADDM) – Automatic Workload Capture and Historical Performance
Analysis (Automatic Workload Repository)– Comprehensive System (Database & OS) Performance
Monitoring– Advanced Event Management
� When Used With Grid Control– Manages Large Sets of Databases and other Oracle
infrastructure– Cross-system Performance and Availability aggregation– Seamlessly Integrates With Application Server Diagnostic
Pack
Database Diagnostics PackKey Features

� Requires and Seamlessly Integrates with Database Diagnostic Pack
� Tuning pack solutions include– SQL Tuning Advisor– SQL Access Advisor– Object Reorganization Wizard
� Provides comprehensive, automatic, and cost-effective solution for application tuning
Database Tuning PackKey Features

Intelligent Infrastructure Overview
� Automatic Workload Repository – “Data Warehouse” of Database– Code instrumentation
� Automatic Maintenance Tasks– Pre-packaged, resource
controlled� Server-generated Alerts
– Push vs. Pull, Just-in-time, Out-of-the-box
� Advisory Infrastructure– Integrated, uniformity– ADDM, SQL Tuning and other
Advisors
Intelligent Infrastructure
Application & SQLManagement
System ResourceManagement
SpaceManagement
Backup & RecoveryManagement
StorageManagement
Database Manageme
ntAutomatic Workload Repository
Automatic Maintenance Task Infrastructure
Server-generated Alert Infrastructure
Advisory Infrastructure

� Built-in Workload and Performance Statistics Repository Within Database
� Part of Oracle Database 10g Intelligent Self-Management Infrastructure
� Automatically Captures Workload Data• Every 60 minutes, or manually, saves data for 7 days by default
• Resides in Newly Introduced SYSAUX Tablespace• Server Automatically Manages Space Requirements
• Old Data is automatically purged• Stores different classes of data:
– BASE STATISTICS e.g. physical reads– SQL STATISTICS e.g. disk reads (per sql stmt)– METRICS e.g. physical reads / sec– ACTIVE SESSION HISTORY
Automatic Workload Repository (AWR)

Intelligent Infrastructure: New Base Statistics Extensive code instrumentation
� Time Model (v$sys_time_model)– Automatic Tracking of Operation Times– DB time– Connection Management (logon, logoff)– Parse (hard, soft, failed,..)– SQL, PLSQL and Java execution times
� Wait Model (v$system_event)– Wait Events Categorized Based On Solution Area– 800+ different wait events =>12 wait classes (Appln, Concurrency..)
� OS Stats (v$osstat)– CPU + Memory
� SQL statement statistics– Wait class: PLSQL, Java, etc time– Sampled bind values (v$sql_bind_capture)– Efficient Top SQL identification using �s in the kernel, by dimensions
SQL Exec
PLSQL Exec
Conn MgmtParse
Java Exec

Intelligent Infrastructure: Active Session History (ASH)
Sampled history of Active Sessions (v$session_wait)
• Samples active sessions every second into memory (v$active_session_history)
• Direct access to kernel structures• Selected samples flushed to AWR• Data captured includes:
– SID – SQL ID– Program, Module, Action – Wait event# – Object, File, Block– actual wait time (if captured while waiting)

DB Time
Query for Melanie Craft
Novels
Browse andRead
Reviews
Add item to
cart
Checkout using
‘one-click’
Active Session History (ASH)

DB Time
Query for Melanie Craft
Novels
Browse andRead
Reviews
WAITING
Statedb file sequential readqa324jffritcf2137:38:26
EventSQL IDModuleSIDTime
CPUaferv5desfzs5Get review id2137:42:35
WAITING log file syncabngldf95f4deOne click2137:52:33
WAITING buffer busy waithk32pekfcbdfrAdd to cart2137:50:59
Add item to
cart
Checkout using
‘one-click’
Book by author
Active Session History (ASH)
Fine Grained Activity History
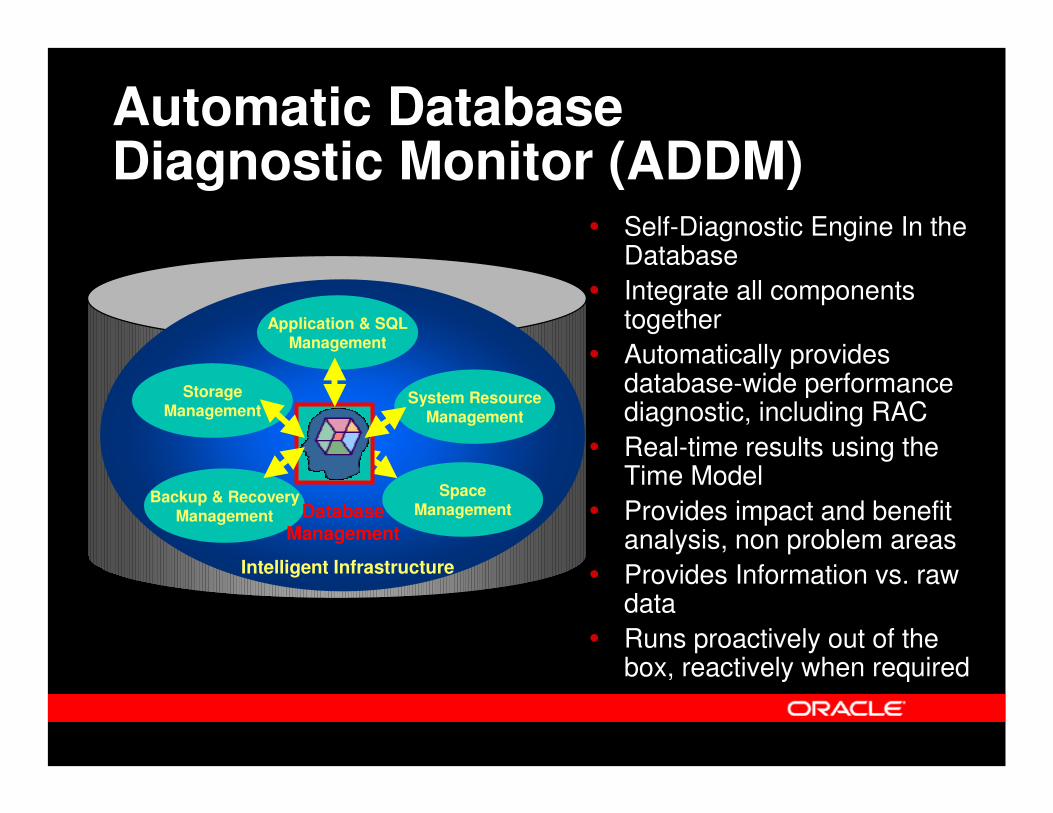
Automatic Database Diagnostic Monitor (ADDM)
� Self-Diagnostic Engine In the Database
� Integrate all components together
� Automatically provides database-wide performance diagnostic, including RAC
� Real-time results using the Time Model
� Provides impact and benefit analysis, non problem areas
� Provides Information vs. raw data
� Runs proactively out of the box, reactively when required
Intelligent Infrastructure
Application & SQLManagement
System ResourceManagement
SpaceManagement
Backup & RecoveryManagement
StorageManagement
Database Management
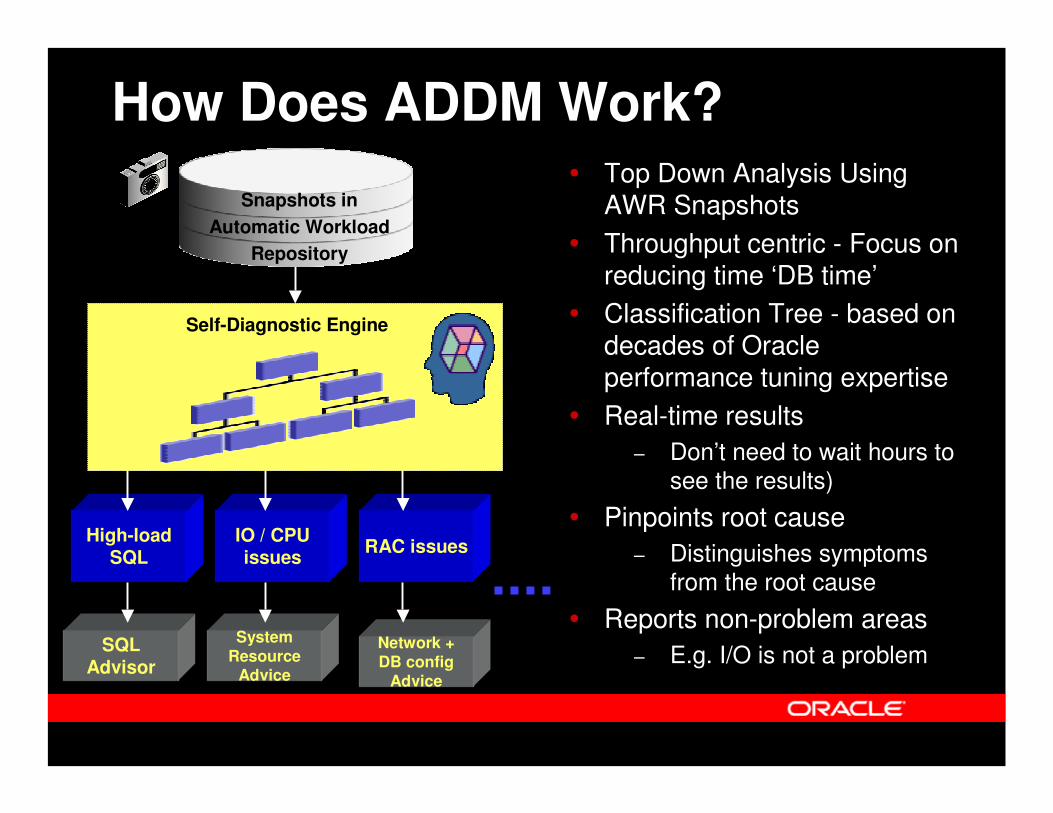
SQLAdvisor
High-load SQL
IO / CPU issues RAC issues
Automatic Diagnostic Engine
Snapshots inAutomatic Workload
Repository
Self-Diagnostic Engine
System Resource
Advice
Network + DB config
Advice
� Top Down Analysis Using AWR Snapshots
� Throughput centric - Focus on reducing time ‘DB time’
� Classification Tree - based on decades of Oracle performance tuning expertise
� Real-time results – Don’t need to wait hours to
see the results)
� Pinpoints root cause– Distinguishes symptoms
from the root cause
� Reports non-problem areas– E.g. I/O is not a problem
How Does ADDM Work?

Top Performance Issues Automatically Diagnosed by ADDM
� Not Rocket Science Any More– Top SQL– I/O Issues
� Hot Files, Bandwidth– Parsing
� Hard, Soft, Failed– Configuration Issues
� Log File Sizing� Log Buffer Sizing� Archiving� MTTR Setting
– Application Usage
� Not Diagnosable by Statspack– Excessive Logon/Logoff– Undersized Memory
� SGA, PGA– Hot Blocks and Objects
� Buffer Busy Waits� Cache Buffer Chain
Latches– RAC Service Issues
� Network, LMS, Remote Instance
– Locks & ITL contention– Checkpoint causes– PL/SQL, Java Time

Intelligent Infrastructure: Performance Overhead
� 2-3% Overhead for the Overall Infrastructure enabled by default
– Validated with real world customers for large, busy databases in production
– Most real-world system are not tuned generally and hence can benefit significantly

“New Age” Performance Tuning Methodology
� Start at the EM Performance Page– Assess the nature of the problem (transient or
otherwise)
� For non-transient problems, look at the relevant ADDM findings
� For transient problems, or for pre-Oracle10g databases
– Use EM Drill downs

Oracle 10g Automates the SQL Tuning Process
I can do it for you !
SQL Tuning Advisor
DBAHigh-Load
SQL
ADDM
SQLWorkload

Automatic SQL Tuning Overview
Add Missing Indexes
Modify SQL Constructs
Create a SQL Profile
Automatic Tuning Optimizer
SQL Structure Analysis
Access Path Analysis
SQL Profiling
Statistics Analysis
Gather Missing or Stale Statistics
DBA
SQL TuningRecommendations
SQL Tuning Advisor
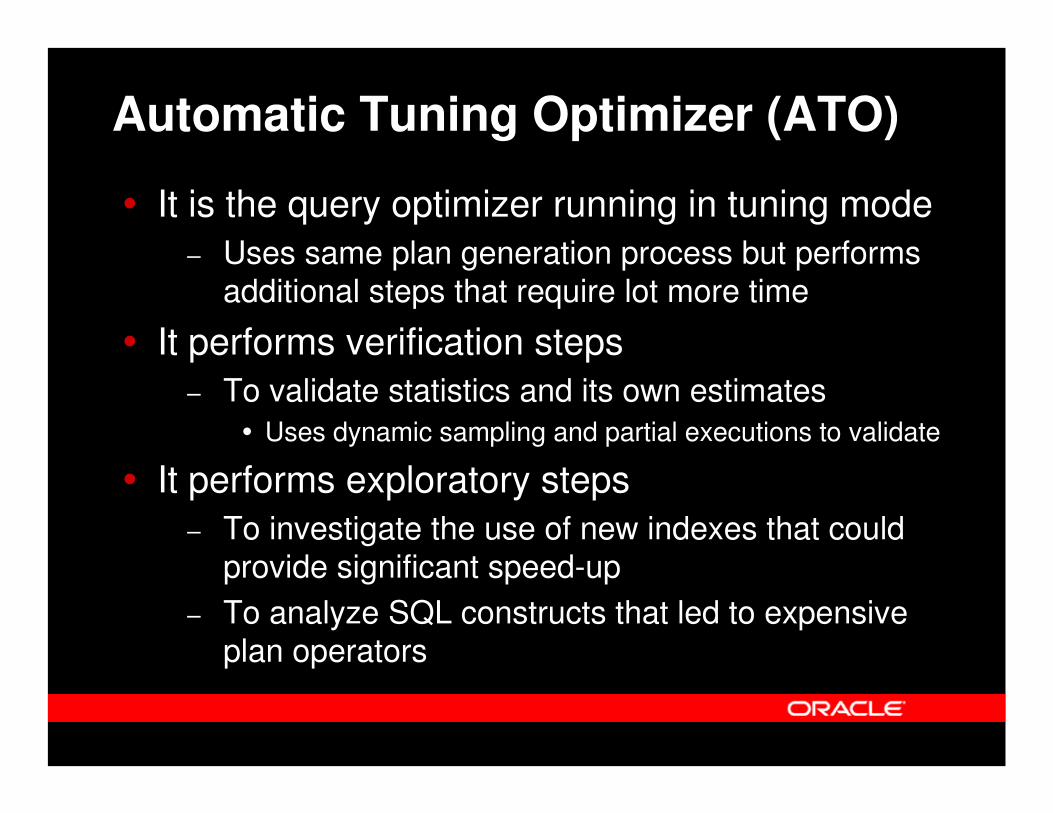
Automatic Tuning Optimizer (ATO)
� It is the query optimizer running in tuning mode– Uses same plan generation process but performs
additional steps that require lot more time
� It performs verification steps– To validate statistics and its own estimates
� Uses dynamic sampling and partial executions to validate
� It performs exploratory steps– To investigate the use of new indexes that could
provide significant speed-up– To analyze SQL constructs that led to expensive
plan operators

SQL Profiling� Motivation
– Empower query optimizer to find better plan by gathering additional information on query behavior
� The query optimizer has time constraints– Makes compromises while finding right plan
� The ATO is allowed a lot more time– Uses the time to gather customized information
about the SQL statement, known as SQL Profile– Builds a SQL Profile and recommends it– Once implemented, SQL Profile is used by the
query optimizer to generate a well-tuned plan

SQL Profiling Flow
Optimizer(Tuning Mode)
createsubmit
SQL Profiling
Optimizer(Normal Mode)
outputsubmit
SQL Profile
SQL TuningAdvisor
DatabaseUsers
Well-TunedPlan
After …
use

SQL Tuning Set (STS)
� Motivation– Enable user to tune custom set of SQL statements
� New object in Oracle10g for capturing and managing SQL workload
� Stores SQL statements along with:– Execution context: parsing user, bind values, etc.– Execution statistics: buffer gets, CPU time, elapse
time, number of executions, etc.
� Created from any SQL source– Sources: AWR, cursor cache, user-defined SQL
workload, another STS

SQL Tuning Set Benefits
� Allows selective, on-demand, custom SQL workload tuning
� Simplifies tuning of large number of SQL statements
� Is persistent� Provides a common infrastructure for dealing
with SQL workloads– Can be used as a source for different tuning tasks

SQL Access Advisor
Workload
Indexes Materialized ViewsMaterialized View Logs
SQL Access Advisor

SQL Access Advisor Features
� De-mystifies access structure design for optimal application performance
� Recommends indexes, materialized views, and materialized view logs to create and/or drop for faster performance
� Analyzes entire workload and not just independent SQL statements
� Takes into account impact of new access structures on DML operations
� Considers storage, creation and maintenance costs
SQL Tuning Set (STS)
� Motivation– Enable user to tune custom set of SQL statements
� New object in Oracle10g for capturing and managing SQL workload
� Stores SQL statements along with:– Execution context: parsing user, bind values, etc.– Execution statistics: buffer gets, CPU time, elapse
time, number of executions, etc.
� Created from any SQL source– Sources: AWR, cursor cache, user-defined SQL
workload, another STS

SQL Tuning Set Benefits
� Allows selective, on-demand, custom SQL workload tuning
� Simplifies tuning of large number of SQL statements
� Is persistent� Provides a common infrastructure for dealing
with SQL workloads– Can be used as a source for different tuning tasks

SQL Access Advisor
Workload
Indexes Materialized ViewsMaterialized View Logs
SQL Access Advisor
SQL Access Advisor Features
� De-mystifies access structure design for optimal application performance
� Recommends indexes, materialized views, and materialized view logs to create and/or drop for faster performance
� Analyzes entire workload and not just independent SQL statements
� Takes into account impact of new access structures on DML operations
� Considers storage, creation and maintenance costs

Usage Scenarios
WorkloadUser Defined
Hypothetical
Cursor Cache
Filter Options
STS
SQL Access Advisor

Filter Options
� Don’t have to use the entire workload� Filter by
– Application or module name– Number of SQL statements– Queries during a specified time window– Username– Tables
� must be in this list� not in this list

Filter Options
� Don’t have to use the entire workload� Filter by
– Application or module name– Number of SQL statements– Queries during a specified time window– Username– Tables
� must be in this list� not in this list

Demo Database Performance Tuning

Conclusion� Automates management of performance issues for
the Oracle Database– Automatic Performance Diagnosis– Guided problem resolution– Graphical, intuitive and easy to use – “Point & Click”
� Adds significant business value– Eliminates Fire drills – Enables higher QoS– Enhances DBA’s quality of life and productivity – Makes available more resources to focus on strategic
initiatives

Q U E S T I O N SQ U E S T I O N SA N S W E R SA N S W E R S

![IBS Hyderabad ... · Human Resource Management (ongoing) Career Management (ongoing) 2017 2017 2017 Course taught in BBA Year ... ICMR, India [Case No.: CLMM130]](https://img.pdfslide.us/doc/110x75/5aee747b7f8b9ac57a8c01a6/ibs-hyderabad-resource-management-ongoing-career-management-ongoing-2017.jpg)