Embed Size (px)
Citation preview
Paper ID #21139
End-of-Semester Control System Design Projects by Senior-level EET Stu-dents
Dr. Biswajit Ray, Bloomsburg University
Biswajit Ray received his B.E., M.Tech., and Ph.D. degrees in Electrical Engineering from Universityof Calcutta (India), Indian Institute of Technology-Kanpur (India), and University of Toledo (Ohio), re-spectively. He is currently the coordinator, and a professor, of the Electronics Engineering Technologyprogram at Bloomsburg University of Pennsylvania. Previously, he taught at University of Puerto Rico-Mayaguez, and designed aerospace electronics at EMS Technologies in Norcross, GA. Dr. Ray is activein power electronics consulting work for various industrial and governmental agencies.
Mr. Robert ChambersNathan Henry, Bloomsburg UniversityMr. Paul Michael Karcher
c©American Society for Engineering Education, 2018

End-of-Semester Control System Design Projects by Senior-Level EET Students
Abstract This paper presents student-initiated projects as part of a control systems course for senior-level electronics engineering technology (EET) students. Student outcomes and associated assessment methodologies as well as general project management concepts are discussed. Two recently completed control system design projects are reported in this paper: an automatic guitar tuner, and a ball balancing on a plate. Both projects focused on control system design and implementation, encompassing sensors and actuators, interface electronics, hardware and software integration, and control logic implementation in software (LabVIEW or Arduino). These end-of-semester course projects were carried out during the final four weeks of the semester, preceded by ten weeks of structured lecture/laboratory session. Introduction The ability to conduct and design experiments is rated as one of the most desirable technical skills of engineering and engineering technology graduates1. Specifically, the referenced survey indicates that employers want graduates with an ability to integrate hardware and software, and to formulate a range of alternative problem solutions. Additionally, potential employers of our EET graduates are primarily in the control and automation, and automated manufacturing and testing sectors of the industry, providing additional motivation for a control systems course embedding design projects that integrate hardware and software. The senior-level control systems course consists of two hours of lecture and three hours of laboratory per week. The first ten weeks of the fourteen-week semester are devoted to structured lecture and laboratory sessions. Topics include system modeling, steady state and dynamic response, system stability, controller design using root locus and frequency response techniques, and control system design and simulation using MATLAB/SIMULINK. The final four weeks are dedicated to student-initiated end-of-semester design projects2, emphasizing problem-based3 and project-based learning4-5, open-ended problem solving6, teamwork7-8, and project management9. This paper focuses on a general approach to implementing end-of-semester course projects, and assessment of the associated student outcomes for this project experience. Technical details of two sample control system design projects, an automatic guitar tuner and a ball balancing on a plate, implemented by students during the spring-2017 semester are also presented. Students taking this senior-level control systems course are expected to be conversant with LabVIEW programing/data-acquisition hardware, Arduino microcontroller hardware/software, and linear signals and systems concepts via prerequisite courses. Project experience gained in this course serves as a stepping-stone for the students taking the semester-long capstone design course the following semester. Student outcomes for the end-of-semester project experience After completing the end-of-semester control system design projects, students will develop the ability to:
• identify and seek information relevant to problem solution without guidance,

• select and design-in appropriate sensors and actuators, • consider and assess multiple methods and approaches to design, • update solution approach based on hardware and software testing, • implement a design solution and prototype functional hardware within time and cost
constraints, • use project management techniques including the Gantt chart, • recognize individual responsibility and fulfill their role to ensure team success, and • document and disseminate project goals and outcomes via written report and oral
presentation.
The above student outcomes are based on the established EET program assessment methodology, and are assessed using both direct and indirect measurement instruments. The assessment methodology and results are reported herein in a later section. Project management Early in the semester, students start developing potential end-of-semester project topics with appropriate feedback and guidance from the instructor, leading to a pre-proposal with two project ideas for each team of two students. The required preproposal is due by the eighth week of the fourteen-week semester. Upon discussion, modification, and approval of the pre-proposal, each team is required to submit a formal proposal for the approved project topic by the ninth week of the semester. The required proposal is quite detailed as it includes project implementation ideas supported by major outcomes and design specifications, control platform selection, hardware/software integration, I/O interface drawings, relevant circuit schematics, parts list with vendor and price information, and a four-week project completion schedule including a Gantt chart. For implementation of the projects, students are responsible for selecting the necessary sensors, actuators, and control platform (typically LabVIEW with myDAQ hardware, or Arduino microcontroller). Students are also given access to a well-equipped departmental shop for fabrication and metal/wood work, including SolidWorks-supported 3-D printers. Each team of two students is allocated a nominal budget of $150 for purchasing project-specific parts not typically available in the laboratory. Project deliverables include a functioning control hardware prototype along with supporting documentation (pre-proposal, proposal, mid-point design review summary, and final report) and a formal presentation. Prototype hardware, student presentations, and final reports are archived for use as part of the display materials for future accreditation visits. Project management skillsets developed in this course contribute to student success in the semester-long capstone design course offered the following semester. Sample student project: Automatic guitar tuner The goal of this project was to design and implement an automatic guitar tuner. The system design is based on closed-loop feedback from an oscillating guitar string to obtain a desired frequency from the string. Through manipulation of string tension using a servo motor, the frequency of the string is adjusted to match a predetermined frequency set within the application. This is repeated for all six strings of a conventional guitar and each string frequency is calibrated to conventional guitar tunings.
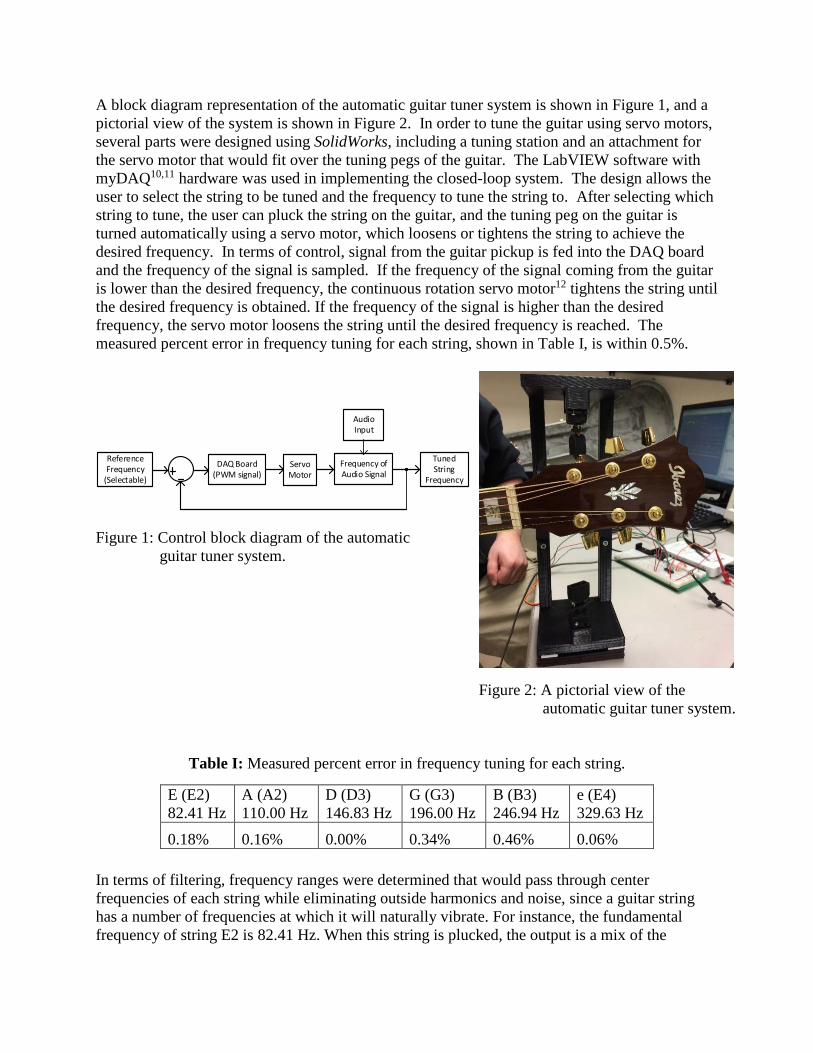
A block diagram representation of the automatic guitar tuner system is shown in Figure 1, and a pictorial view of the system is shown in Figure 2. In order to tune the guitar using servo motors, several parts were designed using SolidWorks, including a tuning station and an attachment for the servo motor that would fit over the tuning pegs of the guitar. The LabVIEW software with myDAQ10,11 hardware was used in implementing the closed-loop system. The design allows the user to select the string to be tuned and the frequency to tune the string to. After selecting which string to tune, the user can pluck the string on the guitar, and the tuning peg on the guitar is turned automatically using a servo motor, which loosens or tightens the string to achieve the desired frequency. In terms of control, signal from the guitar pickup is fed into the DAQ board and the frequency of the signal is sampled. If the frequency of the signal coming from the guitar is lower than the desired frequency, the continuous rotation servo motor12 tightens the string until the desired frequency is obtained. If the frequency of the signal is higher than the desired frequency, the servo motor loosens the string until the desired frequency is reached. The measured percent error in frequency tuning for each string, shown in Table I, is within 0.5%.
Reference Frequency
(Selectable)
DAQ Board(PWM signal)
Servo Motor
Frequency of Audio Signal
Audio Input
Tuned String
Frequency
Figure 1: Control block diagram of the automatic guitar tuner system.
Figure 2: A pictorial view of the automatic guitar tuner system.
Table I: Measured percent error in frequency tuning for each string.
E (E2) 82.41 Hz
A (A2) 110.00 Hz
D (D3) 146.83 Hz
G (G3) 196.00 Hz
B (B3) 246.94 Hz
e (E4) 329.63 Hz
0.18% 0.16% 0.00% 0.34% 0.46% 0.06% In terms of filtering, frequency ranges were determined that would pass through center frequencies of each string while eliminating outside harmonics and noise, since a guitar string has a number of frequencies at which it will naturally vibrate. For instance, the fundamental frequency of string E2 is 82.41 Hz. When this string is plucked, the output is a mix of the

fundamental frequency and its harmonics (164.82 Hz, 247.23 Hz and so on). Accordingly, bandpass filters were designed with a default bandwidth of 20 Hz, providing ample bandwidth to capture the center frequencies while filtering out the harmonics and noise. This bandwidth selection was done so that an allowable frequency range could be compared without picking up the next closest string. Another design objective was to eliminate frequency overshoot due to varying tensions within each string by adjusting the servo settings for each string. Each string on a standard guitar varies in gauge and the type of material used. Due to this fact, when tuning with the same servo settings on different strings, the varying tensions caused potential overshoot. To remedy this, since there was no obvious mathematical approach to use, a trial and error approach was used and servo speeds were set individually for each string. The servo is controlled by a 50 Hz signal, with a center duty cycle corresponding to the stop status of 7.37%. Its speed and direction of rotation are controlled by increasing or decreasing the duty cycle. For example, a duty cycle of 6.70% and 7.8% can be used to tighten and loosen a string, respectively. The LabVIEW front panel, shown in Figure 3, includes features besides a string selector. It displays a numerical value of the frequency, a meter to show how far out of tune the string is—sharp or flat—or if it is in the target frequency range, a graphical display of the frequency, a servo motor selector, and a string winding and de-winding feature.
Figure 3: LabVIEW front panel of the automatic guitar tuner.

The LabVIEW programming was designed using several loops; however, the first loop shown in Figure 4(a) is where most of the decision-making is done. The incoming audio signal from the guitar is read through the audio input channels on the DAQ board. Once the signal is read, it goes through a software band-pass filter with different parameters depending on which string is selected. Once the unwanted frequencies are filtered out of the signal a function in LabVIEW is used to extract information about the signal and the actual frequency is extracted from its tone information. Once the frequency of the signal is acquired, it is compared to a range of values that were selected depending on which string is selected. If the frequency detected in the signal is out of the range on the lower end then it will set a duty cycle for the PWM signal going to the servo that will make the servo tighten the string. If the frequency detected in the signal is out of the range on the higher end it will set a duty cycle for PWM signal going to the servo that will make the servo loosen the string. If the frequency detected is within the desired range then it will set a duty cycle that will cause the servo to stop. In the second loop, shown in Figure 4(b), a PWM signal of 50 Hz with an amplitude of 5 V is created and sent to the analog output channel on the DAQ board. This signal is used to control the speed and direction of the continuous rotation servo. The duty cycle of this signal is variable and depends on the cases in the first loop. Tasks for setting up the analog and digital inputs and outputs were set up individually instead of using the DAQ Assistant function in LabVIEW in order to have more control over the tasks, contributing to an efficient program. The test data acquired from LabVIEW while each string was being tuned are shown in Figure 5. The amount of frequency overshoot captured varied depending on the string being tuned; however, the settling time was negligible for all strings since 2% of the target frequency was reached rather quickly. On average, the rise time was in the 2 – 3 seconds range, which was dependent on the tuning servo speed. The rise time could have been reduced further but at the expense of having more overshoot due to the increased speed of the servo motor. No overshoot in frequency occurred while tuning the G string; however, because of its placement on the guitar being closer to the center of the neck, results in less tension on the string, which caused some oscillation near the target frequency. In addition, the G string being of a lighter material than the other strings has an effect on this as well; this is also true for the B string. It is to be noted that it is commonly known among musicians that the G and B strings are the two most difficult strings to keep in tune. It can be noticed that no overshoot in frequency occurred when strings A and E were tuned; this was due to the thickness tension factor of the strings. A lower frequency string is heavier but it does not have to be tightened as much to reach the desired frequency.

(a) String selection and frequency filtering, and PWM duty cycle generation
(b) Task to output a PWM signal on the analog channel
Figure 4: Partial LabVIEW programming for the automatic guitar tuner system.

(a) e-string tuning data
(c) G-string tuning data
(e) A-string tuning data
(b) B-string tuning data
(d) D-string tuning data
(f) E-string tuning data
Figure 5: Test data acquired from LabVIEW while each string is tuned
(Brown color: string reference frequency; Blue color: string frequency during tuning). Sample student project: Ball balancing on a plate The objective of this project was to create a system that will balance a ball on a flat surface or plate. A resistive touchscreen was used as the flat surface to generate signals for the location of the ball for both the X and Y directions. Additionally, two servo motors were used to adjust the angle of the plate, one for each axis. A pushbutton was used to let the user sequence through four different set points: center position, potentiometer controlled positioning, elliptical motion, and figure eight motion. An Arduino UNO13 microcontroller was used as the controller and proportional-derivative-double derivative14 (PDD2) concepts were used to control the position of the ball. A combination of wooden pieces and 3D-printed plastic parts were used to create the

physical structure. A one-inch diameter steel ball was used for the system, creating enough force to activate the touchscreen at all times. Figures 6 and 7 show the control block diagram of the system and a pictorial view of the prototype, respectively.
Position Reference
PDD2
ControllerServo
Tilt
Position Feedback
(Touchscreen)
Position of Ball
Arduino Microcontroller
Figure 6: Control block diagram of the ball
balancing on a plate system.
Figure 7: A pictorial view of the ball balancing on a plate system.
A four-wire resistive touchscreen15 was used to sense X and Y positions of the steel ball under control. The analog touchscreen, shown in Figure 8, has a two-layer structure consisting of polyester film with an indium-tin-oxide (ITO) membrane and sheet of glass. The surfaces of top and bottom electrodes have a uniform resistive film, with one electrode in the X-axis and the other in the Y-axis. When pressure is applied, it changes the resistance value between X1 and X2 and between Y1 and Y2. For reading the X-axis position: X1 is biased at 5 V, X2 is grounded, Y2 floats, and Y1 is the analog input to the system for the position of the ball. Biasing of the X and Y pins of the touchscreen needs to be reversed to read the Y-axis position information.
(a) Pictorial view
(b) Two-layer structure
(c) Biasing for position sensing
Figure 8: Four-wire resistive touchscreen. In terms of physical construction, a piece of plywood was used as the base of the system. As shown in Figure 7, a thin 3D-printed plate supported the resistive touch screen. Clamps were 3D-printed to hold the touch screen to the support plate. A 3D-printed column with a ball joint on top was used to support the center of the support plate. Two servo motors were mounted on the plywood base with arms reaching the plate support. All pieces were bolted to allow the system to be disassembled easily.

An Arduino UNO microcontroller was chosen for the control implementation primarily due to ease of controlling the high torque metal-geared servo motors16. Additionally, the bidirectional analog I/O pins of Arduino UNO work very well with the resistive touch screen position sensing unit since only one axis can be read at a time. The input-output functionality of the pins alternates as the axis being read alternates. In terms of implementation, the first goal of the project was to successfully control the position of the ball in the X-axis. This was accomplished by creating a guiderail that kept the ball centered on the Y-axis; therefore, adjustments were only needed on the X-axis. After the system successfully positioned the ball in the X-axis, similar controller gains were used for the Y-axis. Once the initial control parameters were established, the system successfully balanced the ball with no guiderails. The system was then extensively tested and PDD2 gains were adjusted to optimize the system performance. As shown in the control block diagram of Figure 6, the position reference, error calculations, and PDD2 controller are all handled by the Arduino. In this implementation, Arduino calculates a new position point of the ball in each axis at 50 Hz. Each time the new position is calculated, the current velocity and acceleration of the ball are also calculated. The calculated values of velocity and acceleration are in reality the average velocity and acceleration since the previous position reading. The current position, velocity, and acceleration values each contribute to the servo angle adjustment. A PDD2 controller configuration was used, instead of the standard PID configuration, since the system in this application is very dynamic and highly nonlinear as the gravity causes the ball to accelerate when the plate is tilted. Key sections of the Arduino code are shown in Figure 9. The definition of the input and output modes of relevant Arduino digital pins as well as biasing of the 4-wire resistive touchscreen interface for reading the X-position of the ball are shown in Figure 9(a). Averaging of the X-position data is shown in Figure 9(b), and implementation of the PDD2 controller using position, velocity, and acceleration information of the moving ball to calculate the desired servo angle is shown in Figure 9(c). In terms of user interface, a pushbutton was used to incorporate a few predefined ball trajectory control features. Accordingly, the set point of the system is determined by the number of times the pushbutton is pressed, with the default ball position being the center of the plate. At the first push, the set point is determined by the position of the external potentiometers. After the second push, the set point changes to an ellipse, and after the third push the set point changes to a figure eight. This cycle repeats with subsequent pushbutton presses. The designed system was tested under dynamic conditions along X-axis, Y-axis, and X-Y axes. Figure 10(a) shows the step response of the system along the X-axis as the normalized position was changed from 4.25 units to 2.5 units. During this test, the ball experienced an overshoot of approximately 23%, with a settling time of approximately 4 seconds and a damped oscillation frequency of approximately 0.45 Hz. Similarly, step response in Y-position is shown in Figure 10(b). It shows a slightly decreased overshoot and a slightly increased settling time, and includes subharmonic noise in the dynamic response. System response due to multiple step changes in X-position is shown in Figure 10(c). It can be observed that the system responded relatively quickly and always adjusted to the new reference position. System response to simultaneous step change in X and Y positions are shown in Figure 10(d), in this case the ball was commanded to move from a corner in the plate to its center position.

(a) Biasing the 4-wire plate, and reading X-position
(b) Averaging the X-position reading
(c) Calculating servo angle using PDD2
controller
Figure 9: Key sections of the Arduino code for ball balancing on a plate system. An elliptical trajectory was defined within Arduino, using parametric equations 𝑥𝑥(𝑡𝑡) = [2.5 +cos(2.75𝑡𝑡)] and 𝑦𝑦(𝑡𝑡) = [2.5 + 0.75 sin(2.75𝑡𝑡)]. The corresponding system response is shown in Figure 10(e). Similarly, the trajectory for a figure eight was defined using 𝑥𝑥(𝑡𝑡) = [2.5 +sin(1.75𝑡𝑡)] and 𝑦𝑦(𝑡𝑡) = [2.5 − 0.75 sin(3.5𝑡𝑡)], and the corresponding system response is shown in Figure 10(f). Due to mechanical imperfections of the system, the Y position constantly lagged behind the set point. This resulted in the ball position shifted in the negative Y direction and slightly in the positive X direction. This shifting error is primarily due to error in the flat angle set point in the system. However, the root cause of this error is due to mechanical imperfections in prototyping the system as well as misalignment between X and Y axes servos. To resolve this issue in the future, a tilt sensor could be added to the system to recalculate the flat angles of the servos each time the system is initialized.

(a) X-position: Step input
(c) X-position: Multiple step inputs
(e) X-Y position: Tracking an elliptical trajectory
(b) Y-position: Step input
(d) X-Y position: Step input from corner position
(f) X-Y position: Tracking a ‘figure eight’ shape
Figure 10: Experimental step response and trajectory tracking data for the ball balancing on a
plate system (Brown color: reference trajectory; Blue color: measured ball trajectory).

Assessment of student outcomes for the end-of-semester project experience Direct assessment of student outcomes for the project experience was conducted using several instruments including the project proposal, project evaluation rubric, final report rubric, and project presentation rubric. These assessment data were evaluated to generate action items to be implemented during the next offering of the course project experience. This feedback process is part of the EET program’s continuous improvement cycle that directly improves student learning. Example action items generated based on spring-2017 control systems project experience are: explicitly specify requirements for the project proposal, emphasize the importance of effective teamwork for project success, include a weekly progress report requirement, and include a timed practice presentation before the formal presentation. These action items will be implemented during the spring-2018 offering of the course. In addition to direct assessment, student outcomes for the end-of-semester project experience are assessed indirectly via student feedback. Results of the indirect assessment for spring-2017 offering are shown below. Indirect student assessment data (Number of students: 12)
Did the project experience contribute significantly in developing your ability to:
Definitely Somewhat Not really
identify and seek information relevant to problem solution without guidance?
75.0% 16.7% 8.3%
select and design-in appropriate sensors and actuators? 83.3% 16.7% 0% consider and assess multiple methods and approaches to design?
83.3% 16.7% 0%
update solution approach based on hardware and software testing?
91.7% 8.3% 0%
implement a design solution and prototype a functional hardware within time and cost constraints?
83.3% 16.7% 0%
use project management techniques including Gantt chart?
75.0% 16.7% 8.3%
recognize individual responsibility and fulfill role to assure team success?
83.3% 16.7% 0%
document and disseminate project goals and outcomes via written report and oral presentation?
75.0% 16.7% 8.3%
Student comments The process of developing, implementing, and testing a project from scratch was a valuable experience for most students. The majority of students were pleased with the project management structure, though a few suggested that the project duration within the control systems course be extended to five weeks (instead of the currently allocated four weeks), to help them transition into the semester-long capstone design course offered the following semester. Qualitative feedback from students is presented below through their comments.
Taking ownership of the project as a team was a great experience Liked working with software and hardware integration and testing Just getting to do a self-developed lab project was fun

Developing a working prototype within four weeks was both challenging and rewarding Reliance on partner was a problem at times Need to allocate more time to the testing phase of the project Emphasize the importance of build-and-test as we move along Make the students test all new parts during the first week of the project period
Summary Experience with student-initiated projects within the control systems course was presented. A few students struggled in defining the structure of their work at the beginning of the four-week project period. It was also observed that a few of the students did not have prior experience through coursework in designing, debugging and testing a system with multiple functional blocks, which contributed to their difficulty in breaking the design into functional modules and designing and testing them separately before putting them together. Improving student competence in this area will be a goal for the next offering of the course. Overall, the experience has been very rewarding and challenging for the students as well as the instructor. Assessment-generated action items will be implemented for the next offering of the course, and additional assessment data will be collected from future offerings as part of the program’s continuous improvement plan. References 1. J. D. Lang et al., “Industry expectations of new engineers: A survey to assist curriculum designers,”
Journal of Engineering Education, pp. 43-51, Jan 1999. 2. J. S. Dalton et al., “Mini-lab projects in the undergraduate classical controls course,” Proc. ASEE
Annual Conf., 2003. 3. B. Dutch et al., “The power of problem-based learning: A practical how-to for teaching undergraduate
courses in any discipline,” Stylus Publishing, 2001. 4. R. Savage, “A design methodology for empowering project-based learning,” Proc. ASEE Annual Conf.,
2007. 5. W. L. Stone et al., “Project-based learning integrating engineering technology and engineering,” Proc.
ASEE Annual Conf., 2017. 6. R. R. Ulseth et al., “A new model of project based learning in engineering education,” Proc. ASEE
Annual Conf., 2011. 7. K. A. Gibbons et al., “An approach to using undergraduate student teams to develop undergraduate
laboratory experiences,” Proc. ASEE Annual Conf., 2012. 8. E. An et al., “A project-oriented, team-based learning approach,” Proc. ASEE Annual Conf., 2009. 9. P. M. Yanik et al., “A pilot program in open-ended problem solving and project management,” Proc.
ASEE Annual Conf., 2017. 10. NI myDAQ Specifications, http://www.ni.com/pdf/manuals/373061f.pdf (accessed Jan. 22, 2018). 11. NI myDAQ User Guide, http://www.ni.com/pdf/manuals/373060g.pdf (accessed Jan. 22, 2018). 12. Continuous rotation servo, FeeTech FS5103R, Adafruit Product ID 154,
https://www.adafruit.com/product/154 (accessed Jan. 22, 2018). 13. Arduino UNO, http://www.arduino.org/products/boards/arduino-uno (accessed Jan. 22, 2018). 14. M. Ertogan et al., “Application of particle swarm optimized PDD2 control for ship roll motion with
active fins,” IEEE/ASME Trans. Mechatronics, Vol. 21, Issue 2, pp. 1004-1014, April 2016. 15. NKK Switches, 4-Wire Touch Screens (FT Series), http://www.nkkswitches.com/pdf/4-wireTouch-
2.pdf (accessed Jan. 22, 2018). 16. Micro servo, High torque metal gear (MG90S), Adafruit Product ID 1143,
https://www.adafruit.com/product/1143 (accessed Jan. 22, 2018).