Embed Size (px)
Citation preview
END OF CHEMOTHERAPY RESPONSE IN LYMPHOMA PATIENTS: THE PREDICTIVE
VALUE OF DUAL TIME POINT IMAGING OF MINIMAL RESIDUAL UPTAKE LESIONS DURING
INTERIM PET-CT
BY
DR. MOHD SYAHRIR BIN YUSOP
DISSERTATION SUBMITTED IN PARTIAL FULFILMENT OF THE REQUIREMENTS FOR THE DEGREE OF MASTER OF MEDICINE (NUCLEAR
MEDICINE)
ADVANCED MEDICAL AND DENTAL INSTITUTE UNIVERSITI SAINS MALAYSIA
2017

ii
DECLARATION I hereby declare that this research has been sent to Universiti Sains Malaysia for the
degree of Master of Medicine (Nuclear Medicine). It is also not to be sent to any other
universities. With that, this research might be used for consultation and will be
photocopied as reference.
________________________________________________ Dr.Mohd Syahrir bin Yusop PIPM 0009/12

iii
DEDICATION
This dissertation is dedicated to my beloved parents for their unconditional support,
encouragement, understanding and sacrifices.
iv
CONTENTS
Page
DECLARATION ii
DEDICATION iii
ACKNOWLEDGEMENT vii
LIST OF TABLES viii
LIST OF FIGURES ix
ABBREVIATIONS AND SYMBOLS xi
ABSTRAK xiii
ABSTRACT xv
CHAPTER 1 INTRODUCTION
1.1 Introduction 1
CHAPTER 2 LITERATURE REVIEW
2.1 General overview of lymphoma 3
2.2 Positron Emission Tomography in staging and end-
treatment response assessment in lymphoma
5
2.3 Interim FDG PET-CT scan in lymphoma 8
2.4 Minimal residual uptake lesion in interim FDG PET-CT
scan
8
2.5 Maximum standardised uptake value (SUVmax), Dual
time point imaging (DTPI) technique and Retention
Index (RI)
11
2.6 Metabolic tumour volume (MTV) 14
v
CHAPTER 3 OBJECTIVES AND HYPOTHESES
3.1 Justification of the study 16
3.2 Benefits of the study 16
3.3 General objective 17
3.4 Specific objectives 17
3.5 Research hypothesis 17
3.6 Null hypothesis 18
3.7 Research framework 19
CHAPTER 4 METHODOLOGY
4.1 Research location 20
4.2 Research design 20
4.3 Research period 20
4.4 Sampling 20
4.5 Variable definition 21
4.6 Research protocol 22
4.7 Patient preparation 23
4.8 Image protocol 23
4.9 Imaging processing 24
4.10 Image analysis 24
4.11 Data collection 25
4.12 Statistical analysis 25
4.13 Ethical issues 26
vi
CHAPTER 5 RESULTS
5.1 Socio-demographic characteristics 27
5.2 Clinical characteristics 29
5.3 Statistical analysis of MRU lesions based on SUVmax,
Retention Index, MTV and end treatment response
31
5.4 Demographic analysis 48
CHAPTER 6 DISCUSSION
6.1 Factors that may influence treatment response
assessment at interim FDG PET-CT scan in lymphoma
patients with MRU lesions
51
6.2 DTPI technique at interim FDG PET-CT scan on MRU
lesions in predicting end of chemotherapy response
54
6.3 Prognostic prediction of DTPI in solid tumour 59
6.4 Socio demographic factors 60
CHAPTER 7 CONCLUSION, STUDY LIMITATIONS
RECOMMENDATIONS
62
63
REFERENCES 64
APPENDICES

vii
ACKNOWLEDGEMENT
I would like to extend my heartfelt gratitude to my supervisors Dr. Aini Ab. Aziz and
Dr. Mahayuddin Abdul Manap for their guidance, supervision and encouragement in
completing this study.

viii
LIST OF TABLES
Table no Page Table 2.0 Deauville Criteria 7
Table 4.0 Dose administration according to body weight 23
Table 5.0 Crosstabulation of response rate between HL and NHL 49
Table 5.1 Chi-Square test results of response rate between HL and NHL 49
Table 5.2 Hosmer and Lemeshow Test 50
Table 5.3 Logistic regression model 50

ix
LIST OF FIGURES
Figure Page
Figure 5.0 Histogram showing the age distribution with two distinct age
peaks
28
Figure 5.1 (A) demonstrates MRU Deauville 2 lesion at right cervical
node, (B) Mediastinal blood pool SUVmax 2.69 and (C) Liver
SUVmax 3.77
30
Figure 5.2 Histogram showing normal data distribution of SUVmax early 33
Figure 5.3 Histogram showing normal data distribution of SUVmax
delayed
34
Figure 5.4 Histogram showing skewed data distribution of SUVmax change
of responder group
35
Figure 5.5 Histogram showing skewed data distribution of SUVmax change
of non-responder group
36
Figure 5.6
Box and whiskers plots showing distribution of retention index
for responder and non-responder groups
37
Figure 5.7 Box and whiskers plots showing distribution of SUVmax
change among the 4 groups (CMR= complete metabolic
response, PR= partial response, Stable= stable disease, PD=
progressive disease)
39
Figure 5.8 Histogram showing skewed data distribution of MTV change of
responder group
41
Figure 5.9 Histogram showing skewed data distribution of MTV change of
non-responder group
42
x
Figure 5.10 Box and whiskers plots showing distribution of MTV change
between responder and non-responder groups
43
Figure 5.11 Histogram showing skewed data distribution of SUVmax change
of Deauville 2 group
45
Figure 5.12 Histogram showing skewed data distribution of SUVmax
change of Deauville 3 group
46
Figure 5.13 Box and whiskers plots showing distribution of SUVmax
change between Deauville 2 and Deauville 3 groups
47
xi
ABBREVIATIONS AND SYMBOLS ABVD Adriamycin, Bleomycin, Vinblastine, Dacarbazine BEACOPP Bleomycin, Etoposide, Adriamycin, Cyclophosphamide,
Oncovin (Vincristine) , Procarbazine, Prednisalone BFM Berlin-Frankfurt-Munster chemotherapy CVAD Cyclophosphamide, Vincristine, Adriamycin, Dexamethasone DLBCL Diffuse large B-cell lymphoma DTPI Dual time point imaging F-18 FDG Fluorine-18 Fluorodeoxyglucose FDG Fluorodeoxyglucose FL Follicular lymphoma HL Hodgkin lymphoma MRU Minimal residual uptake MTV Metabolic tumour volume NHL Non-Hodgkin lymphoma OS Overall survival PET Positron Emission Tomography PET-CT Positron Emission Tomography-Computed Tomography PFS Progression free survival R-CHEOP Rituximab, Cyclophosphamide, Hydroxydaunorubicin,
Etoposide, Oncovin, Prednisalone
R-CHOP Rituximab, Cyclophosphamide, Hydroxydaunorubicin, Oncovin,
Prednisalone
R-EPOCH Rituximab, Etoposide, Prednisalone, Oncovin,
Cyclophosphamide, Hydroxydaunorubicin
xii
RI Retention Index SUVmax Maximum Standardised Uptake Value SUVmax change Maximum Standardised Uptake Value change UNITS kg kilogram
MBq Mega Becquerel
mmol/l millimol per litre
xiii
ABSTRAK
Pengenalan Penilaian peringkat awal tahap keberkesanan rawatan kemoterapi yang
diberikan kepada pesakit limfoma adalah penting kerana ia membolehkan pesakit yang
tidak bertindak balas dikenal pasti lebih awal. Imbasan interim Fluorine-18
Fluorodeoxyglucose (F-18 FDG atau FDG) Positron Emission Tomografi – Komputer
Tomografi (PET-CT) adalah pengimejan imbasan yang masih di peringkat kajian dari
segi kegunaannya dalam menilai tahap awal keberkesanan rawatan limfoma. Semasa
menilai tahap keberkesanan rawatan pada peringkat awal, kewujudan lesi yang
menunjukkan tahap pengambilan sederhana (lesi MRU) menimbulkan kesukaran dalam
menentukan keberkesanan rawatan sama ada ia perlu dikategorikan sebagai rawatan
yang berkesan atau tidak. Bagi mendapatkan maklumat yang lebih lanjut berkaitan lesi
MRU, kaedah pengimejan imbasan dwi-masa (DTPI) dan analisis semikuantitatif
digunakan. Tujuan kajian ini adalah untuk menilai kaedah DTPI yang dibuat ke atas lesi
MRU semasa peringkat awal rawatan sama ada ianya boleh meramal keberkesanan
rawatan di akhir sesi kemoterapi.
Metodologi Satu kajian prospektif telah dijalankan di Jabatan Pengimejan Molekul dan
Perubatan Nuklear, Hospital Canselor Tuanku Muhriz bermula daripada April 2014
sehingga Ogos 2015 melibatkan 28 orang pesakit limfoma dengan 67 lesi MRU. Pesakit
yang terlibat dikenalpasti semasa menjalani sesi imbasan interim FDG PET-CT. Semasa
sesi imbasan interim FDG PET-CT, kaedah DTPI telah dilaksanakan ke atas lesi MRU
dan nilai perubahan pengambilan terpiawai maksimum (SUVmax perubahan),
perubahan isipadu tumor metabolik (MTV perubahan) serta indeks penahanan (RI)
dikira. Selepas pesakit menjalani sesi imbasan interim FDG PET-CT, pesakit akan
menjalani satu lagi imbasan FDG PET-CT yang dibuat setelah sesi kemoterapi tamat.
Pada peringkat ini, pesakit akan dibahagikan kepada dua kumpulan iaitu kumpulan
xiv
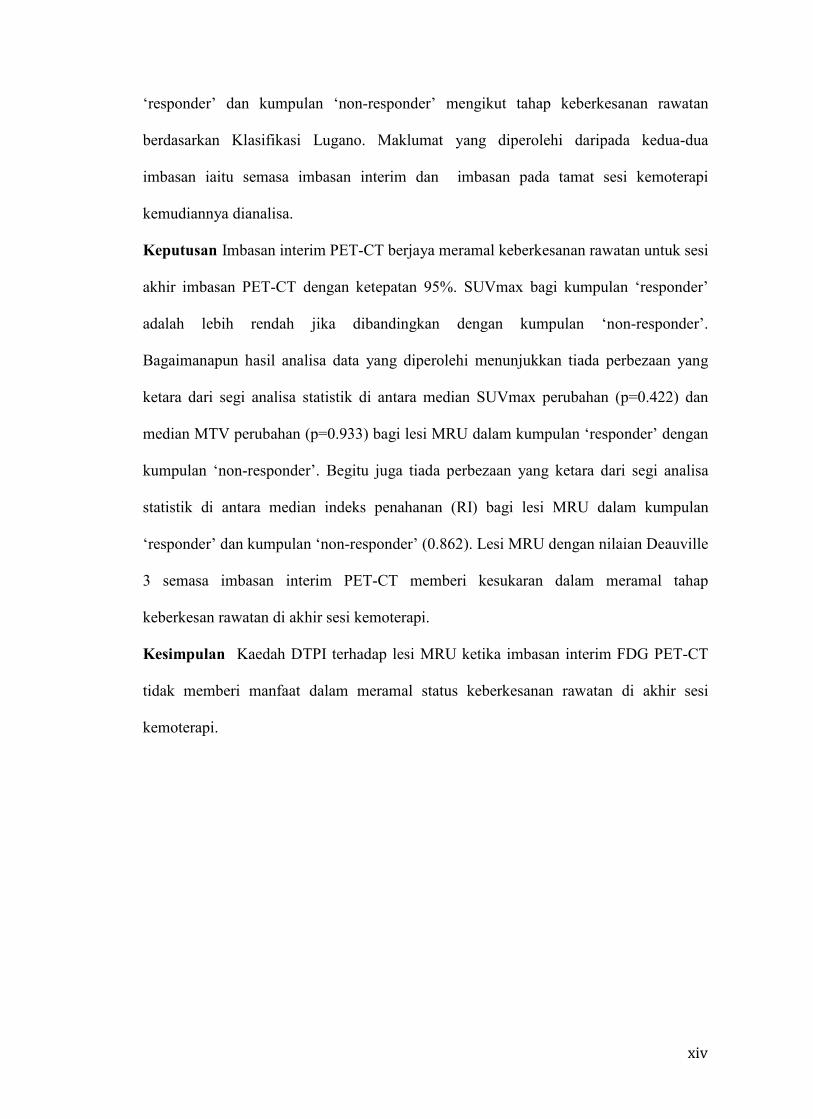
‘responder’ dan kumpulan ‘non-responder’ mengikut tahap keberkesanan rawatan
berdasarkan Klasifikasi Lugano. Maklumat yang diperolehi daripada kedua-dua
imbasan iaitu semasa imbasan interim dan imbasan pada tamat sesi kemoterapi
kemudiannya dianalisa.
Keputusan Imbasan interim PET-CT berjaya meramal keberkesanan rawatan untuk sesi
akhir imbasan PET-CT dengan ketepatan 95%. SUVmax bagi kumpulan ‘responder’
adalah lebih rendah jika dibandingkan dengan kumpulan ‘non-responder’.
Bagaimanapun hasil analisa data yang diperolehi menunjukkan tiada perbezaan yang
ketara dari segi analisa statistik di antara median SUVmax perubahan (p=0.422) dan
median MTV perubahan (p=0.933) bagi lesi MRU dalam kumpulan ‘responder’ dengan
kumpulan ‘non-responder’. Begitu juga tiada perbezaan yang ketara dari segi analisa
statistik di antara median indeks penahanan (RI) bagi lesi MRU dalam kumpulan
‘responder’ dan kumpulan ‘non-responder’ (0.862). Lesi MRU dengan nilaian Deauville
3 semasa imbasan interim PET-CT memberi kesukaran dalam meramal tahap
keberkesan rawatan di akhir sesi kemoterapi.
Kesimpulan Kaedah DTPI terhadap lesi MRU ketika imbasan interim FDG PET-CT
tidak memberi manfaat dalam meramal status keberkesanan rawatan di akhir sesi
kemoterapi.
xv
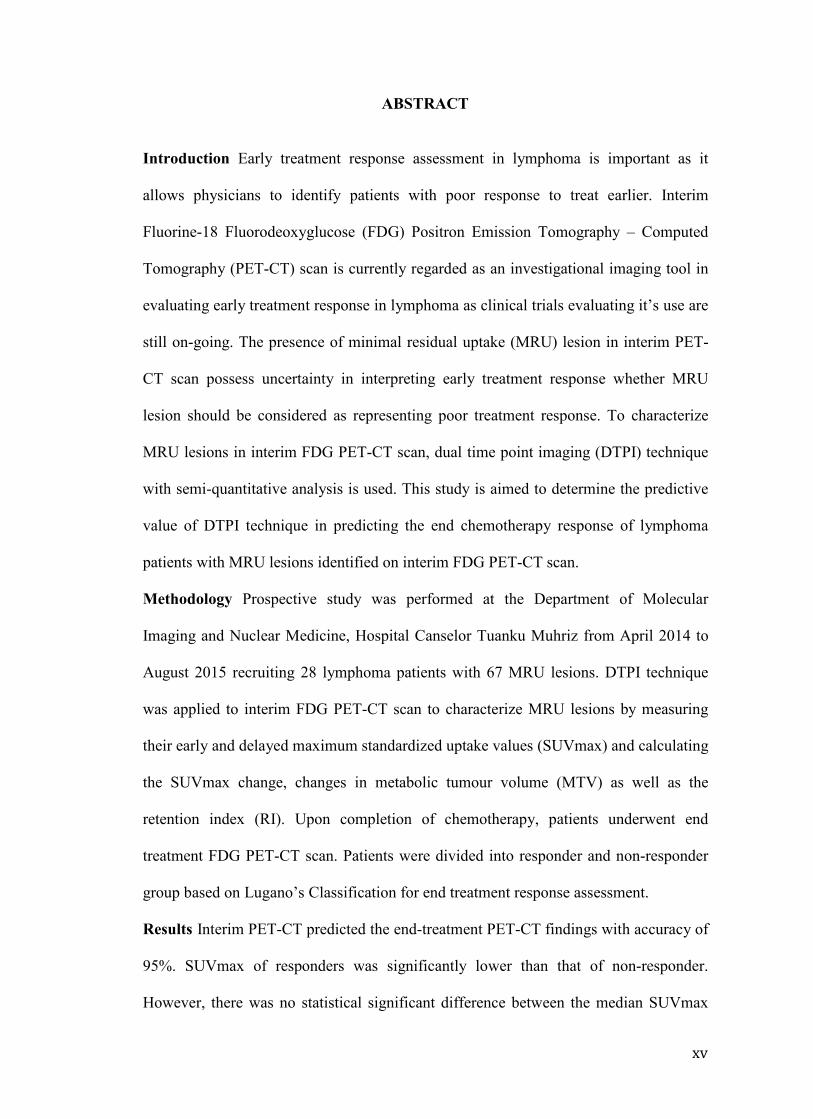
ABSTRACT
Introduction Early treatment response assessment in lymphoma is important as it
allows physicians to identify patients with poor response to treat earlier. Interim
Fluorine-18 Fluorodeoxyglucose (FDG) Positron Emission Tomography – Computed
Tomography (PET-CT) scan is currently regarded as an investigational imaging tool in
evaluating early treatment response in lymphoma as clinical trials evaluating it’s use are
still on-going. The presence of minimal residual uptake (MRU) lesion in interim PET-
CT scan possess uncertainty in interpreting early treatment response whether MRU
lesion should be considered as representing poor treatment response. To characterize
MRU lesions in interim FDG PET-CT scan, dual time point imaging (DTPI) technique
with semi-quantitative analysis is used. This study is aimed to determine the predictive
value of DTPI technique in predicting the end chemotherapy response of lymphoma
patients with MRU lesions identified on interim FDG PET-CT scan.
Methodology Prospective study was performed at the Department of Molecular
Imaging and Nuclear Medicine, Hospital Canselor Tuanku Muhriz from April 2014 to
August 2015 recruiting 28 lymphoma patients with 67 MRU lesions. DTPI technique
was applied to interim FDG PET-CT scan to characterize MRU lesions by measuring
their early and delayed maximum standardized uptake values (SUVmax) and calculating
the SUVmax change, changes in metabolic tumour volume (MTV) as well as the
retention index (RI). Upon completion of chemotherapy, patients underwent end
treatment FDG PET-CT scan. Patients were divided into responder and non-responder
group based on Lugano’s Classification for end treatment response assessment.
Results Interim PET-CT predicted the end-treatment PET-CT findings with accuracy of
95%. SUVmax of responders was significantly lower than that of non-responder.
However, there was no statistical significant difference between the median SUVmax
xvi
change (p= 0.422) and median MTV change (p= 0.930) of MRU lesions in responder
and non-responder groups. There is also no statistical significant difference between RI
in responder and non-responder groups (p = 0.862). MRU lesions with Deauville 3 at
interim PET-CT were less predictable end-treatment response.
Conclusion DTPI technique applied during interim PET-CT has no predictive role in
indicating end chemotherapy response in lymphoma patients with MRU lesions.

1
CHAPTER 1
INTRODUCTION
1.1 Introduction
Positron emission tomography – computed tomography (PET-CT) with
Fluorine-18 Fluorodeoxyglucose (FDG) has become an essential imaging investigation
in the management of lymphoma. It is used for disease staging and treatment response
assessment. In terms of assessing treatment response, PET –CT scan performed during
treatment (interim PET-CT scan) has the potential to be used to assess chemosensitivity
of tumour and to predict the treatment outcome (Valls et al., 2016). Information
obtained from interim PET-CT scan is helpful in guiding clinicians in planning the
chemotherapy with the aims of achieving a better quality of life by minimizing side
effects as well as prolonging survival. Interim PET-CT scan is considered at present as
a research tool. Its use in response adapted-chemotherapy trials in lymphoma are
currently under evaluation.
In order to improve the response assessment interpretation in interim PET-CT
scan, Deauville criteria was introduced in 2009 (Moghbel et al., 2016) . With the
introduction of Deauville criteria, a term called minimal residual uptake (MRU) lesion
which refer to lesion with Deauville score of 2 to 3 was re-defined. The presence of
MRU lesions in interim PET-CT scan cause a considerable uncertainty in predicting the
outcome of chemotherapy as well as early response interpretation. In one study
involving interim FDG PET-CT scan in NHL patients, early stage NHL patients with
MRU lesions have different outcome compared to advanced stage NHL (Mikhaeel et
al., 2005). In response adapted-chemotherapy trials, MRU lesion in interim FDG PET-
CT scan is assigned to a different treatment strategy.
2
In order to further assess MRU lesions, apart from Deauville criteria which is
based on visual interpretation of FDG PET-CT scan images, semi-quantitative analysis
with application of dual-time point imaging (DTPI) technique, could be used.
Maximum standardised uptake value (SUVmax) is an example of semi-quantative
analysis in which it offer information on quantitative aspect of FDG uptake. DTPI
technique in PET-CT scan is often used to study tracer kinetics. It has been used in
investigation of lymphoma and has significantly improved the specificity and sensitivity
of PET imaging (Michihiro et al., 2013). DTPI technique has been shown to produce
higher accuracy rate in diagnosis, staging of malignant lymphoma and also in predicting
the histological grades of malignancy (Takayoshi et al., 2012).
This study is designed to evaluate the significance of MRU lesions in interim
FDG PET-CT by application of DTPI technique. Semi-quantitative analysis of FDG
uptake by measuring the maximum standardised uptake value (SUVmax) of the MRU
lesions in order to study its kinetic behaviour. Retention index (RI) and metabolic
tumour volume (MTV) of MRU lesion are also calculated to give added value to the
analysis. The aim of this study is to look for any association between the change of
SUVmax value, the change of MTV value and RI of MRU lesions obtained during
interim FDG PET-CT scan with end of treatment response based on FDG PET-CT scan
results performed after completion of therapy.
3
CHAPTER 2
LITERATURE REVIEW
2.1 General overview of lymphoma
Lymphoma is a type of neoplasm involving the lymphatic system (Swerdlow et
al., 2016). It is a diverse group of diseases that occurs as the result of a clonal expansion
of lymphocytes. Each types of lymphoma is a disease with a distinct clinical
manifestation. This biologic diversity gives rise to prominent differences among the
lymphomas in terms of clinical presentation, pathological characteristics, epidemiology
and overall management.
Based on the World Health Organisation (WHO) classification of lymphoma
which was published in 2008, lymphoma is divided into several major groups with each
groups consists of various types and certain types are further divided into sub-types.
The WHO classification is based on combination of morphology, immunophenotype,
genetic features, molecular characteristics and clinical presentation. Among these major
groups, only Hodgkin’s lymphoma (HL), the abnormal lymphocyte is the Reed-
Sternberg cell. This particular lymphocyte is not found in other groups of lymphoma.
All other groups of lymphoma are called non-Hodgkin lymphoma (NHL) and there are
about thirty types of NHL. Lymphoma can also be classified based on the rate of
growth, areas of presentation and by lymphocyte type (Swerdlow et al., 2016).
NHL is more common than HL. According to the National Cancer Registry
2003 and 2007, lymphoma is the sixth most common cancer among Malaysians. Based
on gender, lymphoma is the sixth most common cancer in males and the eighth most
common cancer in females. The cancer incidence per 100,000 population for HL is 0.7
for male and 0.6 for female, and for NHL is 4.7 and 3.4 in male and female,

4
respectively. Among the NHL, the two commonest types of NHL are diffuse large B-
cell lymphoma (DLBCL) and follicular lymphoma (FL) (Armitage et al., 1998). Of all
NHL cases, DLBCL make-up of 30-58% cases (Tilly et al., 2015) and FL accounting
for about 20% of all lymphomas (Luminari et al., 2012).
Staging for lymphoma is used to identify disease location and extent, offers
prognostic information, allows useful comparisons among studies and this will give the
opportunity to assess disease progression or response to treatment. Both HL and NHL
were staged based on Ann Arbor classification system (Cheson et al., 2007). The Ann
Arbor staging system was originally published in 1971. In 1989 the ‘Cotswold
modifications’ was added subsequently to extend the definitions of stage IV disease,
and also adding the suffix ‘X’ for description of bulky disease (Cheson et al., 2007). In
2014, the International Conference on Malignant Lymphomas published guidelines for
the evaluation, disease staging and treatment response assessment of patients with
malignant lymphomas. The staging system is known as the Lugano Modification of the
Ann Arbor staging system (Cheson et al., 2014).
Chemotherapy options for HL are based on the stage of HL. In general, the main
chemotherapy regimes used is a combination of adriamycin, bleomycin, vinblastine and
dacarbazine (ABVD). Other chemotherapy regime is used in advanced stage HL which
is combination of bleomycin, etoposide, adriamycin, cyclophosphamide, vincristine,
procarbazine and prednisalone (BEACOPP). Radiotherapy is used after completion of
chemotherapy in limited and intermediate stage of HL. In general, advanced stage
HL is commonly treated with chemotherapy alone. Radiotherapy treatment is confined
to patients having large residual masses after chemotherapy (Eichenauer et al., 2011).
Chemotherapy options for NHL groups vary because of its heterogenous nature.
In DLBCL, the combination chemotherapy with rituximab, cyclophospamide,

5
doxorubicin, vincristine and prednisolone (R-CHOP) is the standard chemotherapy
regime used (Tilly et al., 2015). In FL, the chemotherapy may include a single agent, for
example rituximab, or multi-agent chemotherapy, like R-CHOP (Luminari et al., 2012).
2.2 Positron Emission Tomography in staging and end-treatment response in
lymphoma
Positron emission tomography (PET) is a three-dimensional, noninvasive
functional imaging tool that has become an important and essential imaging modality in
clinical oncology. It was first introduced in the early 1950s for brain imaging. In 2001,
positron emission tomography/X-ray computed tomography (PET-CT) hybrid imaging
system became commercially available. This has improved the detection and
localisation of lesions (International Atomic Energy Agency, 2008).
Fluorine-18 Fluorodeoxyglucose (FDG), a glucose analog, is the commonest
PET tracer used in clinical oncology. After injection, FDG is taken up by cells.
Subsequently it is phosphorylated in the same process as glucose. However, the
phosphorylated product is not further metabolized. It remains trapped in the cells for
extended periods of time (Weiss et al., 2012). This process of FDG accumulation is
detected by PET-CT scan, and provides visualisation of glucose consumption by
different cells in the body. In cancer cells, there is increased in the number of the
membrane glucose transporters, known as GLUT-1 and GLUT-3, as well as increased
in enzyme hexokinase and with overall augmented glucose metabolism, making FDG
the most suitable tracer for measuring viability of malignant cells. When the anatomical
imaging tool CT is combined with PET, the hybrid PET-CT scan will deliver more
precise images that can discriminate between physiological and pathological FDG
6
uptake. PET-CT scan is also able to differentiate between necrotic masses and viable
tumours (Kinahan et al., 2010).
FDG PET scan is a useful functional imaging tool which has a higher sensitivity
and specificity than conventional imaging in evaluation of lymphoma (Spaepen et al.,
2001). For example, up to 64% of lymphoma patients are found to have residual or
remaining lesional abnormalities following chemotherapy treatment as a result from the
development of tumour fibrosis or necrosis. Conventional imaging alone cannot reliably
differentiate between these abnormalities with active residual tumour.
In general, most of malignant lymphomas are FDG-avid, including both
aggressive and indolent subtypes. Examples include HL, Burkitt lymphoma, mantle cell
lymphoma, anaplastic large T-cell lymphoma, marginal zone lymphoma (nodal),
lymphoblastic lymphoma, angioimmunoblastic T-cell lymphoma, plasmacytoma,
natural killer/T-cell lymphoma, diffuse large B-cell lymphoma, follicular lymphoma
and peripheral T-cell lymphoma. A few examples of low FDG avid lymphoma include
small lymphocytic lymphoma, enteropathy-type T-cell lymphoma, MALT marginal
zone lymphoma, lymphomatoid papulosis and primary cutaneous anaplastic large T-cell
lymphoma (Sagie et al., 2010).
PET-CT scan with FDG has been utilised extensively in managing malignant
lymphoma. It is a recommended imaging modality in disease staging and chemotherapy
response assessment in FDG avid lymphoma (Cheson B., 2014). Information obtained
is used to monitor disease progression and guide clinician in management of the
disease. Lugano Classification, which was introduced in 2014 as an updated version of
the 2007 Revised Response Criteria for malignant lymphoma, recommends FDG PET-
CT scan for pretreatment staging assessment and end-treatment response assessment
after completion of treatment.

7
Based on Lugano Classification, the end-treatment FDG PET-CT scan is
interpreted using a five-point visual scale known as Deauville criteria, also known as
the London criteria which was introduced in 2009 (Moghbel et al., 2016). The Deauville
criteria initially proposed as a guideline in interpretation of findings in treatment
response assessment in interim FDG PET-CT scan (Barrington et al, 2010). FDG uptake
in the nodal/lesion is compared visually with two reference sites, the mediastinal blood
pool and the liver, and score from 1 to 5 is given based on the comparison (Table 2.0).
Table 2.0 Deauville Criteria. Deauville Criteria
Point scale Description 1 No uptake 2 Uptake ≤ mediastinum 3 Uptake > mediastinum ≤ liver 4 Uptake moderately more than liver
uptake, at any site 5 Markedly increased uptake at any site and
new sites of disease Source: Valls, L., et al. (2016). ‘FDG-PET imaging in haematological malignancies’, Blood Review, vol.30, no.4, July, pp323.
The Deauville criteria is now recommended as guideline in interpretation of
treatment response assessment in both interim and end-treatment FDG PET-CT scan.
Four categories of response have been outlined (Cheson et al,. 2014) as follows: (a)
complete metabolic response – score of 1, 2 or 3; (b) partial metabolic response – score
of 4 or 5 with reduced FDG uptake; (c) no metabolic response – score of 4 or 5 without
significant change in FDG uptake; and (d) progressive metabolic disease – score of 4 or
5 with increased FDG uptake or with new lesions.

8
2.3 Interim FDG PET-CT scan in lymphoma
FDG PET-CT scan has been utilised as a monitoring tool in FDG avid
lymphoma especially in assessing response to treatment given (Johnson et al., 2015).
Information obtained could be used to alter the treatment for a better outcome. As
mentioned earlier, FDG PET-CT scan in FDG avid lymphoma is performed before
initiation of treatment for staging assessment and at the end of treatment for end
treatment response assessment (Cheson et al,. 2014).
Interim FDG PET-CT scan refers to scan that is performed during a schedule
course of chemotherapy, prior to completion. Interim FDG PET-CT scan, at the time of
this writing, is still considered as an investigational imaging modality and has not yet
been implemented in clinical practice (Cheeson et al,. 2014). It has a promising role for
assessment of chemosensitivity and offers prognostic value in predicting end of
treatment response (Itti et al., 2009). The key interests of interim PET-CT scan in
lymphoma are to assess its capability in term of predicting the outcome of treatment and
in assessing chemotherapy sensitivity with the aim of modifying treatment given.
Interim FDG PET-CT scan has a potential use in response-adapted therapy,
whereby treatment could be de-escalated in intensity in the setting of a satisfactory early
response or escalated if early response is inadequate based on interim FDG PET-CT
scan findings (Hutching et al,. 2009). Deauville criteria, which was mentioned earlier, is
used to interpret interim FDG PET-CT scan as recommended by Lugano Classification.
2.4 Minimal residual uptake lesion in interim FDG PET-CT scan
In 10% of patients diagnosed with HL, whom undergoing interim FDG PET-CT
scan, a persistent faint residual FDG uptake often observed in a site with previous bulky
disease and it is interpreted as minimal residual uptake (MRU). MRU was first defined
9
as a FDG uptake just above background, which was unlikely to represent persisting
disease (Huching et al., 2005). In order to improve interim FDG PET-CT scan
interpretation and with the introduction of Deauville criteria, the definition of MRU has
changed and based on Deauville criteria it is defined as lesion or lymph node with score
2 or 3 (Barrington et al., 2010).
High grade NHL patients with MRU lesion in interim FDG PET scan after two
to three cycles of chemotherapy were found in a study done by Mikhaeel et al., to have
a different progression free survival (PFS) and overall survival (OS). In this study,
which was done before introduction of Deauville criteria, recruited one hundred and
twenty one patients with high grade NHL and underwent interim FDG PET scan. PET-
negative scan was interpreted as non-visualisation of all abnormal disease-related FDG
uptake. PET-positive scan was interpreted as presence of persistent FDG uptake sites or
appearance of new sites of increased FDG uptake, related to lymphoma. MRU was
defined in this study as a focus of low grade FDG uptake within an area of previously
noted disease, interpreted by the nuclear medicine physicians as likely due to
inflammatory process but possibility of small volume disease could not be totally
excluded. Fifty interim FDG PET scans were considered PET-negative, 19 scans were
with MRU and 52 scans were PET-positive. Early stage NHL patients with MRU
lesion showed PFS and OS similar to PET-negative NHL patients and advanced stage
NHL with MRU lesion showed PFS and OS similar to PET-positive NHL patients. The
estimated 5 year PFS from this study was 88.8% for PET negative group, 16.2% for the
PET positive group and 59.3% for the MRU group (Mikhaeel et al., 2005). Results from
this study demonstrate that MRU lesions require further assessment as to explain the
reason behind the findings.

10
An international study to validate the prognostic role of interim FDG PET-CT
scan in ABVD-treated, advanced-stage HL, using Deauville criteria and to assess the
concordance rate among reviewers was carried out involving 260 patients. In this study,
patients underwent FDG PET-CT scan at baseline and at interim post 2 cycles of
ABVD chemotherapy. MRU lesions with Deauville score 2 to 3 were considered as
negative for presence of disease in interim PET-CT scan. They found the sensitivity,
specificity and accuracy of interim PET-CT were 73%, 94% and 91%, respectively.
Negative predictive value and positive predictive value were 0.94 and 0.73,
respectively. There were only 12 false-negative results (6% of interim FDG PET-
negative patients) in which 7 of these were MRU lesions with Deauville score 3. The
researchers in this study concluded that Deauville criteria is precise, reproducible and
reliable to be recommended as standard reporting criterion in clinical practice and for
clinical trials (Biggi et al., 2013).
There are several on-going clinical trials that are looking into the response-
adapted chemotherapy in advanced HL utilizing interim PET scan with the aim is to
reduce chemotherapy side effects by changing the chemotherapy. In these clinical trials,
the MRU lesion is interpreted as negative for presence of disease and the scan is
considered negative (Cheson et al., 2014). Based on Lugano classification
recommendation which was introduce in 2014 for treatment response assessment, the
interpretation of MRU lesion is often based on the intention of the therapy. For
example, MRU lesion with Deauville score 3 in interim PET scan is considered as
negative scan if the intention of subsequent treatment is to escalate chemotherapy.
However if the intention is to de-escalate chemotherapy, MRU lesion with Deauville
score 3 is considered as positive scan. This is to prevent under treatment (Cheson et al.,
2014). Study performed by Southwest Oncology Group S0816 in which the researchers

11
escalate therapy from ABVD to dose escalated BEACOPP in stage III-IV HL patients
with interim PET-positive scan. In this study, interim PET-positive scan was defined as
scan which has lesion with Deauville score 4 and 5. Patients with interim PET-negative
scan will continue with ABVD therapy. The results from this study showed response-
adapted therapy based on interim PET scan after two cycles of ABVD seems promising
with a 2-year PFS of 64% for PET-positive patients, which is much higher than
expected 2-year PFS of 15% to 30%. However despite these results, there were 58
patients experiencing treatment failure in the interim PET-negative group, and the 2-
year estimate of PFS for 271 patients with interim PET-negative group was 82% (Press
et al., 2016).
2.5 Maximum Standardised Uptake Value (SUVmax), Dual Time Point Imaging
(DTPI) technique and Retention Index (RI)
FDG PET-CT scan demonstrates the FDG uptake distribution in the body.
Certain organs in the body utilised the FDG higher than others. It is important to be
able to recognised the physiological FDG uptake distribution in the body in order to
avoid misinterpretation of the scan. As described earlier, once FDG is in the cells, it is
phosphorylated by enzyme hexokinases. FDG cannot be further processed and is
trapped intracellularly as FDG-6-phosphate. Thus, FDG accumulates in areas with high
levels of metabolism and glycolysis, for example at sites of inflammation, active tissue
repair, sites of hyperactivity and also in cancer cells. In neoplastic cells, these increases
in glucose demands lead to increase uptake of FDG and increased intracellular
accumulation of FDG-6-phosphate in neoplastic cells relative to normal cells (Weiss et
al., 2012). With this differentiation of FDG uptake, the areas of higher FDG uptake is
visualised on the image and with the knowledge of normal physiological FDG
12
distribution in the body, areas of abnormal FDG uptake can be identified. This is the
basic principle used behind the FDG PET scan visual analysis (Weiss et al., 2012).
Standardised uptake value (SUV) is a semi-quantitative analysis of FDG uptake
in the body. SUV refers to a ratio of FDG uptake in a region of interest to the FDG
uptake of the rest of body and it is dimensionless. The basic expression for SUV is
SUV = r (a’/w)
where r is the radioactivity concentration (kBq/ml) measured by the PET scanner within
a region of interest, a’ is the decay-corrected amount of injected radiolabeled FDG
(kBq), and w is the weight of the patient (g). Maximum SUV (SUVmax) refers to
maximum SUV measured in the region of interest.
Visual analysis of PET images for treatment response assessment is considered
adequate and sufficient for a positive or negative decision of overall response (Juweid et
al., 2007). However, evaluation of therapy response during interim FDG PET-CT scan
especially in clinical trials, some form of semi-quantitation of FDG uptake may be
helpful (Lin et al., 2007). SUV is helpful in assessing treatment response by comparing
its value during baseline, interim and at end of chemotherapy assessment of FDG PET
scan (Kinahan et al., 2010).
As mentioned earlier, increased FDG uptake in the body is a non-specific
process. FDG uptake can increase in various disease processes either due to benign
inflammatory process or due to malignant cells with high metabolism. To differentiate
between benign and malignant processes that produce increased in FDG uptake, dual
time point imaging (DTPI) technique has been introduced (Houshmand et al., 2016).
DTPI is an imaging technique that is used to study tracer kinetics. DTPI refers to scan
procedure that is performed twice on the same subject at a different time point within

13
the same day. With this technique, SUV of a region of interest can be measured on both
occasion and comparison can be made (Houshmand et al., 2016).
DTPI FDG PET-CT scan has been utilised in predicting the histological grades
of malignancy in lymphoma and the SUVmax on 2-hours delayed scan were
significantly higher than those on 1-hour early scan for all histological grades of
malignant lymphoma during initial staging (Takayoshi et al., 2012). DTPI PET scan
also been used for differentiating the lymph nodes between malignant lymphoma and
benign lesions in which the malignant lymphoma demonstrates higher SUVmax during
delayed scan (Michihiro et al., 2013).
DTPI technique has also been used to study the significant of retention index
(RI) in various disease entities. Retention index is calculated by using this formula:
Retention index = SUVmax delayed – SUVmax early SUVmax early
In general, retention index reflects the capability of retaining the FDG. High RI
reflects the capability of the cells in retaining FDG which may indicate association with
malignancy. In one study, it was shown that the high RI of FDG correlate with the
expression of hexokinase type II which it is increased in malignant cells (Higashi et al.,
2002). In another study, it was shown that RI of FDG in undifferentiated breast cancer
was higher than differentiated breast cancer. From this study, high RI indicates
aggressive disease (Vicente et al., 2012).
The FDG uptake in malignant cells was associated with low glucose-6-
phosphatase enzyme activity, and increased glucose uptake through glucose transporter
proteins, in particular GLUT-1 and GLUT-3, in these cells. Malignant cells also
demonstrate longer duration of FDG uptake as compared to benign lesions and normal
tissues (Kumar et al., 2005). Tumours had average SUVmax increase of 12% between
14
early and delayed scan (Takayoshi et al., 2012). In patients with malignant lymphoma,
there were increased FDG uptake in lymphoma lesions on delayed scans (Takayoshi et
al., 2012). These findings demonstrate the usefulness of DTPI PET scan in assessing
tracer kinetics. Consequently, DTPI technique on FDG PET-CT scan could be used to
evaluate tracer kinetics of MRU lesions in lymphoma patients during interim treatment
assessment by measuring the change in SUVmax and RI.
2.6 Metabolic tumour volume (MTV)
Metabolic tumour volume (MTV) represents the volume of tumour tissues
showing avid FDG uptake. It combined the dual characteristics of three dimensional
volumetric data and the metabolic activity of tumour. MTV has been investigated for it
use as a prognostic factor in lymphoma and also in various other solid tumours. MTV
has been shown in one study as an independent predictor of progression free survival in
HL (Kanoun et al., 2014). Another study has shown that MTV was a better predictor of
progression free survival compared with SUVmax reduction in diffuse large B-cell
lymphoma (Malek et al., 2015). In solid tumours, MTV has been shown to be useful in
predicting short-term outcome to radiotherapy in pharyngeal cancer (Chung et al., 2009)
and in other study involving oral cavity squamous cell carcinoma treated with primary
surgery, MTV was found to be an independent adverse prognostic factor for death and
disease recurrence (Zhang et al., 2014).
The combination of MTV and semi quantitative measurement are useful in
assessing chemoresponse and in predicting the outcome. The fact that there are
multiple prognostic factors which influencing the chemotherapy response and outcome
in lymphoma, the combination of these prognostic factors will further increase the
accuracy of treatment response prediction. Currently the use of MTV in lymphoma
chemotherapy response is being evaluated and is not yet included of its application in
15
the latest guidelines (Cheson et al., 2014). In this study, to assist in evaluating the tracer
kinetics of MRU lesions, the MTV changes of MRU lesions during interim PET-CT
will be assess using DTPI as a secondary parameter whether it can differentiate between
responder and non-responder in order to predict the end chemotherapy response.

16
CHAPTER 3
OBJECTIVES AND HYPOTHESES
3.1 Justification of the study Interim FDG PET-CT scan in lymphoma is currently considered as an
investigational tool. Information gathered from interim FDG PET-CT for early
treatment response evaluation has the potential to guide physicians in response adaptive
chemotherapy. However the presence of minimal residual uptake (MRU) lesion during
interim PET-CT has created uncertainty in the treatment response assessment whether
this finding should be considered as a poor response (positive PET) or a good response
(negative PET) to chemotherapy. Since introduction of Lugano’s classification in 2014
with recommendation of Deauville criteria to be used as guidelines in image
interpretation of response assessment in interim and end treatment FDG PET-CT, MRU
lesion with Deauville score 2 or 3 has been considered as a negative finding which
translates as a good chemotherapy response (Cheson et al., 2014). At present, various
clinical trials in response adaptive chemotherapy involving interim FDG PET-CT
adopting Lugano’s classification are on-going and results are being validated. Further
study is required to assess MRU lesions characteristics particularly its kinetics behavior
in interim FDG PET-CT by application of DTPI technique and semi-quantitative
analysis.
3.2 Benefits of the study 1. Early identification of patients with poor response to chemotherapy, allowing
a change in chemotherapy planning.
17
2. Benefit to patients in term of reducing chemotherapy side effects associated
with ineffective treatment.
3. Reducing patient’s anxiety associated with uncertainty in the treatment
outcome.
3.3 General objective To evaluate the predictive value of dual time point imaging (DTPI) of minimal
residual uptake (MRU) lesion in interim FDG PET-CT scan in predicting the end post
chemotherapy response in lymphoma patients.
3.4 Specific objectives 1. To compare the median of SUVmax changes and median MTV changes
between responder and non-responder groups.
2. To compare the median SUVmax changes between 4 groups based on revised
response criteria.
3. To evaluate any association between demographic factors and end of
chemotherapy response.
3.5 Research hypothesis Increased in SUVmax change of MRU lesion during interim PET-CT
assessment is associated with poor response at the end of chemotherapy.
18
3.6 Null hypothesis
Increased in SUVmax change of MRU lesion during interim PET-CT
assessment does not associated with poor response at the end of chemotherapy.
19
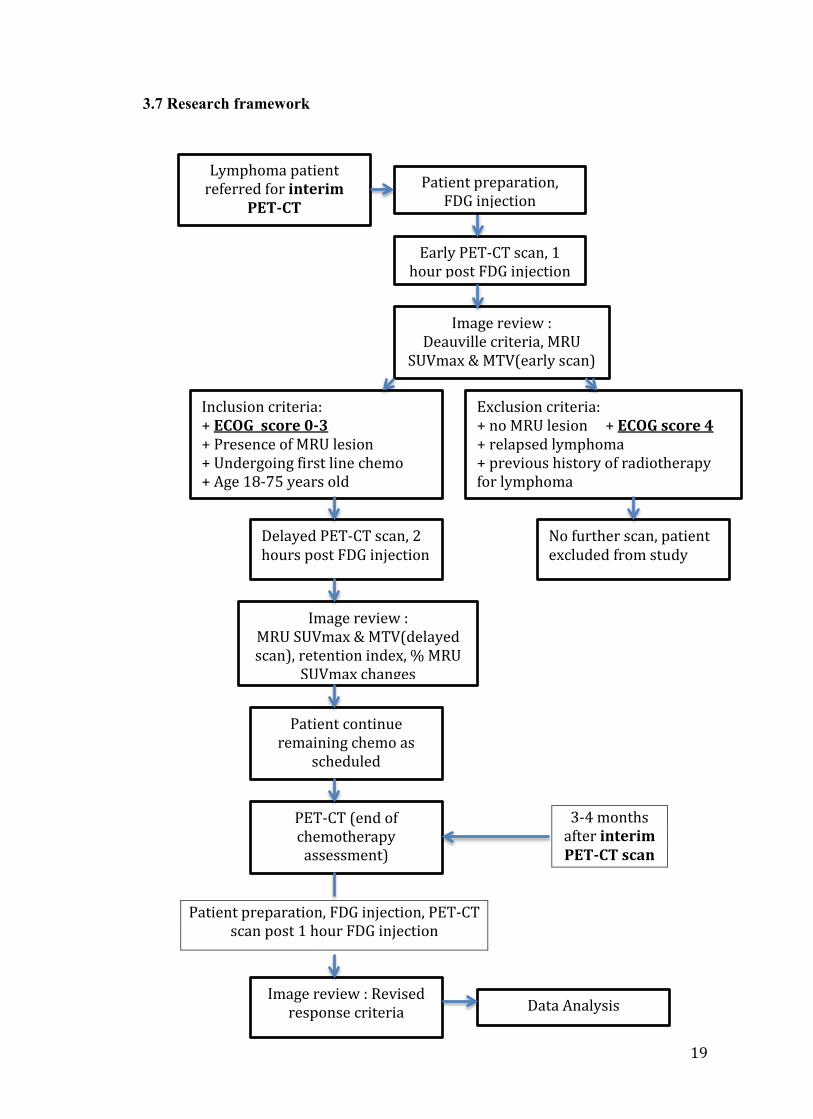
3.7 Research framework
Lymphoma patient referred for interim
PET-CT
Early PET-CT scan, 1 hour post FDG injection
Image review : Deauville criteria, MRU
SUVmax & MTV(early scan)
Inclusion criteria: + ECOG score 0-3 + Presence of MRU lesion + Undergoing first line chemo + Age 18-75 years old
Exclusion criteria: + no MRU lesion + ECOG score 4 + relapsed lymphoma + previous history of radiotherapy for lymphoma
Delayed PET-CT scan, 2 hours post FDG injection
No further scan, patient excluded from study
Image review : MRU SUVmax & MTV(delayed scan), retention index, % MRU
SUVmax changes
Patient continue remaining chemo as
scheduled
PET-CT (end of chemotherapy
assessment)
Image review : Revised response criteria Data Analysis
3-4 months after interim PET-CT scan
Patient preparation, FDG injection
Patient preparation, FDG injection, PET-CT scan post 1 hour FDG injection

20
CHAPTER 4
METHODOLOGY
4.1 Research location
Department of Molecular Imaging and Nuclear Medicine, Hospital Canselor
Tuanku Muhriz (HCTM), Bandar Tun Razak, Cheras, Kuala Lumpur.
4.2 Research design
This is a prospective cohort study.
4.3 Research period
The study was conducted from April 2014 to August 2015.
4.4 Sampling
4.4.1 Target population
Patients with histopathologically proven lymphoma.
4.4.2 Population sample
Lymphoma patients that were subjected to interim FDG PET-CT
investigations and noted to have MRU lesions following the image review.
4.4.3 Sample size and dropout rate
Sample size was calculated using independent t-test. Parameters used are
estimated from previous study (Itti et al., 2009) with the same population.
where Zα = 1.96 Zβ = 0.84
Δ difference = 3.6 power = 0.8 (80%) SD, σ = 5 α = 0.05