Embed Size (px)
Citation preview

This document is an output from a project funded by the UK Department for International Development (DFID) for the benefit of developing countries. The views expressed are not necessarily those of the DFID. Encouraging CDM energy projects to aid poverty
alleviation
Attachment 4
Assessment of GHG Benefits from small-scale energy projects
June 2003
Centre for Environmental Strategy, University of Surrey Katherine. Begg, -coordinator- Stuart Parkinson and Dan van der Horst Intermediate Technology Consultants Schuhmacher Centre, Rugby Rona Wilkinson Intermediate Technology Development Group Kenya Daniel Theuri, Stephen Gitonga, Martha Mathenge Kumasi Institute of Technology and Environment Harriette Amissah-Arthur, Samson Atubga, Sophia Ackon, Sarah Agbey Centre for Energy Environment Science and Technology Hubert Meena, Stephen Mwakifwamba, Stephen Mwakasonde
KITE
CEESTTheCentre forEnergy, Environment,Science and Technology

2
Contact details Dr Katherine Begg -Project Coordinator, Institute for Energy and Sustainable Development De Montfort University Queens Building The Gateway Leicester LE19BH Tel: 0044 116 257 7975 Fax: 0044 116 257 7977 E-mail: [email protected] www.iesd.dmu.ac.uk Dr Rona Wilkinson Intermediate Technology Consultants (ITC) Bourton Hall Bourton on Dunsmore Rugby CV23 9QZ Tel: 0044 1926 634534 Fax: 0044 1926 634405 E-mail: [email protected] www.itcltd.com Daniel Theuri Intermediate Technology Development Group East Africa (ITDGEA) PO Box 39493 Nairobi Kenya Tel 00254 2 719313 Fax: 00254 2 710083 E-mail: [email protected] www.itdg.org
Harriette Amissah-Arthur, Samson Atugba, Abeeku Brew-Hammond, Sophia Ackom, Sarah Agbey and Mrs Odamptey Kumasi Institute for Technology and Environment Accra Office 72, Old Achimota Rd PO Box AH420 Accra Ghana Tel: 00233 21 256800/01 Fax: 00233 21 256800 e-mail:[email protected]; [email protected];[email protected];[email protected]; [email protected]; [email protected]. Hubert Meena, Stephen Mwakifwamba, Stephen Mwakisonde Centre for Environment Energy and Sustainable Technology (CEEST), B316 TIRDO Estates, Morogoro Stores, Oysterbay, P.O. Box 5511 Dar es Salaam, Tanzania. Tel: Fax, email Tel: 00255-22-2667569 Fax: 00255-22-2666079 E-mail: [email protected]

3
Acknowledgements
We would like to thank all our country partners, KITE in Ghana, CEEST in Tanzania and ITDGEA in Kenya and Dr Wilkinson at ITC for all their commitment and hard work on this project. Thanks are also due to Dr Stuart Parkinson for the spreadsheet analyses under tight time pressure. The data on which this study is based was produced by the kind cooperation and support of many organisations and companies in the partner countries and we thank them all for their assistance. We would also like to thank Gill Wilkins and Dick Jones at DFID for their support throughout the project and to DFID-KAR in making the resources available to us.

4
Acronyms AIJ Activities Implemented Jointly BAU Business As Usual CAPA Clean Development Mechanism for Poverty Alleviation Project CCCF Climate Change Challenge Fund of the FCO CDCF Community Development Carbon Fund of the World Bank CF-Assist Carbon Fund Assist for capacity building for the CDM from the
World Bank CDM Clean Development Mechanism (defined in Article 12 of the
Kyoto Protocol) CER Certified Emission Reductions (generated from CDM projects) CO2 Carbon dioxide COP Conference of the Parties to the United Nations Framework
Convention on Climate Change (UNFCCC) COP-MOP Meeting of Conference of the Parties to the United Nations
Framework Convention on Climate Change serving as the Meeting of the Parties to the Kyoto Protocol
CP Commitment Period DFID Department for International Development EB Executive Board for the CDM ERU Emission reductions units FCO Foreign and Commonwealth Office FDI Foreign Direct Investment GHG Greenhouse gas GWh GigaWatt hour ICS Improved Cook Stoves IET International Emissions Trading IPCC Intergovernmental Panel on Climate Change JI Joint Implementation (outlined in Article 6 of the Kyoto Protocol) KP Kyoto Protocol MCA Multi-Criteria Analysis MHP Micro hydro power plants MVP Monitoring And Verification Protocol M&V Monitoring And Verification ODA Official Development Assistance PCF World Bank Prototype Carbon Fund SHS Solar Home Systems S-L Sustainable Livelihoods UNFCCC United Nations’ Framework Convention on Climate Change UNEP United Nations Environment Programme

5
Contents
1 Introduction ................................................................................................................. 9
1.1 Structure of Attachment 4 ................................................................................. 11 2 Projects ...................................................................................................................... 13
2.1 Project selection and data .................................................................................. 13 3 Analytical Approach ................................................................................................. 15
3.1 General Methodology........................................................................................ 16 3.2 Equivalence of Service...................................................................................... 16 3.3 General Assumptions ........................................................................................ 17 3.4 Country Contexts............................................................................................... 18
4 Analytical results for the estimation of emission reductions .................................... 18 4.1 Ghana ................................................................................................................ 18
4.1.1 Appolonia .................................................................................................. 18 4.1.2 Kpasa Solar Home Systems (SHS) ........................................................... 21 4.1.3 Greencoal project ...................................................................................... 23 4.1.4 Nabari Traditional energy sustainable wood project................................. 26 4.1.5 Capacitors AREED projects...................................................................... 29
4.2 Tanzania ............................................................................................................ 29 4.2.1 Uwemba MHP Project .............................................................................. 30 4.2.2 Improved Cookstoves Project (ICS) ......................................................... 32 4.2.3 Utete Solar Hospital Research Project ...................................................... 34 4.2.4 Mtwibwa Sugar Cogeneration................................................................... 36 4.2.5 Kitulango forest efficient charcoal kilns ................................................... 36
4.3 Kenya ................................................................................................................ 36 4.3.1 Tungu MHP project................................................................................... 36 4.3.2 Sony sugar Cogeneration plant with bagasse............................................ 37 4.3.3 Kathamba and Thima pico Hydro power project ...................................... 39 4.3.4 AHP tea MHP............................................................................................ 40
5 Implications of results ............................................................................................... 44 5.1 Ghana ................................................................................................................ 44
5.1.1 Discussion and recommendations ............................................................. 45 5.2 Tanzania ............................................................................................................ 45
5.2.1 Discussion ................................................................................................. 46 5.3 Kenya ................................................................................................................ 46
5.3.1 Discussion ................................................................................................. 47 5.4 Comparison on project size ............................................................................... 47 5.5 Comparison across projects and countries ........................................................ 48
5.5.1 Solar PV .................................................................................................... 49 5.5.2 MHP .......................................................................................................... 50 5.5.3 ICS............................................................................................................. 50
5.6 Conclusions for standardisation and bundling .................................................. 50 5.7 Additionality uncertainty................................................................................... 51
5.7.1 UNFCCC guidance ................................................................................... 51

6
6 Comparison with EB recommended standard methods ............................................ 52 6.1 Comparison of Guidance for Renewable energy projects (Type1) for category A projects (Electricity generation by the user/household) with Analysis ..................... 53 6.2 Comparison of Guidance for Energy efficiency improvement (TypeII) and other project activities (Type (iii)) with Analysis ......................................................... 60 6.3 Implications for Standardised approaches to baselines for small scale projects65 6.4 Implications for Monitoring .............................................................................. 67
7 Bundling .................................................................................................................... 72 7.1 Suitability of current projects in terms of size .................................................. 73 7.2 Implications for Bundling from the Analysis.................................................... 74
7.2.1 Bundling options and Baseline standardisation from the analysis ............ 75 7.2.2 Bundling options and Monitoring requirements ....................................... 77 7.2.3 Recommendations ..................................................................................... 79
8 References ................................................................................................................. 81 Annex 4.1 Initial Project List ............................................................................................ 83
MHP Uwemba............................................................................................................... 83 Annex 4.2 Technical Data Requirements.......................................................................... 84 CAPA project: ................................................................................................................... 85
Project Types: Pico, Mini- and Micro-Hydro, Solar , and energy efficiency projects eg charcoal kilns................................................................................................................. 85 Technical and Financial Data Requirements................................................................. 85 About this form/questionnaire:...................................................................................... 85
2. Technical Data....................................................................................................... 89 For Charcoal Kilns ........................................................................................................ 92 Project type specific data: ............................................................................................. 93
3. Financial Data ....................................................................................................... 94 3.1 Baseline Case (pre-project situation) .................................................................. 94
Annex 4.3 Country Contexts............................................................................................. 97

7
Tables
Table 2-1: List of projects studied across the partner countries........................................ 14 Table 4-1 Results for Appolonia biogas project................................................................ 20 Table 4-2 Results for Kpasa SHS project in Ghana .......................................................... 22 Table 4-3 Emission Factors for charcoal kilns.................................................................. 24 Table 4-4 Results for Greencoal project ........................................................................... 25 Table 4-5 Results for Nabari Sustainable Wood project................................................... 28 Table 4-6 Results for Uwemba MHP project.................................................................... 31 Table 4-7 Results from ICS project analysis in Tanzania................................................. 33 Table 4-8 Results for Utete Solar project.......................................................................... 35 Table 4-9 Results for Tungu MHP in Kenya .................................................................... 37 Table 4-10 Results for Sony Cogeneration project ........................................................... 38 Table 4-11 Results for Kathamba and Thima pico hydro plants....................................... 40 Table 4-12 Results for the AHP tea factories’ MHP plant................................................ 42 Table 5-1 Summary table for Ghana projects ................................................................... 44 Table 6-1 Project Types and categories for Small Scale Projects from EB Guidance...... 52 Table 6-2: Comparison of EB baseline recommendations for Type (i) projects and
Analysis..................................................................................................................... 55 Table 6-3 Comparison of EB small scale projects baseline recommendations and Analysis
for other project types. .............................................................................................. 61 Table 6-4: Comparison of UNFCCC recommendations for calculation of reductions and
for monitoring ........................................................................................................... 68 Table 7-1 List of projects and sizes................................................................................... 74 Table 7-2 MHP projects in Kenya with varying baselines................................................ 75 Table 7-3 Mixed type projects with similar baselines....................................................... 76 Table 7-4 Projects with complementary benefits .............................................................. 76 Table 7-5 MHP same project type /different baselines ..................................................... 77 Table 7-6 Mixed type projects with similar baselines....................................................... 78 Table 7-7 Projects with complementary services.............................................................. 79
Figures
Figure 1-1 CDM Project Cycle ......................................................................................... 10

8

9
1 Introduction This is Attachment 4 to the main report to DFID on encouraging CDM energy projects to aid poverty alleviation. In this part of the study we have focussed on the greenhouse gas benefits from small-scale energy projects both in communities and small industries in Ghana, Kenya and Tanzania. Under the Kyoto Protocol (KP) to the United Nations Framework Convention on Climate Change (UNFCCC) the final agreements known as the Marrakech Accords were agreed at the seventh Conference of the Parties (COP7) in 2001. Within the Accords many of the details for the implementation of the Kyoto Protocol were worked out in detail. In particular some of the modalities for the CDM were developed including the project cycle for the CDM. It was also decided that small scale projects should be given preferential treatment and encouragement through fast tracking with simplified procedures. Small scale projects are defined in the following terms. • Renewable energy projects with maximum output capacity equivalent of up to 15MW • Energy efficiency improvements which reduce energy consumption on supply or
demand side by up to 15GWh/y • Other project activities that both reduce emissions and directly emit less than 15kt of
CO2e annually All CDM projects must go through a process known as the project cycle in order to generate certified emission reductions. The CDM project cycle consists of the following stages. • Project design stage: where the project participants must prepare a project design
document (PDD) which includes the baseline methodology the monitoring plan and approval for the project from the host country
• Project validation and registration stage: where an designated operational entity (DOE) checks the PDD and if it is in order validates the project and sends it to the Executive Board for final registration.
• Project Implementation and monitoring: After registration the project can be implemented and the monitoring plan put into operation.
• Project verification and certification: Once the emission reductions have been generated the participants can invite a second DOE to verify the reductions and these are then sent to the executive board for certification and issuance.
The details of these stages and the conditions surrounding them are summarised in the diagram in Figure 1-1. Developments in the CDM are elaborated further in Attachment 1.

10
Figu
re 1
-1 C
DM
Pro
ject
Cyc
le
Proj
ect P
artic
ipan
ts
(PP)
DO
E 1
Nat
iona
l
CD
M o
ffic
es
Mon
itori
ng
(PP
or 3
rd p
arty
)
Val
idat
ion
Reg
istr
atio
n
Mon
itori
ng
(PP
or 3
rd p
arty
)V
erifi
catio
nC
ertif
icat
ion
Issu
ance
(idea
)
DO
E2
Exe
cutiv
e B
oard
App
rova
l of n
ew
met
hodo
logi
es
Acc
redi
tatio
n of
DO
Es
CO
P M
OP
Nee
d fo
r ne
w
met
hodo
logy
?
Loc
al
Con
sult-
atio
ns
Rev
iew
?
Rev
iew
?
Proj
ect
Des
ign
Doc
umen
t (PD
D)

11
An expert group to the Executive Board on the CDM was set up to generate simplified baselines and other modalities for small scale projects. This group reported in time for COP8 in 2002 where their guidance was adopted by the meeting. The group have provided a new fast tracked simplified PDD for the small scale projects and a set of simplified modalities for the baselines (UNFCCC2002). However to date there has been little direction on bundling of the small scale projects. Bundling or gathering many small projects together into a programme of projects is considered a necessity for small scale projects as the transaction costs for individual PDDs and monitoring and verification costs would be too high to make them viable. These developments have occurred since the onset of this study and are incorporated into the discussion. One purpose of this study has been to examine methodologies for estimating emission reductions with a view to generating proposals for simplified approaches which can still maintain environmental integrity. The results will be available for input to the Executive board and are also compared to the current recommendations from the Expert group on small scale projects for the Executive Board for the CDM. Under the capacity building aspects of the project it is also intended that these baselines can act as a template for the country partners for future CDM projects. The issues considered are • project boundaries, • the baseline, • additionality of the project, • simplified monitoring • uncertainties. All of these issues are relevant to the Project Design Document (PDD) which is currently required before a CDM project can be validated and registered. Leakage is not included in the analysis as the latest UNFCCC guidance on small scale projects specifically directs that no treatment of leakage is required.
1.1 Structure of Attachment 4 In the following sections we discuss the analysis which has been carried out on the projects in each of the study countries and then bring these together and discuss the implications of the results. Section 2 deals with the projects and their descriptions while section 3 describes the methodology used. We discuss the results of the analysis in Section 4. These are then further analysed in section 5 to give comparisons across projects and countries with their resulting implications for standardising baselines, data uncertainties and monitoring. Uncertainties including additionality uncertainty are discussed.

12
In section 6 we compare the analysis results with the new simplified guidance for small scale projects available from the EB for the CDM. And make recommendations on improvements. The report concludes in Section 7 with an examination of the implication of the results for bundling projects and suggests some options and highlights problems.

13
2 Projects
2.1 Project selection and data The study focussed on energy sector development projects in the following countries: • Kenya • Ghana • Tanzania A process was initiated for gathering information on successful development-orientated projects which also contributed towards greenhouse gas (GHG) emissions reduction in the energy sector of the case study countries. From an original large set, a number were chosen for more detailed analysis. The selected projects covered the following types: • Biogas digester; • Improved Cooking Stoves (ICS); • Micro- and Pico- Hydro-Power (MHP); • Off-grid Solar Photovoltaic Systems, known as Solar Homes Systems (SHS) and for a
hospital research facility; • Capacitors for power savings; • Biomass fuelled cogeneration plant; • Higher efficiency cement kilns; • Sustainable wood source; • Efficient Charcoal kilns. The initial project lists are much longer than the final selection and an initial selection is attached as Annex 4.1 for information. The final selection was based on a number of criteria which were as follows: • Project type e.g. energy efficiency; • Sector e.g. energy, industrial, agriculture; • Size individual and programme if applicable; • Technology and fuel e.g. biomass boiler with sawmill waste; • Service provided e.g. cooking, lighting, heat etc; • Amount of service delivered e.g. lighting for 5 hours using 4 CFL bulbs and no of
households, or kWh; • Grid/off grid; • Owners/funders/participation level; • Status, operational? If not when? • Data availability? Surveys required? • Who is receiving the service from the project? • What are the benefits from the project? • What is being substituted by the project? I.e. details of what is currently supplying the
service.

14
The final determinants of the projects selected were the availability of the data and the fact that the projects had to be operational though some partners had difficulty with this aspect. The lists were therefore amended considerably with time. The final selection of projects studied in Ghana, Kenya and Tanzania has been described in Attachment 3 in section 2. We therefore only list them here in Table 2-1.
Table 2-1: List of projects studied across the partner countries
Kenya Tanzania Ghana MHP, Tungu Kaburi MHP Uwemba Thima Pico hydro
Sony sugar co Diesel to bagasse cogen
Sugar cogen grid to bagasse Mtibwa
Biomass Plantation for sustainable wood source Nabari
Bamburi cement energy efficient kilns
Kitulanga Charcoal Kilns Charcoal Production, Western Region More efficient kilns
TEA industry MHP projects
Energy Efficiency in Small Scale Industries – Capacitor Installations
Solar Power for hospital research laboratory Utete
SHS at Kpasa
ICS IREDECT programme
Biogas project at Appolonia
Those in blue indicate where it is possible to have cross country comparisons. Data requirements were then drawn up and sent to national experts to collect the relevant data. These data requirements were tailored to the project type and an example of technical data requirements for projects is attached as Annex 4.2. There were very real problems in collecting internally consistent data about the projects and it is obvious that some data does not exist. Two field trips were undertaken in Ghana and Kenya to build capacity on data collection and on the CDM. Active participation in data collection for the social and technical data for selected projects with country partners was important. The goals and direction for the project was clarified and ensure that all partners had a clear understanding of the CDM and the project. Meetings were also conducted with government and industry representatives to raise awareness on the CDM and level of engagement in the project particularly assessment of sustainability benefits.

15
3 Analytical Approach The approach taken in this study to the estimation of emission reductions of the greenhouse gases has been to explore the uncertainties in the estimation. This has involved the scenario analysis approach to constructing baselines for the projects under study (Begg et al 2002). There are two main reasons for doing this. 1. It enables us to confront the issue of low quality data by exploring the effect of
uncertain information on the final result 2. It enables judgements to be made on simplifications in the baselines while
maintaining environmental integrity In the process of accounting for emission reductions we consider many of the issues dealt with in a PDD. In order to be clear, we first of all define what we mean by project boundaries, additionality, baselines and leakage using the definitions from the Marrakech Accords. Definitions Before discussing the projects in detail we define below the main issues which are relevant to the discussion from the Marrakech Accords (UNFCCC 2001) “The project boundary shall encompass all anthropogenic emissions by sources of greenhouse gases under the control of the project participants that are significant and reasonably attributable to the CDM project activity.” “A CDM project activity is additional if anthropogenic emissions of greenhouse gases by sources are reduced below those that would have occurred in the absence of the registered CDM project activity.” “The baseline for a CDM project activity is the scenario that reasonably represents the anthropogenic emissions by sources of greenhouse gases that would occur in the absence of the proposed project activity.” “Leakage is defined as the net change of anthropogenic emissions by sources of greenhouse gases which occurs outside the project boundary, and that is measurable and attributable to the CDM project activity.” Normally the emission reductions are calculated by calculating the project emissions for a given service, then calculating the baseline emissions for the same service and subtracting the project emissions from the baseline emissions to provide the emission reductions for that service level within the project boundary. From the definition of a baseline given above it can be seen that it is feasible to have more than one baseline representing ‘what would have happened in the absence of the

16
project’. In fact there is a range of approaches to baseline construction which forms a continuum from a project specific set of scenarios concerning possible future emission paths for the project to benchmark approaches. Benchmarks may form part of a scenario approach but the main difference is in how the baselines are used. These have been discussed recently in Begg et al (2002) and Van der Gaast et al (2003). Our approach (Parkinson and Begg 2001, Begg and Parkinson 2001) has been the project specific scenario analysis approach which allows the exploration of uncertainties about the future emissions paths for these projects. There is usually no single correct path but plausible alternatives going off into the future. In the CDM an effective way of managing the uncertainties associated with the counterfactual nature of baselines is to limit the time over which the project is to be credited as the further off into the future we go the less reliable the baseline is. The Marrakech Accords recognise this and propose either a 10 year limited crediting lifetime or three times 7 year crediting periods with baseline revision at each renewal. In this study we have assumed a 21 year crediting lifetime and explored the continuing additionality of projects in that time.
3.1 General Methodology In assessing the projects in terms of emissions reduction and costs, we follow the example described in detail in Parkinson et al (2001). They used the CORINAIR/EMEP (1996) methodology for the calculation of emissions of GHGs, which is compatible with the IPCC guidelines for national inventories (IPCC/UNEP/OECD/IEA, 1996). For costs, they used the incremental costing method of the GEF (Ahuja, 1993). Project level assessments of the case study projects have been carried out using a spreadsheet model of each study project. The spreadsheets consist of a Microsoft Excel file with several layers: the first layer contains a summary of major input parameters and output results; the second has details of the project on a year-by-year basis; the third has details of the baseline case on a year-by-year basis; other layers may explore different baseline scenarios or project scenarios. Outputs from the spreadsheet models are values for each of the four critical accounting variables:
emissions reduction over the lifetime of the project (tonnes of CO2 equivalent); the lifetime-averaged specific emissions reduction (tCO2/MWh); the incremental economic cost (US$); the specific incremental cost (US$/tCO2).
3.2 Equivalence of Service In order to allow comparison between different projects, the ‘unit emissions reduction’ can be calculated per unit of activity. Conventionally (e.g. Begg et al, 1999), this has

17
been the emissions reduction per unit output of the project [in tCO2 equivalent/MWh]. However, the use of such a measure is questionable for many of the projects. This is due to the fact that many development-orientated projects significantly increase the energy service available, e.g. by providing higher quality lighting, when compared with the baseline. The difference in service in klmh provided by the project is roughly 500 times the service provided by kerosene due to the filament or Compact Fluorescent lights being used. In that case alternative comparisons are used. Martens et al (2001) proposed standardised baselines for SHS systems on the basis of the Watts peak of the PV panel in a regression equation. Conventionally, use of a ‘per unit energy output’ measure assumes that there is ‘equivalence of energy service’ between the project and the baseline, but when this is not the case, the value cannot provide a reliable standard for project comparison. This can be seen in many of the results presented below1. Hence, for many development-oriented projects we advocate using an alternative measure for unit emissions reduction: kgCO2/capita/y. While such a measure has its limitations, its superiority for many of the project types in this study is clearly illustrated below. Problems can arise when using this measure when the number of Households or the number of people in the household varies considerably within a community as was found in Ghana.
3.3 General Assumptions Before presenting the baseline discussion and analysis results, it is necessary to state the general assumptions applied to the analysis. The main environmental assumptions are: • biogas combustion produces no net emissions of CO2, ie it is CO2 neutral2; • leaks of biogas from the digesters are negligible; • aerobic digestion of the dung would have occurred with negligible methane emissions; • combustion of agricultural waste, e.g. bagasse, is CO2 neutral; • fuelwood is not from sustainably managed forests, it is not CO2 neutral; • changes in energy demand, except where measured, are negligible during the lifetime
of the projects. The main economic assumptions are: • all fuel prices are assumed to remain constant for the lifetime of the project;
1 To illustrate this, we can look at the unit emissions reduction achieved by replacing an open fire burning wood (from unsustainable source), by a non-GHG emitting source. This gives a value of about 2.6 tCO2/MWh: possibly the highest reduction that can be achieved. However, for an SHS replacing kerosene lamps, values as high as 8tCO2/MWh are apparent! Clearly, this latter value reflects the considerable increase in energy service provided by the SHS, rather than the high emissions of the kerosene lamp. 2 If we assume that the crops/ grass that cattle eat are re-grown, then the uptake of CO2 by these plants during growth will be approximately equal to the CO2 produced by combustion of the methane (biogas) created by the anaerobic digestion of the dung from the cattle.

18
• changes in the fuel quality of both the project and the baseline are negligible during the lifetime;
• all baseline costs before the project start date are sunk; • a discount rate of 4% (social discount rate) and crediting lifetime of 21y are used. Obviously, it is important to bear these assumptions in mind when considering the results, particularly as they have implications for uncertainty. For example, variations in fuel prices, which can be large, will lead to a much higher level of uncertainty in the incremental costs and unit incremental costs than is given here.
3.4 Country Contexts The country context for each of the study countries has been compiled so that the empirical information on the country is available for the construction of the baselines for the projects. The country context also allows an insight into the development priorities of the host and how the projects contribute to alleviating these host concerns. The study countries are Kenya, Ghana and Tanzania. The main country aspects of interest which are summarised for each country in Annex 4.3 of this report include: • general aspects; • poverty situation; • socio-economic profile; • environment; • energy production and use; • policies and development objectives.
4 Analytical results for the estimation of emission reductions The projects that have been analysed have been listed and described in section 2. In this section we discuss the baselines and the results which have been generated for each of the projects in the three study countries. The calculations have been carried out using the assumptions and methodology referenced above given the detailed country contexts in section 3.4.
4.1 Ghana Five projects carried out in Ghana and the results from the emission reduction calculations are discussed below.
4.1.1 Appolonia

19
The biogas plant was not very successful because it is only used for a lighting service most of the time as the cooking service originally planned was not popular with local people who feared germs and odours from the gas. Biogas is used for cooking for short periods when wood is too wet. When there are problems with the plant then diesel is used. Diesel use in the actual project was high. What we have done in the calculations is to look at the project reductions with different scenarios for the biogas production. This is shown in Table 4-1. Baselines
1. Present situation continues: kerosene used for lighting for project lifetime (20y). If the funding for the programme had not been available, it is possible, given the low level of technological development in Ghana, that the situation could have remained unchanged. There is uncertainty in the number of people in households (8-30) and in the amount of kerosene used in each household per month before and after the project. This scenario explores this uncertainty with a high kerosene use figure of 12 l/HH/month. The per capita figures assume an average of 10 people/HH.
2. In this case the assumptions remain substantially the same as for scenario 1 but a
low kerosene use scenario is explored using 9 l/HH/mth. This implies that 40% of the kerosene use is not replaced by the project.
Project
3. The other main uncertainty in this project was the actual use of the biogas plant. Though theoretically 80% biogas 20% diesel (project case 2) was projected, this figure does vary considerably in practice. Obviously the reductions calculated are on the basis of this biogas use, and monitoring would reduce any risk of overestimation. The impact of using 20% biogas 80% diesel (project case 1) on the total emissions is given in baseline 3 for the high kerosene use scenario baseline 1.

20
Emissions
Reduction
Unit Emissions Reduction
Incremental Costs
Unit Incremental Costs
ktCO2e kgCO2/capita/y tCO2/ MWh
M US$ US$/tCO2
80%biogas 20% diesel Baseline 1 High kerosene use
0.18 32 - 0.0002 1
80%biogas 20% diesel / Baseline 2 low kerosene use
0.12 21 - 0.004 35
20% biogas/80% diesel / Baseline 1
0.01 2 - 0.011 1200
Table 4-1 Results for Appolonia biogas project Another aspect of this analysis is consideration of the avoided methane emissions. These have not been accounted for here as methane is produced under anaerobic digestion conditions. Normally the dung and human excreta would be left under aerobic digestion conditions with only very low methane emissions. More work is required to check this aspect. If anaerobic conditions are available as in a farmyard manure heap then emissions of methane could be the order of 5.5kg methane /tonne manure (IPCC 1994).
4.1.1.1 Conclusions • This is a small project and is concerned only with a lighting service consequently
the emission reductions are very low. The costs per tonne are very variable. Exploration of the uncertainty in the data for kerosene use shows that for variation from 9 to 12 l/HH /month the reductions show a variation of 33% between the first two baselines. In addition it is obviously crucial that to attain the reductions the biogas plant is kept running at the predicted rate. If, as in baseline 3, the diesel use increases from 20% to 80%, the reductions decrease by about 95%.
• For monitoring it will therefore be essential that for this type of project there is a
reasonable baseline survey done on kerosene use and that some spot checks are carried out to ensure that diesel use does not escalate during project operation.

21
• The uncertainty range over the baseline and project conditions leads to a total uncertainty value on the reductions of 0.095 kt CO2 ± 89% showing the necessity for minimising errors on these key factors.
• The incremental costs of this project, which are not the same as the normal
costs/tonne calculation, seem to be favourable for this project on a stand alone basis if the biogas use is high and the kerosene baseline use is high.
4.1.2 Kpasa Solar Home Systems (SHS) The project installation was started in 1998 and finished in July 2000 with a guarantee period of one year. It provides power, about 60kWh/y from each 50Wp Solar PV panels, for 410 Households, providing electricity for lighting and thus replacing kerosene lamps. In practice a range of different sizes of panels are provided for different applications. Assumptions
• Calculated load factor is high but consistent with insolation level and number of lamps.
• The average capacity of the panels was 50Wp • 210 SHS were distributed in the first year and 210 panels in the second year. It is
projected that each will last 20 years so that in the final crediting year there are 210 systems left.
• The lifetime of the panels is assumed to be 20 years. Baselines 1. In this scenario the existing situation of kerosene lamps for lighting continues into the
future. Available ranges of figures for kerosene use vary and so a low kerosene use scenario at 2 lamps per household is taken to explore this uncertainty. This represents 7l kerosene/month. All the kerosene use in the baseline is assumed to be replaced by the project. The incremental costs associated with the project for the householders are subsidised through the Spanish 50% export credit and a concessional loan. These costs are calculated against the costs of kerosene in the baseline.
2. In this scenario the existing situation of kerosene lamps for lighting is expected to continue into the future but a high kerosene use path (12l/mth) is used to explore the uncertainty in the data. The kerosene replaced by the project is 40%. In this case the unsubsidised project costs are used for comparison.
3. In this scenario the project does not remain additional for the full 21 year crediting lifetime and after the baseline revision at 14 years it is assumed that the project would have been carried out anyway due to changes in economic circumstances or government policy. The low kerosene use path is used for comparison.

22
Emissions Reduction
Unit Emissions Reduction
Incremental Costs
Unit Incremental Costs
ktCO2e kgCO2/capita/y tCO2/ MWh
M US$ US$/tCO2
Baseline 1 Low kerosene use
1.9 23 - 0.02 12 (subsidised)
Baseline 2 High kerosene use
3.4 42 - 0.48 140 (un-
subsidized)
Baseline 3 Project non additional after 14 years and has low kerosene use
1.2 17 - - -
Table 4-2 Results for Kpasa SHS project in Ghana
4.1.2.1 Conclusions
• The project is mainly lighting service replacement so that the emission reductions are relatively small. The number of households is fairly high at 410 so that the reductions are much higher than the Biogas project above. In the baselines 1 and 2 we have explored again the implications of the data uncertainty in the use of kerosene in the baseline. The data uncertainty leads to an overall relative uncertainty in the emission reductions of 2.65 ±28%, which is in line with the results for the biogas case.
• Baseline 3 gives an opportunity to see the effect of baseline revisions should a project fail to be additional in the future. When the project is initiated it will not be known whether the baseline revision will be allowed after 14 years or not The uncertainty in reductions associated with the additionality variation from 14 to 21 years is 1.55 ± 23%.
• The incremental costs of the project calculated using a social discount rate shows the impact of the subsidies on the affordability of the project is very high and crucial to its success.
• The overall result for the emissions reductions combining all the uncertainties is 2.3 kt CO2 ± 48%.
• The unit emission reductions in baseline 3 are less than baseline 1 as 14 years of reduction is averaged over 21 years lifetime.

23
4.1.3 Greencoal project The project involved the setting-up of a charcoal production factory at the Swiss Lumber Company Ltd sawmill at Manso Amenfie in the Western Region of Ghana. The factory uses residues remaining from timber processing. The SLC decided to utilize its sawmill residues for clean charcoal production for the domestic and export market. For this purpose, carbonisation technology developed by the Carbo Group was employed. The project became fully operational in 2002. Emission reductions from this project arise from two sources. 1. The reductions from using a new modern kiln compared to an earth mound 2. The reductions from the use of the sawmill waste as a carbon neutral source rather
than an unsustainably managed forest. Emission increases from the project may arise from export. A third factor is therefore considered. 3. The emissions from the transport of the charcoal to the Netherlands if it is mainly
exported. The baselines constructed explore these issues. Project Boundaries The project boundaries include the project, the wood source and the market for the charcoal. Baselines 1. Efficient Kilns The emission reductions arise from the change in emissions of volatile organic compounds (VOCs) from the charcoal kiln compared to the old earth mound. There is a range of volatile compounds that can be emitted at different stages in the charcoal making process. Work to characterise these emissions and compare the results across a range of different charcoal kilns has been carried out by Pennisse et al (2001) and by Smith et al (1999). The data from Pennisse et al (2001) show a range of values for the same type of kilns eg Kenyan earth mounds used in the baseline. From the ranges provided, high and low emissions scenarios were prepared. These were compared to the Brazilian rectangular kiln with tar recovery which we felt was closest to the CARBO CG 2000 used in this project. Direct Data from CARBO on their emission characteristics could not be obtained.

24
The greenhouse gases of interest emitted by the kilns included CO2, CH4, and N2O. N2O is of particular interest because of its very high global warming potential. The summaries of the scenarios used is given in the Table Kiln %Yield Emission
Factor CO2 g/kg of charcoal produced
Emission Factor CH4 g/kg of charcoal produced
Emission Factor N2Og/kg of charcoal produced
High emissions scenario Kenyan earth mound
21.6 3027 61.7 0.084
Low emissions scenario Kenyan earth mound
34.2 1058 32.2 0.068
Brazilian rectangular kiln
36.4 543 36.5 0.011
Table 4-3 Emission Factors for charcoal kilns There was only one set of data available for the Brazilian Kiln Baseline 1 used an inefficient earth mound kiln with a high pollutant emissions scenario as described in the Table above with a sustainable wood source. Baseline 2 produces charcoal with an inefficient earth mound kiln but with a low pollutant scenario as described in the table above. Source of the wood The source of the wood in the baseline would normally be from an unsustainably managed forest. In the project, waste wood from the sawmill is used. This wood is normally burned or left in piles to decay in the forest. Thus we have a more sustainable carbon neutral source from the waste wood. Baseline 3 is a scenario where an efficient charcoal is used but with an unsustainable wood source Baseline 4 compares an inefficient kiln with an unsustainable wood source which would be considered to be the combination best representing the existing situation. This baseline uses a high emissions scenario Baseline 5 is as for baseline 4 but with a low emissions scenario.

25
Emissions
Reduction
Unit Emissions Reduction
Incremental Costs
Unit Incremental Costs
ktCO2e kgCO2/capita/y tCO2/ MWh
M US$ US$/tCO2
Baseline 1 Sust wood Inef kiln High scenario
9 0.92 106
Baseline 2 Sust wood Inef kiln low scenario
-1 0.92
Baseline 3 Unsust wood Efficient kiln
8 0.62 75
Baseline 4 Unsust wood Inefficient High scen
50 0.62 12
Baseline 5 Unsust wood Inefficient Low scen.
15 0.62 42
Table 4-4 Results for Greencoal project
Transport emissions In this analysis the effect of exporting the charcoal is explored for the project. It was calculated that additional emissions from the HFO from shipping could range from 0.8 to 2.9ktCO2 over the 21 years of the project depending on whether the calculation is based on using estimated weight or volume. This amounts to roughly offsetting 3-10% of the reductions expected but as a percentage of the reductions calculated for the low scenario baseline is quite high from 7-20%. In practice this would have to be taken into account.

26
4.1.3.1 Conclusions • Baseline 1 and 2 explore the effect of the increased efficiency of the project and
the variation in data for the emissions associated with the operation of an inefficient charcoal kiln given the data available from Pennisse et al. In baseline 2 the negative emissions means that the earth mound is performing better than the new kiln for a sustainable wood source where the CO2 emissions are not counted. This is contrary to expectations but consistent with the measured data. The uncertainty in the emission reductions is therefore high depending on how the kilns are built and operated. From these data the emission reductions, discounting the CO2 as it is deemed to be carbon neutral in these baselines, are 4 ± 125%. This uncertainty is very high. Further data on the operation of the kiln in terms of its emissions as a kiln type are essential so that some of this uncertainty can be decreased. An extension of the Pennisse study would be useful here. It should not fall to the operator to try to make such measurements of the gases emitted.
• With an unsustainable wood source then the comparison between baselines 4 and 5 again explores the effect of the range of data for the high and low scenarios for an inefficient kiln in the baseline due to the increased efficiency of the project. The results now include the CO2 emissions from the kiln so that the range of results is different. Both now produce reductions which are 32.5 ± 54%.
• For an unsustainable wood source the effect of wood source is explored in baseline 3 which gives reductions of 8ktCO2 and comparing with the average baselines 1&2 means that the wood source is a more important source of reductions.
• Comparing baselines 1&2 with 4&5 confirms the importance of the wood source and highlights the uncertainty on the inefficient kiln performance
• The incremental costs of the project are very difficult to determine, as there are no good data for the baseline situation. The figures given are based on nominal labour costs. For some reason the O&M costs are potentially high even at 1%. The costs assume that the wood is bought at market but this is not really the case.
• Where there is transport to a developed country market the emissions can be significant from this source and have to be taken into account in calculating the final reductions.
4.1.4 Nabari Traditional energy sustainable wood project. The Traditional Energy Unit encouraged the local communities to establish woodlots to rehabilitate degraded woodlands and provide alternative sources of woodfuels for the communities. 7 ha out of the proposed total of 60 ha of woodlots have been established under the project. The project provided seedlings through the Forestry Service Division whilst the communities provided labour to prepare the land and maintain the seedlings Soya beans were planted alongside as inter crops. Project boundaries The project boundaries were taken to include the wood source for cooking, in this case the sustainable wood plantation, and the local dwellings with their 3 stone fires.
27
Baselines and assumptions The local people in the Nabari village have been planting trees for their new sustainably managed wood source and have planted 7 ha in 2 years. This rate was taken as a high planting scenario and used to extrapolate over the crediting lifetime. Another lower rate scenario at 2.5 ha/y was also constructed. It was also assumed that there would be no harvests from the sustainably managed woodlot for the first 5 years as the trees grow to the point of harvesting. Baseline 1: In this case the unsustainable wood source would have continued to be used over the lifetime but with increasing time and labour commitment as the wood becomes more and more difficult to obtain. Baseline 2: This explores what would have happened if the project had been delayed by 10 years and is used to explore the effect of uncertainty in the additionality of the project. Baseline 3: This baseline explores the uncertainty in the rate of tree planting. In this case we decrease from 3.5 to 2 ha per year.

28
Emissions
Reduction
Unit Emissions Reduction
Incremental Costs
Unit Incremental Costs
ktCO2e kgCO2/capita/y tCO2/ MWh
M US$ US$/tCO2
Baseline 1 unsustain-able wood Tree planting at 3.5ha/y
2.3 0.85 1.71
Baseline 2 Unsustainable wood for 10 y and then the project
2.1 0.76 1.53
Baseline 3 Unsust wood but lower rate of tree planting 2ha/y
1.4 1.50
Table 4-5 Results for Nabari Sustainable Wood project
4.1.4.1 Conclusions
• The reductions from the project varied according to the tree planting scenario from 1.4 to 2.3 tCO2 over the lifetime of the crediting project giving an overall expected reduction of 1.85tCO2 ±24%.
• Thus the uncertainty in the rate of tree planting over the lifetime of the project does have a large effect on the reductions generated by the project and this is an obvious key parameter to be monitored during the project lifetime.
• The other main assumption that the forest is sustainably managed must also be monitored.
• The additionality of the project must be clear if the longer lifetime of the project is chosen as this also has a major effect on the expected reductions.
• The scenarios for the tree planting showed that in such projects the wood available to supply household needs takes some time to be established and it is not until the last two or so years of such projects that all households are supplied.

29
• The reductions for Baseline 2 are not half of baseline 1 as might be expected. This is due to the time delay in the initial stages in being able to harvest the wood only after 5 years.
4.1.5 Capacitors AREED projects The electricity tariff in Ghana is structured in such a way that the maximum demand charge is based of kilovolt amp (kVA). Customers therefore pay a penalty so that when customers’ power factor is less than 0.90 a penalty is charged. The installation of capacitors in industries corrects the power factor to the required level of 0.9 (being the least) so that industries no longer have to pay a surcharge and save energy. The capacitor installation also saves the utility the losses that would otherwise have been incurred in transporting power. The Power factor correction capacitors installation Project that was studied was undertaken by Dekons Engineering and AB management. They installed power factor correction capacitor banks in industries to reduce their maximum demand (kilovolt - amp) and improve their power factor. Customers with very poor power factors, that is, below 0.70 were selected, economic viability of the capacitor installation was analysed and the necessary agreement made with the customer for outright purchase or payment over a period of not more than 1year. Project Boundaries The project boundary is taken as the factory at which the capacitor is installed and the power system to which it is connected for its electricity supply. Baselines and assumptions Power factor correction reduces losses on a system by decreasing the currents in transformers and conductors that feed a reactive load. However there are debates currently raging as to whether there will be any GHG emission savings as the capacitors do not reduce the real power required by the load, only the reactive power. However correcting the power factor can allow a greater utilisation of the supply distribution system, i.e. a 500KVA transformer can supply 500 kW at a power factor of 1, but 400kW at a power factor of 0.8. This is the reason why utilities want to minimise the cost of investment in plant and put incentives in place to encourage power factor correction. Power factor correction certainly is to be encouraged, probably as part of other energy efficiency measures being put in place, but is probably negligible in actual GHG savings. In Ghana there was no record made of the kWh savings so a baseline could not be produced.
4.2 Tanzania

30
In Tanzania 5 projects were explored but it proved to be impossible to collect the data from 2 of the projects. Below we discuss the results from the three remaining projects.
4.2.1 Uwemba MHP Project The Microhydro power (MHP) project (843kW) was constructed in 1984 and has operated from 1991 in Njombe district in Uwemba village. It replaces a diesel generator for Njombe town and Uwemba village and provides electricity for domestic use and small industries including a tea factory, mills and domestic water pumping. It is owned by Tanesco. There is an increase in number of local and town households served. It is affordable by middle income domestic users at national rates though some local house structures are not suitable for wiring. Project Boundary The boundary of the project is the MHP plant and the dwellings, factories and other amenities served by the plant. Baselines Baseline 1: In this scenario we propose a historic baseline where the existing situation would persist into the future with no change. The diesel generator does in fact still operate with only part of its output being replaced by the project. Baseline 2: The existing diesel generator continues for 10 years and is then replaced by another diesel generator. This is essentially equivalent to baseline 1 in terms of reductions but not in terms of costs. Baseline 3: The existing situation would have continued for 10 years and then the project would have been undertaken. In this scenario the additionality of the project is explored. The argument is that it is likely that initiatives such as this would be mainstream activities in 10 years time. Project Alt: In this case the uncertainty in the data for the output of the plant is explored. The data for the output of the project is explored by calculating the expected output from the flow and head data also provided for the project. This gives an alternative lower output for the project and this is used in the calculations for Baselines 1 to 3 again and revised figures are obtained.

31
Emissions Reduction
Unit Emissions Reduction
Incremental Costs
Unit Incremental Costs
ktCO2e kgCO2/capita/y tCO2/ MWh
M US$ US$/tCO2
Baseline 1 Existing situation continues
49 0.77 1.3 26
Baseline 2 Old diesel replaced by new diesel
49 0.77 0.6 13
Baseline 3 Project carried out in 10 years
24 0.34 0.8 32
Baseline 1 alt project using head and flow figures
34 0.77 3.1 91
Baseline 2 alt
34 0.77 2.6 75
Baseline 3 alt
17 0.34 1.9 102
Table 4-6 Results for Uwemba MHP project
4.2.1.1 Conclusions
• The uncertainty in the output data for the project gives a range of 34 to 49 kt CO2 for the emission reductions over the crediting lifetime. This gives a reduction of 41.5ktCO2 ± 18%. This indicates the importance of good monitoring in the project output.
• The uncertainty in the additionality of the project for the whole 20 years would be minimised by the baseline revisions built in to the CDM system. The analysis shows that the variation is significant and a decision is required from the start on the likelihood of alternative action taking place within the crediting time.
• The overall uncertainty in the reductions including the additionality uncertainty is 33ktCO2 ±48%.
• The incremental costs compared to the baseline are still fairly high for this project though the revenue streams have not been included. Some form of bundling may be required.

32
4.2.2 Improved Cookstoves Project (ICS) The project provides for production and dissemination of improved cookstoves with lower wood fuel requirement at household level in urban and rural areas. It replaces traditional 3 stone wood stoves in mainly rural areas and inefficient charcoal stoves in urban areas. Overall it is equivalent to 144MW with 120,000 stoves. Project boundaries The project boundaries include the use of the stoves over all the dwellings in the ICS programme. The source of the wood or charcoal for cooking is also included in the sense that they are assumed to be unsustainably sourced. Baselines and assumptions In this project it is not clear what proportion of the stoves were metal charcoal burning stoves compared to the traditional 3 stone wood stove. The baselines explore this uncertainty. A scenario is constructed on the number of stoves used in households bearing in mind the replacement after 3 years life. Baseline 1: Alternative programmes either do not get sufficient funding or do not work. Traditional wood and charcoal stoves continue to be used. The project replaces 75% charcoal and 25% wood. Baseline 2: Alternative programmes either do not get sufficient funding or do not work. Traditional wood and charcoal stoves continue to be used. The project replaces 25% charcoal and 75% wood. Baseline 3: Traditional stoves for 5y, then phase-in of ICS programme. Due to Government policy/ other NGO activity on fuelwood scarcity, a more optimistic scenario is that efficiency improvements will be made to stoves without the ICS programme. A further possible baseline is a phase-in of fuelwood from managed forests, ie a CO2 neutral source. This has not been examined here. Whilst LP gas is a desirable fuel for cooking, its expense means that it is unlikely that a significant number of the households targeted by the ICS programme would have been able to use it during the project lifetime. Electricity is too expensive for cooking.

33
Emissions Reduction (2sig figures)
Unit Emissions Reduction
Incremental Costs
Unit Incremental Costs
ktCO2 kgCO2/capita/y tCO2/ MWh
M US$ US$/tCO2
Baseline 1 75% charcoal and 25% wood
5800 340 2.3 -86 -15
Baseline 2 25% charcoal and 75% wood
6700 390 2.7 -37 -6
Baseline 3 Project additional for 5y
2000 270 0.8 -47 -24
Table 4-7 Results from ICS project analysis in Tanzania
4.2.2.1 Conclusions
• The improved cook stoves still release significant amounts of GHGs but a CO2 neutral source for the fuelwood would cut this considerably. Nevertheless, the programme yields significant emissions reduction.
• The uncertainty in total emissions reduction and unit emissions reduction is
±54%. This level is high due mainly to the exploration of additionality. Five years is really a minimum time before a project could not have been predicted to be additional anyway and this uncertainty represents a maximum value. In the CDM the crediting period would have 7 year revisions so that this full uncertainty would not be applicable.
• The uncertainty relating to the data available in terms of the numbers of charcoal
or wood stoves is much lower at 6450 ktCO2 ± 7%. Compared to other uncertainties, this does not make a large difference to the result and is therefore not an issue in data collection. However this is a minimum uncertainty and other data uncertainties such as the actual lifespan of stoves, the way they are used etc are not explored here but are still important.
• In terms of costs, the programme can be seen to lead to a considerable saving.
This is due to the savings in consumption of fuelwood, which dwarfs the costs

34
associated with running the programme for training the potters, or the extra cost of the improved stoves compared with the traditional ones. It should be noted, however, that much of the fuelwood in rural areas is collected rather than bought3, hence the economic savings of this project are more in terms of time than currency.
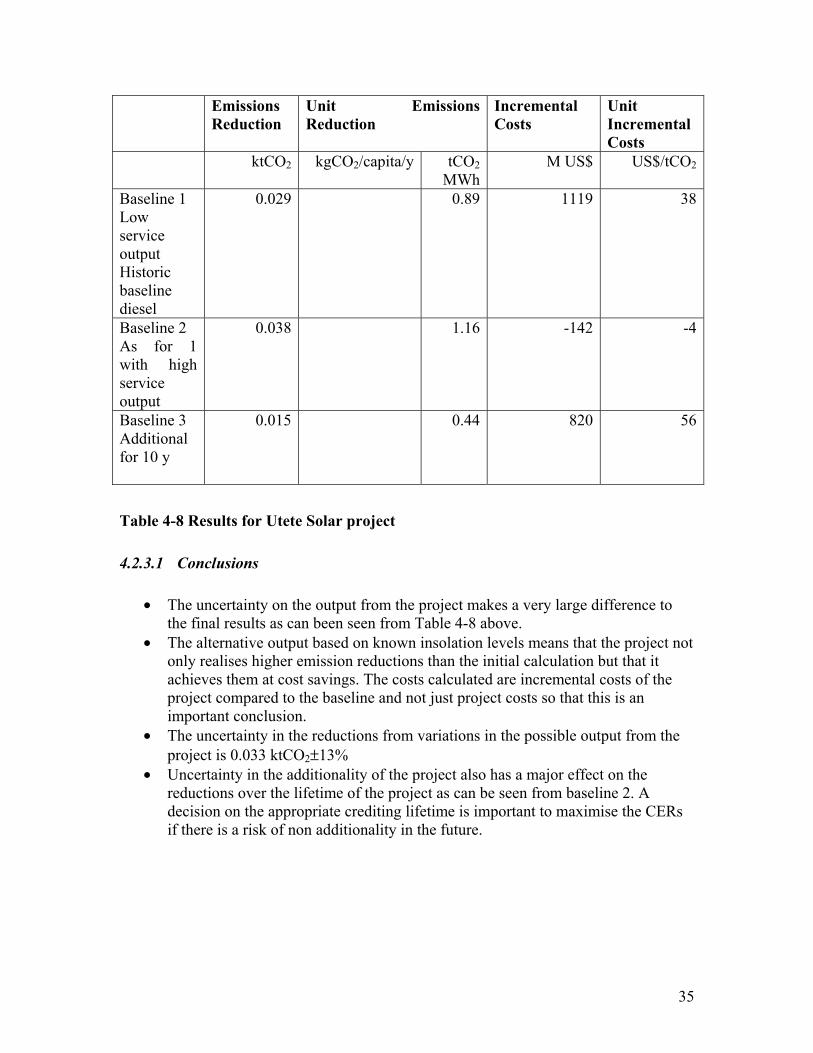
4.2.3 Utete Solar Hospital Research Project This consists of the provisions of 12, 75Wp Solar panels for a malaria research unit at Utete district hospital in Rufiji coastal region. It was installed in 1999 and replaced the use of the diesel generator still used in rest of hospital. It provides a lighting service, increased 24hr service for computers, communication, refrigeration and an expanded health service to neighbouring communities. Project Boundary The project boundary for the calculation of the GHG reductions includes the solar panels and the research labs served by the power supply. Baselines and assumptions The uncertainty in this project arises from the data for the output generated by the panels as it implies a relatively low solar insolation level compared to official maps of solar insolation available. An alternative project scenario was therefore generated to investigate the effect of the uncertainty. The uncertainty in the additionality of the project is also explored. Baseline 1: In this baseline the existing diesel generator continues to operate for 3 years but is then replaced with a new diesel generator which operates for the rest of the crediting lifetime. Baseline 1a: In this case we generate a baseline similar to baseline 1 and calculate the emission reductions as usual on the basis of equivalence of service with the project. However the data gathered for the project corresponds to a low insolation level for Tanzania (1451kWh/m2/y). From official insolation maps the level in Tanzania should be in the region of 1900kWh/m2/y. This baseline uses this higher output level to calculate the reductions in emissions. Baseline 2: This baseline explores what would have happened if the project had been done anyway after 10 years and is therefore additional for half the crediting lifetime chosen. It is assumed that the diesel generated would continue to operate during this time. The service is taken as the low output level given by the data. 3 In the results presented, we assumed that fuelwood that was collected rather than bought had the same currency value.
35
Emissions Reduction
Unit Emissions Reduction
Incremental Costs
Unit Incremental Costs
ktCO2 kgCO2/capita/y tCO2 MWh
M US$ US$/tCO2
Baseline 1 Low service output Historic baseline diesel
0.029 0.89 1119 38
Baseline 2 As for 1 with high service output
0.038 1.16 -142 -4
Baseline 3 Additional for 10 y
0.015 0.44 820 56
Table 4-8 Results for Utete Solar project
4.2.3.1 Conclusions
• The uncertainty on the output from the project makes a very large difference to the final results as can been seen from Table 4-8 above.
• The alternative output based on known insolation levels means that the project not only realises higher emission reductions than the initial calculation but that it achieves them at cost savings. The costs calculated are incremental costs of the project compared to the baseline and not just project costs so that this is an important conclusion.
• The uncertainty in the reductions from variations in the possible output from the project is 0.033 ktCO2±13%
• Uncertainty in the additionality of the project also has a major effect on the reductions over the lifetime of the project as can be seen from baseline 2. A decision on the appropriate crediting lifetime is important to maximise the CERs if there is a risk of non additionality in the future.

36
4.2.4 Mtwibwa Sugar Cogeneration At Mtibwa (2.5MW) and TPC sugar factories (6MW for 22GWh/y), the new plant uses bagasse. It replaces grid electricity for factory needs.
4.2.5 Kitulango forest efficient charcoal kilns This project involves replacement of traditional earth mound inefficient kiln to reduce wood demand. The new half-orange kiln is more efficient (1/3 more) and has been built in Kitulangalo forest reserve. In the two projects described above there is no available data for the analysis despite continued assurances of delivery from the managers concerned. As a result we have analysed only three of the five Tanzanian projects.
4.3 Kenya In Kenya we have five projects which were selected to cover a range of sectors and project types. In the following sections we discuss each in turn.
4.3.1 Tungu MHP project This project is an 18 kW mechanical turbine producing 14 kWe, targeting 300 HH direct beneficiaries and about 4000 individuals indirectly at Chuka, Meru District.. The community who designed it from the start owns it. In Kenya current legislation prevents the delivery of a lighting service and so the main purpose is to power a new enterprise centre with a hairdresser, welding shop, battery charging facility, grain milling. It replaces services from a diesel generator for milling and wood and charcoal for tobacco curing. The number of households who have membership in the scheme is 300 but it is available to all. Project Boundaries The boundaries of the projects relate to the MHP plant itself and the services being provided by the project to the village of Tungu. Baselines and assumptions In this project it was not clear how much of the project output substituted for grain milling and the associated diesel consumption and how much of the output substituted for wood burning for tobacco curing. The baselines were therefore constructed to explore this uncertainty in the baseline activities. Additionality uncertainty was not explored in this case, as it is unlikely to have taken place without ITDG intervention.

37
Baseline 1: In this baseline the amount of grain milling using diesel generators in the baseline is assumed to be equivalent to 75% of the project output while the amount of wood used for tobacco curing is equivalent to 25%. Baseline 2: In this baseline the amount of grain milling using diesel is assumed to be 25% while wood burning accounts for 75% of the project output. Emissions
Reduction
Unit Emissions Reduction
Incremental Costs
Unit Incremental Costs
ktCO2 kgCO2/capita/y tCO2/ MWh
M US$ US$/tCO2
Baseline 1 75% diesel 25% wood
0.34 1.37
Baseline 2 25% diesel 75% wood
0.57 2.32
Table 4-9 Results for Tungu MHP in Kenya
4.3.1.1 Conclusions 1. The emission reductions calculated from this project are 0.46 ± 24%. The uncertainty
in proportion of fuels substituted in the baseline is therefore an important parameter that needs to be properly measured in a full CDM project.
2. The project does not deliver large emission reductions and would need to be bundled. One reason for this is that the load factor for the project is very low at 8% if confined to these uses analysed here though water pumping is planned.
4.3.2 Sony sugar Cogeneration plant with bagasse This project is located in Awendo – Sare, South Nyanza and is owned by the Sony company but it was carried out with community participation. It is proposed that a 15 MW cogeneration plant is built (2003-7) replacing grid electricity in the pre project situation using biomass (bagasse). Though this was not an operational project it will take place within an existing sugar factory structure. Project boundaries The boundaries include the cogeneration plant and the houses receiving the lighting service and the grid system.

38
Baselines and assumptions The existing sugar factory uses electricity from the grid for the factory and for lighting in workers houses. Two scenarios were constructed for the development of the grid over the next 20 years. Baseline 1: In the first scenario the development of the grid was assumed to come via more coal and oil fired (diesel) generation in the future. An emission factor for the grid, developed from 1995 grid figures, was calculated as increasing linearly into the future. This was used as a high scenario projection. Baseline 2: In this scenario there is more hydro and renewables (about 50%) in the grid mix of the future. The corresponding average constant ‘low’ emission factor is used in the calculation of reductions. Baseline 3: In this scenario the grid use continues for 10 years and then the project takes place. This scenario examines the additionality of the project in the commercial environment. Emissions
Reduction
Unit Emissions Reduction
Incremental Costs
Unit Incremental Costs
ktCO2 kgCO2/capita/y tCO2/ MWh
M US$ US$/tCO2
Baseline 1 High grid mix emission factor
127 0.40 0.3 2
Baseline 2 Low grid mix emission factor
111 0.35 0.3 3
Baseline 3 Low emission factor for 10 years and then the project
55 0.17 0.2 3
Table 4-10 Results for Sony Cogeneration project

39
4.3.2.1 Conclusions
• The emission reductions from the project are in the range 91 ktCO2±. 40% if the project may be built after 10years anyway.
• The uncertainty in the reductions due to the development of the emission factor for the grid, without additionality exploration, is 119ktCO2± 7% over the lifetime and therefore does not have a large impact on the results. However this datum should be available in practice.
• The project carbon cost per tonne is good but the transaction costs are not included in the calculation.
4.3.3 Kathamba and Thima pico Hydro power project These are 2 Pico hydro power schemes rated at 1.2 kW and 2.2kW respectively supplying 226 HH with power using a micro grid near Kerogoya town in Kirinyaga district. It provides electricity for lighting replacing kerosene lamps and is community owned. Project Boundaries The project boundary includes the hydro plants and their respective communities. Baselines and assumptions An assumption is made that each household uses an 8W CFL for 5 hours per day. Emissions from battery charging have been calculated to be negligible. It is also assumed that there is no residual kerosene use. Baseline 1: In this scenario the existing kerosene use in the baseline is assumed to be constant throughout the crediting lifetime. The kerosene use is taken as 10l/month for this scenario which is the high use scenario. Baseline 2: This is similar to baseline 1 but in this case we have a low kerosene use scenario at 7 l Kerosene/month. Baseline 3: The low scenario for kerosene use for lighting continues for 10 years and then the project is undertaken. This again explores additionality and the effect of the choice of the short fixed and long revised crediting lifetimes.

40
Emissions
Reduction
Unit Emissions Reduction
Incremental Costs
Unit Incremental Costs
ktCO2 kgCO2/capita/y tCO2/ MWh
M US$ US$/tCO2
Baseline 1 High grid mix emission factor
1.10 57 11.66 -0.12
Baseline 2 Low grid mix emission factor
0.77 40 8.16 -0.08
Baseline 3 Low emission factor for 10 years and then the project
0.38 20 4.08 -0.05
Table 4-11 Results for Kathamba and Thima pico hydro plants
4.3.3.1 Conclusions
• The emission reductions from this very small lighting project are low and assuming a 21 year crediting lifetime are 0.93ktCO2±18%
• The uncertainty in the kerosene use is fairly high and means that this is a key variable for which data must be gathered in the baseline case. In the calculation there has been an assumption of no residual kerosene use.
• Compared to kerosene the pico hydro plant for lighting is cheaper and saves money.
• The choice of crediting lifetime for the project depends on the risk of non-additionality of the project in the future. Here we see that the reductions are directly proportional to the crediting lifetime so that there is an incentive to have the longer lifetime where possible.
4.3.4 AHP tea MHP This is a 1.4MW Mini Hydro serving the 7 Factories in Kericho District built in 1999 - 2002. It will produce emission reductions due to replacement of grid and diesel electricity for machinery in the tea factories. It is not currently operational.

41
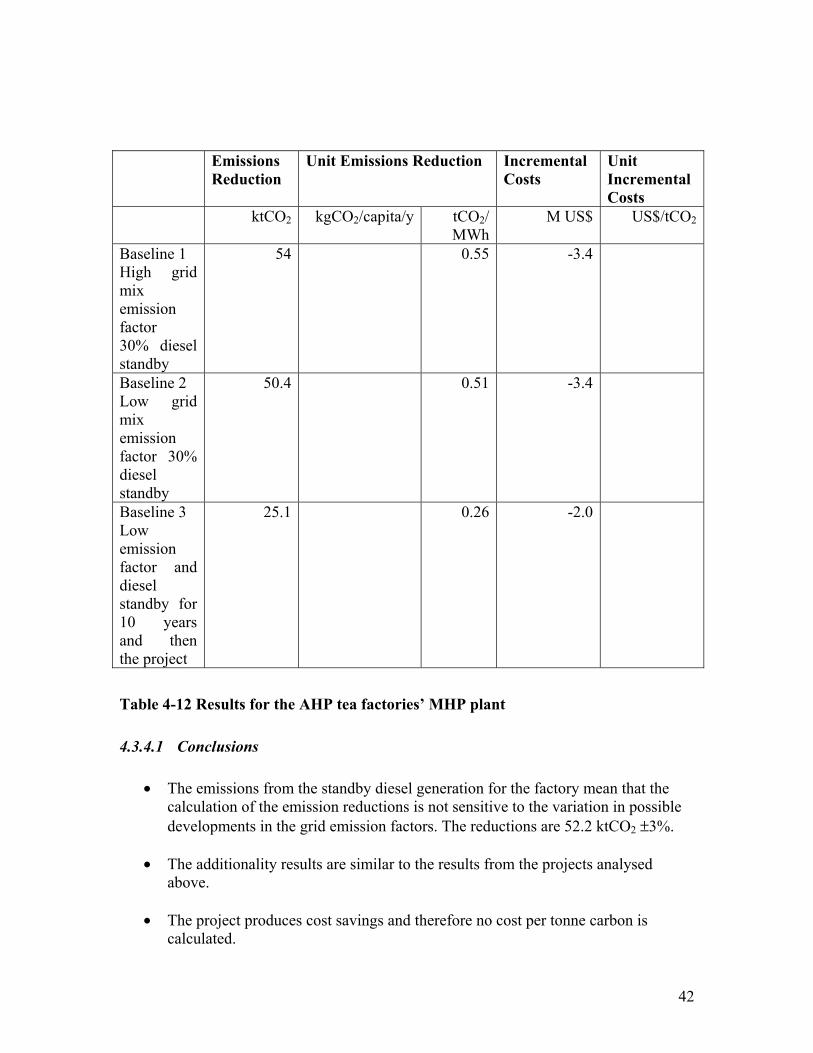
Project boundaries The project boundary includes the mini hydro plant, the tea plant machinery and the grid system supplying electricity as well as the standby diesel generator. Baselines and assumptions The development of the grid system scenarios is already discussed under the Sony cogeneration bagasse plant. The diesel standby is used for 30% of the electricity supply. The same fraction of non-hydro sources is assumed to be supplied by diesel before and after the project. Baseline 1: In this baseline the grid electricity emission factor over the crediting lifetime is assumed to increase. This is the high emission factor scenario for the grid. The diesel generator is assumed to be used to replace the grid 30% of the time. Baseline 2: In this baseline the grid electricity scenario is the low scenario with 50% renewables constant for the grid development over time. Again the diesel standby is 30 % of the replaced electricity. Baseline 3: The low emissions factor scenario for the electricity from the grid is taken along for the first 10 years and then the hydro plant comes on line.
42
Emissions
Reduction
Unit Emissions Reduction
Incremental Costs
Unit Incremental Costs
ktCO2 kgCO2/capita/y tCO2/ MWh
M US$ US$/tCO2
Baseline 1 High grid mix emission factor 30% diesel standby
54 0.55 -3.4
Baseline 2 Low grid mix emission factor 30% diesel standby
50.4 0.51 -3.4
Baseline 3 Low emission factor and diesel standby for 10 years and then the project
25.1 0.26 -2.0
Table 4-12 Results for the AHP tea factories’ MHP plant
4.3.4.1 Conclusions
• The emissions from the standby diesel generation for the factory mean that the calculation of the emission reductions is not sensitive to the variation in possible developments in the grid emission factors. The reductions are 52.2 ktCO2 ±3%.
• The additionality results are similar to the results from the projects analysed
above.
• The project produces cost savings and therefore no cost per tonne carbon is calculated.

43
• These results are very similar to those from the Uwemba project.
4.3.4.2 East Africa Portland and Bamburi Cement Works This project is an energy efficiency project for cement production where a more efficient horizontal dry kiln replaces 4 vertical wet kilns at Mombasa and the Athi river. The project was carried out in 1998 - 2001. Project boundaries This project is an industrial project conducted within the factory site replacing 4 vertical kilns with an efficient dry kiln. The boundary includes the factory and the electricity grid supplying the factory with electricity. The reductions are calculated for the energy saving from the project as it does not affect the clinker/cement ratio. Baselines and assumptions The emission reductions arise from two sources. One is the energy saving produced by the project from the increase in efficiency and the other is the reduction in CO2 from the carbonate added in the process. Sathaye et al (2001) have analysed similar installations in Brazil and China to produce standardised baselines. They point out that the CO2 associated with the cement produced depends on the total amount of clinker produced which can be reduced by altering the clinker per tonne cement ratio. In this project there was no information on the clinker per tonne of cement associated with the baseline though project information is available. We therefore concentrated on the energy savings generated by the project and related those savings to the grid mix used for the AHP and the Sony projects. However, despite a great deal of effort to obtain data on baseline and project energy consumption and cement production, it was unfortunately not possible to generate a figure for emission reductions from the project. More work would be required on this.

44
5 Implications of results The results that have been presented in section 4 above have been presented for the individual projects. In this next stage we consider the projects within the countries and also compare across countries for suitable projects. In each case we have left out the results from the continued additionality of the project and compare the results only on the other data uncertainties explored in the baselines. Additionality uncertainty is discussed in a separate section below.
5.1 Ghana Total Emissions
Reduction
Unit Emissions Reduction
Incremental Costs
Unit Incremental Costs
ktCO2 kgCO2/ capita/y
tCO2/MWh
M US$ US$/tCO2
Appolonia Biogas
0.15±20% (for 9-12lkerosene/mth)
0.01-0.18 (for 20-80%compared to 80/20% biogas)
32-21 2-32
0.0002-0.004 0.011-0.0002
1-35 1-1200
Sustainable wood Nabari
1.85±24% with range of tree
planting rates
1.5-1.71
- -
Kpasa Solar homes
2.65±28% (7-
12lkerosene/mth)
23-42 0.02 subsidised 0.48 un-subsidised
12 140
Greencoal project
Unsustain. wood High and low inefficient kiln 32.5±54% Reduction due to wood source mainly & efficient kiln
Transport 0.8-2.9kt
0.92 106
Table 5-1 Summary table for Ghana projects

45
5.1.1 Discussion and recommendations • The data uncertainties investigated in the projects contributed about 30% to the
uncertainty of the emission reductions but can in the main be reduced by monitoring/surveys before the project ( kerosene use) or monitoring during the project (tree planting rates or biogas production).
• However some uncertainties will need more work to resolve. Particularly in the
case of the charcoal kilns, there is a wide variation in performance of the same type of kiln and we would suggest that further studies are required to obtain meaningful values for standardised approaches.
• The reductions were highest in the case of the sustainable wood greencoal project
with charcoal kilns. This was due to the large size of the project. Though the Nabari sustainable wood fuel project relates to a cooking service, where much more energy is consumed compared to the lighting service, this reduction was not significantly higher than the Kpasa solar homes project. This is probably due to the large number of homes affected by the project in Kpasa. This is in agreement with previous studies (Begg et al 1998).
• Most carbon reduction costs were positive and high except for Kpasa where there
was a subsidy.
5.2 Tanzania Project Total Emissions
Reduction
Unit Emissions Reduction
Incremental Costs
Unit Incremental Costs
ktCO2 kgCO2/capita/y
tCO2/ MWh
M US$ US$/tCO2
Uwemba MHP project 893kW
41.5±18% variation due to project output
uncertainty
0.77 0.6-3.1 13-102
ICS 6450±7% variation due to uncertainty in numbers of
wood/char-coal stoves
365 2.5 -37 to -86 -15 to -6
Utete solar panels
0.033±13% due to project
output variation on insolation
0.89-1.16
-142 to +1119
-4 to 38
Table 5-2 Summary table for Tanzanian projects

46
5.2.1 Discussion • For Uwemba and Utete, the project output proved to be inconsistent with other
data and was explored in the analysis. This project output uncertainty contributed between 13 and 18% variation. These variations are lower than those found for Ghana projects and would be removed by the project monitoring of the output in both cases.
• The projects in Tanzania tend to be larger than in Ghana with the highest
reductions coming from the ICS programme through the sheer size of the programme and the fact that it addresses cooking as a service which requires higher energy inputs.
• The incremental costs of the projects vary considerably with project performance
and in the ICS project, and Utete for the higher project output case, are cost saving.
5.3 Kenya The results for the Kenya projects are set out in the summary table below. Project Total Emissions
Reduction
Unit Emissions Reduction
Incremental Costs
Unit Incremental Costs
ktCO2 kgCO2/capita/y
tCO2/ MWh
M US$ US$/tCO2
Tungu MHP
0.46±28% variation in diesel
and wood use
1.37-2.32
Sony sugar cogeneration with bagasse
119±7% 0.35-0.4 0.3 2-3
AHP tea MHP 1.4MW
14.5±3% variation due to
grid mix minimised by 30% standby
diesel
0.15 -3.4
Kathamba pico hydro
0.93±18% variation from kerosene use
8.16-11.66
-0.08 to –0.12
Cement factory
Table 5-3 Summary table for projects in Kenya

47
5.3.1 Discussion
• Much of the uncertainty in the calculations of emission reductions is arising from the baseline situation. Surveys for kerosene use before the project will be needed. Variations in the grid mix for Kenya had little effect due to the high Hydro component.
• The Tungu project though ostensibly larger than the pico hydro at Kathamba has
less emissions reductions as the load factor is very low. Thus there is unused potential for further reductions in this project. In addition the consumption of diesel in a relatively efficient generator and woodburning compared to inefficient kerosene consumption also contributes to the higher reductions at the pico sites.
• The AHP project is cost saving while the Sony cogeneration plant incremental
costs are low and could mean that this project is viable too.
5.4 Comparison on project size A summary of the projects listed in order of size of plant giving both the baseline condition and the final reductions is presented in Table 5-4.
Table 5-4 Summary in order of size over all countries Country Project Baseline Size Reduction
over 20y in ktCO2
Tanzania ICS Trad stoves 144MW 6450 Kenya Cogen Grid electricity 15MW 119 Kenya MHP Grid and diesel 1.4MW 52.2 Tanzania MHP Diesel
generator 843kW 41
Ghana Trad wood Unsustainable wood
38kW 1.85
Ghana SHS Kerosene 21kW 2.7 Kenya MHP Diesel and
firewood 18kW 0.46
Ghana Biogas Kerosene 12.5kW 0.15 Kenya Pico Kerosene 3.4 kW 0.93 Tanzania solar Diesel 0.9kW 0.033 Ghana Eff charcoal
kiln Inefficient kiln 720t/y charcoal 32.5

48
It can be clearly seen from the table that there is no direct correlation with project size and reductions and that other factors play a major part in the quantity of reductions achieved by a project. Nevertheless, the larger the programme of small-scale projects or the larger the individual project then the greater the expected emission reductions would be. Other key factors for reductions are the baseline fuel use and the type of service provided. These are investigated more closely in the following section.
5.5 Comparison across projects and countries In this study only MHP projects can be easily compared across the countries. In the case of solar projects the nature of the projects is quite different with one being a large panel set in a hospital while the other concerned individual solar homes. Results from the previous study are therefore included for comparison. The improved cook stoves are also compared with the results from the previous study (Begg et al 1998) as there is no available cross country comparison in the current study.

49
Table 5-5 Summary of across country comparison of projects
Country project baseline Reduction ktCO2
tCO2/MWh
SOLAR Tanzania Utete
hospital solar 0.9kWp
Diesel generator
0.033 1.1
Ghana Kpasa shs (410HH) 21kWp
kerosene 2.65
Zimbabwe (1998 study)
SHS (9800HH) 0.4MWp
kerosene 45
Kenya (1998 study)
SHS (20000HH) 0.28MWp
kerosene 13 over10y panel life
HYDRO Tanzania Uwemba
mhp (843kW) diesel 41 0.77
Kenya Tungu mhp (18kW)
Diesel and firewood
0.46 1.87
Kathamba pico (3.4kW)
kerosene 0.93
AHP tea MHP (1.4MW)
Grid and diesel
52 0.15
Sri Lanka (1998 study)
MHP 27kW kerosene 0.9
Sri Lanka (1998 study)
MHP 1.7kW kerosene 0.13
ICS Tanzania 120000stoves
wood and charcoal 144MW
Inefficient stoves
6450
Kenya (1998 study)
Wood, 1500MW
Inefficient stoves
41300 (15y) 1.4
Sri Lanka (1998 study)
450000 stoves 240MW
Inefficient stoves
3280 (15y) 0.84
5.5.1 Solar PV The results across the countries studied including those from the previous study are consistent with the size of the project for the case of the solar homes with the baseline

50
being kerosene use as would be expected. We have only one solar project where the baseline is diesel and in that case it is not consistent and has a lower emission reduction than the kerosene case. It is logical that the diesel generator is more efficient than kerosene lamps hence the lower reductions. It sends a signal that the baseline component is crucial in selecting a standardised baseline approach.
5.5.2 MHP Unlike the SHS with kerosene baseline, the MHP project reductions are not linearly correlated to the size of the project. For the kerosene baseline projects, the variation in reductions does not follow the project generator size. These differences between Kathamba and the two Sri Lankan projects can be explained by variations in load factor between the projects and variations in kerosene consumption across the projects. Where the projects have a diesel generator baseline or mixed diesel baseline then the size of the project again does not correlate with reductions. It may be expected that the reductions would depend on the load factor. However the reality is more complex with diesel being on standby for the AHP project with a load factor of 30% and grid being the main baseline emission source. For the Uwemba MHP which is theoretically about half the size, the baseline is a diesel generator with 22% load factor. The AHP project delivers only slightly more reductions than the Uwemba project because it has a mixed baseline with the grid emission factor for Kenya being quite low because of the high proportion of Hydro in the grid. The Tungu baseline is a mixture of wood and diesel giving an uncertainty of 28% in the estimation of reductions. As discussed earlier, the reductions for Tungu are lower than might be expected because of the efficiency of the diesel generator in the baseline and the wood compared to kerosene lamps. Thus the projects studied, despite having the same technology, have very different baseline situations that will need to be taken into account in any standardisation process.
5.5.3 ICS Again the reductions are not linearly correlated to the size of the project though the trend is clearly that larger projects have deeper reductions. In all cases wood use was lowered by the project so that the baselines here are the same. We would suggest that the differences arise because of the difference in the type of wood and the amount of wood used in the baseline. Again the standardisation of the baseline must take this into account.
5.6 Conclusions for standardisation and bundling
The size of the project can only indicate a general trend for increased reductions with increased size of the project.
The reductions are also dependent on what is substituted in the baseline. This in turn depends on the service being provided.

51
What is substituted in the baseline can vary considerably for some project types. For example for Micro or Pico Hydro power and for Solar power the baseline can vary from kerosene to diesel generators and grid electricity. For ICS the baseline tends to be consistent as inefficient wood stoves.
It will be important in a standardised procedure to take account of these factors and provide differentiated baselines according to what is substituted.
Current advice does not take account of this range of complexity. This has implications for bundling projects where care will need to be taken that in a
mixed set of baseline conditions representatives of each baseline condition are taken for monitoring and verification.
5.7 Additionality uncertainty In the baseline scenarios described above, the effect of some variations in crediting lifetime has been explored on the basis that for some projects there is a likelihood that they would have been done anyway at some point within a 21 year crediting lifetime. However the effect of the risk of a project becoming non additional within a given crediting period can be explored. From work carried out under the EU Probase project (Begg et al 2003), it has been shown that the effect on emission reductions associated with the risk of non-additionality of a project can be expressed as an uncertainty. Thus a correction factor for the risk of non additionality can be suggested and used as a weighting factor for a baseline. In the case of the EU study, a 25% weighting factor on a standardised baseline ( ie 75% credited) was suggested as an average factor over a range of possible years (1-5y) of non additionality for large projects for a 10 year fixed lifetime. In this study we have considered only the 21 year crediting lifetime. This crediting lifetime has a 7 year revision so that the effect of the non additionality risk is much lower. This is due to the fact that in the first 3-5 years predictions can be reasonably accurate and the main risk is only in years 6 and 7. Two years of reductions may therefore be erroneously credited with up to a maximum 30% relative uncertainty in the 7 year periods. Particularly for large projects, this could work out at an average factor of about 10%, which is not a large loss in integrity in absolute terms. In the case of small-scale projects, such a correction could be another disincentive to carry out these projects. We would therefore suggest that as a correction factor should not be used as the risk of non-additionality is generally low in developing country circumstances.
5.7.1 UNFCCC guidance Under the recent guidance from the EB for the CDM for small-scale projects (UNFCCC 2002), the additionality issue has been dealt with by consideration of the barriers to the implementation of the project. These barriers are listed in Appendix A to the guidance. In addition in the Annex B on baseline methodologies evidence that there are incremental costs associated with the project compared to the baseline technology can also be

52
provided for a renewable energy project. Where the project is an energy efficiency project then in addition to the barriers method, project participants can show that the payback period is longer than X years in the case of retrofit. For new supply side transmission and distribution measures, it should be shown that technical transmission and distribution losses are reduced by more than Y% from the baseline technologies or processes. In the case of other energy efficiency measures, for retrofit the guidance is as above, but for new measures the project activity should improve efficiency by more than Y%.
6 Comparison with EB recommended standard methods For the projects a comparison can be made with existing guidance for small-scale under the Executive Board for the CDM. In the following section we take the projects according to the categories outlined in the EB guidance for Type (i) and then Types (ii) and (iii) followed by a comparison of the monitoring guidance with the analytical results for each project. The project types and categories are given in the table below.
Table 6-1 Project Types and categories for Small Scale Projects from EB Guidance Project type Project Category Type (i) Renewable energy projects
A. Electricity generation by User/Household B. Mechanical energy for the User/Enterprise C. Thermal energy for the User D. Electricity generation for a system
Type (ii) Energy efficiency improvement projects
E. E Supply-side energy efficiency improvements- Transmission and distribution
F. F Supply side energy efficiency improvement – generation G. Demand side energy efficiency programmes for specific
technologies H. Energy efficiency and Fuel Switching measures for industrial
activities I. Energy efficiency and Fuel Switching measures for buildings
Type (iii) Other project activities
J. Agriculture K. Switching fossil fuels L. Emission reductions in the transport sector M. Methane recovery
Types(i) to (iii) N. Other small scale projects (new or revised)

53
6.1 Comparison of Guidance for Renewable energy projects (Type1) for category A projects (Electricity generation by the user/household) with Analysis
This category is defined as ‘renewable technologies that supply an individual household or user with a small amount of electricity. The generation capacity should be less than 15MW or less than 15GWh’. The projects which come under this category are Kpasa Ghana Appolonia Ghana Utete solar project, Tanzania AHP MHP Sony cogeneration We take each in turn and compare our results with the recommended standardised approach. The results are summarised in Table 6-2.


55
Tab
le 6
-2: C
ompa
riso
n of
EB
bas
elin
e re
com
men
datio
ns fo
r T
ype
(i) p
roje
cts a
nd A
naly
sis
Proj
ect
Bas
elin
e co
nditi
ons
UN
FCC
C r
ecom
men
datio
ns fo
r B
asel
ine
Cal
cula
ted
redu
ctio
ns fo
r U
NFC
CC
ba
selin
e kt
CO
2
Cal
cula
ted
tota
l re
duct
ions
fr
om a
naly
sis
ktC
O2
Com
men
t
App
olon
ia
Bio
gas
Ker
osen
e fo
r lig
htin
g 9-
12l/m
th/H
H
Whe
re th
e el
ectri
c ou
tput
is m
eter
ed
the
base
line
is th
e kW
h pr
oduc
ed
times
the
emis
sion
coe
ffic
ient
for
dies
el p
ower
bas
ed o
n a
50%
load
fa
ctor
N
o m
entio
n of
CH
4 re
duct
ion
Whe
re th
e el
ectri
c ou
tput
is n
ot
met
ered
and
liqu
id fu
els a
re d
ispl
aced
th
e ba
selin
e is
the
fuel
con
sum
ptio
n of
te
chno
logy
in u
se o
r wou
ld h
ave
been
us
ed ti
mes
the
emis
sion
coe
ffic
ient
for
the
fuel
dis
plac
ed.
0.09
kt
met
erin
g el
ectri
city
ou
tput
in th
is
case
doe
s not
gu
aran
tee
that
th
e bi
ogas
is
the
fuel
bur
ned
As f
or a
naly
sis
0.15±3
3%
(ker
osen
e da
ta
unce
rtain
ty)
0.09±8
9%
(bio
gas%
un
certa
inty
)
The
stan
dard
ised
equ
atio
n ta
kes n
o ac
coun
t of t
he
unce
rtain
ty in
the
biog
as
prop
ortio
n an
d co
uld
over
estim
ate
if th
is is
not
m
onito
red
and
the
resi
dual
di
esel
use
acc
ount
ed fo
r. O
ther
wis
e th
ere
is li
ttle
diff
eren
ce in
resu
lt.
No
diff
eren
ce in
app
roac
h fo
r ba
selin
e
Proj
ect e
mis
sion
s mus
t in
clud
e al
l sou
rces
so re
sidu
al
kero
sene
and
die
sel u
se
shou
ld b
e co
vere
d K
pasa
SH
S K
eros
ene
for
light
ing
7- 12
l/mth
/HH
Whe
re th
e el
ectri
c ou
tput
is n
ot
met
ered
and
dis
plac
es li
quid
fuel
s the
ba
selin
e is
the
fuel
con
sum
ptio
n of
te
chno
logy
in u
se o
r wou
ld h
ave
been
us
ed ti
mes
the
emis
sion
coe
ffic
ient
for
the
fuel
dis
plac
ed
As f
or a
naly
sis
2.65±2
8%
(ker
osen
e da
ta
unce
rtain
ty)
No
diff
eren
ce in
app
roac
h

56
Alte
rnat
ive
from
Tab
le B
1 fo
r SH
S is
75
kg/y
+4*W
p fo
r 410
HH
ove
r 21y
2.37
kt
CO
2
Res
ult f
rom
SH
S eq
uatio
n is
in
rang
e ca
lcul
ated
from
ke
rose
ne u
se
Ute
te S
olar
12
*75W
p D
iese
l ge
nera
tor
for
hosp
ital
Elec
trica
l out
put i
s met
ered
at
2.15
MW
h/y
The
base
line
is th
e kW
h pr
oduc
ed
times
the
emis
sion
coe
ffic
ient
for
dies
el p
ower
bas
ed o
n a
50%
load
fa
ctor
from
Tab
le B
4 us
ing
the
SHS
equa
tion
from
Tab
le B
1 as
abo
ve
0.05
9kt
CO
2 0.
077k
t C
O2
0.03
3 Te
nden
cy to
ove
rest
imat
e w
ith th
is B
4 eq
uatio
n1 EF
used
com
pare
d to
oth
er
stan
dard
val
ues u
sed
in th
is
anal
ysis
but
is m
ore
rela
ted
to
char
acte
ristic
s of d
iese
l ge
nera
tors
acc
ordi
ng to
the
refe
renc
es u
sed.
A
gain
an
over
estim
ate
usin
g B
1 eq
uatio
n
AH
P M
HP
for t
ea
prod
uctio
n Th
is P
roje
ct
coul
d co
me
unde
r thi
s ca
tego
ry
Type
(i) A
(e
lect
ricity
ge
nera
tion)
or
B
(mec
hani
ca
Grid
el
ectri
city
an
d 30
%
dies
el
stan
dby
9828
6MW
h
Und
er A
(ele
ctric
ity g
ener
atio
n) o
r B
(mec
hani
cal e
nerg
y fo
r the
use
r) th
e pr
ojec
t bas
elin
e is
as f
ollo
ws
Whe
re th
e el
ectri
c ou
tput
is m
eter
ed
the
base
line
is th
e kW
h pr
oduc
ed
times
the
emis
sion
coe
ffic
ient
for
dies
el p
ower
bas
ed o
n a
50%
load
fa
ctor
It
assu
mes
a d
iese
l onl
y ba
selin
e an
d 4-
6 hr
s/da
y se
rvic
e an
d no
grid
U
nder
Typ
e (i)
C
Bas
elin
e is
not
rele
vant
as i
t spe
cifie
s fu
el c
onsu
mpt
ion
or fi
rew
ood
thou
gh
78.6
kt
CO
2 Th
e el
ectri
city
pr
oduc
ed is
m
eter
ed b
ut
the
base
line
is
not d
iese
l as
assu
med
N
ot re
leva
nt
52.2±3
%
Unc
erta
inty
on
whi
ch
cate
gory
this
pro
ject
bel
ongs
to
as i
s mix
ture
if g
rid a
nd
dies
el g
ener
ator
. N
one
are
com
plet
ely
appr
opria
te
The
only
cat
egor
y w
hich
di
scus
ses g
rid e
lect
ricity
is
Type
(i) D
for p
roje
cts
supp
lyin
g in
to th
e gr
id
UN
FCC
C c
ateg
orie
s av
aila
ble
need
to b
e w
iden
ed

57
l ene
rgy)
or
C T
herm
al
ener
gy fo
r th
e us
er
Or T
ype
D
elec
trici
ty
gene
ratio
n fo
r a
syst
em)
it do
es d
iscu
ss re
plac
ing
a fo
ssil
fuel
sy
stem
. U
nder
type
(i) D
the
base
line
is th
e w
eigh
ted
aver
age
of th
e cu
rren
t ge
nera
ting
mix
or
The
oper
atin
g an
d bu
ild m
argi
n ba
selin
e U
sing
the
MH
P eq
uatio
n fr
om T
able
B
1
Sim
ilar t
o th
e an
alys
is
56kt
CO
2
MH
P eq
uatio
n gi
ves s
imila
r re
sults
So
ny
coge
ner-
atio
n w
ith
Bag
asse
1.
4MW
Rep
lace
-m
ent o
f a
grid
lig
htin
g se
rvic
e an
d gr
id
for f
acto
ry
This
is si
mila
r to
the
prob
lem
for t
he
AH
P pl
ant a
bove
. Th
e el
ectri
city
gen
erat
ed b
y th
e pl
ant
is u
sed
to re
plac
e a
grid
ligh
ting
serv
ice
and
the
fact
ory
grid
use
U
nder
type
(i) A
(ele
ctric
ity
gene
ratio
n) o
r typ
e (i)
B (
mec
hani
cal
ener
gy fo
r the
use
r) th
e pr
ojec
t ba
selin
e is
as f
ollo
ws
-Whe
re th
e el
ectri
c ou
tput
is m
eter
ed
the
base
line
is th
e kW
h pr
oduc
ed
times
the
emis
sion
coe
ffic
ient
for
dies
el p
ower
bas
ed o
n a
25%
load
fa
ctor
(Tab
le B
4)
It as
sum
es a
die
sel o
nly
base
line
Und
er T
ype
(i) C
Th
is b
asel
ine
is n
ot re
leva
nt a
s it
253k
t C
O2
The
outp
ut E
F us
ed is
0.8
Th
is is
sim
ilar
to o
ur a
naly
sis
119k
t C
O2
The
outp
ut E
F us
ed fo
r the
K
enya
n el
ectri
city
sy
stem
is
0.41
kgC
O2/
kW
h
This
type
of p
roje
ct is
bes
t co
vere
d by
the
type
(i) D
ba
selin
e in
the
guid
ance
and
so
me
mod
ifica
tion
is
requ
ired.

58
spec
ifies
fuel
con
sum
ptio
n or
fir
ewoo
d th
ough
it d
oes d
iscu
ss
repl
acin
g a
foss
il fu
el sy
stem
. U
nder
type
(i) D
the
base
line
is th
e w
eigh
ted
aver
age
of th
e cu
rren
t ge
nera
ting
mix
or
The
oper
atin
g an
d bu
ild m
argi
n ba
selin
e O
utpu
t Em
issi
on fa
ctor
s tim
es th
e ou
tput
of t
he p
lant
thou
gh th
e ca
tego
ry is
not
ap
prop
riate
A
naly
sis r
esul
t as
for s
tudy
Uw
emba
M
HP
Tanz
ania
Die
sel
gene
rato
r Lo
ad
fact
or 2
2%
For
light
ing
Gen
erat
ion
for a
syst
em
Bas
elin
e fo
r Typ
e (i)
D
Ann
ual k
Wh*
EF fo
r mod
ern
dies
el o
f re
leva
nt c
apac
ity o
pera
ting
at o
ptim
al
load
dis
cuss
with
Ron
a in
Tab
le B
4
EF is
0.8
50
.5kt
Cal
c 34
-49
ktC
O2
Dep
endi
ng o
n pr
ojec
t out
put
In th
is c
ase
the
redu
ctio
ns a
re
calc
ulat
ed o
n al
mos
t the
sam
e ba
sis a
nd th
e re
sults
diff
er
only
in th
e sl
ight
ly h
ighe
r EF
reco
mm
ende
d in
Tab
le B
4
Tung
u M
HP
K
enya
18
kW
Die
sel
gene
rato
r fo
r gra
in
mill
ing
and
firew
ood
for
Die
sel f
or g
rain
mill
ing
Elec
trici
ty g
ener
atio
n fo
r mec
hani
cal
ener
gy T
ype
(i) B
W
here
bas
elin
e w
ould
hav
e be
en
dies
el g
ener
atio
n th
en b
asel
ine
is th
e m
echa
nica
l ene
rgy
prod
uced
(MJ)
tim
es 3
.6 to
con
vert
to k
Wh
times
the
Mea
sure
d to
tal
outp
ut is
12
MW
h A
ssum
ed 7
5%
mill
ing
as fo
r ba
selin
e 1
(9M
Wh)
, EF
For b
asel
ine
1 75
% m
illin
g th
e to
tal
redu
ctio
ns d
ue
to m
illin
g w
ere
calc
ulat
ed a
s 0.
16kt
CO
2
The
mai
n pr
oble
m is
that
th
ere
is n
o ex
plic
it gu
idan
ce
whe
re th
ere
is a
mix
ed
base
line
such
as t
his.
Info
rmat
ion
may
not
be
avai
labl
e fo
r the
rela
tive

59
toba
cco
curin
g em
issi
ons f
acto
rs b
ased
on
Tabl
e B
4 fo
r 50%
load
fact
or a
nd th
e re
leva
nt
capa
city
in th
is c
ase
1.3
Fi
rew
ood
for c
urin
g Ty
pe (i
) C th
erm
al e
nerg
y fo
r the
use
r Fi
rew
ood
cons
umpt
ion
times
em
issi
on
coef
ficie
nt fo
r fire
woo
d
1.3
0.23
ktC
O2
This
is a
s for
an
alys
is
prop
ortio
ns o
f the
act
iviti
es
and
an a
ppro
ach
to th
is is
als
o ne
eded
. Th
e m
etho
d us
es a
hig
h em
issi
ons f
acto
r for
the
gene
rato
r due
to th
e sm
all
size
of t
he g
ener
ator
so th
at
stan
dard
val
ues a
s use
d in
this
an
alys
is m
ay u
nder
estim
ate
the
redu
ctio
ns
1 The
sim
plifi
ed g
uida
nce
from
the
EB (A
nnex
B to
UN
FCC
C (2
002)
FC
CC
/CP/
2002
/7/A
dd.3
Sim
plifi
ed m
odal
ities
and
pro
cedu
res f
or sm
all s
cale
pro
ject
s) c
onta
ins r
ecom
men
ded
met
hodo
logi
es
unde
r the
pro
ject
type
s lis
ted
in T
able
4-6
. Und
er ty
pe IA
a li
st o
f equ
atio
ns is
giv
en in
Tab
le B
1 w
hich
app
ly to
SH
S an
d hy
drop
ower
am
ong
othe
rs b
ased
on
an E
CN
stud
y. U
nder
type
ID T
able
B4
cont
ains
a li
st o
f em
issi
on fa
ctor
s for
die
sel g
ener
ator
s for
thre
e lo
ad fa
ctor
s for
a ra
nge
of g
ener
ator
size
s.

60
6.2 Comparison of Guidance for Energy efficiency improvement (TypeII) and other project activities (Type (iii)) with Analysis
The projects which are considered under this part of the existing guidance are Sustainable woodfuel Nabari, Ghana Improved Cook stoves in Tanzania Greencoal improved charcoal kiln in Ghana Efficient Cement Kilns in Kenya Each of the projects is summarised in the following table.

61
Tab
le 6
-3 C
ompa
riso
n of
EB
smal
l sca
le p
roje
cts b
asel
ine
reco
mm
enda
tions
and
Ana
lysi
s for
oth
er p
roje
ct ty
pes.
Proj
ect
Bas
elin
e co
nditi
ons
UN
FCC
C r
ecom
men
datio
ns fo
r B
asel
ine
Cal
cula
ted
redu
ctio
ns fo
r U
NFC
CC
ba
selin
e kt
CO
2
Cal
cula
ted
tota
l red
uctio
ns
from
ana
lysi
s kt
CO
2
Com
men
t
Gre
enco
al
Gha
na
Inef
ficie
nt
kiln
s A
nd
sust
ain-
able
woo
d so
urce
Type
(ii)
(H) d
eman
d si
de e
nerg
y ef
ficie
ncy
and
fuel
switc
hing
for
indu
stria
l pro
ject
s. Th
e U
NFC
C b
asel
ine
is sp
ecifi
ed
by th
e en
ergy
use
of t
he re
trofit
m
easu
res o
r wha
t wou
ld h
ave
been
bu
ilt
The
emis
sion
s are
cal
cula
ted
by th
e pr
oduc
t of e
ach
ener
gy fo
rm in
the
emis
sion
s bas
elin
e tim
es th
e em
issi
on c
oeff
icie
nt.
Type
(ii)
(G) i
s an
alte
rnat
ive
but
does
not
take
acc
ount
of t
he c
hang
e in
sust
aina
ble
woo
d so
urce
In th
is c
ase
the
fuel
is w
ood
but
the
emis
sion
s fr
om th
e ki
lns a
re
a co
mpl
ex
mix
ture
of
pollu
tant
s and
va
riabl
e in
out
put
so th
at th
e da
ta o
n
effic
ient
and
in
effic
ient
kiln
s is
esse
ntia
l for
the
com
paris
on.
In p
rinci
ple
the
anal
ysis
car
ried
out f
ollo
wed
this
bu
t req
uire
d m
uch
mor
e da
ta w
hich
sh
ould
be
incl
uded
in th
e gu
idan
ce
Dep
endi
ng o
n su
stai
nabl
e or
un
sust
aina
ble
woo
d so
urce
in
the
base
line
the
redu
ctio
ns a
re
4±12
5%
Or
32.5±5
4%
New
gui
danc
e is
requ
ired
for t
his t
ype
of p
roje
ct. A
n in
dica
tion
is g
iven
in th
is
anal
ysis
. Th
e w
ood
sour
ce h
as to
be
in th
e pr
ojec
t bou
ndar
ies
Woo
dfue
l Su
stai
n-Th
ere
is n
o su
itabl
e ca
tego
ry fo
r
The
anal
ysis
A
new
cat
egor
y is
requ
ired

62
Gha
na
able
woo
d so
urce
th
is p
roje
ct ty
pe .
The
curr
ent
Type
s (ii)
(H) o
r (I)
are
spec
ified
fo
r ind
ustri
al fa
cilit
ies o
r bui
ldin
gs
whi
le th
e sw
itchi
ng fo
ssil
fuel
s do
es n
ot a
pply
(Typ
e (ii
i) (K
)
was
bas
ed o
n th
e su
bstit
utio
n of
uns
usta
inab
ly
sour
ced
woo
d w
ith su
stai
nabl
y so
urce
d w
ood
1.85
±24%
due
to
unc
erta
inty
in
rate
of t
ree
plan
ting.
Thi
s w
ould
hav
e to
be
mon
itore
d
for t
his p
roje
ct ty
pe.
The
calc
ulat
ion
is b
ased
on
the
amou
nt o
f fue
l use
d (w
hich
wou
ld h
ave
to b
e m
onito
red
by su
rvey
s) a
nd
the
emis
sion
fact
or fo
r w
ood.
Cem
ent
Ken
ya
Impr
oved
ef
ficie
ncy
kiln
s
This
pro
ject
cou
ld b
e de
scrib
ed
unde
r Typ
e (ii
) (H
) ene
rgy
effic
ienc
y an
d fu
el sw
itchi
ng fo
r in
dust
rial t
echn
olog
ies
The
base
line
is b
ased
onl
y on
the
elec
trici
ty u
se o
f exi
stin
g eq
uipm
ent i
f a re
trofit
as i
s the
cas
e he
re c
orre
cted
for t
rans
mis
sion
and
di
strib
utio
n lo
sses
for t
he g
rid. T
he
emis
sion
s fac
tor i
s tha
t spe
cifie
d un
der t
ype
(i) D
. ope
ratin
g an
d bu
ild m
argi
n m
etho
d or
the
wei
ghte
d av
erag
e of
the
curr
ent
gene
ratio
n m
ix o
r dis
patc
h da
ta.
For c
emen
t in
addi
tion
to e
nerg
y sa
ving
s fro
m e
ffic
ienc
y im
prov
emen
ts so
me
proj
ects
may
A sp
ecifi
c ca
tego
ry fo
r sm
all c
emen
t wor
ks c
ould
be
add
ed w
hich
can
allo
w
for p
roce
ss e
mis
sion
re
duct
ions
if re
quire
d.
Som
e gu
idan
ce o
n eq
uiva
lenc
e of
serv
ice
is
also
requ
ired.

63
redu
ce th
e pr
oces
s em
issi
ons f
rom
th
e cl
inke
r pro
duct
ion
Proj
ect
Bas
elin
e co
nditi
ons
UN
FCC
C r
ecom
men
datio
ns fo
r B
asel
ine
Cal
cula
ted
redu
ctio
ns fo
r U
NFC
CC
ba
selin
e kt
CO
2
Cal
cula
ted
tota
l red
uctio
ns
from
ana
lysi
s kt
CO
2
Com
men
t
ICS
Tanz
ania
Im
prov
ed
effic
ienc
y co
ok
stov
es
This
pro
ject
is a
pro
gram
me
of
smal
l ene
rgy
effic
ient
stov
es a
nd
com
es u
nder
Typ
e (ii
) (G
) Th
is is
the
only
type
to ta
ke
acco
unt o
f pro
gram
mes
of s
mal
l pr
ojec
ts.
This
type
dis
cuss
es o
nly
ener
gy
disp
lace
d as
foss
il fu
el o
r as
elec
trici
ty w
hile
in th
is p
roje
ct it
is
woo
d Th
ere
is n
o pr
ovis
ion
for
equi
vale
nce
of se
rvic
e. It
is
assu
med
that
the
sam
e se
rvic
e is
pr
ovid
ed m
ore
effic
ient
ly.
In p
rinci
ple
the
met
hod
shou
ld
follo
w th
e ad
vice
on
foss
il fu
el
whi
ch is
the
fuel
us
e m
ultip
lied
by
the
emis
sion
co
effic
ient
for t
he
fuel
for t
he
base
line
emis
sion
s and
co
mpa
red
to th
e fu
el u
se fo
r the
pr
ojec
t.
The
met
hod
used
in th
is
stud
y fo
llow
s th
is p
rinci
ple
for
woo
d.
The
anal
ysis
re
sult
was
64
50kt
CO
2±7%
w
ith u
ncer
tain
ty
in w
ood
or
char
coal
stov
e re
lativ
e nu
mbe
rs
It sh
ould
be
note
d th
at th
e lif
etim
e of
the
stov
e is
usu
ally
3
year
s so
that
th
e ca
lcul
atio
n of
the
redu
ctio
ns
has t
o ca
lcul
ated
fo
r eac
h st
ove
for 3
yea
rs o
r th
e lif
espa
n of
th
e st
ove
only
ICS
is n
ot m
entio
ned
or
cate
red
for i
n th
is g
uida
nce
but i
t wou
ld re
quire
littl
e m
odifi
catio
n of
the
exis
ting
guid
ance
to in
clud
e w
ood
as
a fu
el.
The
num
ber o
f sto
ves a
nd
lifes
pan
are
requ
ired
data
H
owev
er th
e re
stric
tion
of
15G
Wh
coul
d be
pr
oble
mat
ic a
s it i
s diff
icul
t to
be
prec
ise
abou
t the
nu
mbe
r of h
ours
for w
hich
th
e st
oves
ope
rate
. In
this
ca
se th
e fu
ll 18
0000
of t
he
prog
ram
me
coul
d no
t be
coun
ted.
It w
ould
hav
e to
be
in th
e re
gion
of 9
0000
as
sum
ing
stov
es a
re u
sed
for
4 ho
urs a
day
365
day
s a
year
. Th
is re
stric
tion
seem
s un
nece
ssar
y as
the
proj
ect

64
and
sum
med
ov
er th
e nu
mbe
r of
stov
es ro
lled
out i
n th
e pr
ogra
mm
e.
cann
ot b
e co
nsid
ered
as a
la
rge
proj
ect d
ue to
the
smal
l-sca
le n
atur
e of
the
indi
vidu
al st
oves
.

65
6.3 Implications for Standardised approaches to baselines for small scale projects
This study has examined a range of project types in different countries which has shown that project type does not give a simple guide to the relevant baseline for a project. There can be many different baseline circumstances for a given project type and some widening of the existing guidance is recommended to increase flexibility of application. This comparison with the existing guidance from the UNFCCC Executive Board is detailed in the Table 6-2 and Table 6-2, in sections 6.1 and 6.2 above. The specific comments for each of the projects studied are given in the table in detail but some general summary points can also be made as follows:
• There is some flexibility in the existing guidance in terms of the need to consider mixed baselines but the guidance does not explicitly suggest that the different aspects to the reductions have to be considered under the relevant category and assembled to give a total for the project. This is particularly clear and relevant for the Tungu MHP project.
• The principle that in general, there should be equivalence of service between the project and the baseline is shown by the need to use the project activity level when calculating the reductions. This seems to be reasonably consistent across most of the categories though it is not explicitly dealt with. However, in some cases such as in energy efficiency, no specific direction is given and this needs to be added e.g. for equivalent tonnes of charcoal produced in project and baseline.
• Many of the projects do not fit the available categories but these are recognised to be a starting point and new methodologies are being submitted for approval to the EB. In this study we have found that the main exceptions to the categories available are cement kilns, charcoal kilns, sustainable wood, and power capacitors.
• Though for some projects there were appropriate categories we found that for most of the projects some modification is required in the recommended guidance. An example is Tungu which has a mechanical component and a thermal component. In this case two categories are required. However the guidance for the mechanical energy produced an underestimate of the emissions while for the Uwemba MHP an overestimate was produced. For the Sony cogeneration and the AHP MHP where the baseline was grid electricity the Type (i) A and (i) B appropriate to these projects did not provide for such a baseline but could easily be expanded to cater for this.
• For ICS a modification of Type (ii) (G) is required to include firewood. There is currently no appropriate guidance. There is also the problem of the size of the programme involving these small projects as a whole programme of this size could not be counted as <15GWh reduction. Nor could it be considered a large scale project because of the nature of the household level of the equipment this would seem an unreasonable restriction.

66
• The SHS project at Kpasa was able to be properly processed using the baseline guidance either on kerosene or using the solar power equation. On the other hand for the solar project at Utete the reductions were overestimated by both the UNFCCC recommended diesel and the solar equations.
• Some closer examination of the environmental integrity of the equations and emission factors suggested is required especially with regard to Table B4 and B1(see footnote above) If these equations are to be applied widely then we suggest that they should be double checked or weighted as they do not give conservative estimates.

67
6.4 Implications for Monitoring A comparison is made in the following section between the guidance from the EB on monitoring for the specified project type and the actual requirements for the project derived from detailed analysis. The results are summarised in the following Table 6-4. In the table, we list the implied monitoring requirements from our study and compare them to the monitoring guidance provided by the EB. For the Utete solar project, the AHP, Sony and Uwemba projects, the advice based on metering electricity consumption was appropriate. However for the other projects there were some problems. These are summarised below.
• The biogas project requires two main issues to be addressed. One is the kerosene use before and after the project. This needs to be sampled (which was not covered in current guidance on monitoring though mentioned in the baseline advice). The other is the biogas component of the fuel for the generator. This is crucial for the final reductions and their environmental integrity. Spot checks will be required on the biogas composition. This has to be explicitly included for this project type where there is a possibility of more than one fuel for the generator.
• The monitoring advice for the Kpasa SHS and Biogas project is based on metering electricity in the baseline and does not mention the kerosene use before and after the project. The existing guidance on monitoring is therefore insufficient if the standard equation is not applicable.
• In the projects where the baseline is kerosene use it may be possible to minimise monitoring by taking a conservative value for the baseline kerosene use based on an initial country survey which could then be applied to all projects in the country. In this study a value of 10l/mth could be taken for Ghana. For Kenya the average was 8l/mth but more data would be required to confirm this. This would avoid the need to modify the standard equations by weighting.
• For the Tungu MHP project the guidance was also insufficient for the thermal parts of the baseline and new guidance along the lines suggested is required.
• No relevant guidance was available for the charcoal greencoal project, the sustainable wood project, the cement kilns project or the Improved cook stoves project. For the ICS the lifetime of the stove before replacement and the number of stoves is required. Monitoring recommendations are given from the analysis in this study in the table below.
• The uncertainty analysis has helped to pinpoint key variables which need to be measured to maintain integrity.

68
Tab
le 6
-4: C
ompa
riso
n of
UN
FCC
C r
ecom
men
datio
ns fo
r ca
lcul
atio
n of
red
uctio
ns a
nd fo
r m
onito
ring
Proj
ect
Bas
elin
e co
nditi
ons
UN
FCC
C r
ecom
men
d-at
ions
for
mon
itori
ng a
nd
calc
ulat
ion
of r
educ
tions
Unc
erta
inty
Ana
lysi
s R
ecom
men
datio
ns
Com
men
t
App
olon
ia
Bio
gas
Ker
osen
e fo
r lig
htin
g 9-
12l/m
th
Met
erin
g th
e el
ectri
city
sy
stem
or s
ampl
e w
here
the
base
line
is b
ased
on
the
elec
trici
ty p
rodu
ced.
R
educ
tions
are
subt
ract
ion
of p
roje
ct fr
om th
e ba
selin
e fo
r the
pro
ject
out
put s
o as
sum
es e
quiv
alen
ce o
f se
rvic
e
Ker
osen
e co
nsum
ptio
n su
rvey
s bef
ore
and
afte
r the
pr
ojec
t on
rand
om sa
mpl
e ba
sis.
Che
cks t
o se
e th
at
biog
as/d
iese
l rat
io m
aint
aine
d ar
e ne
eded
. Thi
s cou
ld n
ot b
e do
ne p
urel
y on
the
met
ered
el
ectr
icity
out
put
Red
uctio
ns c
anno
t be
base
d on
equ
ival
ence
of s
ervi
ce
betw
een
proj
ect a
nd th
e ba
selin
e fo
r lig
htin
g w
ith
kero
sene
. Sim
ple
subt
ract
ion
is O
K b
ut p
roje
cts c
anno
t be
com
pare
d ea
sily
.
The
UN
FCC
C m
onito
ring
appr
oach
can
not b
e us
ed fo
r th
is p
roje
ct a
s the
bas
elin
e ha
s no
elec
trici
ty p
rodu
ced.
It
need
s to
be e
xpan
ded
to
incl
ude
fuel
use
bef
ore
and
afte
r the
pro
ject
. It
negl
ects
the
prob
lem
with
th
e bi
ogas
/die
sel m
ixtu
re w
ith
the
need
to e
nsur
e th
at th
e bi
ogas
inpu
t is m
aint
aine
d M
onito
ring
of th
e bi
ogas
co
mpo
nent
wou
ld b
e re
quire
d in
add
ition
.
Kpa
sa S
HS
Gha
na
Ker
osen
e us
e (7
-12
l/HH
/mth
) A
nnua
l che
ck th
at a
ll sy
stem
s or s
ampl
e ne
eded
to
ensu
re st
ill o
pera
ting
whe
re
base
line
is fr
om T
able
B1.
R
educ
tions
are
sim
ple
subt
ract
ion
of p
roje
ct fr
om
the
base
line
Ker
osen
e co
nsum
ptio
n su
rvey
s bef
ore
and
afte
r the
pr
ojec
t on
rand
om sa
mpl
e ba
sis
Red
uctio
ns c
anno
t be
base
d on
equ
ival
ence
of s
ervi
ce
betw
een
proj
ect a
nd th
e
The
UN
FCC
C m
onito
ring
appr
oach
che
cks t
hat S
HS
syst
ems a
re st
ill w
orki
ng
whe
n us
ing
stan
dard
equ
atio
n If
ker
osen
e ba
sed
ther
e is
no
guid
ance
on
mon
itorin
g be
fore
and
afte
r pro
ject
.

69
base
line
for l
ight
ing
with
ke
rose
ne. S
impl
e su
btra
ctio
n is
OK
but
pro
ject
s can
not b
e co
mpa
red
easi
ly
Proj
ect
Bas
elin
e co
nditi
ons
UN
FCC
C r
ecom
men
d-at
ions
for
mon
itori
ng a
nd
calc
ulat
ion
of r
educ
tions
Unc
erta
inty
Ana
lysi
s R
ecom
men
datio
ns
Com
men
t
Ute
te S
olar
Po
wer
D
iese
l gen
erat
or fo
r ho
spita
l M
eter
ing
the
elec
trici
ty
syst
em o
r sam
ple
whe
re th
e ba
selin
e is
bas
ed o
n th
e el
ectri
city
pro
duce
d. T
his i
s eq
uiva
lenc
e of
serv
ice
As f
or U
NFC
CC
Th
is is
the
corr
ect
mon
itorin
g ad
vice
for t
his
proj
ect
AH
P M
HP
in K
enya
G
rid e
lect
ricity
and
30
% d
iese
l sta
ndby
M
eter
ing
the
elec
trici
ty
syst
em o
r sam
ple
whe
re th
e ba
selin
e is
bas
ed o
n th
e el
ectri
city
pro
duce
d.
This
is e
quiv
alen
ce o
f se
rvic
e
For K
enya
ther
e is
no
larg
e ef
fect
of p
roje
cted
cha
nges
in
the
elec
trici
ty su
pply
syst
em
so th
at th
e re
sult
is n
ot
sens
itive
to fu
ture
pro
ject
ions
of
the
grid
em
issi
on fa
ctor
in
Ken
ya. T
he 3
0% d
iese
l st
andb
y al
so b
uffe
rs th
e se
nsiti
vity
of t
he re
duct
ion
to
thes
e ch
ange
s.
The
mon
itorin
g ad
vice
from
Ty
pe A
/B C
is re
leva
nt
Sony
C
ogen
erat
ion
with
B
agas
se
Grid
ele
ctric
ity
Met
erin
g th
e el
ectri
city
sy
stem
or s
ampl
e w
here
the
base
line
is b
ased
on
the
elec
trici
ty p
rodu
ced.
Th
is is
equ
ival
ence
of
serv
ice
As f
or A
HP
plan
t abo
ve.
Ther
e is
no
dies
el st
andb
y bu
t K
enya
em
issi
on fa
ctor
s for
gr
id o
nly
vary
by
7%
The
mon
itorin
g ad
vice
from
Ty
pe A
/B C
is re
leva
nt
Uw
emba
D
iese
l gen
erat
or fo
r lig
htin
g se
rvic
e M
eter
ing
the
elec
trici
ty
prod
uced
by
the
rene
wab
le
Th
is m
onito
ring
advi
ce is
re
leva
nt

70
tech
nolo
gy.
This
is e
quiv
alen
ce o
f se
rvic
e
Proj
ect
Bas
elin
e co
nditi
ons
UN
FCC
C r
ecom
men
d-at
ions
for
mon
itori
ng a
nd
calc
ulat
ion
of r
educ
tions
Unc
erta
inty
Ana
lysi
s R
ecom
men
datio
ns
Com
men
t
Tung
u M
HP
Die
sel f
or m
illin
g an
d fir
ewoo
d fo
r tob
acco
cu
ring
Met
erin
g sy
stem
out
put b
y al
l or s
ampl
e of
syst
ems
Met
erin
g th
e th
erm
al e
nerg
y or
sam
ple
ther
eof
for
toba
cco
curin
g
Th
e fir
st p
art o
n m
illin
g is
re
leva
nt to
the
proj
ect
the
amou
nt o
f woo
d us
e be
fore
and
afte
r the
pro
ject
is
need
ed fo
r the
ther
mal
ene
rgy
part
and
the
amou
nt o
f to
bacc
o cu
red.
N
ew a
dditi
onal
adv
ice
is
requ
ired
here
G
reen
coal
pr
ojec
t G
hana
Impr
oved
eff
icie
nt k
ilns
and
sust
aina
ble
woo
d so
urce
For r
etro
fit th
e re
com
men
datio
ns a
re
for d
ocum
entin
g th
e sp
ecifi
catio
ns o
f the
eq
uipm
ent r
epla
ced,
m
eter
ing
the
ener
gy u
se o
f th
e eq
uipm
ent i
nsta
lled
and
calc
ulat
ing
the
ener
gy
savi
ngs.
In th
is c
ase
this
wou
ld n
ot
be q
uite
cor
rect
as t
here
are
tw
o as
pect
s. O
ne is
the
shift
to
sust
aina
ble
woo
d an
d th
e ot
her i
s the
cha
nge
in
We
wou
ld su
gges
t tha
t ex
perim
enta
l dat
a on
the
emis
sion
s fro
m ty
pica
l kiln
s is
gen
erat
ed to
giv
e m
ore
data
fo
r use
in th
e ba
selin
e an
d ne
w te
chno
logi
es m
ust h
ave
thei
r em
issi
ons c
hara
cter
istic
s sp
ecifi
ed. I
n ad
ditio
n th
e am
ount
of w
ood
use
need
s to
be c
lose
ly m
onito
red
for t
his
proj
ect a
nd it
s sou
rce
if it
is
to b
e co
nsid
ered
sust
aina
ble
The
UN
FCC
C a
dvic
e do
es
not a
pply
to th
is p
roje
ct. N
ew
advi
ce a
s sug
gest
ed is
re
quire
d w
ith so
me
guid
ance
on
equ
ival
ence
of s
ervi
ce in
te
rms o
f ton
nage
of c
harc
oal.
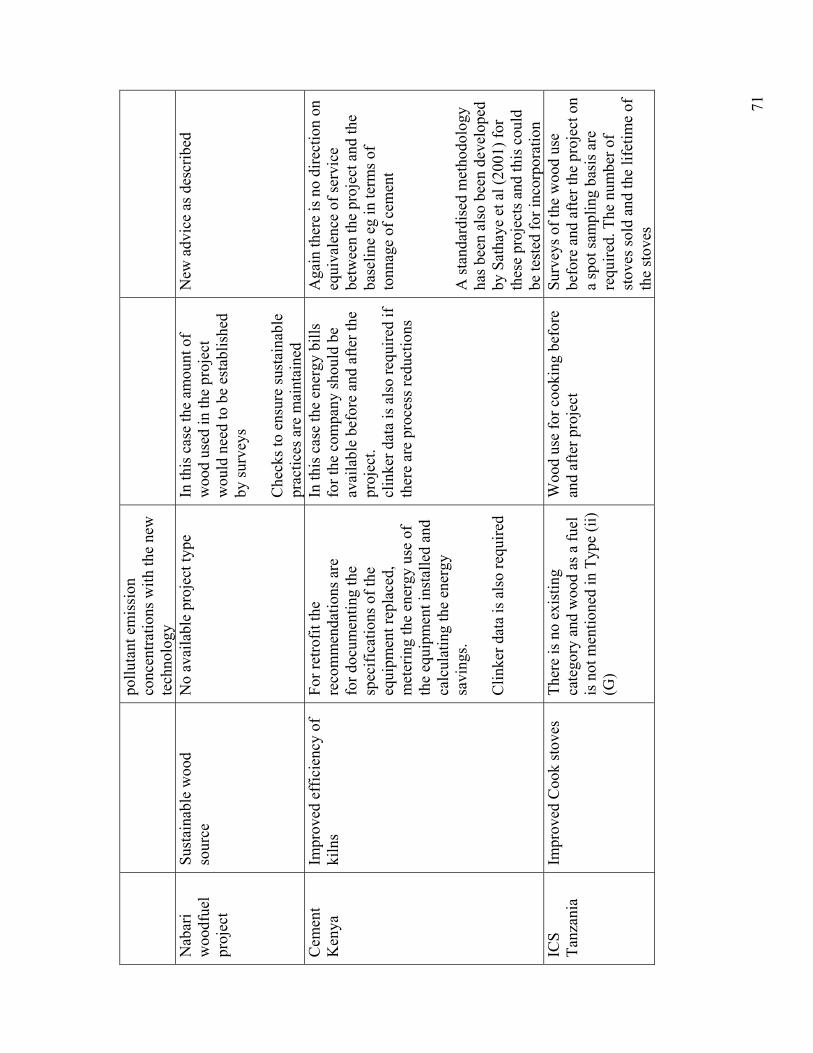
71
pollu
tant
em
issi
on
conc
entra
tions
with
the
new
te
chno
logy
N
abar
i w
oodf
uel
proj
ect
Sust
aina
ble
woo
d so
urce
N
o av
aila
ble
proj
ect t
ype
In th
is c
ase
the
amou
nt o
f w
ood
used
in th
e pr
ojec
t w
ould
nee
d to
be
esta
blis
hed
by su
rvey
s C
heck
s to
ensu
re su
stai
nabl
e pr
actic
es a
re m
aint
aine
d
New
adv
ice
as d
escr
ibed
Cem
ent
Ken
ya
Impr
oved
eff
icie
ncy
of
kiln
s Fo
r ret
rofit
the
reco
mm
enda
tions
are
fo
r doc
umen
ting
the
spec
ifica
tions
of t
he
equi
pmen
t rep
lace
d,
met
erin
g th
e en
ergy
use
of
the
equi
pmen
t ins
talle
d an
d ca
lcul
atin
g th
e en
ergy
sa
ving
s. C
linke
r dat
a is
als
o re
quire
d
In th
is c
ase
the
ener
gy b
ills
for t
he c
ompa
ny sh
ould
be
avai
labl
e be
fore
and
afte
r the
pr
ojec
t.
clin
ker d
ata
is a
lso
requ
ired
if th
ere
are
proc
ess r
educ
tions
Aga
in th
ere
is n
o di
rect
ion
on
equi
vale
nce
of se
rvic
e be
twee
n th
e pr
ojec
t and
the
base
line
eg in
term
s of
tonn
age
of c
emen
t A
stan
dard
ised
met
hodo
logy
ha
s bee
n al
so b
een
deve
lope
d by
Sat
haye
et a
l (20
01) f
or
thes
e pr
ojec
ts a
nd th
is c
ould
be
test
ed fo
r inc
orpo
ratio
n IC
S Ta
nzan
ia
Impr
oved
Coo
k st
oves
Th
ere
is n
o ex
istin
g ca
tego
ry a
nd w
ood
as a
fuel
is
not
men
tione
d in
Typ
e (ii
) (G
)
Woo
d us
e fo
r coo
king
bef
ore
and
afte
r pro
ject
Su
rvey
s of t
he w
ood
use
befo
re a
nd a
fter t
he p
roje
ct o
n a
spot
sam
plin
g ba
sis a
re
requ
ired.
The
num
ber o
f st
oves
sold
and
the
lifet
ime
of
the
stov
es

72
7 Bundling For small scale projects, the transaction costs incurred by the projects present a significant barrier to the implementation of these small scale projects under the CDM. These costs are associated with the ease by which the baselines and monitoring plan can be generated, validated, monitored and verified by an operational entity. They are recognised to be very high compared to the project costs and the expected revenue from the sale of CERs. (Michaelova and Stronzic 2002, Green et al 2003). The Executive Board for the CDM has recognised this problem and a simplified Project design document (PDD) for small scale projects along with simplified baseline modalities discussed above were approved at COP 9. In addition only one operational entity is required for validation and verification compared to two for large projects. To try to minimise the transaction costs associated with the CDM project cycle, small scale projects may be aggregated as a programme or portfolio of projects for all stages of the project cycle to spread the costs over a number of projects. This is called bundling. However in addition to the transaction costs associated with the project cycle there are other costs to be considered. For example most of these small scale projects require capacity building for the local participants and participation arrangements to ensure local input to the design of the project and local term engagement with the project. This is vital to ensure the delivery of the GHG reductions and sustainability benefits in the long term. These other costs include
• the costs of additional capacity building requirements for small scale projects, • the simple institutional process and structures required in each country for small
scale projects with minimisation of investor risk, Only the first accrues solely to the investor. The institutional process for approval within the host country will have a knock on effect for investors but costs will also accrue to the host country. If a simple institutional process is not in place then there will be a risk of failure of the CDM process for small scale projects in the host country. Mechanisms to offset the risk to investors such as that by the government of Costa Rica would also have host country costs but would make it more attractive to investors. In practical terms there is also a need to consider the different bundling options available which will work in practice to produce the required minimisation in costs though at the same time it is important to design the approach to ensure the maximisation of local sustainability benefit delivery. A recent study by Green et al (2003) evaluated the CDM transaction costs and revenues for some CDM type projects in Ghana and concluded that bundling was essential for enabling small scale projects to be implemented under the CDM. They suggested that a bundling organisation financed by commercial enterprises would be needed but that the

73
risks were still too great as the CER production from each project is not in the control of the bundling organisation and thus project failures could be high. If the bundle is made up of many projects involving a range of different parties then this can become unmanageable. They suggest that these risks can be managed if the projects share some synergy and other criteria are met. The criteria given are
• high CER regimes of at least 20000tCO2/y through aggregation • CERs should form at least 10% of the net revenue for the project • established institutional frameworks for the CDM in the host country • common elements for baseline standardisation.
In the following sections we discuss the issue of size of project in relation to the projects in this study and the issue of common elements for baseline standardisation. Institutional arrangements are dealt with in Attachment 5.
7.1 Suitability of current projects in terms of size Michaelova and Stronzic (2002) categorised projects according to size in terms of total reductions and correlated this with expected costs and cost of reductions per tonne carbon dioxide. Their categories were
• Large (wind solar thermal) giving reductions of 20000-200000tCO2/y • Small (boiler conversions, DSM, small hydro) giving reductions between 2000-
20000tCO2/y • Mini (energy efficiency in housing , SME, mini hydro) 200-2000tCO2/y • Micro (PV) <200 tCO2/y
They suggested from this the rough guide that projects of 20000t CO2/y were needed before the cost of the reductions would make the project attractive to investors. Taking the Table of projects listed by size from Section 2 of this Attachment 4 we can label the projects using the colour scheme indicated.

74
Table 7-1 List of projects and sizes
Country Project Baseline Size Reduction over 20y in ktCO2
Tanzania ICS Programme
Trad stoves 144MW 30-60GWh/y reduction project would need to be halved in size to meet 15GWh restriction
6450
Kenya Cogen Grid electricity 15MW 119 Kenya MHP Grid and diesel 1.4MW 52.2 Tanzania MHP Diesel
generator 843kW 41
Ghana Trad wood Unsustainable wood
38kW 1.85
Ghana SHS Kerosene 21kW 2.7 Kenya MHP Diesel and
firewood 18kW 0.45
Ghana Biogas Kerosene 12.5kW 0.15 Kenya Pico Kerosene 3.4 kW 0.93 Tanzania solar Diesel 0.9kW 0.033 Ghana Eff charcoal
kiln Inefficient kiln 5GWh/y 32.5
Kenya Cement Inefficient kilns
Ghana Capacitors Inefficient power factor
It can be seen that the ICS project in Tanzania is already a bundled project. It is the only one likely to have transaction costs spread over the projects sufficiently to make the project viable in terms of transaction costs for the CDM. In fact it may be over the limit for small projects which as pointed out earlier would be counterproductive. The advice on de-bundling from the EB would mean that only part of the project could be eligible for CERs. The Ghana SHS is also bundled in a sense, but like all the other projects is too small, and would have to be bundled further in some way.
7.2 Implications for Bundling from the Analysis

75
The results from our analysis have an impact on how projects can be bundled to effectively maximise the time savings associated with the simplified procedures for fast tracking projects. From the discussion above a target of at least 20000tCO2/y for the reductions from a set of projects has been identified (Michaelova and Stronzic 2002) so that the number of projects included in the bundled project should be able to be identified. This should also ensure that the CERs represent a significant percentage of the net revenue. In the following sections we explore the possible bundling options with respect to the projects in the study firstly from the baseline point of view and then from the monitoring aspects.
7.2.1 Bundling options and Baseline standardisation from the analysis In the set of projects examined in this study, it is clear that similar project types do not necessarily have similar baselines. For example for the MHP projects the range of mixed baselines was high and ranged from kerosene to grid electricity. This does not apply to ICS or to SHS projects where wood fuel or kerosene is usually replaced. Simplified baseline modalities can be applied where the baseline situation is similar or there are only a small number of standardised baselines needed to describe the bulk of the projects. Thus the focus has to be on what is being replaced in the baseline as well as what service the project is providing. For the MHP projects in Kenya, the service provided and baseline are listed in the table below.
Table 7-2 MHP projects in Kenya with varying baselines
Project Service Baseline Comment Tungu Electricity for local
enterprise centre Heat for Tobacco curing
Diesel generator Wood fuel
Mixed baseline
Kathamba Pico Hydro
lighting kerosene Simple baseline
AHP tea MHP electricity for factory and lighting
Grid electricity Simple baseline
From Table 7-1 it can be seen that in the same country we can have a whole range of different baseline conditions for the same project type. However simplified baselines can be applied for these types of projects, and even with this diversity, bundling over a larger sample would be possible provided the baseline situation is known for each and that they fall into limited categories such as those in the table above.
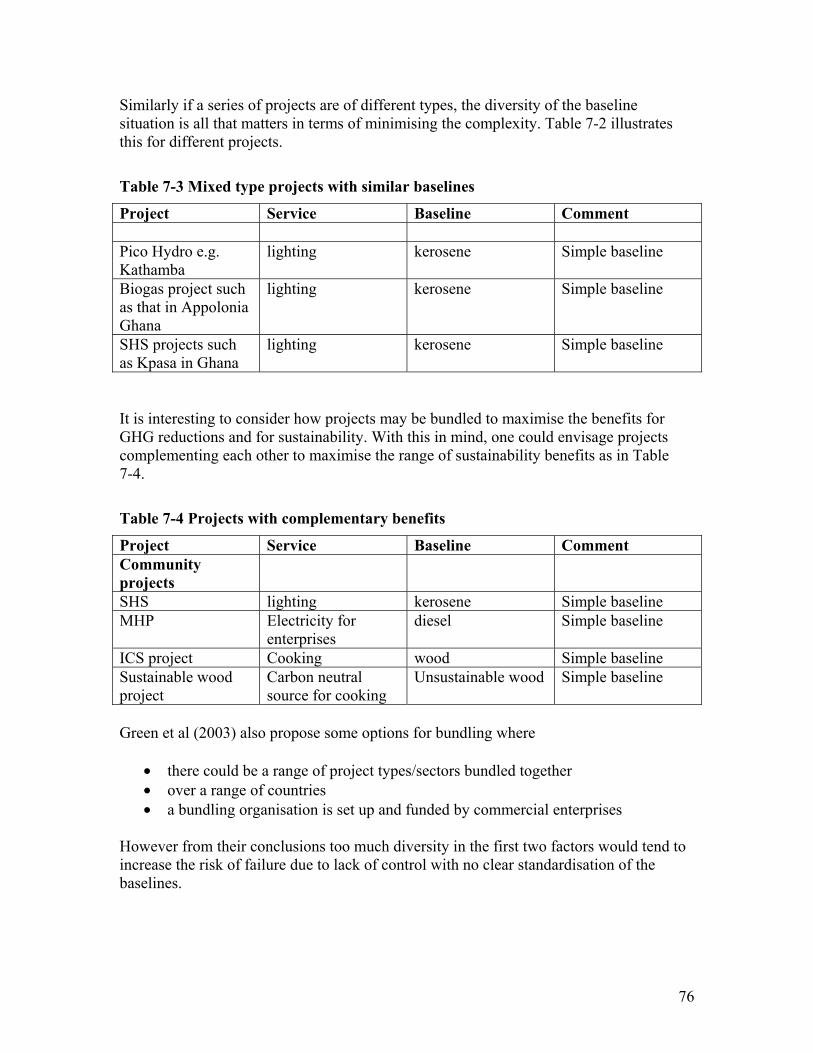
76
Similarly if a series of projects are of different types, the diversity of the baseline situation is all that matters in terms of minimising the complexity. Table 7-2 illustrates this for different projects.
Table 7-3 Mixed type projects with similar baselines
Project Service Baseline Comment Pico Hydro e.g. Kathamba
lighting kerosene Simple baseline
Biogas project such as that in Appolonia Ghana
lighting kerosene Simple baseline
SHS projects such as Kpasa in Ghana
lighting kerosene Simple baseline
It is interesting to consider how projects may be bundled to maximise the benefits for GHG reductions and for sustainability. With this in mind, one could envisage projects complementing each other to maximise the range of sustainability benefits as in Table 7-4.
Table 7-4 Projects with complementary benefits
Project Service Baseline Comment Community projects
SHS lighting kerosene Simple baseline MHP Electricity for
enterprises diesel Simple baseline
ICS project Cooking wood Simple baseline Sustainable wood project
Carbon neutral source for cooking
Unsustainable wood Simple baseline
Green et al (2003) also propose some options for bundling where
• there could be a range of project types/sectors bundled together • over a range of countries • a bundling organisation is set up and funded by commercial enterprises
However from their conclusions too much diversity in the first two factors would tend to increase the risk of failure due to lack of control with no clear standardisation of the baselines.
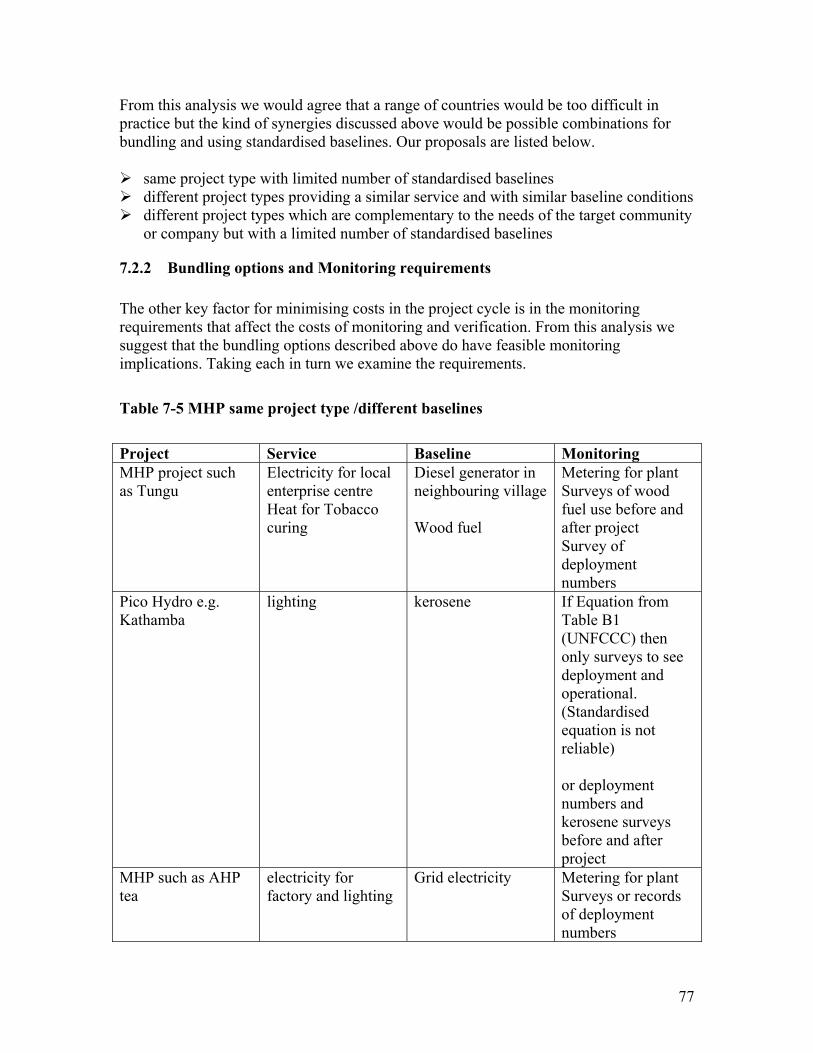
77
From this analysis we would agree that a range of countries would be too difficult in practice but the kind of synergies discussed above would be possible combinations for bundling and using standardised baselines. Our proposals are listed below.
same project type with limited number of standardised baselines different project types providing a similar service and with similar baseline conditions different project types which are complementary to the needs of the target community
or company but with a limited number of standardised baselines
7.2.2 Bundling options and Monitoring requirements The other key factor for minimising costs in the project cycle is in the monitoring requirements that affect the costs of monitoring and verification. From this analysis we suggest that the bundling options described above do have feasible monitoring implications. Taking each in turn we examine the requirements.
Table 7-5 MHP same project type /different baselines Project Service Baseline Monitoring MHP project such as Tungu
Electricity for local enterprise centre Heat for Tobacco curing
Diesel generator in neighbouring village Wood fuel
Metering for plant Surveys of wood fuel use before and after project Survey of deployment numbers
Pico Hydro e.g. Kathamba
lighting kerosene If Equation from Table B1 (UNFCCC) then only surveys to see deployment and operational. (Standardised equation is not reliable) or deployment numbers and kerosene surveys before and after project
MHP such as AHP tea
electricity for factory and lighting
Grid electricity Metering for plant Surveys or records of deployment numbers

78
For projects with similar baseline conditions
Table 7-6 Mixed type projects with similar baselines
Project Service Baseline Monitoring Pico Hydro e.g. Kathamba
lighting kerosene If Equation from Table B1 (UNFCCC) then only surveys to see deployment and operational. (Standardised equation is not reliable) or kerosene surveys before and after project and deployment numbers
Biogas project such as that in Appolonia Ghana
lighting kerosene Biogas use spot checks Deployed numbers Kerosene use before and after surveys or use of standard equation
SHS projects such as Kpasa in Ghana
lighting kerosene Deployed numbers Spot check are operational Kerosene use surveys as above or use standard equation
For projects where there are synergistic benefits both for the GHG reductions and for the sustainability benefits then the monitoring can be standardised on a few variables as follows.

79
Table 7-7 Projects with complementary services
Project Service Baseline Monitoring Community projects
SHS lighting kerosene Use weighted equation or kerosene use surveys before and after Deployment numbers Spot checks are operational
MHP Electricity for enterprises
diesel Electricity metering Deployed numbers
ICS project Cooking wood Deployed numbers. Lifespan, Spot checks to ensure are operational. Surveys for wood use before and after
Sustainable wood project
Carbon neutral source for cooking
Unsustainable wood Hectares planted Sustainable practices maintained Survey of wood use This can applied across country for all projects
7.2.3 Recommendations
The bundling of projects could be carried out under a variety of formats to minimise the costs of the baseline construction.
The simplest is to have a large programme of the same type of project e.g. ICS or SHS. Other formats include
Projects of different types but the same baseline conditions (the ICS and SHS are a special case of this as they do usually replace wood/charcoal or kerosene use respectively)
Projects of the same type but with a limited number of different baseline conditions
Projects which can complement each other in terms of GHG reductions and sustainability benefits with limited number of different baseline conditions.

80
The monitoring information can be derived from limited spot sampling to keep down costs and from general surveys within the country.
These country surveys to measure for example, wood and kerosene use, can then be applied to all subsequent projects to be bundled in that country.
The reductions can be calculated either using the standard baseline equations in UNFCCC Tables B1 and B4 with some checks to prevent overestimates or through the baselines suggested from the analysis.
The reductions should be calculated for one representative project for each baseline type and then multiplied by the numbers deployed and operational, maintaining equivalence of service and lifetime of technology (e.g. 3 years for ICS) where possible.
Bundling of projects also requires consideration of the institutional structures in the country and the capacity building requirements for these projects. These are discussed in Attachment 5 to the main report.

81
8 References Ahuja D. (1993) ‘The incremental cost of climate change mitigation projects’, Working Paper no. 9, Global Environmental Facility, Washington DC. Begg K., Jackson, T.,Van der Gaast, W., Jepma, C., Sorrell, S., Smith, A.,Van der Horst, D., Bandsma, J. and ten Hoopen, M., (2002) ‘Guidance for UK emissions trading projects’ Phase 1 Advice to Policymakers, DTI. Begg, K. and Parkinson, S., (2001), ‘JI and the CDM: Lessons from Pilot project assessment’, Energy and the Environmenet, vol 12, 5&6, 475-486. CORINAIR/EMEP (1996) Atmospheric Emission Inventory Guidebook, First Edition, McInnes, G., (Ed.) European Environment Agency, Copenhagen, Denmark. Green, J., Mariyappan, J., Plastow,J., Mensah-Brown, H., Agbey, S., and Brew-Hammond, A.,(2002), ‘Bundling and small scale projects’, Report for FCO CCCF. IPCC/UNEP/OECD/IEA (1996) Revised IPCC Guidelines for National GHG Inventories Volume 3: GHG Inventory Reference Manual. IPCC: Bracknell, UK. Martens, van Rooijen, Bovee and Wijnants, (2001), ‘Standardised Baselines for Small Scale CDM Activities’, ECN-C-01-122. Michaelova, A. and Stronzik,M., (2002), ‘Transaction costs of the Kyoto Mechanisms’, HWWA discussion paper 175 Parkinson, S. and Begg, K., Jackson, T. and bailey, P.,(2001), Accounting for flexibility against uncertain baselines: lessons from case studies in Eastern European energy sector, Climate Policy, 1 (1),55-73. Pennisse D.M., (2001), Journal of Geophysical Research, Vol 106, D20, 24, 143-24,155, October 27, 2001. Sathaye , J. Price, L., Worrell, E. and Ruth, M., (2001) ‘Multi project baselines for evaluation and Industrial Energy efficiency and Electric Power projects’ LBL report fro the EPA LBNL-48242 Smith, K. R., Pennisse, D.M., Khummongkol P., Charwong, V., Ritgeen, K., Zhang, J., Panyathanya, W., Rasmussen, R.A., and Khalil, M.A.K., (1999), ‘Greenhouse gases from small scale combustion in developing countries: Charcoal making kilns in Thailand, Rep EPA-600/R99-109. ( www.epa.gov/crb/apb/publications.htm) UNFCCC (2002) FCCC/CP/2002/7/Add.3 Simplified modalities and procedures for small scale projects

82
UNFCCC (2001) FCCC/CP/2001/13/Add.2 Annex to decision 17/CP.7 on the modalities and procedures for the CDM Van der Gaast, W., Jepma,C., Begg, K., Michaelova, A., Butzengeiger, S., Flamos, A., Brodmann, U. Procedures for Accounting and Baselines for JI and CDM projects,(PROBASE), Final report to EU FPV

83
Annex 4.1 Initial Project List Kenya Tanzania Ghana MHP, Tungu Kaburi
MHP Uwemba
Solar Water Heaters, Urban & Rural Communities**
Sony sugar co Diesel to bagasse cogen
Sugar cogen grid to bagasse Mtibwa
Solar pump Water treatment, rural communities
Bamburi cement energy efficient kilns
Improved efficiency of charcoal Kilns for rural communities
Biomass Plantation for Charcoal Production, Ashanti Region More efficient kilns
Thima Pico hydro Solar PV Refrigeration** African Highland Produce MHP and cogen
Solar dryers Agricultural communities
Solar Dryers**
Solar power for schools instead of kerosene
SHS for off grid Solar Home Systems for Rural Communities
ICS ICS TATEDO programme
ICS Energy Efficiency cookstoves & lighting, urban & rural
Improved brickmaking wood to diesel
Solar Water Pumps, rural communities** for drinking water
Energy Efficiency in industry National programme
Energy Efficiency in commercial & Industries, Nationwide
Projects in blue would provide cross country comparisons

84
Annex 4.2 Technical Data Requirements

85
CAPA project:
Project Types: Pico, Mini- and Micro-Hydro, Solar , and energy efficiency projects eg charcoal kilns
Technical and Financial Data Requirements
About this form/questionnaire: Please find below a brief explanation on the structure of the forms, and important guidelines about how to fill the form. For each project, there are two cases on which we need data: • Baseline case: this is a description of the most likely situation in the absence of the
project. If without the project ‘nothing new’ would have happened, then you must describe the existing situation before the project started. However, it is also possible that in the absence of the project, the existing situation would not have remained unchanged. In that case, you need to describe the expected changes in the absence of the project (for example if a micro hydro scheme replaces a very old diesel generator which is almost falling apart, then this generator would have had to be replaced in the near future anyway, e.g. by a newer diesel generator or by ‘nothing’ if there was no money to replace the old generator)
• Project case: details about the project This form has 3 sections which need to be filled, both for the baseline case and for the project case; 1. A general description of the situation 2. Technical data 3. Financial data NB: section 2 will be used to calculate the emissions reduction of the project (i.e. GHG emissions of the baseline minus GHG emissions of the project) section 3 will be used to calculate the incremental cost of the project (i.e. the total cost of the project minus the total cost of the baseline) When you fill in the form, please bear in mind: The more information you can provide, the better. However, it is also important to make a note of the reliability of the data. So: • Please give measured operating data as much as possible. If data from the feasibility
study is available in the project case, please specify this as well. Please label all data: measured [M], estimated [E], from feasibility study [F]
• For all data please specify units if these are not the same as requested in the form • If possible, please estimate uncertainties in the values given, eg ±20%.

86
Not all questions will necessarily apply to all project types If you have any technical drawings or reports on the project please attach. 1. General Information 1.1 Baseline Case: 1.What was the energy source that supplied energy needs before present project? Eg kerosene lamp 2.Did it give an equivalent energy service? If not, how did it differ? 3. Age of the existing measure/s 4. How long had this situation been in place, and how long might it have continued without the project ? 5. What are the other local sources of energy? 6. Which ones could have been developed if the project had not been built (technical and financial details of these will be require in sections 2 and 3)? 7. What were the limiting factors?

87
8. please give details of ownership of the pre-project situation 8. How is the fuel transported. 9. How far is it transported? 10. Other information: 1.2 Project Case: 1. Type of project 2. Location 3. Ownership 4. Date built 5 Why the technology was chosen? 6 How much foreign involvement was there – technical, material, financial, etc? 7. Is there an existing base for the technology in the country?

88
8. What is the source of the equipment - local or imported? 9. Does the project simply replace an old energy source or does it create new energy end-used by making power available (or both)? 10. Is demand for the power that this plant is supplying likely to rise? How is this likely to be met? 11. If energy is supplied to commercial plant, have the other outputs, eg tea, been increased as a result of the project? 12. How is the fuel transported. 13. How far is it transported? 14. Other information:

89
2. Technical Data 2.1 Baseline Case (pre-project situation) If pre-project situation was a project: 1. Capacity (design) [kW] 2. Remaining lifetime [y] 3. Annual output/ usage [kWh/y or state units used] (for previous five years, if possible) 4. Efficiency [%] 5. What was the fuel used? 6. Where does the fuel come from? Place and distance in Km 7. For Wood: Is the wood harvested from a forest practising sustainable forest management? 8. Annual fuel consumption [kg/y or MJ/y] (for previous five years, if possible) 9. Calorific value of fuel [MJ/kg] 10. Load factor
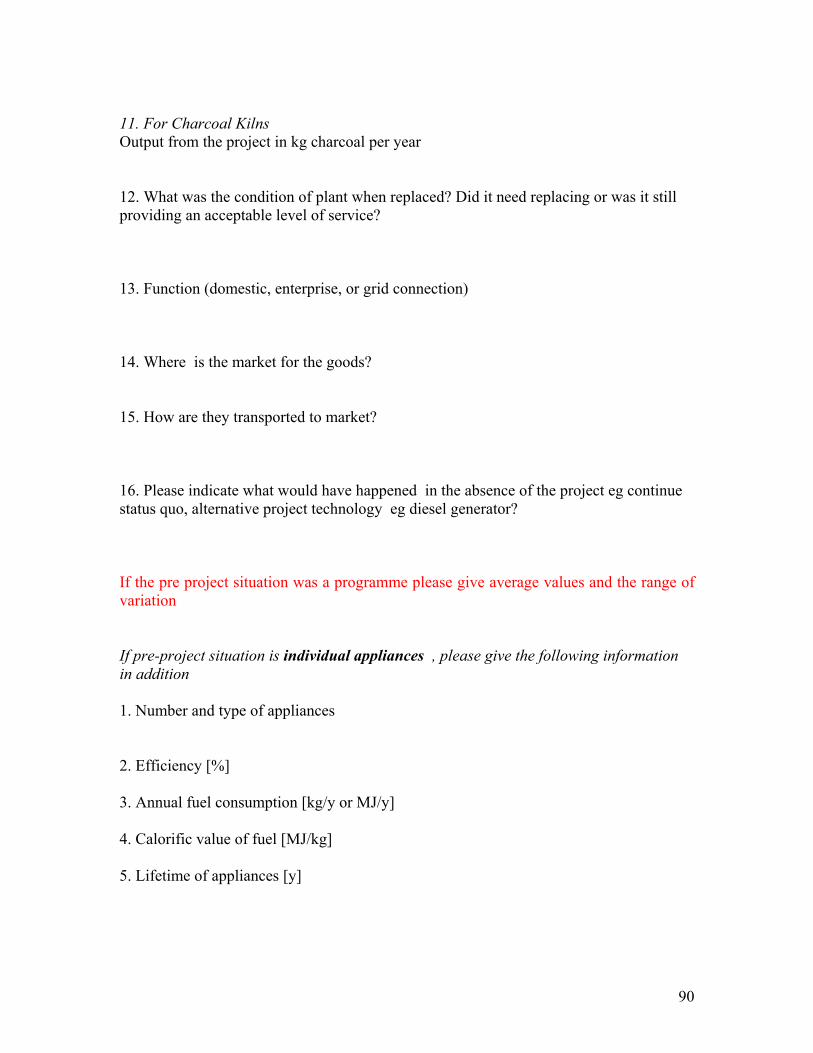
90
11. For Charcoal Kilns Output from the project in kg charcoal per year 12. What was the condition of plant when replaced? Did it need replacing or was it still providing an acceptable level of service? 13. Function (domestic, enterprise, or grid connection) 14. Where is the market for the goods? 15. How are they transported to market? 16. Please indicate what would have happened in the absence of the project eg continue status quo, alternative project technology eg diesel generator? If the pre project situation was a programme please give average values and the range of variation If pre-project situation is individual appliances , please give the following information in addition 1. Number and type of appliances 2. Efficiency [%] 3. Annual fuel consumption [kg/y or MJ/y] 4. Calorific value of fuel [MJ/kg] 5. Lifetime of appliances [y]

91
2.2 Project Case 1. Capacity (design) [kW] 2. Annual Output/ Usage [kWh/y] for each year of operation since commissioning (or total output since commissioning) 3. Efficiency [%] 4. Load factor [%] 5. Expected lifetime of equipment [y] 6. Distance to grid [km] 7. Has the project been operating satisfactorily during its lifetime? Please give details of outages, both maintenance and forced. 8. What external factors affect the operation of the project? (eg rainfall) 9. Function (domestic, enterprise, or grid connection) 10 What is the fuel used? 11. Where does the fuel come from? Place and distance in Km 12. For Wood: Is the wood harvested from a forest practising sustainable forest management? 13. Annual fuel consumption [kg/y or MJ/y] (for previous five years, if possible)

92
14. Calorific value of fuel [MJ/kg]
For Charcoal Kilns 15. Output from the project in kg charcoal per year For a programme of projects please give answers to 1-15 for the programme and 16 16. Domestic and enterprises served by scheme (number of households, type of enterprises, load pattern breakdown from different sectors, if possible) [kWh]
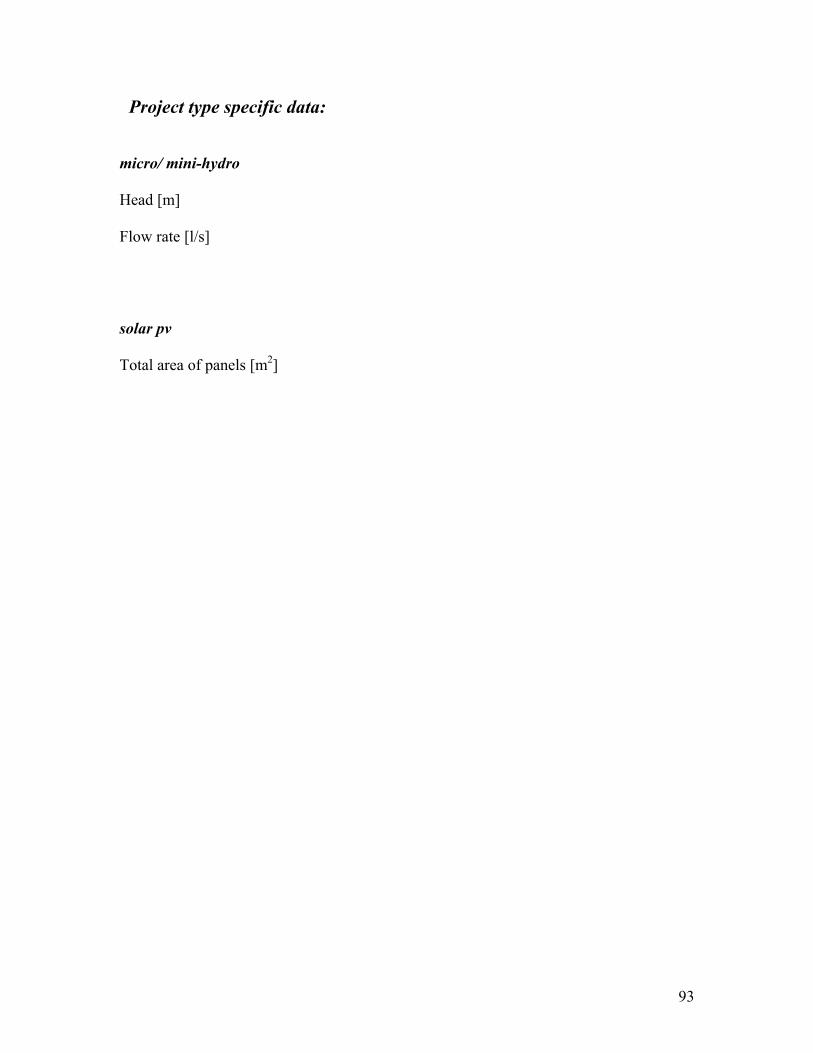
93
Project type specific data: micro/ mini-hydro Head [m] Flow rate [l/s] solar pv Total area of panels [m2]

94
3. Financial Data
3.1 Baseline Case (pre-project situation) [in local currency] 1. Annual operation and maintenance costs (including spares) [currency/y] 2. Fuel costs [currency/kg or currency/MJ] 3. Transport costs, if relevant 3.2 Project Case [in local currency] 1. Capital cost (including breakdown by funding organisation) If labour was provided by locals as an alternative to finance, please give details. Hardware costs Engineering and construction costs Planning costs Other costs Total 2. Annual operation and maintenance costs (including spares) [currency/y] 3. Annual Fuel costs [currency/kg or currency/MJ]

95
4. Annual Income from electricity sales [currency per kWh] plus any other outputs (mechanical/heat/etc.) 5. Annual Transport costs/y 6. Transaction costs: feasibility study , preparation of proposal, training costs, loan administration, other costs
7. How was the project implemented ? 8. who was involved? 9. How was the project financed? Finance Donor country Host country Owner Other Grant Equity Loan Loan admin.costs Total 10. Loan Structure what was the interest rate and time limit for repayment? What is the current market rate for loans in this sector?

96
Can the government be held responsible if the loan is not paid back? What is the current inflation rate in the country? For a programme of projects please give the data as for a project but give average values for the programme and the range of variation Thank You

97
Annex 4.3 Country Contexts These are attached as a separate document.