Embed Size (px)
Citation preview

PAPER
Encoding many channels on the same frequencythrough radio vorticity: first experimental testTo cite this article: Fabrizio Tamburini et al 2012 New J. Phys. 14 033001
View the article online for updates and enhancements.
You may also likeHearing the music of the primes: auditorycomplementarity and the siren song ofzetaM V Berry
-
Musical molecules: the molecular junctionas an active component in audio distortioncircuitsAdam Johan Bergren, Lucas Zeer-Wanklyn, Mitchell Semple et al.
-
The VLSI design of the sub-band filterbankin MP3 decodingJia-Xin Liu and Li Luo
-
This content was downloaded from IP address 128.127.90.36 on 12/03/2022 at 13:43
T h e o p e n – a c c e s s j o u r n a l f o r p h y s i c s
New Journal of Physics
Encoding many channels on the same frequencythrough radio vorticity: first experimental test
Fabrizio Tamburini1,2,8, Elettra Mari3, Anna Sponselli1,Bo Thide4,5, Antonio Bianchini1 and Filippo Romanato6,7
1 Department of Physics and Astronomy, University of Padova, vicolodell’Osservatorio 3, I-35122 Padova, Italy2 CIVEN, Via delle Industrie 5, Torre Hammon I-30175, Venezia-Marghera,Italy3 CISAS, University of Padova, via Venezia 15, I-35131 Padova, Italy4 Swedish Institute of Space Physics, Box 537, Ångstrom Laboratory, SE-75121Uppsala, Sweden5 Scuola Galileiana di Studi Superiori, University of Padova, via VIII Febbraio1848, I-35122 Padova, Italy6 Department of Physics and Astronomy, University of Padova, via Marzolo 8I-35100 Padova, Italy7 LaNN, Laboratory for Nanofabrication of Nanodevices, Venetonanotech, viaStati Uniti 4, I-35100 Padova, ItalyE-mail: [email protected]
New Journal of Physics 14 (2012) 033001 (17pp)Received 12 July 2011Published 1 March 2012Online at http://www.njp.org/doi:10.1088/1367-2630/14/3/033001
Abstract. We have shown experimentally, in a real-world setting, that itis possible to use two beams of incoherent radio waves, transmitted on thesame frequency but encoded in two different orbital angular momentum states,to simultaneously transmit two independent radio channels. This novel radiotechnique allows the implementation of, in principle, an infinite number ofchannels in a given, fixed bandwidth, even without using polarization, multiportor dense coding techniques. This paves the way for innovative techniques in radioscience and entirely new paradigms in radio communication protocols that mightoffer a solution to the problem of radio-band congestion.
S Online supplementary data available from stacks.iop.org/NJP/14/033001/mmedia
8 Author to whom any correspondence should be addressed.
New Journal of Physics 14 (2012) 0330011367-2630/12/033001+17$33.00 © IOP Publishing Ltd and Deutsche Physikalische Gesellschaft

2
Contents
1. Introduction 22. Transmitting with radio vortices 33. Intensity mapping of the field 34. Radio transmission with orbital angular momentum 55. Conclusions 9Acknowledgments 10Appendix 11References 16
1. Introduction
The first radio signal transmitted and received by Guglielmo Marconi on 8 December 1895started the wireless communication revolution [1]. Now information is mostly exchangedthrough wireless channels and the rapid increase of the use of mobile devices has led tocongestion in the available radio bands even after the application of dense coding and channelsharing techniques [2]. Therefore, it is important to try to develop new methods that make itpossible to utilize the electromagnetic (EM) spectrum better.
One way is to exploit fundamental physical properties of the EM field that hithertohave not been utilized in radio communications. To this end, we recall that the EM fieldcan carry both energy and momentum. Whereas the Poynting vector S and the concomitantlinear momentum p =
∫d3x S (rational units) are associated with force action and therefore
with translational dynamics, the angular momentum J =∫
d3x (x × S) is a conserved physicalobservable (constant of motion) that is associated with torque action and thus with rotationaldynamics [3]. In a beam geometry as used in radio communications, the total angularmomentum can be conveniently expressed as the sum of two components: J =Σ+ L. Thecomponent Σ represents the spin angular momentum (SAM), related to the polarization ofthe individual EM waves of the beam and thus with photon helicity. The component Lrepresents the lesser-known orbital angular momentum (OAM) associated with the helicoidalphase profile of the EM beam in the direction orthogonal to the propagation axis. In a quantumpicture L can be described as a superposition of discrete photon quantum eigenstates, eachwith a well-defined OAM value `h, ` = 0, ±1, ±2, . . . [4–7]. Hence, not only in mechanicsbut also in electromagnetism, OAM is a fundamental physical quantity that spans an infinitestate space [8]. It offers, in addition to the conventional translational linear momentum andpolarization (SAM) rotational degrees of freedom, which spans only a two-dimensional (2D)state space, additional rotational degrees of freedom that are distinctly different from SAM.Without increasing the frequency bandwidth, the OAM states can be used as a new, very largeset of communication channels that are mutually orthogonal to each other in the OAM statespace.
Here we report the results of real-world, outdoor radio experiments in the 2.4 GHz WiFiband that demonstrate the feasibility of increasing the wireless information transfer capacityover large distances by exploiting the OAM states [8] of EM waves. Our findings extendprevious indoor laboratory test experiments in which the transmission of optical OAM states of
New Journal of Physics 14 (2012) 033001 (http://www.njp.org/)
3
coherent laser [9] and radio [10] beams was demonstrated. The results reported here show thatOAM and vorticity are preserved throughout the long-distance propagation over long distancesand can indeed be utilized in radio communication.
Unlike already existing radio communication protocols that use the spatial phase distri-bution generated by a set of antennae to artificially increase the transmission bandwidth, theimmediate advantage provided by a protocol based on the physical OAM states as independentcommunication channels is that of using the peculiar spatial phase distribution of each of thesestates as a reference pattern to generate, modulate and detect them in a better way.
OAM has found practical applications in many other fields such as radar [11],nanotechnology [12], quantum experiments [13] and also astronomy and space sciences[14–18], improving the resolving power of diffraction-limited optical instruments [19] andfacilitating the detection of extrasolar planets [20] and Kerr black holes [21].
2. Transmitting with radio vortices
To date, there has been no report on the transmission of twisted radio beams in a real-world experiment. The results from our outdoor radio vorticity experiments demonstrate thatwhen using a given radio frequency bandwidth around a fixed carrier frequency, the inherentorthogonality (in a Hilbert sense) of the denumerably infinite OAM state space can ideallyprovide, without increasing the frequency bandwidth, an arbitrarily large set of independentOAM transmission channels, each characterized only by its peculiar topological property. Thisnew technique can be described as topological diversity.
In our radio vorticity communication experiments, we generated and detected twoorthogonal OAM channels within a given fixed frequency band: one untwisted with OAM ` = 0and the other with an ` = 1 OAM twist. Two identical WiFi FM transmitters, each with anoutput power of 2 W and driven by a signal generator, were tuned to the carrier frequency of2.414 GHz to feed two antennae. In an FM transmission the amplitude and intensity of the EMwave remain constant in time; only the carrier frequency is modulated. The signal-to-noise ratioof the WiFi modules was 38 dB for the video channel and 45 dB for the audio band. The receiversensitivity was −90 dBm, i.e. 10−9mW. The transmitted signal bandwidths of both signals were15 or 27 MHz, like those used in video signals.
The ` = 0 source was radiated with linear polarization by a commercial 16.5 dBi gainYagi–Uda antenna [22]. To generate the ` = 1 vortex beam, we mechanically modified a 26 dBicommercial off-axis parabolic antenna, with diameter D = 80 cm, to attain an off-axis spiralparabolic-shaped phase mask reflector. The expected beam waist, given by the diffraction limitof the antenna, is δϕ = 1.22λ/D ≈ 10.9◦, where λ is the radio wavelength. The half-power beamwidth (HPBW), i.e. the angular separation between the points on the antenna radiation patternat which the power or, equivalently, the linear momentum, drops to half its maximum value isθ = kλ/D = 8.75◦. The characteristic parameter of the antenna, k, is a factor that depends onthe shape of the reflector and the method of illumination. This ` = 1 beam was also linearlypolarized. Additional technical details of the experiment can be found in the appendix.
3. Intensity mapping of the field
As a first step, we characterized experimentally the physical properties of the twisteduncorrelated achromatic EM wave train, proving that vorticity and OAM can indeed be radiated
New Journal of Physics 14 (2012) 033001 (http://www.njp.org/)

4
Figure 1. Intensity map of the radio beam vortex at 40 m (∼320 λ) in free spacein the region around the singularity. The intensity distribution in this regionexhibits fluctuations caused by perturbation and interference effects. The centraldip indicates the region where the field singularity is located, less than 3 cm wide,with a measured intensity of −82 dBm. The actual position of the singularity wasconfirmed by the phase change measured by the two-antenna interferometer (seetext). The scale is in centimetres.
into the far zone, in principle all the way to infinity [3]. In this way, we also proved thatthe topological properties of the twisted waves, namely the presence of the intensity (linearmomentum) singularity and the spatial phase signature, are preserved in the far zone.
The intensity distribution of the radio vortex was mapped out 40 m (320λ) distant from thetransmitting antenna. The HPBW diameter of the twisted parabolic antenna at 40 m distance isof the order of 6 m. The radio noise background measured in a 15 MHz bandwidth centred onthe carrier frequency ν = 2.414 GHz was −90 dBm. The polarization of the signal was linearand kept fixed horizontally. For safety reasons a calibrated 10 dB signal attenuator was insertedat the output of the transmission line.
As shown in figure 1, the region where the radio signal intensity, i.e. the received linearmomentum, was undetectable had a diameter of 21 cm (∼1.7λ) and we determined the positionof the field singularity with an inaccuracy of 3 cm (∼0.24λ). The experimental limitations weredictated by the resolving power of the spectrum analyser used for sampling the electric field.The average intensity measured in the 3 cm region around the singularity was −82 dBm.
That the minimum found was the phase singularity of the field was confirmed by measuringthe phase distribution around it with a phase interferometer constructed from two identicalYagi–Uda antennae deployed along a baseline perpendicular to the direction of the transmitters.First we positioned the centre of the interferometer’s baseline where the minimum of the fieldwas measured and then we mechanically tilted the transmitting antenna in the horizontal andvertical directions and measured the ensuing phase change. Finally, we verified the phase andfield intensity distribution of the Yagi–Uda antenna used for transmitting the untwisted signal.No appreciable phase twist in the Yagi–Uda beam was detected.
New Journal of Physics 14 (2012) 033001 (http://www.njp.org/)
5
4. Radio transmission with orbital angular momentum
The purpose of the second stage of the experiment was to transmit, using the same set ofantennae, on the same frequency of 2.414 GHz, and within a fixed given bandwidth, twomutually orthogonal OAM modes at a distance of 442 m (3536λ) from the phase-detectinginterferometer. After having verified that the phase properties of the twisted beam werepreserved, by analysing the beam shape with an intensity/spectrum analyser, we transmittedthe two OAM modes from the lighthouse of San Giorgio Island in the direction of the balconyof Palazzo Ducale in Venice (Italy), where they were received. The HPBW diameter of theparabolic antenna at that distance was 67 m. During the experiment, we measured a maximumsignal power Pmax = 30.7 dBm, with a background noise of −87 dBm generated by externalradio sources. The noise background that we characterized with the help of a digital spectrumanalyser was dominantly caused by external sources (see table A.4 in the appendix).
At the phase singularity point we expected the intensity to drop almost to zero, as found inexperiments at optical frequencies. The narrow zone where the central singularity was located,defined by a 10 dB (i.e. tenfold) drop in the mean field intensity, had a diameter of about 2λ.This small region was contained inside a wider zone with a diameter of ∼190 cm (∼15λ)
where a 3–5 dB drop in the mean field intensity was observed. Outside this region, at distanceslarger than 2 m (∼16λ) from the singularity, the field intensity was found to be more stable andflatter. The measured signal intensity was only 3 dB lower than expected from a non-helicoidalparabolic antenna with the same diameter and focal length.
Due to propagation effects, the signal intensity near the singularity, where the electricfield tends to zero, exhibited a more uniform and flatter intensity profile than expected froma coherent beam with a Laguerre–Gaussian profile. The phase distribution of the entire antennalobe was preserved. This actually resembles the behaviour of incoherent beams carrying OAM.Such beams preserve the phase profile but the region of the lobe in which the singularity islocated appears much more filled by the signal because of the large width of the transmissionband and, in our case, probably also because of the shape of the transmitting antenna. The onlyinsignificant variable interference effects noted during the experiments were due to reflectionsof the beam from the water surface of the lagoon that varied with the tidal height of the sea.
By using an interferometric phase discrimination method we were able to separate the twoOAM modes by identifying their ‘phase fingerprints’ [10, 11, 21, 23, 24]. The receiving stationconsisted of a commercial off the shelf (COTS) frequency-modulation (FM) radio modulereceiver fed by two identical 16.5 dBi Yagi–Uda antennae (hereafter called antenna A andantenna B) connected together with 180◦-phase-shifted cables through a beam adder module, inorder to obtain a phase-difference interferometer. We decided to use such directive antennae tospatially reduce any possible background interference due to the presence of other WiFi sources.The antenna parameters are given in the appendix. Antenna A was mounted on a mechanicaltranslator oriented towards the direction of the transmitting station to select one of the twochannels by exploiting the spatial phase front properties of different OAM states present inthe two beams, whereas antenna B could be moved mechanically in the orthogonal horizontaldirection only.
The interferometer measured the phase difference between the two antennae, A and B, andtherefore characterized the spatial phase properties of the beams that are the fingerprints of thevorticity OAM states of the field. To discriminate between the two different spatial modes ofthe EM field, we aligned antenna A, antenna B and the field singularity along a line parallel
New Journal of Physics 14 (2012) 033001 (http://www.njp.org/)
6
to the horizon, and the singularity was positioned in the middle of the segment delimited byantennae A and B (see the scheme in the appendix, figure A.6). If the setup were perfectlyaligned, the twisted EM wave with ` = 1 would have produced an exact 180◦ azimuthal phasedifference between the two antennae, subsequently compensated for by the cable electric delay,thus producing an intensity maximum. The untwisted beam, with 0◦ azimuthal phase difference,would have produced an intensity minimum for the same settings.
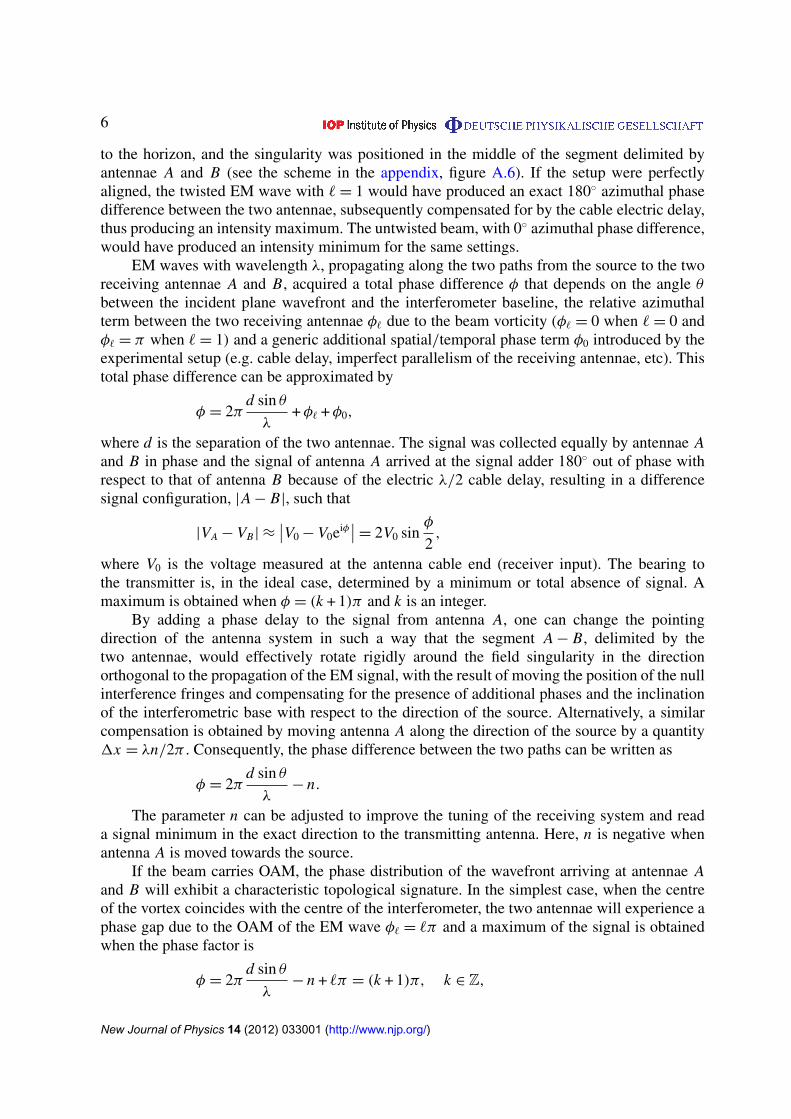
EM waves with wavelength λ, propagating along the two paths from the source to the tworeceiving antennae A and B, acquired a total phase difference φ that depends on the angle θ
between the incident plane wavefront and the interferometer baseline, the relative azimuthalterm between the two receiving antennae φ` due to the beam vorticity (φ` = 0 when ` = 0 andφ` = π when ` = 1) and a generic additional spatial/temporal phase term φ0 introduced by theexperimental setup (e.g. cable delay, imperfect parallelism of the receiving antennae, etc). Thistotal phase difference can be approximated by
φ = 2πd sin θ
λ+ φ` + φ0,
where d is the separation of the two antennae. The signal was collected equally by antennae Aand B in phase and the signal of antenna A arrived at the signal adder 180◦ out of phase withrespect to that of antenna B because of the electric λ/2 cable delay, resulting in a differencesignal configuration, |A − B|, such that
|VA − VB| ≈∣∣V0 − V0eiφ
∣∣ = 2V0 sinφ
2,
where V0 is the voltage measured at the antenna cable end (receiver input). The bearing tothe transmitter is, in the ideal case, determined by a minimum or total absence of signal. Amaximum is obtained when φ = (k + 1)π and k is an integer.
By adding a phase delay to the signal from antenna A, one can change the pointingdirection of the antenna system in such a way that the segment A − B, delimited by thetwo antennae, would effectively rotate rigidly around the field singularity in the directionorthogonal to the propagation of the EM signal, with the result of moving the position of the nullinterference fringes and compensating for the presence of additional phases and the inclinationof the interferometric base with respect to the direction of the source. Alternatively, a similarcompensation is obtained by moving antenna A along the direction of the source by a quantity1x = λn/2π . Consequently, the phase difference between the two paths can be written as
φ = 2πd sin θ
λ− n.
The parameter n can be adjusted to improve the tuning of the receiving system and reada signal minimum in the exact direction to the transmitting antenna. Here, n is negative whenantenna A is moved towards the source.
If the beam carries OAM, the phase distribution of the wavefront arriving at antennae Aand B will exhibit a characteristic topological signature. In the simplest case, when the centreof the vortex coincides with the centre of the interferometer, the two antennae will experience aphase gap due to the OAM of the EM wave φ` = `π and a maximum of the signal is obtainedwhen the phase factor is
φ = 2πd sin θ
λ− n + `π = (k + 1)π, k ∈ Z,
New Journal of Physics 14 (2012) 033001 (http://www.njp.org/)
7
where Z is the set of all integer numbers. When ` = 1, a maximum for the vortex is achievedwhen n = 0 and k = 0. Because of destructive interference the ` = 0 signal intensity will atthe same time experience a minimum. On the other hand, a maximum for the ` = 0 modewill be obtained when n = −λ/2, corresponding to a minimum for the vortex. Followingthese considerations, we aligned the interferometer so as to have the field singularity at themidpoint of the line joining the two receiving antennae (i.e. the interferometer baseline) andobtained a phase gap φ` = π between the two antennae expected during the reception of the` = 1 vortex. To better optimize the interference fringe structure we oriented the baseline by aninclination θ ∼ 10◦ with respect to the balcony in order to be orthogonal to the incoming beam.During the experiment, the main practical difficulty was that of positioning the singularity atthe midpoint between the two Yagi–Uda antennae: this problem was solved with the find-and-track direction method, also known as the ‘fox-hunting’ method [25], commonly used to locatea radio transmitter with high precision.
In order to have a simple, straightforward and practical method to discriminate betweenthe two orthogonal OAM channels, transmitted on the same carrier frequency, we frequencymodulated them with constant-level audio signals at different modulation frequencies (400 and1000 Hz for the untwisted and twisted waves, respectively) by injecting a −5 dBm monophonicaudio signal into the video band of each transmitter. The thus-modulated radio signals werereceived by the two Yagi–Uda antennae, summed by a 3 dB power splitter/combiner (Mini-Circuits ZX10-2-42+) and then demodulated in the FM receiver into monophonic audio signalsthat were subsequently digitally sampled, recorded and analysed in real time with 32-bitresolution. Each dataset so produced was 22 870 008 bytes long.
The total signal loss measured in the receiving line of the interferometer was 6 dB. In orderto reduce the power of the signal we inserted a calibrated 10 dB attenuator into the receiving line,so that the audio digitizer connected to the receiver output would not saturate due to overvoltage.In a conventional single-antenna receiver setup that detects linear momentum only, the two radiosignals were audible simultaneously. By mechanically moving the antenna A with respect to Bto select one of the two orthogonal OAM beams, one signal was alternately suppressed withrespect to the other due to the different spatial phase signature of the two OAM states. Weadjusted the baseline in order to optimize the discrimination of the two different OAM channelsby moving antenna A.
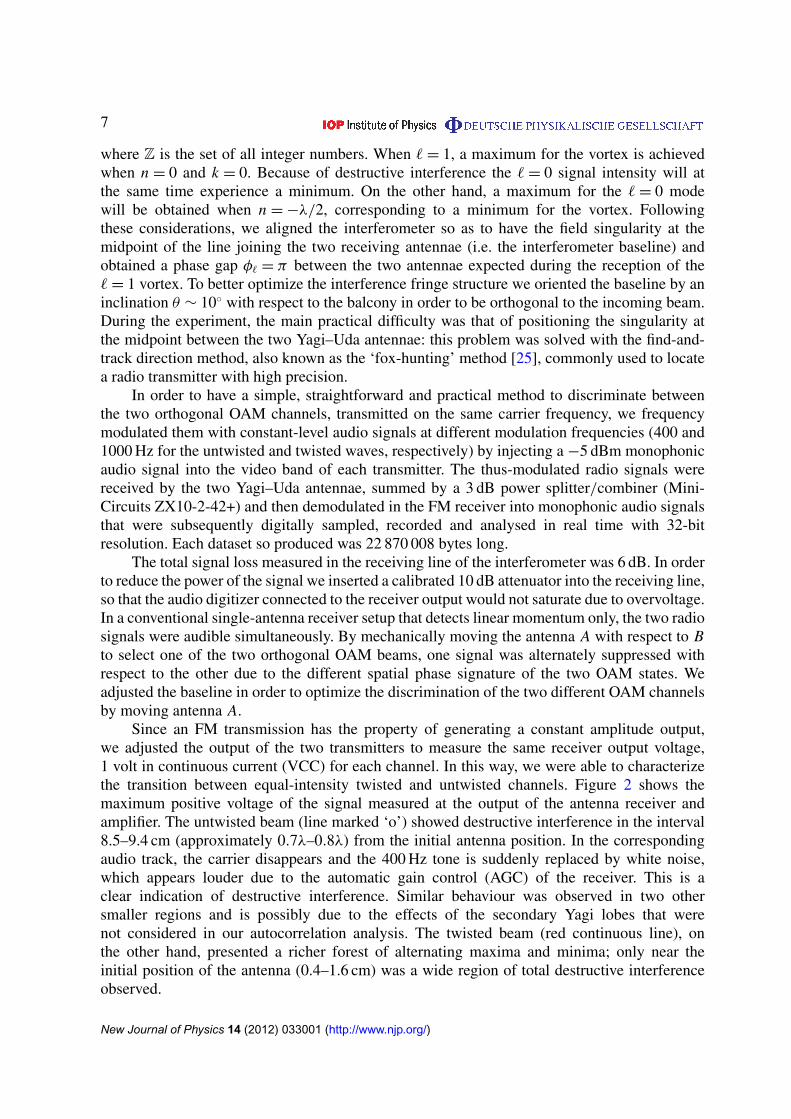
Since an FM transmission has the property of generating a constant amplitude output,we adjusted the output of the two transmitters to measure the same receiver output voltage,1 volt in continuous current (VCC) for each channel. In this way, we were able to characterizethe transition between equal-intensity twisted and untwisted channels. Figure 2 shows themaximum positive voltage of the signal measured at the output of the antenna receiver andamplifier. The untwisted beam (line marked ‘o’) showed destructive interference in the interval8.5–9.4 cm (approximately 0.7λ–0.8λ) from the initial antenna position. In the correspondingaudio track, the carrier disappears and the 400 Hz tone is suddenly replaced by white noise,which appears louder due to the automatic gain control (AGC) of the receiver. This is aclear indication of destructive interference. Similar behaviour was observed in two othersmaller regions and is possibly due to the effects of the secondary Yagi lobes that werenot considered in our autocorrelation analysis. The twisted beam (red continuous line), onthe other hand, presented a richer forest of alternating maxima and minima; only near theinitial position of the antenna (0.4–1.6 cm) was a wide region of total destructive interferenceobserved.
New Journal of Physics 14 (2012) 033001 (http://www.njp.org/)
8
Rec
eive
d si
gnal
pos
itve
volta
ge +
VC
C (V
olt)
Antenna Shift (cm)
Figure 2. Diagram of the monophonic audio recordings of the twisted/untwistedbeams. The output of the two transmitters was adjusted to ensure the samemaximum input voltage of 2 V when both channels were present, and 1 VCC maxfor each individual channel. The first minimum is found at about 1 cm of antennashift for the ` = 1 mode (continuous line). Here the ` = 0 channel (marked withthe symbol ‘o’) has a maximum and the associated audio tone is clearly audible.The same was found for the ` = 0 mode around the 9 cm antenna position. Theinner boundaries of the two minima regions are separated in distance by halfthe radio wavelength. Between these positions there was a forest of minimaof the ` = 1 mode, a phenomenon due to the sampling of the field from a finite-sized antenna. Beyond the minimum located at 9 cm, two additional alternatingsignal minima due to the cross-talk of the two Yagi–Uda antennae were found.
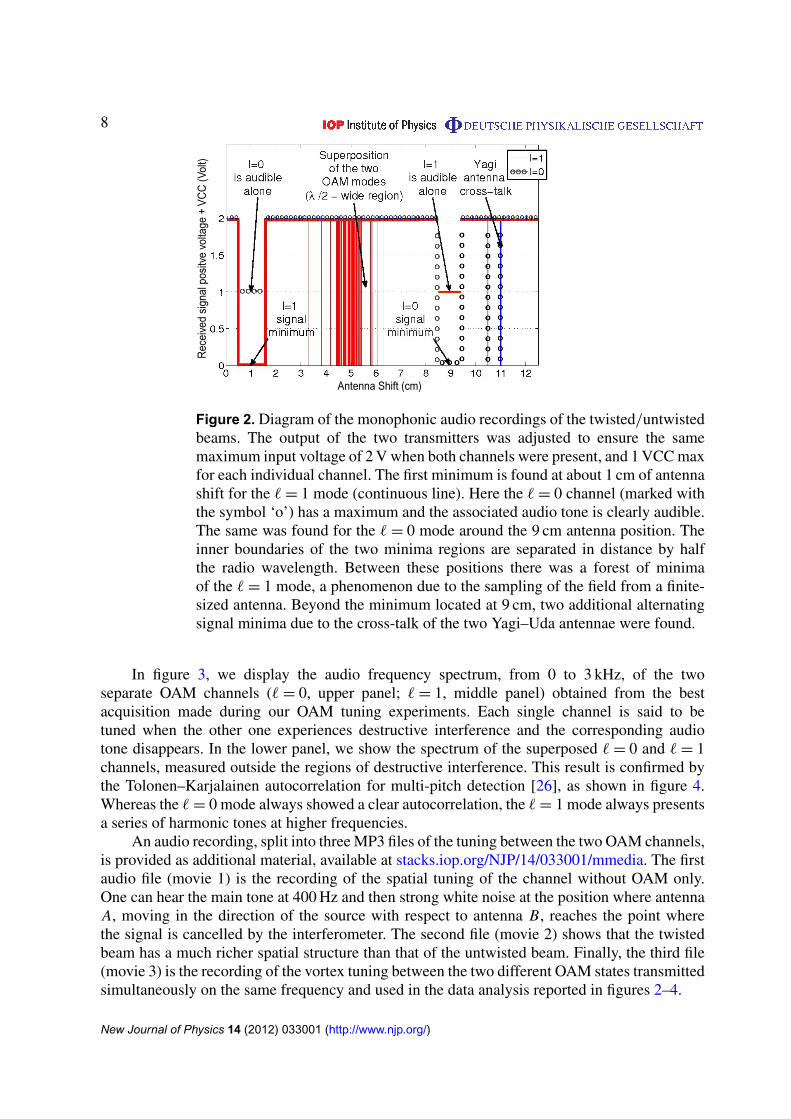
In figure 3, we display the audio frequency spectrum, from 0 to 3 kHz, of the twoseparate OAM channels (` = 0, upper panel; ` = 1, middle panel) obtained from the bestacquisition made during our OAM tuning experiments. Each single channel is said to betuned when the other one experiences destructive interference and the corresponding audiotone disappears. In the lower panel, we show the spectrum of the superposed ` = 0 and ` = 1channels, measured outside the regions of destructive interference. This result is confirmed bythe Tolonen–Karjalainen autocorrelation for multi-pitch detection [26], as shown in figure 4.Whereas the ` = 0 mode always showed a clear autocorrelation, the ` = 1 mode always presentsa series of harmonic tones at higher frequencies.
An audio recording, split into three MP3 files of the tuning between the two OAM channels,is provided as additional material, available at stacks.iop.org/NJP/14/033001/mmedia. The firstaudio file (movie 1) is the recording of the spatial tuning of the channel without OAM only.One can hear the main tone at 400 Hz and then strong white noise at the position where antennaA, moving in the direction of the source with respect to antenna B, reaches the point wherethe signal is cancelled by the interferometer. The second file (movie 2) shows that the twistedbeam has a much richer spatial structure than that of the untwisted beam. Finally, the third file(movie 3) is the recording of the vortex tuning between the two different OAM states transmittedsimultaneously on the same frequency and used in the data analysis reported in figures 2–4.
New Journal of Physics 14 (2012) 033001 (http://www.njp.org/)

9
Figure 3. Spectral analysis of the demodulated audio signal when the antennainterferometer was tuned by the spatial motion of one antenna to receive twoindependent and superposed OAM modes in the same frequency band. Thespectra are truncated at 3 kHz for better clarity. Upper panel: audio frequencyspectrum of the beam in the region where the interferometer is tuned for the ` = 0mode signal. Clearly visible is the main peak at 400 Hz followed by the higher-frequency harmonics. The power of the signal is distributed with decreasingpower at higher frequencies. Middle panel: audio spectrum in the position whereonly the ` = 1 mode audio signal is audible. Also in this case the power isdistributed with less power for higher-frequency harmonics of the 1 kHz mainfrequency. In both the two spectra there are no spurious frequencies introducedby the other twisted signal. Lower panel: audio spectrum of the signal where thetwo twisted beams are not separated. Both the audio frequencies are visible.
Already with this setup, one can obtain four physically distinct channels on the samefrequency by additionally introducing the use of polarization (SAM), which is independent ofOAM. A further five-fold multiplicative factor from implementing multiplexing would yield atotal of 20 channels on the same frequency. The utilization of multiport techniques (e.g. MIMO)could increase the capacity further.
5. Conclusions
Our experimental findings that EM OAM can be used for increasing radio transmissioncapacity without increasing bandwidth is likely to open up new perspectives on wirelesscommunications and radio-based science. History tells us that Marconi invented the wirelesstelegraph and from that the communication world spread its branches in all directions [1].All current radio communication services are based on various forms of phase, frequencyand/or amplitude modulation of the EM radiation in the form of EM linear momentum (i.e.integrated Poynting vector or energy flux). In order that many different broadcasting stationsare able to transmit simultaneously without overlapping their radio signals, Marconi suggested
New Journal of Physics 14 (2012) 033001 (http://www.njp.org/)
10
Figure 4. Autocorrelation spectral analysis of the audio transmission in threedifferent antenna positions. Upper panel: the ` = 0 mode (∼408 Hz) detectablewhen the antenna is at a position between 0.4 and 1.6 cm. Middle panel: the ` = 1(1 kHz), from 8.5 to 9.4 cm, with the exception of the two small intervals where across-talk of the two antennae was observed. In the lower panel, the superpositionof both the audio signals at 400 and 1 kHz is clearly evident, showing theimpossibility of separating the two channels when the moving antenna is in theinterval (1.8–8) cm.
that the total available spectrum of radio frequencies be divided into many non-overlappingfrequency subbands [23]. Now, the wide use of wireless communication has unavoidablyled to the saturation of all available frequency bands, even after the adoption of artificialtechniques that increase band capacity. We have experimentally shown that by using helicoidalparabolic antennae, the use of OAM states might dramatically increase the capacity of anyfrequency band, allowing the use of dense coding techniques in each of these new vortex radiochannels. This might represent a concrete proposal for a possible solution to the band saturationproblem.
Moreover, our experimental findings demonstrate that the spatial phase signature waspreserved even in the far-field region and for incoherent non-monochromatic wave beams.These results open up new perspectives not only for wireless communication but also forphysics and astronomy, including the possible detection of Kerr black holes in the test generalrelativity [21].
Acknowledgments
The authors acknowledge Carlo Giacomo Someda and Luca Palmieri for their collaborationand useful discussions, the logistic support of the Department of Engineering Information,University of Padova and CNR; ‘Vortici and Frequenze Group’, Tullio Cardona, RobertoDe Carli; Renata Codello and her staff and Venezia Marketing Eventi for logistic support
New Journal of Physics 14 (2012) 033001 (http://www.njp.org/)

11
Figure A.1. Public announcement of the reception and tuning of the twistedsignal ‘segnale ricevuto’ (signal received).
during the event ‘Onde sulle Onde’. We acknowledge ARI—Venice (Italian Radio Amateur)for their support, Fondazione Guglielmo Marconi, Princess Elettra Marconi and Dr IngGiuliano Berretta. BT acknowledges the University of Padova for support and hospitality. Theexperiment was partially funded by the University of Padova project ‘Study of orbital angularmomentum’.
Appendix
A.1. Waves on waves
‘Onde sulle Onde’, a public experiment. The final results of this experiment were publiclydemonstrated on 24 June 2011 on Piazza San Marco, Venice, in the presence of the internationalpress, experts, well-known personalities and the general public. In the style of GuglielmoMarconi, we realized this first public demonstration of radio vortices by also involving ordinarypeople in the experiment—a different way to communicate science. A light and sound show withprojections onto the facade of Palazzo Ducale explained to the audience what the experimenterswere doing. More than 2000 people attended the ‘live’ experiment at 21:30 local time andwhen the signal was tuned from vorticity zero to vorticity one at the same frequency andtransmitting simultaneously, a rifle shot was heard, in honour of the first radio transmission madeby Guglielmo Marconi in 1895. After this, on the facade of Palazzo Ducale the words ‘segnalericevuto’, which in Italian means ‘signal received’, were projected. Several video recordings ofthis event, made by spectators and radio amateurs, can be found on YouTube on the Internet(figure A.1).
A.2. Hardware
To demonstrate the feasibility of implementing multiple radio communication channels onthe same frequency, discriminated only by their OAM, we adopted a very basic hardware
New Journal of Physics 14 (2012) 033001 (http://www.njp.org/)
12
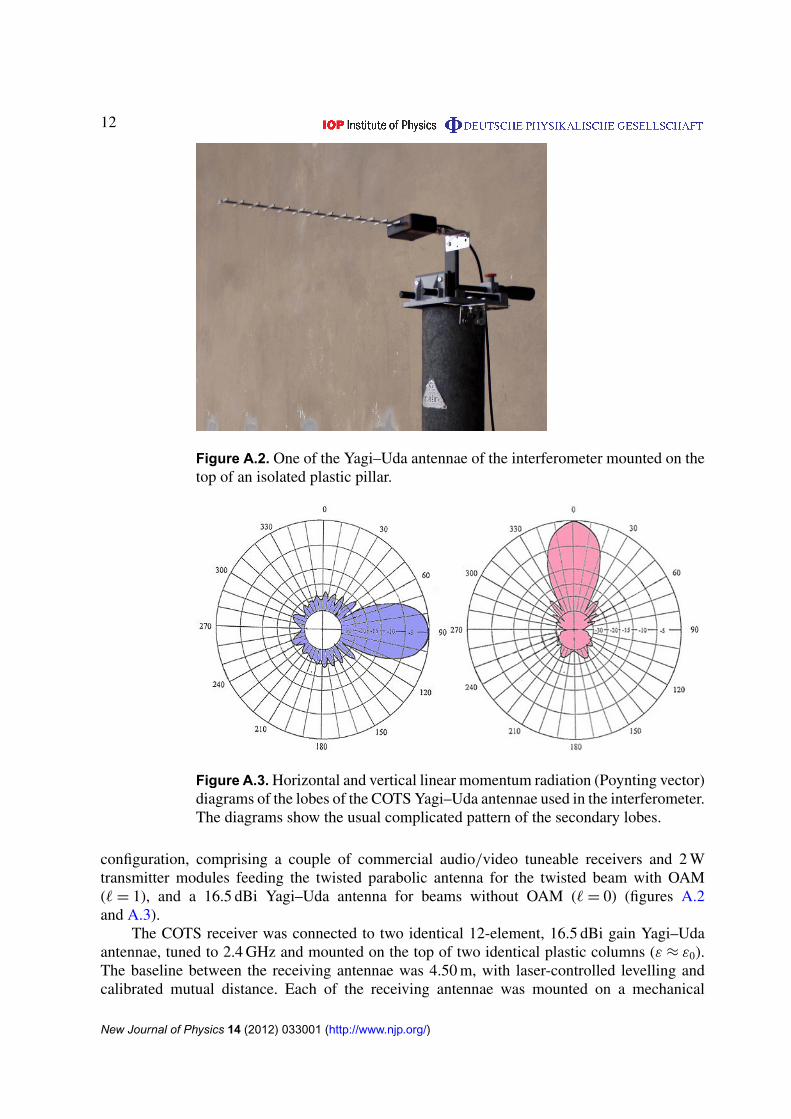
Figure A.2. One of the Yagi–Uda antennae of the interferometer mounted on thetop of an isolated plastic pillar.
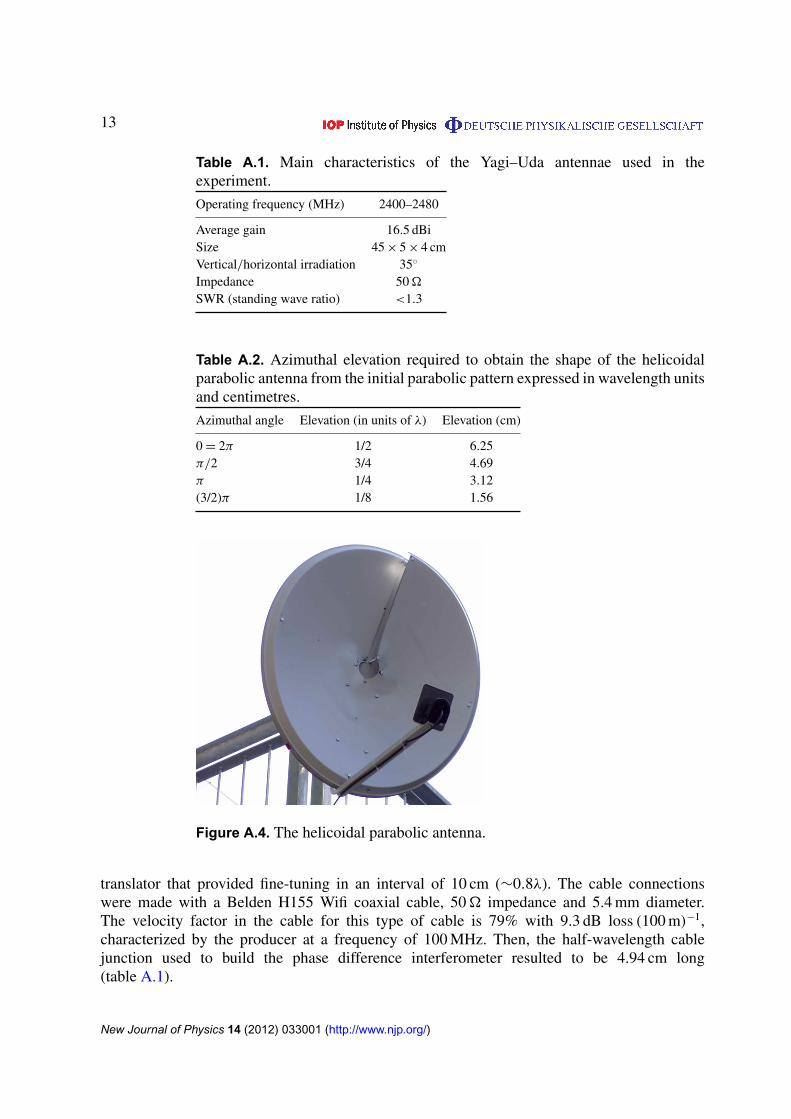
Figure A.3. Horizontal and vertical linear momentum radiation (Poynting vector)diagrams of the lobes of the COTS Yagi–Uda antennae used in the interferometer.The diagrams show the usual complicated pattern of the secondary lobes.
configuration, comprising a couple of commercial audio/video tuneable receivers and 2 Wtransmitter modules feeding the twisted parabolic antenna for the twisted beam with OAM(` = 1), and a 16.5 dBi Yagi–Uda antenna for beams without OAM (` = 0) (figures A.2and A.3).
The COTS receiver was connected to two identical 12-element, 16.5 dBi gain Yagi–Udaantennae, tuned to 2.4 GHz and mounted on the top of two identical plastic columns (ε ≈ ε0).The baseline between the receiving antennae was 4.50 m, with laser-controlled levelling andcalibrated mutual distance. Each of the receiving antennae was mounted on a mechanical
New Journal of Physics 14 (2012) 033001 (http://www.njp.org/)
13
Table A.1. Main characteristics of the Yagi–Uda antennae used in theexperiment.
Operating frequency (MHz) 2400–2480
Average gain 16.5 dBiSize 45 × 5 × 4 cmVertical/horizontal irradiation 35◦
Impedance 50 �
SWR (standing wave ratio) <1.3
Table A.2. Azimuthal elevation required to obtain the shape of the helicoidalparabolic antenna from the initial parabolic pattern expressed in wavelength unitsand centimetres.
Azimuthal angle Elevation (in units of λ) Elevation (cm)
0 = 2π 1/2 6.25π/2 3/4 4.69π 1/4 3.12(3/2)π 1/8 1.56
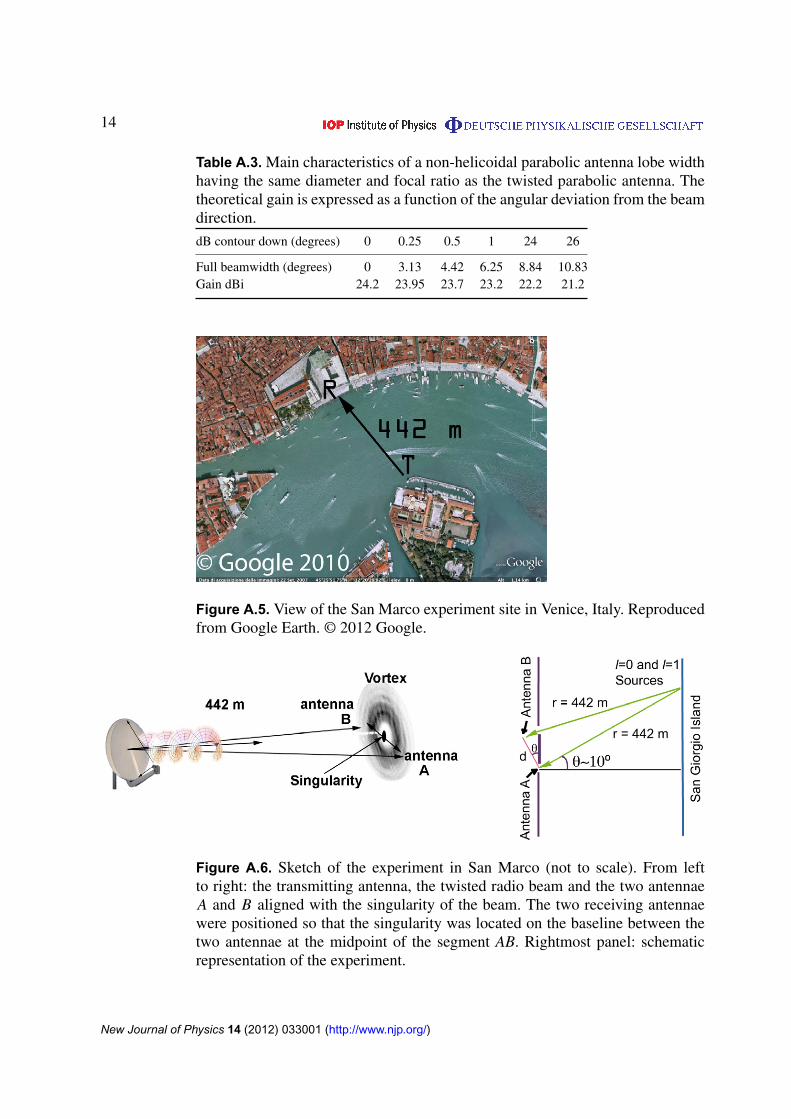
Figure A.4. The helicoidal parabolic antenna.
translator that provided fine-tuning in an interval of 10 cm (∼0.8λ). The cable connectionswere made with a Belden H155 Wifi coaxial cable, 50 � impedance and 5.4 mm diameter.The velocity factor in the cable for this type of cable is 79% with 9.3 dB loss (100 m)−1,characterized by the producer at a frequency of 100 MHz. Then, the half-wavelength cablejunction used to build the phase difference interferometer resulted to be 4.94 cm long(table A.1).
New Journal of Physics 14 (2012) 033001 (http://www.njp.org/)
14
Table A.3. Main characteristics of a non-helicoidal parabolic antenna lobe widthhaving the same diameter and focal ratio as the twisted parabolic antenna. Thetheoretical gain is expressed as a function of the angular deviation from the beamdirection.
dB contour down (degrees) 0 0.25 0.5 1 24 26
Full beamwidth (degrees) 0 3.13 4.42 6.25 8.84 10.83Gain dBi 24.2 23.95 23.7 23.2 22.2 21.2
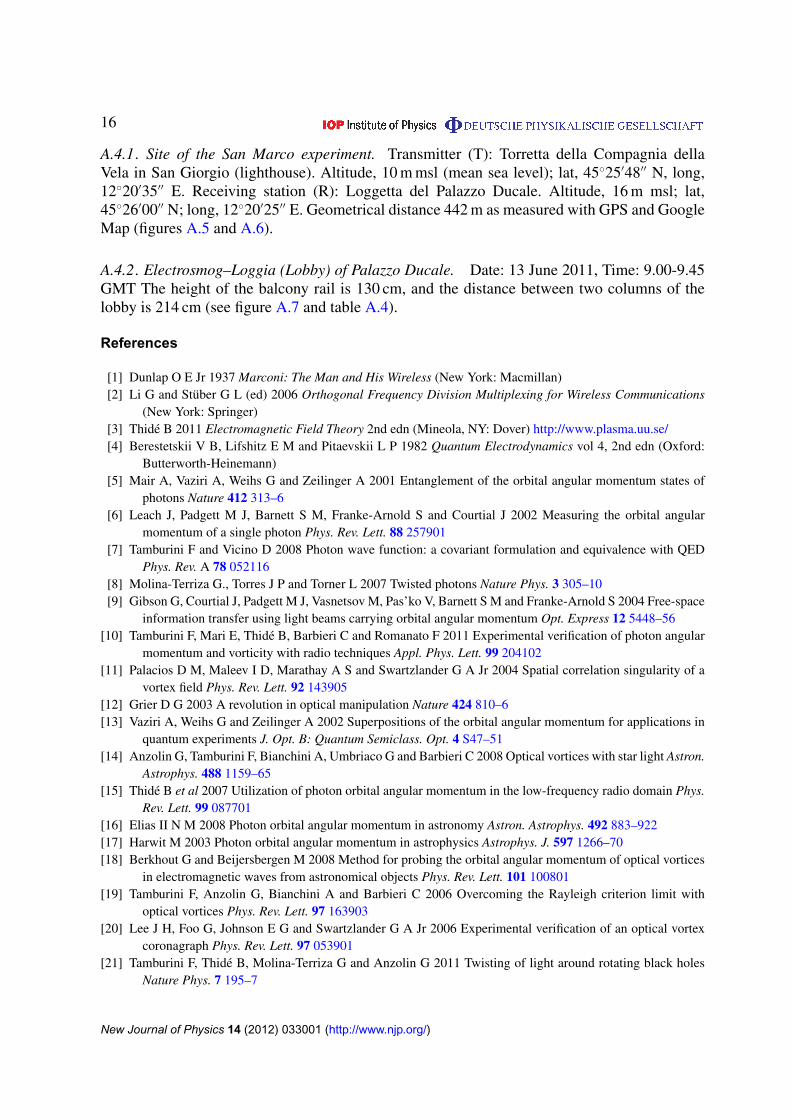
Figure A.5. View of the San Marco experiment site in Venice, Italy. Reproducedfrom Google Earth. © 2012 Google.
Figure A.6. Sketch of the experiment in San Marco (not to scale). From leftto right: the transmitting antenna, the twisted radio beam and the two antennaeA and B aligned with the singularity of the beam. The two receiving antennaewere positioned so that the singularity was located on the baseline between thetwo antennae at the midpoint of the segment AB. Rightmost panel: schematicrepresentation of the experiment.
New Journal of Physics 14 (2012) 033001 (http://www.njp.org/)

15
Figure A.7. Lobby of Palazzo Ducale, 50 m long: location of the receivingstation.
Table A.4. The electrosmog background measured in the lobby of PalazzoDucale (vertical and horizontal linear polarizations).
Loggia 1 Max (dBm) Avg (dBm)
2.414 GHz Vpol −87.5 −882.414 GHz Hpol −89 −89
Loggia 13 Max (dBm) Avg (dBm)2.414 GHz Vpol −87.9 −892.414 GHz Hpol −88 −89
Loggia 25 Max (dBm) Avg (dBm)2.414 GHz Vpol −86 −872.414 GHz Hpol −88 −88
A.3. Transmitter/receiver modules
The audio and radio signals used in the calibration and with the actual radio transmission weregenerated with commercial high-quality super-heterodyne FM transmitting modules. The outputimpedance was 75 �. The deviation in frequency relative to the carrier frequency (2.414 GHz)due to the FM modulation (15 MHz) can be considered negligible and not to cause significantdistortion of the vortex or a consequent change of the topological charge generated by thetwisted parabolic antenna.
A.4. Offset helicoidal parabolic antenna
From a pair of identical, 15◦ offset, 80 cm diameter steel parabolic antennae, the dish wastransformed into a vortex reflector by elevating, from the original shape, the surface of thequantities reported in the table for given values of the azimuthal angle. (see figures A.4 andtables A.2 and A.3).
New Journal of Physics 14 (2012) 033001 (http://www.njp.org/)
16
A.4.1. Site of the San Marco experiment. Transmitter (T): Torretta della Compagnia dellaVela in San Giorgio (lighthouse). Altitude, 10 m msl (mean sea level); lat, 45◦25′48′′ N, long,12◦20′35′′ E. Receiving station (R): Loggetta del Palazzo Ducale. Altitude, 16 m msl; lat,45◦26′00′′ N; long, 12◦20′25′′ E. Geometrical distance 442 m as measured with GPS and GoogleMap (figures A.5 and A.6).
A.4.2. Electrosmog–Loggia (Lobby) of Palazzo Ducale. Date: 13 June 2011, Time: 9.00-9.45GMT The height of the balcony rail is 130 cm, and the distance between two columns of thelobby is 214 cm (see figure A.7 and table A.4).
References
[1] Dunlap O E Jr 1937 Marconi: The Man and His Wireless (New York: Macmillan)[2] Li G and Stuber G L (ed) 2006 Orthogonal Frequency Division Multiplexing for Wireless Communications
(New York: Springer)[3] Thide B 2011 Electromagnetic Field Theory 2nd edn (Mineola, NY: Dover) http://www.plasma.uu.se/[4] Berestetskii V B, Lifshitz E M and Pitaevskii L P 1982 Quantum Electrodynamics vol 4, 2nd edn (Oxford:
Butterworth-Heinemann)[5] Mair A, Vaziri A, Weihs G and Zeilinger A 2001 Entanglement of the orbital angular momentum states of
photons Nature 412 313–6[6] Leach J, Padgett M J, Barnett S M, Franke-Arnold S and Courtial J 2002 Measuring the orbital angular
momentum of a single photon Phys. Rev. Lett. 88 257901[7] Tamburini F and Vicino D 2008 Photon wave function: a covariant formulation and equivalence with QED
Phys. Rev. A 78 052116[8] Molina-Terriza G., Torres J P and Torner L 2007 Twisted photons Nature Phys. 3 305–10[9] Gibson G, Courtial J, Padgett M J, Vasnetsov M, Pas’ko V, Barnett S M and Franke-Arnold S 2004 Free-space
information transfer using light beams carrying orbital angular momentum Opt. Express 12 5448–56[10] Tamburini F, Mari E, Thide B, Barbieri C and Romanato F 2011 Experimental verification of photon angular
momentum and vorticity with radio techniques Appl. Phys. Lett. 99 204102[11] Palacios D M, Maleev I D, Marathay A S and Swartzlander G A Jr 2004 Spatial correlation singularity of a
vortex field Phys. Rev. Lett. 92 143905[12] Grier D G 2003 A revolution in optical manipulation Nature 424 810–6[13] Vaziri A, Weihs G and Zeilinger A 2002 Superpositions of the orbital angular momentum for applications in
quantum experiments J. Opt. B: Quantum Semiclass. Opt. 4 S47–51[14] Anzolin G, Tamburini F, Bianchini A, Umbriaco G and Barbieri C 2008 Optical vortices with star light Astron.
Astrophys. 488 1159–65[15] Thide B et al 2007 Utilization of photon orbital angular momentum in the low-frequency radio domain Phys.
Rev. Lett. 99 087701[16] Elias II N M 2008 Photon orbital angular momentum in astronomy Astron. Astrophys. 492 883–922[17] Harwit M 2003 Photon orbital angular momentum in astrophysics Astrophys. J. 597 1266–70[18] Berkhout G and Beijersbergen M 2008 Method for probing the orbital angular momentum of optical vortices
in electromagnetic waves from astronomical objects Phys. Rev. Lett. 101 100801[19] Tamburini F, Anzolin G, Bianchini A and Barbieri C 2006 Overcoming the Rayleigh criterion limit with
optical vortices Phys. Rev. Lett. 97 163903[20] Lee J H, Foo G, Johnson E G and Swartzlander G A Jr 2006 Experimental verification of an optical vortex
coronagraph Phys. Rev. Lett. 97 053901[21] Tamburini F, Thide B, Molina-Terriza G and Anzolin G 2011 Twisting of light around rotating black holes
Nature Phys. 7 195–7
New Journal of Physics 14 (2012) 033001 (http://www.njp.org/)
17
[22] Uda S 1927 High angle radiation of short electric waves Proc. IRE 15 377–385Yagi H 1928 Beam transmission of ultra-shortwaves Proc. IRE 16 715–40Uda S 1930 Radiotelegraphy and radiotelephony on half-meter waves Proc. IRE 18 1047–63
[23] Marconi G 1941 Scritti di Guglielmo Marconi (Rome: Reale Accademia d’Italia) http://www.liberliber.it/biblioteca/m/marconi/scritti/pdf/marconi scritti.pdf
[24] Torner L, Torres J and Carrasco S 2005 Digital spiral imaging Opt. Express 13 873–81[25] Chang K 2000 RF and Microwave Wireless Systems (New York: Wiley)[26] Tolonen T and Karjalainen M 2000 A computationally efficient multipitch analysis model IEEE Trans. Speech
Audio Process. 8 708–16
New Journal of Physics 14 (2012) 033001 (http://www.njp.org/)


![Robust Frequency-Hopping System for Channels with ...community.wvu.edu/~mcvalenti/documents/51presentation.pdf · with Interference and Frequency-Selective Fading ... [h(x|y)] where](https://img.pdfslide.us/doc/110x75/5ac125b97f8b9ad73f8c979b/robust-frequency-hopping-system-for-channels-with-mcvalentidocuments51presentationpdfwith.jpg)