Embed Size (px)
Citation preview

City University of New York (CUNY) City University of New York (CUNY)
CUNY Academic Works CUNY Academic Works
Dissertations, Theses, and Capstone Projects CUNY Graduate Center
2-2021
Encoding and Perception of Voicing and Aspiration in Native and Encoding and Perception of Voicing and Aspiration in Native and
Non-Native Listeners in Quiet and in Background Noise Non-Native Listeners in Quiet and in Background Noise
Reethee Antony Graduate Center, City University of New York
How does access to this work benefit you? Let us know!
More information about this work at: https://academicworks.cuny.edu/gc_etds/4166
Discover additional works at: https://academicworks.cuny.edu
This work is made publicly available by the City University of New York (CUNY). Contact: [email protected]

ENCODING AND PERCEPTION OF VOICING AND ASPIRATION IN NATIVE
AND NON-NATIVE LISTENERS IN QUIET AND IN BACKGROUND NOISE
by
REETHEE MADONA ANTONY
A dissertation submitted to the Graduate Faculty in Speech-Language-Hearing Sciences in
partial fulfillment of the requirements for the degree of Doctor of Philosophy,
The City University of New York
2021

ii
© 2021
REETHEE MADONA ANTONY
All Rights Reserved

iii
Encoding and Perception of Voicing and Aspiration in Native and Non-native Listeners in Quiet
and in Background Noise
by
Reethee Madona Antony
This manuscript has been read and accepted for the Graduate Faculty in
Speech-Language-Hearing Sciences in satisfaction of the dissertation
requirement for the degree of Doctor of Philosophy.
Date Brett A. Martin, PhD
Chair of Examining Committee
Date Mira Goral, PhD
Executive Officer
Supervisory Committee:
Valerie L. Shafer, PhD
Susan Behrens, PhD
THE CITY UNIVERSITY OF NEW YORK

iv
ABSTRACT
Encoding and Perception of Voicing and Aspiration in Native and
Non-Native Listeners in Quiet and in Background Noise
by
Reethee Madona Antony
Advisor: Dr. Brett A. Martin
The perception and encoding of voice cues in consonants have been well studied,
whereas there has been relatively little research on aspiration. The current study examined the
encoding and perception of aspiration and voicing in Hindi, American English, and Tamil
listeners when relevant cues were and were not degraded by noise. This study is novel because of
the inclusion of aspiration, the language groups, inclusion of noise masking, and inclusion of
auditory evoked potentials (in addition to behavioral testing).
The first aim was to determine whether language groups for whom aspiration and/or
voicing is phonemically contrastive show better perception and differences in encoding these
features in noise relative to those who do not use these features contrastively. The second aim
was to determine how the speech perception and encoding of English aspiration and voicing was
similar to or different from the responses to Hindi aspiration and voicing based on linguistic
background, in quiet and in noise.
Sixteen participants between 20-45 years of age were included in each language group.
Natural digitized speech sounds were used for the study. Allophonic variation and acoustic-
phonetic representations are represented using ‘[ ]’, whereas phonemic representation is

v
indicated using ‘/ /’. Therefore, stimuli were Hindi /ba/ [ba], /pa/ [pa], and /pha/ [pha] and
American English /ba/ [pa], and /pa/ [pha]. These stimuli differed in voice-onset time (VOT)
and aspiration. The speech sounds were presented randomly at 70 dB SPL using insert earphones
in quiet, and in background noise at signal-to-noise ratio of 0. Each stimulus was presented in
consonant-vowel (CV) and vowel only (V-only) contexts.
Behavioral testing included two-speech identification tests (one of these tests encouraged
phonemic-level processing and the other encouraged phonetic-level processing), and a speech
discrimination task. The analyses for the behavioral data included categorization responses (in
percent), A’ scores, goodness ratings, and reaction times. Auditory evoked potential (AEP)
recording to the speech sounds was done using a NeuroScan system and 32-channel cap.
Averaged AEP waveforms to the different stimuli and condition for each participant were
computed. AEP components of interest included P1, N1, P2, and N2 measured at the central
electrode site (FCz) and Na, Ta, Tb, and P350 measured at temporal lateral electrode sites (T7
and T8). The peak amplitudes and latencies were measured for each participant, stimulus, and
condition. Means and standard deviations were computed across language groups as a function
of stimulus and condition.
The behavioral and the AEP responses were analyzed using descriptive statistics and
parametric statistical tests, including mixed model analyses of variance. The native listeners had
significantly higher percent correct categorization scores on the identification tasks and higher
percent correct discrimination scores, relative to non-native listeners. Further, the percent correct
scores were significantly higher, and the reaction times were shorter in quiet relative to in noise.
As predicted, for perceptual assimilation, the American English listeners assimilated the Hindi
/pha/ [pha] as English /pa/ [pha] and Hindi /pa/ [pa] as English /ba/ [pa]. The Hindi listeners

vi
categorized the American English /pa/ [pha] as Hindi /pha/ [pha] and English /ba/ [pa] as Hindi
/pa/ [pa]. The Tamil participants categorized all five stimuli including the Hindi /ba/ [ba], /pa/
[pa], and /pha/ [pha] and American English stimuli /ba/ [pa] and /pa/ [pha] as Tamil /pa/ [pa].
The general pattern of AEP results was consistent with the behavioral findings. A
significant effect of group was present for the P1, P2, and N2 peaks. A significant interaction of
group x condition x stimulus was present, with larger P1 peak amplitudes in Hindi participants in
quiet at FCz, specifically for Hindi /pha/ [pha], relative to other language groups and stimuli.
Significant interactions of group x laterality were present for the American English stimuli with
larger amplitudes in listeners to native-language speech stimuli at T7. The AEP responses were
significantly larger in amplitude and shorter in latency in quiet relative to in noise, as predicted.
Further, Na peak amplitudes were larger at T8 in noise. The AEP latencies were significantly
longer for aspirated speech sounds and shorter for Hindi /ba/ [ba] and English /ba/ [pa].
Significant group differences were present for the AEPs at both the central electrode site
and temporal-lateral electrode sites. Morphology of the waveforms were similar across language
groups, irrespective of whether a speech sound was present in their language or not. The above
finding suggests that non-native speech sounds are encoded acoustic-phonetically. Further,
although a perceptual advantage was obtained in native listeners while processing speech in
noise in the behavioral tasks, the AEP findings indicate that all the language groups showed
similar encoding in noise. This finding also sheds some light on the level of processing indexed
by the AEPs and reveals that it differs from that of perception. The results provide neural
evidence for how language experience modulates speech encoding and contribute toward a better
understanding of cross-linguistic speech processing in noise.

vii
Acknowledgments
“Thank you” is too small a word for Brett, my advisor and my mentor. Thank you for this
opportunity and thank you for the blessing of knowing you. I couldn’t have asked for a better
mentor than you. You knew when to push my boundaries and you came at the right moments
when I needed your help. You stood for me, with me through thick and through thin and gave me
the freedom to grow both in academia and as a person.
I would like to thank Gary and Glenis for their consistent support when I was designing my
study. Gary, thank you for helping me record my stimuli a number of times over a period of two
years. Glenis, my behavioral section is solid because of your inputs in the research design. Thank
you for your passion and for being an inspiration! Val and Sue, thank you for your inputs and
comments with my dissertation. Val, I enjoyed learning IGOR, ICA, and A’ analysis from you!
It is amazing how you dedicate time to teach us. Sue, thank you for your constructive feedback
and for your promptness! Thank you for being there for me always!
Thanks to Yan, the external examiner for reviewing this manuscript. Thanks to my native
Hindi speaker and my native English speaker for helping me record the stimuli. Thanks to all my
participants for making this project happen! Thanks to all the staff in the Facilities department
(especially Nina) and to all the Security personnel (especially Joseph, Fernando, and Holland)
for keeping the Graduate Center clean and safe for my participants and for us. Special thanks to
Mahendran, Sandhya, and Vijay for helping me find my Tamil participants. I am ever grateful
for your thoughtfulness and your friendship. Thanks to my friends in India, all the members in
Audiology and Auditory Evoked Potential Laboratory and in the program for your consistent
support. Thanks to Venicia, Sr. Claire, Lakshmi, Klara, Mira, Patricia, Charmain, Doug, Vivian,
Curtis, Nancy, Ann, Glen, Proxy attai, Chithi, Nainas, Aachis, and Tatas for your consistent
support across years. Special thanks to Ms. Anamma, Ms. Shantha, Ms. Shanthi, Ms. Cinthia, Sr.
Fatima, Sr. Jennifer, Ms. Shymala, Sr. Colleen, Sr. Marian, Ms. Judy, Sr. Leela, Lekha, Roopa
Ma’am, Prakash Sir, Matthew Sir, Ganapathy Sir, Krupa, Deepak, Baga, Dhanya, Gunjan,
Ramya, LeeJung, Hyungi, Marta, and Cindy for making learning fun!
I would not have completed this dissertation without my family. Thanks to my entire family
including my dad, my in-laws, my husband, and my two little boys who spent many days
including weekends in the lab. Guna Amma, I could focus on my day at work only because you
took good care of my little boys at home. Appa, thank you for building literacy skills in me.
Thanks to my mom, Eva Amma, who emphasized that education is the only means of
empowerment in women. I love you and I miss you. Tambi, thanks for your consistent support
da. Love you! Randy, thank you for your consistent support when needed and for letting me be
me.
Chlm, I owe my life to you. My lord and my God, I owe my soul to you.

viii
Dedication
To my uncle for giving me the gift of education.
Namaskaaram.

ix
Table of Contents
Abstract ............................................................................................................................................... iv
Acknowledgements ............................................................................................................................ vii
Dedication ......................................................................................................................................... viii
List of Tables ...................................................................................................................................... xi
List of Figures ................................................................................................................................... xiv
Preface............................................................................................................................................. xviii
CHAPTER 1: Introduction ................................................................................................................. 1
1.1 Theoretical background related to cross linguistic processing of speech in noise ................... 7
1.2 Review of related behavioral research .................................................................................... 11
1.3 Review of related auditory evoked potential (AEP) research ................................................. 19
1.4 Aims of the study .................................................................................................................... 26
1.5 Hypotheses .............................................................................................................................. 26
1.6 Significance & implications .................................................................................................... 30
CHAPTER 2: Method ........................................................................................................................ 31
2.1 Participants .............................................................................................................................. 32
2.2 Stimuli ..................................................................................................................................... 34
2.3 Procedure ................................................................................................................................ 41
CHAPTER 3: Results ........................................................................................................................ 56
3.1 Identification task A: Write the perceived sound ................................................................... 58
3.2 Identification task B: Button press performance .................................................................... 72
3.3 Discrimination task ................................................................................................................. 79
3.4 Summary of behavioral study results ...................................................................................... 85

x
3.5 Mean global field power: Morphology and how peaks correspond to the stimuli ................. 89
3.6 Peak amplitudes in mean global field power .......................................................................... 99
3.7 Peak amplitudes and peak latencies at central electrode site: FCz ....................................... 111
3.8 Peak amplitudes at lateral electrode sites: T7 and T8 ........................................................... 142
CHAPTER 4: Discussion ................................................................................................................. 169
4.1 Behavioral speech perception ............................................................................................... 170
4.2 Neurophysiologic processing of speech sounds: Central and lateral sites ............................ 175
4.3 Relevance of findings in this study to theoretical models .................................................... 183
4.4 Limitations of the study and scope for future research ......................................................... 187
4.5 Implications.......................................................................................................................... 188
CHAPTER 5: Summary and Conclusions ....................................................................................... 191
Appendices ....................................................................................................................................... 193
References ........................................................................................................................................ 206

xi
List of Tables
Table 1. Linguistic profile of Hindi participants ............................................................................ 33
Table 2. Linguistic profile of English participants ......................................................................... 33
Table 3. Linguistic profile of Tamil participants ............................................................................ 34
Table 4. Characteristics of the three Hindi stimuli ......................................................................... 36
Table 5. Characteristics of the two English stimuli ........................................................................ 37
Table 6. Sample of permutations that were used for the discrimination test AXB design ............. 49
Table 7. List of AEP components that were present across stimuli and condition including the
additional peaks .............................................................................................................................. 53
Table 8. Labeling matrices of Hindi participants............................................................................ 66
Table 9. Labeling matrices of American English participants ........................................................ 68
Table 10. Labeling matrices of Tamil participants ......................................................................... 69
Table 11. Summary of behavioral findings: Main effects .............................................................. 86
Table 12. Summary of behavioral findings: Interaction effects ..................................................... 87
Table 13. Summary of the significant main effects in MGFP waveforms across AEP
components P1, N1, P2, and N2 in Hindi and in American English stimuli in both CV and
subtracted (CV-V) responses ........................................................................................................ 109
Table 14. Summary of the significant interactions in MGFP waveforms across AEP components
P1, N1, P2, and N2 in Hindi and in American English stimuli in both CV and subtracted (CV-
V) responses .................................................................................................................................. 110
Table 15. Summary of the significant main effects for peak amplitude measures at FCz across
AEP components in Hindi and in American English stimuli for both CV and subtracted (CV-V)
responses ....................................................................................................................................... 138
Table 16. Summary of the significant interactions for peak amplitude measures at FCz across

xii
AEP components in Hindi and in American English stimuli for both CV and subtracted (CV-V)
responses ....................................................................................................................................... 139
Table 17. Summary of the significant main effects for peak latencies at FCz across AEP
components in Hindi and in American English stimuli for both CV and subtracted (CV-V)
responses ....................................................................................................................................... 140
Table 18. Summary of the significant interactions for peak latencies at FCz across AEP
components in Hindi and in American English stimuli for both CV and subtracted (CV-V)
responses ....................................................................................................................................... 141
Table 19. Summary the significant main effects for the peak amplitudes at T7/T8 across AEP
components in Hindi and in American English stimuli for both CV and subtracted (CV-V)
responses ....................................................................................................................................... 167
Table 20. Summary the significant interactions for the peak amplitudes at T7/T8 across AEP
components in Hindi and in American English stimuli for both CV and subtracted (CV-V)
responses ....................................................................................................................................... 168
Table 21. Detailed linguistic profile of Hindi participants ........................................................... 193
Table 22. Detailed linguistic profile of American English participants ....................................... 194
Table 23. Detailed linguistic profile of Tamil participants ........................................................... 195
Table 24. Mixed model ANOVA results of peak amplitudes in CV and CV-V waveforms for
Hindi stimuli at FCz ...................................................................................................................... 196
Table 25. Mixed model ANOVA results of peak latencies in CV and CV-V waveforms for
Hindi stimuli at FCz ...................................................................................................................... 197
Table 26. Mixed model ANOVA results of peak amplitudes in CV and CV-V waveforms for
American English stimuli at FCz .................................................................................................. 198
Table 27. Mixed model ANOVA results of peak latencies in CV and CV-V waveforms for
American English stimuli at FCz .................................................................................................. 199
Table 28. Mixed model ANOVA results of peak amplitudes in CV and CV-V waveforms for
Hindi stimuli at GFP ..................................................................................................................... 200
Table 29. Mixed model ANOVA results of peak amplitudes in CV and CV-V waveforms for

xiii
American English stimuli at GFP ................................................................................................. 201
Table 30. Mixed model ANOVA results of peak amplitudes in CV and CV-V waveforms for
Hindi stimuli at T7/T8 .................................................................................................................. 202
Table 31. Mixed model ANOVA results of peak amplitudes in CV and CV-V waveforms for
American English stimuli at T7/T8............................................................................................... 204

xiv
List of Figures
Figure 1. Waveforms and spectrograms of the three Hindi stimuli ................................................ 37
Figure 2. Waveforms and spectrograms of the two English stimuli ............................................... 39
Figure 3. Percent categorization scores and standard errors in response to the Hindi and
American English stimuli across language groups in both quiet (Q) and noise (N). Participants
wrote the sound heard orthographically in their native language. .................................................. 58
Figure 4. A’ scores and standard errors in response to the Hindi and American English stimuli
across language groups in both quiet (Q) and noise (N). Participants wrote the sound heard
orthographically in their native language ....................................................................................... 61
Figure 5. Goodness ratings on 7-point rating scale and standard errors in response to the Hindi
and American English stimuli across the three language groups in both quiet and noise .............. 71
Figure 6. Percent categorization scores across the three language groups in response to both
Hindi and English stimuli in quiet (Q) and in noise (N) ................................................................. 73
Figure 7. Detailed analysis of percent categorization scores across the three language groups (H,
AE, T) in response to Hindi stimuli in quiet and in noise.............................................................. 76
Figure 8. Detailed analysis of percent categorization scores across the three language groups (H,
AE, T) in response to American English stimuli in quiet and in noise ........................................... 76
Figure 9. Mean reaction times across the three language groups in response to both Hindi and
English stimuli in quiet (Q) and in noise (N) .................................................................................. 77
Figure 10. Mean correct discrimination scores across language groups for both Hindi (H-VOIC:
Hindi voicing contrast, H-ASP: Hindi aspiration contrast, H-VOIC&ASP: Hindi voicing and
aspiration contrast) and English stimuli (AE-VOIC: American English stimuli voicing contrast)
in quiet (Q) and in noise (N) ........................................................................................................... 80
Figure 11. Mean reaction times in AXB paradigm for the three language groups in response to
both Hindi (H-VOIC: Hindi voicing contrast, H-ASP: Hindi aspiration contrast, H-VOIC&ASP:
Hindi voicing and aspiration contrast) and English stimuli (AE-VOIC: American English
stimuli voicing contrast) in quiet (Q) and in noise (N) ................................................................... 83
Figure 12. MGFP waveforms across language groups in quiet to Hindi stimuli ............................ 90

xv
Figure 13. MGFP waveforms across language groups in quiet to American English stimuli ........ 91
Figure 14. MGFP waveforms across language groups in noise to Hindi stimuli ........................... 92
Figure 15. MGFP waveforms across language groups in noise to American English stimuli ....... 93
Figure 16. Waveforms obtained in response to Hindi /ba/ in quiet and in noise (top panel) along
with the MGFP waveforms (bottom panel) in native Hindi participants........................................ 94
Figure 17. Waveforms obtained in response to Hindi /pa/ in quiet and in noise (top panel) along
with the MGFP waveforms (bottom panel) in native Hindi participants........................................ 95
Figure 18. Waveforms obtained in response to Hindi /pha/ in quiet and in noise (top panel)
along with the MGFP waveforms (bottom panel) in native Hindi participants .............................. 96
Figure 19. Waveforms obtained in response to English /ba/ in quiet and in noise (top panel)
along with the MGFP waveforms (bottom panel) in native American English participants .......... 97
Figure 20. Waveforms obtained in response to English /pa/ in quiet and in noise (top panel)
along with the MGFP waveforms (bottom panel) in native American English participants ......... 98
Figure 21. P1 peak amplitudes for MGFP CV and CV-V waveforms across language groups in
quiet and in noise ............................................................................................................................ 99
Figure 22. N1 peak amplitudes for MGFP CV and CV-V waveforms across language groups in
quiet and in noise .......................................................................................................................... 102
Figure 23. P2 peak amplitudes for MGFP CV and CV-V waveforms across language groups in
quiet and in noise .......................................................................................................................... 104
Figure 24. N2 peak amplitudes for MGFP CV and CV-V waveforms across language groups in
quiet and in noise .......................................................................................................................... 106
Figure 25. FCz waveforms across language groups in quiet to Hindi stimuli .............................. 112
Figure 26. FCz waveforms across language groups in quiet to American English stimuli .......... 113
Figure 27. FCz waveforms across language groups in noise to Hindi stimuli ............................. 114
Figure 28. FCz waveforms across language groups in noise to American English stimuli .......... 115

xvi
Figure 29. P1 peak amplitudes and peak latencies at FCz in CV and CV-V waveforms to Hindi
stimuli across language groups in quiet and in noise .................................................................... 117
Figure 30. P1 peak amplitudes and peak latencies at FCz in CV and CV-V waveforms to
American English stimuli across language groups in quiet and in noise ...................................... 118
Figure 31. N1 peak amplitudes and peak latencies at FCz in CV and CV-V waveforms to Hindi
stimuli across language groups in quiet and in noise ................................................................... 122
Figure 32. N1 peak amplitudes and peak latencies at FCz in CV and CV-V waveforms to
English stimuli across language groups in quiet and in noise ...................................................... 123
Figure 33. P2 peak amplitudes and peak latencies in CV and CV-V waveforms to Hindi stimuli
at FCz across language groups in quiet and in noise .................................................................... 127
Figure 34. P2 peak amplitudes and peak latencies at FCz in CV and CV-V waveforms to
English stimuli across language groups in quiet and in noise ...................................................... 128
Figure 35. N2 peak amplitudes and peak latencies in CV and CV-V waveforms to Hindi stimuli
at FCz across language groups in quiet and in noise .................................................................... 132
Figure 36. N2 peak amplitudes and peak latencies in CV and CV-V waveforms to English
stimuli at FCz across language groups in quiet and in noise ........................................................ 133
Figure 37. Grand mean waveforms at T7 across language groups in quiet to Hindi stimuli........ 143
Figure 38. Grand mean waveforms at T7 across language groups in quiet to English stimuli .... 144
Figure 39. Grand mean waveforms at T8 across language groups in quiet to Hindi stimuli........ 145
Figure 40. Grand mean waveforms at T8 across language groups in quiet to English stimuli .... 146
Figure 41. Grand mean waveforms at T7 across language groups in noise to Hindi stimuli ....... 147
Figure 42. Grand mean waveforms at T7 across language groups in noise to English stimuli .... 148
Figure 43. Grand mean waveforms at T8 across language groups in noise to Hindi stimuli ....... 149
Figure 44. Grand mean waveforms at T8 across language groups in noise to English stimuli .... 150

xvii
Figure 45. Na peak amplitudes to Hindi stimuli at T7 and T8 for CV and CV-V waveforms
across language groups in quiet and in noise ................................................................................ 151
Figure 46. Na peak amplitudes to English stimuli at T7 and T8 for CV and CV-V waveforms
across language groups in quiet and in noise ................................................................................ 152
Figure 47. Ta peak amplitudes to Hindi stimuli at T7 and T8 for CV and CV-V waveforms
across language groups in quiet and in noise ............................................................................... 155
Figure 48. Ta peak amplitudes to English stimuli at T7 and T8 for CV and CV-V waveforms
across language groups in quiet and in noise ............................................................................... 156
Figure 49. Tb peak amplitudes for CV and CV-V waveforms to Hindi stimuli at T7 and T8
across language groups in quiet and in noise ............................................................................... 159
Figure 50. Tb peak amplitudes for CV and CV-V waveforms to English stimuli at T7 and T8
across language groups in quiet and in noise ............................................................................... 160
Figure 51. P350 peak amplitudes for CV and CV-V waveforms to Hindi stimuli at T7 and T8
across language groups in quiet and in noise ............................................................................... 163
Figure 52. P350 peak amplitudes for CV and CV-V waveforms to English stimuli at T7 and T8
across language groups in quiet and in noise ............................................................................... 164
xviii
Preface
This dissertation consists of five chapters. Chapter 1 provides an introduction, which
includes a brief overview of theoretical background related to cross linguistic processing in noise
(section 1.1), a review of previous research on behavioral perception of non-native speech
sounds in quiet and in noise (section 1.2) and related auditory evoked potential (AEP) research
(section 1.3), along with the aims of the research (section 1.4), the hypotheses (section 1.5), and
the rationale (section 1.6). Chapter 2 provides a detailed description of the method. Chapter 3
presents the results. Chapter 4 is a discussion of the results, including their relevance to models
of non-native speech perception, along with limitations and implications. Chapter 5 presents the
conclusions of this dissertation.
1
CHAPTER 1: Introduction

2
Hindi is an Indo-Aryan language (which is also a member of the Indo-European branch)
and is spoken widely in many parts of North India. Obstruent consonants across languages can
be classified in terms of place, manner, and voicing. Hindi stop consonants make contrastive use
of a voicing distinction, voice-onset-time or (VOT), with +/- voice and a manner distinction,
characterized as and aspiration (+/- asp) (Bhaskararao, 2011). The Hindi voiced aspirated
consonants are termed voiced breathy consonants by some (Lisker & Abramson, 1964) and as
voiced aspirates by others (Keating, 1984). They are also sometimes referred to as voiced
phonoaspirated (Benguerel & Bhatia, 1980) or as murmured aspirated (Ladefoged, 1975). In this
manuscript, the term “aspiration” will be used.
In Hindi, /p/ (प) is a voiceless unaspirated consonant, /ph/ (फ) is a voiceless aspirated
consonant, /b/ (ब) is a voiced unaspirated consonant, and /bh/ (भ) is a voiced aspirated consonant.
They are classified by Hindi listeners as four different consonants and cannot be used
interchangeably (Abramson, 2007). For example, /bhal/ means ‘brow’, /phal/ means ‘knife blade’,
/bal/ is ‘hair’, and /pal/ is ‘nurture’ (Ladefoged, 1975). Very few languages of the world
distinguish voiced aspirated/breathy and voiceless aspirated consonants. The few that do include
Hindi, Armenian, Thai, Korean, and other Indian languages related to Hindi, such as Marathi
(Lisker & Abramson, 1964).
In English, which is also an Indo-European language, stop consonants contrast in voicing
(+/- voice). For example, English /b/ has short-lag VOT and /p/ has long-lag VOT. English
voiceless stops are also aspirated, but aspiration is not contrastive (that is, not phonemic), and
serves as a secondary cue. Non-contrastive phonetic characteristics are called allophonic.
Allophonic variation is represented using ‘[ ]’, whereas phonemic representation is indicated
using ‘/ /’ (Ladefoged, 1975). For example, the meaning of the English word ‘pot’ remain the

3
same irrespective of whether the speaker produced the word with aspiration as [phot] or without
aspiration [pot], as long as the voice onset time is long lag (greater than about 20 ms) for both
stimuli.
In English, a voiceless stop consonant in the initial position of a stressed syllable is
typically aspirated, but in non-initial positions, it is unaspirated. For example, /p/ in ‘pit’ is an
aspirated [ph], whereas /p/ in ‘keep’ is unaspirated. Aspiration in English can serve as a
secondary cue for English /p/ when in initial position. So, from an acoustic-phonetic perspective,
Hindi /ph/ is similar to English /p/ in initial word or syllable position and English /b/ is similar to
Hindi /p/, because of the VOT is short-lag (between 0 and 20 ms) and English /b/ is generally not
prevoiced, particularly in word initial contexts. However, English consonants can be prevoiced
in some contexts (Davidson, 2016). However, pre-voicing in English can be considered
allophonic, short-lag [pa] and prevoiced [ba] are both perceived as members of the English /ba/
category.
Unlike Hindi and English, Tamil is a Dravidian language spoken in South India. Voicing
of consonants are non-contrastive, only serving as allophonic features. Thus, both [b] and [p] are
allophones of a single phoneme category (ப) in Tamil (Wiltshire, 1999). For example, both
[palli] and [balli] are treated as dialectal variations and would mean ‘lizard’ (பல்லி). Perception
of [p] versus [b] by Tamil speakers is expected to be poor because of their non-contrastive status
in Tamil.
The inclusion of native Hindi, American English, and Tamil listeners in this study
permits the comparison of a language group that has both aspiration and voicing in its phonetic
inventory (Hindi) versus a language group in which voicing is a phonemic feature and aspiration
is allophonic (American English) versus a language group in which neither voicing nor

4
aspiration is phonemically contrastive, but voicing is allophonic (Tamil). Further, in this study,
the term ‘encoding’ refers to neurophysiologic encoding in/near auditory cortex measured using
auditory evoked potentials and ‘perception’ is examined using behavioral testing including tasks,
such as speech identification and discrimination.
The sounds present in a language and the patterning of these sounds constitute its
phonological system. The phonological system of a listener’s native language affects the
perception of speech (e.g., Abramson & Lisker, 1970). A number of behavioral studies have
examined the perception of Hindi voicing (Ahmed & Agrawal, 1969; Durvasula & Luo, 2012;
Polka, 1991; Werker, Gilbert, Humphrey, & Tees, 1981) and aspiration (Durvasula & Luo, 2012;
Werker et al., 1981) in native Hindi and in native English speakers (e.g., Werker et al., 1981).
These features are easily identified by native Hindi speakers (Meenakshi & Ghosh, 2015;
Schuhmann, 2012).
Listeners have difficulty differentiating speech sounds that are not present in their native
language (e.g., Abramson & Lisker, 1970; Best, McRoberts, & Sithole, 1988; Dupoux, Pallier,
Sebastian, & Mehler, 1997; Polka, 1991; Polka & Werker, 1994; Shafer, Schwartz, & Kurtzberg,
2004; Strange, 1995; Werker, et al., 1981). For example, American English listeners have
difficulty differentiating Hindi retroflex /t/ versus dental /t/ plosives (e.g., Werker, et al., 1981).
Considerable research has shown late learners of a second language (L2) continue to find some
L2 phonemic contrasts difficult to perceive, especially when task demands are high (Hisagi,
Shafer, Strange, & Sussman, 2010; Strange, 2011). For example, speech perception is more
difficult for non-native and L2 listeners relative to native listeners in noise (Calandruccio, Dhar,
& Bradlow, 2010; Jin & Liu, 2012; Mattys, Davis, Bradlow, & Scott, 2012).

5
Several models have attempted to explain why non-native speech perception is difficult
relative to speech perception in the native language and to explain the patterns of assimilation
that might occur in non-native listeners. In particular, the automatic selective perception model
(ASP; Strange & Shafer, 2008; Strange, 2011) posits that native language processing is
automatic due to extensive experience in the native language.
In this study, the ASP model serves as the theoretical framework to generate hypotheses
regarding differences in encoding and perception between native and non-native listeners in
quiet, and hypotheses regarding processing of speech perception in noise. The ASP model
proposes selective perceptual routines (SPRs) that allow native listeners to rapidly and efficiently
recover the phonemic identity of native-language speech. Under difficult tasks conditions,
including background noise, native listeners can perform fairly well in identifying words and
comprehending speech because SPRs are automatic and allow cognitive resources to be allocated
for processing other levels of language (e.g., semantic, syntactic, pragmatic) (Strange & Shafer,
2008). Evidence that first language speech perception is fairly automatic in noise has support
(Nabelek & Donahue, 1984; Strange, 2011; Takata & Nabelek, 1990). In contrast, L2 learners,
even when proficient in the L2, often show poorer performance under increasing task difficulty
(e.g., Hisagi, et al., 2010, 2015; Strange 2011). The hypothesis derived from the ASP model is
that non-native listeners will show considerable poorer performance in speech perception and
encoding in noise compared to native listeners for the corresponding native speech sounds. In
contrast, if both native and non-native listeners are influenced to the same extent by noise, then
the findings would fail to support the ASP model.
Processing of speech can be studied using various methods. Auditory evoked potentials
(AEPs) are neural responses that are elicited by sound stimuli and are generated in/near the

6
auditory cortex. Scalp-recorded AEPs are extracted from the electroencephalogram (EEG) from
electrodes placed on various locations across the scalp. AEPs provide information regarding
synchrony of sound processing (broadly the “strength” of the response) which is measured using
amplitude in microvolts (µV), timing through latency measured in milliseconds (ms), and to
some extent, the location using scalp topography and spatiotemporal modeling (Hillyard &
Picton, 1987). To date, the ASP model has not been tested using AEPs measures.
The AEPs to a simple auditory sound consists of a sequence of peaks. The generated
peaks can be exogenous and endogenous. Exogenous refers to obligatory responses; these are
predominantly bottom-up responses and often reflect the stimulus characteristics. Endogenous
responses, in contrast, are top-down responses that require a higher cognitive-linguistic
processing. Depending upon the research design of a study, one can measure both the exogenous
and endogenous potentials in a study. A simple speech stimulus (e.g., CV stimuli or V stimuli)
elicits P1, N1, P2, N2 that are obligatory potentials. Refer to section 1.3 for details. However, the
morphology of the response voltage waveform can be different than for tones. There are some
AEP studies that examine the processing of voicing in Hindi (Sharma & Dorman, 1999; Sharma
& Dorman, 2000a, 2000b; refer to section 1.3 for details). However, in both studies, synthetic
stimuli were used and none of these studies examined processing in background noise. Further,
there are no studies examining the processing of aspiration of speech sounds in Hindi (refer to
section 1.3 for details).
The overall aim of this dissertation was to determine the encoding and perception of
acoustic-phonetic versus phonemic representations of speech in three different language groups
when the relevant cues were and were not degraded by background noise. This study examined
the encoding and perception of aspiration and voicing in Hindi and American English speech

7
sounds in native versus non-native listeners. Perception was examined using behavioral
identification and discrimination tasks. Specifically, the objective was to determine the encoding
and perception of Hindi and American English voiced and aspirated speech sounds, in Hindi,
American English, and Tamil listeners with normal hearing, in quiet versus in noise.
In this study, similarities and differences in processing aspiration and voicing across the
three groups were examined. Also, interactions between processing of aspiration and voicing
with linguistic background and noise were studied. This study is novel because of the inclusion
of aspiration, the language groups, inclusion of noise masking, and inclusion of auditory evoked
potentials (in addition to behavioral testing).
1.1 THEORETICAL BACKGROUND RELATED TO SIGNAL PROCESSING AND
LINGUSITIC [SP] PROCESSING OF SPEECH IN NOISE
Non-native listeners have reduced access to the full range of cues for phonemes that do
not match in the two languages or they might have limited experience with using certain cues to
distinguish and process certain speech sounds in the non-native language. Noise masks a speech
signal by obscuring the less intense portions of the signal (Helfer & Wilbur, 1990). In particular,
certain phonetic cues used in consonant recognition become even more difficult in noise. Native
listeners often have efficient strategies for compensating for the masking effects of background
noise, because they can make use of alternative, secondary cues in the signal. They use all of the
phonetic cues available to them and are less vulnerable to noise-related effects (Jiang, Chen, &
Alwan, 2006; Parikh & Loizou, 2005). However, certain cues are hypothesized to be less
vulnerable relative to others, e.g., voicing is hypothesized to be preserved relative to aspiration in
noise.

8
Processing of a signal in noise
The process of separating a speech signal from the masker may or may not be knowledge
driven based on the type of signal and the type(s) of masker(s) involved (Cooke, Lecumberri, &
Barker, 2008). For example, if the speech signal is part of a longer meaningful unit (e.g., a
sentence), there is contextual information to help identify the signal. If the signal is a
meaningless segment or syllable unit, then perception in noise is more difficult compared to
longer, meaningful units. Top-down processes include the use of semantic and syntactic
information (or integration of cognitive processes) and can operate both in quiet and in noise.
However, bottom-up processes make use of the acoustic information in the stimulus and in quiet,
all of these cues are available. Whereas in noise, the listeners may need to use secondary cues for
perception, and they may need attention and additional effort to process cues that are somewhat
masked by noise or difficult to process (even if not masked).
Signal driven, bottom-up processes include segregating the auditory scene into individual
components based on the various acoustic sources that contributed to the auditory scene
(Bregman, 1990). In the context of noise, researchers define “glimpsing” as the listener’s ability
to glimpse portions of the target speech when there are dips in the background noise (Cooke,
2006). Both auditory scene analysis and glimpsing are hypothesized to be bottom-up approach.
The process of unmasking the speech or signal from the masker is referred to as release from
masking. The ability to detect one source among others (release from masking) has been
commonly referred to as the cocktail party effect (Brungart, 2001).

9
Models related to linguistic processing of speech in noise that are relevant to this study
Many studies have demonstrated speech perception difficulty for non-native speech (e.g.,
Best et al., 1988; Best, 1995; Flege, 1988). In this study, two models related to cross-linguistic
processing of speech in noise are relevant.
Automatic Selective Perception (ASP) Model
The Automatic Selective Perception (ASP) model describes speech perception by adults
as an active information-seeking process (Strange & Shafer, 2008). Native listeners detect the
most reliable acoustic parameters that specify phonetic segments and sequences, using highly
over-learned, automatic selective perception routines. According to this model, speech
identification or discrimination of native sounds is rapid and robust in suboptimal listening
conditions, even when listeners focus on other levels of language structure, or on another task. In
contrast, late learners of a language (learners after puberty as defined by Mayo, Florentine, &
Buus, 1997) must employ greater attentional resources to extract sufficient information to
differentiate sounds that do not occur in their native language.
The ASP model provided theoretical background for the current study. This model was
used to understand the pattern of results in non-native listeners, specifically in noise and to
generate hypotheses for the current study. The current study also tests the ASP model and based
on the results could then possibly lead to extending the model. The theoretical question of
interest was whether native speakers of a language have more automatic access to speech cues
even in noise. For example, are speech identification and discrimination scores of Hindi
participants better relative to Tamil and American English participants for Hindi speech sounds
in noise? This study serves as a test of the model, since the ASP model has not yet been tested

10
using a design that examines cross-linguistic process of speech in noise at the level of neural
processing. This study might also add a new dimension to the existing model and provide further
information on the relative difficulty of voicing versus aspiration cues.
Perceptual Assimilation Model (PAM-L2)
The second model that was of interest in this study is the Perceptual Assimilation Model
(PAM-L2) (Best et al., 1988, 1995; Best & Tyler, 2007). PAM provides some explanation as to
why there are variations in performance across listeners with different first languages when
perceiving L2 speech. PAM-L2 posits that non-native speech sound perception can be explained
using four mechanisms. A non-native speech sound such as /bh/ can be perceptually assimilated
as a categorized exemplar of /b/ by an American English listener. Alternatively, two speech
sounds can be categorized as the same sound with one being a better exemplar than the other. For
example, Hindi /b/ and /bh/ could be perceived as /b/, with /b/ being a better exemplar relative to
/bh/. Further, it can be perceived as an uncategorized consonant that resembles the different
aspects of two or more categories (for example, falling between two or more phonemes). For
example, a Hindi listener would possibly categorize a non-native speech sound such as /ɵ/,
between two existing phonemic categories /t/ and /f/. Lastly, if a non-native speech sound does
not have any resemblance to any of the native phonemes, new categories can be formed such as a
Zulu click to a native English listener.
This model was used in this study to understand the patterns of perceptual assimilation
that take place in non-native listeners to Hindi versus American English speech sounds. The
Hindi participants in this study were non-native listeners to American English speech sounds, the

11
English participants were non-native listeners to Hindi speech sounds and the Tamil listeners
were non-native listeners to both Hindi and English speech sounds.
The theoretical questions that were relevant to this study include: 1) what are the patterns
of assimilation that occur in American English listeners when they listen to Hindi aspirated and
voiced speech sounds? 2) what are the patterns of assimilation that occur in Hindi listeners when
they listen to corresponding English speech sounds, for example, how do the Hindi listeners
perceive the English /p/ ([ph])? Do they perceive it as /ph/ based on its acoustic-phonetic
representation or do they perceive it as /p/ and realize the underlying phonemic representation at
behavioral and neurophysiologic level? 3) what are the patterns of assimilation that occur in
Tamil listeners when they listen to Hindi versus English, aspirated and voiced speech sounds?
The patterns of assimilation might differ in quiet versus in noise. Differences in patterns of
assimilation across quiet and noise can be used to understand how language perception is
affected by noise.
1.2 REVIEW OF RELATED BEHAVIORAL RESEARCH
The phonology of a listener’s native language influences the perception of non-native
speech sounds (e.g., Abramson & Lisker, 1970; Best et al., 1998; Dupoux et al., 1997; Francis &
Nusbaum, 2002; Polka & Werker, 1994; Strange, 1995). As the current study involves stop
consonants, the review of literature will focus on relevant literature related to stop consonants.

12
Acoustic characteristics of stop consonants with emphasis on the three languages used in
the study
Stop consonants are produced with a momentary blockage or articulatory occlusion in the
vocal tract. The sequence of articulatory acoustic events that correspond to the perception of a
stop consonant includes the following; it is often the same regardless of which consonant one is
looking at except for the timing: 1) a stop gap or closure duration characterized by a silent
interval when the air pressure behind the articulatory point of constriction builds up; 2) a
transient brief pulse of acoustic energy produced by the initial release of the constriction; 3) an
interval characterized by a period of turbulence noise generated as the constriction is
progressively released; 4) aspiration during which breathy noise is generated as air passes
through partially closed vocal folds; and 5) onset of voicing characterized by initiation of vocal
fold vibration (Kent & Read, 2002). The acoustic event associated with the release of the
constrictor (sequences #2 and #3 in the description above) is often referred to as the ‘release
burst’ (Kent & Read, 2002). While most of the articulatory acoustic events described above are
universal across languages, aspiration serves as a phonemic cue in only a subset of languages,
such as Hindi, Armenian, Thai, Korean, and Marathi, and is less common than the use of VOT
(Iverson & Salmon, 1995; Lisker & Abramson, 1964).
Voice onset time (VOT) is the duration between the release burst and onset of voicing of
the vowel. VOT serves as a contrastive cue for stop consonants in many languages. VOT can be
simultaneous, lead, or lag depending on when the onset of voicing occurs relative to the release
burst. Negative VOT or lead voicing occurs when the onset of voicing begins before the release
burst; this voicing that happens during closure before the release burst is referred to as
prevoicing. Prevoicing is present in 98% of adult Hindi voiced consonant productions (Davis,

13
1995). In contrast, zero VOT is when the onset of voicing and the release burst occur (nearly)
simultaneously; positive VOT or lag voicing occurs when the voicing begins after the release
burst.
Generally, the VOT of voiced stops are shorter relative to voiceless stops. Further, VOTs
also vary based on language and context. For example, VOTs for Hindi stop consonants are
reported to be in the range of -90 to +80 ms (Davis, 1995) (the ‘-’ refers to lead voicing or
prevoicing). Typical VOTs for English bilabial stop consonants are on average 1 ms for /b/ and
58 ms for /p/ and for Tamil /p/ was 12 ms (Lisker & Abramson, 1964). In languages like Hindi
and Marathi, the VOT of voiced unaspirated stops and voiced aspirated stops are the longest due
to prevoicing or aspiration (b = -85 ms, bh = -61 ms, p = 13 ms, ph = 70 ms) (Lisker & Abramson,
1964).
Perceptual cues to identification of voicing and aspiration
The perceptual cues to the identification of voicing include voice onset time (time from
burst to onset of voicing), closure duration, duration of preceding and following vowel, burst
amplitude, F0, F1 and F2 at onset of vowel, formant transitions. For voiceless plosives, the VOT
is longer (Lisker & Abramson, 1964), the duration of preceding and following vowel is shorter
(Lisker & Abramson, 1964), burst amplitude is greater (Lisker & Abramson, 1964), F0 of the
following segment is higher (Keating, 1984), F1 onset frequency is higher, and the formant
transitions are slower (Lisker, 1975; Summerfield & Haggard, 1977), relative to voiced plosives.
Out of these, VOT is the most important cue for voicing in quiet (Lisker & Abramson, 1964).
However, when voiced unaspirated stops versus voiced aspirated stops have similar VOT (e.g.,

14
in Hindi: b = -85 ms, bh = -61 ms, p = 13 ms, ph = 70 ms), a cue for voiced aspirated stop would
include a low buzz superimposed with noise (Lisker & Abramson, 1964).
Aspiration serves as a contrastive cue for stop consonants in Hindi, whereas in English
aspiration serves only as a secondary cue for long-lag VOT. Energy of the burst and VOT serves
as primary cues for aspiration in English. Voicing is periodic in nature between 50 and 500 Hz
(Rosen, 1992). Aspiration is a transient cue, aperiodic in nature between 1 kHz and 10 kHz
(Rosen, 1992). In a plosive, specifically in Hindi, the interval prior to the onset of voicing can be
filled with aspiration noise and the very presence of aspiration noise before the onset of voicing
serves as a cue for a voiceless plosive. The perceptual cues include the duration of aspiration,
closure duration, and the amplitude of aspiration. The duration of aspiration is greater, closure
duration is longer, and the amplitude of aspiration is higher (Repp, 1979) for voiceless aspirated
plosives relative to voiced aspirated plosives.
Further, the perceptual cues to the identification of voicing and aspiration vary in quiet
versus in noise (e.g., Bradlow & Alexander, 2007; Tsui & Valter, 2000). In noise, voicing as an
acoustic cue was less likely to be masked relative to other acoustic cues including nasality,
affrication, place, and duration cues (Miller & Nicely, 1955). For example, Miller and Nicely
(1955) examined 16 voiced and voiceless speech consonants in CV context (vowel was /a/) and
voicing was still discriminable at low SNRs such as −12 dB.
General effects of noise on behavioral perception and related factors
There are a number of factors that can influence speech perception and speech processing
in noise, and it is essential to have an overview of these factors. For example, the type of noise
used in a study can influence speech perception. For example, Hant and Alwan (2000) examined

15
the discrimination of voiced synthetic plosive consonants in two types of noisy environments
(speech shaped noise versus white noise). The thresholds for discrimination of CV plosives were
lower by 5-10 dB in speech-shaped noise relative to white noise. Similar results were obtained
by Nittrouer and colleagues (2003). They observed that adults showed a 22% advantage for
speech-shaped noise over white noise in recognition scores. Speech-shaped noise often has a
sloping long-term average spectrum with low frequencies having greater energy, whereas white
noise has equal amount of energy across frequencies. This suggests that listeners use high-
frequency speech cues that were not masked by the sloping long-term spectrum of speech shaped
noise, but those cues were unavailable in white noise.
Another type of noise includes the babble noise where there are talkers speaking in the
background. The number of talkers speaking in the background can differ from one to eight.
Babble noise is a standardized material used in conventional speech-in-noise testing. The type of
babble noise used in a study can influence speech perception. For example, six-talker babble is
more detrimental relative to two-talker babble due to greater spectral and temporal density of six-
talker noise, thereby resulting in poorer speech perception (Rosen, 1992; Simpson & Cooke,
2005; van Engen & Bradlow, 2007). With an increased number of talkers, the amplitude
envelope becomes flatter and more similar to white noise. Also, the long-term average spectrum
of speech becomes flatter with more talkers, with relatively equal energy across frequencies and
hence provides fewer acoustic cues for speech recognition (Simpson & Cooke, 2005).
Further, the gender of the talker also influenced perception. For example, Jiang, et al.
(2006) showed that discrimination accuracy for stimuli from male talkers degraded steadily with
decreasing SNR (+10 to −15) when CV signal was presented at 60 dB SPL and the broad band
noise level was adjusted. In contrast, for female talkers, discrimination performance degraded

16
dramatically only when the SNR was below −5. Hence, female talkers were used to record the
stimuli in the current study.
Non-native speech sound perception in noise
Differences in speech perception between native and non-native listeners are more
evident in the presence of noise (Calandruccio et al. 2010; Jin & Liu, 2012; Mattys et al., 2012;
Mayo et al., 1997; Nabelek & Donahue, 1984; Rogers, Lister, Febo, Besing, & Abrams, 2006).
For example, English sentence recognition was more difficult in background noise for Chinese
(dialect was not specified: Cantonese versus Mandarin) and Korean second language learners of
English (Jin & Liu, 2012). L2 listeners showed 40-70% accuracy relative to native English
listeners who showed greater than 70% accuracy. The non-native listeners had high test of
English as foreign language (TOEFL) scores of at least 213 (computer-based test) and scored
above 80% for the hearing in noise test (HINT) sentence recognition test in quiet.
The increased processing demand for non-native listeners may not be evident in quiet
conditions in which the signal quality is high, and the task demand is low. However, when the
target signal is degraded by noise or reverberation, or when task demand is high (e.g., while
performing a secondary activity), the effects of such differences may be evident (e.g., Mayo et
al., 1997; Meador, Flege, & MacKay, 2000). This pattern in finding is also predicted by the ASP
model (Strange & Shafer, 2008).
Nabelek and Donahue (1984) observed similar word identification scores for native
English listeners versus L2 non-native listeners in quiet (98% correct). However, when exposed
to reverberation (T = 1.2 s), the L2 listeners had a 10% decrease in scores relative to native
listeners. The average percent correct score for L2 listeners was 77.3% and for native listeners

17
was 87%. Similarly, English consonant recognition scores for Japanese L2 learners of English
were poorer (72%) than those of American English listeners (80%) in twelve talker English
babble noise or reverberation conditions with T = 1.2 s (Takata & Nabelek, 1990). For Japanese
participants, the mean percent correct scores were 97.4 in quiet, 72.4 in babble noise, and 72.8 in
reverberation. In contrast, for native American English participants, the mean percent correct
scores were 99.3 in quiet, 80.3 in babble noise, and 80.4 in reverberation.
Further, the language of the speech, the language of the noise, and the language
background of the listener all impact speech perception performance (Calandruccio et al. 2010;
Jin & Liu, 2012; Lecumberri & Cooke, 2006; Mattys et al., 2012; Takata & Nabelek, 1990). For
example, Lecumberri and Cooke (2006) examined consonant identification in CVC context using
English speech sounds across four types of maskers including speech shaped noise, competing
English talker, competing Spanish talker, and eight-talker English babble at SNR 0, in native
English listeners and non-native Spanish listeners. The Spanish listeners were late L2 learners of
English (started learning English after 20 years of age). Higher percent correct responses were
observed in the native English listeners relative to Spanish listeners in quiet and in all four noise
conditions. The percent correct scores (as seen from the figure) were 98% in quiet, over 90% for
competing English and Spanish speech, 85% for speech shaped noise, and 80% for multi-talker
babble. In contrast, the percent correct identification scores in Spanish listeners were 91% in
quiet, approximately 85% for competing English and Spanish speech noise, 71% for speech
shaped noise, and 63% for multi-talker babble. Overall, it appears that both native and non-
native listeners performed poorly for multi-talker babble, followed by speech shaped noise
relative to single talker competing speech in native or non-native language.

18
In bilinguals, factors including age of acquisition, years of exposure, and use of a
language in daily life can often influence speech perception in noise. For example, for late
learners (after puberty), word identification performance was poorer in babble noise relative to
early learners, although both groups performed similar to native listeners in quiet, with greater
than 96% accuracy (Mayo et al., 1997). Hence, age of acquisition of the L2 is associated with
performance in noise, relative to number of years of exposure (Mayo et al., 1997).
Several factors influence the release of masking (Cooke et al, 2008) including
misallocation of audible segments of the masker to arrive at incorrect identification of the signal
(e.g., aspiration following a plosive can be misallocated as a fricative /h/), resulting in speech
perception errors. Also, the cognitive load of the masker and allocation of resources including
attention towards processing of the signal serve as other factors. For example, if the masker has
important information or more content, processing resources are allocated to both the signal and
the masker, therefore increasing the effects of masking. Further, language of the masker also
influences speech in noise perception; for example, if the signal and the masker are in the same
language, masking effects are greater because interaction occurs at phonemic, word, and
prosodic levels (Simpson & Cooke, 2005).
Overall, the differences in speech perception between native and non-native listeners
have been widely reported in behavioral studies, but there are few neurophysiological studies
related to non-native speech perception using Hindi speech sounds. The relevant literature is
discussed below, with emphasis on the perception and neurophysiologic encoding of Hindi
speech sounds.

19
1.3 REVIEW OF RELATED AUDITORY EVOKED POTENTIAL (AEP) RESEARCH
Auditory evoked potentials (AEPs) refer to brain wave responses time-locked to sound
stimuli and generated in or near auditory cortex (Davis, 1939; Davis, Hirsh, Shelnutt, & Bowers,
1967). They are recorded using electrodes placed at a number of locations on the scalp. AEPs
provide information regarding synchrony of sound processing and the number of neurons
responding (“strength” of response). The amplitude of the signal is expressed in microvolts (µV),
because auditory evoked potentials (AEP) generally show amplitudes between -20 and 20
microvolts. The timing of the response relative to the stimulus onset is expressed as latency. It is
measured in milliseconds (ms) because the responses occur in the first few hundred milliseconds
post stimulus onset. AEPs also provide information to some extent on the location using scalp
topography and spatio-temporal source modeling (Hillyard & Picton, 1987; Martin, Tremblay, &
Korczak, 2008). Recording AEPs is a non-invasive method of examining neurophysiologic
correlates of perceptual processes in humans (Davis, 1939).
Electrophysiological responses relevant to this study: P1, N1, P2, N2, and T-complex
responses
The P1-N1-P2 complex provides an objective index of sound encoding, including speech
and T-complex reflects linguistic processing. In this section, P1, N1, P2, and N2 onset responses
will be discussed in detail as these are the potentials of interest in this study. These are obligatory
auditory evoked potentials and they reflect the stimulus characteristics.
The P1-N1-P2 complex is typically evoked using short duration stimuli and a series of
repeated stimulus presentations. It is typically elicited by sound onset but can also be elicited by
offset. However, it can also be generated in response to a change within a sound and this is

20
known as the acoustic change complex (ACC). The AEP is time locked to the stimuli, resulting
in measurable synchronous activity at the scalp. Signal averaging and other processing
techniques are used to increase the signal to noise ratio of responses (Davis, 1939). The P1-N1-
P2 complex is typically large at the vertex.
The components of P1-N1-P2 complex can be dissociated (Naatenen & Picton, 1987).
These peaks can be described in terms of polarity, amplitude and latency (Naatenen & Picton,
1987; Ceponiene, Cheour, & Naatanen, 1998; Ponton, Eggermont, Khosla, Kwong, & Don,
2002). P1 and P2 are vertex positive peaks with latencies around 50 ms and 180 ms post stimulus
onset, respectively (Geisler, Frishkopf, & Rosenblith, 1958; Hyde, 1997; Picton, 2013). N1 is a
vertex negative peak with a latency of approximately 100 ms (Hyde, 1997; Picton, 2013). There
are several (at least 3) sub-components to N1 with peak latencies around 70-150 ms post
stimulus onset (Naatanen & Picton, 1987; Giard et al., 1994; Woods, 1995; Picton, 2013). These
sub-components can be teased apart by parametric manipulations and by examining topography.
The obligatory N2 is a vertex negative peak with latency around 200 ms post-stimulus onset. It
can be elicited in an active or passive paradigm, which requires attention to stimulus or not,
respectively.
P1 has many generators including primary auditory cortex, Heschl’s gyrus, hippocampus,
planum temporale, and lateral temporal cortex (Howard, Volkov, Mirsky, Garell, Noh, Granner,
et al., 2000; Grunwald, Boutros, Pezer, Von Oertzen, Fernandez, Schaller, et al., 2003; Wood &
Wolpaw, 1982). Generators of N1 include the primary and secondary auditory cortex (Howard et
al., 2000; Wood & Wolpaw, 1982). Generators of P2 include primary auditory cortex, secondary
auditory cortex, and mesencephalic reticular activating system (Crowley & Colrain, 2004).

21
Generators for N2 include bilateral superior and middle temporal gyrus (Kiehl, Laurens, Forster,
& Liddle, 2001).
The T-complex is a negative-positive-negative wave measured from lateral temporal
electrode sites (Wolpaw & Penry, 1975). The first peak referred to as ‘Na’ has a negative
polarity with latency around 70 to 80 ms. The second component is a positive peak around 100
ms (Ta) and the third is a large negative peak around 140-160 ms (Tb) post stimulus onset
(Tonnquist-Uhlen, Ponton, Eggermont, Kwong, & Don, 2003). The generators of T-complex
include the secondary auditory cortex on the lateral surface of the superior temporal gyrus
(Howard et al., 2000; Ponton, Eggermont, Khosla, Kwong, & Don, 2002). A later positive peak
around 300 and 400 ms has also been identified and is referred to as P350 (Friedrich, Kotz,
Friederici, & Alter, 2004). P350 indexes lexical access and identification (Scharinger & Felder,
2011).
Electrophysiological responses to plosives focusing on Hindi speech sounds
In general, the peak latencies are more prolonged with increase in VOT, thereby
reflecting the stimulus characteristics (Elangovan & Stuart, 2011; Han, Bahng, & Park, 2013;
Sharma & Dorman, 2000a). Tremblay and colleagues performed a study that is relevant to this
dissertation and can illustrate how P1-N1-P2 reflects stimulus characteristics. Tremblay et al.
(2003) examined the differences in P1-N1-P2 peak amplitude and latency responses with
changes in voice onset time (VOT) using a /ba/-/pa/ continuum. These findings are consistent
with the responses to voiced-voiceless plosives that have been observed in intra-operative
recordings in humans (Howard et al., 2000; Steinschneider, Volkov, Noh, Garell, & Howard,
1999) and even in animals such as monkeys (Steinschneider, Volkov, Fishman, Oya, Arezzo, &

22
Howard, 2005), chinchillas (Kuhl, & Miller, 1975), and guinea pigs (Kraus, McGee, Carrell,
King, Littman, & Nicol, 1994).
In addition, Sharma and Dorman (1999, 2000a) observed double peaking of AEPs for
VOT greater than 50 ms in the N1 region in response to a /da/-/ta/ continuum (Sharma &
Dorman, 1999) and /ba/-/pa/ continuum (Sharma & Dorman, 2000a). VOT was varied
systematically (increasing from prevoicing 0 ms to 90 ms) by editing natural speech to produce
the continuum. English listeners perceive the stimuli with VOTs less than about 20 ms as /ba/
and those longer than 20 ms as /pa/ and have difficulty discriminating between stimuli with VOT
falling on the same side as the 20 ms boundary. They labeled the two negative peaks as N1’ and
N1. However, double peaks for N1 were not consistently observed in the /ga/-/ka/ continuum
(Sharma & Dorman, 2000b). The double peaking and inconsistent N1 findings were attributed to
the differences in acoustic properties of the stimuli in terms of VOT, burst duration, amplitude of
aspiration, and F1 height (Sharma & Dorman, 2000a; Steinschneider, Volkov, Fishman, Oya,
Arezzo, & Howard, 2005).
Most previous work examined the neural processing of Hindi speech sounds in non-
native listeners focused on Hindi retroflex consonants (e.g., Chen & Small, 2015; Dehaene-
Lambert, 1997; Rivera-Gaxiola, Csibra, Johnson, & Karmiloff-Smith, 2000; Shafer, Schwartz, &
Kurtzberg, 2004; Small & Werker, 2012). For example, Small and Werker (2012) examined
Acoustic Change Complex (ACC) responses to Hindi sounds (bilabial /b/, dental /d/, and
retroflex /D/) using the stimuli /daba/, /dada/, and /daDa/ in native English listeners. ACC P1-
N1-P2 peak amplitude responses to /daba/ were larger than the responses to /dada/ and /daDa/.
The study was then followed through by another study (Chen & Small, 2015) using relatively
longer stimulus duration (by increasing the stimulus from 564 ms to 816 ms) and observed larger

23
P1 ACC response for /daba/, and /daDa/, relative to /dada/. Taken together, the results from most
of these studies suggest delayed and less synchronous processing for Hindi speech sounds in
non-native listeners (e.g., Chen & Small, 2015; Small & Werker, 2012).
Electrophysiological responses to aspiration
For the current study, Hindi voicing and aspiration are the focus. There is a large
literature showing that VOT modulates the P1-N1-P2 complex for voiced sounds (e.g.,
Elangovan & Stuart, 2011; Sharma & Dorman, 2000a; Tremblay et al., 2003). However, there
has been little work examining the neurophysiologic processing of aspiration.
The neurophysiologic processing of Hindi aspirated sounds has not been studied
previously. To my knowledge, only two studies have examined the encoding and
neurophysiologic processing of consonant aspiration. One of the studies utilized the Korean
language and examined N1-P2 amplitudes (Han, Bahng, & Park, 2013). The other study focused
on the Thai language and examined N200 and P300 (Dittinger, D’Imperio, & Besson, 2018). The
N200 (N2b) is a negativity peaking between 200 and 300 ms and the P300 (P3b) is a late
potential elicited peaking between 300 ms and 500 ms. Both responses are larger in amplitude to
target than non-target stimuli and are observed in an active discrimination paradigm (e.g., the
participant is asked to press a button; Dittinger, D’Imperio, & Besson, 2018).
Han, Bahng and Park (2013) performed a study that examined the neurophysiologic
processing of Korean aspirated, tense and lax stop consonants in a CV context. The stimuli were
the nine syllables including /pa/, /p*a/, /pha/, /ta/, /t*a/, /tha/, /ka/, /k*a/, and /kha/. The phonemes
/p, t, k/ are lax Korean consonants for which there is little aspiration and the shortest duration
from onset of consonant to the maximum peak in consonant. /p*, t*, k*/ are tense stop

24
consonants which are produced with increased glottal constriction and acoustically showed the
longest duration from onset of consonant to the maximum peak in consonant. /ph, th, kh/ are
aspirated consonants with longest VOT. Findings included larger N1-P2 amplitudes to aspirated
/tha/ and /pha/ compared to its tense and lax counterparts. This finding suggests that there may be
a potential neural signature for the Hindi aspirated speech sound /pha/ used in this study as well.
In the second study (Dittinger, D’Imperio, & Besson, 2018), N2b and P3b were examined
in musicians versus non-musicians who were native French speakers for a native French contrast
of voice (/p/ versus /b/) and a non-native Thai contrast of aspiration (/p/ versus /ph/). A bilingual
French-Thai speaker, who learned both languages early recorded the stimuli. The VOT for /b/
was -144 ms, for /p/ VOT was 3 ms, and for /ph/, VOT was 77 ms. The participants were
instructed to categorize the two contrasts; for example, they were asked to press a button on a
response pad when they heard /p/ and another button when the participants heard /ph/. The
musicians had larger N2b and P3b for the non-native sound (i.e., (/ph/) when compared to non-
musicians, suggesting that musicians were more sensitive to acoustic-phonetic cues in non-native
speech than non-musicians (Dittinger et al., 2018). The first study suggests that there could be
neurophysiological signature of aspiration for Hindi consonants. The second study suggests that
experience can modulate discrimination.
Electrophysiological responses in noise
In the present study, the encoding of both voicing and aspiration features was examined
in quiet and in noise. Although there is a dearth of literature on encoding of Hindi voicing and
aspiration features, there is a considerable amount of work related to P1, N1, P2 to speech
sounds in noise (e.g., Billings, Tremblay, Stecker, & Tolin, 2009; Dimitrijevic, Pratt, & Starr,

25
2013; Martin, Kurtzberg, & Stapells, 1999; Martin, Sigal, Kurtzberg, & Stapells, 1997; Martin &
Stapells, 2005; Whiting, Martin, & Stapells, 1998).
Overall, AEP responses are smaller in amplitude and the latencies are more prolonged in
noise relative to quiet (e.g., Dimitrijevic et al., 2013; Martin et al., 1997, 1999, 2005; Whiting et
al., 1998). The impact of noise on AEP waveforms depends on many factors, including noise
intensity, signal to noise ratio (SNR), spectral content, type of noise, etc. (e.g., Martin et al.,
1997, 1999, 2005; Whiting et al., 1998). For example, Billings and colleagues (2009) generated
two tone levels (60- and 75-dB SPL) and six SNRs (quiet, 20, 10, 0, -10) by varying the levels of
continuous white noise (Billings, Tremblay, Stecker, & Tolin, 2009). As the SNR increased from
-10 to +20, AEP amplitudes increased (0-100%) and the latencies shortened (70-80 ms shifts) in
both N2 and P3 (Billings et al., 2009). In terms of areas of activation, when speech is presented
in noise (or other types of degradation), increased right hemisphere activation (auditory cortices)
has been demonstrated (Shtyrov, Kujala, Ilmoniemi, & Näätänen, 1999), reflecting potential
recruitment of additional brain regions for processing speech in noise.
Taken together, this section reviewed the previous literature and highlights the need to
examine the neurophysiologic processing of native versus non-native speech sounds for better
understanding of speech processing and encoding of these features (aspiration and voicing)
across language groups and to understand how noise can affect listeners with different linguistic
backgrounds.

26
1.4 AIMS OF THE STUDY
1.4.1 GENERAL AIM
The overall aim is to understand the processing and encoding of acoustic-phonetic versus
phonemic representations of speech in listeners of three different language groups who use
aspiration and voicing differently in their native language and to examine how noise interacts
with the two acoustic cues and the linguistic background.
1.4.2 SPECIFIC AIMS
The purpose is to compare the perception and encoding of voicing and aspiration in quiet
versus noise in native Hindi, American English and Tamil listeners.
The specific aims are to answer the following questions:
a. Do listeners in language groups with aspiration and voicing in their native phonetic
repertoire have less difficulty perceiving and encoding these features in noise compared
to those who do not have aspiration or voicing or both?
b. How is speech perception and encoding of English aspiration and voicing similar to or
different from the responses to Hindi aspiration and voicing based on linguistic
background, in quiet and in noise?
1.5 HYPOTHESES
1.5.1 BEHAVIORAL
Identification and discrimination accuracy measures (measured in percent categorization
scores or percent correct scores) were hypothesized to be higher in native listeners compared to
non-native listeners, because non-native listeners have less access to features not present in the

27
native language, due to the phonological filtering imposed by the native language (e.g., Werker
et al., 1981; refer to Lecumberri, Cooke, & Cutler, A, 2010 for review). More specifically, for
Hindi aspirated and voiced sounds, higher behavioral accuracy was hypothesized for Hindi
listeners who are sensitive to both Hindi aspiration and voicing. In contrast, American English
listeners would be more sensitive to voicing relative to aspiration, because aspiration exists only
as an allophonic variation in American English.
For English stimuli (voiced /b/ vs voiceless /p/), native listeners (American English) were
hypothesized to have higher accuracy relative to non-native listeners (Hindi and Tamil). The
poorest accuracy was hypothesized for Tamil listeners in response to both Hindi and English
stimuli, because these listeners have neither voicing nor aspiration as phonemically contrastive.
A ceiling effect was hypothesized for accuracy scores for native listeners in the quiet conditions.
However, the results from native listeners would be used to serve as a reference for the response
patterns found for non-native listeners. In noise conditions, accuracy of native listeners was
hypothesized to be relatively high, but not at ceiling.
Further, although the acoustic-phonetic representation for Hindi /pha/ [pha] is similar to
English /pa, the two speech sounds in both the languages are not identical phonetically. Hence,
for American English participants, the speech identification and discrimination scores were
predicted to be higher in response to English [pha] (/pa/) relative to its acoustic-phonetic
counterpart, i.e., Hindi /pha/, due to the influence of the listeners’ phonological system (Best et
al., 1988; Werker et al., 1981).
In noise, all three groups were predicted to perform poorly with reduced consonant
identification and discrimination scores relative to quiet conditions as previous research had
shown that noise was detrimental to speech perception and encoding (Calandruccio et al. 2010;

28
Jin & Liu, 2012; Mattys et al., 2012; Takata & Nabelek, 1990). However, it was hypothesized
that native listeners would be more resistant to the negative impact of noise compared to non-
native listeners because they are better at reconstructing the identity from the glimpses of
information.
In general, across participants higher accuracy was predicted in response to voicing
relative to aspiration. Aperiodic and transient cues like aspiration were more likely to be
influenced by masking relative to periodic features such as voicing (Wright, 2004). Poorer
accuracy on the behavioral identification task for aspirated sounds was predicted in Tamil
listeners, because aspiration was not phonemic and was not found as a secondary cue in their
native language. Hence, per the ASP model, these Tamil listeners would not automatically select
the relevant information (aspiration) to allow recovery of the identity of the phoneme and might
be more susceptible to masking effects (e.g., Bradlow & Alexander, 2007).
1.5.2 AUDITORY EVOKED POTENTIALS (AEPs)
In the quiet condition, robust AEP responses with larger peak amplitudes and shorter
AEP peak latencies were predicted in native listeners when compared to non-native listeners
(e.g., Chen et al., 2015; Sharma & Dorman, 2000a). The larger peak amplitudes would reflect
stronger neural synchrony and the shorter peak latencies would reflect rapid, efficient
neurophysiologic processing. More specifically, the expected responses to Hindi stimuli included
larger amplitudes and shorter latencies in Hindi listeners, relative to American English or Tamil
listeners. Similarly, larger amplitudes and shorter latencies were hypothesized in American
English listeners relative to Hindi listeners in response to English aspirated and voiced sounds,
because of the influence of their phonological filter. Smaller amplitudes and prolonged latencies

29
were hypothesized in Tamil listeners both to English and Hindi stimuli (Sharma & Dorman,
2000a).
Larger P1, N1, P2 amplitudes and prolonged latencies were predicted in response to
aspirated sounds when compared to unaspirated sounds (Han et al., 2013). The latencies of
voiceless stimuli (/pa/, /pha/) were hypothesized to be longer relative to voiced stimuli (/ba/) as a
reflection of the longer VOT (Sharma & Dorman, 2000a; Small & Werker, 2012). An interaction
of group for the aspiration contrast was hypothesized to be evident at lateral electrode sites in the
T-complex components compared to AEP components measured at central electrode sites
indicating phonemic/linguistic processing (Wagner, Shafer, Martin, & Steinschneider, 2013).
In the noise condition, AEP responses were hypothesized to be less robust in all three
groups with more resistance to the effects of the noise in the native listeners. In other words,
larger amplitudes and shorter latencies in native listeners when compared to non-native listeners
was hypothesized because the phonological filter is active even in the presence of noise
(Bradlow & Alexander, 2007). However, greater influence of noise was predicted in non-native
listeners compared to native listeners, because listeners would have to use all phonetic cues
potentially accessible to them in noise, including formant transition, release burst, duration of
release, duration of vowel following consonant, in addition to VOT. Native listeners were shown
to be more sensitive to all the available phonetic cues in noise (Nabelek & Donahue, 1984;
Takata & Nábelek, 1990). This is predicted by the ASP model as the native listeners can
efficiently and automatically make use of the relevant cues (Strange & Shafer, 2008).
Speech is typically processed in the left hemisphere; however, an increased right
hemisphere activation is hypothesized in the presence of background noise because in noise
additional auditory areas in the right hemisphere are recruited for processing the signal (Binder et

30
al., 2000; Hickok & Poeppel, 2000; Joanisse & Gati, 2003; Scott & Johnsrude, 2003; Shtyrov et
al., 1999).
1.6 SIGNIFICANCE & IMPLICATIONS
Perception of aspiration is critical for language processing in a number of languages,
including Hindi. AEPs reflect the encoding of language-relevant sounds at the level of the
auditory cortex and can provide an index of the timing, synchrony, and distribution of language
processing. The processing of aspiration has received little attention in the AEP literature. To my
knowledge, only two studies have examined this, and they focused on sounds in the Korean (Han
et al., 2013) and Thai languages (Dittinger, D’Imperio, & Besson, 2018).
The neurophysiologic processing of Hindi aspirated sounds has not been studied
previously. Also, no previous AEP study has examined the effects of aspirated sounds in
background noise. Therefore, in this study, the neural encoding of Hindi speech sounds in native
listeners was examined and the interaction of linguistic background with speech processing in
noise was explored. The findings from Hindi listeners served as a baseline when comparing the
processing of aspiration and voicing in native Hindi listeners who have both these features with
native American English listeners who have only voicing in their phonetic inventory, and native
Tamil listeners who have neither. This study sheds light on the perception and encoding of
phonetic versus phonological representations of speech and the factors related to that, including
linguistic background and noise.

31
CHAPTER 2: Method

32
2.1 PARTICIPANTS
Sixteen participants ages 20-45 years participated in each language group (Hindi,
American English, Tamil). The age range of 20-45 years was chosen to avoid effects of
maturation and aging that might be observed in the AEPs. The number of participants was
estimated using power analysis on pilot data (Antony & Martin, 2016) with apriori power set
to 80%, effect size to .5 and an alpha level of 0.01 (N = 10, mean difference for P2 latency =
43.21 ms, sd = 17.22). The mean age of Hindi participants (10 female, 6 male) was 26.44
years (sd = 1.20), English participants (10 male, 6 female) was 29.38 years (sd = 1.72), and
Tamil participants (8 male, 8 female) was 28.75 years (sd = 1.52). Gender or sexual identity
was not a variable in the current study.
Language proficiency was documented using the Language Experience and
Proficiency Questionnaire (LEAP-Q) applied to each participant’s native language, second
language, and third language, if any (Marian, Blumenfeld, & Kaushanskay, 2007). On LEAP-
Q, linguistic proficiency was measured on a ten-point rating scale with ‘10’ indicating ‘highly
proficient’ and ‘0’ indicating ‘not proficient’. The linguistic profile of the three language
groups for native language and second language are displayed in tables 1-3. All the Hindi
participants and Tamil participants were fluent L2 speakers of English. Further, there was one
Tamil speaker who identified herself as a fluent speaker of Hindi as well. No participants in
the Hindi group reported Tamil as their L2 or L3. Further, while the Tamil and English
participants started learning their L1 language in less than one year, the mean age for Hindi
participants was over 2 years. This is because Hindi is spoken in many states in India and
often there is another spoken in that state. So, at least 5 of the Hindi participants had early
exposure to another language, e.g., Marathi, Guajarati, Bengali, Urdu, Punjabi. Refer to the

33
appendices 1-3 for detailed LEAP-Q results.
Table 1. Linguistic profile of Hindi participants
Broad areas Specific areas
L1 L2
Mean SD Mean SD
Self-
reported
proficiency
Speaking 9.31 0.87 9.19 0.83
Understanding 9.38 0.72 9.13 0.89
Reading 7.88 1.75 9.50 0.82
Age
milestones
(yrs)
Started learning 2.41 2.17 3.38 2.09
Attained
fluency 5.94 2.98 8.81 4.20
Started reading 7.25 2.52 5.94 3.09
Attained
reading fluency 9.53 2.61 8.19 2.93
Table 2. Linguistic profile of English participants
Broad areas Specific areas
L1 L2
Mean SD Mean SD
Self-
reported
proficiency
Speaking 9.94 0.25 6.40 0.55
Understanding 9.88 0.34 6.80 1.48
Reading 9.88 0.34 7.20 0.84
Age
milestones
(yrs)
Started learning 0.19 0.54 9.40 6.80
Attained fluency 3.50 1.86 14.00 5.79
Started reading 4.50 1.59 11.40 4.39
Attained reading
fluency 5.47 1.63 14.00 6.38

34
Table 3. Linguistic profile of Tamil participants
Broad areas Specific areas
L1 L2
Mean SD Mean SD
Self-
reported
proficiency
Speaking 9.94 0.25 9.22 1.08
Understanding 10.00 0.00 9.44 0.89
Reading 7.03 3.40 9.63 0.81
Age
milestones
(yrs)
Started learning 0.15 0.33 4.00 1.86
Attained
fluency 3.97 1.55 10.81 4.31
Started reading 7.86 5.02 5.72 2.16
Attained
reading fluency 9.00 3.39 8.78 2.50
The participants had normal hearing sensitivity (pure tone thresholds of ≤ 25 dB HL
for frequencies from 250-8000 Hz, ANSI 1996) and middle ear function (admittance curve
with a single peak between +/- 50 daPa using a 226 Hz probe tone and present ipsilateral
reflexes at 1000 Hz).
Individuals reporting a history of recurrent middle ear problems, neurological
problems, or language or learning problems were excluded. Prior to testing, the purpose of
the study was explained to each participant and informed consent was obtained.
2.2 STIMULI
Natural digitized bilabial speech stimuli including Hindi /ba/, /pa/, and /pha/ and English
/ba/ and /pa/ were recorded using native Hindi and English female speakers respectively.
Monosyllabic consonant-vowel (CV) syllables in the same vowel context (i.e., /a/) were used in
this study to allow for better understanding of the neural signatures that might be related to
voicing and aspiration; further, they were included to examine speech identification and
discrimination at a phonemic level. The use of relatively brief monosyllabic CV syllables would

35
reduce overlapping of responses that could occur in longer stimuli. In addition, more complex
stimuli (e.g., word, sentence) would introduce semantic and syntactic factors that are beyond the
scope of the study.
The vowel /a/ was chosen because it is a relatively neutral vowel and does not involve
the tongue tip or the back of the tongue. The consonants were bilabials, because use of alveolar
consonants would introduce a potential confound. Specifically, English and Hindi make use of
different coronal phonemes. English uses alveolar for /t/ and /d/, whereas Hindi has a phonemic
distinction between a dental and retroflex coronal production (Ahmed & Agrawal, 1969). Velar
sounds are also problematic, because there is a tendency for double bursts when these sounds
are produced (Stevens & Blumstein, 1978). Hence, the obligatory potentials that are of interest
in this study would possibly result in a more complicated electrophysiological response to velar
sounds when compared to bilabial sounds, which is beyond the focus of this study.
In addition, previous research has found that at a signal-to-noise (SNR) of +5, the
poorest identification scores were obtained for the labial consonants /b/ and /p/, relative to
alveolar and velar sounds (Parikh et al., 2005). The authors suspected that this was because the
babble noise and speech-shaped noise used in the study masked low frequencies (found in
bilabials) more than the high frequencies (found in alveolars). Since this study was designed to
determine the speech processing in native listeners and non-native listeners in noise, bilabials
that are more susceptible to speech noise effects are particularly interesting to include.
The talker who produced the Hindi stimuli was a 28-year-old female native Hindi
speaker. The talker who produced the American English stimuli was a 29-year-old native
American English speaker. The recording was accomplished in a double walled sound
attenuated booth. The talkers used a head worn Shure SM10A microphone. The microphone

36
signal was fed to a Shure M267 mixer, and then to a Dell Intel® (Pentium® D, CPU 3.4 GHz,
1.99 GB of RAM) computer with a Montego II plus sound card and Sound Forge 4.5 software.
The stimuli were saved as mono recordings with a sampling rate of 44100 Hz. The Hindi talker
produced the syllables /ba/, /pa/, and /pha/ and the English talker produced /ba/ and /pa/. Each
syllable was produced twenty-one times (7 repetitions*3 blocks). Each block contained seven
repetitions of a syllable and the order of production of the syllables was randomized across
blocks.
One CV token per phoneme was selected for the test stimulus based on relatively flat
f0 contour, relatively flat intensity contour, clear formants (observed from spectrogram), and
clean recording signal without any clipping (observed from waveform). Where necessary, the
CV stimuli were padded with silence at the beginning so that the burst was aligned for all five
stimuli (three Hindi and two English stimuli). The onset of the burst occurred at 94 ms for
each stimulus. Table 4 displays the acoustic characteristics of the Hindi stimuli, including the
total duration, consonant duration, vowel duration, duration of prevoicing, aspiration duration,
VOT, and onset of vowel.
Table 4. Characteristics of the three Hindi stimuli
Stimulus Total
duration
without
padding
(ms)
Duration of
consonant
without
padding
(ms)
Duration
of vowel
(ms)
Total
duration
with
padding
(ms)
Duration
of
prevoicing
(ms)
Duration
of
aspiration
(ms)
VOT
(ms)
Onset
of
vowel
(ms)
/ba/ [ba] 709 98 611 709 86 0 -90 98
/pa/ [pa] 628 77 550 655 - 11 10 104 /pha/ [pha] 630 146 485 641 - 46 45 139

37
Table 5 displays the acoustic characteristics of the English stimuli, including the total
duration, consonant duration, vowel duration, duration of prevoicing, aspiration/noise
duration, VOT, and onset of vowel.
Table 5. Characteristics of the two English stimuli
Figure 1 displays waveforms (top panel) and spectrograms (bottom panel) of the Hindi
/ba/ [ba], /pa/ [pa], and /pha/ [pha] stimuli. As mentioned earlier, phonemic representation in
this proposal is denoted with ‘/ /’, whereas the acoustic-phonetic/allophonic representation is
denoted with ‘[ ]’.
Hindi /ba/ [ba]
Stimulus Total
duration
without
padding
(ms)
Duration of
consonant
without
padding
(ms)
Duration
of vowel
vowel
(ms)
Total
duration
with
padding
(ms)
Duration
of
prevoicing
(ms)
Duration
of
aspiration
(ms)
VOT
(ms)
Onset
of
vowel
(ms)
/ba/ [ba] 761 113 648 761 - 0 19 113
/pa/ [ pha] 713 201 512 713 - 81 107 199

38
Hindi /pa/ [pa]
Hindi /pha/ [pha]
Figure 1. Waveforms and spectrograms of the three Hindi stimuli are shown. Arrows indicate the
release burst and the onset of vowel, respectively. The release burst for all occurred at 94 ms.
Aspiration occurs between the double arrows. Prevoicing is present for the voiced unaspirated
sound /ba/ (region before the arrow in /ba/).

39
Figure 2 displays waveforms and spectrograms of the English /ba/ [pa] and /pa/ [pha]
stimuli.
English /ba/ [ba]
English /pa/ [pha]
Figure 2. Waveforms (top panel) and spectrograms (lower panel) of the two English stimuli.
Arrows indicate the release burst and the onset of vowel, respectively. The release burst for all
occurred at 94 ms. Aspiration/noise occurs between the double arrows for the voiceless
plosives. Prevoicing is absent for English stimulus used in this study.
In this study, it was essential to extract the effects of the consonants and minimize the
overlap of the responses to the CV stimulus for better identification of the neural signatures of
encoding in the AEP results. Hence, in order to understand the responses to consonants used

40
in the study and their features including voicing and/or aspiration, the electrophysiologic
responses to the vowel must be disentangled from those of the entire CV. This can be done to
some extent by subtracting the electrophysiological response to a vowel segment from its CV
counterpart. Therefore, a vowel-only condition (V) was included in the electrophysiological
testing for each syllable so that the ERP to that vowel-only could be subtracted from the CV
to provide insight on how the overlapping responses are in the ERP to the CV.
Each CV stimulus was segmented to produce the corresponding V-only condition. To
accomplish this, the vowel segment was identified as the duration from the first periodic cycle
of the vowel including the rise time (on the waveform) or from the first voice bar after the
formant transition (on the spectrogram) to stimulus offset. A combination of waveform and
spectrogram was used to identify the vowel segment. The second arrow in the figures above
indicate the onset of vowel and represent the point of segmentation. Once the vowel segment
was identified, the preceding consonant segment was set to zero. The vowel maintained the
same temporal relation to the sampling window as in the original CV. Each Hindi and English
plosive used in the study thus included two stimulus conditions (CV, V).
Four additional stimuli including /ma/, /sa/, /a/, and /va/ were recorded from the
American English talker. The steps involved in recording and in signal processing remained
the same for all stimuli. The speech tokens /ma/ and /sa/ were used for training sessions in the
behavioral tests and the speech tokens /a/ and /va/ were used as foils in some behavioral tests.
Each of the CV stimulus was equalized to rms amplitude (-18 dB). The stimuli were
presented binaurally at 70 dB SPL using insert earphones in two conditions - in quiet and in
background noise. The background noise was presented using a signal-to-noise ratio (SNR) of
0. For noise, the envelope of a four-talker speech babble was extracted and filled with

41
broadband noise (BBN). This approach was selected to have some of the amplitude variations
in the envelope that are present in babble, while avoiding having the content of the noise being
clearly identifiable as belonging to a particular language. According to the linguistic similarity
hypothesis (Brouwer et al., 2012), the more similar a speech masker is to the target speech, the
greater the interference (Mattys et al., 2012). In contrast, there is less interference when
masking noise is presented in a foreign language (Calandruccio, Bradlow, & Dhar, 2014).
Thus, the noise used in this study maintained some of the fluctuations present in speech
babble, while minimizing a linguistic confound.
2.3 PROCEDURE
Testing involved four components: two speech identification tests (test A, test B), one
speech discrimination task, and AEP recording. The order of testing of the four tests remained
the same across participants for all three language groups. For example, all participants
completed speech identification test A first and the AEP recording last.
The behavioral tests were completed first to minimize any familiarization effect from
exposure to the stimuli in the AEP session. Similarly, the open-ended identification test A was
presented first to examine categorization before experiencing the discrimination tasks and the
AEP task. English and Hindi stimuli were presented in separate blocks because mixing these
would be confusing for the participants and lead to difficult-to-interpret results. The order of
presentation of the two languages was counter-balanced, both within participants and across
participants. For example, for participant #1, if Hindi stimuli were presented first for speech
identification task A and for the discrimination task, English stimuli were presented first for the
other two tasks. The quiet and noise conditions were randomly presented within each language.

42
2.3.1 BEHAVIORAL TESTING
The behavioral testing included two speech identification tasks and one speech
discrimination task. The objective of having two different identification tasks was to examine the
differences between phonemic/linguistic processing versus acoustic/phonetic processing.
In identification task A, the participants were instructed to write down the sound or the
syllable that they heard using their native/first language orthographic representation. This was
done to facilitate phonemic processing. For example, the Tamil participants were also fluent
English speakers. So, if the Tamil participants were familiar with voicing as a feature that might
lead to the listener reporting differences between voiced and voiceless syllables, although
voicing is only an allophonic variation in their native language. However, as there is only one
grapheme in Tamil to represent /b/ and /p/, irrespective of whether they heard a /b/ or a /p/, the
participants had to use the only grapheme present in Tamil (ப) to represent both /b/ and /p/ when
they wrote down their response. Hence, native-language phonemic level processing was
encouraged in this task.
In contrast, in task B, all three options were available to the participants and they were
instructed to record their responses to both voicing and aspiration using button press, irrespective
of whether it is present in their language and whether they have a grapheme for it in their
language or not. This task was designed to encourage acoustic/phonetic processing.
Foils were included in identification task A and in the discrimination task. The purpose
of including foils was to check whether the participants responded to the speech sounds
attentively and to make sure they were not completing the tests randomly. Further, all the three
tests included training sessions. Both the training sessions and the foils were designed to
promote the internal validity of the entire study. /ma/ and /sa/ were used for training; whereas

43
/a/ and /va/ were used as foils. The four additional stimuli were chosen specifically because
they are present in all three language groups and they do not share the acoustic characteristics
of the test stimuli (other than the vowel).
2.3.1a SPEECH IDENTIFICATION: TASK A
The Hindi and English CV stimuli were presented to participants in each language group,
in quiet and in noise. The Hindi stimuli and the English stimuli were presented in separate blocks
and behavioral identification performance in quiet and in noise were evaluated in separate runs.
Participants were instructed to write down in their native/first language which stimuli they heard
and indicate the goodness of fit on a 7-point rating scale, with 7 indicating a rating of ‘very good
exemplar’ and 0 indicating a rating of ‘poor exemplar’ (Cebrian, Mora, & Aliaga-Garcia, 2010).
The writing down of the response in their first language was included for two reasons: 1)
to encourage linguistic/phonemic processing; and 2) to permit open set responses. For example,
if a Tamil listener for some reason heard /b/ as /v/, they still had an option to document their
response as /v/ and were not confined to a closed set of responses. However, the forced choice
component in this test was that the listeners had to match the sounds to one of the graphemes
present in their native/first language and to encourage linguistic/phonemic processing in the first
language.
To ensure that participants understand the instructions, they first underwent a short
training session on two stimuli that were not evaluated in the experiment (/ma/ and /sa/). Because
all three language groups have these speech sounds as phonemic contrasts and the phonetics are
similar across the three languages, the participants were predicted to respond ‘6’ or ‘7’ on the
goodness ratings and the percent correct responses were expected to be over 80% (5 out of 6

44
trials to be correct). Verbal feedback was given at the end of the training session. If a participant
performed poorly, the training session was repeated (up to two times).
For the testing portion, each stimulus was presented 10 times (for a total of 50 stimulus
presentations: 3 Hindi stimuli, 2 English stimuli, 10 presentations each). The speech sounds /a/
and /va/, which served as foils, were presented on <10% of the trials (2 /a/ and 2 /va/) in each
block. The identification of Hindi and English stimuli was evaluated in separate blocks. The
order of presentation of the blocks was counterbalanced across participants. In addition,
identification in quiet and in noise was evaluated separately. The goodness ratings were done for
both quiet and noise conditions.
Stimuli were presented using an onset-to-onset interstimulus interval, also referred to as
the stimulus onset asynchrony (SOA) of 3500 ms. The duration of the longest stimulus was 761
ms, which allowed at least 2200 ms after stimulus offset for the participants to write down what
they heard and provide a goodness rating. Longer ISIs beyond 1500 ms have been shown to limit
decisions to phonemic and linguistic processing because the acoustic-phonetic detail decays on
the long interval (Werker & Tees, 1984, Werker & Logan, 1985).
Therefore, the purpose of using a long ISI was to limit decisions to the phonemic level, at
least in quiet, and to provide sufficient time to complete the goodness ratings. Hence listeners,
were predicted to categorize and rate the speech sounds on the basis of their native language
phonemic inventories (Nabelek & Donahue, 1984; Rogers, Lister, Febor, Besing, & Abrams,
2006). The duration of this portion of testing was ~ 10 min [(3500 ms SOA * 5 stimuli * 10
repetitions * 2 conditions) + (3500 ms SOA * 2 foils * 2 repetitions * 2 conditions) = 378000 =
6.3 min + training sessions + instructions + set up].

45
Statistical analysis:
The categorization behavior for each of the five stimuli was analyzed using percent
categorization scores and A’ scores. Further, the orthographic responses for each stimulus were
compiled in labeling matrices to analyze the categorization behavior. Percent categorization
scores and goodness ratings were also analyzed for the five stimuli in both conditions. Percent
categorization for the foil (/a/ and /va/) was also computed. Means and standard deviations were
computed across language groups as a function of stimulus and condition.
The Hindi and English stimuli were analyzed separately. Statistical analyses for the
percent categorization scores and the goodness ratings included mixed model ANOVAs with
group (Hindi, American English, Tamil), and condition (quiet, noise) as factors. Statistical
analysis of A’ scores was done using Kruskal-Wallis test with group (Hindi, American English,
Tamil), and condition (quiet, noise) as factors. For both tests, the results were considered
significant when p < 0.05. The results for goodness ratings were analyzed in separate mixed
model ANOVAs. Post-Hoc Fisher’s Least Square Difference (LSD) analyses were performed on
the statistically significant findings where appropriate. Results were considered significant when
p < 0.05.
2.3.1b SPEECH IDENTIFICATION: TASK B
Participants completed a training session that included six trials. The training session
enabled the researcher to identify whether the participants understood the instructions correctly.
The training stimuli that were used in the previous test (described in 2.3.1a) were used in this test
as well. Participants were instructed to press buttons on a response pad. For example, they were
instructed to press #1 each time they heard a /ma/, #2 for /sa/, and #3 for /a/.

46
Participants were provided with a response pad with buttons labeled with digits indicating
#1, #2, and #3. The response pad was not labeled with the corresponding speech sounds (e.g.,
/ma/, /sa/ for training and /pa/, /ba/, /pha/ for the actual test). This was done to minimize
linguistic/phonemic cues. The participants were requested to respond as quickly and as correctly
as they could. Because the three language groups have these speech sounds as phonemes, the
participants were expected to have at least 5 correct responses out of 6 trials. Verbal feedback
was given at the end of the training session. If a participant performed poorly, the training
session was repeated (up to two times).
The stimuli and the test parameters were similar to the previous test; the only difference
was the instruction provided to participants and the task itself. Participants were provided with a
response pad with buttons labeled with digits indicating #1, #2, and #3. They were instructed to
press a button (one of three) that corresponded to the stimulus perceived (e.g., press button #1 for
/ba/ [ba], #2 for /pa/ [pa], and #3 for /pha/ [pha]). The participants were instructed to respond as
accurately and quickly as possible. Also, even if a sound was not present in their language and
they were not familiar with it, they had to select a response matching the sound to one of the
three sounds based on similarity and best fit and choose a response.
Each stimulus was randomly presented 10 times in each condition. Hindi stimuli and the
English stimuli were tested in separate blocks. Further, the two conditions, including quiet and
noise were also evaluated separately. The order of presentation of the blocks was
counterbalanced across participants. No foil was presented. The onset-to-onset interval was 2000
ms. Estimated duration of the test was ~ 7 min [2000 ms * 5 stimuli * 10 repetitions * 2
conditions = 200000 = 3.3 min + training sessions + instructions + set up].

47
Statistical analysis:
Analysis of identification responses was completed for the English and Hindi sounds in
both conditions for each participant. Means and standard deviations were computed across
language groups as a function of stimulus and condition.
The Hindi and English stimuli were analyzed separately. Statistical analyses included
mixed model ANOVA with group (Hindi, American English, Tamil), condition (quiet, noise),
and stimulus (/ba/, /pa/, and /pha/ for Hindi stimuli; /ba/ and /pa/ for American English stimuli) as
factors. Results were considered significant when p < 0.05. The results for percent categorization
scores and reaction times were analyzed in separate mixed model ANOVAs. Post-Hoc Fisher’s
LSD analyses were done on the statistically significant findings. Results were considered
significant when p < 0.05.
2.3.1c SPEECH DISCRIMINATION TEST
An AXB paradigm was used to evaluate each participant’s ability to discriminate the
stimuli. In an AXB paradigm, the target ‘X’ is equidistant from both ‘A’ and ‘B’. Thus, the load
on memory for the A and B items is more equivalent than for an ABX task, where the “X”
stimulus is further from the A than the B stimulus.
The participants indicated, using response buttons, if ‘X’ was more similar to ‘A’ or to
‘B’. They were instructed to press #1 on the response pad, if ‘X’ was similar to ‘A’; and #3, if it
is similar to ‘B’ as correctly and as quickly as possible. Prior to testing, participants completed a
training session to familiarize them with the task. The session included 5 trials utilizing the
speech stimuli /ma/ and /sa/ that were used for previous training. Verbal feedback was given at
the end of the training session and the participants were expected to get at least 80% correct

48
response (4 out of 5 trials) correct. If the participants had any questions related to the task
involved, they were answered prior to the testing.
For the AXB discrimination task, two tokens per stimulus were used to minimize
acoustic-phonetic processing and to examine phonemic processing; hence, ‘X’ was acoustically
different from ‘A’ and ‘B’ but phonemically similar to either ‘A’ or ‘B’. This was to encourage
linguistic processing rather than a decision based on acoustic similarity. One block was designed
to compare the voicing differences (e.g., /ba/-/pa/), a second for aspiration (e.g., /pa/-/pha/), and a
third block included sounds that differ in both aspiration and voicing (e.g., /ba/-/pha/; see Table 6
below for details). For testing, three blocks (/p/ versus /b/, /p/ versus /ph/, and /ph/versus /b/) were
presented for the Hindi stimuli and one block for the English stimuli (/p/ versus /b/). The
rationale for including three blocks was that in previous study by Aggarwal (2011), the non-
native American English listeners identified Hindi stimuli /p/-/b/ to be similar 15 out of 20 times,
/p/-/ph/ to be similar 3 out of 20 times, and /ph/-/b/ to be similar 0 out of 10 times. Using three
blocks for the Hindi stimuli enabled the identification of assimilation patterns in this study across
language groups and provided potential understanding of how the linguistic background interacts
with noise.
Foil sounds (/a/ and /va/) were presented on ~10% of the trials (2 repetitions of one triad
of foil in each block; refer to table 3). The rationale for including foil/control stimuli was to
identify listeners who may not have understood the task. These foil/control stimuli were expected
to show high accuracy for all participants because all three language groups have the stimulus
contrast in their first language, and this is highly acoustically distinct.
Performance in quiet and in noise were evaluated in separate runs. The order of
presentation of the three blocks and two runs (that include quiet versus noise) were randomized

49
across participants. Similar to the identification tests, the Hindi stimuli and the English stimuli
were presented separately. The permutations that were used in the study for Hindi speech sounds
are shown in Table 6. Permutations similar to block 1 were used for the English speech sounds.
Table 6. Sample of permutations that were used for the discrimination test AXB design. For
Hindi speech sounds three blocks were presented. For English speech sounds the first block was
presented because there are only two categories in English.
Block 1 Block 2 Block 3
Voiced vs. Voiceless
/pa/ /ba/ /ba/
/pa/ /pa/ /ba/
/ba/ /pa/ /pa/
/ba/ /ba/ /pa/
Voiceless vs. Aspiration
/pa/ /pha/ /pha/
/pa/ /pa/ /pha/
/pha/ /pa/ /pa/
/pha/ /pha/ /pa/
Voiced vs. Aspiration
/ba/ /pha/ /pha/
/ba/ /ba/ /pha/
/pha/ /ba/ /ba/
/pha/ /pha/ /ba/
Foil
/a/ /a/ /va/
Foil
/a/ /va/ /va/
Foil
/va/ /va/ /a/
A total of 152 triads was presented. One hundred and twenty-eight triads of stimuli were
presented (4 repetitions per triad * 4 combinations per block * 4 blocks, including 3 for Hindi
stimuli and 1 for English stimuli * 2 conditions) + 16 triads of foil (2 repetitions per triad * 4
blocks including 3 for Hindi stimuli and 1 for English stimuli * 2 conditions). The SOA between
syllables (onset to onset) within each triad was 900 ms. The intertrial interval between each triad
(offset of third syllable to onset of first syllable in next triad) was 2000 ms, similar to the other
behavioral test. The duration of each triad was 3800 ms (900 + 900 + 2000). Estimated duration
of the test was ~ 15 min [3800 ms per triad * 152 triads = 577600 ms = 9.63 min + training
sessions + instructions + set up].

50
Statistical analysis:
Analysis of percent correct responses was completed for the English and Hindi sounds in
both conditions for each participant. Percent correct for the foil (/a/ and /va/) was also computed.
Means and standard deviations were computed across language groups as a function of stimulus
and condition.
The Hindi and English stimuli were analyzed separately. Statistical analyses included
mixed model ANOVA for the Hindi stimuli with group (Hindi, American English, Tamil),
speech contrast (voiced vs. voiceless only, voiceless vs. aspiration, voiced vs. aspiration), and
condition (quiet, noise) as factors and two-way ANOVA for the English stimuli with group
(Hindi, American, Tamil) and condition (quiet, noise) as factors. Results were considered
significant when p < 0.05. Post-Hoc analyses included Fisher’s LSD on the statistically
significant findings. Results were considered significant when p < 0.05.
2.3.2 AUDITORY EVOKED POTENTIAL TESTING
The stimuli for the AEP testing included four English speech sounds (2 CV stimuli /ba/
and /pa/ and the corresponding 2 V-only stimuli described in 2.2) and six Hindi speech sounds (3
CV stimuli /ba/, /pa/, /pha/ and the corresponding 3 V-only stimuli). The stimuli were presented
using Gentask software and a Neuroscan 4.5 system.
Two hundred and seventy-five repetitions of each stimulus were presented in separate
runs. Two hundred and seventy-five repetitions of each stimulus were used in order to balance
the need for clean responses with adequate signal-to-noise ratio, while keeping the testing time
reasonable (around 7 minutes per run). The two English CV stimuli, the three Hindi CV stimuli,

51
and the respective vowel-only (V-only) stimuli were presented in separate blocks. Further, quiet
and noise conditions were randomly presented as separate runs.
The order of presentation of the two languages was counterbalanced across listeners.
Within each language, the order of presentation of the stimuli (CV and V-only) and the
conditions were randomized. The onset-to-onset interval was 1300 ms. This interval was selected
because the longest stimulus is 761 ms and the latency window for the AEP components of
interest including P1, N1, P2 is 75-250 ms. At least 500 ms of offset-to-onset time is preferred to
avoid any overlap in responses to two sequential stimuli, even if the responses are delayed for
some listeners.
The listeners were tested in a double-walled sound attenuated booth and were instructed
to watch a muted closed-captioned video of their choice. The stimuli were presented to the
listeners at 70 dB SPL via EAR-3A insert earphones to both ears. Evoked potentials were
recorded using a NeuroScan system and a 32-channel cap. The electrode cap was placed on the
participant’s head according to International 10-20 system, modified combinatorial nomenclature
(Jasper, 1958; Sharbrough, 1991). An electrode placed at the nose served as reference and the
electrode between FPz and Fz served as ground. Eyeblinks and eye-movements were monitored
using an electrode below the left eye. Electrode impedances were maintained below 5 kOhms.
Breaks were provided as and when required. During data acquisition, the EEG was digitized at a
sampling rate of 1000 Hz, amplified (1000 times) and band-pass filtered (.1-100 Hz with a roll-
off of 6 dB/octave).
The estimated duration of the test was 3.5 hrs (1300 ms * 275 trials * 10 stimuli * 2
conditions = 7150000 ms = 119 min ~ 2 hrs + 1 hr (preparation time to place cap, gel, breaks,
and instruction).

52
Data processing:
Epochs of 1000 ms were extracted from the continuous EEG which included a 100 ms
pre-stimulus interval. Data cleaning was carried out offline. An eyeblink reduction algorithm was
first applied to the EEG (Semlitsch, Anderer, Schuster, & Presslich, 1986). The data was
processed offline by applying baseline correction to the pre-stimulus interval (-100 ms), and
digital filtering (finite impulse response (FIR) filter, 1 to 30 Hz, 12 dB/octave, zero phase shift).
Artifact rejection at +/-100 microvolts was applied to each epoch.
Averaged waveforms were computed for each participant, stimulus, and condition along
with grand mean waveforms for each group. In addition, for each stimulus the averaged response
to the V-only stimulus was subtracted from the response to the CV stimulus to isolate the
response to consonant (C) in the CV condition. This procedure was intended to minimize the
overlap from the response to the vowel. All measurements were performed on both CV and
subtracted (CV-V) waveforms.
The mean global field power (MGFP) from the grand mean waveforms was used to
summarize the data. The largest positive and negative peak in the AEP were seen as positive
peaks in the MGFP. The first step was to identify the peaks of interest from the grand mean
waveforms for each stimulus in each condition using the following strategy: The peak
amplitudes and peak latencies of onset P1, N1, P2, and N2 were measured at FCz, where the
responses were typically largest to auditory stimuli, for each stimulus and condition (Bruneau,
Roux, Guerin, Barthelemy, & Lelord, 1997). When additional peaks were present, selection of
the peak was constrained by inspection of the pattern across all participants. The topography of
the response was also used to select peaks because the AEP show inversion of responses seen at
vertex in inferior posterior regions. Table 7 displays the stimulus and condition in which

53
additional peaks were present. Further, when additional peaks were present the responses were
examined for prominence, latency, and for its relationship with the acoustic properties of
stimulus.
Table 7. List of AEP components that were present across stimuli and condition including the
additional peaks.
Stimulus
and
Language
Condition Responses to CV Stimuli Responses to Subtracted Waveforms
(CV-V)
Hindi /ba/
[ba]
Q P1 N1 N1ii N1iii P2 N2 P1 N1 N1ii N1iii - - P2 N2
N P1 N1 - - P2 N2 P1 N1 - - - - P2 N2
Hindi /pa/
[pa]
Q P1 N1 - - P2 N2 P1 N1 - - - - P2 N2
N P1 N1 - - P2 N2 P1 N1 - - - - P2 N2
Hindi
/pha/ [pha]
Q P1 N1 - - P2 N2 P1 N1 - - - - P2 N2
N P1 N1 - - P2 N2 P1 N1 - - - - P2 N2
English
/ba/ [pa]
Q P1 N1 - - P2 N2 P1 N1 - - - - P2 N2
N P1 N1 - - P2 N2 P1 N1 - - P2i P2ii P2 N2
English
/pa/ [pha]
Q P1 N1 - - P2 N2 P1 N1 - - - - P2 N2
N P1 N1i N1ii N1 P2 N2 P1 N1 - - - - P2 N2
Time windows were then used to identify the peaks in the data from individual
participants. For setting the time windows, the peak latencies were identified on the grand mean
average waveforms. Then, ten percent of that value was used to formulate the time window. For
example, if the latency of P1 for Hindi /pa/ in quiet was 163 ms, then the time window in this

54
case was set to 147-179 ms (163-16 and 163+16). Peak latencies were measured at FCz, rather
than using the GFP because the separate peaks were not always clearly delineated in the GFP.
Further, in the subtracted waveforms (CV-V), the amplitudes were small and often too close to
the noise floor. After identifying the latency of each peak, the GFP amplitude at that latency was
selected for each participant. The T-complex responses were measured at electrode sites T7 and
T8, for each participant, stimulus, and condition. The Na, Ta, Tb, P350 amplitudes were
measured at T7 and T8.
Statistical analysis:
Mean and standard deviations of peak latencies at FCz were computed for each peak
component on the average referenced waveforms (both responses to CV and CV-V, the
subtracted waveforms), across participants as a function of language group, stimulus, and
condition.
The Hindi and English stimuli were analyzed separately. Statistical analyses included
mixed model ANOVA. The comparisons for the Hindi stimuli included group (Hindi, American
English, Tamil), stimulus (/ba/, /pa/, /pha/), and condition (quiet, noise) as factors, and for the
English stimuli, group (Hindi, American, Tamil), stimulus (/ba/, /pa/) and condition (quiet,
noise). For the additional peaks that were present only in certain stimuli (e.g., N1ii and N1iii for
Hindi /ba/ in quiet), one-way ANOVAs were carried out to examine group differences. Results
were considered significant when p < 0.05. Post-Hoc Fisher’s LSD analyses were done on the
statistically significant findings. Results were considered significant when p < 0.05. Further, for
both English and Hindi stimuli, the CV stimuli versus CV-V subtracted waveforms were
analyzed separately.

55
Analysis as a function of electrode site was also performed. Separate analyses were
performed on the measurements from electrode sites T7 and T8 to examine laterality effects (i.e.,
T7 vs T8). The Hindi and English stimuli were analyzed separately. Results were considered
significant when p < 0.05. Post-Hoc Fisher’s LSD analyses were done on the statistically
significant findings. Results were considered significant when p < 0.05.

56
CHAPTER 3: Results

57
The behavioral and evoked potential results will be presented in two sections. The
findings from the two speech identification tests (test A, test B) and one speech discrimination
task will be presented in the behavioral results section. The evoked potentials section will
include the results from the voltage waveforms. Also, the results from the LEAP-Q questionnaire
were analyzed for group differences using analysis of variance. There was no significant
difference in the ages across the three language groups [F(2,45) = 1.072, p = 0.350]. Further, the
data on tables 1-3 from LEAP-Q questionnaire was examined for differences across groups in L1
using mixed analysis of variance and no significant difference was present in their L1
proficiency [F(40,18) = 2.0075, p = 0.056].

58
I. BEHAVIORAL RESULTS
3.1 IDENTIFICATION TASK A- Write the sound heard
Percent categorization scores:
Figure 3 displays the percent categorization scores and the standard errors in response to
Hindi stimuli and American English stimuli, in both the quiet and noise conditions.
Figure 3. Percent categorization scores and standard errors in response to the Hindi and
American English stimuli across language groups in both quiet (Q) and noise (N). Participants
wrote the sound heard orthographically in their native language.
In identification task A, the participants were instructed to write down the speech syllable
that they heard orthographically in their native language. These scores were not addressed as
percent scores, instead as percent categorization scores, because the categories were different

59
based on their linguistic background. For example, Hindi participants had three phonemic
categories, American English participants had two categories, and Tamil had one.
Effects of group:
Responses to Hindi stimuli and English stimuli were analyzed separately. For Hindi
stimuli, Hindi participants had greater percent categorization scores (mean = 73.75%, s.e.=
18.43), relative to American English participants (mean = 57.96%, s.e.= 14.49) and Tamil
participants (mean = 72.30%, s.e.= 18.07). Note that the Tamil participants had only one
orthographic representation for all five stimuli (Hindi /ba/, /pa/, pha/, English /ba/ and /pa/), so
irrespective of whether they perceived the acoustic-phonetic differences across the stimuli or not,
they only had one orthographic representation. However, when errors were made, the stimuli
presented were identified as other phonemes. These findings are presented in the labeling
matrices below.
These findings were supported by results from mixed model analysis of variance
(ANOVA). As the number of response categories across groups were unequal, mixed model
ANOVA only included group and condition as the two factors. Further, responses to Hindi
stimuli and English stimuli were analyzed in separate mixed model ANOVAs. For Hindi stimuli,
there was a significant main effect of group [F(2, 90) = 7.791, p = 0.000, partial eta-squared =
0.147]. Post-hoc LSD test results confirmed that the percent categorization scores were
significantly higher in Hindi and Tamil participants relative to the English participants [Hindi vs
American English: p < 0.05; Hindi vs Tamil: p = 0.743; American English vs Tamil: p < 0.05].
For English stimuli, the opposite pattern was obtained with American English
participants having higher percent categorization scores (mean = 69.77, s.e.= 17.44), relative to

60
Hindi participants (mean = 16.40, s.e.= 4.10). The mean percent categorization scores for Tamil
participants were 70.34% (s.e. = 17.58). On mixed model ANOVA, there was a significant main
effect of group [F(2, 90) = 56.219, p = 0.000, partial eta-squared = 0.555]. Post-hoc results
confirmed that the percent categorization scores were significantly higher in English and Tamil
participants relative to Hindi participants [Hindi vs American English: p < 0.05; Hindi vs Tamil:
p < 0.05; American English vs Tamil: p = 0.371].
Effects of condition:
For Hindi stimuli, the participants had significantly higher percent categorization scores
[F(1, 90) = 33.366, p = 0.000, partial eta-squared = 0.270] in quiet (mean = 78.44%, s.e.= 11.32),
relative to in noise (mean = 57.58%, s.e.= 8.31). This pattern of finding was also consistent in
response to the English stimuli (quiet: mean = 64.13%, s.e.= 9.25; noise: mean = 40.22%, s.e.=
5.80). A significant main effect of condition was present for the English stimuli [F(1, 90) =
25.122, p = 0.000, partial eta-squared = 0.218].
Interactions:
For the Hindi stimuli, there was no significant interaction of group and condition [F(2,
90) = 2.236, p = 0.112]. However, there was a pattern that was observed from the mean values.
In quiet, among non-native listeners, the Tamil participants had higher percent categorization
scores (mean = 87.94%, s.e.= 4.42) relative to American English participants (mean = 64.56%,
s.e.= 4.42); however, in noise, the categorization scores for the Tamil participants (mean =
56.67%, s.e.= 4.42) were similar to American English participants (mean = 51.37%, s.e.= 4.42).
For American English stimuli, the Tamil participants had high percent categorization scores both

61
in quiet (mean = 86.42%, s.e.= 5.84) and noise (mean = 54.27%, s.e.= 5.84), relative to Hindi
participants (quiet: mean = 23.64%, s.e.= 5.84; noise: mean = 9.16%, s.e.= 5.84). Mixed model
ANOVAs could not be used to examine interactions of stimulus in this identification task
because the number of phonemic categories were unequal across the three groups. Instead,
labeling matrices were used to understand the pattern of findings (find results presented below).
A' scores:
Figure 4 displays the A’ scores and the standard errors in response to Hindi stimuli and
American English stimuli, in both the quiet and noise conditions.
Figure 4. A’ scores and standard errors in response to the Hindi and American English stimuli
across language groups in both quiet (Q) and noise (N). Participants wrote the sound heard
orthographically in their native language.

62
A’ prime analysis was done as an additional analysis to examine if the participants
consistently categorized each of the stimulus with a specific speech sound in their native
language. While percent categorization scores were able to tell us how frequently a language
categorized a speech sound with the corresponding speech sounds present in their language, A’
gave us an insight into whether other categories were consistently involved when a stimulus was
presented. For example, when Hindi /pa/ [pa] was presented, the American English participants
identified it as /pa/ using the orthographic representation “p” only 6.88% of the time, hence the
vertical bars for /pa/ appears to be very low in figure 3a. However, this group identified the
Hindi /pa/ [pa] as English /ba/ [pa] 60% of the time. This consistency in categorizing the non-
native speech sound with a specific speech sound that is present in the native language was
examined using A’ analysis. A’ scores vary from 0 - 1. Responses to Hindi stimuli and English
stimuli were analyzed separately.
Hindi /ba/:
Effects of group:
For Hindi /ba/, the mean ranks for Hindi participants on Kruskal-Wallis test was greater
relative to the non-native language groups (Hindi: 72.781, English: 49.078, Tamil: 23.641).
There was a significant main effect of group [H(2, N = 96) = 50.972, p < 0.05]. Post-hoc 2-tailed
t-test results confirmed that the mean ranks for each language group were significantly different
from the other groups [p < 0.05 for all comparisons].

63
Effects of condition:
The mean ranks for Hindi /ba/ were similar in quiet (R: 51.021) and in noise (R: 45.979)
and no significant main effect of condition was observed [H(1, N = 96) = .80447, p = 0.3698].
Hindi /pa/:
Effects of group:
For Hindi /pa/, the mean ranks for Hindi participants on Kruskal-Wallis test was greater
relative to the non-native language groups (Hindi: 70.656, English: 39.125, Tamil: 35.719).
There was a significant main effect of group [H(2, N = 96) = 30.99835, p < 0.05]. Post-hoc test
results confirmed that the mean ranks were significantly higher in Hindi relative to the other
groups [Hindi vs American English and Hindi vs Tamil: p < 0.05; American English vs Tamil: p
= 1.000].
Effects of condition:
The mean ranks for Hindi /pa/ were higher in noise (R: 55.552) relative to in quiet (R:
41.448). There was a significant main effect of condition [H(1, N = 96) = 6.231646, p < 0.05].
Hindi /pha/:
Effects of group:
The mean ranks for Hindi /pha/ were significantly higher [H(2, N = 96) = 41.63697, p <
0.05] in American English participants (R: 68.531), high in Hindi participants (R: 51.797) and
low in Tamil participants (R: 25.172). Post-hoc two tailed t-test results confirmed that the mean
64
ranks for each language group were significantly different from the other groups [p < 0.05 for all
comparisons].
Effects of condition:
The mean ranks for Hindi /pha/ were higher in quiet (R: 56.031) relative to in noise (R:
40.969); this finding was supported statistically and a significant main effect of condition was
present [H(1, N = 96) = 7.408503, p < 0.05].
American English /ba/:
Effects of group:
For English /ba/, the mean ranks were similar across groups (Hindi: 48.484, English:
51.047, Tamil: 45.969). There was no significant main effect of group [H(2, N = 96) = .5754790,
p = .7500].
Effects of condition:
The mean rank for English /ba/ was higher in noise (R: 56.177) relative to in quiet (R:
40.823). There was a significant main effect of condition [H(1, N = 96) = 7.891402, p = .0050].
American English /pa/:
Effects of group:
The mean ranks for English /pa/ were significantly higher [H(2, N = 96) = 28.21003, p <
0.05] in American English participants (R: 67.547), relative to the non-native language groups
(Hindi: 44.328; Tamil: 33.625). Post-hoc two-tailed t-test results confirmed that the mean ranks

65
for American English group were significantly higher relative to the other two groups [Ameri-
can English vs Hindi and American English vs Tamil: p < 0.05; Hindi vs Tamil: p = 0.372].
Effects of condition:
The mean ranks for English /pa/ were similar in quiet (R: 52.927) and in noise (R:
44.073); this finding was supported statistically and no main effect of condition was present
[H(1, N = 96) = 2.75770, p = 0.0968].
Labeling matrices:
Table 8 displays the labeling matrices of Hindi participants with percent categorization
scores in response to both Hindi (H) and American English (AE) stimuli, both in quiet and in
noise.

66
Table 8. Labeling matrices of Hindi participants. AEQ above represents American English
stimuli in quiet, AEN: American English stimuli in noise, HQ: Hindi stimuli in quiet, and HN:
Hindi stimuli in noise. Further, the rows represent the stimuli presented and the column headers
represent the responses that were written in their native languages.
HINDI PARTICIPANTS Orthographic responses written →
Stimuli
↓ ब
(/ba/)
भ
(/bha)
प
(/pa/)
फ
(/pha/)
क
(/ka/)
ड
(/da/)
व
(/va/)
स
(/sa/)
श
(/∫a/)
ह
(/ha/)
ज
(/dza/)
र (/ra/)
अ
(/a/)
AEQ /ba/ [pa] 16.67 0.00 71.53 7.64 0.00 0.00 3.47 0.00 0.00 0.00 0.00 0.00 0.69
/pa/
[pha]
0.63 1.25 30.63 58.13 0.00 0.00 0.63 0.00 3.75 4.38 0.00 0.00 0.63
Stimuli
↓ ब
(/ba/)
भ
(/bha)
प
(/pa/)
फ
(/pha/)
क
(/ka/)
ड
(/da/)
व
(/va/)
स
(/sa/)
श
(/∫a/)
ह
(/ha/)
ज
(/dza/)
र
(/ra/)
अ
(/a/)
AEN /ba/ [pa] 8.33 0.00 75.69 11.11 0.00 0.69 1.39 1.39 0.00 0.69 0.00 0.00 0.69
/pa/
[pha]
0.00 0.00 10.00 22.50 3.13 0.00 0.63 1.88 6.25 53.75 0.00 0.00 1.88
Stimuli
↓ ब
(/ba/)
भ
(/bha)
प
(/pa/)
फ
(/pha/)
क
(/ka/)
ड
(/da/)
व
(/va/)
स
(/sa/)
श
(/∫a/)
ह
(/ha/)
ज
(/dza/)
र (/ra/)
अ
(/a/)
HQ /ba/ [ba] 92.36 0.69 2.08 0.69 0.00 0.00 4.17 0.00 0.00 0.00 0.00 0.00 0.00
/pa/ [pa] 8.13 0.00 85.63 5.00 0.00 0.00 1.25 0.00 0.00 0.00 0.00 0.00 0.00
/pha/
[pha]
0.57 0.57 22.73 70.45 0.00 0.00 0.00 0.00 0.00 5.68 0.00 0.00 0.00
Stimuli
↓ ब
(/ba/)
भ
(/bha)
प
(/pa/)
फ
(/pha/)
क
(/ka/)
ड
(/da/)
व
(/va/)
स
(/sa/)
श
(/∫a/)
ह
(/ha/)
ज
(/dza/)
र (/ra/)
अ
(/a/)
HN /ba/ [ba] 79.17 0.69 0.69 0.00 0.00 0.00 18.06 0.00 0.00 1.39 0.00 0.00 0.00
/pa/ [pa] 15.63 0.00 76.88 0.63 0.00 0.00 6.88 0.00 0.00 0.00 0.00 0.00 0.00
/pha/
[pha]
0.57 6.25 5.68 37.50 5.11 0.00 0.00 0.00 1.70 42.05 0.00 0.00 1.14
The identification of the Hindi stimuli was typical of native listeners. They identified the
Hindi /ba/, /pa/, and /pha/ stimuli with their respective graphemes 92.36%, 85.63%, and 70.45%
of the time. However, in noise, the native Hindi participants identified /ba/ as /va/ 18.06% of the
time and Hindi /pha/ as /ha/ 42.05% of the time. In response to English stimuli in quiet (AEQ)
and in noise (AEN), the Hindi participants identified English /ba/ as /pa/ 71.53% of the time and
they identified English /pa/ as /pha/ 58.13% of the time. These findings indicate that the Hindi

67
participants categorize the American English /ba/ [pa] into their phonetic category of /pa/ [pa]
and the American English /pa/ [pha] as Hindi /pha/ [pha]. In noise, the English /ba/ was still
perceived by Hindi participants as /pa/ 75.69% of the time; hence, the category of perception
remained the same in quiet and in noise. However, the English /pa/ was categorized as /ha/
53.75% of the time in noise. Table 9 presents the labeling matrices for American English
participants for both Hindi and English stimuli, in quiet and in noise.

68
Table 9. Labeling matrices of American English participants. AEQ above represents American
English stimuli in quiet, AEN: American English stimuli in noise, HQ: Hindi stimuli in quiet, and
HN: Hindi stimuli in noise. Further, the rows represent the stimuli presented and the column
headers represent the responses that were written in their native languages.
AMERICAN ENGLISH PARTICIPANTS Orthographic responses written →
Stimuli
↓
ba
(/ba/)
pa
(/pa/)
ka
(/ka/)
va
(/va/)
fa
(/fa/)
za
(/za/)
sa
(/sa/)
ha
(/ha/)
ra
(/ra/)
a
(/a/)
AEQ /ba/
[pa]
65.28 4.86 0.00 15.97 13.89 0.00 0.00 0.00 0.00 0.00
/pa/
[pha]
0.63 99.38 0.00 0.00 0.00 0.00 0.00 0.00 0.00 0.00
Stimuli
↓
ba
(/ba/)
pa
(/pa/)
ka
(/ka/)
va
(/va/)
fa
(/fa/)
za
(/za/)
sa
(/sa/)
ha
(/ha/)
ra
(/ra/)
a
(/a/)
AEN /ba/
[pa]
56.94 6.25 0.00 20.14 16.67 0.00 0.00 0.00 0.00 0.00
/pa/
[pha]
0.00 57.50 0.00 0.00 0.00 0.00 0.63 24.38 0.00 17.50
Stimuli
↓
ba
(/ba/)
pa
(/pa/)
ka
(/ka/)
va
(/va/)
fa
(/fa/)
za
(/za/)
sa
(/sa/)
ha
(/ha/)
ra
(/ra/)
a
(/a/)
HQ /ba/
[ba]
86.81 0.00 0.00 13.19 0.00 0.00 0.00 0.00 0.00 0.00
/pa/
[pa]
60.00 6.88 0.00 20.00 13.13 0.00 0.00 0.00 0.00 0.00
/pha/
[pha]
0.00 100.00 0.00 0.00 0.00 0.00 0.00 0.00 0.00 0.00
HN Stimuli
↓
ba
(/ba/)
pa
(/pa/)
ka
(/ka/)
va
(/va/)
fa
(/fa/)
za
(/za/)
sa
(/sa/)
ha
(/ha/)
ra
(/ra/)
a
(/a/) /ba/
[ba]
64.58 0.69 0.00 34.03 0.00 0.00 0.00 0.69 0.00 0.00
/pa/
[pa]
62.50 10.00 0.00 18.75 8.75 0.00 0.00 0.00 0.00 0.00
/pha/
[pha]
0.57 79.55 5.11 0.00 0.57 0.00 0.00 5.68 0.00 8.52
The American English participants categorized both Hindi /ba/ [ba] and Hindi /pa/ [pa] as
English /ba/ and they identified the Hindi /pha/ [pha] as English /pa/ [pha] 100% of the time.
These categories of identification remained the same in noise. Similar to Hindi participants, they
also identified Hindi /ba/ as /va/, 13.19% of the time in quiet and 34.03% of the time in noise.
The responses to American English stimuli were typical as expected for native listeners.
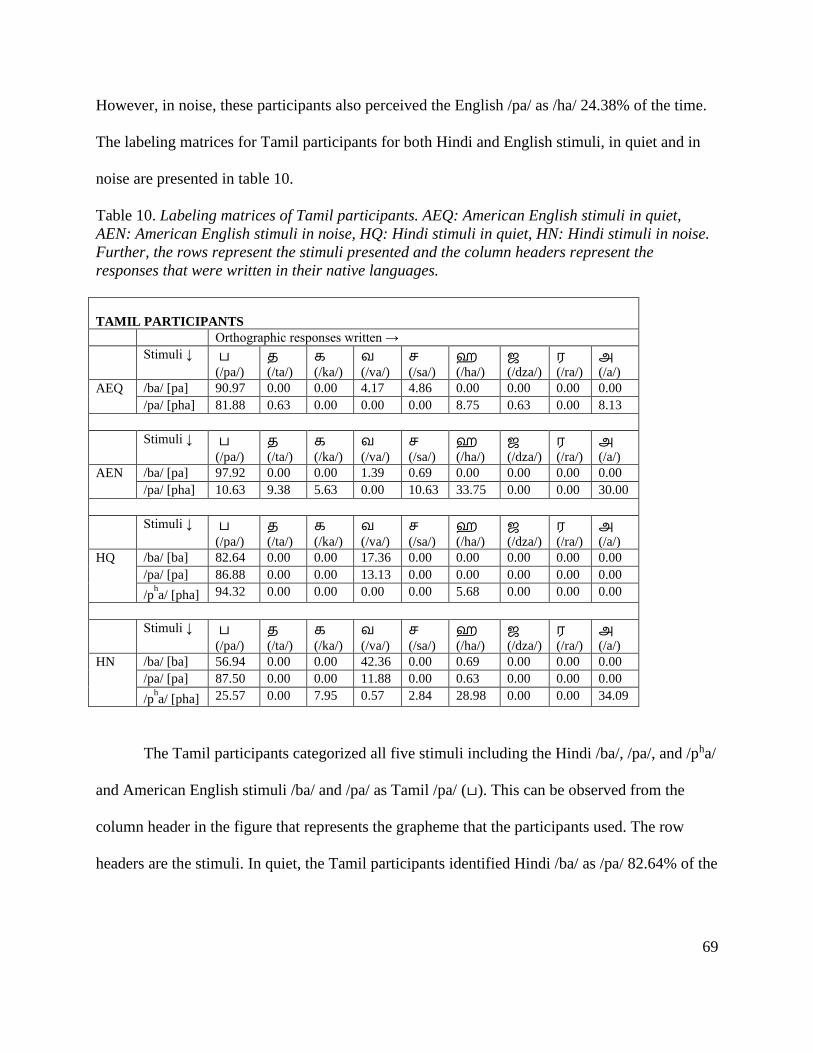
69
However, in noise, these participants also perceived the English /pa/ as /ha/ 24.38% of the time.
The labeling matrices for Tamil participants for both Hindi and English stimuli, in quiet and in
noise are presented in table 10.
Table 10. Labeling matrices of Tamil participants. AEQ: American English stimuli in quiet,
AEN: American English stimuli in noise, HQ: Hindi stimuli in quiet, HN: Hindi stimuli in noise.
Further, the rows represent the stimuli presented and the column headers represent the
responses that were written in their native languages.
TAMIL PARTICIPANTS Orthographic responses written →
Stimuli ↓ ப
(/pa/)
த
(/ta/)
க
(/ka/)
வ
(/va/)
ச
(/sa/)
ஹ
(/ha/)
ஜ
(/dza/)
ர
(/ra/)
அ
(/a/)
AEQ /ba/ [pa] 90.97 0.00 0.00 4.17 4.86 0.00 0.00 0.00 0.00
/pa/ [pha] 81.88 0.63 0.00 0.00 0.00 8.75 0.63 0.00 8.13
Stimuli ↓ ப
(/pa/)
த
(/ta/)
க
(/ka/)
வ
(/va/)
ச
(/sa/)
ஹ
(/ha/)
ஜ
(/dza/)
ர
(/ra/)
அ
(/a/)
AEN /ba/ [pa] 97.92 0.00 0.00 1.39 0.69 0.00 0.00 0.00 0.00
/pa/ [pha] 10.63 9.38 5.63 0.00 10.63 33.75 0.00 0.00 30.00
Stimuli ↓ ப
(/pa/)
த
(/ta/)
க
(/ka/)
வ
(/va/)
ச
(/sa/)
ஹ
(/ha/)
ஜ
(/dza/)
ர
(/ra/)
அ
(/a/)
HQ /ba/ [ba] 82.64 0.00 0.00 17.36 0.00 0.00 0.00 0.00 0.00
/pa/ [pa] 86.88 0.00 0.00 13.13 0.00 0.00 0.00 0.00 0.00
/pha/ [pha] 94.32 0.00 0.00 0.00 0.00 5.68 0.00 0.00 0.00
Stimuli ↓ ப
(/pa/)
த
(/ta/)
க
(/ka/)
வ
(/va/)
ச
(/sa/)
ஹ
(/ha/)
ஜ
(/dza/)
ர
(/ra/)
அ
(/a/)
HN /ba/ [ba] 56.94 0.00 0.00 42.36 0.00 0.69 0.00 0.00 0.00
/pa/ [pa] 87.50 0.00 0.00 11.88 0.00 0.63 0.00 0.00 0.00
/pha/ [pha] 25.57 0.00 7.95 0.57 2.84 28.98 0.00 0.00 34.09
The Tamil participants categorized all five stimuli including the Hindi /ba/, /pa/, and /pha/
and American English stimuli /ba/ and /pa/ as Tamil /pa/ (ப). This can be observed from the
column header in the figure that represents the grapheme that the participants used. The row
headers are the stimuli. In quiet, the Tamil participants identified Hindi /ba/ as /pa/ 82.64% of the

70
time, Hindi /pa/ as /pa/ 86.88% of the time, and Hindi /pha/ as /pa/ 94.32% of the time because
they only had one phonemic category and its corresponding graphemic representation in Tamil.
The Hindi /ba/ was also identified as /va/ 17.36% of the time and Hindi /pa/ as /va/
13.13% of the time. However, the Hindi /pha/ was never identified as /va/ (0% of the time),
instead as /pa/ 94.32% of the time and as /ha/ 5.68% of the time. In noise, they identified the
Hindi /ba/ as /pa/ 56.94% of the time and as /va/ 42.36% of the time. Also, they identified Hindi
/pa/ as /pa/ 87.50% of the time and as /va/ 11.88% of the time. /pha/ in contrast was identified as
/pa/ only 25.57% of the time, it was instead identified as /ha/ 28.98% of the time and as /a/
34.09% of the time.
For the American English stimuli, the Tamil participants identified American English /ba/
as /pa/ 90.97% of the time and the American English /pa/ as /pa/ 81.88% of the time. In noise,
these participants identified the English /ba/ as /pa/ 97.92% of the time. However, their
identification of English /pa/ as /pa/ was lower (10.63%). They instead identified the English /pa/
as /ha/ 33.75% of the time, as /a/ 30% of the time, /ta/ 9.38% of the time, and as /sa/ 10.63% of
the time.
Goodness ratings:
For the identification task A, the participants were asked to write the goodness of each
speech sound heard on a 7-point rating scale with 1 being ‘poor’ and 7 being ‘good’. The
goodness ratings were at ceiling and remained above a score of 6 out of 7 for all groups and all
conditions. The goodness ratings obtained in identification task A are shown in figure 5.

71
Figure 5. Goodness ratings on 7-point rating scale and standard errors in response to the Hindi
(left) and American English (right) stimuli across the three language groups in both quiet and
noise.
Effects of group:
For the Hindi stimuli, the mean rating for Hindi participants were 6.67 (s.e. = 1.66). It
was similar for non-native listeners including English participants (mean = 6.71, s.e. = 1.67) and
Tamil participants (mean = 6.87, s.e. = 1.71). There were no significant differences as a function
of group [F(2, 90) = 2.76, p = 0.068]. For the English stimuli, the mean rating for Hindi
participants were slightly lower (mean = 6.51, s.e.= 1.62), relative to native American English
participants (mean = 6.74, s.e.= 1.68) and non-native Tamil participants (mean = 6.82, s.e.=
1.70). There was a significant main effect of group for the mean ratings of American English

72
stimuli [F(2, 90) = 6.16, p = 0.003, partial eta-squared = 0.120]. Post-hoc Fisher’s LSD
confirmed that the ratings of Hindi participants were significantly lesser relative to the other two
groups [Hindi vs American English: p < 0.05; Hindi vs Tamil: p < 0.05; American English vs
Tamil: p = 0.371].
Effects of condition:
For Hindi stimuli, the mean ratings were slightly higher in quiet (mean = 6.80, s.e.=
0.98), relative to in noise (mean = 6.71, s.e.= 0.96). This pattern of finding was also consistent in
response to English stimuli (quiet: mean = 6.71, s.e.= 0.96; noise: mean = 6.68, s.e.= 0.96).
However, these findings were not statistically significant [Hindi stimuli: F(1, 90) = 1.29, p =
0.258; American English stimuli: F(1, 90) = 0.19, p = 0.667)].
Interactions:
No significant interactions of group or condition were present for both Hindi and English
stimuli.
3.2 IDENTIFICATION TASK B: Button press performance
In identification task B, the participants were presented with speech sounds and they were
instructed to press one of the three buttons, e.g., #1 for /ba/, #2 for /pa/, and #3 for /pha/, as
correctly and as quickly as possible.
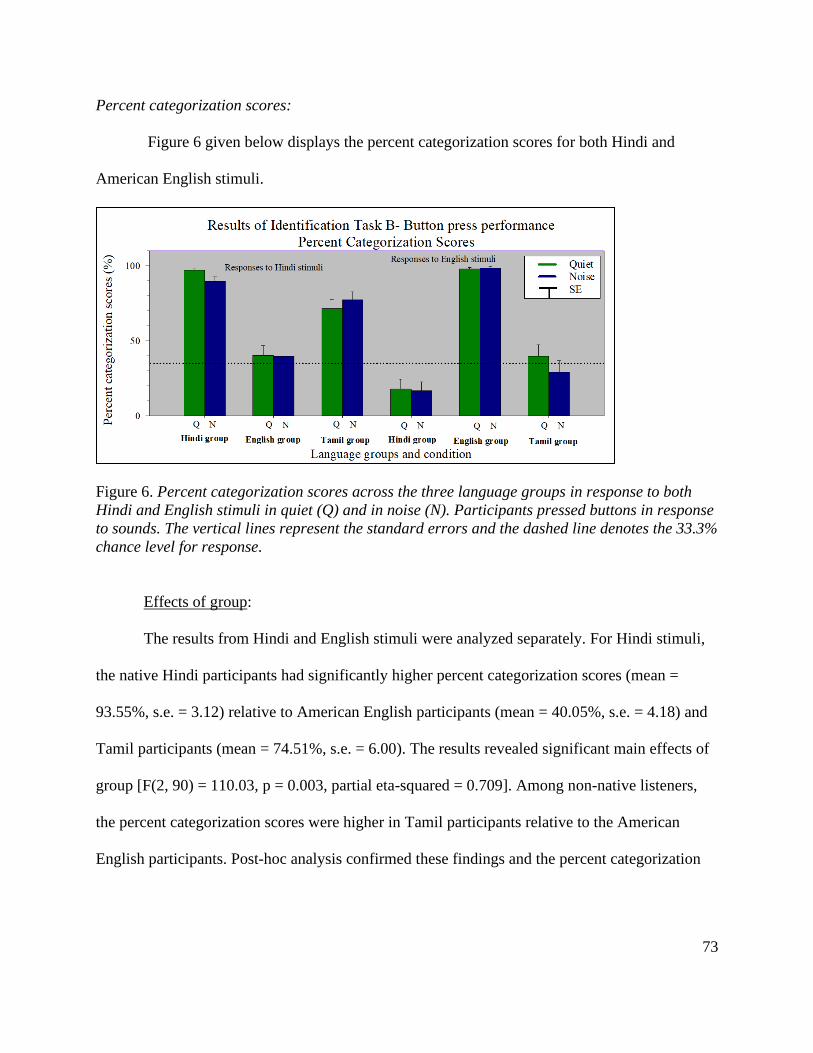
73
Percent categorization scores:
Figure 6 given below displays the percent categorization scores for both Hindi and
American English stimuli.
Figure 6. Percent categorization scores across the three language groups in response to both
Hindi and English stimuli in quiet (Q) and in noise (N). Participants pressed buttons in response
to sounds. The vertical lines represent the standard errors and the dashed line denotes the 33.3%
chance level for response.
Effects of group:
The results from Hindi and English stimuli were analyzed separately. For Hindi stimuli,
the native Hindi participants had significantly higher percent categorization scores (mean =
93.55%, s.e. = 3.12) relative to American English participants (mean = 40.05%, s.e. = 4.18) and
Tamil participants (mean = 74.51%, s.e. = 6.00). The results revealed significant main effects of
group [F(2, 90) = 110.03, p = 0.003, partial eta-squared = 0.709]. Among non-native listeners,
the percent categorization scores were higher in Tamil participants relative to the American
English participants. Post-hoc analysis confirmed these findings and the percent categorization

74
scores were significantly different for all three groups [p < 0.05 for all the comparisons, e.g.,
Hindi vs American English, Hindi vs American English, American English vs Tamil].
For American English stimuli, the native English participants had significantly higher
percent categorization scores (mean = 98.41%, s.e. = 1.14), relative to Hindi (mean = 17.44%,
s.e. = 8.97) and Tamil participants (mean = 34.59%, s.e. = 10.76) and this finding was
statistically significant [F(2, 180) = 109.63, p = 0.000, partial eta-squared = 0.549]. Post-hoc
results supported these observations that the percent categorizations scores were significantly
different in the three language groups [p < 0.05 for all the comparisons].
Effects of condition:
For the Hindi stimuli, the participants had similar [F(1, 270) = 0.122, p = 0.726] mean
percent categorization scores in quiet (mean = 69.83%, s.e.= 3.38) and in noise (mean = 68.92%,
s.e.= 5.49). For American English stimuli, even though the mean categorization scores were
slightly greater in quiet (mean = 52.02%, s.e.= 7.14), relative to in noise (mean = 48.27%, s.e.=
6.77), this difference was not statistically significant [F(1, 180) = 0.634, p = 0.426].
Effects of stimulus:
For Hindi stimuli, the percent categorization scores were highest in response to /ba/
(mean = 97.36%, s.e.= 1.60), high to /pa/ (mean = 62.75%, s.e.= 4.35) and low to /pha/ (mean =
48.01%, s.e.= 7.36). There was a significant main effect of stimulus [F(2, 270) = 126.38, p =
0.000, partial eta-squared = 0.483]. Post-hoc results supported these observations and
categorization scores were significantly different for the three stimuli [p < 0.05 for /ba/, /pa/, and
for /pha/]. For American English stimuli, the mean percent categorization scores were slightly

75
higher for /pa/ (mean = 52.97%, s.e.= 7.21) relative to /ba/ (mean = 47.30%, s.e.= 6.70).
However, this finding was not statistically significant [F(1, 180) = 1.4515, p = 0.229].
Interactions:
For Hindi stimuli, a significant interaction of group x stimulus was present [F(4, 270) =
50.293, p = 0.000, partial eta-squared = 0.426]. For example, the percent categorization scores
were high (above 90%) in native Hindi participants irrespective of the stimulus (/ba/: mean =
97.24%, s.e.= 3.90; /pa/: mean = 92.74%, s.e.= 3.90; /pha/: mean = 90.65%, s.e.= 3.90).
However, in non-native listeners, including English participants and Tamil participants, the
percent categorization scores were high (above 90%) only in response to Hindi /ba/ (English
participants: mean = 96.35, s.e.= 3.90; Tamil participants: mean = 98.47, s.e.= 3.90).
In American English participants, the percent categorization scores were low for Hindi
/pa/ (mean = 8.01%, s.e.= 3.90) and Hindi /pha/ (mean = 15.80%, s.e.= 3.90). It appeared that the
American English participants heard Hindi /pa/ as [ba] or [pha]. Further, both the non-native
language groups selected [pa] when they heard Hindi /pha/.
Hence, to understand the patterns of categorization, the percent categorization scores for
each stimulus were analyzed for each language group. Figures 7-8 display the detailed results of
identification task B to Hindi stimuli (figure 7) and to English stimuli (figure 8). The x-axis
represents the three options on the response pad and the y-axis their percent categorization
scores. The first figure on the left shows the results from Hindi participants, the middle from
American English participants, and the right most displays the results from Tamil participants.

76
Figure 7. Detailed analysis of percent categorization scores across the three language groups
(H, AE, T) in response to Hindi stimuli in quiet and in noise. The x-axis represents the response
categories that were present in the three-choice closed set response pad. The vertical lines
represent the standard errors and the dashed line denotes the 33.3% chance level for response.
Figure 8. Detailed analysis of percent categorization scores across the three language groups
(H, AE, T) in response to American English stimuli in quiet and in noise. The x-axis represents
the response categories that were present in the three-choice closed set response pad. The
vertical lines represent the standard errors and the dashed line denotes the 33.3% chance level
for response.
From figure 7, it appears that the American English participants categorized the Hindi
/pa/ as /ba/ (in quiet: mean 50.69%, s.e. = 11.00; in noise: mean = 76.63%, s.e. = 7.90) and Hindi
/pha/ as /pa/ (in quiet: mean 83.60%, s.e. = 5.45; in noise: mean = 81.71%, s.e. = 7.37).
In Tamil participants, the percent categorization scores were low for Hindi /pha/ (mean =
37.56%, s.e.= 3.90). Figure 7 shows that these participants identified Hindi /pha/ as /pa/ (in quiet:

77
mean 62.26%, s.e. = 10.44; in noise: mean = 44.10%, s.e. = 11.63). The findings from post-hoc
LSD test supported these findings. A significant interaction of group x stimulus was present [p <
0.05] for percent categorization scores in American English participants for Hindi /pa/ and /pha/
and for Tamil participants for Hindi /pha/.
From figure 8, it appears that the Hindi participants categorized the English /ba/ [pa] as
/pa/ (in quiet: mean = 83.44%, s.e. = 8.59; in noise: mean = 79.69%, s.e. = 8.32) and English /pa/
as /pha/ (in quiet: mean 80.47%, s.e. = 10.01; in noise: mean = 80.21%, s.e. = 10.00). The Tamil
participants identified the English /ba/ as /pa/ (in quiet: mean 69.17%, s.e. = 9.72; in noise: mean
= 74.10%, s.e. = 10.24) but had difficulty categorizing English /pa/ as they no specific pattern
that was observed. For American English stimuli, no significant interactions were present in the
percent categorization scores.
Mean reaction times:
Figure 9 displays the mean reaction times for both Hindi and American English stimuli.
Figure 9. Mean reaction times across language groups to Hindi and English stimuli in quiet (Q)
and in noise (N).
78
Effects of group:
The results from Hindi and English stimuli were analyzed separately. For Hindi stimuli,
the native Hindi listeners had shorter reaction times (mean = 792 ms, s.e. = 27.05) relative to
American English participants (mean = 857.5 ms, s.e. = 29.29) and Tamil participants (mean =
842.40, s.e. = 48.74); this finding was statistically significant [F(2, 270) = 4.651, p = 0.010,
partial eta-squared = 0.033]. Post-hoc analysis supported this finding with significantly shorter
reaction times in the native Hindi participants relative to the other two language groups [p <
0.05]. For the American English stimuli, the mean reaction times were similar [F(2, 180) =
0.487, p = 0.615] in all the three language groups (English participants: mean = 756.55 ms, s.e.=
17.44; Hindi participants: mean = 777.77 ms, s.e.= 18.49; Tamil participants: mean = 783.16 ms,
s.e.= 24.80).
Effects of condition:
For Hindi stimuli, the participants had similar [F(2, 270) = 0.263, p = 0.608] mean
reaction times in quiet (mean = 835.30, s.e.= 40.70) and in noise (mean = 825.90 ms, s.e.=
29.36). For American English stimuli, the mean reaction times were significantly shorter in quiet
(mean = 736.44 ms, s.e.= 13.70), relative to in noise (mean = 808.55 ms, s.e.= 18.60). There was
a main effect of condition for the American English stimuli [F(1, 180) = 9.592, p = 0.002, partial
eta-squared = 0.505].
Effects of stimulus:
For Hindi stimuli, the mean reaction times were shorter in response to /ba/ (mean =
787.20 ms, s.e.= 32.22) relative to /pa/ (mean = 862.92 ms, s.e.= 35.76) and /pha/ (mean =

79
841.66, s.e.= 37.08). There was a significant main effect of stimulus [F(2, 270) = 6.030, p =
0.002, partial eta-squared = 0.042]. Post-hoc testing supported these observations that the
reaction times for Hindi /ba/ were significantly shorter relative to the other two stimuli [/ba/ vs
/pa/ and /ba/ vs /pha/: p < 0.05 for both comparisons; /pa/ vs /pha/: p = 0.345]. For American
English stimuli, the mean reaction times to English /ba/ were slightly longer (mean = 791.54 ms,
s.e.= 13.56), relative to English /pa/ (mean = 753.45 ms, s.e.= 19.22). However, this finding was
not statistically significant [F(1, 180) = 2.676, p = 0.103].
Interactions:
No significant interactions of group, condition, or stimulus were present for both Hindi
and English stimuli. However, there was a pattern in finding with longer reaction times for non-
native speech sounds relative to native speech sounds, specifically in noise. For example, the
mean reaction times for Hindi participants were longest for the American English stimuli in
noise condition (mean RT = 824.47 ms, s.e.= 35.99).
3.3 DISCRIMINATION TASK
An AXB paradigm was used to evaluate each participant’s ability to discriminate the
stimuli. The participants were instructed to respond as correctly and as quickly as possible using
the button press performance. A total of four blocks were analyzed (three blocks for Hindi
stimuli: one for voicing contrast /ba/-/pa/, second for aspiration contrast /pa/-/pha/, third for
voicing and aspiration contrast /ba/-/pha/, and the fourth block was American English stimuli:
voicing contrast /ba/-/pa/).

80
Percent correct scores:
Figure 10 shows the percent correct scores for both the Hindi and English stimuli in all
language groups, in both quiet and noise condition.
Figure 10. Mean correct discrimination scores across language groups for both Hindi (H-VOIC:
Hindi voicing contrast, H-ASP: Hindi aspiration contrast, H-VOIC&ASP: Hindi voicing and
aspiration contrast) and English stimuli (AE-VOIC: American English stimuli voicing contrast)
in quiet (Q) and in noise (N). The vertical lines represent the standard errors.
81
Effects of group:
For the Hindi stimuli, the native Hindi listeners had greater percent categorization scores
(mean = 92.75%, s.e. = 1.61) relative to American English participants (mean = 85.00%, s.e. =
2.67) and Tamil participants (mean = 91.31%, s.e. = 1.69). A significant main effect of group
was present [F(2, 270) = 5.614, p = 0.004, partial eta-squared = 0.039]. Post-hoc testing
supported these observations with significantly lower percent categorization scores in American
English participants relative to the other two language groups [American English vs Hindi and
American English vs Tamil: p < 0.05 for both comparisons; Hindi vs Tamil: p = 0.560].
For American English stimuli, both native (American English language group) and non-
native listeners (Hindi and Tamil language groups) had similar mean percent discrimination
scores (English participants: mean = 79.80%, s.e.= 2.46; Hindi participants: mean = 81.81%,
s.e.= 2.21; Tamil participants: mean = 72.66%, s.e.= 3.00). No significant effect of group was
present [F(2, 90) = 1.658, p = 0.196].
Effects of condition:
For Hindi stimuli, the participants had similar mean percent discrimination scores in quiet
(mean = 89.25%, s.e.= 1.59) and in noise (mean = 90.13%, s.e.= 1.33). For American English
stimuli, the mean percent discrimination scores were significantly higher in quiet (mean =
82.76%, s.e.= 6.89), relative to in noise (mean = 73.42%, s.e.= 6.11). These findings were
statistically significant [F(1, 90) = 4.692, p = 0.032, partial eta-squared = 0.049].

82
Effects of stimulus:
For Hindi stimuli, the percent correct discrimination scores were slightly lower for
voicing contrast (/ba/-/pa/: mean = 83.89%, s.e.= 3.15), relative to the other two contrasts
(aspiration /pa/-/pha/: mean = 92.23%, s.e.= 2.03, voicing-aspiration /ba/-/pha/: mean = 92.95%,
s.e.= 2.08). This finding was statistically significant [F(2, 270) = 8.389, p =0.000, partial eta-
squared = 0.058]. Post-hoc testing revealed that the percent correct discrimination scores for the
voicing contrast (/ba/-/pa/) was significantly lower [p < 0.05] relative to scores for aspiration
contrast (/pa/-/pha/) and voicing-aspiration contrast (/ba/-/pha/). However, the percent correct
discrimination scores for the aspiration contrast was not statistically different from the scores for
the voicing-aspiration contrast [p = 0.769]. For the English stimuli, the mean percent
discrimination scores for the voicing contrast (i.e., English /ba/ versus English /pa/) was 78.09
(s.e. = 2.24). There was only one speech contrast for the American English stimuli including the
/ba/-/pa/. Hence, as described in the method section, for the analysis of responses to American
English stimuli only a two-factor mixed model ANOVA was done with group and condition as
the factors.
Interactions:
For both Hindi and English stimuli, there were no significant interactions of group,
condition, or stimulus. However, for Hindi stimuli the American English participants had the
lowest mean percent discrimination scores for the voicing contrast (mean = 74.27%, s.e.= 3.01),
relative to the other two contrasts (aspiration contrast: mean = 90.07%, s.e.= 3.01; voicing-
aspiration contrast: mean = 90.67%, s.e.= 3.01).

83
Mean reaction times:
Figure 11 shows the mean reaction times for both the Hindi and English stimuli in all
language groups, in both quiet and noise condition.
Figure 11. Mean reaction times in AXB paradigm for the three language groups in response to
both Hindi (H-VOIC: Hindi voicing contrast, H-ASP: Hindi aspiration contrast, H-VOIC&ASP:
Hindi voicing and aspiration contrast) and English stimuli (AE-VOIC: American English stimuli
voicing contrast) in quiet (Q) and in noise (N). The vertical lines represent the standard errors.

84
Effects of group:
For Hindi stimuli, the mean reaction times were longest (mean = 849.83 ms, s.e. = 19.63)
in American English participants relative to Hindi participants (mean = 763.92 ms, s.e. = 24.99)
and Tamil participants (mean = 747.94 ms, s.e. = 23.40) and these findings were statistically
significant [F(2, 270) = 8.508, p = 0.000, partial eta-squared = 0.059]. Post-hoc testing indicated
that the American English participants had significantly longer reaction times relative to the
other two language groups [American English vs Hindi and American English vs Tamil: p < 0.05
for both comparisons; Hindi vs Tamil: p = 0.548].
For the American English stimuli, the mean reaction time for Hindi participants was
851.96 ms (s.e. = 20.25), for American English participants was 921.04 ms (s.e. = 22.37) and for
Tamil participants was 920.26 (s.e. = 25.82). There was no significant main effect of language
group [F(2, 90) = 1.429, p = 0.244].
Effects of condition:
For Hindi stimuli, the participants had similar mean reaction times in quiet (mean =
779.89 ms, s.e.= 14.94) and in noise (mean = 794.58 ms, s.e.= 16.05). These findings were not
statistically significant [F(1, 270) = 0.458, p = 0.498]. For American English stimuli, the mean
reaction time was slightly shorter in quiet (mean = 851.68 ms, s.e.= 70.97), relative to in noise
(mean = 943.83 ms, s.e.= 78.65). These findings were statistically significant [F(1, 90) = 5.768, p
= 0.018, partial eta-squared = 0.060].
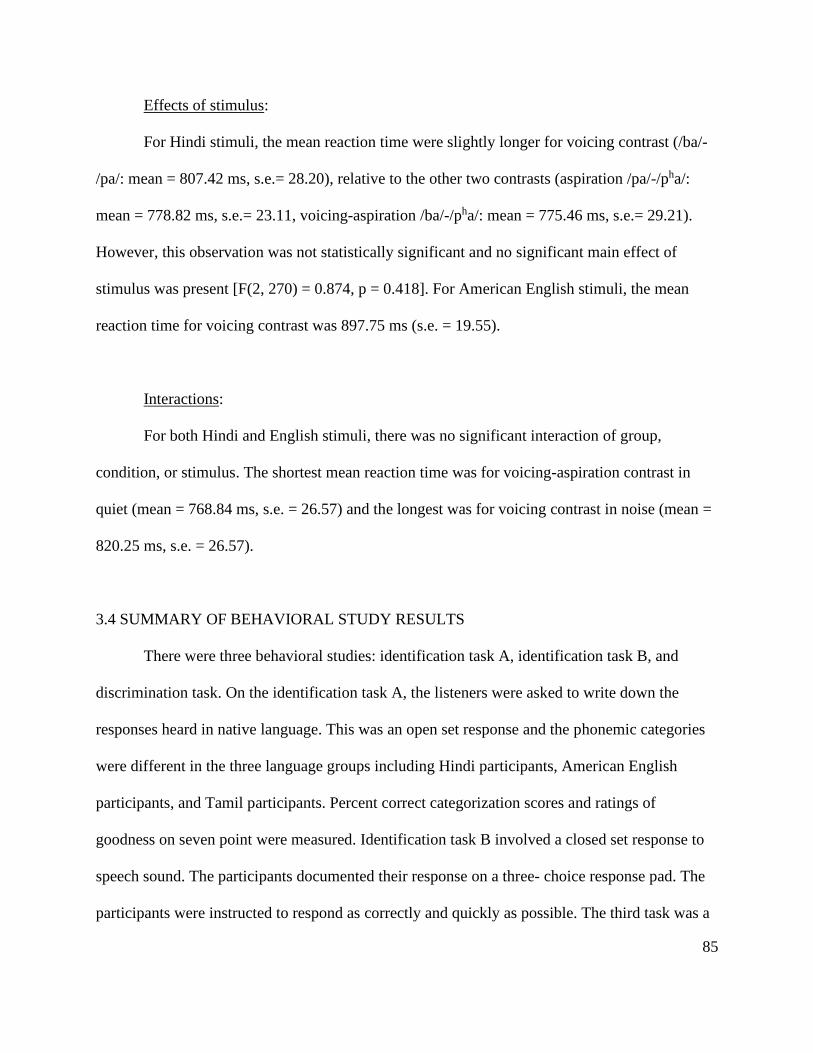
85
Effects of stimulus:
For Hindi stimuli, the mean reaction time were slightly longer for voicing contrast (/ba/-
/pa/: mean = 807.42 ms, s.e.= 28.20), relative to the other two contrasts (aspiration /pa/-/pha/:
mean = 778.82 ms, s.e.= 23.11, voicing-aspiration /ba/-/pha/: mean = 775.46 ms, s.e.= 29.21).
However, this observation was not statistically significant and no significant main effect of
stimulus was present [F(2, 270) = 0.874, p = 0.418]. For American English stimuli, the mean
reaction time for voicing contrast was 897.75 ms (s.e. = 19.55).
Interactions:
For both Hindi and English stimuli, there was no significant interaction of group,
condition, or stimulus. The shortest mean reaction time was for voicing-aspiration contrast in
quiet (mean = 768.84 ms, s.e. = 26.57) and the longest was for voicing contrast in noise (mean =
820.25 ms, s.e. = 26.57).
3.4 SUMMARY OF BEHAVIORAL STUDY RESULTS
There were three behavioral studies: identification task A, identification task B, and
discrimination task. On the identification task A, the listeners were asked to write down the
responses heard in native language. This was an open set response and the phonemic categories
were different in the three language groups including Hindi participants, American English
participants, and Tamil participants. Percent correct categorization scores and ratings of
goodness on seven point were measured. Identification task B involved a closed set response to
speech sound. The participants documented their response on a three- choice response pad. The
participants were instructed to respond as correctly and quickly as possible. The third task was a
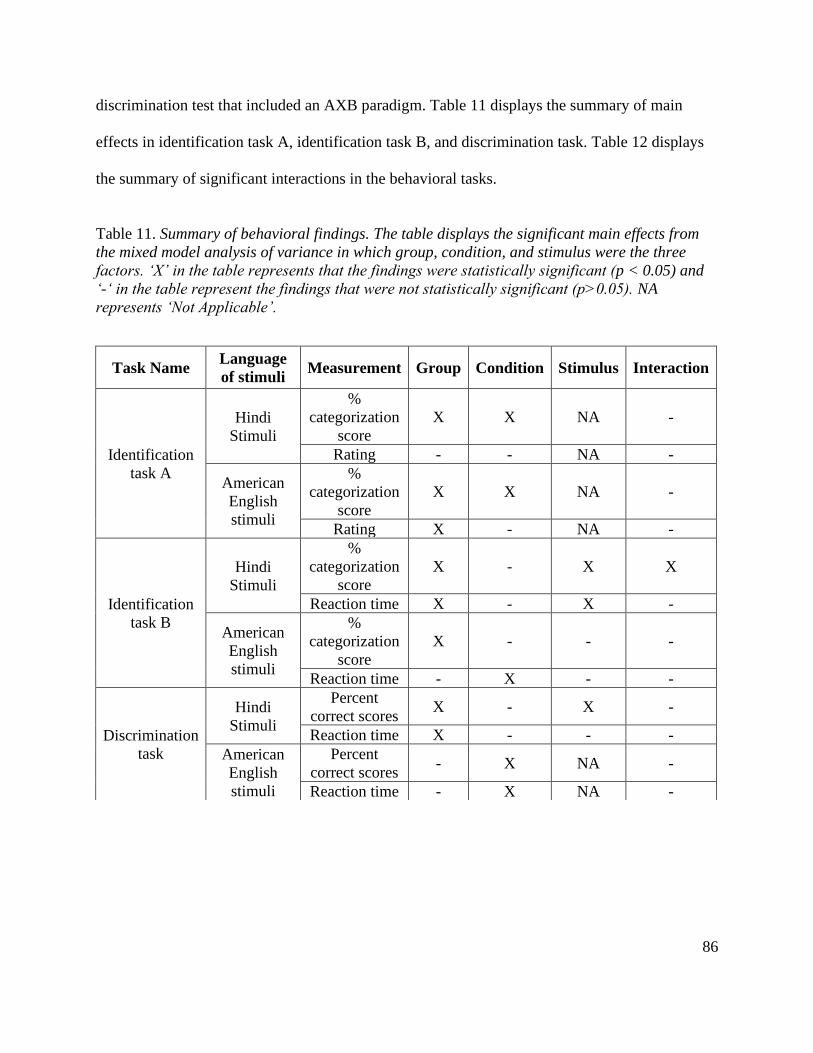
86
discrimination test that included an AXB paradigm. Table 11 displays the summary of main
effects in identification task A, identification task B, and discrimination task. Table 12 displays
the summary of significant interactions in the behavioral tasks.
Table 11. Summary of behavioral findings. The table displays the significant main effects from
the mixed model analysis of variance in which group, condition, and stimulus were the three
factors. ‘X’ in the table represents that the findings were statistically significant (p < 0.05) and
‘-‘ in the table represent the findings that were not statistically significant (p>0.05). NA
represents ‘Not Applicable’.
Task Name Language
of stimuli Measurement Group Condition Stimulus Interaction
Identification
task A
Hindi
Stimuli
%
categorization
score
X X NA -
Rating - - NA -
American
English
stimuli
%
categorization
score
X X NA -
Rating X - NA -
Identification
task B
Hindi
Stimuli
%
categorization
score
X - X X
Reaction time X - X -
American
English
stimuli
%
categorization
score
X - - -
Reaction time - X - -
Discrimination
task
Hindi
Stimuli
Percent
correct scores X - X -
Reaction time X - - -
American
English
stimuli
Percent
correct scores - X NA -
Reaction time - X NA -

87
Table 12. Summary of behavioral findings. The table displays the significant interactions from
the mixed model analysis of variance in which group, condition, and stimulus were the three
factors. ‘X’ in the table represents that the findings were statistically significant (p < 0.05) and
‘-‘ in the table represent the findings that were not statistically significant (p>0.05). NA
represents ‘Not Applicable’.
Task Name Language
of stimuli Measurement
Group x
Condition
Condition
x
Stimulus
Group x
Stimulus
Group x
Condition
x Stimulus
Identification
task A
Hindi
Stimuli
%
categorization
score
- NA NA NA
Rating - NA NA NA
American
English
stimuli
%
categorization
score
- NA NA NA
Rating - NA NA NA
Identification
task B
Hindi
Stimuli
%
categorization
score
- - X -
Reaction time - - - -
American
English
stimuli
%
categorization
score
- - - -
Reaction time - - - -
Discrimination
task
Hindi
Stimuli
Percent
correct scores - - - -
Reaction time - - - -
American
English
stimuli
Percent
correct scores - - - -
Reaction time - - - -

88
II. AUDITORY EVOKED POTENTIALS
The evoked potentials section focuses on the results from the voltage waveforms. The
averaged waveforms were computed for the V-only and CV stimuli for each condition and for
each participant. Then, the waveforms for V-only were subtracted from the response to CV
stimuli. These findings are presented as subtracted waveforms (CV-V). The subtraction was done
to minimize the effects of vowel and to examine the responses to the consonant segment (refer to
the method section for details). The subtracted waveforms were then averaged for each group
and condition. All measurements were done on the subtracted waveforms and on the waveforms
in response to the CV stimuli. The results from the voltage waveforms will be presented in the
following sub-sections: MGFP (section 3.5), peak amplitudes and peak latencies at FCz (section
3.6), peak amplitudes at the lateral sites (T7/T8) (section 3.7). These findings will then be
supported by statistically significant results. Refer to appendices for the complete ANOVA
tables including both significant and non-significant findings, its F and p values. Further, refer to
the appendices for the statistical findings related to the subtracted waveforms. The morphology
of the waveforms and how the peaks correspond to the stimuli will be presented in section 3.5.

89
3.5 MEAN GLOBAL FIELD POWER: MORPHOLOGY AND HOW PEAKS CORRESPOND
TO THE STIMULI
MGFP waveforms were used in this study to summarize the results across all of the
electrodes, to identify time windows and peaks of interest, and to understand its relevance to the
stimuli. Figures 12 - 15 display the mean global field power waveforms for the Hindi and
American English stimuli in CV, V-only, and CV-V waveforms across all three language groups,
in quiet (figures 12 - 13) and in noise (figures 14 - 15).
The morphology of MGFP waveforms appeared to be similar across language groups. In
quiet, P1, N1, P2, N2, components were identified. In noise, P1, N1, P2, N2 were identified as
the peaks following the initial peak that corresponded to onset of vowel. The amplitudes in the
CV-V responses were smaller relative to CV, and V-only responses, except for Hindi /pha/ in
quiet, American English /pa/ in quiet, and for American English /ba/ in noise. Further, the CV
and V-only responses were so similar that they overlapped for most stimuli, except for Hindi
/ba/, Hindi /pha/, and American English /pa/ in quiet. In noise, however, these differences were
not evident.

90
Figure 12. MGFP waveforms across language groups in quiet to Hindi stimuli. The rows
represent the stimuli and the columns display the three language groups. Within each figure
(embedded in grey background), there are three waveforms displaying the findings from CV, V-
only, and CV-V.

91
Figure 13. MGFP waveforms across language groups in quiet to English stimuli. The rows
represent the stimuli and the columns display the three language groups. Within each figure
(embedded in grey background), there are three waveforms displaying the findings from CV, V-
only, and CV-V.

92
Figure 14. MGFP waveforms across language groups in noise to Hindi stimuli. The rows
represent the different stimuli and the columns display the three language groups. Within each
figure (embedded in grey background), there are three waveforms displaying the findings from
CV, V-only, and CV-V.

93
Figure 15. MGFP waveforms across language groups in noise to English stimuli. The rows
represent the different stimuli and the columns display the three language groups. Within each
figure (embedded in grey background), there are three waveforms displaying the findings from
CV, V-only, and CV-V.
Before the AEP amplitudes are measured, it is important to understand how the
waveforms relate to the stimuli. Figures16a-e illustrate the relationship between the stimuli, the
MGFP waveforms, and the AEP components for each stimulus. The top panel and middle panel
include the waveforms of the stimulus and the bottom panel include the MGFP waveforms.
There are three vertical lines running across the waveforms and GMFP waveforms. The first line
often indicates the onset of stimulus, the middle vertical line represents the release burst, and the
third line represent the onset of vowel.

94
Figure 16 displays the MGFP CV (in purple) and subtracted waveforms (in black on
bottom panel) in native Hindi participants in response to Hindi /ba/, in quiet (left) and in noise
(right).
Figure 16. Waveforms obtained in response to Hindi /ba/ in quiet and in noise (top panel) along
with the MGFP waveforms (bottom panel) in native Hindi participants.
.
The latency for P1 is normally approximately 50-75 ms post stimulus onset (Geisler,
Frishkopf, & Rosenblith, 1958; Hyde, 1997; Picton, 2013). In this study, the release burst for the
stop consonants were aligned at 94 ms. Therefore, the latency in response to the release burst
would be predicted to be approximately 140 ms. From figure 16 in quiet, it appeared that the P1
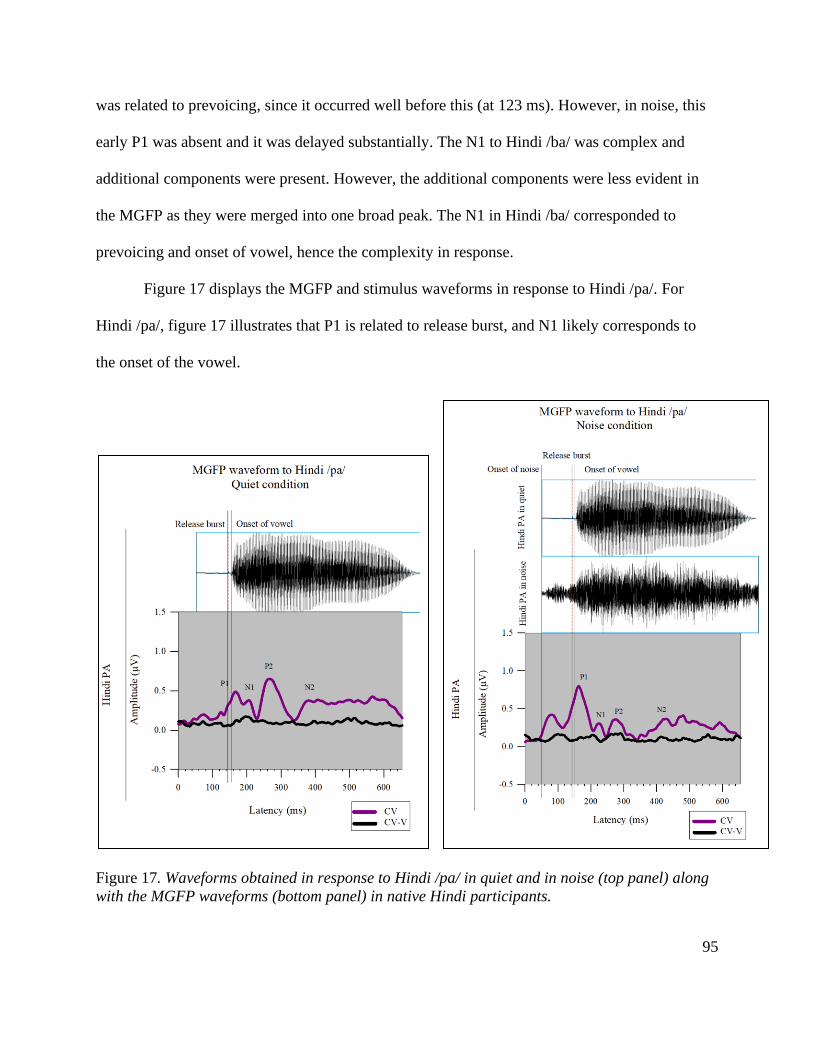
95
was related to prevoicing, since it occurred well before this (at 123 ms). However, in noise, this
early P1 was absent and it was delayed substantially. The N1 to Hindi /ba/ was complex and
additional components were present. However, the additional components were less evident in
the MGFP as they were merged into one broad peak. The N1 in Hindi /ba/ corresponded to
prevoicing and onset of vowel, hence the complexity in response.
Figure 17 displays the MGFP and stimulus waveforms in response to Hindi /pa/. For
Hindi /pa/, figure 17 illustrates that P1 is related to release burst, and N1 likely corresponds to
the onset of the vowel.
Figure 17. Waveforms obtained in response to Hindi /pa/ in quiet and in noise (top panel) along
with the MGFP waveforms (bottom panel) in native Hindi participants.

96
Figure 18 displays the MGFP and stimulus waveforms in response to Hindi /pha/.
Figure 18. Waveforms obtained in response to Hindi /pha/ in quiet and in noise (top panel) along
with the MGFP waveforms (bottom panel) in native Hindi participants.
For Hindi /pha/, the MGFP waveforms in quiet were used to identify whether there was a
neural signature for aspiration present in the waveforms. Figure 14c shows that P1 was related to
the release burst and aspiration because the latency for P1 (i.e., 170 ms) corresponded to what
would be expected in response to the release burst (i.e., 163 ms) and aspiration (i.e., 170 ms).
The P2 on CV waveforms was related to aspiration, because the latency for the peak (291 ms)
was later relative to what would be expected in response to release burst (i.e., 273 ms), but was

97
too early to be associated with the onset of vowel (i.e., 319 ms). Also, the subtracted waveforms
in responses to Hindi /pha/ had larger amplitudes and distinct peaks relative to Hindi /pa/,
possibly because given the complexity of the stimulus /pha/, the subtracted waveform was more
efficient in disentangling the responses to the consonant from the CV syllable.
Figure 19 displays the MGFP and stimulus waveforms in response to English /ba/.
Figure 19. Waveforms obtained in response to English /ba/ in quiet and in noise (top panel)
along with the MGFP waveforms (bottom panel) in native American English participants.

98
For the English /ba/, figure 14d showed that P1 was associated with the burst and vowel
onset. In noise, there were additional AEP peaks between ~270 – 340 ms that corresponded to
the release burst and the vowel.
Figure 20 shows the stimulus and MGFP response to English /pa/.
Figure 20. Waveforms of the speech sound English /pa/ in quiet and in noise (top panel) along
with the MGFP waveforms (bottom panel) in native American English participants.
For English /pa/, the peak latencies of P1 (i.e., 169 ms) and N1 (i.e., 262 ms) were
associated with what would be expected in response to the release burst and aspiration. Further,
on the subtracted response in quiet, the increased P2 amplitude and timing also corresponded to

99
aspiration. In noise, it appears the responses were smaller. However, for the CV response,
additional peaks were present between ~220 – 320 ms in the N1 region.
3.6. PEAK AMPLITUDES IN THE MGFP:
P1:
Figure 21 displays the P1 amplitudes in the mean global field power waveforms for the
Hindi (left) and American English (right) stimuli in CV, and CV-V waveforms across all three
language groups, in quiet and in noise.
Figure 21. P1 peak amplitudes in MGFP waveforms (CV and CV-V) across language groups in
quiet and in noise for Hindi (left) and American English stimuli (right).

100
Effects of group:
For Hindi CV stimuli, the amplitude of the MGFP waveform was larger in Hindi
participants (mean = 0.735 µV, s.e. = 0.068) relative to American English participants (mean =
0.599 µV, s.e. = 0.050) and Tamil participants (mean = 0.613 µV, s.e. = 0.068) and these
observations were statistically significant [F(2, 270) = 8.073, p = 0.000, partial eta-squared =
0.056]. Post-hoc analyses also supported this finding, in which significantly larger amplitudes
were present in the Hindi participants relative to the other two language groups [Hindi vs
American English and Hindi vs Tamil: p < 0.05 for both comparisons; American English vs
Tamil: p = 0.696].
For American English CV stimuli, the amplitude of the MGFP waveforms was larger in
Hindi participants (mean = 0.746 µV, s.e. = 0.076) relative to American English participants
(mean = 0.585 µV, s.e. = 0.070) and Tamil participants (mean = 0.621 µV, s.e. = 0.073). A
significant main effect of group was present [F(2, 180) = 5.221, p = 0.006, partial eta-squared =
0.054]. Post-hoc analyses also supported this finding, as the amplitudes were significantly larger
in the Hindi participants relative to the other two groups [Hindi vs American English and Hindi
vs Tamil: p < 0.05 for both comparisons; American English vs Tamil: p = 0.503].
Effects of condition:
Amplitudes in the MGFP waveform were significantly smaller in quiet (mean = 0.498
µV, s.e.= 0.052) for the CV Hindi stimuli [F(1, 270) = 98.920, p = 0.000, partial eta-squared =
0.268] relative to in noise (mean = 0.801 µV, s.e.= 0.071).
For the American English CV stimuli, the amplitude of the MGFP was smaller in quiet
(mean = 0.574 µV, s.e.= 0.067) relative to in noise (mean = 0.727 µV, s.e.= 0.078). This finding

101
was statistically significant and a main effect of condition was present [F(1, 180) = 12.708, p =
0.000, partial eta-squared = 0.065].
Effects of stimulus:
The amplitude of the MGFP waveform was larger in response to Hindi /pa/ (mean =
0.743 µV, s.e.= 0.071), relative to /pha/ (mean = 0.621 µV, s.e.= 0.062) and /ba/ (mean = 0.583
µV, s.e.= 0.053). A significant main effect was present for CV stimulus [F(2, 270) = 10.080, p =
0.000, partial eta-squared = 0.069]. Post-hoc testing revealed that the responses to Hindi CV
stimulus /pa/ were significantly larger relative to the other two stimuli [/pa/ vs /ba/ and /pa/ vs
/pha/: p < 0.05; /ba/ vs /pha/: p = 0.322].
Interactions:
There were no significant interactions of group, condition or stimulus for the Hindi CV
stimuli. No significant interaction of group, condition, or stimulus was observed for the
American English CV stimuli.
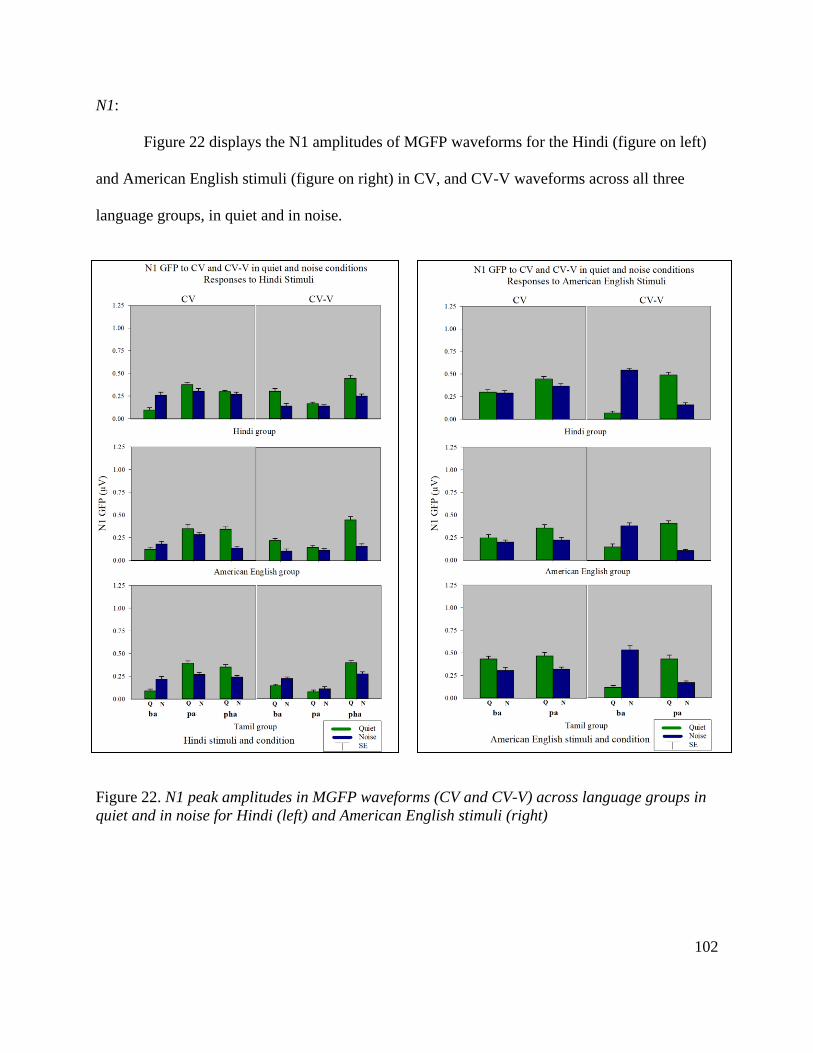
102
N1:
Figure 22 displays the N1 amplitudes of MGFP waveforms for the Hindi (figure on left)
and American English stimuli (figure on right) in CV, and CV-V waveforms across all three
language groups, in quiet and in noise.
Figure 22. N1 peak amplitudes in MGFP waveforms (CV and CV-V) across language groups in
quiet and in noise for Hindi (left) and American English stimuli (right)

103
Effects of group:
The N1 amplitudes were similar across all the three language groups for both Hindi and
American English stimuli.
Effects of condition:
For the American English CV stimuli, the amplitude of the MGFP waveform was larger
in quiet (mean = 0.597 µV, s.e.= 0.071) relative to in noise (mean = 0.513 µV, s.e.= 0.063) and
this finding was statistically significant [F(1, 180) = 4.423, p = 0.037, partial eta-squared =
0.023].
Effects of stimulus:
The N1 peak amplitudes for Hindi CV stimuli were larger for /pa/ (mean = 0.574 µV,
s.e.= 0.072) relative to Hindi /ba/ (mean = 0.401 µV, s.e.= 0.042) and /pha/ (mean = 0.481 µV,
s.e.= 0.045). There was a significant main effect of stimulus [F(2, 270) = 14.028, p = 0.000,
partial eta-squared = 0.094]. Post-hoc testing revealed that the responses to all three Hindi
stimuli were significantly different from each other [p < 0.05 for all comparisons] with larger
amplitudes for /pa/, smaller for /ba/, and /pha/ in between.
Interactions:
The peak N1 amplitudes to the Hindi stimuli were larger for Hindi /pa/ in quiet (mean =
0.626 µV, s.e.= 0.032) and was smaller for Hindi /ba/ in quiet (mean = 0.362 µV, s.e.= 0.032). A
significant interaction of condition x stimulus was present [F(2, 270) = 4.801, p = 0.009, partial
eta-squared = 0.034]. Post-hoc testing revealed that the responses to Hindi /pa/ in quiet condition

104
was significantly larger relative to the other stimuli and condition [/pa/ in quiet: p < 0.05 for all
comparisons).
P2:
Figure 23 displays the P2 amplitudes of mean global field power waveforms for the Hindi
(figure on left) and American English stimuli (figure on right) in CV, and CV-V waveforms
across all three language groups, in quiet and in noise.
Figure 23. P2 peak amplitudes in MGFP waveforms (CV and CV-V) across language groups in
quiet and in noise for Hindi (left) and American English stimuli (right).

105
Effects of group:
The P2 amplitudes were similar across the three language groups in Hindi and English
stimuli (e.g., for Hindi CV stimuli in Hindi participants: mean = 0.672 µV, s.e. = 0.060;
American English participants: mean = 0.685 µV, s.e. = 0.098; Tamil participants: mean = 0.675
µV, s.e. = 0.063).
Effects of condition:
The P2 amplitudes were significantly larger in quiet relative to in noise, both in the Hindi
CV stimuli (quiet: mean = 0.835 µV, s.e.= 0.026; noise: mean = 0.520 µV, s.e.= 0.026). A
significant main effect of condition was present both for the Hindi CV stimuli [F(1, 270) =
70.632, p = 0.000, partial eta-squared = 0.207] and in the subtracted waveforms [F(1, 270) =
36.078, p = 0.000, partial eta-squared = 0.117].
For the American English CV stimuli, the P2 peak amplitudes were significantly larger
[F(1, 180) = 60.619, p = 0.000, partial eta-squared = 0.251] in quiet (mean = 0.849 µV, s.e.=
0.084) relative to in noise (mean = 0.506 µV, s.e.= 0.058).
Effects of stimulus:
Main effects were observed for the subtracted waveforms. Refer to the appendices for
statistical findings.
Interactions:
Significant interactions were present for the subtracted waveforms. Refer to the
appendices for details.

106
N2:
N2 peak amplitudes in the mean global field power waveforms for the Hindi (figure on
left) and American English stimuli (figure on right) in CV, and CV-V waveforms across all three
language groups, in quiet and in noise are displayed in the figure below (figure 24).
Figure 24. N2 peak amplitudes in MGFP waveforms (CV and CV-V) across language groups in
quiet and in noise for Hindi (left) and American English stimuli (right).

107
Effects of group:
The N2 peak amplitudes were similar across the three language groups in the MGFP
waveforms (e.g., in Hindi CV stimuli: Hindi participants: mean = 0.567 µV, s.e. = 0.054;
American English participants: mean = 0.498 µV, s.e. = 0.059; Tamil participants: mean = 0.503
µV, s.e. = 0.058).
Effects of condition:
For the Hindi CV stimuli, the mean N2 peak amplitude was larger in quiet (mean = 0.555
µV, s.e.= 0.064) relative to in noise (mean = 0.490 µV, s.e.= 0.050) and this finding was
statistically significant [F(1, 270) = 5.393, p = 0.021, partial eta-squared = 0.019].
Effects of stimulus:
The N2 peak amplitudes in the MGFP waveform for the American English CV stimuli
were larger for /ba/ (mean = 0.563 µV, s.e.= 0.055) relative to /pa/ (mean = 0.483 µV, s.e.=
0.058). There was a main effect of stimulus [F(1, 180) = 5.679, p = 0.018, partial eta-squared =
0.030].
Interactions:
For the Hindi and English CV responses, there was no significant interaction.

108
3.6.1 SUMMARY OF MGFP RESULTS
Tables 13 - 14 display the summary of results related to MGFP waveforms. Table 13
displays the main effects and 14 the interactions. For the Hindi and American English stimuli, a
significant main effect of group was present in P1 amplitudes. The effect of condition, stimulus,
and interaction were present in various AEP components. Further, there were no significant
interactions that involved group in the MGFP results.

109
Table 13. Summary of the significant main effects in MGFP waveforms across AEP components
P1, N1, P2, and N2 in Hindi and in American English stimuli in both CV and subtracted (CV-V)
responses. The table displays the significant findings from the mixed model analysis of variance
in which group, condition, and stimulus were the three factors. ‘X’ in the table represents that
the findings were statistically significant (p < 0.05) and ‘-‘ in the table represent the findings
that were not statistically significant (p>0.05).
AEP
Component
Language of
stimuli Context Group Condition Stimulus Interaction
P1
Hindi stimuli CV X X X -
CV-V - - - X
American
English stimuli
CV X X - -
CV-V X X X X
N1
Hindi stimuli CV - - X X
CV-V - X X X
American
English stimuli
CV - X - -
CV-V - - - X
P2
Hindi stimuli CV - - - -
CV-V - X X X
American
English stimuli
CV - X - -
CV-V - - X X
N2
Hindi stimuli CV - X - -
CV-V - X X X
American
English stimuli
CV - - X -
CV-V - - - X

110
Table 14. Summary of the significant interactions in MGFP waveforms across AEP components
P1, N1, P2, and N2 in Hindi and in American English stimuli in both CV and subtracted (CV-V)
responses. The table displays the significant findings from the mixed model analysis of variance
in which group, condition, and stimulus were the three factors. ‘X’ in the table represents that
the findings were statistically significant (p < 0.05) and ‘-‘ in the table represent the findings
that were not statistically significant (p>0.05).
AEP
Component
Language of
stimuli Context
Group x
Condition
Condition
x
Stimulus
Stimulus
x Group
Group x
Condition
x Stimulus
P1
Hindi stimuli CV - - - -
CV-V - - - -
American
English stimuli
CV - - - -
CV-V - X - -
N1
Hindi stimuli CV - X - -
CV-V - X - -
American
English stimuli
CV - - - -
CV-V - X - -
P2
Hindi stimuli CV - - - -
CV-V - X - -
American
English stimuli
CV - - - -
CV-V - X - -
N2
Hindi stimuli CV - - - -
CV-V - X - -
American
English stimuli
CV - - - -
CV-V - X - -

111
3.7 PEAK AMPLITUDES AND LATENCIES AT CENTRAL ELECTRODE SITE: FCz
AEP results at the FCz electrode site will be presented in this section because it is a
midline-central electrode with relatively larger peak amplitudes. Further, it reflects
predominantly the primary auditory contributions to the responses. Figure 25 - 28 displays the
grand mean waveforms at FCz for the Hindi and American English stimuli (CV, V-only, and
CV-V stimuli across all three language groups, in quiet (figures 25 - 26) and in noise (figures 27
- 28).
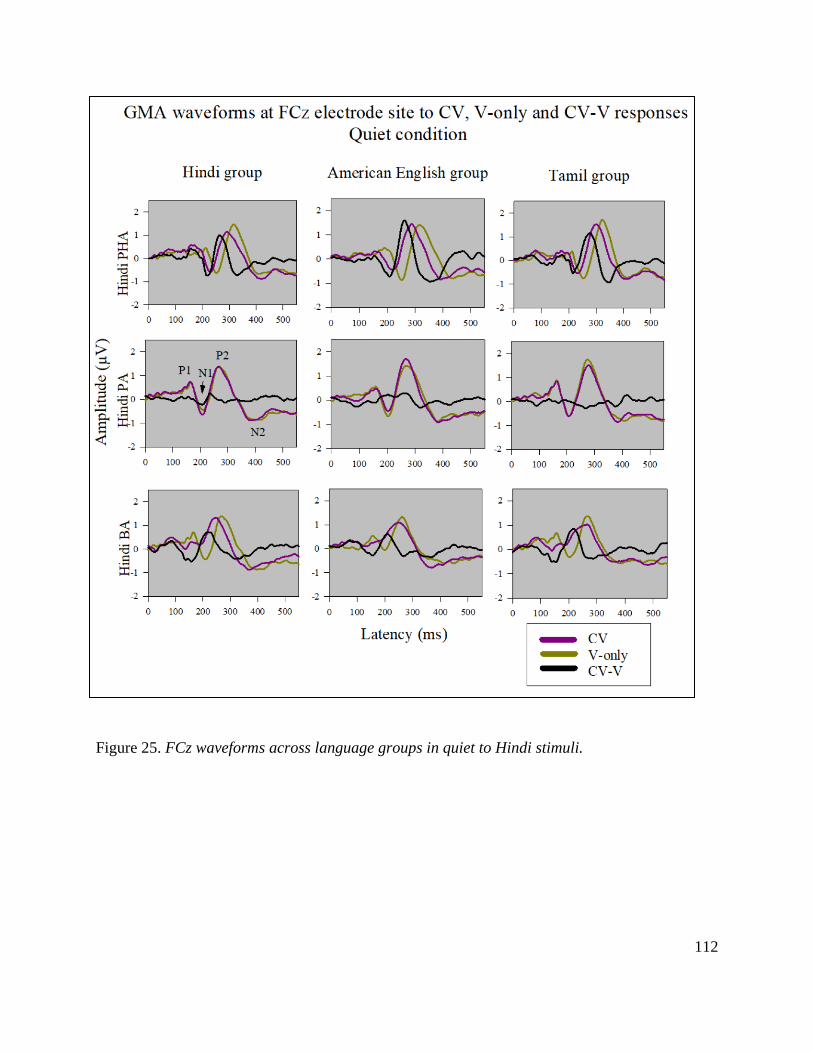
112
Figure 25. FCz waveforms across language groups in quiet to Hindi stimuli.

113
Figure 26. FCz waveforms across language groups in quiet to English stimuli.

114
Figure 27. FCz waveforms across language groups in noise to English stimuli.

115
Figure 28. FCz waveforms across language groups in noise to English stimuli.
The morphology of GMA waveforms at FCz were similar across language groups. The
morphology of responses to Hindi /pa/ was similar to the morphology of responses to English
/ba/. Also, for these two stimuli, the morphology of CV responses was similar to V-only
responses. In addition, the CV responses and V-only responses to Hindi /pha/ and to English /pa/
were noticeably spaced apart. The responses to vowel had longer latencies relative to CV
responses.
In noise, similar to GMFP, there was an early additional peak around 70 ms (represented
by dashed vertical line on figure 28) corresponding to onset of noise. Further, the latencies were

116
longer and the responses to CV and V-only were more similar to each other, relative to responses
in quiet. The only exception to this were the CV and V-only responses to English /ba/ in which
both these were spaced apart. Lastly, similar to amplitudes in the MGFP waveforms, P2 peak
amplitudes were larger in quiet and smaller in noise; P1 peak amplitudes were larger in noise and
relatively smaller in quiet.

117
3.7.1 PEAK AMPLITUDES AND LATENCIES
P1:
Figure 29 displays the P1 amplitudes and latencies at FCz for the Hindi stimuli (CV, and
CV-V) across all three language groups, in quiet and in noise.
Figure 29. P1 peak amplitudes (right) and peak latencies (left) at FCz in CV and CV-V
waveforms across language groups in quiet and in noise for Hindi stimuli

118
Figure 30 displays the P1 amplitudes and latencies at FCz for the American English
stimuli in CV, and CV-V waveforms across all three language groups, in quiet and in noise.
Figure 30. P1 peak amplitudes (right) and peak latencies (left) at FCz in CV and CV-V
waveforms across language groups in quiet and in noise for American English stimuli
Effects of group:
The P1 peak amplitudes were significantly larger for Hindi CV stimuli in Hindi
participants (mean = 1.036 µV, s.e.= 0.128) relative to American English participants (mean =
0.728 µV, s.e.= 0.119) and Tamil participants (mean = 0.870 µV, s.e.= 0.133). A significant

119
main effect of group [F(2, 270) = 8.422, p = 0.000, partial eta-squared = 0.058] was obtained.
Post-hoc testing supported these observations and the amplitudes in Hindi participants were
significantly larger relative to the non-native participants [Hindi: p < 0.05 for all comparisons;
American English vs Tamil: p = 0.060]
For the English CV stimuli, P1 amplitudes were the lowest in native listeners (mean =
0.727 µV, s.e.= 0.116) relative to non-native listeners (Hindi group: mean = 0.995 µV, s.e.=
0.160; Tamil: mean = 0.836 µV, s.e.= 0.138). A significant main effect of group was observed
[F(2, 180) = 3.6656, p = 0.028, partial eta-squared = 0.0391]. The post-hoc test results revealed
that the P1 amplitudes in the Hindi group were significantly larger relative to the American
English group [American English vs Hindi: p < 0.05; American English vs Tamil: p = 0.273;
Hindi vs Tamil: p = 0.112].
Effects of condition:
For the Hindi stimuli, the CV responses were larger in noise (mean = 1.207 µV, s.e. =
0.144) relative to quiet (mean = 0.549 µV, s.e. = 0.110). A significant main effect of condition
[F(1, 270) = 115.807, p = 0.000, partial eta-squared = 0.300] were observed.
In the CV waveforms, as predicted, the mean latencies were significantly longer [F(1,
270) = 426.60, p = 0.000, partial eta-squared = 0.612] in noise (mean = 166.270 ms, s.e.= 2.919)
relative to in quiet (mean = 137.562 ms, s.e. = 2.591
For the American English CV stimuli, the P1 amplitudes were larger in noise condition
(mean = 1.081 µV, s.e. = 0.156) relative to quiet (mean = 0.625 µV, s.e. = 0.120). A significant
main effect of condition [F(1, 180) = 31.3959, p = 0.000, partial eta-squared = 0.1485] was
present.

120
The P1 latency for CV stimuli was longer in noise (mean = 168.969 ms, s.e.= 2.962)
relative to in quiet (mean = 164.240 ms, s.e.= 2.929). A significant main effect of condition [F(1,
180) = 7.600, p = 0.006, partial eta-squared = 0.040] was obtained.
Effects of stimulus:
The P1 peak amplitudes were significantly smaller [F(2, 270) = 4.103, p = 0.017, partial
eta-squared = 0.029] for Hindi /ba/ (mean = 0.772 µV, s.e. = 0.120) relative to Hindi /pa/ (mean
= 0.987 µV, s.e.= 0.137) and Hindi /pha/ (mean = 0.875 µV, s.e. = 0.123). This finding also
reflected in the post-hoc results where responses to Hindi /ba/ were significantly smaller relative
to Hindi /pa/ [/ba/ vs /pa/: p < 0.05], but not to Hindi /pha/ [/ba/ vs /pha/: p = 0.171; /pa/ vs /pha/:
p = 0.136].
The mean P1 peak latencies were shorter for /ba/ (123.343 ms, s.e.= 1.964) relative to
/pa/ (162.052 ms, s.e.= 2.341) and /pha/ (170.354 ms, s.e.= 3.959). A significant main effect of
stimulus [F(2, 270) = 434.480, p = 0.000, partial eta-squared = 0.762] was present. Post-hoc test
results revealed that the P1 latencies were significantly shorter for Hindi /ba/, short for /pa/, and
long for /pha/ [p < 0.05 for all comparisons].
For the English stimuli, the latency was longer for English /pa/ (mean = 169.823 ms,
s.e.= 2.969) relative to /ba/ (mean = 163.385 ms, s.e.= 2.922) and this finding was statistically
significant [F(1, 180) = 14.090, p = 0.000, partial eta-squared = 0.072].
Interactions:
No significant interaction was present for the P1 amplitudes in the CV. In terms of P1
latencies, for Hindi CV stimuli the interaction of condition x stimulus was significant [F(2, 270)

121
= 322.158, p = 0.000, partial eta-squared = 0.704]. Post-hoc LSD test results revealed that the
responses to Hindi /ba/ in quiet was significantly shorter (mean = 84.08 ms, s.e.= 1.702) relative
to other Hindi stimuli in quiet or in noise [p < 0.05 for all comparisons].
In the American English CV, there was no significant interaction in the P1 amplitudes. In
terms of latency, there were no significant interactions of group, condition, or stimulus in the P1
amplitudes for American English CV stimuli.

122
N1:
Figure 31 displays the N1 amplitudes and latencies at FCz for the Hindi stimuli in CV,
and CV-V waveforms across all three language groups, in quiet and in noise.
Figure 31. N1 peak amplitudes (left) and latencies (right) in the CV and CV-V waveforms to
Hindi stimuli at FCz across language groups in quiet and in noise.

123
Figure 32 displays the N1 amplitudes and latencies at FCz for the English stimuli in CV,
and CV-V waveforms across all three language groups, in quiet and in noise
Figure 32. N1 peak amplitudes (left) and latencies (right) in the CV and CV-V waveforms for
English stimuli at FCz across language groups in quiet and in noise.
Effects of group:
The N1 peak amplitudes and latencies were similar in all language groups for both Hindi
and English stimuli. For example, the N1 peak latencies to Hindi stimuli was similar across
language groups: in Hindi participants (CV: mean = 211.510 ms, s.e. = 2.784; CV-V: mean =
194.635 ms, s.e.= 3.245), American English participants (CV: mean = 210.354 ms, s.e. = 3.131;

124
CV-V: mean = 194.083 ms, s.e.= 3.648), and Tamil participants (CV: mean = 211.438 ms, s.e. =
3.102; CV-V: mean = 194.906 ms, s.e. = 3.645).
Effects of condition:
The N1 latency for Hindi CV stimuli was longer in noise (mean = 232.263 ms, s.e.=
3.531) relative to quiet condition (mean = 189.937 ms, s.e.= 2.479). A main effect of condition
was present [F(1, 270) = 847.50, p = 0.000, partial eta-squared = 0.758].
For the American English CV stimuli, the N1 latency was longer in noise condition
(mean = 268.250 ms, s.e.= 3.272) relative to in quiet (mean = 210.254 ms, s.e. = 2.704) and this
finding was statistically significant [F(1, 180) = 1085.180, p = 0.000, partial eta-squared =
0.857].
Effects of stimulus:
The amplitude for Hindi CV /ba/ (mean = -0.254 µV, s.e. = 0.110) was smaller relative to
Hindi /pa/ (mean = -0.700 µV, s.e. = 0.142) and /pha/ (mean = -0.651, s.e = 0.099). A significant
main effect of stimulus was present [F(2, 270) = 24.893, p = 0.000, partial eta-squared = 0.155].
The post-hoc testing added more evidence to support this finding as /ba/ was significantly
smaller relative to the other two stimuli [/ba/: p < 0.05 for all comparisons; /pa/ vs /pha/: p =
0.474].
The latencies for Hindi CV /pha/ were longer (mean = 241.958 ms, s.e.= 3.250) relative to
Hindi /ba/ (mean = 176.250 ms, s.e. = 2.894) and /pa/ (mean = 215.093 ms, s.e.= 2.871). Main
effect of stimulus was present [F(2, 270) = 688.370, p = 0.000, partial eta-squared = 0.836]. The
post-hoc testing revealed that the performance for all three stimuli were significantly different
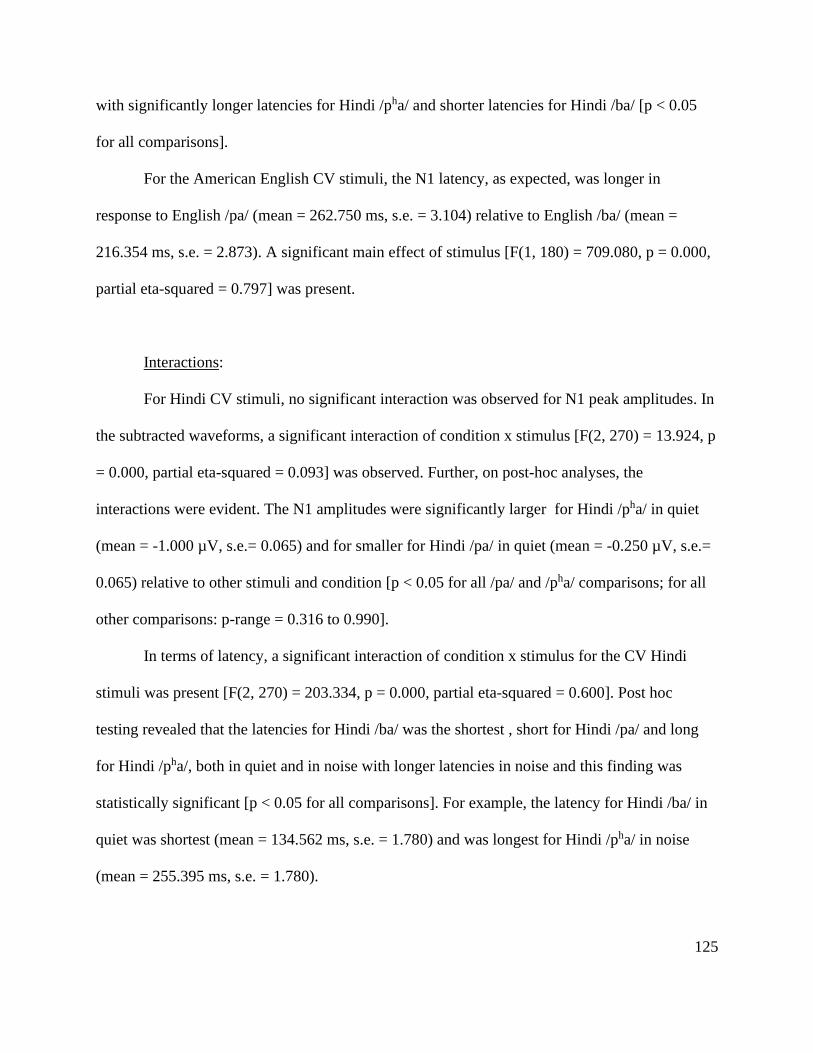
125
with significantly longer latencies for Hindi /pha/ and shorter latencies for Hindi /ba/ [p < 0.05
for all comparisons].
For the American English CV stimuli, the N1 latency, as expected, was longer in
response to English /pa/ (mean = 262.750 ms, s.e. = 3.104) relative to English /ba/ (mean =
216.354 ms, s.e. = 2.873). A significant main effect of stimulus [F(1, 180) = 709.080, p = 0.000,
partial eta-squared = 0.797] was present.
Interactions:
For Hindi CV stimuli, no significant interaction was observed for N1 peak amplitudes. In
the subtracted waveforms, a significant interaction of condition x stimulus [F(2, 270) = 13.924, p
= 0.000, partial eta-squared = 0.093] was observed. Further, on post-hoc analyses, the
interactions were evident. The N1 amplitudes were significantly larger for Hindi /pha/ in quiet
(mean = -1.000 µV, s.e.= 0.065) and for smaller for Hindi /pa/ in quiet (mean = -0.250 µV, s.e.=
0.065) relative to other stimuli and condition [p < 0.05 for all /pa/ and /pha/ comparisons; for all
other comparisons: p-range = 0.316 to 0.990].
In terms of latency, a significant interaction of condition x stimulus for the CV Hindi
stimuli was present [F(2, 270) = 203.334, p = 0.000, partial eta-squared = 0.600]. Post hoc
testing revealed that the latencies for Hindi /ba/ was the shortest , short for Hindi /pa/ and long
for Hindi /pha/, both in quiet and in noise with longer latencies in noise and this finding was
statistically significant [p < 0.05 for all comparisons]. For example, the latency for Hindi /ba/ in
quiet was shortest (mean = 134.562 ms, s.e. = 1.780) and was longest for Hindi /pha/ in noise
(mean = 255.395 ms, s.e. = 1.780).
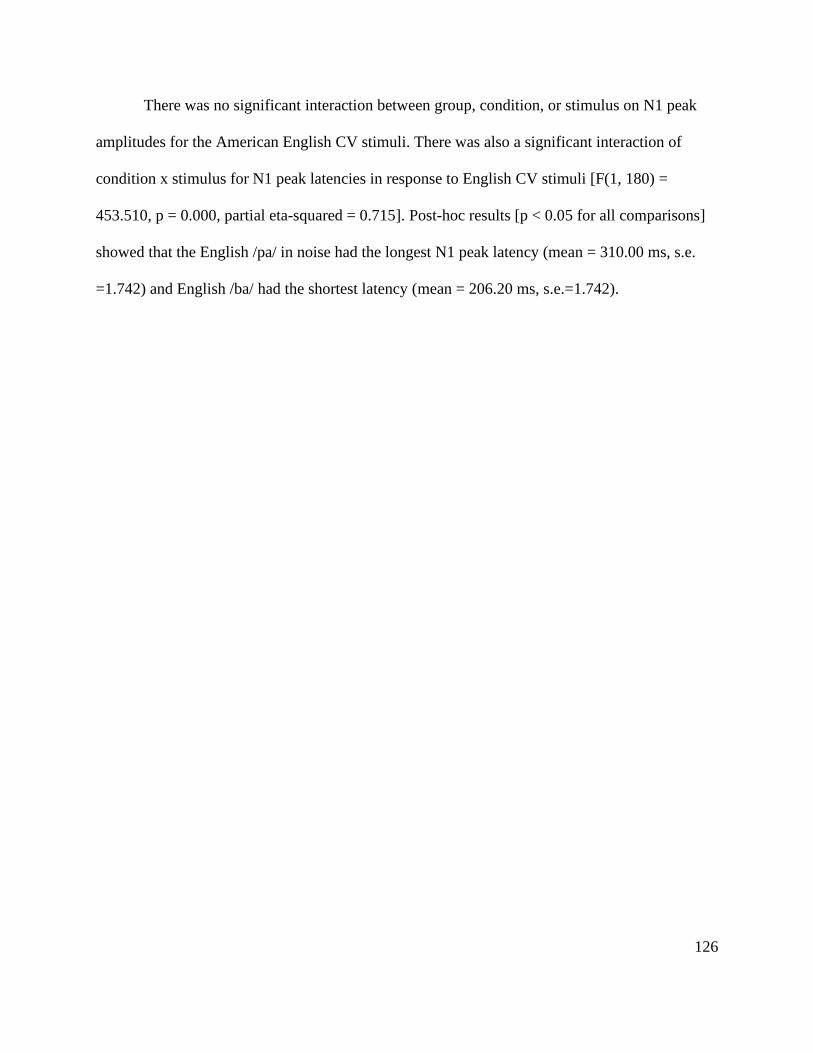
126
There was no significant interaction between group, condition, or stimulus on N1 peak
amplitudes for the American English CV stimuli. There was also a significant interaction of
condition x stimulus for N1 peak latencies in response to English CV stimuli [F(1, 180) =
453.510, p = 0.000, partial eta-squared = 0.715]. Post-hoc results [p < 0.05 for all comparisons]
showed that the English /pa/ in noise had the longest N1 peak latency (mean = 310.00 ms, s.e.
=1.742) and English /ba/ had the shortest latency (mean = 206.20 ms, s.e.=1.742).

127
P2:
Figure 33 shows the P2 amplitudes and latencies at FCz for Hindi stimuli in quiet and in
noise
Figure 33. P2 peak amplitudes (left) and latencies (right) at FCz in CV and CV-V waveforms
across language groups in quiet and in noise

128
Figure 34 displays the P2 amplitudes and latencies at FCz for the English stimuli in CV,
and CV-V waveforms across all three language groups, in quiet and in noise.
Figure 34. P2 peak amplitudes (left) and peak latencies (right) at FCz in the CV and CV-V
waveforms for English stimuli across language groups in quiet and in noise
Effects of group:
For the Hindi stimuli, in the CV waveforms, the P2 amplitudes in Hindi participants
(mean = 1.000 µV, s.e. = 0.119) were similar to the responses in non-native participants
(American English participants: mean = 1.011 µV, s.e. = 1.191; Tamil: mean = 1.004 µV, s.e. =
0.136). However, from figure 25 and the tables in the appendices it can be noted that in the

129
subtracted waveforms, it can be noted that in the subtracted waveforms for Hindi stimuli, the P2
amplitudes were larger in Hindi participants (mean = 0.405 µV, s.e.= 0.081) relative to non-
native participants (American English participants: mean = 0.261 µV, s.e.= 0.100; Tamil: mean =
0.260 µV, s.e. = 0.089). A significant main effect of group [F(2, 270) = 4.723, p = 0.010, partial
eta-squared = 0.033] was present. Post-hoc testing revealed significantly larger P2 amplitudes in
the Hindi participants relative to the other two groups [Hindi: p < 0.05 for all comparisons,
American English vs Tamil: p = 0.990]. This is an important finding that reveals the effects of
consonant because there was no significant effect of group to the CV and there was a significant
effect in the subtracted waveforms where the effects of vowel were detangled from the CV.
Effects of condition:
For the Hindi CV stimuli, the P2 amplitudes were larger in quiet (mean = 1.351 µV, s.e.
= 0.175), relative to in noise (mean = 0.659 µV, s.e. = 0.123). A significant effect of condition
[F(1, 270) = 85.118, p = 0.000, partial eta-squared = 0.239] was present.
The P2 latency for Hindi CV stimuli was longer in noise (mean = 292.131 ms, s.e.=
3.712) relative to in quiet (mean = 271.437 ms, s.e.= 3.166). This finding was statistically
significant [F(1, 270) = 151.143, p = 0.000, partial eta-squared = 0.358].
For the American English CV stimuli, the P2 amplitude in noise (mean = 0.659 µV, s.e. =
0.123) was smaller relative to in quiet (mean = 1.400 µV, s.e. = 0.177). A main effect of
condition was present [F(1, 180) = 64.540, p = 0.000, partial eta-squared = 0.263]. The pattern of
results was also similar in the subtracted waveforms with significantly larger P2 amplitudes [F(1,
180) = 30.222, p = 0.000, partial eta-squared = 0.143] in quiet (mean = 1.194 µV, s.e. = 0.164)
relative to in noise (mean = 0.690 µV, s.e. = 0.118).

130
The P2 latencies for the English CV stimuli were longer in noise (mean = 335.271 ms,
s.e.= 4.865) relative to in quiet (mean = 275.844 ms, s.e. = 2.927) and this finding was
statistically significant [F(1, 180) = 633.440, p = 0.000, partial eta-squared = 0.778].
Effects of stimulus:
A significant main effect of stimulus was present for the Hindi CV stimuli [F(2, 270) =
349.063, p = 0.000, partial eta-squared = 0.721]. Post-hoc testing indicated that the P2 latencies
were significantly longer [p < 0.05 for all comparisons] for Hindi /pha/ (mean = 311.677 ms,
s.e.= 3.650) relative to Hindi /ba/ (mean = 258.375 ms, s.e. = 3.998) and /pa/ (mean = 275.302
ms, s.e.= 2.669).
Similar to CV responses, the P2 latencies in the subtracted responses were significantly
longer [F(2, 270) = 217.856, p = 0.000, partial eta-squared = 0.617] for Hindi /pha/ (mean =
276.541 ms, s.e.= 3.320), relative to Hindi /pa/ (mean = 259.197 ms, s.e.= 3.569) and /ba/ (mean
= 228.562 ms, s.e. = 4.776). Post-hoc testing revealed that the P2 latencies was significantly
longer for Hindi /pha/ and significantly shorter for Hindi /ba/ relative to Hindi /ba/ [p < 0.05 for
all comparisons].
In terms of latency, as expected, the mean P2 latency was longer in response to English
/pa/ (mean = 327.646 ms, s.e. = 3.751) relative to English /ba/ (mean = 283.469 ms, s.e. = 4.041).
A main effect of stimulus was present [F(1, 180) = 350.050, p = 0.000, partial eta-squared =
0.660].

131
Interactions:
In the Hindi CV responses, no significant interactions were present in terms of P2
amplitude. In terms of P2 latencies, a significant interaction of condition x stimulus was
observed in response to the Hindi CV stimuli [F(2, 270) = 18.313, p = 0.000, partial eta-squared
= 0.119]. The latencies were significantly short for /ba/, long for /pa/, and longest for Hindi /pha/.
Further, the latencies were significantly longer in noise relative to quiet. For example, the latency
of Hindi /ba/ in quiet was shorter (mean = 247.208 ms, s.e.= 2.061), relative to in noise (mean =
269.541 ms, s.e.= 2.061). Post hoc LSD test results revealed significantly longer latencies [/pha/
in noise and /ba/ in quiet: p < 0.05 for all comparisons] for Hindi /pha/ in noise (mean = 327.812
ms, s.e.= 2.061) and significantly shorter for Hindi /ba/ in quiet (mean = 247.208 ms, s.e.=
2.061). For the American English CV stimuli, there were no significant interactions of group,
condition, or stimulus in the P2 peak amplitudes.
In terms of latency, significant interactions of condition x stimulus were present [CV:
F(1, 180) = 323.18, p = 0.000, partial eta-squared = 0.642]. Post-hoc testing revealed that the
mean P2 latency was longer in response to English /pa/ (quiet: mean = 276.708 ms, s.e. = 2.361;
noise: mean = 378.583 ms, s.e. = 2.361) relative to English /ba/ (quiet: mean = 274.979 ms, s.e. =
2.361; noise: mean = 291.958 ms, s.e. = 2.361), specifically in noise [/ba/ and /pa/ in noise: p <
0.05 for all comparisons, /ba/ in quiet vs /pa/ in quiet: p = 0.605].

132
N2:
Figure 35 displays the N2 amplitudes and latencies at FCz for the Hindi stimuli in CV,
and CV-V waveforms across all three language groups, in quiet and in noise.
Figure 35. N2 peak amplitudes (left) and latencies (right) in the CV and CV-V waveforms for
Hindi stimuli at FCz across language groups in quiet and in noise.

133
Figure 36 displays the N2 amplitudes and latencies at FCz for English stimuli in CV, and
CV-V waveforms across all three language groups, in quiet and in noise.
Figure 36. N2 peak amplitudes (left) and latencies (right) in the CV and CV-V waveforms for
English stimuli at FCz across language groups in quiet and in noise.
Effects of group:
For the Hindi stimuli, in the CV waveforms, the N2 amplitude were similar in all the
participants (e.g., Hindi: mean = -0.879 µV, s.e. = 0.099) relative to non-native participants
(American English participants: mean = -0.748 µV, s.e. = 0.118; Tamil participants: mean = -
0.762 µV, s.e. = 0.125).

134
For the English stimuli, the N2 latencies in Hindi listeners (mean = 453.406 ms, s.e.=
7.964) were similar to English listeners (mean = 455.234 ms, s.e. = 7.657) and Tamil listeners
(mean = 458.922 ms, s.e. = 7.049).
Effects of condition:
In the CV responses to Hindi stimuli, N2 amplitudes were larger in quiet (mean = -0.902
µV, s.e. = 0.132), relative to in noise (mean = -0.691 µV, s.e. = 0.096). There was a significant
main effect of condition [F(1, 270) = 14.044, p = 0.000, partial eta-squared = 0.049].
In terms of latency, longer N2 peak latency was observed in noise (mean = 427.270 ms,
s.e.= 6.463) relative to quiet condition (mean = 391.062 ms, s.e.= 5.494). There was a main
effect of condition [F(1, 270) = 158.35, p = 0.000, partial eta-squared = 0.369].
The N2 latency in response to English CV stimuli was longer in noise (mean = 465.990
ms, s.e.= 8.017) relative to in quiet (mean = 445.719 ms, s.e. = 7.096) and this finding was
statistically significant [F(1, 180) = 20.160, p = 0.000, partial eta-squared = 0.100].
Effects of stimulus:
In the subtracted waveforms, the N2 peak amplitudes for Hindi /ba/ (mean = -0.485 µV,
s.e. = 0.090) and Hindi /pa/ (mean = -0.524 µV, s.e. = 0.081) were smaller relative to the N2
amplitude for Hindi /pha/ (mean = -0.747 µV, s.e = 0.134). This finding was statistically
significant [F(2, 270) = 9.9950, p = 0.000, partial eta-squared = 0.068]. Post-hoc LSD Fisher’s
test revealed that the N2 amplitudes for Hindi /pha/ was significantly larger [MS = 0.19203, df =
270.00, p < 0.05].

135
On the CV Hindi stimuli, the N2 latencies for Hindi /pha/ (mean = 427.000 ms, s.e.=
6.328) were longer and the responses to Hindi /ba/ (mean = 368.708 ms, s.e. = 5.100) were
shorter, relative to Hindi /pa/ (mean = 431.791 ms, s.e.= 6.508). A main effect of stimulus was
present [F(2, 270) = 198.63, p = 0.000, partial eta-squared = 0.595]. Post-hoc testing showed that
the N2 latencies in response to Hindi /ba/ were significantly shorter relative to /pa/ and pha/ [/ba/:
p < 0.05 for all comparisons, except /pa/ vs /pha/: 0.175].
For the American English stimuli, as expected, the mean N2 latency was longer in
response to English CV /pa/ (mean = 497.500 ms, s.e. = 7.436) relative to English /ba/ (mean =
414.208 ms, s.e. = 7.678). A main effect of stimulus was present [F(1, 180) = 340.39, p = 0.000,
partial eta-squared = 0.654].
Interactions:
There were no significant interactions of group, condition, or stimulus in the N2 peak
amplitudes for the CV Hindi stimuli. In terms of N2 peak latencies, a significant interaction of
group x stimulus was present [F(4, 270) = 2.451, p = 0.046, partial eta-squared = 0.035] in the
CV waveforms. The latencies for Hindi /ba/ were significantly shorter relative to the latencies for
Hindi /pa/ and Hindi /pha/, in all three groups (Hindi group: mean = 374.00 ms, s.e = 4.316;
English group: mean = 367.531 ms, s.e. = 4.316; Tamil group: mean = 364.593, s.e.= 4.316). For
Hindi /pa/ versus Hindi /pha/, the N2 latencies for both the stimuli were similar in Hindi listeners
(/pa/: mean = 428.750 ms, s.e.= 4.316; /pha/: 431.687, s.e.= 4.316) and in Tamil listeners (/pa/:
mean = 429.718 ms, s.e.= 4.316; /pha/: 431.343, s.e.= 4.316). However, the N2 peak latency in
response to Hindi /pa/ was slightly longer relative to Hindi /pha/ in American English listeners.
(/pa/: mean = 436.906 ms, s.e.= 4.316; /pha/: 417.968, s.e.= 4.316). This was an unexpected

136
finding and was not hypothesized. However, the post-hoc results from Fisher’s LSD test
supported this finding [p < 0.05].
Also, a significant condition x stimulus interaction was present for the N2 peak latencies
in the CV stimuli [F(2, 270) = 55.961, p = 0.000, partial eta-squared = 0.293]. The N2 latencies
in response to Hindi /ba/ were similar in quiet (mean = 366.250 ms, s.e = 3.524) and in noise
(mean = 371.166 ms, s.e = 3.524). However, for Hindi /pa/ and Hindi /pha/, the latencies were
significantly longer in noise relative to in quiet. For example, the N2 peak latency for Hindi /pha/
in quiet was 413.875 ms (s.e = 3.524), relative to in noise 440.125 ms (s.e = 3.524). The post-hoc
results supported this finding [p < 0.05 for all comparisons, except /ba/ in quiet vs in noise: p =
0.324].
For the American English CV stimuli, there was no significant interaction of group,
condition, or stimulus in the N2 peak amplitudes. In terms of latency, there was a significant
interaction of condition x stimulus in the CV waveforms [F(1, 180) = 44.840, p = 0.000, partial
eta-squared = 0.199]. Post-hoc testing indicated that the N2 latencies for English /ba/ were
significantly shorter in quiet and longer in noise [p < 0.05]. However, the N2 latencies for
English /pa/ were similar in quiet versus in noise (quiet: mean = 439.458 ms, s.e = 4.514; noise:
mean = 492.520 ms, s.e = 4.514; p = 0.120), This finding is in contrast to what was obtained in
response to the Hindi stimuli. In the subtracted waveforms, there was no significant interaction
between group, condition, or stimulus.

137
3.7.2 SUMMARY OF RESULTS AT FCz
Tables 15 and 16 display the summary of results related to measurements of peak
amplitudes at FCz electrode site. Table 15 displays the significant main effects and table 16
displays the significant interaction effects. For the Hindi stimuli, effect of group was evident in
P1 and P2 components; for the American English stimuli in P1. The effect of condition was
present in all AEP components, except in N1. The effect of stimulus was observed across all
AEP components. Interactions were present in various AEP components, except in P1. Similar to
MGFP findings, no significant interactions were observed in the amplitudes at FCz.
Tables 17 and 18 display the summary of peak latency measurements at FCz electrode
site. Table 17 displays the significant main effects and table 18 displays the significant
interactions. For the Hindi stimuli, the effect of group was present in P2 component. For the
American English stimuli, effect of group was observed in N2 component. The effect of
condition, stimulus, and interaction were present in various AEP components. There was a
significant group x stimulus interaction in N2 latency at FCz.

138
Table 15. Summary of the significant main effects for peak amplitude measures at FCz across
AEP components in Hindi and in American English stimuli for both CV and subtracted (CV-V)
responses. ‘X’ in the table represent the significant findings (p < 0.05) and ‘-‘ in the table
represent the findings that were not statistically significant (p > 0.05).
AEP
Component
Language of
stimuli Context Group Condition Stimulus Interaction
P1
Hindi stimuli CV X X X -
CV-V X - - -
American
English stimuli
CV X X - -
CV-V - - - -
N1
Hindi stimuli CV - - X -
CV-V - - X X
American
English stimuli
CV - - - -
CV-V - - - X
P2
Hindi stimuli CV - X - -
CV-V X - - -
American
English stimuli
CV - X - -
CV-V - X X X
N2
Hindi stimuli CV - X X -
CV-V - X X X
American
English stimuli
CV - - - -
CV-V - - - X

139
Table 16. Summary of the significant interactions for peak amplitude measures at FCz across
AEP components in Hindi and in ``American English stimuli for both CV and subtracted (CV-V)
responses. The table displays the significant findings from the mixed model analysis of variance
in which group, condition, and stimulus were the three factors. ‘X’ in the table represent the
significant findings (p < 0.05) and ‘-‘ in the table represent the findings that were not
statistically significant (p > 0.05).
AEP
Component
Language of
stimuli Context
Group x
Condition
Condition
x
Stimulus
Stimulus
x Group
Group x
Condition
x Stimulus
P1
Hindi stimuli CV - - - -
CV-V - - - -
American
English stimuli
CV - - - -
CV-V - - - -
N1
Hindi stimuli CV - - - -
CV-V - X - -
American
English stimuli
CV - - - -
CV-V - X - -
P2
Hindi stimuli CV - - - -
CV-V - - - -
American
English stimuli
CV - - - -
CV-V - X - -
N2
Hindi stimuli CV - - - -
CV-V - X - -
American
English stimuli
CV - - - -
CV-V - X - -

140
Table 17. Summary of the significant main effects for peak latencies at FCz across AEP
components in Hindi and in American English stimuli for both CV and subtracted (CV-V)
responses. The table displays the significant findings from the mixed model analysis of variance
in which group, condition, and stimulus were the three factors. ‘X’ in the table represent the
significant findings (p < 0.05) and ‘-‘ in the table represent the findings that were not
statistically significant (p > 0.05).
AEP
Component
Language of
stimuli Context Group Condition Stimulus Interaction
P1
Hindi stimuli CV - X X X
CV-V - X X X
American
English stimuli
CV - X X -
CV-V - X X X
N1
Hindi stimuli CV - X X X
CV-V - X X X
American
English stimuli
CV - X X X
CV-V - X X X
P2
Hindi stimuli CV X X X X
CV-V - X X -
American
English stimuli
CV - X X X
CV-V - X X X
N2
Hindi stimuli CV - X X X
CV-V - X X X
American
English stimuli
CV - X X X
CV-V X X X -

141
Table 18. Summary of the significant interactions for peak latencies at FCz across AEP
components in Hindi and in American English stimuli for both CV and subtracted (CV-V)
responses. The table displays the significant findings from the mixed model analysis of variance
in which group, condition, and stimulus were the three factors. ‘X’ in the table represent the
significant findings (p < 0.05) and ‘-‘ in the table represent the findings that were not
statistically significant (p > 0.05).
AEP
Component
Language of
stimuli Context
Group x
Condition
Condition
x
Stimulus
Stimulus
x Group
Group x
Condition
x Stimulus
P1
Hindi stimuli CV - X - -
CV-V - X - -
American
English stimuli
CV - - - -
CV-V - X - -
N1
Hindi stimuli CV - X - -
CV-V - X - -
American
English stimuli
CV - X - -
CV-V - X - -
P2
Hindi stimuli CV - X - -
CV-V - - - -
American
English stimuli
CV - X - -
CV-V - X - -
N2
Hindi stimuli CV - X X -
CV-V - X - -
American
English stimuli
CV - X - -
CV-V - - - -

142
3.8 AEP RESPONSES AT LATERAL ELECTRODE SITES: T7 AND T8
Lateral temporal electrode sites primarily reflect contributions from secondary auditory
cortex generators. Figures 37 - 40 display the grand mean waveforms for the Hindi and
American English stimuli at T7 (figures 37 - 38) and T8 (figures 39 - 40) electrode sites in CV,
V-only, and CV-V waveforms across all three language groups, in quiet. Overall, the responses
were larger at the left electrode site (T7) relative to the right site (T8), except for American
English /pa/. For English /pa/ in quiet an inverse pattern was observed, and the responses were
larger at the right relative to the left.

143
Figure 37. Grand mean waveforms at T7 across language groups in quiet to Hindi stimuli. The
rows represent the different stimuli and the columns display the three language groups. Within
each figure (embedded in grey background), there are three waveforms displaying the findings
from CV, V-only, and CV-V.

144
Figure 38. Grand mean waveforms at T7 across language groups in quiet to English stimuli. The
rows represent the different stimuli and the columns display the three language groups. Within
each figure (embedded in grey background), there are three waveforms displaying the findings
from CV, V-only, and CV-V.

145
Figure 39. Grand mean waveforms at T8 across language groups in quiet to Hindi stimuli. The
rows represent the different stimuli and the columns display the three language groups. Within
each figure (embedded in grey background), there are three waveforms displaying the findings
from CV, V-only, and CV-V.

146
Figure 40. Grand mean waveforms at T8 across language groups in quiet to English stimuli. The
rows represent the different stimuli and the columns display the three language groups. Within
each figure (embedded in grey background), there are three waveforms displaying the findings
from CV, V-only, and CV-V.
Further, the responses were larger in response to Hindi /pha/ and to English /pa/ relative
to other stimuli. Figures 41 - 44 displays the grand mean waveforms for the Hindi and American
English stimuli at T7 (figures 41 - 42) and T8 (figures 43 - 44) electrode sites in CV, V-only, and
CV-V waveforms across all three language groups, in noise. The responses were relatively
smaller in noise relative to in quiet. However, the amplitudes to English /ba/ were larger in noise
relative to those in quiet condition. Further, the amplitudes were larger at the right site in noise,
relative to in quiet. In the following section, the findings from peak amplitudes are presented.

147
Figure 41. Grand mean waveforms at T7 across language groups in noise to Hindi stimuli. The
rows represent the different stimuli and the columns display the three language groups. Within
each figure (embedded in grey background), there are three waveforms displaying the findings
from CV, V-only, and CV-V.

148
Figure 42. Grand mean waveforms at T7 across language groups in noise to English stimuli. The
rows represent the different stimuli and the columns display the three language groups. Within
each figure (embedded in grey background), there are three waveforms displaying the findings
from CV, V-only, and CV-V.

149
Figure 43. Grand mean waveforms at T8 across language groups in noise to Hindi stimuli. The
rows represent the different stimuli and the columns display the three language groups. Within
each figure (embedded in grey background), there are three waveforms displaying the findings
from CV, V-only, and CV-V.

150
Figure 44. Grand mean waveforms at T8 across language groups in noise to English stimuli. The
rows represent the different stimuli and the columns display the three language groups. Within
each figure (embedded in grey background), there are three waveforms displaying the findings
from CV, V-only, and CV-V.

151
3.8.1 PEAK AMPLITUDES OF T7/T8:
Na:
Figure 45 displays the Na amplitudes of grand mean waveforms for the Hindi stimuli at
T7 (left) and T8 (right) in CV, and CV-V waveforms across all three language groups, in quiet
and in noise.
Figure 45. Na peak amplitudes for Hindi stimuli at T7 and T8 in the CV and CV-V waveforms
across language groups in quiet and in noise
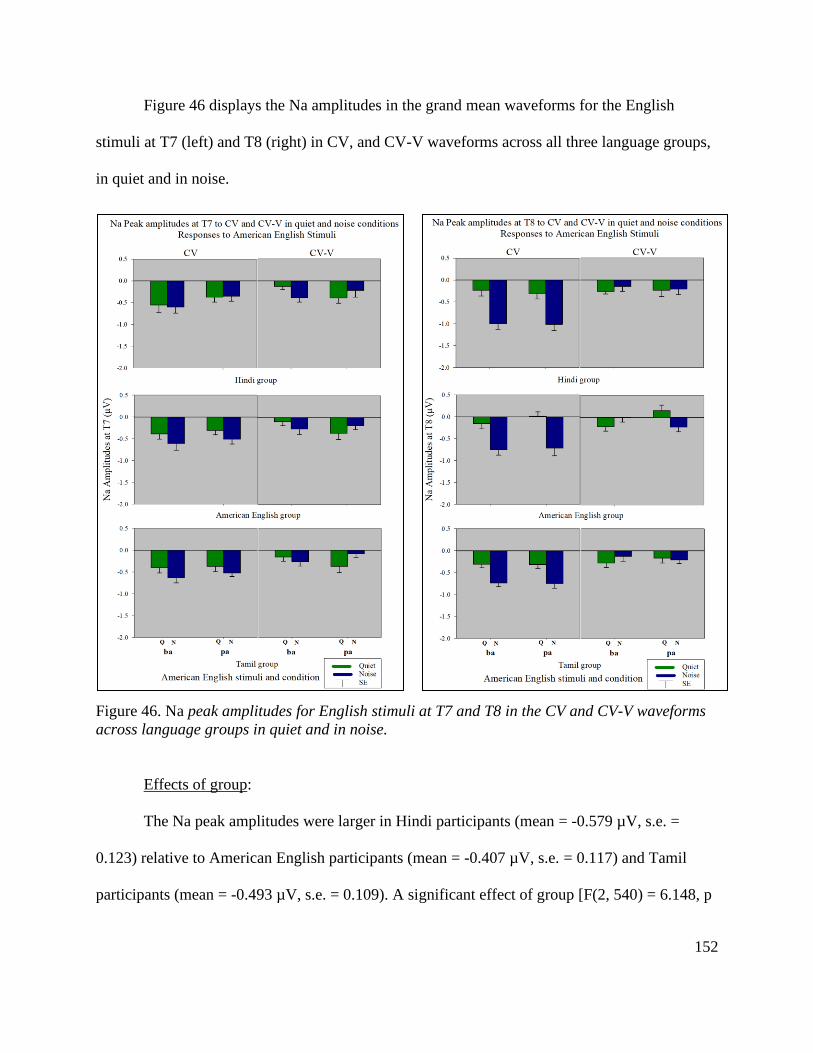
152
Figure 46 displays the Na amplitudes in the grand mean waveforms for the English
stimuli at T7 (left) and T8 (right) in CV, and CV-V waveforms across all three language groups,
in quiet and in noise.
Figure 46. Na peak amplitudes for English stimuli at T7 and T8 in the CV and CV-V waveforms
across language groups in quiet and in noise.
Effects of group:
The Na peak amplitudes were larger in Hindi participants (mean = -0.579 µV, s.e. =
0.123) relative to American English participants (mean = -0.407 µV, s.e. = 0.117) and Tamil
participants (mean = -0.493 µV, s.e. = 0.109). A significant effect of group [F(2, 540) = 6.148, p

153
= 0.002, partial eta-squared = 0.022] was present. This finding was supported by post-hoc testing
where Na peak amplitudes in Hindi participants were significantly larger relative to the Na
amplitudes in American English participants [Hindi vs American English: p < 0.05, Hindi vs
Tamil: p = 0.817, American English vs Tamil: p = 0.785].
Effects of condition:
For the Hindi CV stimuli, the Na amplitudes were larger in noise (mean = -0.727 µV, s.e.
= 0.125) relative to in quiet (mean = -0.259 µV, s.e. = 0.108) and this finding was statistically
significant [F(1, 540) = 137.784, p = 0.000, partial eta-squared = 0.203].
For the American English stimuli, Na amplitudes were larger in noise (mean = -0.681
µV, s.e. = 0.122) relative to in quiet (mean = -0.309 µV, s.e. = 0.114). A significant main effect
of condition [F(1, 360) = 56.424, p = 0.000, partial eta-squared=0.135] was present.
Effects of stimulus:
The Na peak amplitudes were similar for English /ba/ (CV: mean = -0.531 µV, s.e. =
0.124) and for English /pa/ (CV: mean = -0.459 µV, s.e.= 0.112).
Effects of laterality:
No main effects were present.
Interactions:
For the Hindi CV stimuli, a significant interaction of laterality x condition was present
[F(1, 540) = 16.175, p = 0.000, partial eta-squared = 0.029]. The patterns of interaction between

154
laterality x condition was examined using post-hoc testing which showed that responses in quiet
were smaller relative to in noise. Post-hoc analyses indicated that in quiet, the amplitudes were
significantly larger [p < 0.05 for all comparisons] in the left electrode site T7 (mean = -0.333 µV,
s.e.= 0.039), however in noise the responses were larger at the right electrode site T8 (mean = -
0.813 µV, s.e.= 0.039).
For American English CV stimuli, a similar interaction of condition x stimulus was
present [F(1, 360) = 22.550, p = 0.000, partial eta-squared = 0.058]. Post-hoc analyses revealed
that the amplitudes were significantly larger [p < 0.05 for all comparisons, except for T7 in quiet
vs T7 in noise: p = 0.051] in quiet at the left electrode site T7 (mean = -0.399 µV, s.e.= 0.049)
and was larger in noise at the right electrode site T8 (mean = -0.825 µV, s.e.= 0.049).
Ta:
Figure 47 displays the Ta amplitudes for the Hindi stimuli at T7 (left) and T8 (right) in
the CV, and CV-V waveforms across all three language groups, in quiet and in noise.

155
Figure 47. Ta peak amplitudes for Hindi stimuli at T7 and T8 in the CV and CV-V waveforms
across language groups in quiet and in noise
Figure 48 displays the Ta amplitudes of grand mean waveforms for the English stimuli at
T7 (left) and T8 (right) in the CV, and CV-V waveforms across all three language groups, in
quiet and in noise.

156
Figure 48. Ta peak amplitudes for English stimuli at T7 and T8 in the CV and CV-V waveforms
across language groups in quiet and in noise
Effects of group:
The Ta peak amplitudes were similar across all the three language groups for both Hindi
and English stimuli (e.g., CV: Hindi participants: mean = 0.333 µV, s.e. = 0.130), in American
English participants, (CV: mean = 0.392 µV, s.e. = 0.113), and in Tamil participants (CV: mean
= 0.339 µV, s.e. = 0.111).

157
Effects of condition:
The Ta amplitudes to Hindi stimuli were similar in quiet (Hindi CV: mean = 0.315 µV,
s.e. = 0.110) versus in noise (Hindi CV: mean = 0.394 µV, s.e. = 0.126). However, for the
English stimuli, the Ta amplitudes were significantly larger in noise (CV: mean = 0.501 µV, s.e.
= 0.041; CV-V: mean = 0.457 µV, s.e. = 0.037) relative to in quiet (CV: mean = 0.153 µV, s.e. =
0.041; CV-V: mean = 0.107 µV, s.e. = 0.037). A main effect of condition was present [CV: F(1,
360) = 35.165, p = 0.000, partial eta-squared = 0.088; CV-V: F(1, 360) = 44.051, p = 0.000,
partial eta-squared = 0.109].
Effects of stimulus:
The Ta amplitude was smaller for Hindi /ba/ (mean = 0.236 µV, s.e. = 0.113) relative to
Hindi /pa/ (mean = 0.481 µV, s.e. = 0.135) and /pha/ (mean = 0.347, s.e = 0.106). A main effect
of stimulus was present [F(2, 270) = 12.083, p = 0.000, partial eta-squared = 0.042]. The post-
hoc testing added more evidence to support this finding that the Ta amplitude was significantly
smaller for Hindi /ba/ and significantly larger for Hindi /pa/, relative to Hindi /pha/ [p < 0.05 for
all comparisons].
Effects of laterality:
For the Hindi stimuli, the Ta peak amplitudes were similar at right electrode site T8 (CV:
mean = 0.353 µV, s.e. = 0.031; CV-V: mean = 0.255 µV, s.e. = 0.030) and left electrode site T7
(CV: mean = 0.356 µV, s.e.= 0.027; CV-V: mean = 0.298 µV, s.e.= 0.030).

158
Interaction effect:
For the Hindi CV stimuli, there was a significant interaction of condition x stimulus [F(2,
540) = 5.023, p = 0.007, partial eta-squared= 0.018]. Further, post-hoc analyses indicated that the
Ta amplitude to Hindi /ba/ in quiet (mean = 0.118 µV, s.e.= 0.049) was significantly smaller
[/ba/ in quiet: p < 0.05 for all comparisons], relative to other stimuli and condition. For the
American English CV stimuli, no significant interaction of group, condition, or stimulus was
present.
Tb:
Figure 49 displays the Tb amplitudes of grand mean waveforms for the Hindi stimuli at
T7 (left) and T8 (right) in the CV, and CV-V waveforms across all three language groups, in
quiet and in noise.

159
Figure 49. Tb peak amplitudes in the CV and CV-V waveforms for Hindi stimuli at T7 and T8
across language groups in quiet and in noise.
Figure 50 shows the Tb amplitudes in the grand mean waveforms for the English stimuli
at T7 (left) and T8 (right) in CV, and CV-V waveforms across all three language groups, in quiet
and in noise.

160
Figure 50. Tb peak amplitudes in the CV and CV-V waveforms for English stimuli at T7 and T8
across language groups in quiet and in noise.
Effects of group:
The Tb amplitudes were similar in similar in all groups for both Hindi and English
stimuli: for example, in Hindi participants (English CV: mean = -0.446 µV, s.e.= 0.124), English
participants (English CV: mean = -0.494 µV, s.e.= 0.165), and Tamil participants (English CV:
mean = -0.481 µV, s.e. = 0.131).

161
Effects of condition:
Tb amplitudes were larger in quiet (mean = -0.565 µV, s.e. = 0.159) relative to in noise
(mean = -0.371 µV, s.e. = 0.129) and this finding was statistically significant [F(1, 540) =
15.122, p = 0.000, partial eta-squared = 0.027]. For the American English stimuli, the Tb
amplitudes were smaller in noise (mean = -0.342 µV, s.e. = 0.127) relative to in quiet (mean = -
0.605 µV, s.e. = 0.152). This finding was statistically significant [F(1, 360) = 20.080, p = 0.000,
partial eta-squared = 0.052].
Effects of stimulus:
No main effects were present for CV stimuli.
Effects of laterality:
For the Hindi CV stimuli, the Tb peak amplitudes were smaller at the right electrode site
T8 (mean = -0.319 µV, s.e. = 0.036) relative to the left electrode site T7 (mean = -0.617 µV,
s.e.= 0.035). A significant main effect of laterality [F(1, 540) = 35.306, p = 0.000, partial eta-
squared = 0.061] was present.
Also, for the American English stimuli, the Tb peak amplitudes were smaller on right
electrode site T8 (mean = -0.399 µV, s.e. = 0.043) relative to the left site T7 (mean = -0.548 µV,
s.e.= 0.043). This finding was supported by results from analysis of variance and a main effect of
laterality was present [F(1, 360) = 6.387, p = 0.012, partial eta-squared = 0.017].

162
Interactions:
No significant interaction of group, condition, stimulus, or laterality was present for the
Hindi CV stimuli.
In the American English CV stimuli, there was a significant interaction of group x
laterality [F(1, 360) = 3.820, p = 0.023, partial eta-squared = 0.020]. Post-hoc testing revealed
that the P2 amplitudes were significantly larger [American English listeners at T7: p < 0.05 for
all comparisons, except for American English listeners at T7 vs Tamil listeners at T7: p = 0.072]
in American English listeners specifically at the left electrode site T7 (mean = -0.682 µV, s.e.=
0.072), relative to other language groups at the left electrode site T7 (Hindi: mean = -0.461 µV,
s.e.= 0.072; Tamil: mean = -0.499 µV, s.e.= 0.072). Further, the differences in P2 amplitudes
between left T7 (mean = -0.682 µV, s.e.= 0.072) versus right electrode site T8 (mean = -0.304
µV, s.e.= 0.072) were larger in the American English group, relative to the other groups.
Also, there was a significant interaction of stimulus x laterality [F(1, 360) = 4.527, p =
0.034, partial eta-squared = 0.012]. The P2 amplitudes for English /ba/ at the left electrode site
T7 (mean = -0.615 µV, s.e.= 0.058) were significantly larger [/ba/ at T7 vs T8: p < 0.05] relative
to the amplitudes at the right electrode site T8 (mean = -0.341 µV, s.e.= 0.058).
A significant interaction of condition x stimulus x laterality for the American English CV
stimuli was present [F(1, 360) = 4.327, p = 0.038, partial eta-squared = 0.011]. Post-hoc Fisher’s
LSD test supported these findings and it revealed that the P2 amplitudes were smallest for
English /pa/ in noise at the right electrode site T8 (mean = -0.171 µV, s.e.= 0.083) [/pa/ in noise
at T8: p < 0.05 for all comparisons, except /pa/ in noise at T8 vs /ba/ in noise at T8: p = 0.378].

163
Also, it was largest in response to English /pa/ in quiet at the right electrode site T8 (mean = -
0.742 µV, s.e.= 0.083).
P350:
Figure 51 shows the P350 amplitudes in the grand mean waveforms for the Hindi stimuli
at T7 (left) and T8 (right) in CV, and CV-V waveforms across all three language groups, in quiet
and in noise.
Figure 51. P350 peak amplitudes in the CV and CV-V waveforms for Hindi stimuli at T7 and T8
across language groups in quiet and in noise.

164
Figure 52 shows the P350 amplitudes in the grand mean waveforms for English stimuli at
T7 (left) and T8 (right) in the CV, and CV-V waveforms across all three language groups, in
quiet and in noise.
Figure 52. P350 peak amplitudes in the CV and CV-V waveforms for English stimuli at T7 and
T8 across language groups in quiet and in noise.
Effects of group:
The P350 amplitudes were similar in all the three language groups for both Hindi and
English stimuli For example, in Hindi participants (English CV-V: mean = 0.370 µV, s.e. =

165
0.108), English participants (English CV-V: mean = 0.416 µV, s.e. = 0.147), and Tamil
participants (English CV-V: mean = 0.337 µV, s.e.= 0.118).
Effects of condition:
P350 amplitudes for the Hindi stimuli were slightly larger in quiet (mean = 0.384 µV, s.e.
= 0.099) relative to in noise (mean = 0.317 µV, s.e. = 0.092). This finding was statistically
significant [F(1, 540) = 4.317, p = 0.038, partial eta-squared = 0.007].
Effects of stimulus:
No main effects were present for CV stimuli.
Effects of laterality:
The P350 peak amplitudes for the English CV stimuli were smaller at the right electrode
site T8 (mean = 0.294 µV, s.e. = 0.023) relative to the left T7 (mean = 0.410 µV, s.e.= 0.031).
There was a main effect of laterality [F(1, 360) = 8.936, p = 0.003, partial eta-squared = 0.024].
In the subtracted waveforms, the P350 peak amplitudes were similar at right electrode site T8
(mean = 0.333 µV, s.e. = 0.038) and at the left electrode site T7 (mean = 0.416 µV, s.e.= 0.043).
Interactions:
For the Hindi CV stimuli, a significant interaction of condition x laterality was present
[F(1, 540) = 5.528, p = 0.019, partial eta-squared = 0.010]. Post-hoc analyses revealed that the
N2 amplitude was significantly small [in noise at T8: p < 0.05 for all comparisons] in noise at the

166
right electrode site T8 (mean = 0.254 µV, s.e. = 0.032), relative to quiet and to responses at the
left electrode site T7.
For the American English CV stimuli, there was a significant interaction of group x
laterality [F(2, 360) = 3.625, p = 0.028, partial eta-squared = 0.019]. The P350 amplitude was
largest in American English listeners at the left electrode site T7 (mean = 0.462 µV, s.e.= 0.047)
relative to other language groups and was lowest in American English listeners at the right
electrode site T8 (mean = 0.203 µV, s.e.= 0.047). These findings were supported by the results
from post-hoc testing in which responses in American English participants were significantly
large at the right electrode site T8 [American English at T8: p < 0.05 for all comparisons, except
for American English vs Tamil at T8: p = 0.127].
3.8.2 SUMMARY OF RESULTS AT T7/T8 ELECTRODE SITES
Tables 19 and 20 display the summary of peak amplitude measurements at T7/T8
electrode sites. Table 19 display the significant main effects and 20 display the significant
interactions. For the Hindi stimuli, the effect of group was present in Na component. For the
American English stimuli, no main effect of group was observed on the lateral electrode sites.
The effect of condition, stimulus, and interaction were present in various AEP components.

167
Table 19. Summary of the significant main effects for the peak amplitudes at T7/T8 across AEP
components in Hindi and in American English stimuli for both CV and subtracted (CV-V)
responses. The table displays the significant findings from the mixed model analysis of variance
in which group, condition, and stimulus were the three factors. ‘X’ in the table represent the
significant findings (p < 0.05) and ‘-‘ in the table represent the findings that were not
statistically significant (p > 0.05).
AEP
Component
Language of
stimuli Context Group Condition Stimulus Interaction
Na
Hindi stimuli CV X X - -
CV-V X - X X
American
English stimuli
CV - X - -
CV-V - - - -
Ta
Hindi stimuli CV - - X -
CV-V - - X -
American
English stimuli
CV - X - -
CV-V - X X X
Tb
Hindi stimuli CV - X - X
CV-V - X X X
American
English stimuli
CV - X - X
CV-V - - - -
P350
Hindi stimuli CV - X - -
CV-V - X X -
American
English stimuli
CV - - - X
CV-V - - - -

168
Table 20. Summary of the significant interactions for the peak amplitudes at T7/T8 across AEP
components in Hindi and in American English stimuli for both CV and subtracted (CV-V)
responses. The table displays the significant findings from the mixed model analysis of variance
in which group, condition, and stimulus were the three factors. ‘X’ in the table represent the
significant findings (p < 0.05) and ‘-‘ in the table represent the findings that were not
statistically significant (p > 0.05).
AEP
Component
Language
of stimuli Context
Condition
x
Stimulus
Stimulus
x
Laterality
Laterality
x Group
Laterality
x
Condition
Laterality x
Condition x
Stimulus
Na
Hindi
stimuli
CV - - - X -
CV-V - - - - -
American
English
stimuli
CV - - - X -
CV-V - - - - X
Ta
Hindi
stimuli
CV X - - - -
CV-V X X - - X
American
English
stimuli
CV - - - - -
CV-V X - X - -
Tb
Hindi
stimuli
CV - - - - -
CV-V X - - - -
American
English
stimuli
CV - X X - X
CV-V X - - - X
P350
Hindi
stimuli
CV - - - X -
CV-V X - - - -
American
English
stimuli
CV - - X - -
CV-V X X X - -

169
CHAPTER 4: Discussion

170
The overall aim of this work was to determine the encoding and perception of acoustic-
phonetic versus phonemic representations of speech in three different language groups when the
relevant cues were and were not degraded by background noise. The first aim was to determine
whether language groups for whom aspiration and/or voicing is phonemically contrastive show
better perception and differences in encoding these features in noise relative to those who do not
use these features contrastively. The second aim was to determine how the speech perception and
encoding of English aspiration and voicing was similar to or different from the responses to
Hindi aspiration and voicing based on linguistic background, in quiet and in noise. These aims
were examined using behavioral tests and auditory evoked potentials. In this section, the results
will be discussed in the following sub-sections. First, the results of the behavioral and the
auditory evoked potential recording will be discussed in relation to the prior literature. Then, the
limitations of the present study and scope for future research will be discussed. Finally, the
theoretical and practical implications will be described.
4.1. BEHAVIORAL SPEECH PERCEPTION
As hypothesized, when speech sounds that were not present in the native language were
presented, the participants had difficulty identifying or discriminating them. For example, native
English listeners had difficulty identifying the Hindi speech sounds. This was consistent with the
findings from previous research (e.g., Chen & Small, 2015; Elangovan et al., 2011; Shafer et al.,
2004; Sharma & Dorman, 2000a; Small & Werker, 2012; Werker, Gilbert, Humphrey, & Tees,
1981).

171
The identification task in this study allowed listeners to select the category, and thus, was
constrained by the native language. In other words, the orthographic symbols in English and
Tamil limited categorization to two categories or one category for bilabial stop consonants. Even
so, this task allowed evaluation of which native language category was the best fit for a given
non-native speech sound.
The consistent categorization observed in this study can be explained by the VOT
differences in the three languages. For example, mean VOTs for Hindi stop consonants /b/, /p/,
and /ph/ are usually around -85 ms, 13 ms, and 70 ms, respectively and for English bilabial stop
consonants are around 1 ms for /b/ and 58 ms for /p/ and for Tamil /p/ is 12 ms (Lisker &
Abramson, 1964; Davis, 1995). In the current study, the VOT values for Hindi were -90 ms for
/b/, 10 ms for /p/, 45 ms for /ph/ and for American English /b/ these were 19 ms and for /p/ 107
ms. The VOT value for Hindi /p/ was closer to the VOT value for English /ba/ and the VOT for
English /p/ was relatively closer to Hindi /ph/. This explains why the Hindi listeners consistently
perceived the English /ba/ as [pa] and English /pa/ as [pha], and vice versa in the English listeners
to Hindi speech stimuli.
In noise, the percent categorization scores were lower relative to the scores in quiet for
the three language groups. Also, the confusion errors were greater in noise, as expected. These
findings are consistent with previous research (Miller & Nicely, 1955). In noise, the Hindi
participants mis-perceived the aspirated categories as /ha/ for around half of the trials (English
/pa/ [pha] perceived as /ha/ 54% and Hindi /pha/ [pha] as /ha/ 42%). It was also interesting to
note that the Hindi participants were able to access the cues for voicing in all conditions. For
example, even if they had difficulty identifying the phoneme /b/ when it was presented in noise,

172
they still identified /b/ as another voiced speech sound. However, the identification of Hindi /pha/
in these individuals was only 70% in native Hindi participants even in quiet.
The English participants identified English /pa/ as /ha/ in noise; however, they continued
to identify Hindi /pha/ as American English /pa/ even in noise. Hence, it is important to
understand the acoustics of /h/ in the two languages to explain these perceptual differences
across the two groups.
The Tamil participants also identified the Hindi /pha/ and English /pa/ as /a/ in noise
(Hindi /pha/ as /a/ in noise: 34.09%; English /pa/ as /a/ in noise: 30%). Interestingly, this
confusion error was not noted in native participants. The Hindi and the English participants were
certain that there was a constriction when they heard the Hindi /pha/ and English /pa/ even in
noise. This may mean that, in noise, the Tamil participants had difficulty using the acoustic cues
present in the burst. This finding may have occurred because the non-native listeners had
difficulty separating the noise and the consonant segment in Hindi /pha/ that were embedded in
noise, hence identified it as /a/, whereas the native listeners did not. In contrast, /a/ had greater
intensity and was identifiable even in the presence of background noise.
On the closed set response task, for the Hindi stimuli, the Hindi participants showed clear
separation of the three Hindi categories whereas the English or the Tamil participants were
inconsistent in labeling the Hindi stimuli, except for the Hindi /ba/. The English participants did
not perceive the Hindi /ba/ and /pa/ categories as being distinct. The Tamil participants did not
perceive Hindi /pa/ and /pha/ as being distinct. The Tamil participants however had consistent
response categories for Hindi /ba/ and Hindi /pa/; they identified Hindi /ba/ as [ba] and Hindi /pa/
as [pa]. Hence, it appears that although voicing is not present as a phonemic feature in their
native language, they were able to detect the voicing feature, thereby engaging in acoustic-

173
phonetic processing. Then for the English stimuli, the English participants showed clear
separation of the two categories. The Hindi participants did almost as well as the English
participants, but no distinct categories were present in the Tamil group. Also, for a forced choice
task noise was not a problem.
For the discrimination task, an AXB paradigm was used. The main finding was that
percent discrimination scores for English participants were relatively lower than the other two
groups in response to non-native Hindi speech sounds for the voicing contrast, both in quiet and
in noise. This finding could have occurred because both Hindi /ba/ and Hindi /pa/ were perceived
as [ba] by English listeners, as shown in their identification behavior. Hence, when they were
asked to discriminate between Hindi /pa/ versus Hindi /ba/, they had more difficulty because
they associated both stimuli with the American English /ba/ category. Overall, the percent
discrimination scores were greater relative to the identification tasks for all three language
groups. These findings indicate that the voicing and aspiration cues are available to the listeners
for discrimination, which allowed for discrimination well above chance levels. The findings are
consistent with previous literature that show that performance can be better in discrimination
than in identification (Carlet & Cebrian, 2015; Hisagi et al., 2014).
Goodness ratings and reaction times were also measured in the behavioral tasks.
Goodness ratings were measured in the open-set identification task. The goodness ratings were
often at ceiling level, except in Hindi participants who rated the American English stimuli lower
than Hindi stimuli. Higher goodness ratings illustrate that the listeners perceived all the speech
sounds present in the study as relatively good exemplars of native language categories. This
pattern suggests that pre-voicing is acceptable in English and is consistent with the literature
(Davidson, 2016; Hunnicutt & Morris, 2016). Specifically, Hunnicutt and Morris observed that

174
prevoicing was common in Southern American English accents. They measured VOT in word
initial stops using 951 tokens produced by 13 speakers from Mississippi and Alabama and
observed that prevoicing (VOT: mean = -92.6 ms; s.d. = 23.7) was present in 77.8% of the
utterances.
Reaction times were measured in the other two behavioral tasks including identification
task B and discrimination task. In terms of reaction times, longer reaction times were present in
noise, relative to quiet conditions. Also, the mean reaction times were shorter for the American
English stimuli relative to Hindi stimuli. This finding adds to the evidence that the aspiration
versus short-lag contrast in the Hindi speech sounds was relatively difficult to process.
Examination of the figures for the stimuli reveal that the aspiration was more intense for the
American English than the Hindi stimuli, which would account for this difference.
Taken together, speech perception was more difficult for non-native listeners relative to
native listeners, specifically in noise; these findings were consistent with the literature (e.g.,
Calandruccio et al., 2014; Jin and Liu, 2012; Mattys et al., 2012). The results from the labeling
matrices provide evidence that for behavioral perception, non-native speech sounds undergo
perceptual assimilation into native-language categories. In addition, the different patterns of
assimilation for speakers of the different languages indicated that the acoustic-phonetic features
of VOT and aspiration were available for some tasks, such as discrimination, even when the
speech sound is not present in their native language.

175
4.2 NEUROPHYSIOLOGIC PROCESSING OF SPEECH SOUNDS: CENTRAL AND
LATERAL SITES
The results for the auditory evoked potentials will be discussed in two sub-sections. First,
the morphology of the waveforms, and the presence of additional peaks will be discussed. Then,
the findings from peak amplitudes at FCz and lateral sites (T7/T8) will be discussed. The
findings from peak latencies at FCz will also be described in this section.
Morphology of the waveforms:
In terms of effect of group, the morphology of the grand mean waveforms was similar
across language groups (Hindi, American English, and Tamil). Even in Tamil participants, who
do not have aspiration and voicing as a phonemic feature, the AEP morphology was similar to
that of the other two language groups. These findings indicate that the acoustic details of voicing
and aspiration were encoded at the level of AEPs. In other words, the information is encoded,
even if it is not necessarily used.
In terms of the effect of noise, all the peaks responses were attenuated in noise relative to
quiet, except for P1. The finding was consistent with previous literature in which smaller
amplitudes or prolonged latencies were observed in noise (Martin et al., 1997, 1999, 2005;
Whiting et al., 1998; Dimitrijevic et al., 2013), except for P1 (Billings, McMillan, Penman, &
Gille, 2013). However, in this study the P1 amplitudes were small in quiet and were larger in
noise both for Hindi and American English stimuli. This was an interesting finding in this study
because in Billings et al. (2013) the P1 amplitudes were close to the noise floor; however, in this
study the P1 amplitudes were larger in noise. Although there is very little previous literature in
the AEP literature to help us interpret this finding, this pattern in response was observed in visual

176
ERP literature where larger P1 amplitudes were observed in noise relative to in quiet due to
greater processing demands (Finnigan, O'Connell, Cummins, Broughton, & Robertson, 2011;
Mangun, Hopfinger, Kussmaul, Fletcher, & Heinze, 1997). In contrast, P2 peak amplitudes were
large in quiet and smaller in noise. This finding in the current study serves as evidence to support
previous research in which P2 is an AEP component that can be closely associated with the
behavioral results; the reduced P2 amplitudes can be related to poorer speech perception in the
presence of background noise (Billings et al., 2013).
Further, consistent with previous research (Näätänen & Picton, 1987; Hyde, 1997), N1
was found to be a better indicator for acoustic characteristics of the stimulus in this study.
Additional peaks were present in the N1 region in the CV responses to Hindi /ba/ in quiet and for
American English /pa/ in noise (Refer to section 3.5 for details). The additional peaks in the N1
region for the CV speech sound Hindi /ba/ corresponded to prevoicing; it was also present in the
subtracted waveforms and the timing of the additional peaks corresponded to prevoicing. These
findings were also consistent to the additional negativity that was observed in some AEP
research on VOT (Sharma & Dorman, 1999). In this study, additional peaks were also observed
in noise, e.g., in the CV responses to English /pa/ It should be noted that the additional peaks in
response to CV speech sound English /pa/ was present only in the presence of noise; it was also
interesting to observe that these additional peaks were absent in the subtracted waveforms. This
indicates that the additional peaks could be related to the overlapping response to the vowel
segment and its interaction with noise.
One interesting finding in this study that was not hypothesized was the similarity between
behavioral findings and AEP results in terms of morphology of the waveforms. Consistent with
the behavioral results, the morphology in response to Hindi /pha/ was similar relative to English

177
/pa/, which is phonetically [pha]. Likewise, the morphology for Hindi /pa/ was similar to English
/ba/, which is phonetically [pa]. As explained in section 4.1, these findings are not surprising
given the somewhat equivalent phonetic realization. The morphology of the waveforms for Hindi
/ba/ were different because of the presence of prevoicing in the stimulus. It added to the existing
evidence that these speech sounds were primarily processed based on acoustic-phonetic
representations, rather than phonemic representations. Many languages have pre-voicing for the
/ba/ category (e.g., Spanish). But few make use of both VOT and aspiration. Thus, it would be
interesting to also examine neural responses to speakers of languages with the two-way
distinction using pre-voiced versus short-lag phonetic cues.
Peak amplitudes and latencies:
An interesting finding was that effects of group were present in the GFP (which reflected
contributions from all electrodes), in the central electrode site (FCz) waveforms, and in the
lateral electrode site waveforms (T7/T8) across various AEP components in this study. P1 peak
amplitudes were larger in Hindi participants relative to the other language groups, at both the
central and lateral electrode sites. Also, the P2 amplitudes were larger in native Hindi
participants for Hindi stimuli relative to non-native participants (but only in the subtracted
waveforms – see appendix). The finding of this difference only for the subtraction, however,
suggest that it is related to the consonant rather than the vowel portion. The larger P1 for Hindi
participants may indicate more faithful encoding of the acoustic-phonetic details. However, few
studies have reported cross-linguistic differences in AEPs (Han, Bahng, & Park, 2013).
In terms of latency, as expected, the P2 latency was shorter in Hindi participants and N2
latency was longer in Tamil participants. Studies using MMN have observed larger amplitudes

178
and shorter latencies speech contrasts for native compared to non-native listeners (Sharma &
Dorman, 2000). However, most studies to date have observed language group differences in the
P1-N1-P2 AEPs (Chen et al., 2015; Elangovan & Stuart, 2011; Small & Werker, 2012) and very
few have observed group differences in the P1-N1-P2 AEPs (Han, Bahng, & Park, 2013;
Wagner, Shafer, Martin, & Steinschneider, 2013) .
In terms of stimulus, as expected, /ba/ had the shortest latency for P1, N1, P2, and N2.
This finding was also consistent with the previous research in which latencies were more
prolonged with increases in VOT, thereby reflecting the stimulus characteristics (Elangovan &
Stuart, 2011; Han, Bahng, & Park, 2013; Sharma & Dorman, 2000a; Toscano, McMurray,
Dennhardt, & Luck, 2010). Further, in this study, larger P2 and N2 amplitudes were present in
response to Hindi /pha/ and larger P1 and N1 amplitudes were present in response to Hindi /pa/.
This finding was also consistent with previous findings in which larger P1, N1, P2 amplitudes
were present to aspirated sounds when compared to unaspirated sounds. This pattern is probably
related to the greater overall energy in aspirated relative to unaspirated sounds (Han et al., 2013).
In terms of condition, AEP peak amplitudes were larger, and latencies were shorter in
quiet when compared to the latencies in noise. This pattern of findings was consistent with the
previous literature in which less synchronous firing of the neurons lead to reduced peak
amplitudes or longer latencies in noise relative to quiet conditions (e.g., Dimitrijevic et al., 2013;
Martin et al., 1997, 1999, 2005; Whiting et al., 1998).
Interactions between group, condition, or stimuli were also present in the current study.
The most common interaction was between condition and stimulus. For example, the N1, P2, and
N2 peak amplitudes to English /ba/ were larger in noise, relative to the amplitudes for English
/pa/. This finding illustrated that voicing cues including VOT were likely more preserved relative

179
to aspiration in noise and suggests that aspiration is a more subtle, transient acoustic cue than
VOT (Wright, 2004). The latencies were also often shorter in quiet relative to the latencies in
noise to both Hindi and English stimuli.
Significant interactions between group and stimulus or group, stimulus and condition
were also present in this study. For example, P1 amplitudes were larger in Hindi participants for
the Hindi speech sound /pha/. Further, interactions between group, condition, and stimulus
indicated that the P1 peak amplitudes were larger for Hindi /pha/ in Hindi participants in quiet.
This finding served as additional neurophysiologic evidence to the existing literature to indicate
that native listeners have better neural synchrony relative to non-native listeners (Elangovan &
Stuart, 2011; Han, Bahng, & Park, 2013; Sharma & Dorman, 2000a).
While findings and interactions were often consistent with the hypotheses, there were
some unexpected and interesting significant interactions as well. For example, the N2 peak
latency in response to Hindi /pa/ was slightly longer relative to Hindi /pha/ in American English
listeners. Usually, one might expect longer latencies for Hindi /pha/ relative to Hindi /pa/ due to
its increased VOT. However, the finding in this study was unexpected. Prolonged latencies for
Hindi /pa/ could have occurred because the Hindi /pha/ was linguistically processed in American
English participants and they assimilated the Hindi /pha/ into their phonetic category of English
/pa/ based on acoustic phonetic similarity. However, they might have had some difficulty finding
a good exemplar for Hindi /pa/, thereby resulting in prolonged N2 latencies for Hindi /pa/
relative to Hindi /pha/. This AEP finding was consistent with the findings from forced choice
identification task. In this task the American English participants identified the Hindi /pa/ as [ba],
but the percent categorization scores were lower than for the Hindi prevoiced /ba/. So, this
suggests that Hindi /pa/ was not necessarily a good example of the English /ba/ category.

180
Another interesting interaction included a significant interaction of condition and
stimulus interaction for the N2 peak latencies. The N2 latencies in response to Hindi /ba/ were
similar in quiet (mean = 366 ms, s.e = 3.5) and in noise (mean = 371 ms, s.e = 3.5). However, for
Hindi /pa/ and Hindi /pha/, the latencies were significantly longer in noise relative to in quiet. For
example, the N2 peak latency for Hindi /pha/ in quiet was 414 ms (s.e = 3.524), relative to in
noise 440 ms (s.e = 3.524). This finding served as a potential indicator that aspiration was
difficult to process in noise, relative to voicing. This is the first ERP study to examine aspiration
in quiet versus in noise; and the finding that aspiration was difficult to process relative to voicing
is an important one.
Hemispheric differences at the lateral temporal sites T7/T8:
Cerebral asymmetry was present in this study in native and in non-native listeners, both
in quiet and in noise. For the Hindi stimuli, larger Na, Ta peak amplitudes and for the American
English stimuli, larger Ta and Tb peak amplitudes were present on the left hemisphere relative to
the right. This finding was consistent with the previous research in which speech segments were
predominantly processed on the left hemisphere (Belin, Zilbovicius, Crozier, Thivard, Fontaine,
Masure, & Samson, 1998; Binder, Frost, Hammeke, Bellgowan, Springer, Kaufman, & Possing,
2000; Zaehle, Wustenberg, Meyer, & Jancke, 2004). However, few studies have specifically
examined laterality in relation to speech at the temporal sites. Specifically, temporal
information, linguistic segments including tones (e.g., Mandarin tonal segments when perceived
by native listeners), phonemic segments, meaningful words, or temporal information were
processed in the left hemisphere; whereas, spectral information, non-linguistic sounds and cues

181
(including gestural cues or suprasegmental) were processed in the right (See Zatorre, Meyer,
Gjedde, & Evans, 1996, Zatorre & Belin, 2001, Zatorre & Gandour, 2008 for review papers).
In the current study, in quiet, increased Na and Ta amplitudes were present in the left
hemisphere, both for Hindi and American English stimuli. Further, larger Ta amplitudes were
present in the right hemisphere relative to the left, in quiet; this finding could possibly indicate
either spectral or non-linguistic processing of the stimulus (Gandour, Wong, Lowe, Dzemidzic,
Satthamnuwong, Tong, & Li, 2002; Hall, Johnsrude, Haggard, Palmer, Akeroyd, &
Summerfield, 2002; Zatorre & Belin, 2001).
There were also interactions between laterality versus group, and laterality versus
stimulus. The Ta and Tb amplitudes were larger at the left electrode site in native American
English participants for the American English stimuli. This finding was also consistent with
previous T-complex literature in which larger Tb responses were observed in native listeners at
left temporal posterior site (Wagner, Shafer, Martin, & Steinschneider, 2013). Also, the peak Ta
and Tb peak amplitudes were larger in response to English /ba/ in the left hemisphere (relative to
right hemisphere) and to English /pa/ in the right hemisphere (relative to left hemisphere).
Further, the significant interaction between condition x stimulus x laterality revealed that the Ta
peak amplitudes to Hindi /pha/ in quiet were larger on the left hemisphere than right. These
findings served as evidence that cerebral asymmetry might be prominent on the left hemisphere
to speech sounds, specifically in quiet (Belin et al., 1998; Binder et al., 2000; Shtyrov et al.,
1999; Wagner, Shafer, Martin, & Steinschneider, 2013; Zatorre & Belin, 2001).
In noise, greater right hemisphere amplitude was seen both for Hindi and American
English stimuli, and this was reflected in Na peak amplitude. This is another important finding. It
is consistent with the hypothesis and with previous research (Bidelman & Howell, 2016; Coffey,

182
Chepesiuk, Herholz, Baillet, & Zatorre, 2017; Shtyrov et al., 1999; Vander Ghinst et al. 2019;
Zattore & Belin, 2001). The increased amplitudes at T8 in noise could have occurred because
temporal information is predominantly processed in the left hemisphere and spectral information
is processed in the right hemisphere. In noise, spectral peaks served as an important cue because
formant peaks were more likely to be preserved in background noise relative to the temporal
cues (Assmann & Summerfield, 2004). The increased right hemisphere activation in noise could
also indicate the recruitment of additional brain regions for processing speech in noise (Assmann
& Summerfield, 2004; Shtyrov et al., 1999).
Taken together, the results in this study demonstrate that although listeners could not
identify the non-native speech sounds on behavioral tasks, the AEP findings indicated that
voicing, VOT, and aspiration were encoded in the auditory cortex, even if the speech sounds
were not present in the native language and even if the information could not be further
processed and used for behavioral perception (e.g. Tamil or American English participants
listening to Hindi /pha/). Further, in terms of laterality, the current study provided further
evidence to the existing literature that speech in quiet was predominantly processed in the left
hemisphere and additional brain regions in the right hemisphere were involved in the presence of
background noise (e.g., Shtyrov et al., 1999; Zatorre et al., 1996). The pattern of results in the
current study were complex and were dependent on many factors, including stimulus (e.g.,
English /ba/ vs /pa/), linguistic background, and AEP components of interest in a study.

183
4.3 RELEVANCE OF FINDINGS IN THIS STUDY TO MODELS RELATED TO
LINGUISTIC PROCESSING OF SPEECH IN NOISE
In this study, two models related to cross-linguistic processing of speech in noise were
relevant. Given below is a brief description of how the findings from the present study support or
fail to support these models.
Perceptual Assimilation Model (PAM-L2)
The behavioral findings specifically from the identification test A (write the sound heard)
can be used to understand the patterns of perceptual assimilation in this study. Consistent
patterns of perceptual assimilation were observed in the present study. For example, the Hindi
participants identified the English /pa/ [pha] as Hindi /pha/ [pha] and English /ba/ [pa] as Hindi
/pa/ [pa], both in quiet and in noise. In the context of PAM-L2 speech perception model, the
Hindi participants perceptually assimilated both the non-native speech sounds that were
presented in this study (i.e., English /ba/ [pa], and English /pa/ [pha]) as categorized exemplars
of native speech sounds, i.e., Hindi /pa/ and Hindi /pha/ respectively.
A similar pattern in the findings was observed in American English participants where
they identified Hindi /pha/ [pha] as English /pa/ [pha]. In reference to PAM-L2 model, these
participants perceptually assimilated the Hindi /pha/ [pha] as a categorized exemplar of English
/pa/ [pha]. Alternatively, the Hindi /pa/ [pa] and Hindi /ba/ [ba] were categorized as the same
sound (i.e., English /ba/ [pa]) with Hindi /ba/ [ba] (86.81% categorization scores on labeling
matrice) being a better exemplar relative to Hindi /pa/ [pa] (60.00% categorization scores on
labeling matrice).

184
The Tamil participants perceptually assimilated all the Hindi stimuli and English stimuli
as /pa/ in quiet because the Tamil participants had only one grapheme in their native language to
represent the Hindi and English stimuli. However, it appears that in noise, these participants
perceived the Hindi /pha/ [pha] and English /pa/ [pha] as an uncategorized consonant that
resembles the /pa/ and /ha/. For example, the Tamil participants identified the Hindi /pha/ as /ha/
28.98% of the time and as /pa/ 25.57% of the time, in noise. Similarly, they identified the
English /pa/ as /pa/ 10.63 % of the time and as /ha/ 33.75% of the time, in noise.
This pattern of categorization in which the acoustic-phonetically similar English /pa/
[pha] and Hindi /pha/ [pha] were categorized as /ha/ was observed not only in non-native
participants but also in the native participants when the stimuli was presented with background
noise. This finding is consistent with previous literature (i.e., Cooke et al. 2008) that examined
factors influencing the release of masking (Cooke et al, 2008). In this case, with both the speech
sounds (i.e., English /pa/ and Hindi /pha/), the aspiration following the plosive could have been
misallocated as the fricative /h/ due to the misallocation of audible segments of the masker to
arrive at incorrect identification of the signal resulting in speech perception errors.
Taken together, In the Hindi and American English participants, a consistent pattern in
perceptual assimilation was present across both the identification tasks. The English participants
mapped the Hindi /pha/ as the American English /pa/ and Hindi /pa/ as the American English
/ba/. A similar pattern of mapping based on acoustic-phonetic representations was also observed
in the Hindi participants for the American English speech sounds. However, the Hindi
participants showed lower categorization scores for the AE speech sounds and generally showed
lower scores for American English /ba/ [pa] and /pa/ [pha] stimuli than the American English
groups. These findings serve as further evidence to support models of non-native speech

185
perception that propose that listeners assimilate non-native speech sounds into first language
categories (Best et al., 1988; Best, 1995; Best & Tyler, 2007). Overall, these findings illustrate
that the patterns of perceptual assimilation are different in quiet versus in noise, but also are
influenced by the native language phonological system.
Automatic Selective Perception (ASP) Model
The different patterns of perception across groups in this study suggests that the
accessibility to the various phonetic cues were automatic only to native listeners (Nabelek &
Donahue, 1984; Takata & Nabelek, 1990; Strange, 2011). These findings are consistent with
previous explanations that when the target signal is degraded by noise the differences between
native versus non-native listeners in speech perception become more evident (e.g., Mattys,
Davis, Bradlow, & Scott, 2012; Mayo et al., 1997; Meador et al., 2000). For example, the Tamil
participants had higher percent categorization scores relative to Hindi participants for the non-
native American English stimuli in quiet. However, the group difference between native English
participants and the non-native listeners of American English (i.e., Tamil participants) were more
evident in noise.
It appears that the Automatic Speech Perception (ASP) model (Strange & Shafer, 2008)
holds even in noise where native listeners have automatic processing of the speech cues. In the
presence of background noise, listeners fall back on the native language routines, hence
perception degrades more for non-native listeners relative to native listeners.
The findings from this study illustrate that aspiration cues were more influenced by noise
relative to the voicing cues. For example, all three language groups in noise identified both the
Hindi /ba/ and English voiced /ba/ as either [ba] or another voiced speech sound (e.g., /va);

186
however, for the Hindi /pha/ and English /pa/, no clear pattern was evident. More importantly, the
Tamil group that had neither voicing nor aspiration used acoustic-phonetic processing in the
identification task B to detect voicing feature with higher categorization scores relative to
aspiration feature, both in quiet and in noise. The Tamil participants had difficulty identifying
both Hindi /pha/ and English /pa/. As expected, poorer accuracy on the behavioral identification
task for aspirated speech sounds were present in Tamil listeners, because aspiration is not
phonemic in Tamil (e.g., Bradlow & Alexander, 2007). An interesting question is why aspiration
is more difficult for these individuals than the voicing contrast. Either the results could mean that
the aspiration contrast was difficult relative to the voicing contrast for non-native listeners with
neither voicing nor aspiration contrasts in their native language. Or, there is a possibility that the
L2 experience with voicing in English had impacted their identification of Hindi voiced stops.
There is some previous evidence (Kraljic & Samuel, 2006) that perceptual learning of stop
contrasts (i.e., /b/ and /p/ in English language as L2 learners) can generalize to new phoneme
contrasts (i.e., /b/ and /p/ Hindi stimuli that were presented in this study). Hence, the results from
this study also contributes to the understanding of factors which can modify the phonological
filter imposed on an individual by the native language.
To date, the ASP model has not been test using AEP measures. Hence, the findings from
the present study have important theoretical significance. The AEP components of interest in this
study are predominantly obligatory in nature. Hence, it was not surprising to observe similar
morphology in the AEP waveforms in the non-native participants (e.g., Tamil and Hindi
participants to English stimuli and Tamil and English participants to Hindi stimuli). However,
while most previous literature have observed main effects of group at the lateral sites (Han,
Bahng, & Park, 2013; Wagner, Shafer, Martin, & Steinschneider, 2013), in this study main

187
effects of group were observed at the lateral sites (T7/T8), in the MGFP waveforms and at
central site (FCz). For example, significant interactions between group and stimulus or group,
stimulus and condition were present. The P1 peak amplitudes were larger in native Hindi
participants for Hindi /pha/ in quiet. This is an important finding and serves as the first
neurophysiologic evidence to support the ASP model.
4.4 LIMITATIONS OF THE STUDY AND SCOPE FOR FUTURE RESEARCH
Across all of the analyses, there was variation in the effect sizes obtained for the
statistically significant findings. For example, there were several significant findings in the
present study with small effect sizes (Refer to the appendices for complete ANOVA tables). Out
of the 132 statistically significant findings, only 19 had large effect sizes (i.e., >0.5) and 10
findings had medium effect sizes (i.e., 0.3 - 0.5). Findings that had the large effect sizes were the
most obvious ones, specifically, significant group effects where native listeners had greater
percent categorization scores relative to non-native listeners or when latencies were longer for
speech sounds with increased voice onset time (e.g., English /pa/) and in noise. Further, the
significant interactions of condition by stimulus had large effect size. Although these findings
were consistent with previous literature, there was less novelty to it. In this study, the significant
interactions between group, and stimulus, group and laterality, group by condition by stimulus,
condition by stimulus by laterality, and stimulus by laterality were the findings that added a new
dimension to our current perspective of cross linguistic speech perception in noise, but these
findings, though statistically significant, had small effect sizes. This was a limitation. However,
most of these findings were consistent with the hypotheses and with the behavioral findings in

188
this study; this adds to the internal validity and reliability of the current study and provides
additional support to the existing literature.
The recruitment of the Hindi and Tamil participants took place in the United States. If the
same study was to be carried out in India in a group of monolingual Hindi speaking participants
and in Tamil speaking participants, then the findings might be different. Both Hindi and Tamil
participants in this study had experience with English. Further, some of the Tamil participants
had some exposure to Hindi. Mean values were computed with and without the Tamil
participants with Hindi exposure and the group mean values were similar and remained within
±1SD. Although the findings from these participants were not different from those Tamil
participants without exposure to Hindi, overall, the exposure to multiple languages in the three
language groups could have influenced the findings of this study.
The interpretation of the results would be easier to interpret in this study if synthetic
speech was used, as there would have been better control of the independent variables and
resulting morphology. However, there is a trade-off between making a study more naturalistic by
using natural digitized speech stimuli versus controlling the acoustic detail of the stimulus to
ensure that the response to specific acoustic features of the stimulus can be teased apart. The use
of natural speech in this study helped in maintaining the ecological validity of the study.
However, it would be interesting to compare the findings in this study with findings from
synthetic speech and could be explored in future research.
4.5 IMPLICATIONS
The results of the current study have both theoretical and practical significance. They
contribute towards better understanding of acoustic-phonetic versus linguistic-phonemic

189
processing of speech sounds. This study also facilitates understanding of the perception versus
encoding of aspiration relative to voicing, regardless of the linguistic background. Further, the
present study expanded our knowledge on how these two acoustic cues were processed in noise.
The behavioral and electrophysiologic results from this study provided further evidence
to support existing PAM-L2 and ASP models of non-native speech perception (Best, 1995, Best
& Tyler, 2007; Strange & Shafer, 2008). More specifically, the evidence for perceptual
assimilation of non-native speech sounds in all the three language groups provided further
evidence to support the PAM and PAM-L2 (Best, 1995; Best & Tyler, 2007). The increased
differences in performance between native versus non-native listeners in the behavioral tasks
provided additional evidence to support the ASP model (Strange & Shafer, 2008). Specifically,
this study was the first to test the ASP model using AEP measures. In addition, the results from
the current study contributed for a possible extension of the ASP model due to two reasons: First,
the aspiration cues were difficult to process relative to voicing cues specifically in noise, even in
native listeners. Hence, there is a need to include that the selective perceptual routines in the ASP
model can be different for various acoustic cues thereby making some routines difficult to access
in noise relative to others, even in native listeners. Second, it appears that non-native participants
can perceive and encode speech sounds using acoustic-phonetic processing. For example, in
Tamil participants although neither voicing and aspiration are phonemically contrastive, these
participants were able to detect voicing cues more consistently relative to aspiration cues. As
discussed before, this could be because of L2 influence (i.e., English). Hence, a possible
extension could include that the SPRs in the native language can be influenced by an individual’s
linguistic exposure to other languages; thereby modifying the phonological filter that is imposed
on an individual by the native language.

190
The study could also be relevant for pedagogical purposes, when performing second
language training or auditory training to monitor improvements with training (e.g., Rivera-
Gaxiola et al., 2000). The speech in noise condition used in this study is loosely analogous to
hearing loss because of the difficult to listen condition that it emulates. In the past research, band
pass or broad noise have been used to simulate hearing loss (Martin et al., 1997, 1999, Whiting
et al., 2007). Hence, the results of the current study from a clinical perspective could be useful
when examining non-native speech perception in clinical population including those with deficits
in auditory processing (Norris, McQueen, & Cutler, 2003; Pallier, Sebastian-Galles, Dupoux,
Christophe, & Mehler, 1998).

191
CHAPTER 5: Summary & Conclusions

192
The results of this study contribute towards better understanding of the similarities and
differences in phonetic versus phonological processing and encoding of speech in quiet and in
background noise. Overall, this study determined the encoding and perception of acoustic-
phonetic versus phonemic representations of speech in three different language groups when the
relevant cues are degraded by background noise. The inclusion of native Hindi, American
English, and Tamil listeners provided an opportunity to compare a language group that has both
aspiration and voicing in its phonetic inventory (Hindi) versus a language group in which voicing
is a phonemic feature and aspiration is an allophonic variation (American English) versus a
language group in which neither voicing or aspiration exists as phonemic features and voicing
exists as an allophonic variation (Tamil).
The combined findings from the behavioral tests and the AEP recording in this study
serve as an evidence that although non-native sounds are difficult to identify in behavioral tasks,
they are processed at the cortex using acoustic-phonetic processing. The present study helps us
understand the patterns of perceptual assimilation in non-native listeners and that these findings
can be consistent in both behavioral tests and in AEP recording. Lastly, the findings from this
study serve as an evidence that the Automatic Speech Perception model holds good in noise.
This finding is important, given that the ASP model is designed to predict behavior in difficult
listening conditions.

193
APPENDICES
Table 21. Detailed linguistic profile of Hindi participants. All Hindi participants were L2
speakers of English (n =16).
Broad areas Specific areas
L1 L2
Mean SD Mean SD
Self-
reported
proficiency
Speaking 9.31 0.87 9.19 0.83
Understanding 9.38 0.72 9.13 0.89
Reading 7.88 1.75 9.50 0.82
Age
milestones
(yrs)
Started
learning 2.41 2.17 3.38 2.09
Attained
fluency 5.94 2.98 8.81 4.20
Started
reading 7.25 2.52 5.94 3.09
Attained
reading
fluency 9.53 2.61 8.19 2.93
Immersion
duration
(yrs)
Country 22.78 8.61 18.53 9.87
Family 19.03 10.96 13.84 12.01
School 17.03 7.59 19.17 8.40
Contribution
to language
learning
Friend 8.38 1.82 8.94 1.00
Family 8.13 3.26 5.88 3.83
Reading 7.69 2.47 9.50 0.82
Self-
instruction 3.88 4.03 5.50 4.38
TV 8.13 2.68 8.88 1.45
Radio 5.13 3.98 4.75 3.70
Extent of
language
exposure
Friends 6.63 2.90 9.25 0.93
Family 7.56 3.79 4.75 4.02
TV 4.94 3.86 9.69 0.70
Radio 6.50 3.48 7.81 2.26
Reading 2.88 3.12 9.63 0.89
Independent
Study 2.38 3.72 3.13 4.00
Self-report
of foreign
accent
Perceived by
self 1.44 2.34 4.44 2.45
Identified by
others 0.94 1.73 4.88 2.85

194
Table 22. Detailed linguistic profile of English participants (n = 16). L2 was Spanish in three
participants.
Broad areas Specific areas L1 L2
Mean SD Mean SD
Self-
reported
proficiency
Speaking 9.94 0.25 6.40 0.55
Understanding 9.88 0.34 6.80 1.48
Reading 9.88 0.34 7.20 0.84
Age
milestones
(yrs)
Started
learning
0.19 0.54 9.40 6.80
Attained
fluency
3.50 1.86 14.00 5.79
Started
reading
4.50 1.59 11.40 4.39
Attained
reading
fluency
5.47 1.63 14.00 6.38
Immersion
duration
(yrs)
Country 29.25 6.78 5.38 9.88
Family 28.81 7.15 15.60 14.47
School 24.56 8.85 9.90 9.21
Contribution
to language
learning
Friend 9.31 1.74 4.20 3.90
Family 9.38 2.03 4.80 3.83
Reading 9.38 1.41 6.60 1.52
Self-
instruction
7.38 4.01 7.00 1.41
TV 8.69 2.89 5.60 0.89
Radio 8.75 1.57 4.60 3.05
Extent of
language
exposure
Friends 9.69 0.60 2.60 2.79
Family 9.75 0.58 4.20 3.42
TV 9.19 2.07 4.20 1.48
Radio 8.94 1.34 4.80 3.27
Reading 9.19 1.38 5.00 3.32
Independent
Study
6.25 4.77 3.60 2.70
Self-report
of Foreign
accent
Perceived by
self
0.31 0.70 5.20 2.95
Identified by
others
0.13 0.34 5.40 3.21

195
Table 23. Detailed linguistic profile of Tamil participants. All Tamil participants were L2
speakers of English (n =16).
Broad areas Specific areas
L1 L2
Mean SD Mean SD
Self-
reported
proficiency
Speaking 9.94 0.25 9.22 1.08
Understanding 10.00 0.00 9.44 0.89
Reading 7.03 3.40 9.63 0.81
Age
milestones
(yrs)
Started
learning 0.15 0.33 4.00 1.86
Attained
fluency 3.97 1.55 10.81 4.31
Started
reading 7.86 5.02 5.72 2.16
Attained
reading
fluency 9.00 3.39 8.78 2.50
Immersion
duration
(yrs)
Country 24.13 8.31 18.33 9.79
Family 26.06 4.89 8.19 11.35
School 16.88 9.26 17.13 9.56
Contribution
to language
learning
Friend 8.19 2.07 8.38 1.75
Family 9.19 1.38 4.44 2.87
Reading 6.38 3.26 8.94 1.24
Self-
instruction 5.50 4.20 5.63 3.58
TV 8.38 1.78 8.38 1.75
Radio 6.31 3.20 6.06 2.84
Extent of
language
exposure
Friends 7.84 1.84 8.13 2.36
Family 7.94 3.02 3.81 2.56
TV 7.22 3.11 8.94 1.18
Radio 7.03 3.28 8.06 1.98
Reading 3.94 3.30 8.88 1.41
Independent
Study 3.31 4.05 5.25 3.96
Self-report
of Foreign
accent
Perceived by
self 0.13 0.34 5.94 2.93
Identified by
others 0.06 0.25 6.78 2.97

196
196
Note: The ANOVA tables for the AEP results are given below in the appendices. The numbers in red represent significant findings.
Table 24. Mixed model ANOVA results of peak amplitudes in CV and CV-V waveforms for Hindi stimuli at FCz.
P1 N1 P2 N2
Degr.
of
freedom
MS F P MS F p MS F p MS F P
CV Group (G) 2.000 0.162 0.702 0.497 0.162 0.702 0.497 0.003 0.008 0.992 0.495 2.155 0.118
Condition (C) 1.000 0.111 0.480 0.489 0.111 0.480 0.489 34.545 85.118 0.000 3.224 14.044 0.000
Stimulus (S) 2.000 5.745 24.893 0.000 5.745 24.893 0.000 0.762 1.878 0.155 0.561 2.445 0.089
G*C 2.000 0.006 0.027 0.973 0.006 0.027 0.973 0.053 0.131 0.878 0.054 0.235 0.790
G*S 4.000 0.015 0.064 0.992 0.015 0.064 0.992 0.270 0.665 0.617 0.124 0.538 0.708
C*S 2.000 0.412 1.786 0.170 0.412 1.786 0.170 0.167 0.412 0.663 0.060 0.263 0.769
G*C*S 4.000 0.093 0.403 0.807 0.093 0.403 0.807 0.164 0.403 0.807 0.027 0.118 0.976
Error 270.000 0.231 0.231 0.406 0.230
CV-
V Group (G) 2.000 0.669 4.723 0.010 0.172 0.839 0.433 0.669 4.723 0.010 0.068 0.353 0.703
Condition (C) 1.000 0.016 0.114 0.736 0.367 1.786 0.183 0.016 0.114 0.736 2.498 13.006 0.000
Stimulus (S) 2.000 0.370 2.612 0.075 4.444 21.629 0.000 0.370 2.612 0.075 1.919 9.995 0.000
G*C 2.000 0.212 1.495 0.226 0.247 1.200 0.303 0.212 1.495 0.226 0.133 0.694 0.500
G*S 4.000 0.202 1.427 0.225 0.102 0.495 0.740 0.202 1.427 0.225 0.083 0.432 0.785
C*S 2.000 0.027 0.193 0.825 2.861 13.924 0.000 0.027 0.193 0.825 1.251 6.514 0.002
G*C*S 4.000 0.197 1.390 0.237 0.266 1.293 0.273 0.197 1.390 0.237 0.064 0.333 0.856
Error 270.000 0.142 0.205 0.142 0.192

197
197
Table 25. Mixed model ANOVA results of peak latencies in CV and CV-V waveforms for Hindi stimuli at FCz.
P1 N1 P2 N2
Degr. of
freedom
MS F p MS F p MS F P MS F p
CV
Group
(G) 2.000 3.969 0.029 0.972 40.253 0.264 0.768 999.003 4.897 0.008 413.198 0.693 0.501
Condition
(C) 1.000 59340.125 426.603 0.000 128989.670 847.500 0.000 30834.722 151.143 0.000 94395.125 158.353 0.000
Stimulus
(S) 2.000 60435.823 434.480 0.000 104770.045 688.370 0.000 71212.462 349.063 0.000 118406.167 198.632 0.000
G*C 2.000 68.260 0.491 0.613 81.983 0.539 0.584 73.670 0.361 0.697 30.010 0.050 0.951
G*S 4.000 44.589 0.321 0.864 270.191 1.775 0.134 40.665 0.199 0.939 1460.833 2.451 0.046
C*S 2.000 44811.885 322.158 0.000 30947.420 203.334 0.000 3736.108 18.313 0.000 33358.792 55.961 0.000
G*C*S 4.000 54.224 0.390 0.816 39.545 0.260 0.903 133.509 0.654 0.624 495.583 0.831 0.506
Error 270.000 139.099 152.200 204.010 596.107
CV-
V
Group
(G) 2.000 220.045 0.777 0.461 16.885 0.075 0.927 108.233 0.416 0.660 2566.125 2.270 0.105
Condition
(C) 1.000 20016.670 70.663 0.000 20842.014 92.941 0.000 22419.031 86.198 0.000 18915.125 16.735 0.000
Stimulus
(S) 2.000 114100.566 402.799 0.000 123892.125 552.476 0.000 56661.358 217.856 0.000 6989.573 6.184 0.002
G*C 2.000 327.253 1.155 0.317 505.024 2.252 0.107 178.823 0.688 0.504 214.125 0.189 0.828
G*S 4.000 319.670 1.129 0.343 480.807 2.144 0.076 372.488 1.432 0.224 2651.292 2.346 0.055
C*S 2.000 2571.795 9.079 0.000 8336.847 37.177 0.000 51.260 0.197 0.821 15777.635 13.959 0.000
G*C*S 4.000 30.910 0.109 0.979 77.811 0.347 0.846 75.443 0.290 0.884 100.729 0.089 0.986
Error 270.000 283.269 224.249 260.086 1130.281
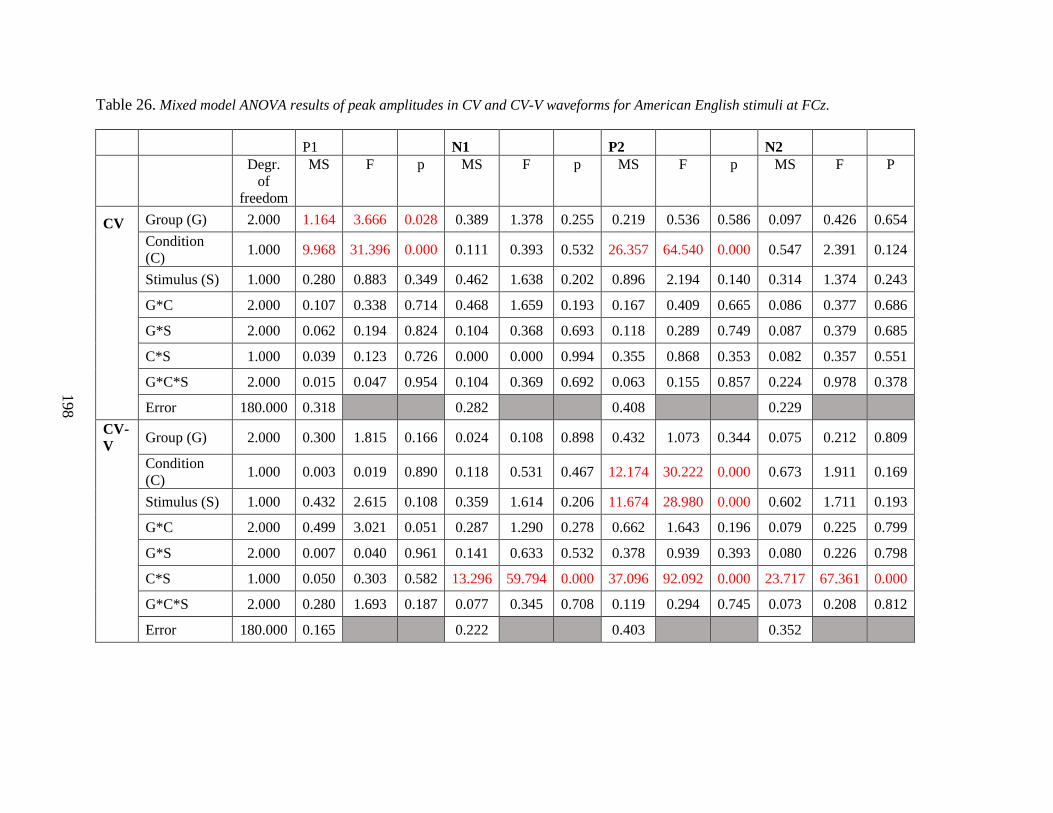
198
198
Table 26. Mixed model ANOVA results of peak amplitudes in CV and CV-V waveforms for American English stimuli at FCz.
P1 N1 P2 N2
Degr.
of
freedom
MS F p MS F p MS F p MS F P
CV Group (G) 2.000 1.164 3.666 0.028 0.389 1.378 0.255 0.219 0.536 0.586 0.097 0.426 0.654
Condition
(C) 1.000 9.968 31.396 0.000 0.111 0.393 0.532 26.357 64.540 0.000 0.547 2.391 0.124
Stimulus (S) 1.000 0.280 0.883 0.349 0.462 1.638 0.202 0.896 2.194 0.140 0.314 1.374 0.243
G*C 2.000 0.107 0.338 0.714 0.468 1.659 0.193 0.167 0.409 0.665 0.086 0.377 0.686
G*S 2.000 0.062 0.194 0.824 0.104 0.368 0.693 0.118 0.289 0.749 0.087 0.379 0.685
C*S 1.000 0.039 0.123 0.726 0.000 0.000 0.994 0.355 0.868 0.353 0.082 0.357 0.551
G*C*S 2.000 0.015 0.047 0.954 0.104 0.369 0.692 0.063 0.155 0.857 0.224 0.978 0.378
Error 180.000 0.318 0.282 0.408 0.229
CV-
V Group (G) 2.000 0.300 1.815 0.166 0.024 0.108 0.898 0.432 1.073 0.344 0.075 0.212 0.809
Condition
(C) 1.000 0.003 0.019 0.890 0.118 0.531 0.467 12.174 30.222 0.000 0.673 1.911 0.169
Stimulus (S) 1.000 0.432 2.615 0.108 0.359 1.614 0.206 11.674 28.980 0.000 0.602 1.711 0.193
G*C 2.000 0.499 3.021 0.051 0.287 1.290 0.278 0.662 1.643 0.196 0.079 0.225 0.799
G*S 2.000 0.007 0.040 0.961 0.141 0.633 0.532 0.378 0.939 0.393 0.080 0.226 0.798
C*S 1.000 0.050 0.303 0.582 13.296 59.794 0.000 37.096 92.092 0.000 23.717 67.361 0.000
G*C*S 2.000 0.280 1.693 0.187 0.077 0.345 0.708 0.119 0.294 0.745 0.073 0.208 0.812
Error 180.000 0.165 0.222 0.403 0.352

199
199
Table 27. Mixed model ANOVA results of peak latencies in CV and CV-V waveforms for American English stimuli at FCz.
P1 N1 P2 N2
Degr. of
freedom
MS F p MS F p MS F p MS F p
CV
Group
(G) 2.000 40.000 0.280 0.754 56.000 0.390 0.680 689.000 2.570 0.079 505.000 0.520 0.598
Condition
(C) 1.000 1074.000 7.600 0.006 158126.000 1085.180 0.000 169516.000 633.440 0.000 19724.000 20.160 0.000
Stimulus
(S) 1.000 1989.000 14.090 0.000 103324.000 709.080 0.000 93678.000 350.050 0.000 333000.000 340.390 0.000
G*C 2.000 205.000 1.450 0.238 135.000 0.920 0.399 122.000 0.460 0.635 555.000 0.570 0.568
G*S 2.000 61.000 0.430 0.650 11.000 0.080 0.924 102.000 0.380 0.685 1484.000 1.520 0.222
C*S 1.000 91.000 0.640 0.424 66083.000 453.510 0.000 86488.000 323.180 0.000 43863.000 44.840 0.000
G*C*S 2.000 38.000 0.270 0.764 31.000 0.220 0.807 177.000 0.660 0.518 1192.000 1.220 0.298
Error 180.000 141.000 146.000 268.000 978.000
CV-
V
Group
(G) 2.000 27.000 0.060 0.939 14.000 0.080 0.927 97.000 0.190 0.829 3389.000 3.710 0.026
Condition
(C) 1.000 75644.000 176.940 0.000 112182.000 632.560 0.000 261444.000 502.780 0.000 347565.000 380.740 0.000
Stimulus
(S) 1.000 63329.000 148.140 0.000 105703.000 596.030 0.000 37325.000 71.780 0.000 83625.000 91.610 0.000
G*C 2.000 168.000 0.390 0.676 252.000 1.420 0.244 212.000 0.410 0.666 200.000 0.220 0.803
G*S 2.000 158.000 0.370 0.691 247.000 1.390 0.251 444.000 0.850 0.428 1908.000 2.090 0.127
C*S 1.000 4116.000 9.630 0.002 9282.000 52.340 0.000 22729.000 43.710 0.000 1832.000 2.010 0.158
G*C*S 2.000 194.000 0.450 0.637 361.000 2.030 0.134 333.000 0.640 0.529 473.000 0.520 0.597
Error 180.000 428.000 177.000 520.000 913.000

200
200
Table 28. Mixed model ANOVA results of peak amplitudes in CV and CV-V waveforms for Hindi stimuli at GFP.
P1 N1 P2 N2
Degr.
of
freedom
MS F p MS F p MS F p MS F P
CV Group (G) 2.000 0.540 8.073 0.000 0.017 0.330 0.719 0.004 0.043 0.958 0.145 2.561 0.079
Condition (C) 1.000 6.613 98.920 0.000 0.093 1.825 0.178 7.166 70.632 0.000 0.305 5.393 0.021
Stimulus (S) 2.000 0.674 10.080 0.000 0.714 14.028 0.000 0.234 2.307 0.102 0.122 2.152 0.118
G*C 2.000 0.011 0.163 0.850 0.049 0.969 0.381 0.206 2.033 0.133 0.026 0.457 0.634
G*S 4.000 0.014 0.211 0.932 0.017 0.341 0.850 0.086 0.846 0.497 0.013 0.233 0.920
C*S 2.000 0.152 2.267 0.106 0.244 4.801 0.009 0.022 0.216 0.806 0.085 1.497 0.226
G*C*S 4.000 0.007 0.111 0.979 0.009 0.170 0.954 0.033 0.320 0.864 0.007 0.120 0.975
Error 270.000 0.067 0.051 0.101 0.057
CV-
V Group (G) 2.000 0.074 2.498 0.084 0.011 0.247 0.781 0.046 0.541 0.583 0.006 0.148 0.863
Condition (C) 1.000 0.021 0.708 0.401 0.898 20.173 0.000 3.041 36.078 0.000 0.393 10.070 0.002
Stimulus (S) 2.000 0.028 0.949 0.389 1.112 24.990 0.000 2.121 25.163 0.000 0.236 6.048 0.003
G*C 2.000 0.043 1.451 0.236 0.055 1.227 0.295 0.183 2.172 0.116 0.018 0.459 0.633
G*S 4.000 0.032 1.069 0.372 0.009 0.196 0.940 0.108 1.277 0.279 0.008 0.204 0.936
C*S 2.000 0.005 0.155 0.856 0.744 16.716 0.000 0.891 10.574 0.000 0.216 5.519 0.004
G*C*S 4.000 0.073 2.434 0.048 0.025 0.567 0.687 0.051 0.611 0.655 0.005 0.115 0.977
Error 270.000 0.030 0.044 0.084 0.039

201
201
Table 29. Mixed model ANOVA results of peak amplitudes in CV and CV-V waveforms for American English stimuli at GFP
P1 N1 P2 N2
Degr.
of
freedom
MS F p MS F p MS F p MS F p
CV Group (G) 2.000 0.460 5.221 0.006 0.176 2.258 0.108 0.079 0.844 0.432 0.000 0.007 0.993
Condition (C) 1.000 1.119 12.708 0.000 0.344 4.423 0.037 5.656 60.620 0.000 0.036 0.660 0.417
Stimulus (S) 1.000 0.278 3.153 0.077 0.032 0.414 0.521 0.315 3.373 0.068 0.310 5.679 0.018
G*C 2.000 0.031 0.353 0.703 0.026 0.335 0.716 0.115 1.229 0.295 0.002 0.029 0.971
G*S 2.000 0.040 0.457 0.634 0.014 0.181 0.835 0.046 0.498 0.609 0.043 0.784 0.458
C*S 1.000 0.001 0.012 0.914 0.002 0.031 0.861 0.023 0.247 0.620 0.023 0.418 0.519
G*C*S 2.000 0.032 0.358 0.700 0.012 0.151 0.860 0.012 0.130 0.878 0.035 0.640 0.529
Error 180.000 0.088 0.078 0.093 0.055
CV-
V Group (G) 2.000 0.101 3.309 0.039 0.077 1.057 0.350 0.116 1.074 0.344 0.018 0.251 0.778
Condition (C) 1.000 0.146 4.790 0.030 0.002 0.025 0.876 2.565 23.711 0.000 0.029 0.415 0.520
Stimulus (S) 1.000 0.145 4.737 0.031 0.007 0.093 0.761 2.100 19.408 0.000 0.001 0.019 0.890
G*C 2.000 0.021 0.688 0.504 0.031 0.424 0.655 0.112 1.036 0.357 0.024 0.338 0.714
G*S 2.000 0.016 0.522 0.594 0.003 0.035 0.966 0.153 1.418 0.245 0.017 0.242 0.785
C*S 1.000 0.251 8.210 0.005 4.325 59.189 0.000 12.251 113.245 0.000 6.352 89.651 0.000
G*C*S 2.000 0.039 1.292 0.277 0.038 0.516 0.598 0.051 0.473 0.624 0.030 0.417 0.660
Error 180.000 0.031 0.073 0.108 0.071

202
202
Table 30. Mixed model ANOVA results of peak amplitudes in CV and CV-V waveforms for Hindi stimuli at T7/T8
Na Ta Tb P350
Degr.
of
freedom
MS F p MS F p MS F p MS F P
CV Group (G) 2.000 1.411 6.148 0.002 0.201 0.841 0.432 0.355 0.983 0.375 0.291 1.927 0.147
Condition
(C) 1.000 31.627 137.784 0.000 0.898 3.765 0.053 5.456 15.122 0.000 0.651 4.317 0.038
Stimulus
(S) 2.000 0.211 0.919 0.400 2.881 12.083 0.000 0.880 2.438 0.088 0.002 0.015 0.986
Laterality
(L) 1.000 0.021 0.093 0.761 0.002 0.009 0.926 12.737 35.306 0.000 0.334 2.218 0.137
G*C 2.000 0.227 0.989 0.373 0.186 0.781 0.458 0.151 0.420 0.657 0.039 0.262 0.770
G*S 4.000 0.035 0.153 0.962 0.052 0.219 0.928 0.135 0.373 0.542 0.076 0.507 0.730
C*S 2.000 0.357 1.554 0.212 1.198 5.023 0.007 0.346 0.958 0.384 0.141 0.935 0.393
G*L 2.000 0.465 2.028 0.133 0.474 1.988 0.138 0.981 2.719 0.067 0.082 0.547 0.579
C*L 1.000 3.713 16.175 0.000 0.084 0.354 0.552 0.223 0.618 0.650 0.834 5.528 0.019
S*L 2.000 0.597 2.602 0.075 0.026 0.109 0.896 0.007 0.020 0.980 0.203 1.346 0.261
G*C*S 4.000 0.105 0.456 0.768 0.032 0.133 0.970 0.046 0.126 0.882 0.043 0.286 0.887
G*C*L 2.000 0.297 1.292 0.276 0.111 0.468 0.627 0.067 0.185 0.946 0.047 0.311 0.733
G*S*L 4.000 0.047 0.203 0.937 0.015 0.065 0.992 0.171 0.475 0.622 0.157 1.044 0.384
C*S*L 2.000 0.037 0.162 0.850 0.181 0.760 0.468 0.117 0.324 0.862 0.288 1.907 0.149
G*C*S*L 4.000 0.039 0.169 0.954 0.026 0.111 0.979 0.064 0.178 0.950 0.084 0.556 0.695
Error 540.000 0.230 0.238 0.361 0.151

203
203
Table 30 (cont.). Mixed model ANOVA results of peak amplitudes in CV and CV-V waveforms for Hindi stimuli at T7/T8
Na Ta Tb P350
Degr.
of
freedom
MS F p MS F p MS F p MS F p
CV-
V Group (G) 2.000 0.595 3.397 0.034 0.130 0.542 0.582 0.287 1.045 0.353 0.176 0.946 0.389
Condition
(C) 1.000 0.035 0.201 0.654 0.786 3.291 0.070 5.370 19.535 0.000 1.695 9.114 0.003
Stimulus
(S) 2.000 0.607 3.468 0.032 2.930 12.265 0.000 5.794 21.080 0.000 1.381 7.428 0.001
Laterality
(L) 1.000 1.346 7.692 0.006 0.262 1.096 0.296 2.033 7.395 0.007 0.109 0.586 0.444
G*C 2.000 0.384 2.192 0.113 0.061 0.255 0.775 0.319 1.162 0.314 0.238 1.279 0.279
G*S 4.000 0.049 0.281 0.891 0.158 0.659 0.621 0.121 0.440 0.779 0.283 1.520 0.195
C*S 2.000 0.064 0.364 0.695 1.713 7.170 0.001 1.552 5.646 0.004 1.305 7.019 0.001
G*L 2.000 0.071 0.404 0.668 0.079 0.332 0.718 0.595 2.166 0.116 0.026 0.142 0.868
C*L 1.000 0.561 3.203 0.074 0.819 3.426 0.065 0.111 0.403 0.526 0.024 0.131 0.718
S*L 2.000 0.395 2.258 0.106 0.798 3.340 0.036 0.153 0.557 0.573 0.355 1.908 0.149
G*C*S 4.000 0.043 0.245 0.913 0.244 1.022 0.395 0.406 1.478 0.207 0.030 0.164 0.957
G*C*L 2.000 0.360 2.058 0.129 0.168 0.703 0.496 0.017 0.062 0.940 0.110 0.590 0.555
G*S*L 4.000 0.231 1.318 0.262 0.058 0.242 0.915 0.091 0.331 0.857 0.166 0.891 0.469
C*S*L 2.000 0.145 0.831 0.436 0.778 3.257 0.039 0.043 0.157 0.854 0.164 0.879 0.416
G*C*S*L 4.000 0.124 0.706 0.588 0.179 0.749 0.559 0.324 1.180 0.318 0.120 0.646 0.630
Error 540.000 0.175 0.239 0.275 0.186

204
204
Table 31. Mixed model ANOVA results of peak amplitudes in CV and CV-V waveforms for American English stimuli at T7/T8
Na Ta Tb P350
Degr. of
freedom MS F p MS F p MS F p MS F p
CV Group (G) 2.000 0.507 2.151 0.118 0.187 0.564 0.569 0.076 0.228 0.796 0.072 0.498 0.608
Condition
(C) 1.000 13.297 56.424 0.000 11.653 35.165 0.000 6.671 20.080 0.000 0.088 0.608 0.436
Stimulus
(S) 1.000 0.502 2.129 0.145 0.331 0.998 0.318 0.010 0.031 0.861 0.327 2.257 0.134
Laterality
(L) 1.000 0.281 1.194 0.275 0.844 2.546 0.111 2.122 6.387 0.012 1.295 8.936 0.003
G*C 2.000 0.132 0.559 0.572 0.158 0.476 0.622 0.153 0.462 0.631 0.001 0.005 0.996
G*S 2.000 0.041 0.173 0.841 0.310 0.935 0.394 0.048 0.143 0.867 0.110 0.761 0.468
C*S 1.000 0.005 0.019 0.890 0.081 0.243 0.622 0.891 2.682 0.102 0.010 0.072 0.789
G*L 2.000 0.381 1.617 0.200 0.072 0.217 0.805 1.269 3.820 0.023 0.525 3.625 0.028
C*L 1.000 5.314 22.550 0.000 0.713 2.152 0.143 0.750 2.259 0.134 0.072 0.494 0.483
S*L 1.000 0.294 1.248 0.265 0.189 0.569 0.451 1.504 4.527 0.034 0.055 0.376 0.540
G*C*S 2.000 0.031 0.131 0.877 0.251 0.758 0.470 0.161 0.484 0.617 0.147 1.015 0.363
G*C*L 2.000 0.464 1.970 0.141 0.229 0.690 0.502 0.180 0.543 0.581 0.000 0.002 0.998
G*S*L 2.000 0.155 0.659 0.518 0.264 0.796 0.452 0.085 0.257 0.774 0.141 0.971 0.380
C*S*L 1.000 0.037 0.157 0.693 0.361 1.089 0.297 1.438 4.327 0.038 0.226 1.559 0.213
G*C*S*L 2.000 0.009 0.037 0.964 0.597 1.801 0.167 0.020 0.059 0.943 0.072 0.500 0.607
Error 360.000 0.236 0.331 0.332 0.145

205
205
Table 31 (cont.). Mixed model ANOVA results of peak amplitudes in CV and CV-V waveforms for American English at T7/T8
Na Ta Tb P350
Degr.
of
freedom
MS F p MS F p MS F p MS F p
CV-
V Group (G) 2.000 0.318 1.579 0.208 0.008 0.032 0.969 0.189 0.596 0.551 0.201 0.723 0.486
Condition
(C) 1.000 0.024 0.120 0.729 11.708 44.051 0.000 0.191 0.603 0.438 0.021 0.074 0.786
Stimulus (S) 1.000 0.016 0.082 0.775 3.238 12.182 0.001 0.898 2.831 0.093 0.257 0.926 0.337
Laterality
(L) 1.000 0.629 3.129 0.078 1.960 7.374 0.007 0.141 0.445 0.505 0.660 2.378 0.124
G*C 2.000 0.101 0.503 0.605 0.243 0.914 0.402 0.170 0.535 0.586 0.181 0.652 0.522
G*S 2.000 0.009 0.045 0.956 0.113 0.424 0.655 0.185 0.583 0.559 0.141 0.507 0.603
C*S 1.000 0.064 0.317 0.574 7.641 28.748 0.000 17.179 54.166 0.000 13.657 49.192 0.000
G*L 2.000 0.141 0.701 0.497 1.233 4.639 0.010 0.437 1.379 0.253 0.839 3.022 0.050
C*L 1.000 0.001 0.003 0.957 0.394 1.481 0.224 0.189 0.595 0.441 0.661 2.382 0.124
S*L 1.000 0.158 0.786 0.376 0.092 0.348 0.556 0.406 1.282 0.258 1.901 6.848 0.009
G*C*S 2.000 0.177 0.879 0.416 0.221 0.833 0.435 0.236 0.745 0.475 0.032 0.114 0.892
G*C*L 2.000 0.089 0.445 0.641 0.325 1.221 0.296 0.702 2.213 0.111 0.501 1.805 0.166
G*S*L 2.000 0.047 0.232 0.793 0.573 2.158 0.117 0.216 0.680 0.507 0.022 0.078 0.925
C*S*L 1.000 2.759 13.719 0.000 0.001 0.004 0.952 1.766 5.570 0.019 0.410 1.478 0.225
G*C*S*L 2.000 0.095 0.471 0.625 0.136 0.513 0.599 0.544 1.714 0.182 0.578 2.081 0.126
Error 360.000 0.201 0.266 0.317 0.278

206
REFERENCES
Abramson, A. S., & Lisker, L. (1970). Discriminability along the voicing continuum: Cross-
language tests. Proceedings of the Sixth International Congress of Phonetic Sciences,
196(7), 569-573.
Aggarwal, A. (2011). Acquisition of Hindi contrasts by English speakers: An optimality
theoretic account. Acta Linguistica Asiatica, 1(3), 9-24.
Ahmed, R., & Agrawal, S. S. (1969). Significant features in the perception of (Hindi)
consonants. The Journal of the Acoustical Society of America, 45(3), 758-763.
Antony, R. M. & Martin, B. A. (2016). Neurophysiologic Processing of Voicing & Aspiration
Contrasts in Hindi Listeners: Results of a Pilot Study. Poster Presentation at the
American Speech Language and Hearing Association (ASHA) Convention, Philadelphia,
Pennsylvania, USA
Assmann, P., & Summerfield, Q. (2004). The perception of speech under adverse conditions.
In Speech processing in the auditory system (pp. 231-308). Springer, New York, NY..
Belin, P., Zilbovicius, M., Crozier, S., Thivard, L., Fontaine, A., Masure, M.-C. & Samson, Y.
(1998). Lateralization of speech and auditory temporal processing. Journal of Cognitive
Neuroscience, 10, 536–540. (doi:10.1162/089892998562834)
Benguerel, A. P., & Bhatia, T. K. (1980). Hindi stop consonants: An acoustic and fiberscopic
study. Phonetica, 37(3), 134-148.
Best, C. T. (1995). A direct realist view of cross-language speech perception. In. W. Strange
(Ed.), Speech perception and linguistic experience: Issues in cross-language research
171-204.

207
Best, C. T., & Tyler, M. D. (2007). Nonnative and second-language speech perception:
Commonalities and complementarities. Language Experience in Second Language
Speech Learning: In honor of James Emil Flege, 1334, 1-47.
Best, C. T., McRoberts, G. W., & Sithole, N. M. (1988). Examination of perceptual
reorganization for nonnative speech contrasts: Zulu click discrimination by English-
speaking adults and infants. Journal of Experimental Psychology: Human Perception and
Performance, 14(3), 345.
Bhaskararao, P. (2011). Salient phonetic features of Indian languages in speech
technology. Sadhana, 36(5), 587-599.
Bidelman, G. M., & Howell, M. (2016). Functional changes in inter-and intra-hemispheric
cortical processing underlying degraded speech perception. Neuroimage, 124, 581-590.
Billings, C. J., Tremblay, K. L., Stecker, G. C., & Tolin, W. M. (2009). Human evoked cortical
activity to signal-to-noise ratio and absolute signal level. Hearing Research, 254(1-2),
15-24.
Billings, C. J., McMillan, G. P., Penman, T. M., & Gille, S. M. (2013). Predicting perception in
noise using cortical auditory evoked potentials. Journal of the Association for Research
in Otolaryngology, 14(6), 891-903.
Binder, J. R., Frost, J. A., Hammeke, T. A., Bellgowan, P. S., Springer, J. A., Kaufman, J. N., &
Possing, E. T. (2000). Human temporal lobe activation by speech and nonspeech
sounds. Cerebral Cortex, 10(5), 512-528.
Bradlow, A. R., & Alexander, J. A. (2007). Semantic and phonetic enhancements for speech-in-
noise recognition by native and non-native listeners. The Journal of the Acoustical
Society of America, 121(4), 2339-2349.

208
Bregman, A. S. (1990). Auditory Scene Analysis: The Perceptual Organization of Sound, MIT
Press, Cambridge, MA.
Brouwer, S., Van Engen, K. J., Calandruccio, L., & Bradlow, A. R. (2012). Linguistic
contributions to speech-on-speech masking for native and non-native listeners: Language
familiarity and semantic content. The Journal of the Acoustical Society of
America, 131(2), 1449-1464.
Bruneau, N., Roux, S., Guerin, P., Barthelemy, C., & Lelord, G. (1997). Temporal prominence
of auditory evoked potentials (N1 wave) in 4‐8‐year‐old children.
Psychophysiology, 34(1), 32-38.
Brungart, D. S. (2001). Informational and energetic masking effects in the perception of two
simultaneous talkers. The Journal of the Acoustical Society of America, 109(3), 1101-
1109.
Calandruccio, L., Dhar, S., & Bradlow, A. R. (2010). Speech-on-speech masking with variable
access to the linguistic content of the masker speech. The Journal of the Acoustical
Society of America, 128(2), 860-869.
Calandruccio, L., Bradlow, A. R., & Dhar, S. (2014). Speech-on-speech masking with variable
access to the linguistic content of the masker speech for native and nonnative English
speakers. Journal of the American Academy of Audiology, 25(4), 355-366.
Carlet, A. & Cebrian, J. (2015). Identification vs. discrimination training: Learning effects for
trained and untrained sounds. In the Scottish Consortium for ICPhS 2015 (Ed.),
Proceedings of the 18th International Congress of Phonetic Sciences. Glasgow, UK:
University of Glasgow.

209
Cebrian, J., Mora, J. C., & Aliaga-Garcia, C. (2010). Assessing crosslinguistic similarity by
means of rated discrimination and perceptual assimilation tasks. In New Sounds 2010:
Proceedings of the Sixth International Symposium on the Acquisition of Second
Language Speech, 77-82.
Ceponiene, R., Cheour, M., & Naatanen, R. (1998). Interstimulus interval and auditory event-
related potentials in children: evidence for multiple generators. Electroncephalography
and Clinical Neurophysiology, 108, 345–54.
Chen, K. H., & Small, S. A. (2015). Elicitation of the acoustic change complex to long-duration
speech stimuli in four-month-old infants. International Journal of Otolaryngology, 2015,
1-15.
Coffey, E. B., Chepesiuk, A. M., Herholz, S. C., Baillet, S., & Zatorre, R. J. (2017). Neural
correlates of early sound encoding and their relationship to speech-in-noise perception.
Frontiers in Neuroscience, 11, 479.
Cooke, M. (2006). A glimpsing model of speech perception in noise. The Journal of the
Acoustical Society of America, 119(3), 1562-1573.
Cooke, M., Lecumberri, M. G., & Barker, J. (2008). The foreign language cocktail party
problem: Energetic and informational masking effects in non-native speech perception.
The Journal of the Acoustical Society of America, 123(1), 414-427.
Crowley, K. E., & Colrain, I. M. (2004). A review of the evidence for P2 being an independent
component process: Age, sleep and modality. Clinical Neurophysiology, 115(4), 732-744.
Davidson, L. (2016). Variability in the implementation of voicing in American English
obstruents. Journal of Phonetics, 54, 35-50.

210
Davis, P. A. (1939). Effects of acoustic stimuli on the waking human brain. Journal of
Neurophysiology, 2, 494–499.
Davis, H., Hirsh, S. K., Shelnutt, J., & Bowers, C. (1967). Further validation of evoked response
audiometry (ERA). Journal of Speech and Hearing Research, 10, 717-732.
Davis, K. (1995). Phonetic and phonological contrasts in the acquisition of voicing: voice onset
time production in Hindi and English. Journal of Child Language, 22(02), 275-305.
Dehaene-Lambertz, G. (1997). Electrophysiological correlates of categorical phoneme
perception in adults. NeuroReport, 8(4), 919-924.
Dimitrijevic, A., Pratt, H., & Starr, A. (2013). Auditory cortical activity in normal hearing
subjects to consonant vowels presented in quiet and in noise. Clinical Neurophysiology,
124(6), 1204-1215.
Dittinger, E., D'Imperio, M., & Besson, M. (2018). Enhanced neural and behavioural processing
of a nonnative phonemic contrast in professional musicians. European Journal of
Neuroscience, 47(12), 1504-1516.
Dupoux, E., Pallier,C., Sebastian, N., & Mehler, J., (1997) A destressing 'deafness' in French?
Journal of Memory and Language, 36, 406-421.
Durvasula, K., & Luo, Q. (2012, October). Voicing, aspiration, and vowel duration in Hindi.
In Proceedings of Meetings on Acoustics 164 ASA (Vol. 18, No. 1, p. 060009). ASA.
Elangovan, S., & Stuart, A. (2011). A cross-linguistic examination of cortical auditory evoked
potentials for a categorical voicing contrast. Neuroscience Letters, 490(2), 140-144.
Finnigan, S., O'Connell, R. G., Cummins, T. D., Broughton, M., & Robertson, I. H. (2011). ERP
measures indicate both attention and working memory encoding decrements in aging.
Psychophysiology, 48(5), 601-611.

211
Flege, J. E. (1988). The production and perception of foreign language speech sounds. In H.
Winitz (Ed.), Human Communication and its Disorders: A Review (pp. 224-401).
Norwood, NJ: Ablex.
Francis, A. L., & Nusbaum, H. C. (2002). Selective attention and the acquisition of new
phonetic categories. Journal of Experimental Psychology: Human Perception and
Performance, 28(2), 349-366.
Friedrich, C. K., Kotz, S. A., Friederici, A. D., & Alter, K. (2004). Pitch modulates lexical
identification in spoken word recognition: ERP and behavioral evidence. Cognitive Brain
Research, 20(2), 300-308.
Gandour, J., Wong, D., Lowe, M., Dzemidzic, M., Satthamnuwong, N., Tong, Y. & Li, X.
(2002). A crosslinguistic FMRI study of spectral and temporal cues underlying
phonological processing. Journal of Cognitive Neuroscience, 14, 1076–1087.
(doi:10.1162/089892902320474526)
Geisler, C. D., Frishkopf, L. S., & Rosenblith, W. A. (1958). Extracranial responses to acoustic
clicks in man. Science, 128(3333), 1210-1211.
Giard, M. H., Perrin, F., Echallier, J. F., Thevenet, M., Froment, J. C., & Pernier, J. (1994).
Dissociation of temporal and frontal components in the human auditory N1 wave: A
scalp current density and dipole model analysis. Electroencephalography and Clinical
Neurophysiology/Evoked Potentials Section, 92(3), 238-252.
Grunwald, T., Boutros, N. N., Pezer, N., von Oertzen, J., Fernández, G., Schaller, C., & Elger, C.
E. (2003). Neuronal substrates of sensory gating within the human brain. Biological
Psychiatry, 53(6), 511-519.

212
Hall, D. A., Johnsrude, I. S., Haggard, M. P., Palmer, A. R., Akeroyd, M. A. & Summerfield, A.
Q. (2002). Spectral and temporal processing in human auditory cortex. Cerebral Cortex
12, 140–149. (doi:10.1093/cercor/12.2.140).
Han, W., Bahng, J., & Park, J. (2013). The Cortical Evoked Response Elicited by Nine Plosives
in Normal Hearing Listeners. Korean Journal of Audiology, 17(3), 124-132.
Hant, J. J., & Alwan, A. (2000). Predicting the perceptual confusion of synthetic plosive
consonants in noise. In Sixth International Conference on Spoken Language Processing,
3, 941-944.
Helfer, K. S., & Wilber, L. A. (1990). Hearing loss, aging, and speech perception in
reverberation and noise. Journal of Speech, Language, and Hearing Research, 33(1),
149-155.
Hickok, G., Poeppel, D. (2000). Towards a functional neuroanatomy of speech perception.
Trends in Cognitive Science, 4, 131– 138.
Hillyard, S. A., & Picton, T. W. (1987). Electrophysiology of cognition. Comprehensive
Physiology, 519–584.
Hisagi, M., Shafer, V. L., Strange, W., & Sussman, E. S. (2010). Perception of a Japanese vowel
length contrast by Japanese and American English listeners: Behavioral and
electrophysiological measures. Brain Research, 1360, 89-105.
Hisagi, M., Shafer, V. L., Strange, W., & Sussman, E. S. (2015). Neural measures of a Japanese
consonant length discrimination by Japanese and American English listeners: Effects of
attention. Brain Research, 1626, 218-231.
Howard, M. A., Volkov, I. O., Mirsky, R., Garell, P. C., Noh, M. D., Granner, M., Damasio, H.,
Steinschneider, M., Reale, R., Hind, J., & Brugge, J. F. (2000). Auditory cortex on the

213
human posterior superior temporal gyrus. Journal of Comparative Neurology, 416(1), 79-
92.
Hunnicutt, L., & Morris, P. A. (2016). Prevoicing and aspiration in Southern American English.
University of Pennsylvania Working Papers in Linguistics, 22(1), 24.
Hyde, M. (1997). The N1 response and its applications. Audiology and Neurotology, 2(5), 281-
307.
Iverson, G. K., & Salmons, J. C. (1995). Aspiration and laryngeal representation in Germanic.
Phonology, 12(03), 369-396.
Jasper, H. H. (1958). The ten-twenty electrode system of the International Federation.
Electroencephalography and Clinical Neurophysiology, 10, 371-375.
Jiang, J., Chen, M., & Alwan, A. (2006). On the perception of voicing in syllable-initial plosives
in noise. The Journal of the Acoustical Society of America, 119(2), 1092-1105.
Jin, S. H., & Liu, C. (2012). English sentence recognition in speech-shaped noise and multi-
talker babble for English-, Chinese-, and Korean-native listeners. The Journal of the
Acoustical Society of America, 132(5), EL391-EL397.
Joanisse, M. F., & Gati, J. S. (2003). Overlapping neural regions for processing rapid temporal
cues in speech and nonspeech signals. Neuroimage, 19(1), 64-79.
Keating, P. A. (1984). Phonetic and phonological representation of stop consonant voicing.
Language, 286-319.
Kent, R. D. & Read, C. (2002). The Acoustic Analysis of speech. San Diego: Singular Publishing.
Kiehl, K. A., Laurens, K. R., Duty, T. L., Forster, B. B., & Liddle, P. F. (2001). Neural sources
involved in auditory target detection and novelty processing: an event-related fMRI
study. Psychophysiology, 38(1), 133-142.

214
Kraljic, T., & Samuel, A. G. (2006). Generalization in perceptual learning for speech.
Psychonomic Bulletin & Review, 13(2), 262-268.
Kraus, N., McGee, T., Carrell, T., King, C., Littman, T., & Nicol, T. (1994). Discrimination of
speech‐like contrasts in the auditory thalamus and cortex. The Journal of the Acoustical
Society of America, 96(5), 2758-2768.
Kuhl, P. K., & Miller, J. D. (1975). Speech perception by the chinchilla: Voiced-voiceless
distinction in alveolar plosive consonants. Science, 190(4209), 69-72.
Ladefoged, P. (1975). A Course in Phonetics/Peter Ladefoged. Or lando: Harcourt Brace.
Lecumberri, M. G., & Cooke, M. (2006). Effect of masker type on native and non-native
consonant perception in noise. The Journal of the Acoustical Society of America, 119(4),
2445-2454.
Lecumberri, M. L. G., Cooke, M., & Cutler, A. (2010). Non-native speech perception in adverse
conditions: A review. Speech Communication, 52(11-12), 864-886.
Lisker, L., & Abramson, A. (1964). A cross-language study of voicing in initial stops: Acoustical
measurements. Word, 20(3), 384-422.
Lisker, L. (1975). Is it VOT or a first‐formant transition detector? The Journal of the Acoustical
Society of America, 57(6), 1547-1551.
Mangun, G. R., Hopfinger, J. B., Kussmaul, C. L., Fletcher, E. M., & Heinze, H. J. (1997).
Covariations in ERP and PET measures of spatial selective attention in human
extrastriate visual cortex. Human Brain Mapping, 5(4), 273-279.
Marian, V., Blumenfeld, H. K., & Kaushanskaya, M. (2007). The Language Experience and
Proficiency Questionnaire (LEAP-Q): Assessing language profiles in bilinguals and
multilinguals. Journal of Speech, Language, and Hearing Research, 50(4), 940-967.
215
Martin, B. A., Sigal, A., Kurtzberg, D., & Stapells, D. R. (1997). The effects of decreased
audibility produced by high-pass masking on cortical event-related potentials to speech
sounds /ba/ and /da/. Journal of the Acoustical Society of America, 101(3), 1585-1599.
Martin, B. A., Kurtzberg, D., & Stapells, D. R. (1999). The effects of decreased audibility
produced by high-pass noise masking on N1 and the mismatch negativity to speech
sounds/ba/and/da. Journal of Speech, Language, and Hearing Research, 42(2), 271-286.
Martin, B. A., & Stapells, D. R. (2005). Effects of low-pass noise masking on auditory event-
related potentials to speech. Ear and Hearing, 26(2), 195-213.
Martin, B. A., Tremblay, K. L., & Korczak, P. (2008). Speech evoked potentials: from the
laboratory to the clinic. Ear and Hearing, 29(3), 285-313.
Mattys, S. L., Davis, M. H., Bradlow, A. R., & Scott, S. K. (2012). Speech recognition in
adverse conditions: A review. Language and Cognitive Processes, 27(7-8), 953-978.
Mayo, L. H., Florentine, M., & Buus, S. (1997). Age of second-language acquisition and
perception of speech in noise. Journal of Speech, Language, and Hearing Research,
40(3), 686-693.
Meador, D., Flege, J. E., & MacKay, I. R. (2000). Factors affecting the recognition of words in a
second language. Bilingualism: Language and Cognition, 3(1), 55-67.
Meenakshi, G. N., & Ghosh, P. K. (2015). A discriminative analysis within and across voiced
and unvoiced consonants in neutral and whispered speech in multiple Indian languages.
In Sixteenth Annual Conference of the International Speech Communication Association,
781-785
Miller, G. A., & Nicely, P. E. (1955). An analysis of perceptual confusions among some English
consonants. The Journal of the Acoustical Society of America, 27(2), 338-352.

216
Moncur, J. P., & Dirks, D. (1967). Binaural and Monaural Speech Intelligibility in
Reverberation. Journal of Speech, Language, and Hearing Research, 10(2), 186-195.
Nabelek, A. K., & Donahue, A. M. (1984). Perception of consonants in reverberation by native
and non‐native listeners. The Journal of the Acoustical Society of America, 75(2), 632-
634.
Naatenen, R. & Picton, T. (1987). The N1 wave of the human electric and magnetic response to
sound: A review and an analysis of the component structure. Psychophysiology, 24, 375-
425.
Nittrouer, S., Wilhelmsen, M., Shapley, K., Bodily, K., & Creutz, T. (2003). Two reasons not to
bring your children to cocktail parties. The Journal of the Acoustical Society of America,
113(4), 2254-2254.
Norris, D., McQueen, J. M., & Cutler, A. (2003). Perceptual learning in speech. Cognitive
psychology, 47(2), 204-238.
Pallier, C., Sebastian-Gallés, N., Dupoux, E., Christophe, A., & Mehler, J. (1998). Perceptual
adjustment to time-compressed speech: A cross-linguistic study. Memory & Cognition,
26(4), 844-851.
Parikh, G., & Loizou, P. C. (2005). The influence of noise on vowel and consonant cues. The
Journal of the Acoustical Society of America, 118(6), 3874-3888.
Picton, T. (2013). Hearing in time: evoked potential studies of temporal processing. Ear and
Hearing, 34(4), 385-401.
Polka, L. (1991). Cross-language speech perception in adults: Phonemic, phonetic, and acoustic
contributions. The Journal of the Acoustical Society of America, 89(6), 2961-2977.

217
Polka, L., & Werker, J. F. (1994). Developmental changes in perception of nonnative vowel
contrasts. Journal of Experimental Psychology: Human Perception and Performance,
20(2), 421.
Ponton, C. W., Don, M., Waring, M. D., Eggermont, J. J., & Masuda, A. (1993). Spatio-temporal
source modeling of evoked potentials to acoustic and cochlear implant
stimulation. Electroencephalography and Clinical Neurophysiology/Evoked Potentials
Section, 88(6), 478-493.
Ponton, C. W., Eggermont, J. J., Khosla, D., Kwong, B., & Don, M. (2002). Maturation of
human central auditory system activity: Separating auditory evoked potentials by dipole
source modeling. Clinical Neurophysiology, 113, 407–20.
Repp, B. H. (1979). Relative amplitude of aspiration noise as a voicing cue for syllable-initial
stop consonants. Language and Speech, 22(2), 173-189.
Rivera-Gaxiola, M., Csibra, G., Johnson, M. H., & Karmiloff-Smith, A. (2000).
Electrophysiological correlates of cross-linguistic speech perception in native English
speakers. Behavioural Brain Research, 111(1), 13-23.
Rogers, C. L., Lister, J. J., Febo, D. M., Besing, J. M., & Abrams, H. B. (2006). Effects of
bilingualism, noise, and reverberation on speech perception by listeners with normal
hearing. Applied Psycholinguistics, 27(03), 465-485.
Rosen, S. (1992). Temporal information in speech: acoustic, auditory and linguistic
aspects. Philosophical Transactions of Royal Society of London B, 336(1278), 367-373.
Scharinger, M., & Felder, V. (2011). ERP signatures of cross-modal semantic fragment priming:
early context effects in speech perception. International Journal of Psychophysiology,
80(1), 19-27.

218
Scott, S. K., & Johnsrude, I. S. (2003). The neuroanatomical and functional organization of
speech perception. Trends in Neurosciences, 26(2), 100-107.
Schuhmann, K. S. (2012). Perceptual learning in Hindi-English bilinguals. Studies in the
Linguistic Sciences: Illinois Working Papers, 81-99.
Semlitsch, H. V., Anderer, P., Schuster, P., & Presslich, O. (1986). A solution for reliable and
valid reduction of ocular artifacts, applied to the P300 ERP. Psychophysiology, 23(6),
695-703.
Shafer, V. L., Schwartz, R. G., & Kurtzberg, D. (2004). Language-specific memory traces of
consonants in the brain. Cognitive Brain Research, 18(3), 242-254.
Sharbrough, F. (1991). American Electroencephalographic Society guidelines for standard
electrode position nomenclature. Journal of Clinical Neurophysiology, 8, 200-202.
Sharma, A., & Dorman, M. F. (1999). Cortical auditory evoked potential correlates of categorical
perception of voice-onset time. The Journal of the Acoustical Society of America, 106(2),
1078-1083.
Sharma, A., & Dorman, M. F. (2000). Neurophysiologic correlates of cross-language phonetic
perception. The Journal of the Acoustical Society of America, 107(5), 2697-2703.
Sharma, A., Marsh, C. M., & Dorman, M. F. (2000). Relationship between N1 evoked potential
morphology and the perception of voicing. The Journal of the Acoustical Society of
America, 108(6), 3030-3035.
Shtyrov, Y., Kujala, T., Ilmoniemi, R. J., & Näätänen, R. (1999). Noise affects speech‐signal
processing differently in the cerebral hemispheres. NeuroReport, 10(10), 2189-2192.

219
Simpson, S. A., & Cooke, M. (2005). Consonant identification in N-talker babble is a
nonmonotonic function of N. The Journal of the Acoustical Society of America, 118(5),
2775-2778.
Small, S. A., & Werker, J. F. (2012). Does the ACC have potential as an index of early speech
discrimination ability? A preliminary study in 4-month-old infants with normal
hearing. Ear and Hearing, 33(6), e59-e69.
Steinschneider, M., Volkov, I. O., Noh, M. D., Garell, P. C., & Howard, M. A. (1999). Temporal
encoding of the voice onset time phonetic parameter by field potentials recorded directly
from human auditory cortex. Journal of Neurophysiology, 82(5), 2346-2357.
Steinschneider, M., Volkov, I. O., Fishman, Y. I., Oya, H., Arezzo, J. C., & Howard, M. A.
(2005). Intracortical responses in human and monkey primary auditory cortex support a
temporal processing mechanism for encoding of the voice onset time phonetic
parameter. Cerebral Cortex, 15(2), 170-186.
Stevens, K. N., & Blumstein, S. E. (1978). Invariant cues for place of articulation in stop
consonants. The Journal of the Acoustical Society of America, 64(5), 1358-1368.
Strange, W. (1995). Cross-language studies of speech perception: A historical review. Speech
Perception and Linguistic Experience: Issues in Cross-Language Research, 3-45.
Strange, W. (2011). Automatic selective perception (ASP) of first and second language speech:
A working model. Journal of Phonetics, 39(4), 456-466.
Strange, W., & Shafer, V. L. (2008). Speech perception in second language learners: The re-
education of selective perception. Phonology and second language acquisition, 36, 153-
192.

220
Summerfield, Q., & Haggard, M. (1977). On the dissociation of spectral and temporal cues to the
voicing distinction in initial stop consonants. The Journal of the Acoustical Society of
America, 62(2), 435-448.
Takata, Y., & Nabelek, A. K. (1990). English consonant recognition in noise and in
reverberation by Japanese and American listeners. The Journal of the Acoustical Society
of America, 88(2), 663-666.
Tonnquist-Uhlen, I., Ponton, C. W., Eggermont, J. J., Kwong, B., & Don, M. (2003). Maturation
of human central auditory system activity: The T-complex. Clinical
Neurophysiology, 114(4), 685-701.
Toscano, J. C., McMurray, B., Dennhardt, J., & Luck, S. J. (2010). Continuous perception and
graded categorization: Electrophysiological evidence for a linear relationship between the
acoustic signal and perceptual encoding of speech. Psychological Science, 21(10), 1532-
1540.
Tremblay, K. L., Piskosz, M., & Souza, P. (2003). Effects of age and age-related hearing loss on
the neural representation of speech cues. Clinical Neurophysiology, 114(7), 1332-1343.
Tsui, Y. H., & Valter, C. (2000). Perception of aspiration and place of articulation of Cantonese
initial stops by normal and sensorineural hearing-impaired listeners. International
Journal of Language & Communication Disorders, 35(4), 507-525.
Vander Ghinst, M., Bourguignon, M., Niesen, M., Wens, V., Hassid, S., Choufani, G., ... & De
Tiège, X. (2019). Cortical tracking of speech-in-noise develops from childhood to
adulthood. Journal of Neuroscience, 39(15), 2938-2950.

221
Van Engen, K. J., and Bradlow, A. R. (2007). Sentence recognition in native- and foreign-
language multi-talker background noise. The Journal of the Acoustical Society of
America, 121(1), 519–526
Werker, J. F., & Logan, J. S. (1985). Cross-language evidence for three factors in speech
perception. Perception & Psychophysics, 37(1), 35-44.
Werker, J. F., & Tees, R. C. (1984). Phonemic and phonetic factors in adult cross‐language
speech perception. The Journal of the Acoustical Society of America, 75(6), 1866-1878.
Werker, J. F., Gilbert, J. H., Humphrey, K., & Tees, R. C. (1981). Developmental aspects of
cross-language speech perception. Child Development, 349-355.
Wagner, M., Shafer, V. L., Martin, B., & Steinschneider, M. (2013). The effect of native-
language experience on the sensory-obligatory components, the P1–N1–P2 and the T-
complex. Brain Research, 1522, 31-37.
Whiting, K. A., Martin, B. A., & Stapells, D. R. (1998). The Effects of Broadband Noise
Masking on Cortical Event‐Related Potentials to Speech Sounds/ba/and/da. Ear and
hearing, 19(3), 218-231.
Wiltshire, C. R. (1999). The Phonology of the Past Tense in Tamil. In Annual Meeting of the
Berkeley Linguistics Society, 25(2), 22-43.
Wolpaw, J. R., & Penry, J. K. (1975). A temporal component of the auditory evoked
response. Electroencephalography and Clinical Neurophysiology, 39(6), 609-620.
Wood, C. C., & Wolpaw, J. R. (1982). Scalp distribution of human auditory evoked potentials.
II. Evidence for overlapping sources and involvement of auditory
cortex. Electroencephalography and Clinical Neurophysiology, 54(1), 25-38.

222
Woods, D. L. (1995). The component structure of the N 1 wave of the human auditory evoked
potential. Electroencephalography and Clinical Neurophysiology-Supplements Only, 44,
102-109.
Wright, R. (2004). A review of perceptual cues and cue robustness. Phonetically Based
Phonology, 34-57.
Zaehle, T., Wustenberg, T., Meyer, M. & Jancke, L. (2004). Evidence for rapid auditory
perception as the foundation of speech processing: a sparse temporal sampling fMRI
study. European Journal of Neuroscience, 20, 2447–2456. (doi:10.1111/j.1460-
9568.2004.03687.x)
Zatorre, R. J., Meyer, E., Gjedde, A. & Evans, A. C. (1996). PET studies of phonetic processing
of speech: Review, replication, and re-analysis. Cerebral Cortex, 6, 21–30.
(doi:10.1093/cercor/6.1.21).
Zatorre, R. J. & Belin, P. (2001). Spectral and temporal processing in human auditory cortex.
Cerebral Cortex, 11, 946–953. (doi:10.1093/cercor/11.10.946).
Zatorre, R. J., & Gandour, J. T. (2008). Neural specializations for speech and pitch: moving
beyond the dichotomies. Philosophical Transactions of the Royal Society B: Biological
Sciences, 363(1493), 1087-1104.


![Dialectal variation in English meets laryngeal typology...• [voice] = L • unmarked: passive voicing (in aspiration lang. only) (Honeybone 2005, Iverson & Salmons 2008, etc.) (this](https://img.pdfslide.us/doc/110x75/5f6a432fa78de01ed2388b8c/dialectal-variation-in-english-meets-laryngeal-typology-a-voice-l-a.jpg)