Embed Size (px)
Citation preview

EncephalitisPage 57
Acute Communicable Disease Control 2016 Annual Morbidity Report
ENCEPHALITIS
aCases per 100,000 population bNot nationally notifiable
DESCRIPTION
Encephalitis or meningoencephalitis, inflammation of parts of the brain, spinal cord, and meninges, causes headache, stiff neck, fever, and altered mental status. It can result from infection of a number of different agents including viral, parasitic, fungal, rickettsial, and bacterial pathogens as well as chemical agents.
Healthcare providers and diagnostic laboratories in LAC are required to report all suspected encephalitis cases including primary and post-infectious encephalitis but excluding individuals with underlying human immunodeficiency virus (HIV) infection to LAC DPH. Reporters are required to identify the cause as either viral, bacterial, fungal, or parasitic. Public health conducts passive surveillance of encephalitis cases.
In this report, encephalitis cases of viral etiologies are summarized. For the purpose of surveillance, LAC DPH requires a case to have clinically compatible illness. Of special concern are arthropod-borne viruses (i.e., arboviruses), which are maintained in nature through biological transmission between susceptible vertebrate hosts by blood-feeding arthropods (mosquitoes, ticks, and certain mites
and gnats). All arboviral encephalitides are zoonotic, meaning that they are maintained in complex life cycles involving a non-human vertebrate primary host and a primary arthropod vector. Arboviruses have a global distribution. The five main arboviral agents of encephalitis in the US are West Nile virus (WNV), eastern equine encephalitis virus (EEEV), western equine encephalitis virus (WEEV), Saint Louis encephalitis virus (SLEV), and La Crosse encephalitis virus (LACV).
All of these are transmitted by mosquitoes, thus can be prevented by personal protection and mosquito control (see WNV chapter).
2016 TRENDS AND HIGHLIGHTS
A total of 69 cases of viral encephalitis were confirmed in 2016 compared to 136 cases reported in 2015. The decrease in encephalitis was most likely due to the decrease in WNV-associated cases in 2016 (n=53, 77%) compared with 2015 (n=114, 84%).
Most viral encephalitis cases with laboratory evidence of the causative agent were positive for WNV (n=53, 77%). WNV-associated encephalitis is the most frequently identified etiology for viral encephalitis in LAC. Cases of WNV encephalitis occurred from July through November. August, the peak month of encephalitis cases in 2016, coincided with the peak for WNV-associated cases (Figure 4). Of all WNV encephalitis cases, three (6%) cases died.
Encephalitis associated with herpes simplex virus was the second most common etiology identified for reported viral encephalitis cases (n=9, 13%).
A total of four (6%) encephalitis cases were considered to be due to an unknown viral etiology based on review of medical records. The number of viral encephalitis cases of unknown etiology in LAC has been consistently low, n=19 (14%) in 2015 and n=16 (17%) in 2014.
CRUDE DATA
Number of Cases 69
Annual Incidencea
LA County 0.72 Californiab N/A United Statesb N/A Age at Diagnosis Mean 67 Median 72 Range 15–92 years

EncephalitisPage 58
Acute Communicable Disease Control 2016 Annual Morbidity Report
The greatest incidence of encephalitis was in persons >65 years old (3.8 cases per 100,000) followed by those 55-64 years old (0.7 cases per 100,000 population). The peak incidence in persons >65 years old corresponds to older age as a risk factor for WNV-associated neuroinvasive disease. The
average age of WNV encephalitis cases in 2016 was 71 years old.
The highest number of encephalitis cases was documented within SPA 2 (n=36, 52%) (Figure 3). The SPA with the highest number of WNV-associated encephalitis cases was also SPA 2 (n=29, 42%).

EncephalitisPage 59
Acute Communicable Disease Control 2013 Annual Morbidity Report
Reported Encephalitis Cases and Rates* per 100,000 by Age Group, Race/Ethnicity, and SPA LAC, 2012-2016
2012 (N=75) 2013 (N=79) 2014 (N=92) 2015 (N=136) 2016 (N=69)
No. (%) Rate/
No. (%) Rate/
No. (%) Rate/
No. (%) Rate/
No. (%) Rate/
100,000 100,000 100,000 100,000 100,000
Age Group <1 1 1.3 0.8 1 1.3 0.8 1 1.1 0.8 0 - - - - -1-4 3 4.0 0.6 4 5.1 0.8 2 2.2 0.4 1 0.7 0.2 - - -5-14 8 10.7 0.7 7 8.9 0.6 4 4.3 0.3 7 5.1 0.6 - - -15-34 6 8.0 0.2 6 7.6 0.2 5 5.4 0.2 5 3.7 0.2 5 7.2 0.235-44 0 - - 1 1.3 0.1 3 3.3 0.2 6 4.4 0.5 3 4.3 0.245-54 9 12.0 0.7 13 16.5 1.0 10 10.9 0.8 16 11.8 1.2 6 8.7 0.555-64 12 16.0 1.2 19 24.1 1.9 23 25.0 2.2 14 10.3 1.3 8 11.6 0.765+ 36 48.0 3.2 28 25.3 2.5 44 47.8 3.9 87 64.0 7.3 47 68.1 3.8Unknown 0 - - 8 10.1 - 0 - - - - - - - -
Race/Ethnicity Asian 8 10.7 0.6 6 7.6 0.4 8 8.7 0.6 4 2.9 0.3 3 4.3 0.2Black 3 4.0 0.4 2 2.5 0.3 3 3.3 0.4 3 2.2 0.4 3 0.4Hispanic 23 30.7 0.5 20 25.3 0.4 24 26.1 0.5 51 37.5 1.1 19 0.4White 31 41.3 1.2 36 45.6 1.4 40 43.5 1.5 62 45.6 2.3 33 1.2Other 5 6.7 - 3 3.8 - 0 - - 1 0.7 - 1 1.4 -Unknown 5 6.7 - 12 15.2 - 17 18.5 - 15 11.0 - 10 14.5 -
SPA 1 6 8.0 1.5 6 7.6 1.5 1 1.1 0.3 4 2.9 1.0 2 2.9 0.52 22 29.3 1.0 27 34.2 1.2 21 22.8 1.0 52 38.2 2.3 36 52.2 1.63 24 32.0 1.5 11 13.9 0.7 14 15.2 0.9 19 14.0 1.1 6 8.7 0.44 10 13.3 0.9 3 3.8 0.3 12 13.0 1.0 14 10.3 1.2 5 7.2 0.45 2 2.7 0.3 2 2.5 0.3 11 12.0 1.7 11 8.1 1.7 4 5.8 0.66 4 5.3 0.4 3 3.8 0.3 5 5.4 0.5 3 2.2 0.3 3 4.3 0.37 5 6.7 0.4 11 13.9 0.8 18 19.6 1.4 26 19.1 2.0 6 8.7 0.58 2 2.7 0.2 13 16.5 1.2 9 9.8 0.8 7 5.1 0.6 5 7.3 0.5Unknown 0 - - 3 3.8 - 1 1.1 - 0 - - 2 2.9 -
*Rates calculated based on less than 19 cases or events are considered unreliable.

EncephalitisPage 60
Acute Communicable Disease Control 2016 Annual Morbidity Report
0
5
10
15
20
25
30
35
40
1 2 3 4 5 6 7 8
Num
ber o
f Cas
es
SPA
Figure 3. Encephalitis Cases by SPALAC, 2016 (N=69)
0
5
10
15
20
25
30
35
40
Jan Feb Mar Apr May Jun Jul Aug Sep Oct Nov Dec
Num
ber o
f Cas
es
Month
Figure 4. Reported Encephalitis Cases by Month of OnsetLAC, 2016 (N=69)
WNV Encephalitis Other Encephalitis Previous 5-year average
Figure 2. Percent Cases of Encephalitis by Race/Ethnicity LAC, 2016 (*N=69)
Asian4%
Black4%
Hispanic28%
Other1%
Unknown15%
0
0.25
0.5
0.75
1
1.25
1.5
2011 2012 2013 2014 2015 2016
Cas
es p
er 1
00,0
00
Year
Figure 1. Incidence Rates* of EncephalitisLAC, 2011-2016
*See text for limitations.
White48%

EncephalitisPage 61
Acute Communicable Disease Control 2016 Annual Morbidity Report
0
10
20
30
40
50
60
70
White Black Asian Hispanic
Num
ber o
f Cas
es
Race/Ethnicity
Figure 5. Reported Encephalitis Cases by Race/EthnicityLAC, 2011-2016
2011 2012 2013 2014 2015 2016

Catalina Island (HB)
Map . EncephalitisRates by Health District, Los Angeles County, 2016*
.0 4.5 92.25
Miles
AV
SF
WV
WE
EVFH
PO
*PSNE
CEHW
SWSESO
IW
TO
HB
SA
EL
AH
WH
EM
BFCN
*LB
GL
*Excludes Long Beach and Pasadena Data.
Health District Boundary
Service Planning Area (SPA)
Cases Per 100,000 Population
1.2 - 2.1
0.7 - 1.1
0.4 - 0.6
0.1 - 0.3
0.0
EncephalitisPage 62

Encephalitis Page 73
Acute Communicable Disease Control 2015 Annual Morbidity Report
ENCEPHALITIS
aCases per 100,000 population bNot nationally notifiable DESCRIPTION Encephalitis, an inflammation of parts of the brain, spinal cord, and meninges, causes headache, stiff neck, fever, and altered mental status. It can result from infection of a number of different agents including viral, parasitic, fungal, rickettsial, and bacterial pathogens as well as chemical agents. Public health conducts passive surveillance of encephalitis cases and is limited to cases with suspected or confirmed viral and bacterial etiologies, which includes primary and post-infectious encephalitis but excludes individuals with underlying human immunodeficiency virus (HIV) infection. Of special concern are arthropod-borne viruses (i.e., arboviruses), which are maintained in nature through biological transmission between susceptible vertebrate hosts by blood feeding arthropods (mosquitoes, ticks, and certain mites and gnats). All arboviral encephalitides are zoonotic, meaning that they are maintained in complex life cycles involving a nonhuman vertebrate primary host and a primary arthropod vector. Arboviruses have a global distribution. The five main viral agents of encephalitis in the United States are West Nile virus (WNV), eastern equine encephalitis virus (EEEV), western equine encephalitis virus (WEEV), Saint Louis encephalitis virus (SLEV), and La Crosse encephalitis virus (LACV). All of these are
transmitted by mosquitoes, thus can be prevented by personal protection and mosquito control (see WNV chapter). 2015 TRENDS AND HIGHLIGHTS
A total of 136 cases of encephalitis were
confirmed in 2015 compared to 92 cases reported in 2014. The increase in encephalitis was most likely due to the increase in WNV-associated encephalitis cases. The 2015 surveillance year had the second highest number of total WNV infections (n=300) cases since the first LAC WNV outbreak (n=309), which occurred in 2004 (see WNV chapter).
Most laboratory confirmed encephalitis cases (n=114, 84%) were due to underlying WNV infection. WNV-associated encephalitis is the most frequently reported etiology for viral encephalitis in the US. Cases of WNV encephalitis were reported from late July through late November. October, the peak month of encephalitis reports coincided with the WNV- infection peak in 2015 (Figure 4). A total of 17 (15%) of WNV-associated cases died, 0.2% mortality rate.
Herpes virus encephalitis associated with herpes simplex virus was the second most common etiology for reported encephalitis cases (n=3, 2%).
A total of 19 (14%) encephalitis cases were considered to be due to an unknown viral etiology based on review of medical records.
The greatest incidence of encephalitis was in persons >65 years old (7.3 cases per 100,000) followed by those 55-64 years old (1.3 cases per 100,000 population). The peak incidence in persons >65 years old corresponds to age as a risk factor for WNV-associated neuroinvasive disease. The average age of WNV encephalitis cases in 2015 was 69.4 years.
The highest encephalitis incidence rates were documented within SPA 2 (2.3 cases per 100,000) and SPA 7 (2.0 cases per 100,000) (Figure 3). The SPAs with the highest incidence rates for WNV-associated encephalitis were SPA 2 (1.9 cases per 100,000) and SPA 3 (1.7 cases per 100,000).
CRUDE DATA
Number of Cases 136
Annual Incidencea LA County 1.42 Californiab N/A United Statesb N/A Age at Diagnosis Mean 60 Median 63 Range 0–94 years

Encephalitis Page 74
Acute Communicable Disease Control 2015 Annual Morbidity Report
Reported Encephalitis Cases and Rates* per 100,000 by Age Group, Race/Ethnicity, and SPA LAC, 2011-2015
2011 (N=59) 2012 (N=75) 2013 (N=79) 2014 (N=92) 2015 (N=136)
No.
(%) Rate/
No.
(%) Rate/
No.
(%) Rate/
No.
(%) Rate/
No. (%) Rate/
100,000 100,000 100,000 100,000 100,000
Age Group
<1 3 5.1 2.1 1 1.3 0.8 1 1.3 0.8 1 1.1 0.8 0 - -1-4 4 6.8 0.7 3 4.0 0.6 4 5.1 0.8 2 2.2 0.4 1 0.7 0.25-14 10 16.9 0.8 8 10.7 0.7 7 8.9 0.6 4 4.3 0.3 7 5.1 0.615-34 8 13.6 0.3 6 8.0 0.2 6 7.6 0.2 5 5.4 0.2 5 3.7 0.235-44 2 3.4 0.1 0 0 - 1 1.3 0.1 3 3.3 0.2 6 4.4 0.545-54 9 15.3 0.7 9 12.0 0.7 13 16.5 1.0 10 10.9 0.8 16 11.8 1.255-64 8 13.6 0.8 12 16.0 1.2 19 24.1 1.9 23 25.0 2.2 14 10.3 1.365+ 15 25.4 1.4 36 48.0 3.2 28 25.3 2.5 44 47.8 3.9 87 64.0 7.3Unknown 0 - - 0 - - 8 10.1 - 0 - - - - -
Race/Ethnicity Asian 0 0 - 8 10.7 0.6 6 7.6 0.4 8 8.7 0.6 4 2.9 0.3Black 4 6.8 0.5 3 4.0 0.4 2 2.5 0.3 3 3.3 0.4 3 2.2 0.4Hispanic 33 55.9 0.7 23 30.7 0.5 20 25.3 0.4 24 26.1 0.5 51 37.5 1.1White 14 23.7 0.5 31 41.3 1.2 36 45.6 1.4 40 43.5 1.5 62 45.6 2.3Other 1 1.7 - 5 6.7 - 3 3.8 - 0 - - 1 0.7 -Unknown 7 11.9 - 5 6.7 - 12 15.2 - 17 18.5 - 15 11.0 -
SPA 1 2 3.4 0.5 6 8.0 1.5 6 7.6 1.5 1 1.1 0.3 4 2.9 1.02 20 33.9 0.9 22 29.3 1.0 27 34.2 1.2 21 22.8 1.0 52 38.2 2.33 9 15.3 0.5 24 32.0 1.5 11 13.9 0.7 14 15.2 0.9 19 14.0 1.14 4 6.8 0.3 10 13.3 0.9 3 3.8 0.3 12 13.0 1.0 14 10.3 1.25 1 1.7 0.2 2 2.7 0.3 2 2.5 0.3 11 12.0 1.7 11 8.1 1.76 4 6.8 0.4 4 5.3 0.4 3 3.8 0.3 5 5.4 0.5 3 2.2 0.37 8 13.6 0.6 5 6.7 0.4 11 13.9 0.8 18 19.6 1.4 26 19.1 2.08 5 8.5 0.4 2 2.7 0.2 13 16.5 1.2 9 9.8 0.8 7 5.1 0.6Unknown 6 10.2 - 0 - - 3 3.8 - 1 1.1 - 0 - -
*Rates calculated based on less than 19 cases or events are considered unreliable.

Encephalitis
Page 75
Acute Communicable Disease Control 2015 Annual Morbidity Report
0
0.5
1
1.5
2
2.5
1 2 3 4 5 6 7 8
Cas
es p
er 1
00,0
00
SPA
Figure 3. Incidence Rates of Encephalitis by SPALAC, 2015 (N=136)
0
10
20
30
40
50
60
Jan Feb Mar Apr May Jun Jul Aug Sep Oct Nov Dec
Num
ber o
f Cas
es
Month
Figure 4. Reported Encephalitis Cases by Month of OnsetLAC, 2015 (N=136)
WNV Other EncephalitisPrevious 5-year average
Figure 2. Percent Cases of Encephalitis by Race/Ethnicity LAC, 2015 (*N=136)
Asian3%
Black2%
Hispanic38%
White46%
Other1%
Unknown11%
0
0.25
0.5
0.75
1
1.25
1.5
2011 2012 2013 2014 2015
Cas
es p
er 1
00,0
00
Year
Figure 1. Incidence Rates* of EncephalitisLAC, 2011-2015
*See text for limitations.

Encephalitis Page 76
Acute Communicable Disease Control 2015 Annual Morbidity Report
0
10
20
30
40
50
60
70
White Black Asian Hispanic
Num
ber o
f Cas
es
Race/Ethnicity
Figure 5. Reported Encephalitis Cases by Race/EthnicityLAC, 2011-2015
2011 2012 2013 2014 2015

Catalina Island (HB)
Map 5. EncephalitisRates by Health District, Los Angeles County, 2015*
.0 4.5 92.25
Miles
AV
SF
WV
WE
EV FH
PO
*PSNE
CEHW
SWSESO
IW
TO
HB
SAEL
AH
WHEM
BFCN
*LB
GL
*Excludes Long Beach and Pasadena Data.
Health District BoundaryService Planning Area (SPA)
Cases Per 100,000 Population1.9 - 5.21.5 - 1.81.0 - 1.40.4 - 0.90.0 - 0.3
EncephalitisPage 77

Encephalitis Page 78
Acute Communicable Disease Control 2015 Annual Morbidity Report

Acute Communicable Disease Control2014 Annual Morbidity Report
ENCEPHALITIS
aCases per 100,000 population.bNot nationally notifiable.
DESCRIPTION
Encephalitis, an inflammation of parts of the brain, spinal cord and meninges, causes headache, stiff neck, fever and altered mental status. It can result from infection with a number of different agents including viral, parasitic, fungal, rickettsial, and bacterial pathogens as well as chemical agents. LAC DPH conducts passive surveillance and is limited to cases with suspected or confirmed viral and bacterial etiologies, which includes primary and post-infectious encephalitis but excludes individuals with underlying human immunodeficiency virus (HIV) infection. Of special concern are arthropod-borne viruses (i.e., arboviruses), which are maintained in nature through biological transmission between susceptible vertebrate hosts by blood feeding arthropods (mosquitoes, ticks, and certain mites and gnats). All arboviral encephalitides are zoonotic, being maintained in complex life cycles involving a nonhuman vertebrate primary host and a primary arthropod vector. Arboviruses have a global distribution. The five main viral agents of encephalitis in the United States are West Nile virus (WNV), eastern equine encephalitis (EEE)
virus, western equine encephalitis (WEE) virus, St. Louis encephalitis (SLE) virus and La Crosse (LAC) virus, all of which are transmitted by mosquitoes and thus can be prevented by personal protection and mosquito control (see West Nile virus chapter).
2014 TRENDS AND HIGHLIGHTS
� A total of 92 cases of encephalitis were confirmed in 2014 compared with 79 cases reported in 2013. The 2014 surveillance year had the second highest number of total WNV infections since 2004 (see WNV chapter).
� Most cases (n=67, 73%) of encephalitis were laboratory confirmed to be WNV-associated encephalitis, the most frequently reported etiology for viral encephalitis in the U.S. Cases of WNV encephalitis were reported from lateJuly through late November. The peak month of encephalitis reports, September, coincided with the WNV-infection peak in 2014 (Figure 4).
� Herpes virus encephalitis associated withherpes zoster due to infection with varicella zoster virus (VZV) and herpes simplex virus (HSV) was the third most common etiology for reported encephalitis; three (3%) each cases case of HSV and VZV associated encephalitis were documented.
� Sixteen (17%) encephalitis cases were considered to be due to an unknown viral etiology based on review of medical records.
� The greatest incidence of encephalitis was in persons 65 years old and older (3.9 cases per 100,000) followed by those 55-64 years of age (2.2 cases per 100,000 population). The peak incidence in persons 65 years and older corresponds to age as a risk factor for WNV-associated neuroinvasive disease. The average age of WNV encephalitis cases in 2014 was 66.7 years.
� The highest encephalitis incidence rateswere documented within SPAs 5 and 7, which also matches the SPAs with highest incidence rates for WNV-associated encephalitis (Figure 1).
CRUDE DATA
Number of Cases 92Annual Incidencea
LA County 0.97Californiab N/AUnited Statesb N/A
Age at DiagnosisMean 60 yearsMedian 63 yearsRange 0–94 years
EncephalitisPage 65

Acute Communicable Disease Control2014 Annual Morbidity Report
Reported Encephalitis Cases and Rates* per 100,000 by Age Group, Race/Ethnicity, and SPALos Angeles County, 2009-2014
2010 (N=51) 2011 (N=59) 2012 (N=75) 2013 (N=79) 2014 (N=92)
No. (%) Rate/100,000 No. No. (%) Rate/
100,000Rate/
100,000 No. (%) Rate/100,000 No. (%) Rate/
100,000 No. (%) Rate/100,000
Age Group<1 1 2.0 0.7 3 5.1 2.5 1 1.3 0.8 1 1.3 0.8 1 1.1 0.81-4 4 7.8 0.7 4 6.8 0.8 3 4.0 0.6 4 4.0 0.6 2 2.2 0.45-14 21 41.2 1.6 10 16.5 0.8 8 10.7 0.7 7 10.7 0.7 4 4.3 0.315-34 11 21.6 0.4 8 13.6 0.3 6 8.0 0.2 6 8.0 0.2 5 5.4 0.135-44 1 2.0 0.1 2 3.4 0.2 0 0.0 - 1 0.0 - 3 3.3 0.245-54 4 7.8 0.3 9 15.7 0.7 9 12.0 0.7 13 12.0 0.7 10 11.0 0.855-64 6 11.8 0.6 8 13.5 0.8 12 16.0 1.2 19 16.0 1.2 23 25.3 2.265+ 3 5.9 0.3 15 25.4 1.4 36 48.0 3.2 28 48.0 3.2 44 48.3 3.9Unknown 0 - - 0 - - 0 - - 0 - - 0 - -Race/Ethnicity
Asian 6 11.8 0.4 0 - - 8 10.7 0.6 6 10.7 0.4 8 7.7 0.6Black 3 5.9 0.4 4 6.8 0.5 3 4.0 0.4 2 4.0 0.3 3 3.3 0.4Hispanic 27 52.9 0.6 33 55.9 0.7 23 30.7 0.5 20 30.7 0.4 24 25.3 0.5White 7 13.7 0.2 14 23.7 0.5 31 41.3 1.2 36 41.3 1.4 40 43.9 1.5Other 1 2.0 - 1 1.7 - 5 6.7 - 3 6.7 - 0 - -Unknown 7 13.7 - 7 11.9 - 5 6.7 - 12 6.7 - 17 19.8 -SPA
1 2 3.9 0.5 2 3.4 0.5 6 8.0 1.5 6 8.0 1.5 1 1.1 0.32 10 19.6 0.5 20 33.9 0.9 22 29.3 1.0 27 29.3 1.2 21 22.8 1.03 7 13.7 0.4 9 15.2 0.6 24 32.0 1.5 11 32.0 0.7 14 15.2 0.94 4 7.8 0.3 4 6.8 0.4 10 13.3 0.9 3 13.3 0.3 12 13.0 1.05 2 3.9 0.3 1 1.7 0.2 2 2.7 0.3 2 2.7 0.3 11 12.0 1.76 13 25.5 1.2 4 6.8 0.4 4 5.3 0.4 3 5.3 0.3 5 5.4 0.57 5 9.8 0.4 8 13.5 0.6 5 6.7 0.4 11 6.7 0.8 18 19.6 1.48 4 7.8 0.4 5 8.2 0.5 2 2.7 0.2 13 2.7 1.2 9 9.8 0.8Unknown 4 7.8 - 6 10.2 - 0 - - 0 - - 1 1.1 -
*Rates calculated based on less than 19 cases or events are considered unreliable.
EncephalitisPage 66
Acute Communicable Disease Control2014 Annual Morbidity Report
*See text for limitations. * Other includes Native American and any additional racial group that cannot be categorized as Asian, black, Hispanic, or white.
0
0.25
0.5
0.75
1
1.25
2010 2011 2012 2013 2014
Cas
es p
er 1
00,0
00
Year
Figure 1. Incidence Rates* of EncephalitisLAC, 2010-2014
0
0.25
0.5
0.75
1
1.25
1.5
1.75
2
1 2 3 4 5 6 7 8
Cas
es p
er 1
00,0
00
SPA
Figure 3. Incidence Rates of Encephalitis by SPALAC, 2014 (N=92)
Asian7.7% Black
3.3%
Hispanic25.3%
White43.9%
Unknown19.8%
0
5
10
15
20
25
30
35
40
45
Jan Feb Mar Apr May Jun Jul Aug Sep Oct Nov Dec
Num
ber o
f Cas
es
Month
Figure 4. Reported Encephalitis Cases by Month of OnsetLAC, 2014 (N=92)
WNV Other EncephalitisPrevious 5-year average
Figure 2. Percent Cases of Encephalitis by Race/Ethnicity LAC, 2014 (*N=92)
EncephalitisPage 67

Acute Communicable Disease Control2014 Annual Morbidity Report
0
10
20
30
40
50
White Black Asian Hispanic
Num
ber o
f Cas
es
Race/Ethnicity
Figure 5. Reported Encephalitis Cases by Race/EthnicityLAC, 2010-2014
2010 2011 2012 2013 2014
EncephalitisPage 68

Catalina Island (HB)
Map 5. EncephalitisRates by Health District, Los Angeles County, 2014*
.0 4.5 92.25
Miles
AV
SF
WV
WE
EVFH
PO
*PSNE
CEHW
SWSESO
IW
TO
HB
SA
EL
AH
WH
EM
BFCN
*LB
GL
*Excludes Long Beach and Pasadena Data.
Health District Boundary
Service Planning Area (SPA)
Cases Per 100,000 Population
1.7 - 3.1
1.1 - 1.6
0.8 - 1.0
0.4 - 0.7
0.0 - 0.3
��������� ������

Encephalitis Page 67
Acute Communicable Disease Control2013 Annual Morbidity Report
ENCEPHALITIS
aCases per 100,000 population.
DESCRIPTION
Encephalitis, an inflammation of parts of the brain, spinal cord and meninges, causes headache, stiff neck, fever and altered mental status. It can result from infection with a number of different agents including viral, parasitic, fungal, rickettsial, and bacterial pathogens as well as chemical agents. Public health conducts passive surveillance is limited to cases with suspected or confirmed viral and bacterial etiologies,which includes primary and post-infectious encephalitis but excludes individuals with underlying human immunodeficiency virus (HIV) infection. Of special concern are arthropod-borne viruses (i.e., arboviruses), which are maintained in nature through biological transmission between susceptible vertebrate hosts by blood feeding arthropods (mosquitoes, ticks, and certain mites and gnats). All arboviral encephalitides are zoonotic, being maintained in complex life cycles involving a nonhuman vertebrate primary host and a primary arthropod vector. Arboviruses have a global distribution. The five main viral agents of encephalitis in the United States are West Nile virus (WNV), eastern equine
encephalitis (EEE) virus, western equine encephalitis (WEE) virus, St. Louis encephalitis (SLE) virus and La Crosse (LAC) virus, all of which are transmitted by mosquitoes and thus can be prevented by personal protection and mosquito control (see West Nile virus chapter).
2013 TRENDS AND HIGHLIGHTS
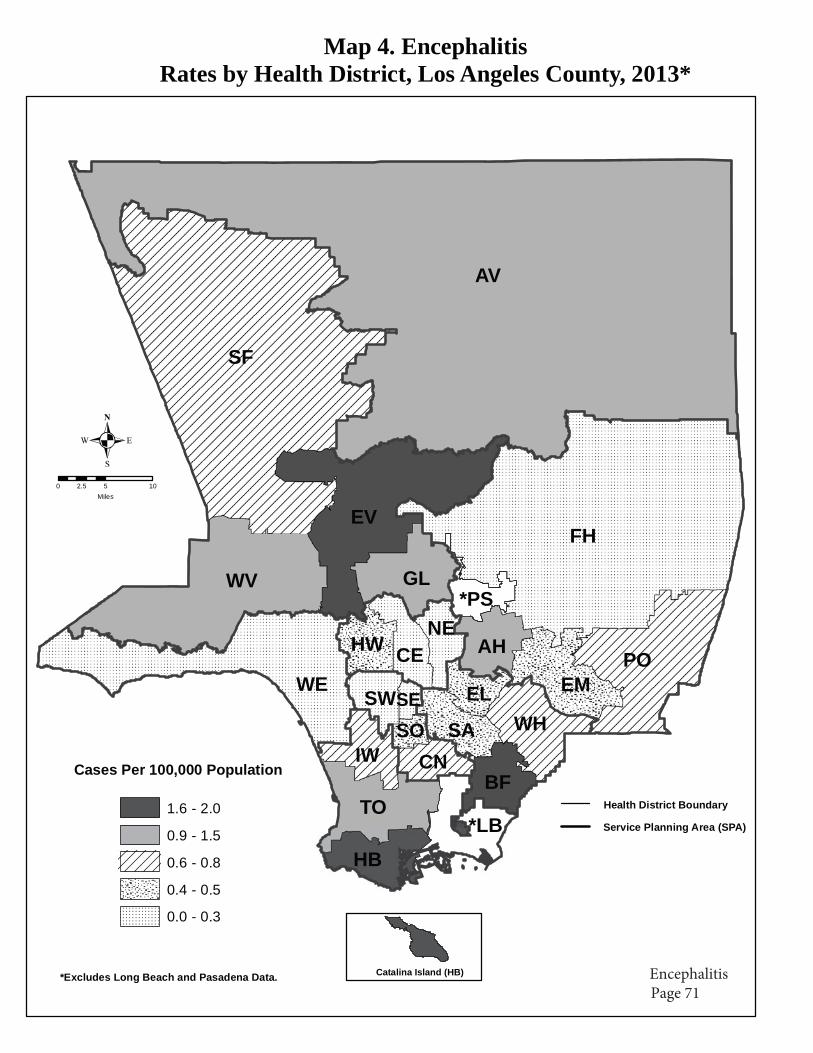
Seventy-nine cases of encephalitis wereconfirmed in 2013 compared with 75 casesreported in 2012. The 2013 surveillance yearhad the third highest number of total WNVinfections since 2004 (see WNV chapter).Forty-six (58%) cases WNV-encephalitis, themost frequently reported etiology for viralencephalitis, were laboratory confirmed. Casesof WNV encephalitis were reported from earlyJuly through late November. The peak month ofencephalitis reports, September, coincided withthe WNV- infection peak in 2013 (Figure 4).Herpes zoster complicated by encephalitis wasthe third most common etiology for reportedencephalitis; 2 (3%) cases were documented.Thirty-one (39%) encephalitis cases wereassessed to be due to an unknown viraletiology based on review of medical records.The greatest incidence of encephalitis wasin persons 65 years and older (3.2 cases per100,000) followed by those 55-64 years ofage (1.2 cases per 100,000 population)(data not shown). The peak incidence inpersons 65 years and older corresponds toage as a risk factor for WNV- associatedneuroinvasive disease.The highest encephalitis incidence rateswere documented within SPAs 1, 2 and 8.This can be attributed to the increasednumber of WNV-associated encephalitiscases in these regions of Los AngelesCounty (Figure 3).
CRUDE DATA
Number of Cases 79Annual Incidencea
LA County 0.84California N/AUnited States N/A
Age at DiagnosisMean 53 yearsMedian 58 yearsRange 0-99 years

Encephalitis Page 68
Acute Communicable Disease Control2013 Annual Morbidity Report
Reported Encephalitis Cases and Rates* per 100,000 by Age Group, Race/Ethnicity, and SPA Los Angeles County, 2009-2013
2009 (N=51) 2010 (N=51) 2011 (N=59) 2012 (N=75) 2013 (N=79)
No. (%) Rate/100,000 No. (%) Rate/
100,000 No. (%) Rate/100,000 No. (%) Rate/
100,000 No. (%) Rate/100,000
Age Group<1 0 0 - 1 2.0 0.7 3 5.1 2.5 1 1.3 0.8 1 1.3 0.81-4 4 7.8 0.7 4 7.8 0.7 4 6.8 0.8 3 4.0 0.6 4 4.0 0.65-14 17 33.4 1.2 21 41.2 1.6 10 16.5 0.8 8 10.7 0.7 7 10.7 0.7 15-34 10 19.6 0.4 11 21.6 0.4 8 13.6 0.3 6 8.0 0.2 6 8.0 0.235-44 2 3.9 0.1 1 2.0 0.1 2 3.4 0.2 0 0.0 - 1 0.0 -45-54 7 13.7 0.5 4 7.8 0.3 9 15.7 0.7 9 12.0 0.7 13 12.0 0.755-64 2 3.9 0.2 6 11.8 0.6 8 13.5 0.8 12 16.0 1.2 19 16.0 1.265+ 8 15.7 0.8 3 5.9 0.3 15 25.4 1.4 36 48.0 3.2 28 48.0 3.2Unknown 1 2.0 0 0 0.0Race/Ethnicity
Asian 5 9.8 0.4 6 11.8 0.4 0 - - 8 10.7 0.6 6 10.7 0.4 Black 2 3.9 0.2 3 5.9 0.4 4 6.8 0.5 3 4.0 0.4 2 4.0 0.3 Hispanic 22 43.2 0.5 27 52.9 0.6 33 55.9 0.7 23 30.7 0.5 20 30.7 0.4 White 9 17.6 0.3 7 13.7 0.2 14 23.7 0.5 31 41.3 1.2 36 41.3 1.4 Other 1 2.0 - 1 2.0 - 1 1.7 - 5 6.7 - 3 6.7 -Unknown 12 23.5 - 7 13.7 - 7 11.9 - 5 6.7 - 12 6.7 -SPA
1 3 5.9 0.8 2 3.9 0.5 2 3.4 0.5 6 8.0 1.5 6 8.0 1.52 11 21.7 0.5 10 19.6 0.5 20 33.9 0.9 22 29.3 1.0 27 29.3 1.2 3 10 19.6 0.6 7 13.7 0.4 9 15.2 0.6 24 32.0 1.5 11 32.0 0.74 7 13.7 0.6 4 7.8 0.3 4 6.8 0.4 10 13.3 0.9 3 13.3 0.3 5 0 0.0 - 2 3.9 0.3 1 1.7 0.2 2 2.7 0.3 2 2.7 0.36 7 13.7 0.7 13 25.5 1.2 4 6.8 0.4 4 5.3 0.4 3 5.3 0.3 7 9 17.6 0.7 5 9.8 0.4 8 13.5 0.6 5 6.7 0.4 11 6.7 0.8 8 2 3.9 0.2 4 7.8 0.4 5 8.2 0.5 2 2.7 0.2 13 2.7 1.2
Unknown 2 3.9 4 7.8 6 10.2 - - - -
*Rates calculated based on less than 19 cases or events are considered unreliable.

Encephalitis Page 69
Acute Communicable Disease Control2013 Annual Morbidity Report
*See text for limitations. * Other includes Native American and any additional racial group thatcannot be categorized as Asian, black, Hispanic, or white.
0
0.25
0.5
0.75
1
1.25
1.5
2009 2010 2011 2012 2013
Cas
es p
er 1
00,0
00
Year
Figure 1. Incidence Rates* of EncephalitisLAC, 2009-2013
0
0.25
0.5
0.75
1
1.25
1.5
1 2 3 4 5 6 7 8
Cas
es p
er 1
00,0
00
SPA
Figure 3. Incidence Rates of Encephalitis by SPALAC, 2013 (N=79)
Asian6% Black
2%
Hispanic20%
White36%
Other*3%
Unknown12%
0
5
10
15
20
25
30
Jan Feb Mar Apr May Jun Jul Aug Sep Oct Nov Dec
Num
ber o
f Cas
es
Month
Figure 4. Reported Encephalitis Cases by Month of OnsetLAC, 2013 (N=79)
WNV Other EncephalitisPrevious 5-year average
Figure 2. Percent Cases of Encephalitis by Race/Ethnicity LAC, 2013 (*N=79)

Encephalitis Page 70
Acute Communicable Disease Control2013 Annual Morbidity Report
0
10
20
30
40
White Black Asian Hispanic
Num
ber o
f Cas
es
Race/Ethnicity
Figure 5. Reported Encephalitis Cases by Race/EthnicityLAC, 2009-2013
2009 2010 2011 2012 2013
Catalina Island (HB)
Map 4. EncephalitisRates by Health District, Los Angeles County, 2013*
.0 5 102.5
Miles
AV
SF
WV
WE
EVFH
PO
*PSNE
CEHW
SWSESO
IW
TO
HB
SA
EL
AH
WH
EM
BFCN
*LB
GL
*Excludes Long Beach and Pasadena Data.
Health District Boundary
Service Planning Area (SPA)
Cases Per 100,000 Population
1.6 - 2.0
0.9 - 1.5
0.6 - 0.8
0.4 - 0.5
0.0 - 0.3

Encephalitis Page 72
Acute Communicable Disease Control2013 Annual Morbidity Report

Encephalitis Page 69
Acute Communicable Disease Control2012 Annual Morbidity Report
����������
aCases per 100,000 population. � ��������
Encephalitis, an inflammation of parts of the brain, spinal cord and meninges, causes headache, stiff neck, fever and altered mental status. It can result from infection with a number of different agents including viral, parasitic, fungal, rickettsial, and bacterial pathogens as well as chemical agents. Public health conducts passive surveillance and islimited to cases with suspected or confirmed viral and bacterial etiologies, which includes primary and post-infectious encephalitis but excludes individuals with underlying human immunodeficiency virus (HIV) infection. Of special concern are arthropod-borne viruses (i.e., arboviruses), which are maintained in nature through biological transmission between susceptible vertebrate hosts by blood feeding arthropods (mosquitoes, ticks, and certain mites and gnats). All arboviral encephalitides are zoonotic, being maintained in complex life cyclesinvolving a nonhuman vertebrate primary host and a primary arthropod vector. Arboviruses have a global distribution. The five main viral agents of encephalitis in the United States are West Nile virus (WNV), eastern equine encephalitis (EEE) virus, western equine encephalitis (WEE) virus, St. Louis encephalitis (SLE) virus and La Crosse (LAC) virus, all of which are transmitted by mosquitoes and thus can be prevented by personal protection and mosquito control (see West Nile virus chapter).
��
�������� ���� ����������� Seventy-five cases of encephalitis were
confirmed in 2012 compared to 59 cases reported in 2011. The increase in case reports is largely due to the increased WNV –encephalitis case reported in 2012. The 2012 surveillance year was the second highest number of total WNV infections since 2004 (see special report).
� Forty-six (61%) cases of WNV-encephalitis were laboratory confirmed, the most frequently reported etiology. Cases of WNV encephalitis were reported from early July through late November. The peak month of encephalitis reports, September, coincided with the WNV- infection peak in 2012 (Figure 4).
� Herpes zoster complicated by encephalitis was the 2nd most common etiology for reported encephalitis cases; four (5%) cases were documented.
� Twenty-five (33%) encephalitis cases were assessed to be due to an unknown viral etiology based on review of medical records.
� The greatest incidence of encephalitis was in persons 65 years and older (3.3 cases per 100,000) followed by those 55-64 years ofage (1.2 cases per 100,000 population) (See Table). The peak incidence in persons 55 years and older corresponds to age as a risk factor for WNV- associated neuroinvasive disease.
� The highest encephalitis case incidence rates were documented within SPAs 1 and 3 and can be attributed to the increased number of WNV- associated encephalitis cases in this region of Los Angeles County (Figure 3).
� Fifteen (20%) encephalitis cases were reported to public health that had laboratory testing conducted by the Neurologic Testing and Surveillance Branch of the California Department of Public Health. All cases were classified as viral encephalitis of unknown etiology; extensive testing revealed no clear viral etiology. More information on the California Department of Public Health Neurological Surveillance and Testing Program can be found at
� http://www.cdph.ca.gov/programs/vrdl/Pages/NeurologicSurveillanceTesting.aspx.
��� �� ��
Number of Cases 75Annual Incidencea
LA County 0.81California N/AUnited States N/A
Age at DiagnosisMean 55 yearsMedian 64 yearsRange 0 -91 years

Encephalitis Page 70
Acute Communicable Disease Control2012 Annual Morbidity Report
����������������� � !���!�!���������!"��������#����$%��&�����'�#�����(���� � �%#�����������!���&���!���'��%#����)*�����
����)�+�,)-.� ���-�+�,/�.� �����+�,/�.� �����+�,/-.� �����+�,0/.�
No. (%) Rate/100,000 No. (%) Rate/
100,000 No. (%) Rate/100,000 No. (%) Rate/
100,000 No. (%) Rate/100,000
�&�����'��<1 4 4.5 2.9 0 0 - 1 2.0 0.7 3 5.1 2.5 1 1.3 0.81-4 8 9.0 1.4 4 7.8 0.7 4 7.8 0.7 4 6.8 0.8 3 4.0 0.65-14 14 15.7 1.0 17 33.4 1.2 21 41.2 1.6 10 16.5 0.8 8 10.7 0.715-34 4 4.5 0.1 10 19.6 0.4 11 21.6 0.4 8 13.6 0.3 6 8.0 0.235-44 1 1.1 0.1 2 3.9 0.1 1 2.0 0.1 2 3.4 0.2 0 0.0 -45-54 11 12.4 0.8 7 13.7 0.5 4 7.8 0.3 9 15.7 0.7 9 12.0 0.755-64 14 15.7 1.5 2 3.9 0.2 6 11.8 0.6 8 13.5 0.8 12 16.0 1.265+ 33 37.1 3.2 8 15.7 0.8 3 5.9 0.3 15 25.4 1.4 36 48.0 3.3Unknown 0 0.0 1 2.0 0 0 0.0Race/Ethnicity
Asian 3 3.4 0.2 5 9.8 0.4 6 11.8 0.4 0 - - 8 10.7 0.6Black 5 5.6 0.6 2 3.9 0.2 3 5.9 0.4 4 6.8 0.5 3 4.0 0.4Hispanic 40 44.9 0.9 22 43.2 0.5 27 52.9 0.6 33 55.9 0.7 23 30.7 0.5White 38 42.7 1.3 9 17.6 0.3 7 13.7 0.2 14 23.7 0.5 31 41.3 1.2Other 1 1.1 4.1 1 2.0 - 1 2.0 - 1 1.7 - 5 6.7 1.2Unknown 2 2.2 12 23.5 - 7 13.7 - 7 11.9 - 5 6.7 -SPA
1 3 3.4 0.8 3 5.9 0.8 2 3.9 0.5 2 3.4 0.5 6 8.0 1.52 9 10.1 0.4 11 21.7 0.5 10 19.6 0.5 20 33.9 0.9 22 29.3 1.13 25 28.1 1.4 10 19.6 0.6 7 13.7 0.4 9 15.2 0.6 24 32.0 1.54 10 11.2 0.8 7 13.7 0.6 4 7.8 0.3 4 6.8 0.4 10 13.3 0.95 0 0.0 0.0 0 0.0 - 2 3.9 0.3 1 1.7 0.2 2 2.7 0.36 3 3.4 0.3 7 13.7 0.7 13 25.5 1.2 4 6.8 0.4 4 5.3 0.47 16 18.0 1.2 9 17.6 0.7 5 9.8 0.4 8 13.5 0.6 5 6.7 0.48 9 10.1 0.8 2 3.9 0.2 4 7.8 0.4 5 8.2 0.5 2 2.7 0.2
Unknown 14 15.7 2 3.9 4 7.8 6 10.2 0 0
*Rates calculated based on less than 19 cases or events are considered unreliable.

Encephalitis Page 71
Acute Communicable Disease Control2012 Annual Morbidity Report
*See text for limitations.
* Other includes Native American and any additional racial group that cannot be categorized as Asian, black, Hispanic, or white.
0
0.25
0.5
0.75
1
1.25
1.5
2000 2001 2002 2003 2004 2005 2006 2007 2008 2009 2010 2011 2012
��!
�!��
����
��#�
���
1����
2 &'����3��� ����������!*��4��������� � !����#�����*�����
0
0.25
0.5
0.75
1
1.25
1.5
1 2 3 4 5 6 7 8
��!
�!��
����
��#�
���
����
2 &'���53��� ����������!��4��������� � !�$%��������#������+�,06.�
Asian10%
Black4%
Hispanic31%
White41%
Other*7%
Unknown7%
2 &'����3�����������!�!��4��������� � !�$%�����(���� � �%����#������+�,06.�
0
5
10
15
20
25
Jan Feb Mar Apr May Jun Jul Aug Sep Oct Nov Dec
�'7
$����
4���!
�!�
8�����
2 &'���93������������������ � !���!�!�$%�8������4���!������#������+�,06.�
:�; ����� ���< �'!�/*%�����<���&�

Encephalitis Page 72
Acute Communicable Disease Control2012 Annual Morbidity Report
0
10
20
30
40
50
White Black Asian Hispanic
�'7
$����
4���!
�!
����(���� � �%�
2 &'���/3������������������ � !���!�!�$%�����(���� � �%����#����6*�����
���6 ���0 ���) ���- ���� ���� ����

Catalina Island (HB)
Map �. EncephalitisRates by Health Distr�ct, Los Angeles County, 2012*
.0 5 102.5
Miles
AV
SF
WV
WE
EVFH
PO
*PSNE
CEHW
SWSESO
IW
TO
HB
SA
EL
AH
WH
EM
BFCN
*LB
GL
*Excludes Long Beach and Pasadena Data.
Health District Boundary
Service Planning Area (SPA)
Cases Per 100,000 Population1.6 - 3.0
1.0 - 1.5
0.6 - 0.9
0.1 - 0.5
0.0
EncephalitisPage 73

Encephalitis Page 67
Acute Communicable Disease Control 2011 Annual Morbidity Report
ENCEPHALITIS
aCases per 100,000 population.
DESCRIPTION
Encephalitis, an inflammation of parts of the brain, spinal cord and meninges, causes headache, stiff neck, fever and altered mental status. It can result from infection with a number of different agents including viral, parasitic, fungal, rickettsial, and bacterial pathogens as well as chemical agents. Public health surveillance is limited to cases with suspected or confirmed viral and bacterial etiologies, which includes primary and post-infectious encephalitis but excludes individuals with underlying human immunodeficiency virus (HIV) infection. Of special concern are arthropod-borne viruses (i.e., arboviruses), which are maintained in nature through biological transmission between susceptible vertebrate hosts by blood feeding arthropods (mosquitoes, ticks, and certain mites and gnats). All arboviral encephalitides are zoonotic, being maintained in complex life cycles involving a nonhuman vertebrate primary host and a primary arthropod vector. Arboviruses have a global distribution. The five main viral agents of encephalitis in the United States are West Nile virus (WNV), eastern equine encephalitis (EEE) virus, western equine encephalitis (WEE) virus, St. Louis encephalitis (SLE) virus and La Crosse (LAC) virus, all of which are transmitted by
mosquitoes and thus can be prevented by personal protection and mosquito control (see West Nile virus chapter).
2011 TRENDS AND HIGHLIGHTS
� Most encephalitis case reports originate from acute care medical facilities and physicians. Prior to its closure in January 2012, the California Encephalitis Project (http://ceip.us/encephalitis.htm) contributed a significant number of case reports as well.
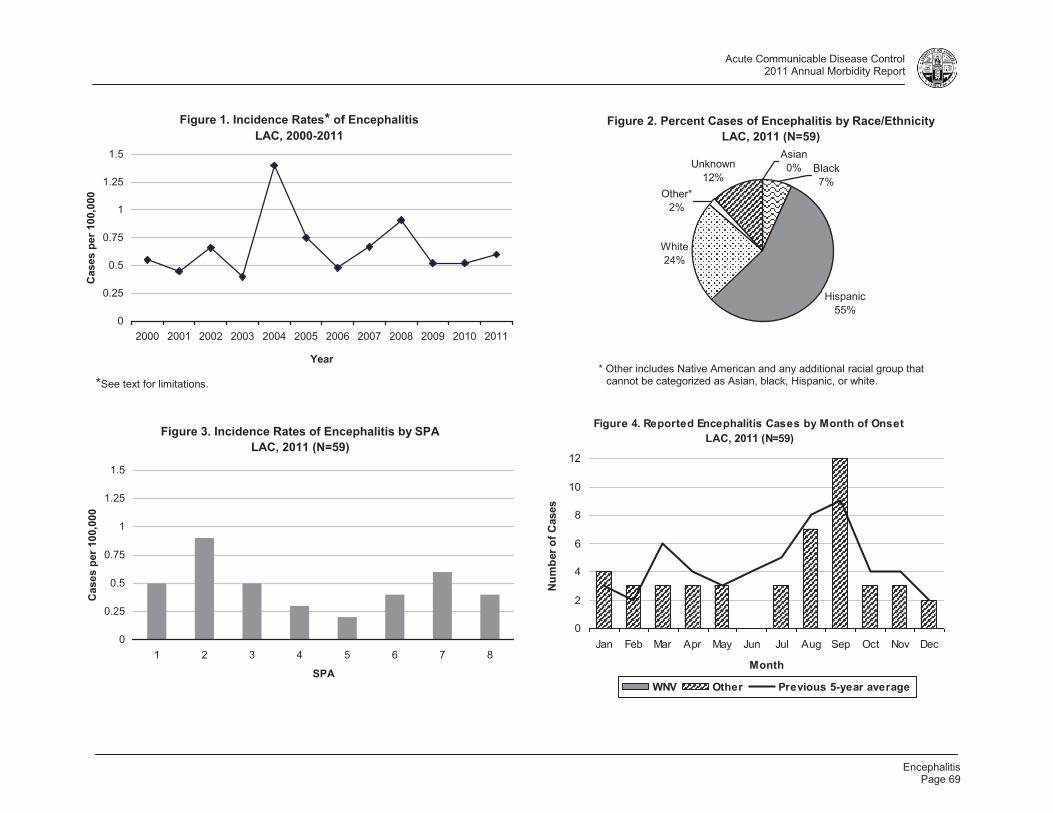
� Fifty- nine cases of encephalitis were confirmed in 2011 compared to 51 cases reported in 2010. Fifteen (25%) cases of WNV encephalitis were laboratory confirmed and are included in this report. Cases of WNV encephalitis were reported from July through October, consistent with vector-borne encephalitis, resulting in the spike of summertime cases shown in Figure 4.
� Twenty-seven (46%) encephalitis cases were assessed to be due to an unknown viral etiology based on review of medical records.
� The greatest incidence of encephalitis was in the <1 year old group (2.1 cases per 100,000) followed by those 65 years of age and older (1.4 cases per 100,000 population) (data not shown). The high rate in SPA 2 can be attributed to WNV encephalitis case predominance in that region (Figure 3).
� Seventeen (29%) encephalitis cases were reported to Los Angeles County Department of Public Health (LAC DPH) by the California Encephalitis Project (CEP). Of these, seven cases were laboratory confirmed with a viral or bacterial etiology including HSV-2, adenovirus, Mycoplasma pneumoniae (2 cases), enterovirus, and parainfluenza virus 3. One case was later determined to have botulism. Seven cases suggested an infectious etiology that could not be identified and were classified as viral encephalitis of unknown etiology.
CRUDE DATA
Number of Cases 59Annual Incidencea
LA County 0.60 California N/A United States N/A
Age at Diagnosis Mean 41 years Median 48 years Range 0 -85 years
2011 Annual Morbidity Report

Encephalitis Page 68
Acute Communicable Disease Control 2011 Annual Morbidity Report
Reported Encephalitis Cases and Rates* per 100,000 by Age Group, Race/Ethnicity, and SPA Los Angeles County, 2007-2011
2007 (N=65) 2008 (N=89) 2009 (N=51) 2010 (N=51) 2011 (N=59)
No. (%) Rate/ 100,000 No. (%) Rate/
100,000 No. (%) Rate/ 100,000 No. (%) Rate/
100,000 No. (%) Rate/ 100,000
Age Group <1 3 4.6 2.0 4 4.5 2.9 0 0 - 1 2.0 0.7 3 5.1 2.1 1-4 6 9.2 1.0 8 9.0 1.4 4 7.8 0.7 4 7.8 0.7 4 6.8 0.7 5-14 13 20.0 0.9 14 15.7 1.0 17 33.4 1.2 21 41.2 1.6 10 16.5 0.815-34 15 23.1 0.5 4 4.5 0.1 10 19.6 0.4 11 21.6 0.4 8 13.6 0.335-44 2 3.1 0.1 1 1.1 0.1 2 3.9 0.1 1 2.0 0.1 2 3.4 0.145-54 6 9.2 0.5 11 12.4 0.8 7 13.7 0.5 4 7.8 0.3 9 15.7 0.755-64 7 10.8 0.8 14 15.7 1.5 2 3.9 0.2 6 11.8 0.6 8 13.5 0.865+ 10 15.4 1.0 33 37.1 3.2 8 15.7 0.8 3 5.9 0.3 15 25.4 1.4Unknown 3 4.6 0 0.0 1 2.0 0 0 0.0Race/Ethnicity
Asian 7 10.8 0.5 3 3.4 0.2 5 9.8 0.4 6 11.8 0.4 0 - Black 5 7.7 0.6 5 5.6 0.6 2 3.9 0.2 3 5.9 0.4 4 6.8 0.3Hispanic 31 47.7 0.7 40 44.9 0.9 22 43.2 0.5 27 52.9 0.6 33 55.9 0.7White 19 29.2 0.7 38 42.7 1.3 9 17.6 0.3 7 13.7 0.2 14 23.7 0.5Other 0 0.0 0.0 1 1.1 4.1 1 2.0 - 1 2.0 - 1 1.7 -Unknown 3 4.6 2 2.2 12 23.5 - 7 13.7 - 7 11.9 -SPA
1 3 4.6 0.8 3 3.4 0.8 3 5.9 0.8 2 3.9 0.5 2 3.4 0.52 20 30.8 0.9 9 10.1 0.4 11 21.7 0.5 10 19.6 0.5 20 33.9 0.93 7 10.8 0.4 25 28.1 1.4 10 19.6 0.6 7 13.7 0.4 9 15.2 0.54 5 7.7 0.4 10 11.2 0.8 7 13.7 0.6 4 7.8 0.3 4 6.8 0.35 1 1.5 0.2 0 0.0 0.0 0 0.0 - 2 3.9 0.3 1 1.7 0.26 6 9.2 0.6 3 3.4 0.3 7 13.7 0.7 13 25.5 1.2 4 6.8 0.47 6 9.2 0.4 16 18.0 1.2 9 17.6 0.7 5 9.8 0.4 8 13.5 0.68 13 20.0 1.2 9 10.1 0.8 2 3.9 0.2 4 7.8 0.4 5 8.5 0.4
Unknown 4 6.2 14 15.7 2 3.9 4 7.8 6 10.2
*Rates calculated based on less than 19 cases or events are considered unreliable.
Encephalitis Page 69
Acute Communicable Disease Control 2011 Annual Morbidity Report
Figure 1. Incidence Rates* of EncephalitisLAC, 2000-2011
0
0.25
0.5
0.75
1
1.25
1.5
2000 2001 2002 2003 2004 2005 2006 2007 2008 2009 2010 2011
Year
Cas
es p
er 1
00,0
00
*See text for limitations.
Figure 3. Incidence Rates of Encephalitis by SPALAC, 2011 (N=59)
0
0.25
0.5
0.75
1
1.25
1.5
1 2 3 4 5 6 7 8
SPA
Cas
es p
er 1
00,0
00
Figure 2. Percent Cases of Encephalitis by Race/EthnicityLAC, 2011 (N=59)
White24%
Black7%
Hispanic55%
Asian0%
Other*2%
Unknown12%
* Other includes Native American and any additional racial group that cannot be categorized as Asian, black, Hispanic, or white.
Figure 4. Reported Encephalitis Cases by Month of OnsetLAC, 2011 (N=59)
0
2
4
6
8
10
12
Jan Feb Mar Apr May Jun Jul Aug Sep Oct Nov Dec
Month
Num
ber o
f Cas
es
WNV Other Previous 5-year average

Encephalitis Page 70
Acute Communicable Disease Control 2011 Annual Morbidity Report
Figure 5. Reported Encephalitis Cases by Race/EthnicityLAC, 2006-2011
0
10
20
30
40
50
60
70
White Black Asian Hispanic
Race/Ethnicity
Num
ber o
f Cas
es
2006 2007 2008 20092010 2011

Catalina Island (HB)
Map �. EncephalitisRates by Health Distr�ct, Los Angeles County, 2011*
.0 5 102.5
Miles
AV
SF
WV
WE
EVFH
PO
*PSNE
CEHW
SWSESO
IW
TO
HB
SA
EL
AH
WH
EM
BFCN
*LB
GL
*Excludes Long Beach and Pasadena Data.
Health District Boundary
Service Planning Area (SPA)
Cases Per 100,000 Population
1.0 - 1.3
0.6 - 0.9
0.5
0.3 - 0.4
0.0 - 0.2
Encephalitis Page 71

Encephalitis Page 72
Acute Communicable Disease Control 2011 Annual Morbidity Report

EncephalitisPage 67
Acute Communicable Disease Control 2010 Annual Morbidity Report
ENCEPHALITIS
aCases per 100,000 population.
DESCRIPTION
Encephalitis, an inflammation of parts of the brain, spinal cord and meninges, causes headache, stiff neck, fever and altered mental status. It can result from infection with a number of different agents including viral, parasitic, fungal, rickettsial, and bacterial pathogens as well as chemical agents. Public health surveillance is limited to cases with suspected or confirmed viral etiology, which includes primary and post-infectious encephalitis but excludes individuals with underlying human immunodeficiency virus (HIV) infection. Of special concern are arthropod-borne viruses (i.e., arboviruses), which are maintained in nature through biological transmission between susceptible vertebrate hosts by blood feeding arthropods (mosquitoes, ticks, and certain mites and gnats). All arboviral encephalitides are zoonotic, being maintained in complex life cycles involving a nonhuman vertebrate primary host and a primary arthropod vector. Arboviral encephalitides have a global distribution. The five main viral agents of encephalitis in the United States are West Nile virus (WNV), eastern equine encephalitis (EEE) virus, western equine encephalitis (WEE) virus, St. Louis encephalitis (SLE) virus and La Crosse (LAC) virus, all of which are transmitted by mosquitoes and thus can be prevented by personal protection and mosquito control (see West Nile virus chapter).
Prevention measures for arboviral infections consist of personal protection, screens on windows, avoiding mosquito-infested areas, especially at dusk when most mosquitoes are active, wearing protective clothing and use of insect repellants containing DEET, oil of eucalyptus, and picaridin. Elimination of standing water and proper maintenance of ponds and swimming pools decrease the available sites for hatching and maturation of mosquito larvae. Five local mosquito abatement districts monitor and control populations of these insects, especially in areas used by the public.
2010 TRENDS AND HIGHLIGHTS
Encephalitis case reports originate from the California Encephalitis Project (http://ceip.us/encephalitis.htm) and acute care medical facilities through local confidential morbidity reporting system.
Fifty-one cases of encephalitis of probable viral etiology were reported in 2010, identical to the number of encephalitis cases reported in 2009 (Table). The decline in encephalitis cases since 2008 is most likely related to a decrease in all WNV-associated infections seen in both 2009 and 2010 compared to previous peak seasons in 2004 and 2008 (Figure 4). Forty-eight cases of WNV-associated encephalitis were reported in 2004 and 2008, both peak WNV infection seasons; WNV infection was first detected in LAC in 2003. WNV- associated encephalitis has decreased significantly since 2008 with 6 and 1 cases documented in 2008 and 2009, respectively.
Twenty- eight (55%) encephalitis cases were reported to LAC from the California Encephalitis Project. Despite a thorough work-up, twenty-seven (96%) cases had no definitive infectious disease etiology identified. One case had presumed underlying etiology of parainfluenza-1 virus infection.
The greatest incidence of encephalitis was in the 5-14 year old group (1.6 cases per 100,000) followed by those in the 1-4 and <1 year old group (0.7 cases per 100,000 population).
CRUDE DATA
Number of Cases 51 Annual Incidencea
LA County 0.52 California N/A United States N/A
Age at Diagnosis Mean 24 years Median 14 years Range 1 -82 years
2010 Annual Morbidity Report

EncephalitisPage 68
Acute Communicable Disease Control 2010 Annual Morbidity Report
Reported Encephalitis Cases and Rates* per 100,000 by Age Group, Race/Ethnicity, and SPA Los Angeles County, 2006-2010
2006 (N=46) 2007 (N=65) 2008 (N=89) 2009 (N=51) 2010 (N=51)
No. (%) Rate/ 100,000 No. (%) Rate/
100,000 No. (%) Rate/ 100,000 No. (%) Rate/
100,000 No. (%) Rate/ 100,000
Age Group
<1 2 4.3 1.4 3 4.6 2.0 4 4.5 2.9 0 0 - 1 2.0 0.7 1-4 8 17.4 1.4 6 9.2 1.0 8 9.0 1.4 4 7.8 0.7 4 7.8 0.7 5-14 8 17.4 0.5 13 20.0 0.9 14 15.7 1.0 17 33.4 1.2 21 41.2 1.6 15-34 15 32.6 0.5 15 23.1 0.5 4 4.5 0.1 10 19.6 0.4 11 21.6 0.4 35-44 3 6.5 0.2 2 3.1 0.1 1 1.1 0.1 2 3.9 0.1 1 2.0 0.1 45-54 4 8.7 0.3 6 9.2 0.5 11 12.4 0.8 7 13.7 0.5 4 7.8 0.3 55-64 1 2.2 0.1 7 10.8 0.8 14 15.7 1.5 2 3.9 0.2 6 11.8 0.6 65+ 5 10.9 0.5 10 15.4 1.0 33 37.1 3.2 8 15.7 0.8 3 5.9 0.3 Unknown 0 0.0 3 4.6 0 0.0 1 2.0 0 0 0.0
Race/Ethnicity Asian 4 8.7 0.3 7 10.8 0.5 3 3.4 0.2 5 9.8 0.4 6 11.8 0.4 Black 8 17.4 0.9 5 7.7 0.6 5 5.6 0.6 2 3.9 0.2 3 5.9 0.4 Hispanic 20 43.5 0.4 31 47.7 0.7 40 44.9 0.9 22 43.2 0.5 27 52.9 0.6 White 12 26.1 0.4 19 29.2 0.7 38 42.7 1.3 9 17.6 0.3 7 13.7 0.2 Other 1 2.2 3.5 0 0.0 0.0 1 1.1 4.1 1 2.0 - 1 2.0 - Unknown 1 2.2 3 4.6 2 2.2 12 23.5 - 7 13.7 -
SPA 1 5 10.9 1.4 3 4.6 0.8 3 3.4 0.8 3 5.9 0.8 2 3.9 0.5 2 8 17.4 0.4 20 30.8 0.9 9 10.1 0.4 11 21.7 0.5 10 19.6 0.5 3 12 26.1 0.7 7 10.8 0.4 25 28.1 1.4 10 19.6 0.6 7 13.7 0.4 4 3 6.5 0.2 5 7.7 0.4 10 11.2 0.8 7 13.7 0.6 4 7.8 0.3 5 1 2.2 0.2 1 1.5 0.2 0 0.0 0.0 0 0.0 - 2 3.9 0.3- 6 1 2.2 0.1 6 9.2 0.6 3 3.4 0.3 7 13.7 0.7 13 25.5 1.2 7 8 17.4 0.6 6 9.2 0.4 16 18.0 1.2 9 17.6 0.7 5 9.8 0.4 8 8 17.4 0.7 13 20.0 1.2 9 10.1 0.8 2 3.9 0.2 4 7.8 0.4
Unknown 0 0.0 4 6.2 14 15.7 2 3.9 4 7.8
*Rates calculated based on less than 19 cases or events are considered unreliable.
2010 Annual Morbidity Report

Encephalitis Page 69
Acute Communicable Disease Control 2010 Annual Morbidity Report
Figure 1. Incidence Rates* of EncephalitisLAC, 2000-2010 (N=51)
0
0.25
0.5
0.75
1
1.25
1.5
2000 2001 2002 2003 2004 2005 2006 2007 2008 2009 2010
Year
Cas
es p
er 1
00,0
00
*See text for limitations.
Figure 3. Incidence Rates of Encephalitis by SPALAC, 2010 (N=51)
0
0.25
0.5
0.75
1
1.25
1.5
1 2 3 4 5 6 7 8
SPA
Cas
es p
er 1
00,0
00
Figure 2. Percent Cases of Encephalitis by Race/EthnicityLAC, 2010 (N=51)
White39%
Black8%
Hispanic40%
Asian4%Other*
1%
Unknown8%
* Other includes Native American and any additional racial group that cannot be categorized as Asian, black, Hispanic, or white.
Figure 4. Reported Encephalitis Cases by Month of OnsetLAC, 2010 (N=51)
0
2
4
6
8
10
12
Jan Feb Mar Apr May Jun Jul Aug Sep Oct Nov Dec
Month
Num
ber o
f Cas
es
WNV Other Previous 5-year average
2010 Annual Morbidity Report

EncephalitisPage 70
Acute Communicable Disease Control 2010 Annual Morbidity Report
Figure 5. Reported Encephalitis Cases by Race/EthnicityLAC, 2005-2010
0
10
20
30
40
50
60
70
White Black Asian Hispanic
Race/Ethnicity
Num
ber o
f Cas
es
2005 2006 2007 20082009 2010
2010 Annual Morbidity Report

EncephalitisPage 55
Acute Communicable Disease Control2009 Annual Morbidity Report
ENCEPHALITIS
aCases per 100,000 population.
DESCRIPTION
Encephalitis, an inflammation of parts of the brain, spinal cord and meninges, causes headache, stiff neck, fever and altered mental status. It can result from infection with a number of different agents including viral, parasitic, fungal, rickettsial, and bacterial pathogens as well as chemical agents. Public health surveillance is limited to cases with suspected or confirmed viral etiology, which includes primary and post-infectious encephalitis but excludes individuals with underlying human immunodeficiency virus (HIV) infection. Of special concern is arboviral (mosquito-borne) encephalitis, which can be prevented by personal protection and mosquito control (See West Nile virus chapter). Arthropod-borne viruses (i.e.,arboviruses) are viruses that are maintained in nature through biological transmission between susceptible vertebrate hosts by blood feeding arthropods (mosquitoes, ticks, and certain mites and gnats). All arboviral encephalitides are zoonotic, being maintained in complex life cycles involving a nonhuman vertebrate primary host and a primary arthropod vector. Arboviral encephalitides have a global distribution. The five main viral agents of encephalitis in the United States are West Nile virus (WNV), eastern equine encephalitis (EEE) virus, western equine encephalitis (WEE) virus, St. Louis encephalitis (SLE) virus and La Crosse (LAC) virus, all of which are transmitted by mosquitoes.
Prevention measures for arboviral infections consist of personal protection, screens on windows, avoiding mosquito-infested areas, especially at dusk when most mosquitoes are active, wearing protective clothing and use of insect repellants containing DEET, oil of eucalyptus, and picaridin. Elimination of standing water and proper maintenance of ponds and swimming pools decrease the available sites for hatching and maturation of mosquito larvae. Five local mosquito abatement districts monitor and control populations of these insects, especially in areas used by the public.
2009 TRENDS AND HIGHLIGHTS
Encephalitis cases reports included: cases reported from the California Encephalitis Project (http://ceip.us/encephalitis.htm),those reported by acute care medical facilities through local confidential morbidity reporting system.Fifty-one cases of encephalitis of probable viral etiology were reported in 2009. This is a 43%decrease in 2009 encephalitis cases compared to 2008 when 89 cases were reported. The overall decrease in the number of encephalitis cases is most likely related to the decrease in all WNV-associated infections in 2009 compared to previous seasons from 2005 to 2008 (Figure4). In 2008, 45 cases of WNV –associated encephalitis were reported compared to only six cases in 2009.The most frequent underlying etiology for encephalitis cases was WNV infection accounting for six (12%) cases.Twenty-five (49%) encephalitis cases were reported to LAC from the California Encephalitis Project. Despite a thorough work-up, twenty-four (96%) cases had no definitive infectious disease etiologyidentified. Only one case had presumed underlying etiology of mycoplama infection. The greatest incidence of encephalitis was in the 5-14 year old group (1.2 cases per 100,000) followed by those 65 years and older (0.8 cases per 100,000 population).
CRUDE DATA
Number of Cases 51Annual Incidencea
LA County 0.52California N/AUnited States N/A
Age at DiagnosisMean 30 yearsMedian 15 yearsRange 1 -82 years
2009 Annual Morbidity Report

EncephalitisPage 56
Acute Communicable Disease Control2009 Annual Morbidity Report
Reported Encephalitis Cases and Rates* per 100,000 by Age Group, Race/Ethnicity, and SPALos Angeles County, 2005-2009
2005 (N=70) 2006 (N=46) 2007 (N=65) 2008 (N=89) 2009 (N=51)
No. (%) Rate/100,000 No. (%) Rate/
100,000 No. (%) Rate/100,000 No. (%) Rate/
100,000 No. (%) Rate/100,000
Age Group
<1 3 4.3 2.1 2 4.3 1.4 3 4.6 2.0 4 4.5 2.9 0 0 -1-4 6 8.6 1.0 8 17.4 1.4 6 9.2 1.0 8 9.0 1.4 4 7.8 0.75-14 19 27.1 1.3 8 17.4 0.5 13 20.0 0.9 14 15.7 1.0 17 33.4 1.215-34 11 15.7 0.4 15 32.6 0.5 15 23.1 0.5 4 4.5 0.1 10 19.6 0.435-44 7 10.0 0.5 3 6.5 0.2 2 3.1 0.1 1 1.1 0.1 2 3.9 0.145-54 7 10.0 0.6 4 8.7 0.3 6 9.2 0.5 11 12.4 0.8 7 13.7 0.555-64 1 1.4 0.1 1 2.2 0.1 7 10.8 0.8 14 15.7 1.5 2 3.9 0.265+ 15 21.4 1.6 5 10.9 0.5 10 15.4 1.0 33 37.1 3.2 8 15.7 0.8Unknown 1 1.4 0 0.0 3 4.6 0 0.0 1 2.0 0
Race/Ethnicity
Asian 11 15.7 0.9 4 8.7 0.3 7 10.8 0.5 3 3.4 0.2 5 9.8 0.4Black 5 7.1 0.6 8 17.4 0.9 5 7.7 0.6 5 5.6 0.6 2 3.9 0.2Hispanic 32 45.7 0.7 20 43.5 0.4 31 47.7 0.7 40 44.9 0.9 22 43.2 0.5White 22 31.4 0.8 12 26.1 0.4 19 29.2 0.7 38 42.7 1.3 9 17.6 0.3Other 0 0.0 0.0 1 2.2 3.5 0 0.0 0.0 1 1.1 4.1 1 2.0 -Unknown 0 0.0 1 2.2 3 4.6 2 2.2 12 23.5 -
SPA
1 3 4.3 0.9 5 10.9 1.4 3 4.6 0.8 3 3.4 0.8 3 5.9 0.82 21 30.0 1.0 8 17.4 0.4 20 30.8 0.9 9 10.1 0.4 11 21.7 0.53 6 8.6 0.4 12 26.1 0.7 7 10.8 0.4 25 28.1 1.4 10 19.6 0.64 6 8.6 0.5 3 6.5 0.2 5 7.7 0.4 10 11.2 0.8 7 13.7 0.65 2 2.9 0.3 1 2.2 0.2 1 1.5 0.2 0 0.0 0.0 0 0.0 -6 3 4.3 0.3 1 2.2 0.1 6 9.2 0.6 3 3.4 0.3 7 13.7 0.77 12 17.1 0.9 8 17.4 0.6 6 9.2 0.4 16 18.0 1.2 9 17.6 0.78 13 18.6 1.2 8 17.4 0.7 13 20.0 1.2 9 10.1 0.8 2 3.9 0.2
Unknown 4 5.7 0 0.0 4 6.2 14 15.7 2 3.9
*Rates calculated based on less than 19 cases or events are considered unreliable.
2009 Annual Morbidity Report

EncephalitisPage 57
Acute Communicable Disease Control2009 Annual Morbidity Report
Figure 1. Incidence Rates* of EncephalitisLAC, 1999-2009 (N=51)
0
0.25
0.5
0.75
1
1.25
1.5
1999 2000 2001 2002 2003 2004 2005 2006 2007 2008 2009
Year
Cas
es p
er 1
00,0
00
*See text for limitations.
Figure 3. Incidence Rates of Encephalitis by SPALAC, 2009 (N=51)
0
0.25
0.5
0.75
1
1.25
1.5
1 2 3 4 5 6 7 8
SPA
Cas
es p
er 1
00,0
00
Figure 2. Percent Cases of Encephalitis by Race/EthnicityLAC, 2009 (N=51)
White18%
Black4%
Hispanic42%
Asian10%
Other*2%
Unknown24%
* Other includes Native American and any additional racial group that cannot be categorized as Asian, black, Hispanic, or white.
Figure 4. Reported Encephalitis Cases by Month of OnsetLAC, 2009 (N=51)
0
5
10
15
20
25
30
Jan Feb Mar Apr May Jun Jul Aug Sep Oct Nov Dec
Month
Num
ber o
f Cas
es
WNV Other Previous 5-year average
2009 Annual Morbidity Report

EncephalitisPage 58
Acute Communicable Disease Control2009 Annual Morbidity Report
Figure 5. Reported Encephalitis Cases by Race/EthnicityLAC, 2004-2009
0
10
20
30
40
50
60
70
White Black Asian Hispanic
Race/Ethnicity
Num
ber o
f Cas
es
2004 2005 2006 20072008 2009
2009 Annual Morbidity Report

Catalina Island (HB)
Map 4. EncephalitisRates by Health District, Los Angeles County, 2009*
.0 5 102.5
Miles
AV
SF
WV
WE
EVFH
PO
*PSNE
CEHW
SWSESO
IW
TO
HB
SA
EL
AH
WH
EM
BFCN
*LB
GL
*Excludes Long Beach and Pasadena Data.
Health District Boundary
Service Planning Area (SPA)
Cases Per 100,000 Population
1.3 - 1.7
1.0 - 1.2
0.5 - 0.9
0.1 - 0.4
0.0
Encephalitis Page 59

Acute Communicable Disease Control 2008 Annual Morbidity Report
ENCEPHALITIS
aCases per 100,000 population.
DESCRIPTION
Encephalitis, an inflammation of parts of the brain, spinal cord and meninges, causes headache, stiff neck, fever and altered mental status. It can result from infection with a number of different agents including viral, parasitic, fungal, rickettsial, and bacterial pathogens as well as chemical agents. Public health surveillance is limited to cases with suspected or confirmed viral etiology, which includes primary and post-infectious encephalitis but excludes individuals with underlying human immunodeficiency virus (HIV) infection. Of special concern is arboviral (mosquito-borne) encephalitis, which can be prevented by personal protection and mosquito control (See West Nile virus chapter). Arthropod-borne viruses (i.e., arboviruses) are viruses that are maintained in nature through biological transmission between susceptible vertebrate hosts by blood feeding arthropods (mosquitoes, ticks, and certain mites and gnats). All arboviral encephalitides are zoonotic, being maintained in involving a nonhuman vertebrate primary host and a primary arthropod vector. Arboviral encephalitides have a global distribution. The five main viral agents of encephalitis in the United States are West Nile virus (WNV), eastern equine encephalitis (EEE) virus, western equine encephalitis (WEE) virus, St. Louis encephalitis (SLE) virus and La Crosse (LAC) virus, all of which are transmitted by mosquitoes.
complex life cycles
Prevention measures for arboviral infections consist of personal protection, screens on windows, avoiding mosquito-infested areas, especially at dusk when most mosquitoes are active, wearing protective clothing and use of insect repellants containing DEET, oil of eucalyptus, and picaridin. Elimination of standing water and proper maintenance of ponds and swimming pools decrease the available sites for hatching and maturation of mosquito larvae. Five local mosquito abatement districts monitor and control populations of these insects, especially in areas used by the public.
2008 TRENDS AND HIGHLIGHTS
Encephalitis cases were reported from the California Encephalitis Project (http://ceip.us/encephalitis.htm) and the local confidential morbidity reporting system, and include WNV- associated encephalitis.
Eighty- nine cases of encephalitis of probable viral etiology were reported in 2008. This is a 27% increase in 2008 encephalitis cases compared to 2007 when 65 cases were reported. The increase in overall related encephalitis cases is most likely related to the increase in WNV-associated infections in 2008 compared to previous seasons from 2005 to 2007.
The most frequent underlying etiology for encephalitis cases was WNV accounting for 48 (54%) cases followed by herpes simplex virus (HSV) 1 with 6 (7%) of cases.
Twenty-one (24%) encephalitis cases were reported to Los Angeles County from the California Encephalitis Project. Despite a thorough work-up, 18 (86%) cases had no definitive infectious disease etiology. Only three cases had presumed underlying etiologies (one case with HSV 6 infection and two cases with mycoplama infection).
The majority of encephalitis cases were reported from July to October, 66 (77%) cases, most likely due to circulating WNV infection.
The greatest incidence of encephalitis was in the <1 year old group (2.9 cases per 100,000) followed by those 65 years and older (3.2 cases per 100,000 population).
CRUDE DATA
Number of Cases 89Annual Incidencea
LA County 0.91California N/AUnited States N/A
Age at Diagnosis Mean 46 yearsMedian 58 yearsRange 6 months-85 years
EncephalitisPage 51
2008 Annual Morbidity Report

Encephalitis
Acute Communicable Disease Control 2008 Annual Morbidity Report
Reported Encephalitis Cases and Rates* per 100,000 by Age Group, Race/Ethnicity, and SPA Los Angeles County, 2004-2008
2004 (N=133) 2005 (N=70) 2006 (N=46) 2007 (N=65) 2008 (N=89)
No. (%) Rate/ 100,000 No. (%) Rate/
100,000 No. (%) Rate/ 100,000 No. (%) Rate/
100,000 No. (%) Rate/ 100,000
Age Group
<1 4 3.0 2.8 3 4.3 2.1 2 4.3 1.4 3 4.6 2.0 4 4.5 2.91-4 6 4.5 1.0 6 8.6 1.0 8 17.4 1.4 6 9.2 1.0 8 9.0 1.45-14 18 13.5 1.2 19 27.1 1.3 8 17.4 0.5 13 20.0 0.9 14 15.7 1.015-34 17 12.8 0.6 11 15.7 0.4 15 32.6 0.5 15 23.1 0.5 4 4.5 0.135-44 12 9.0 0.8 7 10.0 0.5 3 6.5 0.2 2 3.1 0.1 1 1.1 0.145-54 9 6.8 0.7 7 10.0 0.6 4 8.7 0.3 6 9.2 0.5 11 12.4 0.855-64 16 12.0 2.0 1 1.4 0.1 1 2.2 0.1 7 10.8 0.8 14 15.7 1.565+ 47 35.3 5.0 15 21.4 1.6 5 10.9 0.5 10 15.4 1.0 33 37.1 3.2Unknown 4 3.0 1 1.4 0 0.0 3 4.6 0 0.0
Race/Ethnicity
Asian 9 6.8 0.7 11 15.7 0.9 4 8.7 0.3 7 10.8 0.5 3 3.4 0.2Black 8 6.0 0.9 5 7.1 0.6 8 17.4 0.9 5 7.7 0.6 5 5.6 0.6Hispanic 45 33.8 1.0 32 45.7 0.7 20 43.5 0.4 31 47.7 0.7 40 44.9 0.9White 63 47.4 2.2 22 31.4 0.8 12 26.1 0.4 19 29.2 0.7 38 42.7 1.3Other 2 1.5 7.2 0 0.0 0.0 1 2.2 3.5 0 0.0 0.0 1 1.1 4.1Unknown 6 4.5 0 0.0 1 2.2 3 4.6 2 2.2
SPA
1 5 3.8 1.5 3 4.3 0.9 5 10.9 1.4 3 4.6 0.8 3 3.4 0.82 33 24.8 1.6 21 30.0 1.0 8 17.4 0.4 20 30.8 0.9 9 10.1 0.43 35 26.3 2.1 6 8.6 0.4 12 26.1 0.7 7 10.8 0.4 25 28.1 1.44 7 5.3 0.6 6 8.6 0.5 3 6.5 0.2 5 7.7 0.4 10 11.2 0.85 2 1.5 0.3 2 2.9 0.3 1 2.2 0.2 1 1.5 0.2 0 0.0 0.06 10 7.5 1.0 3 4.3 0.3 1 2.2 0.1 6 9.2 0.6 3 3.4 0.37 18 13.5 1.3 12 17.1 0.9 8 17.4 0.6 6 9.2 0.4 16 18.0 1.28 11 8.3 1.0 13 18.6 1.2 8 17.4 0.7 13 20.0 1.2 9 10.1 0.8Unknown 12 9.0 4 5.7 0 0.0 4 6.2 14 15.7
*Rates calculated based on less than 19 cases or events are considered unreliable.
Page 52
2008 Annual Morbidity Report

Encephalitis
Acute Communicable Disease Control 2008 Annual Morbidity Report
Figure 1. Incidence Rates* of EncephalitisLAC, 1999-2008
0
0.25
0.5
0.75
1
1.25
1.5
1999 2000 2001 2002 2003 2004 2005 2006 2007 2008
Year
Cas
es p
er 1
00,0
00
*See text for limitations.
Figure 3. Incidence Rates of Encephalitis by SPALAC, 2008
0
0.25
0.5
0.75
1
1.25
1.5
1 2 3 4 5 6 7 8
SPA
Cas
es p
er 1
00,0
00
Figure 2. Percent Cases of Encephalitis by Race/EthnicityLAC, 2008
White43%
Black6%
Hispanic45%
Asian3%Other*
1%
Unknown2%
* Other includes Native American and any additional racial group that cannot be categorized as Asian, black, Hispanic, or white.
Figure 4. Reported Encephalitis Cases by Month of OnsetLAC, 2008
0
5
10
15
20
25
30
Jan Feb Mar Apr May Jun Jul Aug Sep Oct Nov D
Month
Num
ber o
f Cas
es
ec
WNV Other Previous 5-year average
Page 53
2008 Annual Morbidity Report

Acute Communicable Disease Control 2008 Annual Morbidity Report
Figure 5. Reported Encephalitis Cases by Race/EthnicityLAC, 2004-2008
0
10
20
30
40
50
60
70
White Black Asian Hispanic
Race/Ethnicity
Num
ber o
f Cas
es
2004 2005 2006 2007 2008
EncephalitisPage 54
2008 Annual Morbidity Report

EncephalititsPage 55

Acute Communicable Disease Control2007 Annual Morbidity Report
Encephalitispage 47
ENCEPHALITIS
Figure 2 Encephalitis by Etiology
LAC, 2007 (N=65)
Unknown 65%
WNV 18%
HSV 6%
Enterovirus 6%
Adenovirus 2%
VZV 2%
EBV 2%
a Excludes AIDS encephalopathy cases.
b Cases per 100,000 population.
DESCRIPTION Encephalitis, an inflammation of parts of the brain, spinal cord, and meninges, causes headache, stiff neck, fever, and altered mental status. It can result from infection with a number of different agents including viral, parasitic, fungal, rickettsial, bacterial and chemical. Public health surveillance is limited to cases of suspected or confirmed viral etiology, which includes primary and post-infectious encephalitis—but excludes individuals with underlying human immunodeficiency virus (HIV) infection. Of special concern is arboviral (mosquito-borne) encephalitis, which can be prevented by personal protection and mosquito control (See West Nile virus chapter of this report). Arthropod-borne viruses (i.e., arboviruses) are viruses that are maintained in nature through biological transmission between susceptible vertebrate hosts by blood-feeding arthropods (mosquitoes, ticks, and certain mites and gnats). All arboviral encephalitides are zoonotic, being maintained in complex life cycles involving a nonhuman vertebrate primary host and a primary arthropod vector. Arboviral encephalitides have a global distribution. There are five main viral agents of encephalitis in the US: West Nile virus (WNV), eastern equine encephalitis (EEE) virus, western equine encephalitis (WEE) virus, St. Louis encephalitis (SLE) virus, and La Crosse virus, all of which are transmitted by mosquitoes. DISEASE ABSTRACT In 2007, 65 viral encephalitis cases were reported. The
incidence of viral encephalitis increased from 0.48 cases per 100,000 population in 2006 to 0.67 cases per 100,000 population in 2007 (Figure 1).
The number of reported encephalitis cases increased by 41% compared to 2006 when 46 cases were reported.
One death was reported. The majority of encephalitis cases occurred in children
<15 years old (n=22, 36%). Hispanics had the greatest number of encephalitis
cases (n=31, 50%), followed by whites (n=19, 31%), Asians (n=7, 11%), and blacks (n=5, 8%).
The number of reported encephalitis cases was highest in SPA 2 (n=20, 0.9 per 100,000), followed by
CRUDE DATA
Number of Casesa 65 Annual Incidenceb LA County 0.67 California N/A United States N/A Age at Onset Mean 32.5 Median 21 Range 0–94 years
Figure 1Encephalitis
Incidence Rates by Year of OnsetLAC 1994–2007
0
0.2
0.4
0.6
0.8
1
1.2
1.4
1.6
1994 1996 1998 2000 2002 2004 2006
Year
Cas
es p
er 1
00,0
00
2007 Annual Morbidity Report

Acute Communicable Disease Control2007 Annual Morbidity Report
Encephalitispage 48
SPAs 6 and 7 (n=6 each, 0.6 and 0.4 per 100,000, respectively). The annual incidence of acute encephalitis reported in the medical literature varies from 3.5-7.4 cases per 100,000 population. In 2007, the overall Los Angeles County (LAC) viral encephalitis incidence rate of 0.67 per 100,000 population increased from the 2006 incidence rate. The case fatality from encephalitis has ranged from a high of 38% in 1997 to a low of 0% in 2006. This year’s case fatality was at 2%. Of particular public health concern in LAC are the arthropod-borne viral (arboviral) encephalitides (endemic to California (CA)), SLE, WEE, and WNV encephalitis. Since 1985, sporadic cases of SLE have been reported following an outbreak of 16 cases in 1984. The last confirmed SLE case in LAC was in 1997. Ongoing identification of SLE virus in sentinel chicken populations indicate that the virus remains endemic in LAC. Beginning in 2001, arboviral disease surveillance has included WNV, in addition to SLE and WEE. In 2007, 12 cases of WNV-assoicated encephalitis were confirmed. In 2007, more WNV-associated encephalitis cases were seen compared to 2006 when 5 were documented. Like SLE virus, WNV is transmitted principally by Culex species mosquitoes. PREVENTION Prevention measures for arboviral infections consist of personal protection, screens on windows, avoiding mosquito-infested areas, especially at dusk when most mosquitoes are active, wearing protective clothing and use of insect repellants containing DEET, oil of eucalyptus, and picaridin. Elimination of standing water and proper maintenance of ponds and swimming pools decrease the available sites for hatching and maturation of mosquito larvae. Five local mosquito abatement districts monitor and control populations of these insects, especially in areas used by the public (See WNV section). COMMENTS Surveillance for WNV infection in humans, mosquitoes, sentinel chickens, and dead birds will continue throughout CA and LAC. Research is underway to develop a WNV vaccine and treatment for humans. No human vaccine is available for SLE, WEE, and WNV. A human vaccine exists for Japanese encephalitis. Licensed equine (horse) vaccines are available for WEE, EEE, and WN viruses. ADDITIONAL RESOURCES Chaudhuri, A. & Kennedy, P.G. (2002). Diagnosis and treatment of viral encephalitis. Postgraduate
Medical Journal, 78(924), 575-583. Glaser, C.A., Gilliam, S., Schnurr, D., Forghani, B., Honarmand, S., Khetsuriani, N., et al. (2003). In
search of encephalitis etiologies: diagnostic challenges in the California Encephalitis Project, 1998–2000. Clinical Infectious Diseases, 36(6), 731-742.
Trevejo, R.T. (2004). Acute encephalitis hospitalizations, California, 1990-1999: unrecognized arboviral
encephalitis? Emerging Infectious Diseases, 10(8), 1442-1449. For information on mosquito-borne encephalitis: http://www.cdc.gov/ncidod/dvbid/arbor/index.htm For information for consumers: http://www.nlm.nih.gov/medlineplus/encephalitis.html Information about case investigation of encephalitis in LAC is available at: http://www.lapublichealth.org/acd/procs/b73/b73index.htm
2007 Annual Morbidity Report

Acute Communicable Disease Control2007 Annual Morbidity Report
Encephalitispage 49
2007 Annual Morbidity Report

ENCEPHALITIS
aExcludes AIDS encephalopathy cases.
b Cases per 100,000 population.
DESCRIPTION
Encephalitis, an inflammation of parts of the brain, spinal cord and meninges, causes headache, stiff neck, fever and altered mental status. It can result from infection with a number of different agents including viral, parasitic, fungal, rickettsial, bacterial and chemical. Public health surveillance is limited to cases of suspected or confirmed viral etiology, which includes primary and post-infectious encephalitis—but excludes individuals with underlying human immunodeficiency virus (HIV) infection. Of special concern is arboviral (mosquito-borne) encephalitis, which can be prevented by personal protection and mosquito control (See West Nile virus section). Arthropod-borne viruses (i.e., arboviruses) are viruses that are maintained in nature through biological transmission between susceptible vertebrate hosts by blood feeding arthropods (mosquitoes, ticks, and certain mites and gnats). All arboviral encephalitides are zoonotic, being maintained in complex life cycles involving a nonhuman vertebrate primary host and a primary arthropod vector. Arboviral encephalitides have a global distribution. There are five main viral agents of encephalitis in the United States: West Nile virus (WNV), eastern equine encephalitis (EEE) virus, western equine encephalitis (WEE) virus, St. Louis encephalitis (SLE) virus and La Crosse (LAC) virus, all of which are transmitted by mosquitoes.
DISEASE ABSTRACT
In 2006, 46 viral encephalitis cases were reported. The incidence of viral encephalitis decreased from 0.59 cases per 100,000 population in 2005 to 0.48 cases per 100,000 population in 2006 (Figure 1). The number of reported encephalitis cases declined in 2006 by 22% compared to 2005 when 56 cases were reported. The underlying etiologies of encephalitis were identified in only 11 (24%) cases and included: 1 WNV (see WNV Report for details), 8 herpes simplex virus (HSV), 1 influenza, and 1 enterovirus (Figure 2). No deaths were reported.
The majority of encephalitis cases occurred in children <15 years old (n=18, 39%), followed by adolescents and young adults ages 15-34 years (n=15, 33%);
CRUDE DATA
Number of Casesa 46Annual Incidenceb
LA County 0.48 California N/A United States N/A Age at Onset Mean 25.1 Median 15.5 Range 0–80 years 0
0.2
1
1.21.4
1.61.8
Year
1994 1996 1998 2000 2002 2004 2006
Cas
es p
er 1
00,0
00
0.8
0.60.4
Figure 1 Encephalitis
Incidence Rates by Year of Onset
LAC 1994-2006
Enterovirus 2%
Influenza 2%
Unknown83%
Figure 2 Encephalitis by Etiology
LAC, 2006 (N=46)
Acute Communicable Disease Control Program 2006 Annual Morbidity Report
Disease Summariespage 47
2006 Annual Morbidity Report

adults between 35-64 years (n=8, 17%), and those more than 65 years (n=4, 9%). Latinos had the greatest number of encephalitis cases (n=20, 45%), followed by whites (n=11, 25%),
blacks (n=8, 18%), and Asians (n=4, 9%). The number of reported encephalitis cases was highest in SPA 3 (n=12, 0.7 per 100,000), followed by SPAs 7 and 8 (n=8 each, 0.8 and 0.9 per 100,000, respectively), and SPA 2 (n=7, 0.3 per 100,000).
The annual incidence of acute encephalitis reported in the medical literature varies from 3.5–7.4 cases per 100,000 person-years. In 2006, the overall LAC viral encephalitis rate of 0.48 per 100,000 person-years was slightly lower than the 2005 incidence rate (.59 cases per 100,000) and rates quoted in surveillance literature. Rationale for the lower rate may be far fewer cases of WNV-associated encephalitis reported in 2006 compared to 2005; misclassification of encephalitis cases as meningitis; and underreporting of hospitalized encephalitis cases, since all reporting is passive. The case fatality from encephalitis has ranged from a high of 38% in 1997 to a low of 0% in 2006 and remains lower than the 2005 overall state case fatality rate of 12% reported by the California Encephalitis Project. The higher encephalitis mortality rate reported by the California Encephalitis Project, a California Department of Health Services’ research project, may be biased as more severely ill individuals are more likely to be included in this data source. Further, cases are often reported before the final outcome of the patient is known and so the LAC record of mortality may be incomplete.
Of particular public health concern in LAC are the arthropod-borne viral (arboviral) encephalitides, SLE, WEE and WNV encephalitis, endemic to California. Since 1985, sporadic cases of SLE have been reported each year following an outbreak of 16 cases in 1984. The last confirmed SLE case in LAC was in 1997. The potential for another SLE outbreak exists, as sporadic cases in previous years and identification of SLE virus in sentinel chicken populations indicate that the virus remains endemic in LAC. Beginning in 2001, arboviral disease surveillance has included WNV, in addition to SLE and WEE.
In 2006, only 1 of 16 (6%) documented WNV infections had a clinical history compatible with encephalitis. This case was laboratory-confirmed WNV and thought to be locally acquired. In 2006, far fewer WNV associated encephalitis cases were seen compared to 2005 and 2004 when 13 and 48 cases were noted in respective years. This is consistent with overall surveillance data showing a continued decline in WNV infections over the past three years. Like SLE virus, WNV is transmitted principally by Culex species mosquitoes. Enhanced surveillance for early detection of virus activity in birds and mosquitoes will be crucial to guide control measures in 2006.
Prevention measures for arboviral infections consist of personal protection, screens on windows, avoiding mosquito-infested areas, especially at dusk when most mosquitoes are active, wearing protective clothing and use of insect repellants containing DEET, oil of eucalyptus and Picaridin. Elimination of standing water and proper maintenance of ponds and swimming pools decrease the available sites for hatching and maturation of mosquito larvae. Five local mosquito abatement districts monitor and control populations of these insects, especially in areas used by the public (See WNV section).
Future Directions: Surveillance for WNV infection in humans, mosquitoes, sentinel chickens, and dead birds will continue throughout the state of CA. and LAC. Research is underway to develop a WNV vaccine and treatment for humans. No human vaccine is available for SLE, WEE, and WNV. A human vaccine exists for Japanese Encephalitis.
Licensed equine (horse) vaccines are available for WEE, EEE, and WN viruses.
ADDITIONAL RESOURCES
Glaser CA, Gilliam S, Schnurr D, et al. In search of encephalitis etiologies: diagnostic challenges in the California Encephalitis Project, 1998–2000. Clin Infect Dis 2003; 36(6):731–742.
Khetsuriani N, Holman RC, Anderson LJ. Burden of encephalitis-associated hospitalizations in the United States, 1988–1997. Clin Infect Dis 2002; 35(2):175–182.
Acute Communicable Disease Control Program 2006 Annual Morbidity Report
Disease Summariespage 48
2006 Annual Morbidity Report

Johnston RT. Acute Encephalitis. Clin Infect Dis 1996; 23:219–226.
Nicolosi A, Hauser WA, Beghi E, Kurland LT. Epidemiology of central nervous system infections in Olmsted County, Minnesota, 1950–1981. J Infect Dis 1986; 154(3):399–498.
Trevejo RT. Acute encephalitis hospitalizations, California, 1990-1999: unrecognized arboviral encephalitis? Emerg Infect Dis 2004; 10(8):1442-1449.
For information on mosquito-borne encephalitis: www.cdc.gov/ncidod/dvbid/arbor/index.htm.
For information for consumers: www.nlm.nih.gov/medlineplus/encephalitis.html
For more detailed information such as causal information and effective management strategies: www.postgradmed.com/issues/1998/03_98/guti.htm
Information about case investigation of encephalitis in LAC is available at: www.lapublichealth.org/acd/procs/b73/b73index.htm
Acute Communicable Disease Control Program 2006 Annual Morbidity Report
Disease Summariespage 49
2006 Annual Morbidity Report

Acute Communicable Disease Control 2005 Annual Morbidity Report
ENCEPHALITIS
Figure 2. Encephalitis by Etiology
LAC, 2005 (N=36)
Unknown64%
WNV23%HSV
7%
JEV2%
Mycoplasma 4%
a Cases per 100,000 population 2005 LAC Census estimates.
bExcludes AIDS encephalopathy cases.
DESCRIPTION
Encephalitis, an inflammation of parts of the brain, spinal cord and meninges, causes headache, stiff neck, fever and altered mental status. It can result from infection with a number of different agents including viral, parasitic, fungal, rickettsial, bacterial and chemical. Public health surveillance is limited to cases of suspected or confirmed viral etiology, which includes primary and post-infectious encephalitis—but excludes individuals with underlying Human Immunodeficiency Virus (HIV) infection. Of special concern is arboviral (mosquito-borne) encephalitis, which can be prevented by personal protection and mosquito control (See WNV section). Arthropod-borne viruses, i.e., arboviruses, are viruses that are maintained in nature through biological transmission between susceptible vertebrate hosts by blood feeding arthropods (mosquitoes, ticks, and certain mites and gnats). All arboviral encephalitides are zoonotic, being maintained in complex life cycles involving a nonhuman vertebrate primary host and a primary arthropod vector. Arboviral encephalitides have a global distribution. There are five main viral agents of encephalitis in the United States: West Nile virus (WNV), eastern equine encephalitis (EEE), western equine encephalitis (WEE), St. Louis encephalitis (SLE) and La Crosse (LAC) encephalitis, all of which are transmitted by mosquitoes.
CRUDE DATA Figure 1Encephalitis
Incidence Rates by Year of OnsetLAC 1994–2005
0
0.2
0.4
0.6
0.8
1
1.2
1.4
1.6
1.8
1994
1995
1996
1997
1998
1999
2000
2001
2002
2003
2004
2005
Year
Cas
es p
er 1
00,0
00
Number of Cases 56
Annual Incidencea,b
LA County 0.59
California N/AUnited States N/A
Age at Diagnosis
Mean 25
Median 15
Range 0-93 yearsCase Fatality
LA County b 9%
United States N/A
Disease Summaries page 47
2005 Annual Morbidity Report
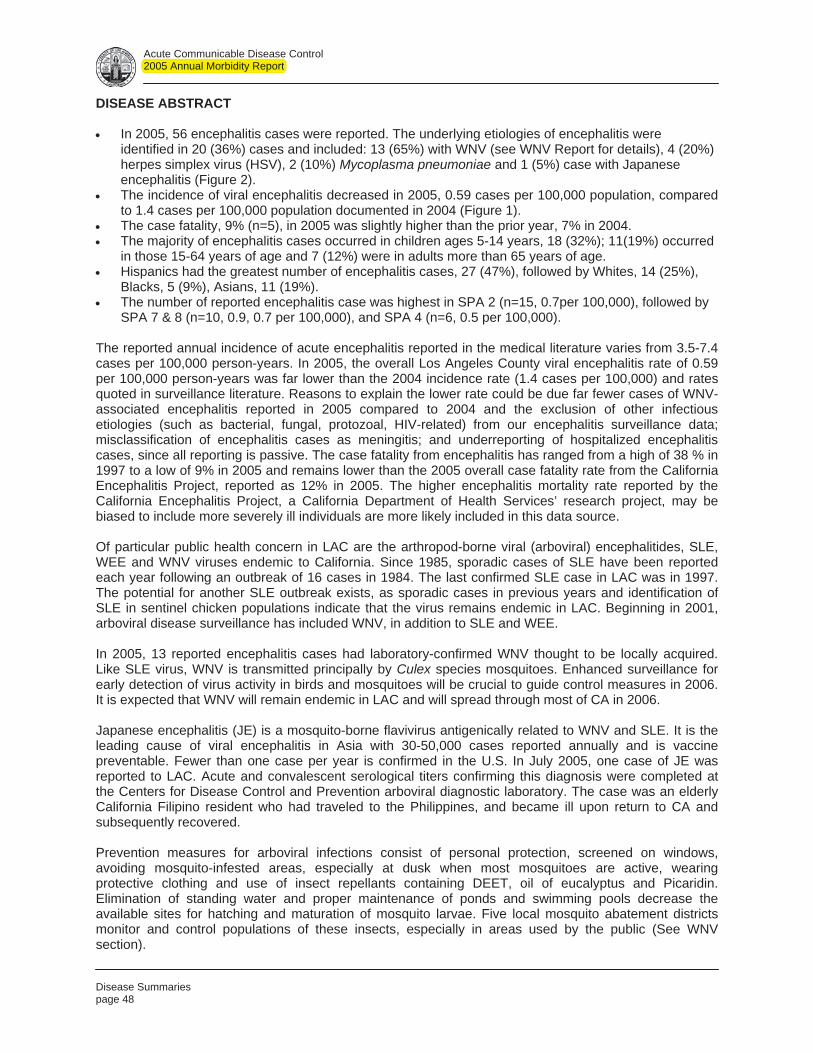
Acute Communicable Disease Control 2005 Annual Morbidity Report
DISEASE ABSTRACT
In 2005, 56 encephalitis cases were reported. The underlying etiologies of encephalitis were identified in 20 (36%) cases and included: 13 (65%) with WNV (see WNV Report for details), 4 (20%) herpes simplex virus (HSV), 2 (10%) Mycoplasma pneumoniae and 1 (5%) case with Japanese encephalitis (Figure 2). The incidence of viral encephalitis decreased in 2005, 0.59 cases per 100,000 population, compared to 1.4 cases per 100,000 population documented in 2004 (Figure 1). The case fatality, 9% (n=5), in 2005 was slightly higher than the prior year, 7% in 2004. The majority of encephalitis cases occurred in children ages 5-14 years, 18 (32%); 11(19%) occurred in those 15-64 years of age and 7 (12%) were in adults more than 65 years of age. Hispanics had the greatest number of encephalitis cases, 27 (47%), followed by Whites, 14 (25%), Blacks, 5 (9%), Asians, 11 (19%). The number of reported encephalitis case was highest in SPA 2 (n=15, 0.7per 100,000), followed by SPA 7 & 8 (n=10, 0.9, 0.7 per 100,000), and SPA 4 (n=6, 0.5 per 100,000).
The reported annual incidence of acute encephalitis reported in the medical literature varies from 3.5-7.4 cases per 100,000 person-years. In 2005, the overall Los Angeles County viral encephalitis rate of 0.59 per 100,000 person-years was far lower than the 2004 incidence rate (1.4 cases per 100,000) and rates quoted in surveillance literature. Reasons to explain the lower rate could be due far fewer cases of WNV-associated encephalitis reported in 2005 compared to 2004 and the exclusion of other infectious etiologies (such as bacterial, fungal, protozoal, HIV-related) from our encephalitis surveillance data; misclassification of encephalitis cases as meningitis; and underreporting of hospitalized encephalitis cases, since all reporting is passive. The case fatality from encephalitis has ranged from a high of 38 % in 1997 to a low of 9% in 2005 and remains lower than the 2005 overall case fatality rate from the California Encephalitis Project, reported as 12% in 2005. The higher encephalitis mortality rate reported by the California Encephalitis Project, a California Department of Health Services’ research project, may be biased to include more severely ill individuals are more likely included in this data source.
Of particular public health concern in LAC are the arthropod-borne viral (arboviral) encephalitides, SLE, WEE and WNV viruses endemic to California. Since 1985, sporadic cases of SLE have been reported each year following an outbreak of 16 cases in 1984. The last confirmed SLE case in LAC was in 1997. The potential for another SLE outbreak exists, as sporadic cases in previous years and identification of SLE in sentinel chicken populations indicate that the virus remains endemic in LAC. Beginning in 2001, arboviral disease surveillance has included WNV, in addition to SLE and WEE.
In 2005, 13 reported encephalitis cases had laboratory-confirmed WNV thought to be locally acquired. Like SLE virus, WNV is transmitted principally by Culex species mosquitoes. Enhanced surveillance for early detection of virus activity in birds and mosquitoes will be crucial to guide control measures in 2006. It is expected that WNV will remain endemic in LAC and will spread through most of CA in 2006.
Japanese encephalitis (JE) is a mosquito-borne flavivirus antigenically related to WNV and SLE. It is the leading cause of viral encephalitis in Asia with 30-50,000 cases reported annually and is vaccine preventable. Fewer than one case per year is confirmed in the U.S. In July 2005, one case of JE was reported to LAC. Acute and convalescent serological titers confirming this diagnosis were completed at the Centers for Disease Control and Prevention arboviral diagnostic laboratory. The case was an elderly California Filipino resident who had traveled to the Philippines, and became ill upon return to CA and subsequently recovered.
Prevention measures for arboviral infections consist of personal protection, screened on windows, avoiding mosquito-infested areas, especially at dusk when most mosquitoes are active, wearing protective clothing and use of insect repellants containing DEET, oil of eucalyptus and Picaridin. Elimination of standing water and proper maintenance of ponds and swimming pools decrease the available sites for hatching and maturation of mosquito larvae. Five local mosquito abatement districts monitor and control populations of these insects, especially in areas used by the public (See WNV section).
Disease Summaries page 48
2005 Annual Morbidity Report

Acute Communicable Disease Control 2005 Annual Morbidity Report
Disease Summaries
page 49
Future Directions: Surveillance for WNV infection in humans, mosquitoes, sentinel chickens, and dead birds will continue throughout the state of CA. and LAC. Research is underway to develop a WNV vaccine and treatment for humans. No human vaccine is available for SLE, WEE, and WNV. A human vaccine exists for JE. Licensed equine (horse) vaccines are available for WEE, EEE, and WN viruses. ADDITIONAL RESOURCES Glaser CA, Gilliam S, Schnurr D, Bagher F, Honarmand S, et al. In search of encephalitis etiologies: Diagnostic challenges in the California Encephalitis Project, 1998–2000. CID 2003; 36:731–42. Khetsuriani H, Holman RC, Anderson LJ. Burden of encephalitis-associated hospitalizations in the United States, 1988–1997. CID 2002; 25:175–82. Johnston RT. Acute Encephalitis. CID 1996; 23:219–26. Nicolosi A, Hauser WA, Beghi E, Kurland LT. Epidemiology of central nervous system infections in Olmsted County, Minnesota, 1950–1981. J Inf Ds 1986; 154:399–498. Trevejo RT. Acute Encephalitis Hospitalizations, California, 1990-1999: Unrecognized arboviral encephalitis? Emerging Inf Dis 2004; 10:8: 1442-1449. For information on mosquito-borne encephalitis: www.cdc.gov/ncidod/dvbid/arbor/index.htm For information for consumers: www.nlm.nih.gov/medlineplus/encephalitis.html For more detailed information such as causal information and effective management strategies: www.postgradmed.com/issues/1998/03_98/guti.htm Information about case investigation of encephalitis in LAC is available at: www.lapublichealth.org/acd/procs/b73/b73index.htm
2005 Annual Morbidity Report

Catalina Island (HB)
Map 5. EncephalitisRates by Health District, Los Angeles County, 2005*
.0 5 102.5
Miles
AV
SF
WV
WE
EV
FH
PO
*PS
NECEHW
SW SE
SOIW
TO
HB
SAEL
AH
WH
EM
BFCN
*LB
GL
*Excludes Long Beach and Pasadena Data.
Health District Boundary
Service Planning Area (SPA)
Cases Per 100,000 Population
1.6 - 3.8
0.8 - 1.5
0.4 - 0.7
0.1 - 0.3
0.0

Acute Communicable Disease Control 2004 Annual Morbidity Report
Disease Summaries
page 47
Figure 2. Encephalitis by Etiology
LAC, 2004 (N=59)
ENCEPHALITIS
a Cases per 100,000 population. b
Excludes AIDS encephalopathy cases.
DESCRIPTION
Encephalitis, an inflammation of parts of the brain, spinal cord and meninges, causes headache, stiff neck, fever and altered mental status. It can result from infection with a number of different agents including viral, parasitic, fungal, rickettsial, bacterial and chemical. Public health surveillance is limited to cases of suspected or confirmed viral etiology, which includes primary and post-infectious encephalitis—but excludes individuals with underlying Human Immunodeficiency Virus (HIV) infection. Of special concern is arboviral (mosquito-borne) encephalitis, which can be prevented by personal protection and mosquito control (See WNV section). Arthropod-borne viruses, i.e., arboviruses, are viruses that are maintained in nature through biological transmission between susceptible vertebrate hosts by blood feeding arthropods (mosquitoes, psychodids, ceratopogonids, and ticks). All arboviral encephalitides are zoonotic, being maintained in complex life cycles involving a nonhuman primary vertebrate host and a primary arthropod vector. Arboviral encephalitides have a global distribution. There are five main viral agents of encephalitis in the United States: West Nile virus (WNV), eastern equine encephalitis (EEE), western equine encephalitis (WEE), St. Louis encephalitis (SLE) and La Crosse (LAC) encephalitis, all of which are transmitted by mosquitoes. In 2004, the most frequently diagnosed arboviral etiology for reported encephalitis cases was WNV infection (Figure 2).
CRUDE DATA
Number of Cases
133 Annual Incidencea,b
LA County 1.4
California N/A United States N/A
Age at Diagnosis
Mean 47
Median 50
Range 0-93 years
Case Fatality
LA County b 7% United States N/A
Figure 1Encephalitis
Incidence Rates by Year of OnsetLAC 1993–2004
0
0.2
0.4
0.6
0.8
1
1.2
1.4
1.6
1993
1995
1997
1999
2001
2003
YearC
ases
per
100
,000
West Nile (49) 83%
Enterovirus (1) 2%
Herpes Simplex (4) 7%
Mycoplasma Pnuemoniae (1) 2%
2004 Annual Morbidity Report

Acute Communicable Disease Control 2004 Annual Morbidity Report
Disease Summaries page 48
DISEASE ABSTRACT
In 2004, there were 133 viral encephalitis cases reported. Of these, 49 were due to WNV infection. (See WNV Report for details).
The incidence of viral encephalitis increased by over three times in 2004, 1.4 cases per 100,000 population, compared to 0.4 cases per 100,000 population in 2003 (Figure 1).
In 2004, the case fatality, 7% (n=9), was lower than prior years, with 13% and 16% reported in 2003 and 2002, respectively.
The majority of encephalitis cases occurred in those greater than 40 years of age; 61 (47%) cases occurred in those greater than 55 years of age and 28 (22%) cases were in children less than 15 years of age.
Non-Hispanic Whites accounted for the greatest number of encephalitis cases, 63 (50%), followed by Hispanics, 44 (35%), Blacks, 8 (6%), Asians, 9 (7%), and unknown race, 2 (2%).
The underlying etiologies of encephalitis were identified in 59 (44%) cases and included: 49 (83%) with WNV, 4 (7%) herpes simplex virus (HSV), 1 (2%) Mycoplasma pneumoniae, and 1 (2%) case due to enterovirus infection (Figure 2).
The number of reported encephalitis cases was highest in SPA 3 (n=35, 2.1 per 100,000), followed by SPA 2 (n=33, 1.6 per 100,000) and SPA 7 (n=18, 1.3 per 100,000).
The reported annual incidence of acute encephalitis reported in the medical literature varies from 3.5-7.4 cases per 100,000 person-years. In 2004, the overall Los Angeles County viral encephalitis rate of 1.4 per 100,000 person-years is far lower that rates quoted in surveillance literature. Reasons to explain the lower rate could be the exclusion of other infectious etiologies (such as bacterial, fungal, protozoal, HIV-related) from our encephalitis surveillance data, misclassification of encephalitis cases as meningitis, under diagnosis of encephalitis cases, and under reporting of hospitalized encephalitis cases, since all reporting is passive. The case fatality from encephalitis has ranged from a high of 38 % in 1997 to a low of 7% in 2004 and remains lower than the 2004 overall case fatality rate of 16% from the California Encephalitis Project. The higher encephalitis mortality rate reported by the California Encephalitis Project, a California Department of Health Services’ research project, may be biased to include more severely ill individuals in their data than LAC surveillance data. Of particular public health concern in LAC are the arthropod-borne (arboviral) encephalitides, SLE, WEE and WN viruses which are endemic to California. Since 1985, sporadic cases of SLE have been reported, following an outbreak of 16 cases in 1984. The last confirmed SLE case in LAC was in 1997. The potential for another SLE outbreak exists, as sporadic cases in previous years and identification of SLE in sentinel chicken populations indicate that the virus remains endemic in LAC. Beginning in 2001, arboviral disease surveillance has included WNV, in addition to SLE and WEE. Beginning in 2001, the LAC PHL has served as a reference laboratory and provided human testing for West Nile virus (WNV). In 2004, 49 reported encephalitis cases had laboratory-confirmed WNV thought to be locally acquired, compared to one case acquired out of state in 2003. Like SLE virus, WNV is transmitted principally by Culex species mosquitoes, but also can be transmitted by Aedes, Anopheles, and other species. The predominance of urban C. pipiens, C. tarsalis, and C. quinquefasciatus, mosquitoes trapped during the 2004 outbreak suggests an important role for this species. Enhanced surveillance for early detection of virus activity in birds and mosquitoes will be crucial to guide control measures in 2005. It is expected that WNV will remain endemic in LAC and will spread through most of CA in 2005. Prevention measures for arboviral infections consist of personal protection, screened windows, avoiding mosquito-infested areas, especially at dusk when most mosquitoes are active, wearing protective clothing and use of insect repellants containing DEET. Elimination of standing water and proper maintenance of ponds and swimming pools decrease the available sites for hatching and maturation of mosquito larvae. Five local mosquito abatement districts monitor and control populations of these insects, especially in areas used by the public (See WNV section).
2004 Annual Morbidity Report

Acute Communicable Disease Control 2004 Annual Morbidity Report
Disease Summaries
page 49
Future Directions: Surveillance for WNV infection in humans, mosquitoes, sentinel chickens, and dead birds will continue throughout the state of CA. and LAC. Research is underway to develop a WNV vaccine and treatment for humans. No human vaccine is available for SLE, WEE, and WNV. A human vaccine exists for Japanese Equine encephalitis. Licensed equine (horse) vaccines are available for WEE, EEE, and WN viruses. ADDITIONAL RESOURCES Glaser CA, Gilliam S, Schnurr D, Bagher F, Honarmand S, et al. In search of encephalitis etiologies: Diagnostic challenges in the California Encephalitis Project, 1998–2000. CID 2003; 36:731–42. Khetsuriani H, Holman RC, Anderson LJ. Burden of encephalitis-associated hospitalizations in the United States, 1988–1997. CID 2002; 25:175–82. Johnston RT. Acute Encephalitis. CID 1996; 23:219–26. Nicolosi A, Hauser WA, Beghi E, Kurland LT. Epidemiology of central nervous system infections in Olmsted County, Minnesota, 1950–1981. J Inf Ds 1986; 154:399–498. Trevejo RT. Acute Encephalitis Hospitalizations, California, 1990-1999: Unrecognized arboviral encephalitis? Emerging Inf Dis 2004; 10:8: 1442-1449. For information on mosquito-borne encephalitis: www.cdc.gov/ncidod/dvbid/arbor/index.htm For information for consumers: www.nlm.nih.gov/medlineplus/encephalitis.html For more detailed information such as causal information and effective management strategies: www.postgradmed.com/issues/1998/03_98/guti.htm Information about case investigation of encephalitis in LAC is available at: www.lapublichealth.org/acd/procs/b73/b73index.htm CDC website—Q & A about West Nile Virus: www.cdc.gov/ncidod/dvbid/westnile/q&a.htm Mosquito and Vector Control Association of California: www.mvcac.org
2004 Annual Morbidity Report

Acute Communicable Disease Control 2004 Annual Morbidity Report
Disease Summaries page 50
2004 Annual Morbidity Report

Acute Communicable Disease Control 2003 Annual Morbidity Report
Disease Summaries
page 47
Figure 2. Encephalitis by Etiology
LAC, 2003 (N=13)
ENCEPHALITIS
a
Cases per 100,000 population. b
Excludes AIDS encephalopathy cases.
DESCRIPTION
Encephalitis, an inflammation of parts of the brain, spinal cord and meninges, causes headache, stiff neck, fever and altered mental status. It can result from infection with a number of different agents including viral, parasitic, fungal, rickettsial, bacterial and chemical. Public health surveillance is limited to cases of suspected or confirmed viral etiology, which includes primary and post-infectious encephalitis—but excludes individuals with underlying Human Immunodeficiency Virus (HIV) infection. Of special concern is arboviral (mosquito-borne) encephalitis, which can be prevented by personal protection and mosquito control.
DISEASE ABSTRACT
The incidence of viral encephalitis in 2003 was 0.40 cases per 100,000 population (Figure 1).
In 2003, the case fatality, 13%, was lower than prior years, 16% and 38%, 2002 and 1997 respectively. The 2003, the LAC case fatality rate is comparable to that seen in the California Encephalitis Project in 2003, reported as 16% statewide.
CRUDE DATA
Number of Cases
38 Annual Incidence a,b
LA County 0.40
California N/A United States N/A
Age at Diagnosis
Mean 27
Median 17 Range 0-89 years
Case Fatality
LA County b 13% United States N/A
Figure 1Encephalitis
Incidence Rates by Year of OnsetLAC 1993–2003
0
0.1
0.2
0.3
0.4
0.5
0.6
0.7
0.8
1993 1994 1995 1996 1997 1998 1999 2000 2001 2002 2003
YearC
ases
per
100
,000
Influenza A (2) 15%
Herpes Simplex (4) 31%
Enterovirus (1) 8%
Epstein-Barr (1) 8%
West Nile (1) 8%
Varicella Zoster (2) 15%
Mycoplasma Pnuemoniae (2) 15%
2003 Annual Morbidity Report

Acute Communicable Disease Control 2003 Annual Morbidity Report
Disease Summaries page 48
The majority of encephalitis cases were under age 44 years of age: 15 (40%) were in children less than 15 years of age and 15 (40%) were in those from 15 to 44. The remainder were 3 (7.5%) cases between 45 to 54 years, and 5 (12.5%) occurred in those more than 55 years.
There were 23 (61%) male cases and 15 (39%) female cases. Hispanics had the greatest number of reported encephalitis cases, 15 (39%), followed by Whites, 14
(38%), Black, 4 (10%), Asian, 2 (5%), and 3 (8%) with race unknown. Cases of encephalitis occurred throughout LAC; SPA 2 had 12 cases, followed by SPA 3, 4, 6, 7, 8
with 4 cases each, and SPA 1 and SPA 5 with 3 cases each. The underlying etiologies of encephalitis were identified in only 13 (34%) of reported cases. The
etiologies were identified included: 4 (31%) herpes simplex virus (HSV), 2 (15%) influenza A, 2 (15%) varicella zoster virus (VZV), 2 (15%) Mycoplasma pneumoniae, and 1 (8%) case each caused by Epstein-Barr, 1 (8%) West Nile virus, and 1 (8%) enterovirus (Figure 2).
One case of encephalitis was due to WNV infection that was acquired in the state of Louisiana. The reported annual incidence of acute encephalitis has varied from 3.5-7.4 cases per 100,000 person-years. In 2003, the overall viral encephalitis rate of 0.4 per 100,000 person-years is far lower that rates quoted in the surveillance literature. Reasons to explain our lower rate could be the exclusion of other infectious etiologies of encephalitis, inclusion of seriously ill patients by medical facilities and misclassification of aseptic meningitis as encephalitis cases in earlier surveillance reports from the 1950-1990’s, and under reporting of hospitalized encephalitis cases, since all reporting is passive. The mortality ratio in LAC from encephalitis has ranged from a high of 38 % in 1997 to a low of 12.5% in 2003. LAC mortality data is consistent with data from the California Encephalitis Project with an overall reported mortality ratio of 16 % in 2003. In both LAC and the California Encephalitis Project, reporting may be biased to the more severely ill individuals. The underlying etiologies of encephalitis are diverse in both infectious etiologies as well as non-infectious etiologies. Encephalitis surveillance at ACDC is dedicated to acute viral etiologies excluding underlying HIV infection. Even with exhaustive testing, the underlying etiology of encephalitis is difficult to determine. Reviewing their 291 encephalitis cases from 1998-2000, the California Encephalitis Project found confirmed or probable infectious etiologies in only 15% of their encephalitis characterized as due to infectious etiology despite exhaustive viral, bacterial, fungal and parasitic testing. In 2003, 18 (45%) encephalitis cases reported to ACDC were enrolled in the California (CA) Encephalitis Project. The etiology was identified in 7 cases (39%) enrolled in the CA Encephalitis Project. Of the 38 total cases reported to ACDC in 2003, the etiology was identified for 13 (32.5%) cases (Figure 2). Determining the etiology of encephalitis allows public health to follow disease trends, to notify the community of increased disease risk, and to implement prevention efforts. Of particular public health concern in LAC are the arthropod-borne (arboviral) encephalitides, St. Louis encephalitis (SLE), western equine encephalitis (WEE) and West Nile (WNV) viruses, which are endemic to California. Since 1985, sporadic cases of SLE have been reported, following an outbreak of 16 cases in 1984. The last confirmed SLE case in LAC was in 1997. The potential for another SLE outbreak exists, as sporadic cases in previous years and identification of SLE in sentinel chicken populations indicate that the virus is now endemic in LAC. Beginning in 2001, arboviral disease surveillance has included WNV, in addition to SLE and WEE. Beginning in 2001, the LAC PHL has served as a reference laboratory and provided human testing for (WNV). In 2003, one reported encephalitis case was determined due to WNV. This California (CA) resident had traveled to a WNV endemic state, Louisiana, and became ill upon return in CA. In October 2003 one locally acquired case of WNV fever was identified in LAC (see special report section). It is expected that the encephalitis due to WNV will be a major cause of encephalitis within LAC and CA as WNV becomes established in the mosquito and bird populations of CA. Prevention measures for arboviral infections consist of personal protection, screened windows, avoiding mosquito-infested areas especially at dusk when most mosquitoes are active, wearing protective clothing and use of insect repellants containing DEET. Elimination of standing water and proper maintenance of
2003 Annual Morbidity Report

Acute Communicable Disease Control 2003 Annual Morbidity Report
Disease Summaries
page 49
ponds and swimming pools decrease the available sites for hatching and maturation of mosquito larvae. Five local mosquito abatement districts monitor and control populations of these insects, especially in areas used by the public.
Future Directions: Surveillance for WNV infection in humans, mosquitoes, sentinel chickens, and dead birds will continue throughout the state of CA and LAC. Research is underway to develop a WNV vaccine and treatment for humans. No human vaccine is available for SLE, WEE, and WNV. A human vaccine exists for Japanese equine encephalitis. Licensed equine (horse) vaccines are available for WEE, EEE, and WN viruses. ADDITIONAL RESOURCES Glaser CA, Gilliam S, Schnurr D, Bagher F, Honarmand S, et al. In search of encephalitis etiologies: Diagnostic challenges in the California Encephalitis Project, 1998–2000. CID 2003; 36: 731-42. Khetsuriani H, Holman RC, Anderson LJ. Burden of encephalitis-associated hospitalizations in the United States, 1988–1997. CID 2002; 25: 175-82. Johnston RT. Acute Encephalitis. CID 1996; 23: 219-26. Nicolosi A, Hauser WA, Beghi E, Kurland LT. Epidemiology of central nervous system infections in Olmsted County, Minnesota, 1950–1981. J Inf Ds 1986; 154: 399-498. Trevejo RT. Acute Encephalitis Hospitalizations, California, 1990-1999: Unrecognized arboviral Encephalitis? Emerging Inf Dis 2004; 10(8): 1442-1449. For information on mosquito-borne encephalitis: www.cdc.gov/ncidod/dvbid/arbor/index.htm For information for consumers: www.nlm.nih.gov/medlineplus/encephalitis.html For more detailed information such as causal information and effective management strategies: www.postgradmed.com/issues/1998/03_98/guti.htm Information about case investigation of encephalitis in LAC is available at: www.lapublichealth.org/acd/procs/b73/b73index.htm CDC website—Q & A about West Nile Virus: www.cdc.gov/ncidod/dvbid/westnile/q&a.htm Mosquito and Vector Control Association of California: www.mvcac.org
2003 Annual Morbidity Report

Acute Communicable Disease Control 2002 Annual Morbidity Report
Disease Summaries
page 45
ENCEPHALITIS
a Cases per 100,000 population.
b Excludes AIDS encephalopathy cases.
DESCRIPTION
Encephalitis, an inflammation of parts of the brain, spinal cord and meninges, causes headache, stiff neck, fever and altered mental status. It can result from infection with a number of different agents including viral, parasitic, fungal, rickettsial, bacterial and chemical. Public health surveillance is limited to cases of suspected or confirmed viral etiology, which includes primary and post-infectious encephalitis—but excludes individuals with underlying Human Immunodeficiency Virus (HIV) infection. Of special concern is arboviral (mosquitoborne) encephalitis, which can be prevented by personal protection and mosquito control. The etiologies of cases with known cause reported in 2002 are shown in Figure 2. DISEASE ABSTRACT The incidence of viral encephalitis in 2002 was 0.66
cases per 100,000 population (Figure 1). The 2002 case fatality of 16 % is lower than in 2001, 22 %, and also from prior years where case
fatality has been as high as 38% in 1997. The 2002 LAC case fatality rate is comparable to that seen in the California Encephalitis Project in 2002, reported as 15%.
27 (45%) were in children less than 15 years of age, 14 (22%) were in those from 15 to 44 and 20 (33%) occurred in those more than 55 years.
There were 40 male cases (65%) and 21 (35%) female cases.
CRUDE DATA
Number of Cases
61 Annual Incidencea LA County 0.7 California N/A United States N/A Age at Diagnosis Mean 30 Median 18 Range 0–91 years Case Fatality LA County b 16.0% United States N/A
Figure 1Encephalitis
Incidence Rates by Year of OnsetLAC 1993–2002
0
0.1
0.2
0.3
0.4
0.5
0.6
0.7
0.8
1993 1994 1995 1996 1997 1998 1999 2000 2001 2002
YearC
ases
per
100
,000
Figure 2Encephalitis by Etiology
LAC, 2002 (N=12)
Herpes simplex virus
25%
Varicella Zoster43%
Epstein-Barr8%
Cytomegalovirus8%
Influenza B 8%
Influenza A 8%
2002 Annual Morbidity Report

Acute Communicable Disease Control 2002 Annual Morbidity Report
Disease Summaries
page 46
Cases of encephalitis occurred throughout LAC; SPA 2 had 14 cases, followed by SPA 7 with 10 and SPA 3 and SPA 8 with 9 cases.
The underlying viral etiology of encephalitis was identified only in 12 (20%) cases. The etiologies identified included 5 of cases caused by Varicella Zoster Virus (VZV), three cases caused by Herpes Simplex Virus (HSV) and 1 case each of encephalitis caused by Influenza A, Influenza B and Epstein-Barr viruses (Figure 2).
COMMENTS The reported annual incidence of acute encephalitis has varied from 3.5–7.4 cases per 100,000 person-years. Using 2002 US census data, LAC viral encephalitis rate of 0.6 per 100,000 person-years is far lower that rates quoted in the surveillance literature. Reasons to explain our lower rate could be the exclusion of other infectious etiologies of encephalitis, reporting of seriously ill patients by medical facilities and misclassification of aseptic meningitis as encephalitis cases in earlier surveillance reports from the 1950–1990’s. The mortality ratio in LAC from encephalitis has ranged from a high of 38 % in 1997 to a low of 16% in 2002. LAC mortality data is consistent with data from the California Encephalitis Project with an overall reported mortality ratio of 15 % in 2002. In both LAC an the California Encephalitis Project, reporting may be biased to the more severely ill individuals. The underlying etiologies of encephalitis are diverse in both infectious etiologies as well as non-infectious etiologies. Encephalitis surveillance at ACDC is focused on acute viral etiologies excluding underlying HIV infection. Even with exhaustive testing, the underlying etiology of encephalitis is difficult to determine. Reviewing their 291 encephalitis cases from 1998–2000, the California Encephalitis Project found confirmed or probable infectious etiologies in only 15% of their encephalitis characterized as due to infectious etiology despite exhaustive viral, bacterial, fungal and parasitic testing. In 2002, 27 (45%) encephalitis cases reported to ACDC were enrolled in the California (CA) Encephalitis Project. The etiology was identified in only 3 cases (11%) enrolled in the CA Encephalitis Project. Of the 61 total cases reported to ACDC in 2002, the etiology was identified for 20% (Figure 2). Determining the etiology of encephalitis allows public health to follow disease trends, to notify the community of increased disease risk and to implement prevention efforts. Of particular public health concern in LAC are the arthropodborne (arboviral) encephalitides, St. Louis encephalitis (SLE), Western equine encephalitis (WEE) and West Nile (WN) viruses. Since 1985, sporadic cases of SLE have been reported, following an outbreak of 16 cases in 1984. The last confirmed SLE case in LAC was in 1997. The potential for another SLE outbreak exists, as sporadic cases in previous years and identification of SLE in sentinel chicken populations indicate that the virus is now endemic in LAC. Beginning in 2001, surveillance has included West Nile (WN) virus, in addition to SLE and WEE. The mosquitoborne encephalitis surveillance program includes of surveillance for equine cases of WEE and WN viral infections, monitoring of mosquito populations, laboratory testing of mosquitoes, and twice monthly testing of sentinel chicken flocks for SLE, WEE and WN virus seroconversion. Beginning in 2001, the LAC PHL provided human testing for West Nile virus. In 2002, no arthropodborne etiology was found in cases of encephalitis reported to ACDC. Prevention measures for arboviral infections consist of personal protection, including use of screens on windows, avoiding mosquito-infested areas, especially at dusk when most mosquitoes are active, wearing protective clothing and use of insect repellants containing DEET. Elimination of standing water and proper maintenance of ponds and swimming pools decrease the available sites for hatching and maturation of mosquito larvae. Five local mosquito abatement districts monitor and control populations of these insects, especially in areas used by the public. Future Directions: There will be increased surveillance for WNV infection in humans. Research is underway in development of a WNV vaccine and treatment for humans. No human vaccine is available for SLE and WEE. Licensed equine (horse) vaccines are available for WEE, EEE, and WN viruses.
2002 Annual Morbidity Report

Acute Communicable Disease Control 2002 Annual Morbidity Report
Disease Summaries
page 47
ADDITIONAL RESOURCES
Glaser CA, Gilliam S, Schnurr D, Bagher F, Honarmand S, et al. In search of encephalitis etiologies: Diagnostic challenges in the California Encephalitis Project, 1998–2000. CID 2003; 36:731–42. Khetsuriani H, Holman RC, Anderson LJ. Burden of encephalitis-associated hospitalizations in the United States, 1988–1997. CID 2002; 25:175–82. Johnston RT. Acute Encephalitis. CID 1996; 23:219–26. Nicolosi A. Hauser WA, Beghi E, Kurland LT. Epidemiology of central nervous system infections in Olmsted County, Minnesota, 1950–1981. J Inf Ds 1986; 154:399–498.
For information on mosquitoborne encephalitis: www.cdc.gov/ncidod/dvbid/arbor/index.htm For information for consumers: www.nlm.nih.gov/medlineplus/encephalitis.html For more detailed information such as causal information and effective management strategies: www.postgradmed.com/issues/1998/03_98/guti.htm Information about case investigation of encephalitis in LAC is available at: www.lapublichealth.org/acd/procs/b73/b73index.htm
CDC website—Q & A about West Nile virus: www.cdc.gov/ncidod/dvbid/westnile/q&a.htm Mosquito and Vector Control Association of California: www.mvcac.org
2002 Annual Morbidity Report

Acute Communicable Disease Control 2002 Annual Morbidity Report
Disease Summaries
page 48
2002 Annual Morbidity Report