Embed Size (px)
Citation preview
Enabling Unsupervised Eye Tracker Calibration by SchoolChildren through Games
Oleg ŠpakovUniversity of Tampere
Tampere, Finland
Howell IstanceUniversity of Tampere
Tampere, Finland
Tiia ViitanenTampere University of Applied
SciencesTampere, Finland
Harri SiirtolaUniversity of Tampere
Tampere, Finland
Kari-Jouko RäihäUniversity of Tampere
Tampere, Finland
ABSTRACTTo use eye trackers in a school classroom, children need to be able tocalibrate their own tracker unsupervised and on repeated occasions.A game designed specifically around the need to maintain their gazein fixed locations was used to collect calibration and verificationdata. The data quality obtained was compared with a standardcalibration procedure and another game, in two studies carriedout in three elementary schools. One studied the effect on dataquality over repeated occasions and the other studied the effect ofage on data quality. The first showed that accuracy obtained fromunsupervised calibration by children was twice as good after sixoccasions with the game requiring the fixed gaze location comparedwith the standard calibration, and as good as standard calibrationby group of supervised adults. In the second study, age was foundto have no effect on performance in the groups of children studied.
CCS CONCEPTS• Human-centered computing → Human computer interac-tion (HCI); • Applied computing → Education;
KEYWORDScalibration, games, school children, low cost tracker, unsupervised
ACM Reference Format:
Oleg Špakov, Howell Istance, Tiia Viitanen, Harri Siirtola, and Kari-Jouko Räihä. 2018. Enabling Unsupervised Eye Tracker Calibration by School Children through Games. In ETRA ’18: 2018 Symposium on Eye Tracking Research and Applications, June 14–17, 2018, Warsaw, Poland. ACM, New York, NY, USA, 9 pages. https://doi.org/10.1145/3204493.3204534
1 INTRODUCTIONOne area that offers many possibilities for exploiting the advent oflow-cost eye tracking systems is education. Gaze measurement maybe integrated into activities such as learning to read. Monitoring
reading progress of a school class in real-time could enable theteacher to see which readers are having problems, and which partsof a reading text are causing problems to several readers. Collectinggaze-based reading performance data could enable the teacher tomonitor the progress of individual students over time.
The extent to which this is feasible with low cost systems willdepend very much on the data quality obtainable from the eyetracker over the course of a lesson lasting, say, 40 minutes. There arethree necessary pre-requisites. First, the eye tracker is calibrated oneach use occasion. With low sample trackers, modifying previouslystored calibration data is unlikely to produce sufficiently accuratetracking performance. Second, the calibration needs to be doneunsupervised by the individual student as there are not the teachingstaff resources to oversee the calibration. This might be the case ifthe tracker is used in the laboratory or individual field test situation.Third, the calibration procedure may not take a disproportionateamount of time out of the lesson in comparison to the perceivedbenefits either to the teacher or to the student.
It is necessary to find a means of encouraging each child tocalibrate their eye tracker quickly and carefully without supervision.As this will need to be done every time there is a reading lesson, themotivation to calibrate quickly and carefully needs to be maintainedover multiple sessions.
This paper describes two studies carried out in three Finnishprimary schools to compare data quality resulting from using twogames to collect calibration data with a standard calibration pro-cedure. The first study compares the data quality resulting whenthe procedures were tested by the same class over six repeatedoccasions, while the second study compares the same outcomes forchildren of different ages on a single occasion.
2 BACKGROUNDGames now constitute a fundamental part of digital entertainmentculture and are a natural starting point for when considering suit-able computer-based activities to motivate and engage children.
Broadly, a computer game consists of participation in an activ-ity which has one or more players, rules, and a victory condition[Rogers 2014]. Characteristics of a game include: Genre, which re-lates to the gameplay interactions of the game external to the storyor theme; Theme, which is the setting or scenario of the game-play; Actions, which are the interactions the player makes with thegame, such as opening chests, firing a weapon, or casting a spell;Progression, which marks how far along in the game a player is,
This is the accepted manuscript of the article, which has been published in ETRA '18 Proceedings of the 2018 ACM Symposium on Eye Tracking Research & Applications. New York, NY, USA: ACM, 2018. ISBN:978-1-4503-5706-7. https://doi.org/10.1145/3204493.3204534
which could be an increase in level of the character, or progres-sion through an over-arching story; Rules define the constraintsa player must keep within; Game mechanics, which are the mostbasic building blocks of a game; a rule or description that coversa specific, single aspect of play, for example, pressing a sequenceof buttons to make a character jump, or rotating a falling block ofshapes; rewards and achievements, which are given to the player asa result of progression and performance.
Achievements are rewards collected alongside the main gameandmay be carried over between play occasions [Hamari and Eranti2011]. Badges are a common type of achievement and may beaccompanied by a reward, such as an amount of virtual currency.
The impact of an achievement system based on badges for class-basedwork in a large sample of university students was investigatedby Denny [Denny 2013]. A highly significant positive effect wasfound on the quantity of contributions made by students, withoutany negative impact on quality. In general, they enjoyed being ableto earn badges. The impact of gamifying two sets of tasks withoutmuch intrinsic interest carried out by 5 to 7 year old children wasstudied in a laboratory setting [Brewer et al. 2013]. Gamifyingthe task led to a significantly higher proportion of participantscompleting the tasks in both sets.
The application of games to a broad range of calibration activitieshas been discussed [Flatla et al. 2011]. They propose a frameworkthat involves identifying calibration type, identifying the core cal-ibration tasks, identifying one or more game mechanics for eachtask, and then adding additional games design elements. Threegames for calibration were compared with their respective stan-dard procedures, which were not related to eye tracking. The gamesproduced a higher rating of enjoyment and in some cases betterdata quality.
Alternative means of eye tracker calibration have been studiedwith a view to making this activity, necessary on each use occasion,less tedious. Calibration using smooth pursuit eye movements in-stead of the usual fixed location approach has been studied [Pfeufferet al. 2013]. It was observed by these, and other authors [Reingold2014], that there is no guarantee that a user actually looks at therequired location while calibration data is collected in the fixedlocation approach. In the smooth pursuit approach, the correlationbetween changes in gaze position in a time windowwith changes inthe coordinates of moving objects on screen was studied. A personwas encouraged to follow the path of a known object and then gazedata at known points on the object’s trajectory was sampled. Theadvantages of this approach claimed by the authors are that thetechnique is tolerant to interruption and is able to calibrate userswithout them being aware of it. They did not claim advantages inrelation to superior data quality over the fixed location approach.
The testing and reporting of data quality obtained from eye track-ers rather than relying on data published bymanufacturers has beenadvocated recently, particularly as the cost of eye tracking systemsfall and the situations in which they are used increase. Standardizedprocedures for doing this have been proposed ([Holmqvist et al.2012], [Akkil et al. 2014], [Niehorster et al. 2017], [Feit et al. 2017],[Špakov et al. 2017]). These share similar features and use accuracyand precision as the main quality metrics. After a system has beencalibrated, then gaze position data is collected when a person isassumed to be looking at a known location. The difference between
the known location and the average of the locations of gaze po-sition samples collected when looking at that location is used asthe measure of accuracy, and the dispersion of those samples isused as the measure of precision. Both measures may or may notbe reported separately for the X and Y directions.
3 DESIGNING GAMES FOR CALIBRATIONThree games conditions were designed to collect calibration andverification data and compared with the standard fixed point cali-bration procedure. The game was layered over the standard fixedlocation calibration procedure. One reason for this is speed of com-pletion in order to minimize the impact of this task on the classroomlesson in progress. Other approaches such as smooth pursuit arepossible, as noted previously, and may be appropriate if these canbe completed within an acceptable time. These were not investi-gated further in this study. In each condition, there were five fixedcalibration locations, and between 4 and 10 verification locations.The eye tracker gave a value for the quality of the data collected ateach calibration location. If the reported value was below a certainthreshold, the point was re-calibrated. When all points had beencalibrated, verification data was collected.
3.1 The Ball game (Standard procedure)This was the standard calibration procedure where a ball movedbetween the calibration locations. This was called a game in ordernot to make this appear differently to the participants, although nofeedback was provided. The player was instructed to follow the ballwith their eyes and when it stopped, to wait for a second and thenclick the mouse button. The click caused the ball to move to thenext location, where it stopped. After calibration was completed,the ball moved to the verification locations without any break.
3.2 The Mission gameThe main game mechanic was designed to keep the player lookingat a small area (40 x 40 px) on screen just before and just after eyeposition data was collected. An attribute (color or shape) of the smallarea cycled quickly through four options and the action requiredwas that the player had to press a key (the space bar) when the targetattribute was displayed. Each option appeared for a period between0.43 to 0.8 seconds (1 in Figure 1). There was a 1 second delaybefore feedback was given at the same location showing whetheror not the selection had been successful (2 and 3 in Figure 1). It wasduring this second that the calibration data was collected. Duringthe calibration phase, five similar objects appeared at differentlocations on screen, one at a time. Prior to this, the player had beengiven the value to select on an instruction screen, for example selectthe ’yellow’ object, or select the ’triangular’ object. An importantdesign consideration was that themechanic is extensible, and can beembedded into different themes for games. The number of optionscycled through could be increased or reduced, as could the displaytime.
The theme used in Level 1 was to open a door to let the playerescape following a radioactive leak by releasing five locks, whichwere at the required calibration locations. There were four verifica-tion locations which followed on directly from the calibration. Foradditional motivation, a personal customizable player character,

Figure 1: Main mechanic in Level 1, Mission game
levels and rewards were added. As a reward, points were awardedfor speed and deducted for locks not opened in order to a) win themission and b) gain achievements in the form of virtual currencyand bonus accessories. In these trials, the game had two levels withdifferent missions, each with their own background stories.
3.3 The Firefly/Troll gameThe Firefly game was similar to the standard calibration, but it wasvisualized as a firefly flying on the screen and turning on lamps.There was a bullseye on top of the light bulb to which the fireflywould fly to and the user was instructed to look at. When thebullseye disappeared, the user would click the mouse button toturn the lamp on. Then a new lamp would appear and the fireflywould fly to it (Figure 2a). Although instructed to do so, there wasno penalty for not looking at the fly when the button was clicked.
When the calibration had been completed, a separate verificationgame immediately followed (the Troll game). A room appearedwhere the user played a hidden object game where they had tofind and click on 10 troll characters displayed semi-transparentlyin the room (Figure 2b). The player was awarded a score based onthe time and amount of trolls found within the time limit of 30seconds, and their high scores were saved. The difference betweenthe location of the mouse pointer and the location of the closestfixation to the pointer in the second prior to the click event wastaken as the basis for validation (see Section 4.2.3). This is similarto the idea of Hornof and Halverson’s required fixation locations[Hornof and Halverson 2002], where the user was required to clickon a small target and was assumed to be looking at the pointer onthe target when it was clicked.
There was no carry-over between game-playing occasions, otherthan the display of a ’Best’ sign at the end of the Troll game if thiswas the player’s highest score to date.
3.4 Encouraging the player to sit in a positionacceptable for satisfactory tracking
To encourage the player to sit in a position and at a distance toprovide suitable eye images for the tracker’s cameras, an initialscreen preceded the games (shown in Figure 3).
Figure 2: Firefly game (calibration) and Troll game (verifica-tion)
Figure 3: Means of encouraging the player to sit within thehead box of the eye tracker
With the Ball game and Firefly game, the player was asked to sitso that the yellow circles were the center of the brown box (Figure3a). When this happened the ’Aloita’ (’Begin’) button appeared,the player clicked on this and the game screen appeared. If theplayer moved out of position before clicking the button, the buttondisappeared. In the Mission game, the player was asked to movetheir position to move the eye images shown as red circles to matchthe location of the character’s eyes (Figure 3b). When this happened,the initial game instruction screen appeared automatically. Therewas little difference between the acceptability thresholds in bothmethods. There was an automatic accept in theMission game after adelay when an acceptable position was logged, and a manual acceptin the other two conditions where a button appeared after the samedelay. Positioning participants only took place in the beginningbefore each game and probably changed during the game for allgames. They were not made to keep their head or eyes in that areaduring the actual period of game play.
4 EVALUATION OF THE EFFECTIVENESS OFGAMES FOR EYE TRACKER CALIBRATION
The purpose of using games for eye tracker calibration was to in-vestigate whether unsupervised calibration by elementary schoolstudents could produce satisfactory levels of data quality over mul-tiple use occasions at an acceptable cost in terms of time taken andother disruption. This can be resolved into two research questions:RQ1: do games-based calibration procedures provide better quality
of data than the standard procedure at an acceptable cost interms of time taken to complete the procedure?
RQ2: is there a change in calibration data quality over repeatedoccasions?

The ages of children in elementary school in Finland range from 7to 11, which prompts a further question.RQ3: does the effect of games-based calibration procedures on
data quality depend on the age of the students?
4.1 EquipmentSix Dell E7520 laptops with a screen resolution of 1366 x 768 and a12.5 inch screen were used, each equipped with a Visual InteractionmyGaze n eye tracker, and a mouse. The myGaze n was a remotebinocular tracker with a sample rate of 30Hz, with manufacturer’sestimates of accuracy and spatial resolution of 0.4◦ and 0.05◦ re-spectively. The three game solutions were built into a customizedversion of the general eye tracker driver software, ETU Driver,
4.2 Study 1: (RQ1 and RQ2) Investigation of theimpact of games-based calibration on dataquality
All of the students in a second-grade class (7-8 years old) of oneof the schools completed the games in a single session, which wasthen repeated on five subsequent occasions. The session took about10 minutes to complete. The class teacher had randomly allocatedstudents to four groups of up to six students each, and the studentsremained in the same group for each session. The sessions werecompleted on separate days over a 10-day period, three in one weekand three in the following week. The order of the games that eachparticipant completed was counterbalanced over the six sessions.Sessions took place in a room adjacent to their normal classroom(see Figure 4). Prior to the data collection, a presentation of thegames was made to the whole class. After the final session, therewas a 10-minute discussion about each of the games with eachgroup. School procedures for obtaining parental consent for eachstudent’s participation in the trials were followed. A pilot study totest the data collection procedures with a large group of participantsin the school was not carried not as this would have meant thatthey would have already seen and played the games before thefirst session of the study. It would have been difficult (though notimpossible) to have conducted a pilot test on a different group ofparticipants, and this would have reduced the data loss in Session 1of the study.
The dependent variables were:• the data quality, assessed by the accuracy and precision ofthe data collected in the verification, and by the number ofpoints requiring recalibration.
• the time taken to complete the games• ratings of how engaging each game was (made after eachsession)
It was expected that the Mission game would produce the bestdata quality, initially and over the repeated sessions, due to themechanic requiring attention to be maintained on the verificationpoint, and the greater engagement expected with the game. It wasexpected that the Firefly/Troll game would result in greater engage-ment than the standard procedure, although not necessarily betterdata quality as the calibration mechanic was similar.
4.2.1 Observations from the data collection trials. It was in-tended that, as far as possible, each session would be conducted
Figure 4: A group of six students taking part in a data collec-tion session (Study 1)
without any direct supervision or intervention. During the firstsession, however frequent interventions were required to adjustthe sitting position of the participant in relation to the eye tracker.In general, the sitting position was too low in relation to the deskand the eye tracker and required the screen angle to be increased toan almost vertical position. For the second and subsequent sessions,cushions were provided (used in the session shown in Figure 4),very little intervention was required, and participants completedthe games generally unsupervised.
4.2.2 Definition of a fixation. The fixation detection algorithmaccumulates gaze points to a single fixation as long as their loca-tion is not further from the current fixation center than a certainthreshold [Špakov 2012]. The threshold was 50 pixels (~1.5◦) as themyGaze tracker applied a two-state low-pass filter and temporallyadjacent gaze points within a fixation lay relatively close to eachother. The fixation center was calculated as a simple average of allgaze points assigned to this fixation. Two consecutive gaze pointswithin 50 pixels of each other falling outside of the current fixationformed a new fixation.
4.2.3 Definition of the verification fixation. In the Ball game andthe Firefly/Troll game the notion of a ’verification’ fixation wasused. Instead of using the fixation in progress when the selectionevent was made as the datum point for verification, the fixationsmade in the 1 second preceding the selection event were examined.The closest fixation to the verification reference point was selected,provided the duration of this fixation exceeded 350 ms. The refer-ence point for the verification was taken to be the location of thepointer for the Firefly/Troll game. The size of an individual trollwas relatively large, and it was not known where exactly a playerwould look when selecting one. The center of the target object inthe Mission game and the Ball game was taken as its referencepoint.

Figure 5: Average accuracy (cm) for the 3 games, sessions 1to 6, error bar: 95% Confidence Interval
Figure 6: Average precision (cm) for the 3 games, sessions 1to 6, error bar: 95% Confidence Interval
The distance from the center of the closest fixation to the refer-ence point was used as the measure of accuracy and the standarddeviation of the gaze points within the whole verification fixa-tion was used as the measure of precision, in accordance with theTraQuMe formulae [Akkil et al. 2014].
4.2.4 Results - data quality. Of the 23 students in the class, onestudent was absent for five sessions, one was absent for four ses-sions and one for two sessions. Data from 368 games were collectedin total from a possible maximum of 381, which represents anoverall data loss of 3.4%. In Session 1, data from 55 games out of apossible 63 were collected (a 12.7% data loss) due mostly to problemswith the data collection system rather than the eye trackers.
The accuracy and precision in a game were computed as av-erages in centimeters for all individual verification points acrossparticipants that had valid gaze data.
Figure 5 shows the average accuracy values in centimeters. Theviewing distance was not fixed, nor recorded, so accuracy data isnot given in degrees of visual angle but in centimeters. The smallervalues indicate greater accuracy. The accuracy provided by theMission game (~0.5 cm) is about twice as good as that providedby the standard calibration (~1.0 cm). The error bars show the 95%confidence intervals of where the population mean lies in relationto the sample mean. The differences in accuracy between the gamesaccord with the expected outcomes for RQ1. Regarding RQ2, there
Figure 7: Average number of recalibrations for every 5 cali-bration points over all 6 sessions
Figure 8: Average ratings made after each session, 5 = reallygood, 1 = really boring
is no evidence that accuracy gets worse over the six sessions forany of the calibration conditions.
Figure 6 shows the corresponding data for precision. The rangeof precision values is very small, probably as a result of the filteringapplied to consecutive data samples by the eye tracker. The averagesof most precision measures shown lie within a 0.1 centimeter range.There is no evidence of a systematic difference between games orover repeated sessions in the measures of precision.
Each game used five calibration locations on the screen, andFigure 7 shows the average number of recalibrations required foreach game. Over the sessions, the number of recalibrations for theBall game doubles, while that of the Mission game is nearly halfthis amount to start with, and remains at, or below, the initial levelthroughout. The performance of the Firefly calibration is initiallysimilar to the Ball game, then improves in Sessions 2 and 3, but thendeteriorates over sessions 4 to 6 and mirrors that of the Ball game.By the final session, the number of recalibrations required for thestandard calibration method is three times that of the Mission game.There is then an effect in the predicted direction over time (RQ2)when the number of recalibrations is taken as the measure of dataquality.
4.2.5 Subjective feedback. Contrary to expectations, the stu-dents were very positive about all the games over each of the ses-sions in the ratings made after each session. Figure 8 shows theaverage of rating values (5 being the most favourable and 1 theleast). A ’Smileyometer’ was used to obtain the ratings, which has

been found to be usable with students at elementary school level[Read et al. 2002]. There was no apparent effect on rating values ei-ther by game or by session. It was noted that on occasion, a studentcould make negative comments during a game, but afterwards stillgive it a very positive rating. As the students were not experiencedgames testers, in spite of being told what to rate, some of them mayhave been responding to how well they thought they did.
To gain more detailed feedback, group discussions were held andrecorded with each group after the last session. The students wereasked which game they liked the best and the least, and why. Tenout of the 20 students present in the final session considered theBall game to be the most boring of the three. Most could not comeup with any good qualities, but a few commented that they likedthe movement of the ball. On the other hand, some also consideredthat as being negative. The Firefly game divided opinions moreevenly, with nine votes for it being the best, and ten for it being theworst of the three. Positive things mentioned about it were the trollsand making a high score. However, the initial calibration (fireflyand lamps) was still considered boring and too slow. The Missiongame received 11 votes for the best game, and none to be the worst.Some of the students felt that the game was too difficult. Positivefeedback included opening the locks (with preference to shapesinstead of colors) and making a "high score" with the amount oflocks opened.
4.2.6 Duration. The overall durations of the three games (Figure9) are affected by the time for the verification process and thenumber of re-calibrations, as well as the time required to read theinstruction screen. These are very consistent after the first day andthe Ball game is completed about twice as quickly than the Missiongame, the difference being about 40 seconds. A possible reasonfor the increase in the duration of the Mission game in Session6 is that all students were moved to Level 2. The mechanic wassimilar in that a target shape had to be selected instead of a targetcolor. However, moving to the new level necessitated reading newinstructions, which would affect the overall duration.
The time required for the calibration only when the initial in-structions and verification are discounted is consistent after thefirst session. This represents a minimum time overhead. In the Mis-sion game, the player had to wait while the target cycled througheach of the color options or shape options, whereas in the Fireflyand Ball game, there were a greater number of recalibrations. Thestandard calibration was consistently faster by about 5 seconds.
4.2.7 Comparison of results obtained from supervised calibra-tions. It is informative to compare the data quality obtained fromthe school with that collected from adults during a supervised cal-ibration using the standard procedure with the same eye tracker.These data provide a benchmark of what could be expected inlaboratory testing conditions. Table 2 shows the averages for thenumbers of recalibrations, accuracy and precision for Session 1and Session 6 compared with a group of 12 adults undertakingthe standard calibration under supervision. Here, the seating posi-tion, viewing distance and screen angle were checked, and adjustedif necessary, before the calibration using the Ball game only. Forthe standard calibration, the data quality from the unsupervisedstudents is clearly much worse than from the supervised adults.However, the data quality obtained from the students using the
Figure 9: Durations of games (in seconds) over each session
Mission game is as good if not better than from the supervisedadults using the standard procedure. Comparing data from Session1, the difference between the accuracy of adults using the stan-dard calibration (mean = 0.68cm) and students using the Missiongame (mean = 0.47cm) approaches a significant difference (p = 0.06).Comparing the accuracy from the students in Session 6 using theMission game (mean = 0.52) with the adult data, the difference isnot significant.
We can compare our data with data quality values obtained froma study in which a large number of adults performed a task similarto the verification task in two different lighting conditions and withtwo different eye trackers [Feit et al. 2017]. The tracker used inour study is a low cost version of one of the trackers used in thatstudy, the SMI REDn scientific. The mean values for accuracy andprecision from unsupervised students using the Mission game inour study are similar to those reported for adults using a similartracker with a higher sample rate (60Hz) in Feit et al.’s study.
4.3 Study 2: (RQ3) Investigation of the impactof age on the effect of games-basedcalibration
Study 2 repeated the first session of Study 1 with elementary schoolstudents in the third grade and fifth grade. There were:
• School A : 21 second grade students, age 7-8, (this data wasfrom Session 1, Study 1)
• School B : 19 third grade students, age 8-9• School C : 21 third grade students, age 8-9
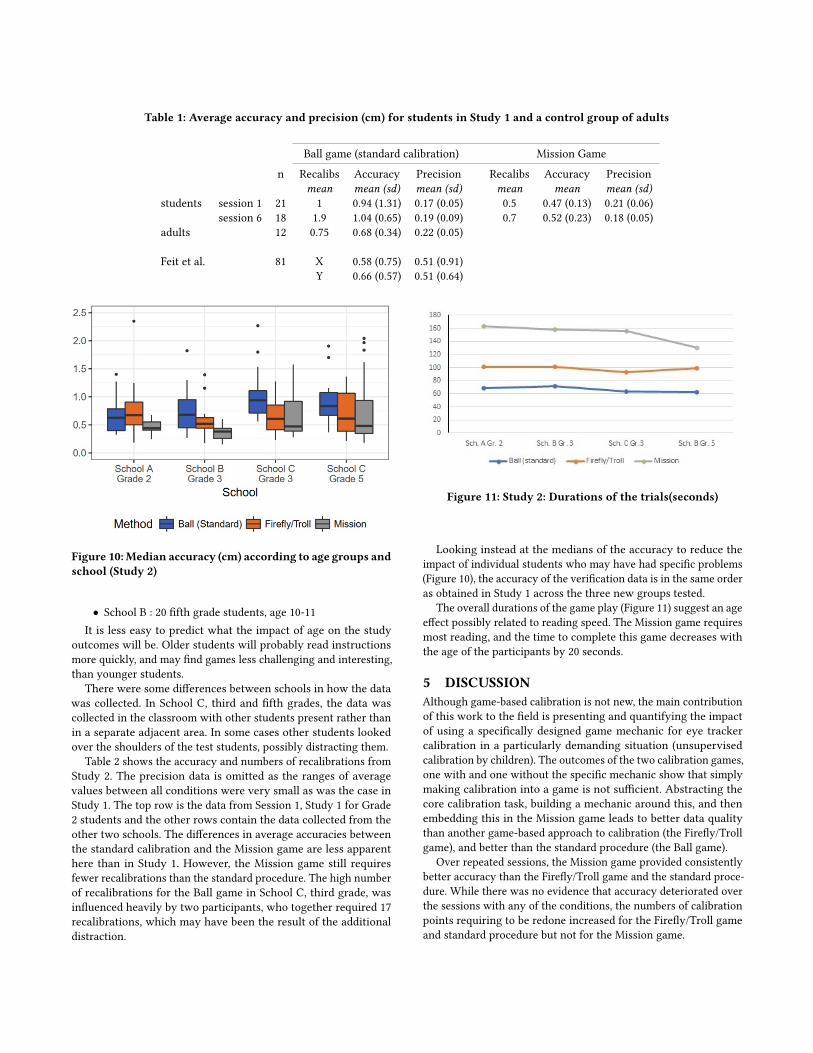
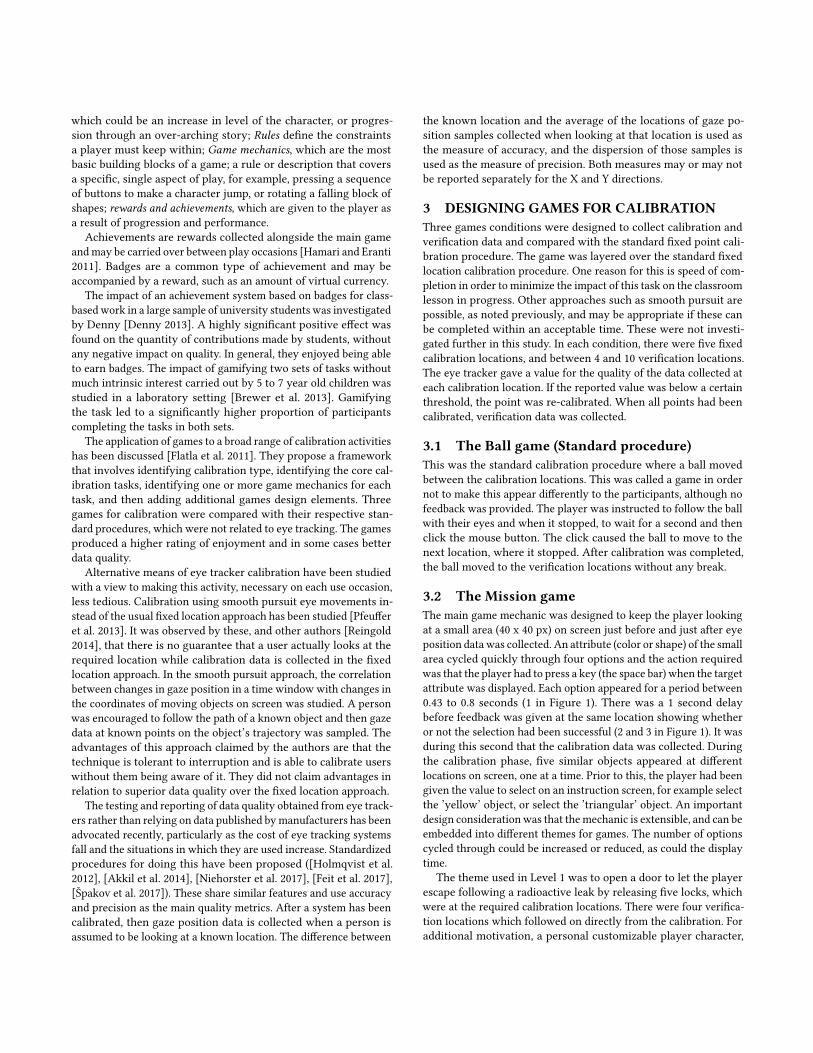
Table 1: Average accuracy and precision (cm) for students in Study 1 and a control group of adults
Ball game (standard calibration) Mission Gamen Recalibs Accuracy Precision Recalibs Accuracy Precision
mean mean (sd) mean (sd) mean mean mean (sd)students session 1 21 1 0.94 (1.31) 0.17 (0.05) 0.5 0.47 (0.13) 0.21 (0.06)
session 6 18 1.9 1.04 (0.65) 0.19 (0.09) 0.7 0.52 (0.23) 0.18 (0.05)adults 12 0.75 0.68 (0.34) 0.22 (0.05)
Feit et al. 81 X 0.58 (0.75) 0.51 (0.91)Y 0.66 (0.57) 0.51 (0.64)
Figure 10:Median accuracy (cm) according to age groups andschool (Study 2)
• School B : 20 fifth grade students, age 10-11It is less easy to predict what the impact of age on the study
outcomes will be. Older students will probably read instructionsmore quickly, and may find games less challenging and interesting,than younger students.
There were some differences between schools in how the datawas collected. In School C, third and fifth grades, the data wascollected in the classroom with other students present rather thanin a separate adjacent area. In some cases other students lookedover the shoulders of the test students, possibly distracting them.
Table 2 shows the accuracy and numbers of recalibrations fromStudy 2. The precision data is omitted as the ranges of averagevalues between all conditions were very small as was the case inStudy 1. The top row is the data from Session 1, Study 1 for Grade2 students and the other rows contain the data collected from theother two schools. The differences in average accuracies betweenthe standard calibration and the Mission game are less apparenthere than in Study 1. However, the Mission game still requiresfewer recalibrations than the standard procedure. The high numberof recalibrations for the Ball game in School C, third grade, wasinfluenced heavily by two participants, who together required 17recalibrations, which may have been the result of the additionaldistraction.
Figure 11: Study 2: Durations of the trials(seconds)
Looking instead at the medians of the accuracy to reduce theimpact of individual students who may have had specific problems(Figure 10), the accuracy of the verification data is in the same orderas obtained in Study 1 across the three new groups tested.
The overall durations of the game play (Figure 11) suggest an ageeffect possibly related to reading speed. The Mission game requiresmost reading, and the time to complete this game decreases withthe age of the participants by 20 seconds.
5 DISCUSSIONAlthough game-based calibration is not new, the main contributionof this work to the field is presenting and quantifying the impactof using a specifically designed game mechanic for eye trackercalibration in a particularly demanding situation (unsupervisedcalibration by children). The outcomes of the two calibration games,one with and one without the specific mechanic show that simplymaking calibration into a game is not sufficient. Abstracting thecore calibration task, building a mechanic around this, and thenembedding this in the Mission game leads to better data qualitythan another game-based approach to calibration (the Firefly/Trollgame), and better than the standard procedure (the Ball game).
Over repeated sessions, the Mission game provided consistentlybetter accuracy than the Firefly/Troll game and the standard proce-dure. While there was no evidence that accuracy deteriorated overthe sessions with any of the conditions, the numbers of calibrationpoints requiring to be redone increased for the Firefly/Troll gameand standard procedure but not for the Mission game.

Table 2: Average accuracy (cm) and Recalibrations - Study 2
Ball game (standard calibration) Firefly/Troll Mission Gamen Recalibs Accuracy Recalibs Accuracy Recalibs Accuracy
students mean mean (sd) mean mean (sd) mean (sd) mean (sd)School A, Grade 2 21 1.0 0.94 (1.31) 0.9 0.90 (0.77) 0.5 0.47 (0.13)School B, Grade 3 21 1.1 0.73 (0.39) 0.5 0.71 (0.71) 0.9 0.70 (1.59)School C, Grade 3 19 2.2 1.03 (0.44) 0.8 0.90 (1.15) 0.6 0.90 (1.20)School C, Grade 5 20 1.1 0.89 (0.39) 0.8 0.79 (0.60) 1.1 0.75 (0.63)
The data quality provided by the standard calibration carried outby adults using the same eye tracking equipment under supervisedlaboratory conditions provides a useful benchmark. While the dataquality of the unsupervised students was understandably muchworse than the supervised adults using the standard procedure, thedata quality provided by the Mission game was actually better thanthat obtained from the adults.
The framework advocated by Flatla et al. in Section 2 has beenshown to be very effective in this application, even though eyetracker calibration was not specifically addressed in their work.The essential calibration task of maintaining the gaze point at aseries of specific locations was abstracted and formed the basis fordesigning a game mechanic. Subsequently, a game that used thismechanic was designed, which included a reward and achievementsystem to promote motivation over several repeated sessions of use.Significantly, there was little or no emphasis on calibrating the eyetracker in describing the reason to the participants for playing thegames.
Making the distinction between the mechanic and the game inwhich it is embedded provides a good approach to the issue ofneeding to repeat the calibration every time the eye tracker is usedwhich could be several times a week in a school classroom. Differentgames and different levels within the same game can be designedaround the same mechanic. In addition to selecting color and shapeas attributes of the target object, for example, letters or numberscould be selected to make a password, provided that feedback aboutthe selection is given at exactly the same location as the object, aswas show in Figure 1. The number of options cycled through maybe changed to make the task more or less difficult, and the timeeach is exposed for can also be varied.
The system of rewards and achievements added to motivate im-proving performance over repeated occasions can be transferredbetween games. In this study, a customizable character was pro-vided together with the idea of current level and acquiring virtualcurrency to enable the individual to buy assets to further customizetheir character.
The second study where data quality outcomes were comparedbetween age groups and across schools shows that this approach tounsupervised calibration is valid in the second grade and upwardsin elementary schools. Further design work is needed to reducethe requirement for participants to read instructions. Then similartests need to be carried out using first grade students. Carrying outthe tests in the classroom as opposed to an adjacent room, as wasthe case in School C, showed that data quality may be affected byother students distracting the student while playing a game. This
highlights the need for field testing of gaze-enabled educationalaids under realistic conditions.
The design of the game or games needs to be such that the activ-ity does not occupy too much time as a proportion of a lesson. Theduration of the Mission game with verification in Session 6 was onaverage 100 seconds. Of this the actual calibration data collectiontook on average 23 seconds. Having established the benefits of us-ing the game mechanic, further work is needed to investigate howmuch the game duration can be reduced without compromisingengagement with the game. There is a case for making the verifica-tion phase a check on the data quality after calibration, in order totrigger a complete recalibration. However there is a danger that astudent may deliberately score badly to extend the game play time.
Seating in the classroom was an issue that caused significantproblems in terms of the height of the students’ eyes above the deskand the eye tracker. In Study 1, the seated eye height was too low.This was corrected by using cushions, which were not normallyused in the classroom. This was not a problem in Schools B and Cin Study 2 however. In another school that took part in one of ourprevious studies, parents were encouraged to provide a ’stabilityball’ for their children to sit on as this afforded postural benefits.One effect was that the students’ eye height above the desk wastoo great for an eye tracker. Changing the angle of the screen ledto reflections from interior lighting.
6 CONCLUSIONSThe study has shown a game with the core mechanic designedaround the need to keep the gaze point fixed for short periods atspecific locations on the screen is an effective means of encouragingelementary school students to undertake unsupervised calibrationof an eye tracker. The mechanic is essential to providing good dataquality. A calibration game without this mechanic did not deliverthe same data quality. The same mechanic can be embedded indifferent game themes meaning that it is not necessary to alwaysuse the same game for repeated calibrations. It was shown too thatthe game solution adopted is capable of motivating children ofdifferent ages with an elementary school. The issue of motivatingadults to undertake unsupervised careful calibration of eye trackingequipment built into personal computing equipment will need tobe addressed if the promise of ubiquitous gaze-based interactionis to be realized. Games may well offer an effective route to thisobjective.
ACKNOWLEDGMENTSWe would sincerely like to thank staff and students at Nuolialan,Lamminpää and Peltolammi elementary schools in the Tampereregion who took part in the study so enthusiastically, and, in par-ticular, Irja Kivikangas of Nuolialan School, and Sanna Salonen ofLamminpää School for their help. The work was supported by theAcademy of Finland under grant number 2501287895.
REFERENCESDeepak Akkil, Poika Isokoski, Jari Kangas, Jussi Rantala, and Roope Raisamo. 2014.
TraQuMe: A Tool for Measuring the Gaze Tracking Quality. In Proceedings of theSymposium on Eye Tracking Research and Applications (ETRA ’14). ACM, New York,NY, USA, 327–330. https://doi.org/10.1145/2578153.2578192
Robin Brewer, Lisa Anthony, Quincy Brown, Germaine Irwin, Jaye Nias, and BerthelTate. 2013. Using gamification to motivate children to complete empirical studies inlab environments. In Proceedings of the 12th International Conference on InteractionDesign and Children. ACM, 388–391.
Paul Denny. 2013. The Effect of Virtual Achievements on Student Engagement. InProceedings of the SIGCHI Conference on Human Factors in Computing Systems (CHI’13). ACM, New York, NY, USA, 763–772. https://doi.org/10.1145/2470654.2470763
Anna Maria Feit, Shane Williams, Arturo Toledo, Ann Paradiso, Harish Kulkarni,Shaun Kane, and Meredith Ringel Morris. 2017. Toward Everyday Gaze Input:Accuracy and Precision of Eye Tracking and Implications for Design. In Proceedingsof the 2017 CHI Conference on Human Factors in Computing Systems (CHI ’17). ACM,New York, NY, USA, 1118–1130. https://doi.org/10.1145/3025453.3025599
David R. Flatla, Carl Gutwin, Lennart E. Nacke, Scott Bateman, and Regan L. Mandryk.2011. Calibration Games: Making Calibration Tasks Enjoyable by Adding Moti-vating Game Elements. In Proceedings of the 24th Annual ACM Symposium on UserInterface Software and Technology (UIST ’11). ACM, New York, NY, USA, 403–412.https://doi.org/10.1145/2047196.2047248
Juho Hamari and Veikko Eranti. 2011. Framework for Designing and Evaluating GameAchievements.. In Digra Conference.
Kenneth Holmqvist, Marcus Nyström, and Fiona Mulvey. 2012. Eye Tracker DataQuality: What It is and How to Measure It. In Proceedings of the Symposium on EyeTracking Research and Applications (ETRA ’12). ACM, New York, NY, USA, 45–52.https://doi.org/10.1145/2168556.2168563
Anthony J. Hornof and Tim Halverson. 2002. Cleaning up systematic error in eye-tracking data by using required fixation locations. Behavior Research Methods,Instruments, & Computers 34, 4 (01 Nov 2002), 592–604. https://doi.org/10.3758/BF03195487
Diederick C. Niehorster, Tim H. W. Cornelissen, Kenneth Holmqvist, Ignace T. C.Hooge, and Roy S. Hessels. 2017. What to expect from your remote eye-trackerwhen participants are unrestrained. Behavior Research Methods (15 Feb 2017).https://doi.org/10.3758/s13428-017-0863-0
Ken Pfeuffer, Melodie Vidal, Jayson Turner, Andreas Bulling, and Hans Gellersen. 2013.Pursuit Calibration: Making Gaze Calibration Less Tedious and More Flexible. InProceedings of the 26th Annual ACM Symposium on User Interface Software andTechnology (UIST ’13). ACM, New York, NY, USA, 261–270. https://doi.org/10.1145/2501988.2501998
Janet C Read, SJ MacFarlane, and Chris Casey. 2002. Endurability, engagement andexpectations: Measuring children’s fun. In Interaction design and children, Vol. 2.Shaker Publishing Eindhoven, 1–23.
Eyal M. Reingold. 2014. Eye tracking research and technology: Towards objective mea-surement of data quality. Visual Cognition 22, 3-4 (2014), 635–652. https://doi.org/10.1080/13506285.2013.876481 arXiv:https://doi.org/10.1080/13506285.2013.876481PMID: 24771998.
Scott Rogers. 2014. Level Up! The Guide to Great Video Game Design (2nd ed.). Wiley.Oleg Špakov. 2012. Comparison of Eye Movement Filters Used in HCI. In Proceedings
of the Symposium on Eye Tracking Research and Applications (ETRA ’12). ACM, NewYork, NY, USA, 281–284. https://doi.org/10.1145/2168556.2168616
Oleg Špakov, Harri Siirtola, Howell Istance, and Kari-Jouko Räihä. 2017. Visualizingthe Reading Activity of People Learning to Read. Journal of Eye Movement Research10, 5 (2017). https://bop.unibe.ch/index.php/JEMR/article/view/3735
![Abstract arXiv:1905.00174v3 [cs.CV] 10 Jun 2019 · Unsupervised Temperature Scaling: An Unsupervised Post-Processing Calibration Method of Deep Networks Figure 1. M k subset division](https://img.pdfslide.us/doc/110x75/60621c5cb27b530a7d34c037/abstract-arxiv190500174v3-cscv-10-jun-2019-unsupervised-temperature-scaling.jpg)


![KinematicCalibrationofIndustrialRobotsBasedonDistance ... · 2021. 3. 26. · [16] reported a calibration method with a laser tracker to acquire data. e maximum position error of](https://img.pdfslide.us/doc/110x75/612911615c0bfa6a936f1087/kinematiccalibrationofindustrialrobotsbasedondistance-2021-3-26-16-reported.jpg)