Embed Size (px)
Citation preview
Enabling Event Tracing at Leadership-Class Scalethrough I/O Forwarding Middleware
Thomas Ilsche∗‡, Joseph Schuchart∗, Jason Cope†, Dries Kimpe†, Terry Jones‡,Andreas Knüpfer∗, Kamil Iskra†, Robert Ross†, Wolfgang E. Nagel∗, Stephen Poole‡
∗Technische Universität Dresden, ZIH 01062 Dresden, Germany{thomas.ilsche,joseph.schuchart,andreas.knuepfer,wolfgang.nagel}@tu-dresden.de†Argonne National Laboratory, 9700 South Cass Avenue, Argonne, IL 60439, USA
{copej,dkimpe,iskra,rross}@mcs.anl.gov‡Oak Ridge National Laboratory, Mailstop 5164, Oak Ridge, TN 37831, USA
{trjones,spoole}@ornl.gov
ABSTRACTEvent tracing is an important tool for understanding theperformance of parallel applications. As concurrency in-creases in leadership-class computing systems, the quantityof performance log data can overload the parallel file system,perturbing the application being observed. In this work wepresent a solution for event tracing at leadership scales. Weenhance the I/O forwarding system software to aggregateand reorganize log data prior to writing to the storage sys-tem, significantly reducing the burden on the underlying filesystem for this type of traffic. Furthermore, we augmentthe I/O forwarding system with a write buffering capabilityto limit the impact of artificial perturbations from log dataaccesses on traced applications. To validate the approach,we modify the Vampir tracing toolset to take advantage ofthis new capability and show that the approach increasesthe maximum traced application size by a factor of 5x tomore than 200,000 processes.
Categories and Subject DescriptorsD.2.5 [Software Engineering]: Testing and Debugging—Tracing ; D.4.3 [Operating Systems]: File Systems Man-agement—File organization; D.4.4 [Operating Systems]:Communications Management—Input/output
Keywordsevent tracing, I/O forwarding, atomic append
Copyright 2012 Association for Computing Machinery. ACM acknowl-edges that this contribution was authored or co-authored by an employee,contractor or affiliate of the U.S. Government. As such, the Government re-tains a nonexclusive, royalty-free right to publish or reproduce this article,or to allow others to do so, for Government purposes only.HPDC’12, June 18–22, 2012, Delft, The Netherlands.Copyright 2012 ACM 978-1-4503-0805-2/12/06 ...$10.00.
1. INTRODUCTIONPerformance analysis tools are a vital part of the HPC
software ecosystem. They provide insight into the runtimebehavior of parallel applications and guide performance op-timization activities toward the most promising or urgentaspects. Porting and tuning performance measurement toolsare essential since they must be efficient and must not per-turb the runtime behavior of the analyzed application, evenat full scale.
The rising levels of concurrency in leadership-class sys-tems present a number of challenges to performance analysistools. One challenge to scaling these tools is efficiently stor-ing trace data. These tools often generate large amountsof data and must execute efficiently at full scale. Tradi-tional access patterns for these tools, such as file per pro-cess, file per thread, and synchronous I/O, do not scale wellpast tens of thousands of processes. Such data access pat-terns require excessive use of file metadata operations andoverwhelm leadership-class storage systems. SynchronousI/O may cause unnecessary delays in trace data collectionand skew application execution. Alternative access patterns,such as a shared file pattern, may alleviate metadata bottle-necks but inject artificial synchronization into the applica-tion. Therefore, a unique data organization is desired thatexploits the log like I/O behavior of performance analysistools, allows for uncoordinated access to a shared file frommultiple processes, and tolerates lazy I/O semantics.
To achieve and sustain application event trace recording atfull leadership-class scale, we investigated several I/O opti-mizations to support high-performance, scalable, and unco-ordinated access of event trace data generated by the Vampirtoolset [17]. We observed that the uncoordinated I/O pat-terns generated by the VampirTrace and Open Trace For-mat (OTF) tools could be transparently optimized at anintermediate file I/O aggregation layer, known as the I/Oforwarding layer. We integrated the I/O Forwarding Scal-ability Layer (IOFSL) [2, 23] with the VampirTrace/OTFtoolset. Also as part of contributions of this paper, we im-plemented optimizations and new capabilities within IOFSLto reorganize and optimize the captured VampirTrace/OTFI/O patterns while preserving the independent I/O require-
ments of these tracing tools. These new features include adistributed atomic file append capability and a write buffer-ing capability. By taking advantage of characteristics of theevent trace workload and augmenting our HPC I/O stack tobetter support it, we have reduced the stress that the traceI/O workload places on HPC storage systems. Furthermore,we have reduced the impact of HPC I/O storage systems onthe tracing tools.
Our investigation and evaluation resulted in significantimprovements to the VampirTrace and OTF software stack.We increased the VampirTrace and OTF tracing infrastruc-ture scalability by 5x (a 40, 000 core to 200, 000 core capabil-ity improvement), generated a trace containing 941 billionevents at an average aggregate trace data storage rate of13.3 billion events per second, and demonstrated that cou-pling IOFSL and the Vampir toolset yields a performanceanalysis framework suitable for end users on leadership-classcomputing systems. Overall, we have shown that the entiresoftware stack including trace generation, middleware, post-processing, and analysis can be utilized to analyze a parallelapplication consisting of 200,448 processes.
The remainder of this paper is organized as follows. Thegeneral I/O requirements of performance analysis tools andthe Vampir toolset I/O needs are described in Section 2. Anoverview of IOFSL and optimizations relevant to tracing isprovided in Section 3. Section 4 describes the integrationand scalability improvement efforts. The proposed conceptsare evaluated on a leadership-class machine, and the result-ing performance measurements are analyzed in Section 5.An overview of related work is given in Section 6. Con-clusions and insights into future work are summarized inSection 7.
2. THE VAMPIR TOOLSETThe Vampir toolset is a sophisticated performance anal-
ysis infrastructure for parallel programs that use combina-tions of MPI, OpenMP, PThreads, CUDA, and OpenCL.It consists of the Vampir GUI for interactive post-mortemvisualization, the VampirServer for parallel analysis, theVampirTrace instrumentation and runtime recording sys-tem, and the Open Trace Format as the file format andaccess library. The Vampir toolset relies on event tracerecording, which allows the most detailed analysis of theparallel behavior of target applications. First, the Vampirtoolset performs instrumentation of the target applicationusing various techniques. During run time, the monitoringcomponent collects the instrumented events together withsignificant properties. These include entry/exit events foruser code subroutines, message send/receive events, collec-tive communication events, shared memory synchronization,and I/O events. A single Vampir event needs approximately10 to 50 bytes for its encoding in the buffer. Typically, eventfrequencies range from 100 to 100, 000 per second (withproper settings). A parallel run with 10, 000 processes orthreads for 10 minutes results in data sizes of 6 · 109 to3 · 1013 bytes (approx. 5.6 GB to 27 TB1). The trace buffersize should not exceed the local main memory size minusthe memory required by the target application; otherwisethe application behavior will be severely distorted. Typi-cal sizes are 10 MB to 1 GB per process or thread. The
1In this paper, we use 1 MB = 220B, 1 GB = 230B, and1 TB = 240B.
event trace data is written to a set of OTF files and is thenready for post-mortem investigation with the Vampir GUI.By default, VampirTrace and OTF use a file-per-thread I/Opattern to store data to minimize coordination.
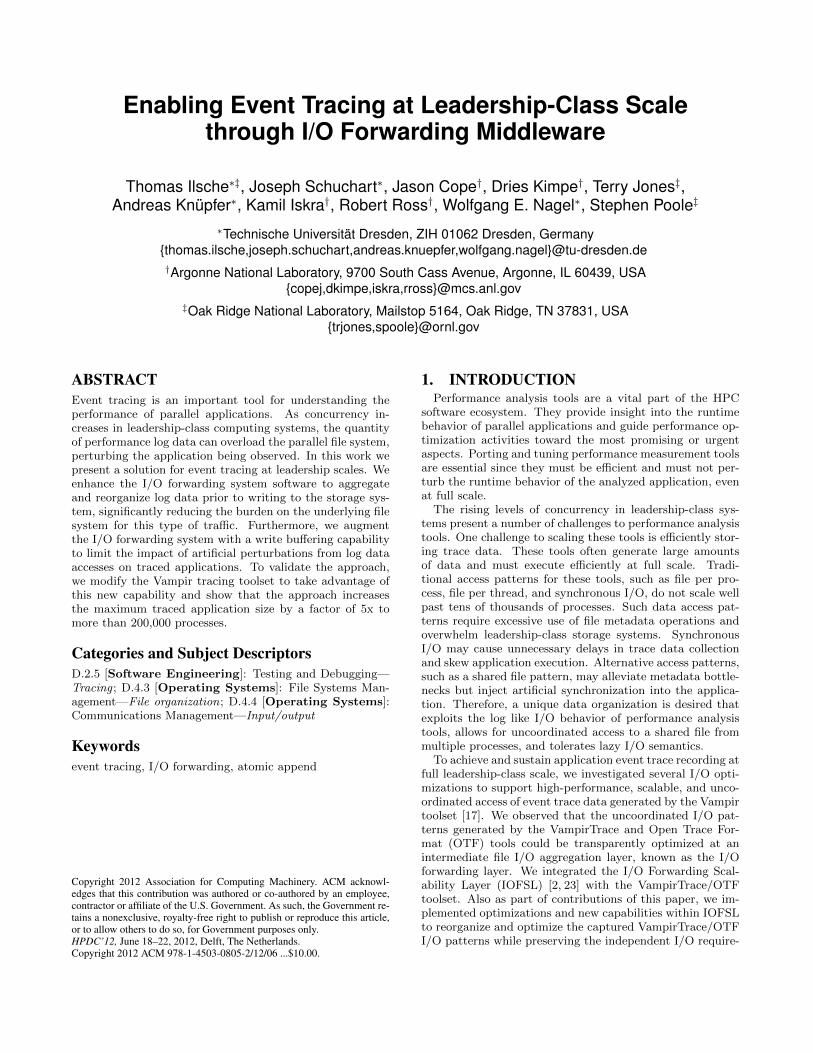
Figure 1: The VampirTrace data flow.
Figure 1 gives an overview of VampirTrace’s data flow.Additional information about Vampir, VampirTrace, andOTF is provided in our prior work [17]. When the Vampir-Trace monitoring component captures the parallel runtimebehavior of the target application, it strives to impose min-imal perturbation. Triggered by events of interest, the run-time recording layer stores the event information togetherwith vital properties (precise time stamp, event-specific prop-erties, performance counter values if configured) to a preal-located memory buffer. The recording is performed indepen-dently for every process or thread into local buffers. In orderto avoid artificial synchronization of the target application,buffers are never shared between processes or threads.
2.1 I/O Patterns in VampirTraceThe VampirTrace buffer can be written to an OTF file in
several ways. The most general one is to flush the buffer assoon as it is filled. If the measurement library cannot ensureenough space for an event in the buffer, the application isdelayed, and the data is written to a file through the OTFlibrary. These buffer flush phases are clearly marked in thetrace so that their effect is not mistaken for stray behaviorof the target application. However, they can delay otherprocesses waiting for messages or synchronization in the ap-plication, unless the buffer limit is reached at the same spotin the application for all processes (i.e., each process gener-ated the same number of events). This becomes an issue forlarger scale and tightly coupled applications.
Alternatively, VampirTrace can use collective MPI opera-tions to trigger synchronized buffer flushes by piggybackingwork on application collective operations. For each collec-tive operation, the measurement environment communicates
the maximum buffer level. Once a threshold is reached,all processes enter a flush phase. All synchronous flushesand synchronizations are captured in the trace and clearlymarked for analysis. An additional barrier after the flushmakes sure the processes resume simultaneously, avoidingan indirect impact on the application behavior.
Having a single flush at the end of the recording (typi-cally during an MPI_Finalize wrapper) is preferred whenpossible because it removes trace I/O from the applicationexecution. For this case, the event buffer must be able tohold all events generated during the application execution.This can be achieved by reducing the total event count, forexample, by using filters or tracing only specific iterationsof the application. In addition, transparent compression us-ing zlib in the OTF layer helps reducing the file sizes. It isapplied only to the output during a buffer flush to keep theperturbation minimal at the expense of the required memorybuffer space.
In general, the number of buffer flushes per process can belimited to avoid uncontrolled use of storage space. The spe-cialized cases for flushing largely improve the perturbationdue to I/O, but it cannot be guaranteed that a collectiveoperation triggers a buffer flush before the buffer is full. Itis also difficult to choose appropriate settings that do notrequire buffer flushes. Therefore, VampirTrace may needto fall back to the general uncoordinated buffer flush thatprevents loss of data at the cost of a performance impact.Traditional collective I/O optimizations and methods relyon implicit synchronization. This required synchronizationdistorts the measurement and is therefore not an appropriatesolution for VampirTrace’s data collection. Also, the possi-bility of processes or threads being created during runtimemakes it impossible to know how many participants theremight be for collective I/O at any point in time.
2.2 I/O Challenges and SolutionsThe original configuration of VampirTrace imposed two
I/O challenges that prevented it from tracing applicationsrunning at full-scale on leadership-class systems. First, theoften nearly simultaneous buffer flushes of many processesor threads increase I/O bandwidth pressure on the I/O sub-system. This pressure can delay trace data storage and skewthe application trace measurements. The storage targets canget overwhelmed with inefficient, nearly random workloadsthat can sap over 60% of their peak performance. Second,the metadata load for this configuration is high because ofthe creation of many individual files and the allocation of filesystem blocks for a large number of I/O operations. For ex-ample, ORNL’s JaguarPF is in principle capable of openingone file per process even at the scale of 224, 000 processes,taking around 45 seconds (David Dillow, personal communi-cation, September 20, 2011). In production usage however,such operations have been observed to take five minutes [30].Parallel file creation requests at a high rate will impact allother users and jobs on the machine. VampirTrace/OTFsupports the use of node-local storage for the intermediatetrace I/O. This involves copying the files from local to globaldirectories after the measurement. However, node-local stor-age is not available on many current large-scale systems andthe situation will not change on the next generation systems(Cray XK6, Blue Gene/Q) either.
To address these challenges, we identified several oppor-tunities that allow VampirTrace to store its trace data col-
lections more efficiently while minimizing the overhead ofthe data accesses on the traced applications. We found thata shared file access pattern may be better suited for large-scale applications than is the file-per-thread access pattern.This approach significantly reduces the metadata load ofthe file-per-thread access pattern. Since writing to a sharedfile from many processes requires coordination among thoseprocesses, we opted to store trace data collections in mul-tiple files, where the total number of files is far less thanthe number of traced processes or threads. For storing thetrace data collections, we identified an append-only stream-ing access pattern that is easier for parallel file systems tohandle than are random I/O patterns. To further reduce theimpact of file system performance on trace data collection,we recognized that a write buffering strategy can isolate filesystem performance from the trace data collection storage.
The capabilities required by the improved VampirTraceI/O access pattern are not readily available or adequatelysupported by vendor-supplied I/O software stacks. The nec-essary capabilities missing from these stacks include trans-parent aggregation of uncoordinated I/O requests to a set offiles, portable atomic append of file data, and write buffer-ing. These capabilities can be implemented within I/O for-warding tools, such as IOFSL. Our I/O forwarding approachprovides a convenient solution that integrates with the exist-ing VampirTrace/OTF infrastructure and promises to scalemuch farther than today’s high-end systems.
3. THE IOFSL I/O FORWARDING LAYERThe goal of I/O forwarding is to bridge computation and
storage systems in leadership-class computers. Using thissoftware, all application file I/O requests are shipped to ded-icated resources that aggregate and execute the requests.This approach allows I/O forwarding layers to bridge com-pute nodes, networks, and storage systems that are phys-ically disconnected, such as on the IBM Blue Gene sys-tems [32]. I/O forwarding middleware aggregates file I/Orequests from multiple distributed sources (I/O forwardingclients) to a smaller number of I/O handlers (the I/O for-warding servers). The I/O forwarding server delegates andexecutes the requests on behalf of the clients. Since the I/Oforwarding layer has access to all the file I/O requests, onecan implement file I/O optimizations on both coordinatedand uncoordinated file access patterns. These optimizationsinclude coalescing, merging, transforming, and buffering I/Orequests.
IOFSL [2, 23] is a high-performance, portable I/O for-warding layer for leadership-class computing systems. Forcommunication between the IOFSL clients and servers, theBuffered Message Interface (BMI) library [5] is used. BMIsupports native access to the SeaStar2+ network used on theCray XT platforms using the Portals API and to the IBMBlue Gene/P tree network using ZOID [14]. TCP is sup-ported as a general transport. IOFSL provides a statelessI/O application programming interface called ZOIDFS thatapplications can use to directly communicate with IOFSLservers. It also provides compatibility layers for POSIX andMPI-IO programming interfaces.
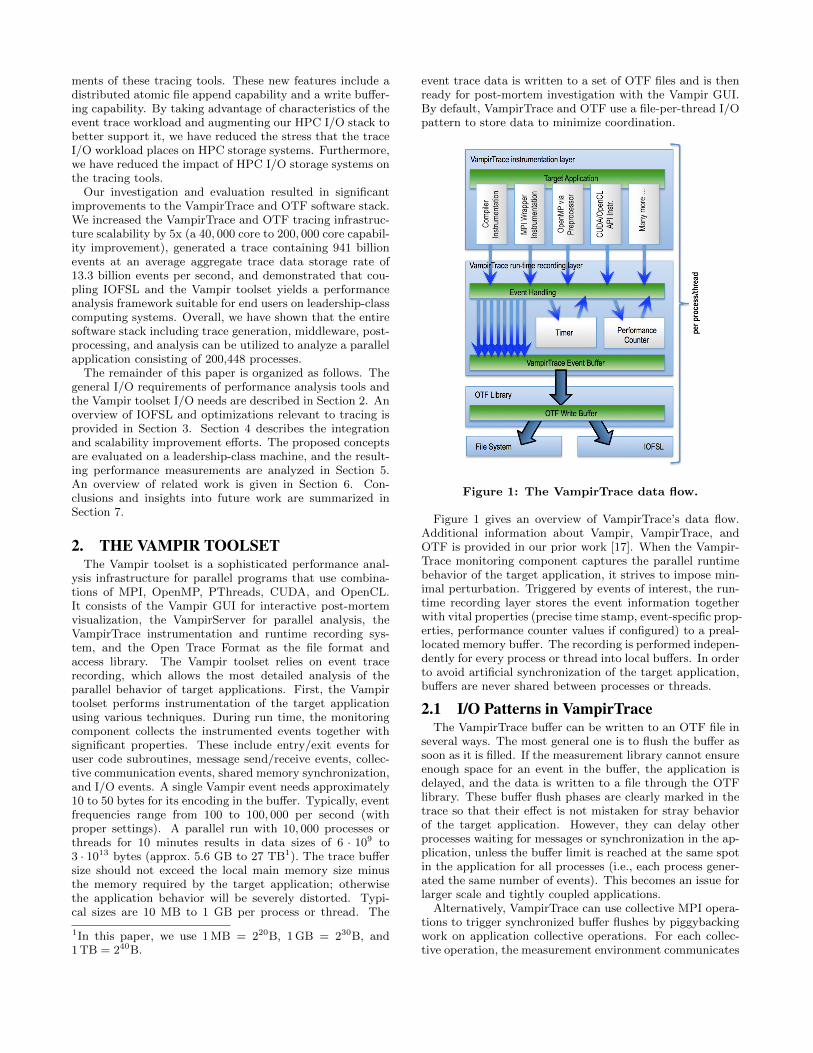
IOFSL is an ideal location to prototype and evaluate newor existing HPC I/O capabilities. Figure 2 illustrates atypical HPC software stack on leadership-class systems andwhere I/O forwarding fits into it. IOFSL interacts directlywith the parallel file system. Implementing our enhance-
Application
High-Level I/O Library
I/O Middleware
I/O Forwarding
Parallel File System
I/O Hardware
High-Level I/O Librarymaps applicationabstractions onto storageabstractions and providesdata portability.
HDF5, Parallel netCDF, ADIOS
I/O Forwardingbridges between applicationtasks and storage systemto provide aggregation foruncoordinated I/O.
IOFSL, IBM ciod, Cray DVS
I/O Middlewareorganizes accesses frommany processes, especiallythose using collective I/O.
MPI-IO
Parallel File Systemmaintains logical space andprovides efficient access todata.
PVFS, pNFS, PanFS,GPFS, Lustre
Figure 2: Overview of the HPC I/O software stack.
ments we present in this paper required no changes to vendor-supplied systems software; all of our I/O enhancements wereimplemented within IOFSL. Since IOFSL is positioned justabove the file system, our enhancements to IOFSL can affectall applications using the I/O software stack.
In Section 2.2, we identified several file optimizations thatcan improve the performance and scalability of the tracedata generation of VampirTrace. These improvements in-clude a write buffering strategy to quickly offload trace datafrom the application compute nodes and an atomic file ap-pend capability to reduce random I/O workloads to the filesystem. In this section, we describe how we implementedthese capabilities within IOFSL.
The IOFSL write buffering capability provides nonblock-ing file I/O enhancements to the IOFSL server and client.This capability transforms blocking I/O operations into non-blocking ones while requiring minimal changes to the ap-plication and no changes to the ZOIDFS API. It relaxesthe data consistency semantics in order to achieve higherI/O throughputs for the application. To implement this,we modified the file write data path in the IOFSL serverto signal operation completion to the client before initiatingthe file write operation. Once the I/O forwarding server re-ceives the client data for a non-blocking operation, the datais buffered within the server and the client I/O operationis completed. The client is then free to release or reuse itstransmitted data buffer since the server is now responsiblefor completing the I/O operation for the client. The I/Orequest will complete as soon as the server has resourcesto process the request or when the client forces all pend-ing nonblocking I/O operations to complete using a commitoperation. This behavior allows the IOFSL server to trans-parently manage nonblocking I/O operations initiated byclients.
IOFSL’s atomic append capability allows multiple clientsto share the same output file without client-side coordinationand supports tools that exhibit log like data access patterns.This file append capability is a distributed and atomic I/Ooperation. We developed several new IOFSL features tosupport distributed atomic file append operations. IOFSLservers now provide a distributed hash table that is usedto track the end-of-file offset for unique files. This datastructure provides a fetch and update operation, so that thecurrent file offset can be retrieved and updated. The dis-tributed storage of file handles allows IOFSL to scatter anddecentralize the file offset data. We also developed a mech-anism for IOFSL servers to communicate with each other.
Originally, IOFSL provided a client-server communicationmodel. The server to sever communication capability allowsan IOFSL server to query remote IOFSL servers and retrievethe end-of-file offset information. As a consequence, IOFSLclients are not required to contact multiple IOFSL serversto obtain and update file offset information. Additionally,the IOFSL server coalesces multiple atomic append requeststo limit the amount of server to server traffic. The atomicappend capability can be used by any number of IOFSLservers, including a local server mode when data files arenot shared between IOFSL servers.
There are several benefits to our atomic append approach.Clients can append data to a file that is simultaneously be-ing written to by other clients and I/O forwarding servers.IOFSL clients do not require prior knowledge of the end-of-file position and simply need to deliver the data to bewritten into the file to the server. This capability effectivelyallows applications to stream data to the IOFSL servers,which manage data placement within a file. The server re-turns to the client the file offset where the data was written.This capability is similar to MPI shared file pointers andthe O APPEND mode provided by the POSIX I/O API.The novelty of our approach is in supporting a distributedand portable append functionality — O APPEND does notwork in a multi node environment like a parallel computingsystem. Since this capability is implemented within IOFSL,it can be used on any system where IOFSL can run, re-gardless of the underlying file system, operating system, ornetwork. For write buffering operations, the IOFSL servercan also return the state of completed operations. The clientand application can use this information to construct an in-dex of the data accesses within the file and determine thestate of pending nonblocking operations.
4. INTEGRATING OTF WITH IOFSLThe OTF layer provides a single integration point between
the VampirTrace stack and IOFSL. Since all trace I/O hap-pens in this layer, this permits a portable solution that isusable for other applications based on OTF. We chose to usethe ZOIDFS API because it provides additional capabilitiesthat are not present in the IOFSL POSIX translation layers.
The primary integration goal was to reduce the number offiles generated by the Vampir tracing infrastructure. Insteadof storing n OTF event streams in n files, we aggregate thestreams into m files, where m � n. m can vary based onthe tracing configuration. For example, m could be equalto the number of IOFSL servers (one file per IOFSL server)or be smaller (files shared between the servers). Figure 3illustrates the file aggregation and integration of the usedsoftware layers.
To accomplish this, all ZOIDFS write operations use thenovel atomic-append feature of IOFSL. This allows arbitrarysubsets of event trace streams to share the same file withoutany coordination on the OTF side. IOFSL ensures thatblocks from the same source stay in their original order butmakes no guarantees with respect to global ordering; thisapproach enables additional optimizations.
The coordination of the blocks and their positions in theshared file is done by IOFSL and the results of this activityis reported to OTF. Every OTF stream2 collects the file
2An OTF stream abstracts the events from a single threador process.
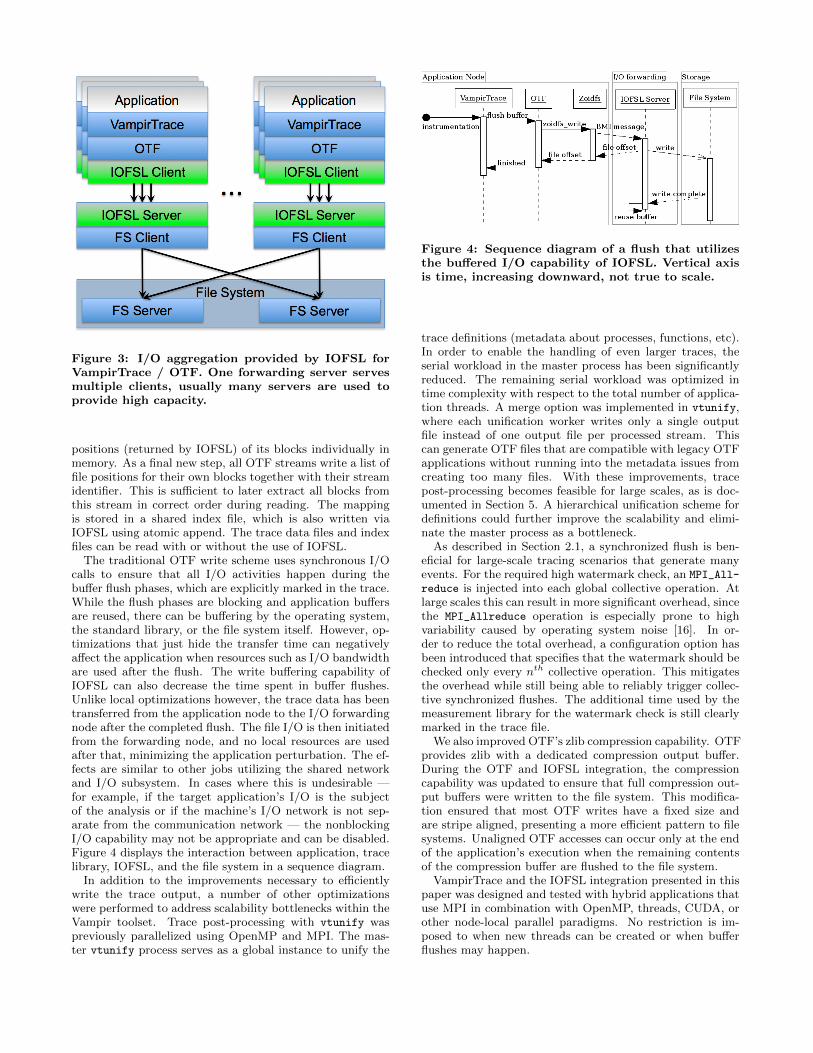
Figure 3: I/O aggregation provided by IOFSL forVampirTrace / OTF. One forwarding server servesmultiple clients, usually many servers are used toprovide high capacity.
positions (returned by IOFSL) of its blocks individually inmemory. As a final new step, all OTF streams write a list offile positions for their own blocks together with their streamidentifier. This is sufficient to later extract all blocks fromthis stream in correct order during reading. The mappingis stored in a shared index file, which is also written viaIOFSL using atomic append. The trace data files and indexfiles can be read with or without the use of IOFSL.
The traditional OTF write scheme uses synchronous I/Ocalls to ensure that all I/O activities happen during thebuffer flush phases, which are explicitly marked in the trace.While the flush phases are blocking and application buffersare reused, there can be buffering by the operating system,the standard library, or the file system itself. However, op-timizations that just hide the transfer time can negativelyaffect the application when resources such as I/O bandwidthare used after the flush. The write buffering capability ofIOFSL can also decrease the time spent in buffer flushes.Unlike local optimizations however, the trace data has beentransferred from the application node to the I/O forwardingnode after the completed flush. The file I/O is then initiatedfrom the forwarding node, and no local resources are usedafter that, minimizing the application perturbation. The ef-fects are similar to other jobs utilizing the shared networkand I/O subsystem. In cases where this is undesirable —for example, if the target application’s I/O is the subjectof the analysis or if the machine’s I/O network is not sep-arate from the communication network — the nonblockingI/O capability may not be appropriate and can be disabled.Figure 4 displays the interaction between application, tracelibrary, IOFSL, and the file system in a sequence diagram.
In addition to the improvements necessary to efficientlywrite the trace output, a number of other optimizationswere performed to address scalability bottlenecks within theVampir toolset. Trace post-processing with vtunify waspreviously parallelized using OpenMP and MPI. The mas-ter vtunify process serves as a global instance to unify the
Figure 4: Sequence diagram of a flush that utilizesthe buffered I/O capability of IOFSL. Vertical axisis time, increasing downward, not true to scale.
trace definitions (metadata about processes, functions, etc).In order to enable the handling of even larger traces, theserial workload in the master process has been significantlyreduced. The remaining serial workload was optimized intime complexity with respect to the total number of applica-tion threads. A merge option was implemented in vtunify,where each unification worker writes only a single outputfile instead of one output file per processed stream. Thiscan generate OTF files that are compatible with legacy OTFapplications without running into the metadata issues fromcreating too many files. With these improvements, tracepost-processing becomes feasible for large scales, as is doc-umented in Section 5. A hierarchical unification scheme fordefinitions could further improve the scalability and elimi-nate the master process as a bottleneck.
As described in Section 2.1, a synchronized flush is ben-eficial for large-scale tracing scenarios that generate manyevents. For the required high watermark check, an MPI_All-
reduce is injected into each global collective operation. Atlarge scales this can result in more significant overhead, sincethe MPI_Allreduce operation is especially prone to highvariability caused by operating system noise [16]. In or-der to reduce the total overhead, a configuration option hasbeen introduced that specifies that the watermark should bechecked only every nth collective operation. This mitigatesthe overhead while still being able to reliably trigger collec-tive synchronized flushes. The additional time used by themeasurement library for the watermark check is still clearlymarked in the trace file.
We also improved OTF’s zlib compression capability. OTFprovides zlib with a dedicated compression output buffer.During the OTF and IOFSL integration, the compressioncapability was updated to ensure that full compression out-put buffers were written to the file system. This modifica-tion ensured that most OTF writes have a fixed size andare stripe aligned, presenting a more efficient pattern to filesystems. Unaligned OTF accesses can occur only at the endof the application’s execution when the remaining contentsof the compression buffer are flushed to the file system.
VampirTrace and the IOFSL integration presented in thispaper was designed and tested with hybrid applications thatuse MPI in combination with OpenMP, threads, CUDA, orother node-local parallel paradigms. No restriction is im-posed to when new threads can be created or when bufferflushes may happen.
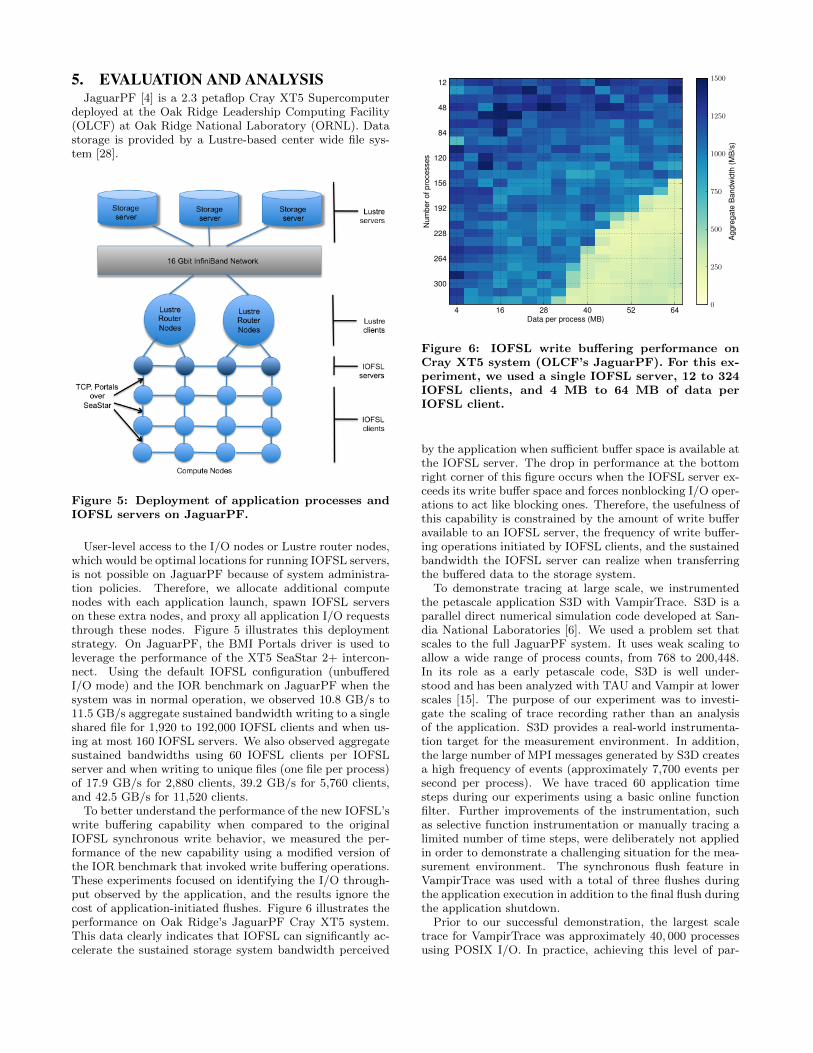
5. EVALUATION AND ANALYSISJaguarPF [4] is a 2.3 petaflop Cray XT5 Supercomputer
deployed at the Oak Ridge Leadership Computing Facility(OLCF) at Oak Ridge National Laboratory (ORNL). Datastorage is provided by a Lustre-based center wide file sys-tem [28].
Figure 5: Deployment of application processes andIOFSL servers on JaguarPF.
User-level access to the I/O nodes or Lustre router nodes,which would be optimal locations for running IOFSL servers,is not possible on JaguarPF because of system administra-tion policies. Therefore, we allocate additional computenodes with each application launch, spawn IOFSL serverson these extra nodes, and proxy all application I/O requeststhrough these nodes. Figure 5 illustrates this deploymentstrategy. On JaguarPF, the BMI Portals driver is used toleverage the performance of the XT5 SeaStar 2+ intercon-nect. Using the default IOFSL configuration (unbufferedI/O mode) and the IOR benchmark on JaguarPF when thesystem was in normal operation, we observed 10.8 GB/s to11.5 GB/s aggregate sustained bandwidth writing to a singleshared file for 1,920 to 192,000 IOFSL clients and when us-ing at most 160 IOFSL servers. We also observed aggregatesustained bandwidths using 60 IOFSL clients per IOFSLserver and when writing to unique files (one file per process)of 17.9 GB/s for 2,880 clients, 39.2 GB/s for 5,760 clients,and 42.5 GB/s for 11,520 clients.
To better understand the performance of the new IOFSL’swrite buffering capability when compared to the originalIOFSL synchronous write behavior, we measured the per-formance of the new capability using a modified version ofthe IOR benchmark that invoked write buffering operations.These experiments focused on identifying the I/O through-put observed by the application, and the results ignore thecost of application-initiated flushes. Figure 6 illustrates theperformance on Oak Ridge’s JaguarPF Cray XT5 system.This data clearly indicates that IOFSL can significantly ac-celerate the sustained storage system bandwidth perceived
Figure 6: IOFSL write buffering performance onCray XT5 system (OLCF’s JaguarPF). For this ex-periment, we used a single IOFSL server, 12 to 324IOFSL clients, and 4 MB to 64 MB of data perIOFSL client.
by the application when sufficient buffer space is available atthe IOFSL server. The drop in performance at the bottomright corner of this figure occurs when the IOFSL server ex-ceeds its write buffer space and forces nonblocking I/O oper-ations to act like blocking ones. Therefore, the usefulness ofthis capability is constrained by the amount of write bufferavailable to an IOFSL server, the frequency of write buffer-ing operations initiated by IOFSL clients, and the sustainedbandwidth the IOFSL server can realize when transferringthe buffered data to the storage system.
To demonstrate tracing at large scale, we instrumentedthe petascale application S3D with VampirTrace. S3D is aparallel direct numerical simulation code developed at San-dia National Laboratories [6]. We used a problem set thatscales to the full JaguarPF system. It uses weak scaling toallow a wide range of process counts, from 768 to 200,448.In its role as a early petascale code, S3D is well under-stood and has been analyzed with TAU and Vampir at lowerscales [15]. The purpose of our experiment was to investi-gate the scaling of trace recording rather than an analysisof the application. S3D provides a real-world instrumenta-tion target for the measurement environment. In addition,the large number of MPI messages generated by S3D createsa high frequency of events (approximately 7,700 events persecond per process). We have traced 60 application timesteps during our experiments using a basic online functionfilter. Further improvements of the instrumentation, suchas selective function instrumentation or manually tracing alimited number of time steps, were deliberately not appliedin order to demonstrate a challenging situation for the mea-surement environment. The synchronous flush feature inVampirTrace was used with a total of three flushes duringthe application execution in addition to the final flush duringthe application shutdown.
Prior to our successful demonstration, the largest scaletrace for VampirTrace was approximately 40, 000 processesusing POSIX I/O. In practice, achieving this level of par-
allelism is already difficult because of substantial overheadduring file generation and the impact on other users of thefile system.
In our demonstration we utilized the full stack that is in-volved in trace generation: application (S3D), VampirTrace,OTF, IOFSL, the BMI Portals driver for network transfers,and Lustre as a target file system. We have conducted mul-tiple experiments tracing up to 200,448 application coresrunning S3D and using a set of 672 I/O forwarding nodesresulting in 2,688 files. The largest generated trace size was4.2 TB of compressed data containing 941 billion events.The total time spent on trace I/O, including forwardingserver connection setup, file creation, open, sync, and close,was 71 seconds with write buffering I/O, for a total appli-cation run time of 22 minutes. Trace I/O was synchronizedamong the MPI processes so this time includes the timespent in barriers when waiting for other processes to finishtheir writing. It therefore represents the total extension ofapplication run time due to trace I/O. On average it took5.5 seconds for each process to establish the connection tothe forwarding server and to open the four shared outputfiles (definitions file and events file, plus an index file foreach). Some processes were delayed by up to 32 secondsbecause of the massive stress on I/O forwarding nodes re-sulting from write operations from other processes. Theintermediate buffer flushes are not affected by connectioninitialization, file open times, and final commit and there-fore show much better individual performance. With writebuffering enabled, aggregated write rates of up to 154 GB/sor 33.5 billion events per second were observed, as recordedby the tracing measurement environment during individualflushes. We observed this high bandwidth because all tracedata fit into the IOFSL servers’ buffers. The cost for theclient to flush this data was limited by the IOFSL serverperformance. This bandwidth result also includes the syn-chronization of all processes as well as the overhead of OTFand compression.
For comparison, we ran a full-scale experiment using theIOFSL enhancements and unbuffered I/O. The total traceI/O time was 122 seconds, yielding a sustained aggregatebandwidth of 35.3 GB/s. This further indicates that writebuffering reduces the I/O overhead observed by the tracinginfrastructure. The IOFSL capability buffers trace data atthe IOFSL server and overlaps application tracing with tracedata storage. In this test series, the trace size per processremains almost constant.
The post-processing (vtunify) for such a trace requiresapproximately 27 minutes but only a fraction of the re-sources of the application (10,752 workers). This is a re-quired step, regardless of the use of IOFSL. In the post-processing, IOFSL was not utilized since only 10,754 files3
are created in this step.This large-scale demonstration shows that trace record-
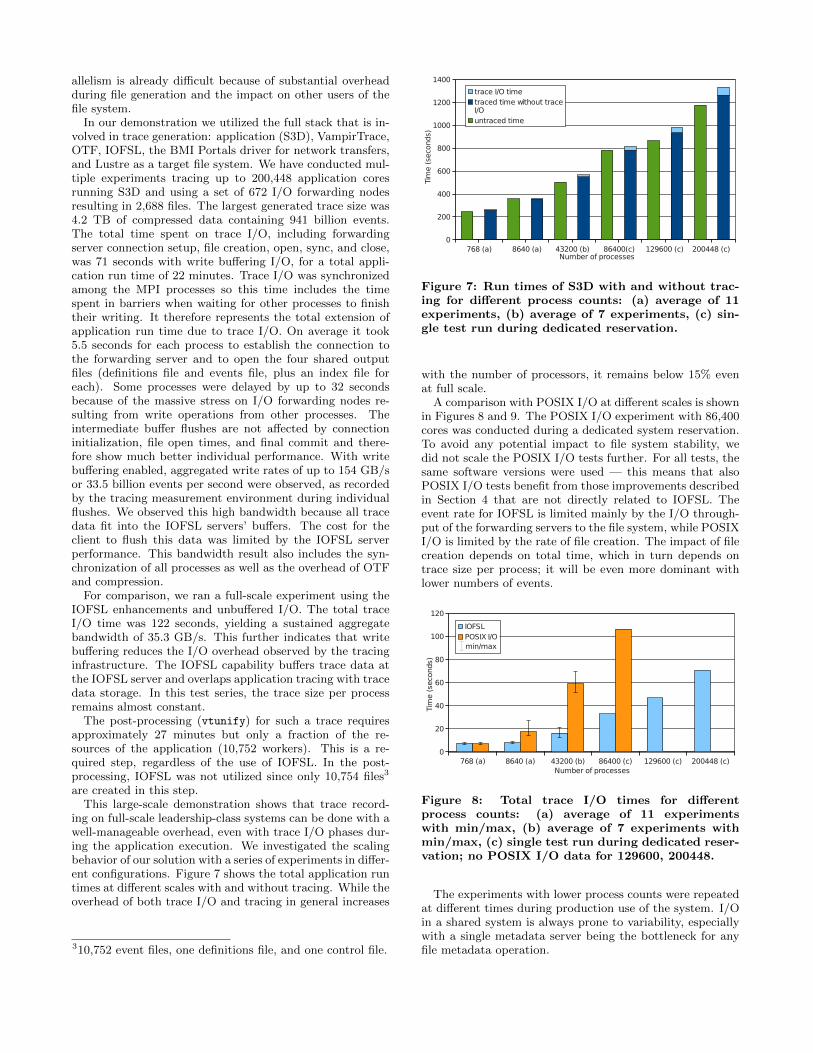
ing on full-scale leadership-class systems can be done with awell-manageable overhead, even with trace I/O phases dur-ing the application execution. We investigated the scalingbehavior of our solution with a series of experiments in differ-ent configurations. Figure 7 shows the total application runtimes at different scales with and without tracing. While theoverhead of both trace I/O and tracing in general increases
310,752 event files, one definitions file, and one control file.
768 (a) 8640 (a) 43200 (b) 86400(c) 129600 (c) 200448 (c)0
200
400
600
800
1000
1200
1400
trace I/O timetraced time without trace I/Ountraced time
Number of processes
Tim
e (
seco
nds)
Figure 7: Run times of S3D with and without trac-ing for different process counts: (a) average of 11experiments, (b) average of 7 experiments, (c) sin-gle test run during dedicated reservation.
with the number of processors, it remains below 15% evenat full scale.
A comparison with POSIX I/O at different scales is shownin Figures 8 and 9. The POSIX I/O experiment with 86,400cores was conducted during a dedicated system reservation.To avoid any potential impact to file system stability, wedid not scale the POSIX I/O tests further. For all tests, thesame software versions were used — this means that alsoPOSIX I/O tests benefit from those improvements describedin Section 4 that are not directly related to IOFSL. Theevent rate for IOFSL is limited mainly by the I/O through-put of the forwarding servers to the file system, while POSIXI/O is limited by the rate of file creation. The impact of filecreation depends on total time, which in turn depends ontrace size per process; it will be even more dominant withlower numbers of events.
768 (a) 8640 (a) 43200 (b) 86400 (c) 129600 (c) 200448 (c)0
20
40
60
80
100
120
IOFSLPOSIX I/O
Number of processes
Tim
e (
seco
nds)
min/max
Figure 8: Total trace I/O times for differentprocess counts: (a) average of 11 experimentswith min/max, (b) average of 7 experiments withmin/max, (c) single test run during dedicated reser-vation; no POSIX I/O data for 129600, 200448.
The experiments with lower process counts were repeatedat different times during production use of the system. I/Oin a shared system is always prone to variability, especiallywith a single metadata server being the bottleneck for anyfile metadata operation.
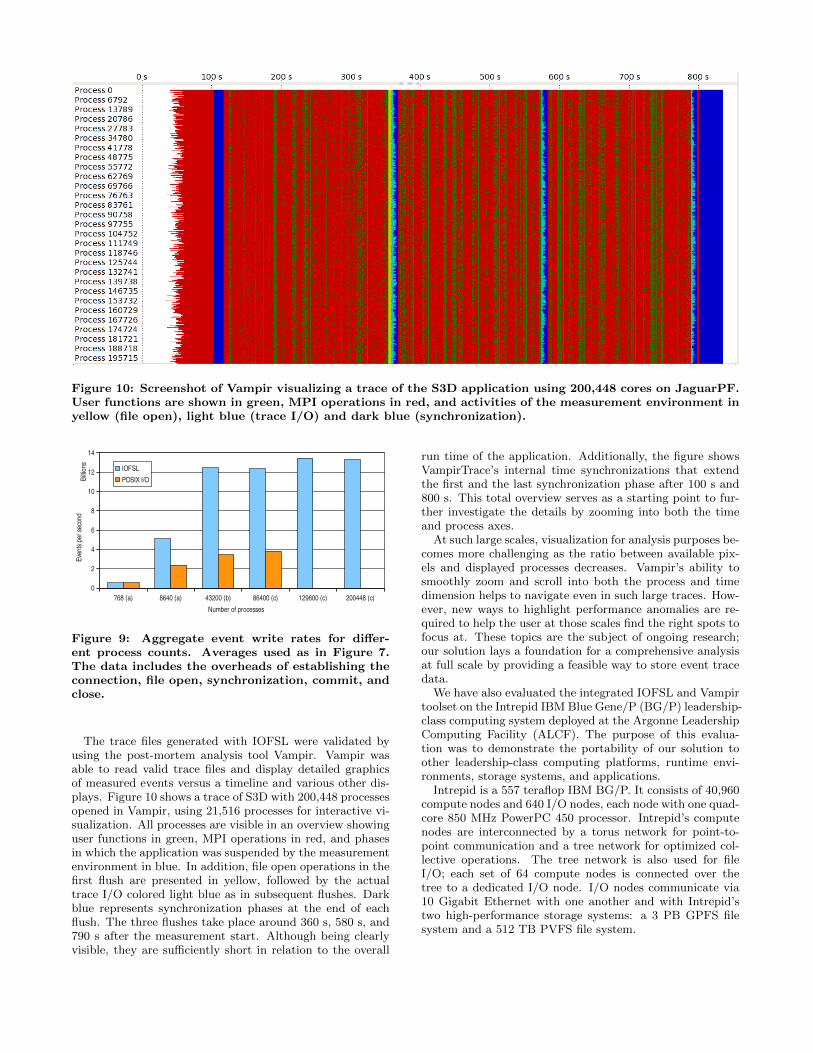
Figure 10: Screenshot of Vampir visualizing a trace of the S3D application using 200,448 cores on JaguarPF.User functions are shown in green, MPI operations in red, and activities of the measurement environment inyellow (file open), light blue (trace I/O) and dark blue (synchronization).
768 (a) 8640 (a) 43200 (b) 86400 (c) 129600 (c) 200448 (c)0
2
4
6
8
10
12
14
IOFSL
POSIX I/O
Number of processes
Even
ts pe
r sec
ond
Billio
ns
Figure 9: Aggregate event write rates for differ-ent process counts. Averages used as in Figure 7.The data includes the overheads of establishing theconnection, file open, synchronization, commit, andclose.
The trace files generated with IOFSL were validated byusing the post-mortem analysis tool Vampir. Vampir wasable to read valid trace files and display detailed graphicsof measured events versus a timeline and various other dis-plays. Figure 10 shows a trace of S3D with 200,448 processesopened in Vampir, using 21,516 processes for interactive vi-sualization. All processes are visible in an overview showinguser functions in green, MPI operations in red, and phasesin which the application was suspended by the measurementenvironment in blue. In addition, file open operations in thefirst flush are presented in yellow, followed by the actualtrace I/O colored light blue as in subsequent flushes. Darkblue represents synchronization phases at the end of eachflush. The three flushes take place around 360 s, 580 s, and790 s after the measurement start. Although being clearlyvisible, they are sufficiently short in relation to the overall
run time of the application. Additionally, the figure showsVampirTrace’s internal time synchronizations that extendthe first and the last synchronization phase after 100 s and800 s. This total overview serves as a starting point to fur-ther investigate the details by zooming into both the timeand process axes.
At such large scales, visualization for analysis purposes be-comes more challenging as the ratio between available pix-els and displayed processes decreases. Vampir’s ability tosmoothly zoom and scroll into both the process and timedimension helps to navigate even in such large traces. How-ever, new ways to highlight performance anomalies are re-quired to help the user at those scales find the right spots tofocus at. These topics are the subject of ongoing research;our solution lays a foundation for a comprehensive analysisat full scale by providing a feasible way to store event tracedata.
We have also evaluated the integrated IOFSL and Vampirtoolset on the Intrepid IBM Blue Gene/P (BG/P) leadership-class computing system deployed at the Argonne LeadershipComputing Facility (ALCF). The purpose of this evalua-tion was to demonstrate the portability of our solution toother leadership-class computing platforms, runtime envi-ronments, storage systems, and applications.
Intrepid is a 557 teraflop IBM BG/P. It consists of 40,960compute nodes and 640 I/O nodes, each node with one quad-core 850 MHz PowerPC 450 processor. Intrepid’s computenodes are interconnected by a torus network for point-to-point communication and a tree network for optimized col-lective operations. The tree network is also used for fileI/O; each set of 64 compute nodes is connected over thetree to a dedicated I/O node. I/O nodes communicate via10 Gigabit Ethernet with one another and with Intrepid’stwo high-performance storage systems: a 3 PB GPFS filesystem and a 512 TB PVFS file system.
Intrepid’s system administration policies permit users tocustomize the runtime environment of the system. For ourevaluation of IOFSL and VampirTrace/OTF, these policiesallowed us to deploy the IOFSL servers on the I/O nodes.To do so, we had to replace IBM’s ciod I/O forwarding soft-ware with the ZOID [14] BG/P tree network driver to facil-itate high-throughput and low-latency communication be-tween user-space processes on the compute and I/O nodes,and boot ZeptoOS [31] operating system on the BG/P com-pute nodes (replacing IBM’s CNK). Additional informationon how IOFSL is deployed on BG/P systems is provided inour prior work [23].
We successfully traced the Radix-k [26] image composit-ing algorithm on Intrepid at a variety of scales using theintegrated IOFSL and VampirTrace/OTF toolset. Asidefrom small adjustments to the infrastructure deployment,the software stack required no additional changes to run onthe system. Our evaluation on Intrepid demonstrates thatwe can trace additional applications, run our toolsets in dif-ferent runtime environments and systems, and interact withdifferent storage systems. Since our initial target platformwas JaguarPF, assessing the performance and scalability ofthese tools on IBM BG/P systems is a work in progress.
6. RELATED WORKThe performance analysis toolset Scalasca faced similar
problems to ours when handling large numbers of trace files.Recently, the scalability of Scalasca was improved up to300, 000 cores [30]. For tests on a large IBM BG/P system,the SIONlib library was used. It uses a special multifile for-mat that contains additional metadata managing chunks ofdata from different processes within one file [9]. With SION-lib, multifile creation is a collective operation. This wouldpose a significant limitation to VampirTrace with respect tothe dynamic threading model.
The POSIX I/O standard was designed before the adventof wide-scale parallelism. As such, it suffers from many fun-damental characteristics that preclude it from scenarios suchas multiple writers updating the same file — a common needfor parallel I/O oriented activity [13].
New I/O research efforts within standards-oriented activ-ities have recognized this fact and are actively working onAPIs appropriate for extreme-scale parallelism [13,25]. Onesuch API is pNFS [12], an extension to NFSv4 designed toovercome NFS scalability and performance barriers.
MPI-IO [19] provides a more sophisticated I/O abstrac-tion than POSIX. It includes collective operations and fileviews, which enable coordinated and concurrent access with-out locking [7]. It does not directly provide an “n-to-m”mapping from clients to output files. OTF’s management ofmixed blocks in shared files would be difficult to implementon top of MPI-IO, because most implementations (includ-ing the popular ROMIO) do not return accurate current filesizes unless a synchronizing collective is used.
The I/O Delegate Cache System (IODC) [22] is a cachingmechanism for MPI-IO that resolves cache coherence issuesand alleviates the lock contention of I/O servers. IOFSL of-fers similar capabilities but is located below MPI-IO in theI/O software stack, providing a dedicated abstract devicedriver enabling unmodified applications to take full advan-tage of its optimizations.
The I/O forwarding concept was introduced within theSandia Cplant project [24], which used a forwarding frame-
work based on an extended NFS protocol. IOFSL extendsthe target environment imagined by Cplant to much largerscales and higher performance through a more sophisticatedprotocol permitting additional optimizations.
Decoupled and Asynchronous Remote Transfers (DART)[8] and DataStager [1] achieve high-performance transfers onCray XT5 using dedicated data staging nodes. Unlike ourapproach, which is transparent to the applications that usePOSIX and MPI-IO interfaces, DART requires applicationsto use a custom API.
Similarly, Adaptable I/O System (ADIOS) [18] providesperformance improvements through strategies such as pre-fetch and write-behind, based on application-specific con-figuration files read at startup; this information also helpsADIOS minimize the memory footprint during the course ofthe application run. In contrast, our approach requires noknowledge of the application behavior in advance, and it issituated at a lower level in the I/O software stack.
PLFS [3] is a file system translation layer developed forHPC environments to alleviate scaling problems associatedwith large numbers of clients writing to a single file. Likeour solution, they interpose middleware between the clientapplication and the underlying file system through the useof FUSE. Their solution, which is aimed at checkpointingand similar activities for architectures such as Los AlamosNational Laboratory’s Roadrunner (3,060 nodes), transpar-ently creates a container structure consisting of subdirecto-ries for each writer as well as index information and othermetadata for each corresponding data file. Since our so-lution is focused on supporting hundreds of thousands ofclients or more, we have chosen to aggregate I/O operationsin the middleware, thus resulting in fewer metadata oper-ations in the underlying parallel file system. Furthermore,our IOFSL-based solution focuses on transforming uncoor-dinated file accesses to many unique files, such as a file perprocess or thread I/O pattern, into a shared file per groupof processes I/O pattern. Our solution reduces file systemresource contention generated by shared file access patterns(such as file stripe lock contention or false sharing) and elim-inates file system metadata overheads generated by I/O pat-terns with one file per process or thread (such as frequentfile creation, stat, or attribute access operations) at extremescales.
IOFSL work extends the earlier ZOID efforts [14]. ZOID isa Blue Gene-specific function call forwarding infrastructurethat is part of the ZeptoOS project. The I/O forwardingprotocol used by IOFSL was first prototyped in ZeptoOS.IOFSL is a mature, portable implementation that integrateswith common HPC file systems and also works on the CrayXT series and Linux clusters.
While recent work has addressed the use of non-blockingI/O at the I/O forwarding layer [29], our work focuses onproviding a portable and transparent to applications, write-buffering based, and high-performance non-blocking I/O ca-pability in HPC environments. Furthermore, non-blockingfile I/O capabilities are not provided by existing I/O for-warding tools, including IBM’s ciod or Cray’s DVS.
In other areas of computer science research, augmenta-tions to existing I/O software that take advantage of spe-cific workload characteristics have been shown effective inimproving performance for important workloads. For ex-ample, in the Internet services domain, the Google File Sys-tem provides specialized append operations that allow many
tasks to contribute to an output file in an uncoordinatedmanner [10].
7. CONCLUSIONS AND FUTURE WORKThis paper described the use of I/O forwarding middle-
ware for scalable event trace recording. Through an integra-tion into the OTF library, the Vampir toolset benefits from anew atomic append capability that is provided by the IOFSLI/O forwarding layer. Using the Vampir tracing infrastruc-ture, we demonstrated that this solution enables softwaretracing at full-scale on leadership-class systems (200,448 pro-cesses). A comprehensive trace-based analysis is now feasi-ble for pattern recognition, post-processing, and visualiza-tion systems. Within the context of this paper, we haveadressed the increasing trace data volumes at large scales atI/O level. Further ongoing work investigates advanced fil-tering, selective tracing and semantic runtime compressionto provide additional benefits for tracing large applicationruns. We show that even at medium scales, tracing overheadcan be significantly reduced with our solution. The benefitfor scalability results from reducing the massive amount ofmetadata file system requests from all application processesto a much lower number. Further improvements on perfor-mance comes from utilizing write buffering, which, thanksto being implemented on separate I/O forwarding nodes,does not perturb the application processes. We improvedthe scalability of the Vampir toolset to leverage the entireperformance analysis workflow.
While these results meet our immediate needs and objec-tives, this effort has led us to consider further related linesof inquiry. We will pursue more advanced aggregate mem-ory footprint optimizations to yield more available memoryto user applications. While we have addressed the data col-lection challenges in this paper and presented a solution tothis problem, we do not address how to effectively visualizetrace data for applications running at extreme scales. Thisinformation visualization challenge will be addressed as ourwork progresses. We plan to couple the data collection toolsand techniques presented in this paper with recent MPI andI/O visualization tools that focus on extreme scale event andtrace data collections [20,21].
The capabilities described in this paper are also applicableto other use cases beyond improving VampirTrace’s I/O andcan be implemented within other I/O forwarding tools. Thenew IOFSL capabilities can improve the I/O performanceof tools that generate per-process logs. Thus, these capa-bilities are applicable to massively parallel applications thatexhibit log like data storage patterns (such as Qbox’s [11]shared file pointer object capability), data-intensive streamprocessing tools (such as LOFAR’s real-time signal process-ing pipeline [27]), and high-level I/O libraries that allow un-limited dimensionality or enlargement of variable data struc-tures (such as chunked data storage in HDF5). While welimited our demonstration of these capabilities to IOFSL,the capabilities are sufficiently generic and can be imple-mented within other production-quality I/O forwarding lay-ers, such as IBM’s ciod and Cray’s DVS. If these capabilitieswere implemented within these production tools, they couldhave a substantial impact on the HPC community’s abil-ity to understand applications running on leadership-classsystems.
The OLCF and ALCF are in the process of upgradingtheir leadership-class computing resources. The new Titan
Cray XK6 supercomputer at OLCF will consist of 299,008CPU cores and 18,688 GPUs, whereas Mira, a 800,000 CPUcore IBM Blue Gene/Q system, will be deployed at ALCF.Both centers will upgrade the storage systems that servetheir leadership-class computing resources. While we areconfident our toolsets will scale on these systems, we willre-evaluate the scalability and performance of our tools onthese new platforms as they are deployed. Moreover, we planto further investigate the IOFSL and OTF/VampirTraceconfiguration space on these systems so that we can identifyoptimal infrastructure configurations for performance anal-ysis I/O workloads.
AcknowledgmentsWe thank Ramanan Sankaran (ORNL) for providing a work-ing version of S3D as well as a benchmark problem set forJaguarPF. We are very grateful to Matthias Jurenz for hisassistance on VampirTrace as well as Matthias Weber andRonald Geisler for their support for Vampir. The IOFSLproject is supported by the DOE Office of Science and Na-tional Nuclear Security Administration (NNSA). This re-search used resources of the Argonne Leadership Comput-ing Facility at Argonne National Laboratory and the OakRidge Leadership Computing Facility at Oak Ridge NationalLaboratory, which are supported by the Office of Science ofthe U.S. Department of Energy under contracts DE-AC02-06CH11357 and DE-AC05-00OR22725, respectively.
The general enhancement of the VampirTrace and Vampirtools at TU Dresden for full-size runs on leadership-classHPC systems is supported with funding and cooperation byORNL and UT-Battelle.
8. REFERENCES[1] Abbasi, H., Wolf, M., Eisenhauer, G., Klasky,
S., Schwan, K., and Zheng, F. DataStager:Scalable data staging services for petascaleapplications. In Proceedings of the 18th ACMInternational Symposium on High PerformanceDistributed Computing (HPDC) (2009), pp. 39–48.
[2] Ali, N., Carns, P., Iskra, K., Kimpe, D., Lang,S., Latham, R., Ross, R., Ward, L., andSadayappan, P. Scalable I/O forwarding frameworkfor high-performance computing systems. InProceedings of the 11th IEEE International Conferenceon Cluster Computing (CLUSTER) (2009).
[3] Bent, J., Gibson, G., Grider, G., McClelland,B., Nowoczynski, P., Nunez, J., Polte, M., andWingate, M. PLFS: A checkpoint filesystem forparallel applications. In Proceedings of 21stACM/IEEE International Conference for HighPerformance Computing, Networking, Storage andAnalysis (SC) (2009).
[4] Bland, A., Kendall, R., Kothe, D., Rogers, J.,and Shipman, G. Jaguar: The world’s most powerfulcomputer. In Proceedings of the 51st Cray User GroupMeeting (CUG) (2009).
[5] Carns, P., Ligon III, W., Ross, R., andWyckoff, P. BMI: A network abstraction layer forparallel I/O. In Proceedings of the 19th IEEEInternational Parallel and Distributed ProcessingSymposium, Workshop on CommunicationArchitecture for Clusters (CAC) (2005).
[6] Chen, J. H., Choudhary, A., de Supinski, B.,DeVries, M., Hawkes, E. R., Klasky, S., Liao,W. K., Ma, K. L., Mellor-Crummey, J.,Podhorszki, N., Sankaran, R., Shende, S., andYoo, C. S. Terascale direct numerical simulations ofturbulent combustion using S3D. ComputationalScience & Discovery 2, 1 (2009), 015001.
[7] Ching, A., Choudhary, A., Coloma, K., Liao,W., Ross, R., and Gropp, W. Noncontiguous I/Oaccess through MPI-IO. In Proceedings of the 3rdIEEE/ACM International Symposium on ClusterComputing and the Grid (CCGrid) (2003),pp. 104–111.
[8] Docan, C., Parashar, M., and Klasky, S. DART:A substrate for high speed asynchronous data IO. InProceedings of the 17th International Symposium onHigh Performance Distributed Computing (HPDC)(2008).
[9] Frings, W., Wolf, F., and Petkov, V. Scalablemassively parallel I/O to task-local files. InProceedings of 21st ACM/IEEE InternationalConference for High Performance Computing,Networking, Storage and Analysis (SC) (2009).
[10] Ghemawat, S., Gobioff, H., and Leung, S. TheGoogle File System. SIGOPS Operating SystemsReview 37 (Oct. 2003), 29–43.
[11] Gygi, F., Duchemin, I., Donadio, D., and Galli,G. Practical algorithms to facilitate large-scalefirst-principles molecular dynamics. Journal ofPhysics: Conference Series 180, 1 (2009).
[12] Hildebrand, D., and Honeyman, P. Exportingstorage systems in a scalable manner with pNFS. InProceedings of the 22nd IEEE / 13th NASA GoddardConference on Mass Storage Systems and Technologies(MSST) (2005), pp. 18–27.
[13] IEEE POSIX Standard 1003.1 2004 Edition.http://www.opengroup.org/onlinepubs/000095399/
functions/write.html.
[14] Iskra, K., Romein, J. W., Yoshii, K., andBeckman, P. ZOID: I/O-forwarding infrastructurefor petascale architectures. In Proceedings of the 13thACM SIGPLAN Symposium on Principles andPractice of Parallel Programming (PPoPP) (2008),pp. 153–162.
[15] Jagode, H., Dongarra, J., Alam, S., Vetter, J.,Spear, W., and Malony, A. D. A holistic approachfor performance measurement and analysis forpetascale applications. In Proceedings of the 9thInternational Conference on Computational Science(ICCS) (2009), vol. 2, pp. 686–695.
[16] Jones, T., Dawson, S., Neely, R., Tuel, W.,Brenner, L., Fier, J., Blackmore, R., Caffrey,P., and Maskell, B. Improving the scalability ofparallel jobs by adding parallel awareness. InProceedings of the 15th ACM/IEEE InternationalConference on High Performance Networking andComputing (SC) (2003).
[17] Knupfer, A., Brunst, H., Doleschal, J., Jurenz,M., Lieber, M., Mickler, H., Muller, M. S., andNagel, W. E. The Vampir performance analysistool-set. In Tools for High Performance Computing
(2008), M. Resch, R. Keller, V. Himmler, B. Krammer,and A. Schulz, Eds., Springer Verlag, pp. 139–155.
[18] Lofstead, J. F., Klasky, S., Schwan, K.,Podhorszki, N., and Jin, C. Flexible IO andintegration for scientific codes through the adaptableIO system (ADIOS). In Proceedings of the 6thInternational Workshop on Challenges of LargeApplications in Distributed Environments (CLADE)(2008), pp. 15–24.
[19] MPI Forum. MPI-2: Extensions to theMessage-Passing Interface.http://www.mpi-forum.org/docs/docs.html, 1997.
[20] Muelder, C., Gygi, F., and Ma, K.-L. Visualanalysis of inter-process communication for large-scaleparallel computing. IEEE Transactions onVisualization and Computer Graphics 15, 6 (2009),1129–1136.
[21] Muelder, C., Sigovan, C., Ma, K.-L., Cope, J.,Lang, S., Iskra, K., Beckman, P., and Ross, R.Visual analysis of I/O system behavior for high-endcomputing. In Proceedings of the 3rd InternationalWorkshop on Large-Scale System and ApplicationPerformance (LSAP) (2011).
[22] Nisar, A., Liao, W., and Choudhary, A. Scalingparallel I/O performance through I/O delegate andcaching system. In Proceedings of 20th ACM/IEEEInternational Conference for High PerformanceComputing, Networking, Storage and Analysis (SC)(2008).
[23] Ohta, K., Kimpe, D., Cope, J., Iskra, K., Ross,R., and Ishikawa, Y. Optimization techniques at theI/O forwarding layer. In Proceedings of the 12th IEEEInternational Conference on Cluster Computing(CLUSTER) (2010).
[24] Pedretti, K., Brightwell, R., and Williams, J.CplantTM runtime system support for multi-processorand heterogeneous compute nodes. In Proceedings ofthe 4th IEEE International Conference on ClusterComputing (CLUSTER) (2002), pp. 207–214.
[25] Petascale Data Storage Institute.http://www.pdsi-scidac.org/.
[26] Peterka, T., Goodell, D., Ross, R., Shen,H.-W., and Thakur, R. A configurable algorithm forparallel image-compositing applications. InProceedings of 21st ACM/IEEE InternationalConference for High Performance Computing,Networking, Storage and Analysis (SC) (2009).
[27] Romein, J. Fcnp: Fast I/O on the Blue Gene/P. InParallel and Distributed Processing Techniques andApplications (PDPTA’09) (2009).
[28] Shipman, G., Dillow, D., Oral, S., and Wang, F.The Spider center wide file system; from concept toreality. In Proceedings of the 51st Cray User GroupMeeting (CUG) (2009).
[29] Vishwanath, V., Hereld, M., Iskra, K., Kimpe,D., Morozov, V., Papka, M., Ross, R., andYoshii, K. Accelerating I/O forwarding in IBM BlueGene/P systems. In Proceedings of 22nd ACM/IEEEInternational Conference for High PerformanceComputing, Networking, Storage and Analysis (SC)(2010).

[30] Wylie, B. J. N., Geimer, M., Mohr, B., Bohme,D., Szebenyi, Z., and Wolf, F. Large-scaleperformance analysis of Sweep3D with the Scalascatoolset. Parallel Processing Letters 20, 4 (2010),397–414.
[31] Yoshii, K., Iskra, K., Naik, H., Beckman, P., andBroekema, P. C. Performance and scalabilityevaluation of ‘Big Memory’ on Blue Gene Linux.International Journal of High Performance ComputingApplications 25, 2 (2011), 148–160.
[32] Yu, H., Sahoo, R. K., Howson, C., Almasi, G.,Castanos, J. G., Gupta, M., Moreira, J. E.,Parker, J. J., Engelsiepen, T. E., Ross, R. B.,Thakur, R., Latham, R., and Gropp, W. D. Highperformance file I/O for the Blue Gene/Lsupercomputer. In Proceedings of the 12thInternational Symposium on High-PerformanceComputer Architecture (HPCA) (2006), pp. 187–196.