Embed Size (px)
Citation preview

The Vital Signs trademark is used with permission from Toronto Community Foundation.
SAINT JOHN, MONTREAL, OTTAWA, TORONTO, WATERLOO REGION,
SUDBURY, CALGARY, RED DEER, MEDICINE HAT,
VANCOUVER, AND VICTORIA
Community foundations taking the pulse of Canadian communities. National Report2007VitalSigns®

Local Reports: Vital Signs CommunitiesIn 2007, Vital Signs reports are being issued in 11 communities: Saint John, Montreal, Ottawa, Toronto, Waterloo Region, Sudbury, Calgary, Red Deer, Medicine Hat, Vancouver, and Victoria. The list will continue to grow in 2008. See the local reports at www.vitalsignscanada.ca
Vital Signs is a powerful tool. It zeros in on where communities are doing well and where improvement is needed. It engages citizens in ranking the priority issues that need to be addressed.
Community foundations see enormous value for donors and the entire community in Vital Signs. Measuring the vitality of Canadian communities in critical areas helps community foundations:• Increase the effectiveness of our grantmaking• Better inform our donors about pressing local issues and opportunities• Assist ourselves in making connections between individuals and groups to address those issues
With Vital Signs data and all the players at the table, communities can find creative, multi-sector solutions to their most important concerns.
National Report: Vital Signs CanadaVital Signs Canada provides the national data on each 2007 indicator and a context for the local, more detailed reports in Vital Signs communities. This year, the national findings in three of the ten issue areas demanded extra attention, and in those areas we provide more context, raise concerns, and highlight action examples across the country.
An expanded on-line version of this report that includes footnotes and links to source documents is available at www.vitalsignscanada.ca
IndicatorsVital Signs communities have agreed to report on ten common issue areas. Then each community adds to that set, according to local priorities.Common indicators are being used in each issue area, on a rotating basis.
“The Vital Signs report is contributing to deeper understanding of the bigpicture issues and opportunities we have in Vancouver, on the part of bothcitizens and decision-makers.” – Judy Rogers, City Manager, The City of Vancouver
Vital Signs is an annual community check-up conducted by community foundations across Canada that measures the vitality of our communities, identifies significant trends, and assigns grades in at least ten areas
critical to quality of life. The Vital Signs project was originally developed by of the Toronto CommunityFoundation and is coordinated nationally by Community Foundations of Canada.
Issue Area 2007 Indicator
Learning Proportion of population with completed post-secondary educationWork Unemployment rateBelonging and Leadership Volunteer rateGetting Started in Our Community Unemployment rate of immigrantsHousing Average housing prices as a proportion of median incomeSafety Property crime rateArts and Culture Employment in cultural industriesHealth and Wellness Physicians per capitaGap Between Rich and Poor Overall poverty rateEnvironment Greenhouse gas emissions

Vital Signs | National Report 1
Canada’s Vital Signs also show we’re acountry of growing disparity. Betweenrich and poor. Between those who haveopportunity and those who have not.
More than 20% of our population stilllives in poverty. Aboriginal povertyremains at unacceptable levels. Newimmigrants are twice as likely as otherCanadians to experience poverty, despitebringing more credentials than ever tothis country. And as the gap betweenrich and poor widens, homeownership isbecoming an impossible dream for manyCanadians.
On the environmental front, the pictureis not encouraging. Canada’s greenhousegas emissions continue to rise. We areone of the biggest per capita producersof carbon dioxide in the world.
As a nation, we are at a crossroads.Canada has an opportunity to be aworld leader in multiculturalism, insocial justice, and in environmentalresponsibility. We have the resourcesand the skills to do so. Do we have thecollective will? Can we be a model forother nations without first improving thelives of our own citizens?
Community foundations across Canadaare searching for ways to come to gripswith these questions in partnership withour communities. We made grants of$137 million in 2006 to charitableorganizations working in every field ofinterest. Now, by taking the pulse of our communities through Vital Signs, we are highlighting both the assets andthe warning signs that will help guidedecision-making and planning in localcommunities. At the national level,
Community Foundations of Canada isdoing the same.
This report exists, first and foremost, tostimulate discussion, debate and action.We hope it will serve as a wake-up callto individuals, communities, and ournation, reminding us that our prosperitymust be shared. And we must worktogether to find ways to do better for allCanadians.
Monica PattenPresident and CEO
Vincenza TravaleChair, Board of Directors
Community Foundations of Canada
On the surface Canada’s Vital Signs look healthy. Unemployment is at its lowest in a generation, Canadians arebetter educated than they used to be, median family income is advancing, and property crime is down. But justbelow the surface is a different story.
OUR NATION’S VITAL SIGNS What Are they Telling Us?
VITAL COMMENTS
The First Nations population is the fastest growing and youngest population in Canada, with more than 50% under 23 years of age. Yet, as recognized in the VitalSigns Report, more than half of First Nations people have not graduated from high school and/or are unemployed. As a result, one in four First Nations childrenlive in poverty. Community infrastructures are underfunded and subject to a 2% cap on annual budget growth by the federal government. In housing alone, thepicture is dismal and expected to worsen: one in three First Nations report that their home is in need of major repairs, 44% report mould or mildew, and close to onein five live in overcrowded conditions.
The cycle of First Nations poverty can be broken. Canada does not have to abandon First Nations communities as a failed enterprise. Opportunities can becreated for First Nations citizens, especially First Nations youth, which will contribute to Canada's economic prosperity. The Red Deer Community Foundationis a positive example of how citizen engagement can contribute to addressing social injustices affecting our peoples. Ongoing support is needed to press forthe recognition and implementation of First Nations governments, with secure, flexible and sustainable funding. Urgent investments in education, human andresource development are also critical to build sustainable First Nations economies and, ultimately, fulfill Canada's commitment to support all of its citizens.- Phil Fontaine, National Chief of the Assembly of First Nations
Those who don’t know their history are condemned to remain children. The same can be said for understanding what ishappening in our own society today. What is really happening? Emotion and opinion can’t solve problems. They can help youonce you understand. I read this report as a mechanism for action.
We walk by homeless people on our streets as if this were unavoidable. It isn’t. Vital Signs shows that we have been stuckin the same place on poverty for decades, and that this is the result of having no solid strategy to reduce poverty.
But this report and the increasingly coordinated conscious words and actions of community foundations across Canada is akey mechanism for facing poverty, dealing with the financial risks of immigration, confronting the income gap and the low-costhousing shortage. Conscious people have the tools to act and this report is just that – a vital tool for action.- John Ralston Saul, Writer and Co-Chair of the Institute for Canadian Citizenship
For complete expert commentary, see the expanded on-line version of this report at www.vitalsignscanada.ca

2 Vital Signs | National Report
• Canada’s population grew by 5.4% between 2001 and 2006• The average annual growth rate (1.02%) is almost identical to the rate in the 1990s (1.03%)• Only Alberta and Ontario had population growth above the national average between 2001 and 2006• Population growth is now largely due to immigration• Canada’s elderly population is growing: by 2031, Statistics Canada projects seniors will account for a quarter of the total population
-- almost double their current proportion• The 2005 median family income in Canada was $60,600 – an increase of 6.4% since 2000 when adjusted for inflation
40
30
20
70
% of totalgrowth
60
50
10
01980-1990 1990-2000 2000-2005
Natural increase (Births-Deaths)Net Migration
CANADA’S POPULATION
Source: Statistics Canada
Sources of Population Increases1980-2005

LEARNINGThe proportion of Canadians who completed post-secondary education is up nearly 50% since 1990.
Close to half of all Canadians age 15 or older (48.8%) now have completed university degrees or post-secondarycertificates or diplomas. In an evolving, information-based society, this is good news.
60
50
40
30
10
0
20
Perc
enta
ge
1990 1991 1992 1993 1994 1995 1996 1997 1998 1999 2000 2001 2002 2003 2004 2005 2006
Post-Secondary Certificate or Diploma or University Degree
Post-Secondary Certificate or Diploma
University Degree
Proportion of Population (15 years and over)
with a Post-Secondary Education in Canada, 1990-2006
Vital Signs | National Report 3
Source: Statistics Canada
Montreal Hooked on School was created in response to the concerning fact that 4,000 teenagersand young adults in Montreal quit school each year. In addition to working actively with the fiveschool boards of Montreal to set up preventive initiatives promoting the importance of staying inschool and obtaining a qualifying diploma, MHOS also serves as a forum that encouragespartners to share their experiences and best practices. The organization offers services toyoung people, parents, education professionals, and the general public and implements activitieswith the business community and political partners to raise awareness about the drop outphenomena and its impacts on the socio-economic development of our society.
Over the last two years, Montreal Hooked on School has treated 850 cases of young peopleand parents through its Information and Referral hotline and offered information workshopsto 17 853 young people in 78 schools of the five school boards of Montreal.
TAKING ACTION

14
12
10
8
4
2
0
6Per
cent
1976
1978
1980
1982
1984
1986
1988
1990
1992
1994
1996
1998
2000
2002
2004
2006
Unemployment rate
27 weeks or more
53 weeks or more
Unemployment Rates in Canada, 1976 to 2007
WORKCanada’s unemployment rate in 2006 (6.3%) was the lowest in a generation, and the first half of 2007 was even lower, at 6.1%.Long-term rates, for those out of work for 27 weeks or longer, also reached record lows. However, we also know that unattached
individuals, Aboriginal people, recent immigrants, youth, people with disabilities, and other specific groups continue to experiencehigher than average unemployment. Aboriginal Canadians, for example, are more than twice as likely to be unemployed as
non-Aboriginals (16.5% vs. 5.9% in 2001).
4 Vital Signs | National Report
Source: Statistics Canada

Toronto's Vital Signs report in 2005 helped relate the growth in youth violence, the ten-yearhigh in youth unemployment, and the dramatic drop in youth involvement (after the age of12) in all forms of recreational activity. Armed with this data, the Toronto CommunityFoundation led the development of a partnership between the Foundation, the City, Toronto'sschool boards, United Way and sports organizations. The result was the Toronto SportLeadership Program that, in its first two years, recruited and trained over 200 youth from 21different high schools in two of Toronto's most vulnerable areas. Youth were given the oppor-tunity to train for certification in sport leadership in aquatics, basketball and soccer coaching.They were introduced to recreation employers. Many secured employment in communityleadership roles as lifeguards, coaches and camp leaders, not only enhancing their ownfutures, but also providing positive role models in their communities.
TAKING ACTION
Fondation du Grand Montréal 7Vital Signs | National Report 5
BELONGING AND LEADERSHIPIn 2004, when the last national survey was taken, 45.3% of Canadians over age 15 were engaged in unpaid volunteer work. As we look toward the future, younger Canadians age 15-24 volunteer
at an even higher rate: 55%.

6 Vital Signs | National Report
Our country has one of the highest percentages offoreign-born population in the world – in 2001,18.4% of Canada’s population was born overseas.Visible minorities make up an increasing share of thenewcomer population. In our long history as acountry of immigrants, newcomers will shape ourfuture more than ever before. How we welcomethem and help them settle has never been moreimportant.
Despite Canada’s falling unemployment rate, it isharder for new immigrants than for other Canadiansto get a job. While the 2006 Census figures aren’tavailable yet, the picture in 2001 showed that recentimmigrants – those who had arrived in the previousfive years – were almost twice as likely (1.72 timesto be exact) to be unemployed as people born inCanada. In cities with high immigration, the differencewas even more dramatic.
This is particularly worrying, when immigrants are arriving with more education and qualifications than ever.
Our immigration system evaluates potential newcomers on a point system that favours education and qualifications, tacitly holdingout the promise of employment in that field. But many immigrants find that the qualifications that got them into the country can’t getthem a job.
One study shows that many of our most highly-skilled immigrants encounter such difficulty finding work that they stay only a shorttime in Canada before deciding to move elsewhere. Studies also show that while immigrants arrive in Canada healthier than Canadian-born counterparts of the same age, they lose this advantage over time.
“My husband and I got into Canada by the points system. We passed andbecame landed due to our education, English skills, and other factors…But then we got here and there were no jobs. Our diplomas were notreally worth anything.” – Focus group participant, Unsettled: Legal and Policy Barriers for Newcomers to Canada
GETTING STARTED INOUR COMMUNITY
Whether we realize it or not, immigration affects every Canadian and every community. The growth and prosperityof our country literally depends on newcomers. Immigration accounts for about two-thirds of our population growth
and 70% of the net growth in our labour force.
4.0
3.5
3.0
2.5
2.0
0.5
0.0
3.37
2.84 2.74
2.51
2.222.02
1.72
1.37 1.28
1.03 0.941.0
1.5
Rat
io
Montreal Ottawa Kitchener Victoria Toronto Vancouver Canada Calgary MedicineHat
Saint John Sudbury
Ratio of the Unemployment Rate of Recent Immigrants
to Non-Immigrants, 2001
Source: Statistics CanadaData not available for Red Deer

Not surprisingly, given their employment difficulties, poverty within immigrant communities is much higher than the Canadian average:35% of newcomers who arrived in 1991 or later were living below the poverty line in 2001 (using the before tax LIM measure– see the Gap Between Rich and Poor for details on poverty measuring sticks).
“The costs of not utilizing newcomers’ skills are numerous, and they impact Canada, the sending countries, andthe immigrants themselves and their families. Economic costs include labour shortages, unnecessary retraining,a greater burden on social programs, the loss of potential tax revenue, and an overall increase in immigrantpoverty rates. In social terms, the exclusion of newcomers has costs in terms of ethnic and race relations, humanrights, the settlement process, and mental health.” – Unsettled: Legal and Policy Barriers for Newcomers to Canada
The Maytree Foundation is a Canadian organization established in 1982. Maytree viewsimmigration and urbanization as powerful elements in the Canadian landscape, and worksto accelerate the settlement of refugees and immigrants in large urban centres. Maytree alsoaims to strengthen the vibrancy of civil society by supporting the development of strongleaders and organizations.
A key Maytree initiative is the Toronto Region Immigrant Employment Council (TRIEC), amulti-stakeholder collaboration of employers, occupational regulatory bodies, post-secondary institutions, assessment service providers, labour, immigrant professionalassociations, community organizations and all three levels of government. Together, thisgroup works to address an urgent need -- effective and appropriate inclusion of skilledimmigrants in the labour market. Amongst many successful initiatives, TRIEC has developedthe Mentoring Partnership, a collaboration of community organizations and corporatepartners that brings together skilled immigrants and established professionals in occupation-specific mentoring relationships. Since the program was launched in November 2004, over2000 mentoring matches have been made, with 70% of mentees finding employment atthe end of the relationship.
Other examples include the Calgary Foundation’s Immigrant Access Fund, which providesloans of up to $5,000 to immigrants to fund the accreditation proce ss (study and examina-tion fees, for example) that makes it possible for them to work in their field in Canada.
The Waterloo Region Immigrant Employment Network, a region-wide strategy to ensurethat immigrant skills are better used – to benefit newcomers and their families, the localeconomy and the community as a whole. WRIEN includes funders, businesses, immigrants,educators, governments and community-based organizations. The Kitchener and WaterlooCommunity Foundation was an early funder and catalyst of the WRIEN initiative.
VITAL COMMENTS
TAKING ACTION
Vital Signs | National Report 7
Canada's future economic growth and competitiveness will depend on how quickly and effectively we canintegrate immigrants into our workplaces and our communities. We look at international experience as anasset and try to consider how we can leverage it for competitive advantage, to better serve increasinglydiverse clients, to generate new ideas, and to develop knowledge about global markets. Effective immigra-tion, integration and inclusion policies, plus employment practices focused on diverse talent, will be critical in confronting labour shortages and sustaining economic growth. The stakes are higher than ever before.
- Zabeen Hirji, Chief Human Resources Officer, RBCFor complete expert commentary, see the expanded on-line version of this report at www.vitalsignscanada.ca

4.2
4.0
3.8
3.6
3.2
3.0
3.4
Rat
io
2000 2001 2002 2003 2004 2005
8 Vital Signs | National Report
8
7
6
5
4
1
0
7.2
5.75.4
4.1
3.5 3.33.1 3.1
2.8
2.3 2.1 2.02
3
Rat
io
Vancouver Victoria Toronto Canada Montreal Calgary Kitchener Ottawa MedicineHat
Red Deer
Saint John Sudbury
The ratio of average residential prices to median familyincome measures this gap. As illustrated below, the ratiorose from 3.23 in 2000 to 4.11 in 2005, meaning that in2000, the cost of the average Canadian house was 3.23times the amount of a Canadian family’s annual pre-taxincome. In 2005, the house cost more than 4 times thefamily’s income.
Reflecting the difference in housing prices across thecountry, the ratio varies dramatically between Vital Signscommunities, from an affordable 2.0 in Sudbury to a highof 7.2 in Vancouver, as illustrated above.
HOUSINGStable, affordable housing is essential to quality of life. Owning a home is a Canadian dream, and a significanthedge against poverty. For many Canadian families, their home is their most important asset. But housing prices
in Canada have increased faster than income since 2000, making it more difficult for many Canadians to purchase a home.
Ratio of MLS Average Residential Prices and
Median Census Family Pre-Tax Income in Canada,
2000-2005
Ratio of MLS Average Residential Prices andMedian Census
Family Pre-Tax Income for Vital Signs Communities, 2005
Source: Canada Mortgage and Housing Corporation and Statistics Canada
Source: Canada Mortgage and Housing Corporation and Statistics Canada
Affordable, safe, and appropriate housing is a major poverty prevention and amelioration measure.Financing shelters for the homeless is not a solution. There is a pressing need for supportive non-market housing for people whose lives are most at risk and for non-market housing (non-profit,cooperative and publicly-owned) and for low end market housing (rental and ownership) for lowincome Canadians. Affordable home ownership through accessible and manageable mortgages andincentives for builders can generate powerful social and economic benefits. People move out ofnon-profit and public housing, freeing up space in the existing stock. They develop equity in theirhome, improving their long term assets. This equity means debt can be paid down, opportunitiesfor savings and investments are increased and prudent consumer spending takes place.
- Michael Clague, President of the Carold Institute for the Advancement of Citizenship in Social Change, Vancouver, British ColumbiaFor complete expert commentary, see the expanded on-line version of this report at www.vitalsignscanada.ca
VITAL COMMENTS
The big increase from 2000 to 2005 (27.4%) is due to a45% increase in house prices far outpacing the 19%increase in family income during that time.
SAFETYIn 2006, property crime was down 41.8% from 1991. Much of the decrease took place between 1991 and
2000 (an annual average reduction of 4.5%). The decrease has slowed down since then, to an annual averageof 1.7%. Although the property crime rate varies significantly across Canada, it has come down in every
Vital Signs community. Violent crime is also down in Canada, by just over 10% since 1991.
Vital Signs | National Report 9

10 Vital Signs | National Report
The arts and culture sector’s share of totalemployment has remained steady over thelast 20 years: fluctuating between a high of2.06% in 2005 to a low of 1.81% in 1991.The share is generally higher in Canada’slarge cities than in small ones.
ARTS AND CULTUREThriving arts and culture is one mark of a vital community. And one measure of the health of a sector is the
amount of employment it generates. In our nation’s cultural industries (publishing, motion pictures and video,broadcasting, Internet publishing and broadcasting, performing arts, spectator sports and related industries, and
heritage institutions), employment has increased significantly since 1987: an average annual growth rate of 1.44%.However, 2006 showed the first drop-off in recent years – a significant one-year reduction of 3.7%.
Vital Signs | National Report 11
350
300
250
200
50
0
294
275
246231
219
191 186167
141130 128 124
100
150Per
100,
000
Victoria Montreal Vancouver Calgary Canada Saint John SudburyOttawa Toronto MedicineHat
Kitchener Red Deer
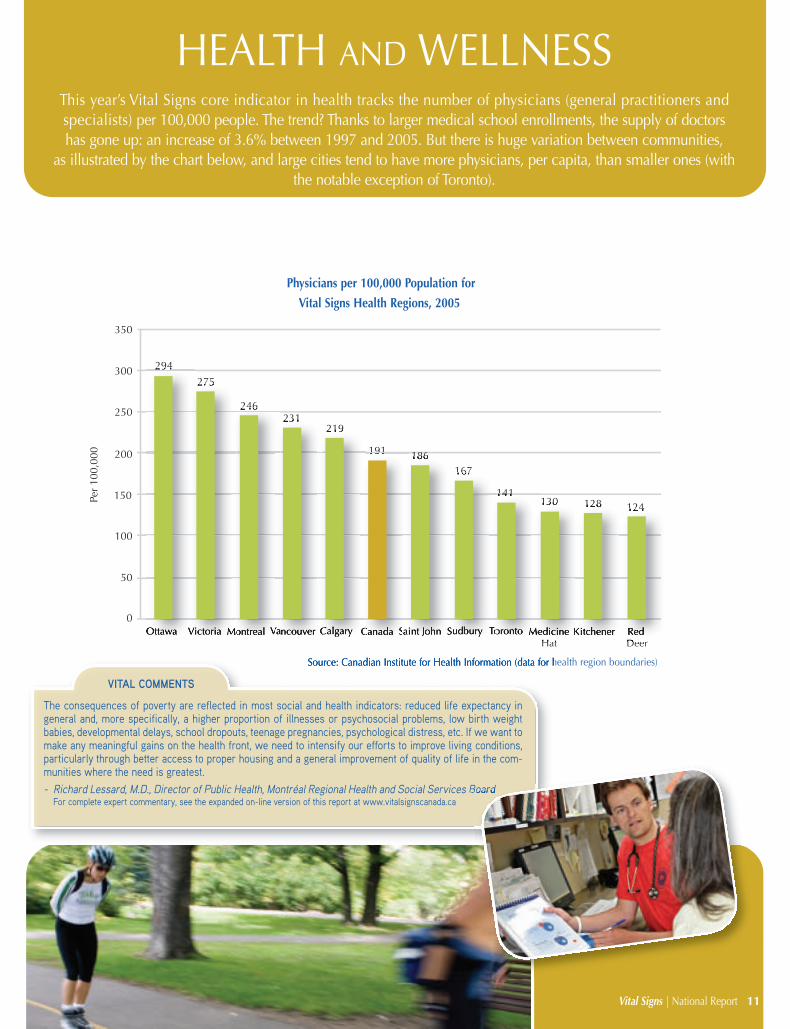
Physicians per 100,000 Population for
Vital Signs Health Regions, 2005
HEALTH AND WELLNESSThis year’s Vital Signs core indicator in health tracks the number of physicians (general practitioners andspecialists) per 100,000 people. The trend? Thanks to larger medical school enrollments, the supply of doctorshas gone up: an increase of 3.6% between 1997 and 2005. But there is huge variation between communities,
as illustrated by the chart below, and large cities tend to have more physicians, per capita, than smaller ones (withthe notable exception of Toronto).
Source: Canadian Institute for Health Information (data for health region boundaries)
VITAL COMMENTS
The consequences of poverty are reflected in most social and health indicators: reduced life expectancy ingeneral and, more specifically, a higher proportion of illnesses or psychosocial problems, low birth weightbabies, developmental delays, school dropouts, teenage pregnancies, psychological distress, etc. If we want tomake any meaningful gains on the health front, we need to intensify our efforts to improve living conditions,particularly through better access to proper housing and a general improvement of quality of life in the com-munities where the need is greatest.- Richard Lessard, M.D., Director of Public Health, Montréal Regional Health and Social Services Board
For complete expert commentary, see the expanded on-line version of this report at www.vitalsignscanada.ca
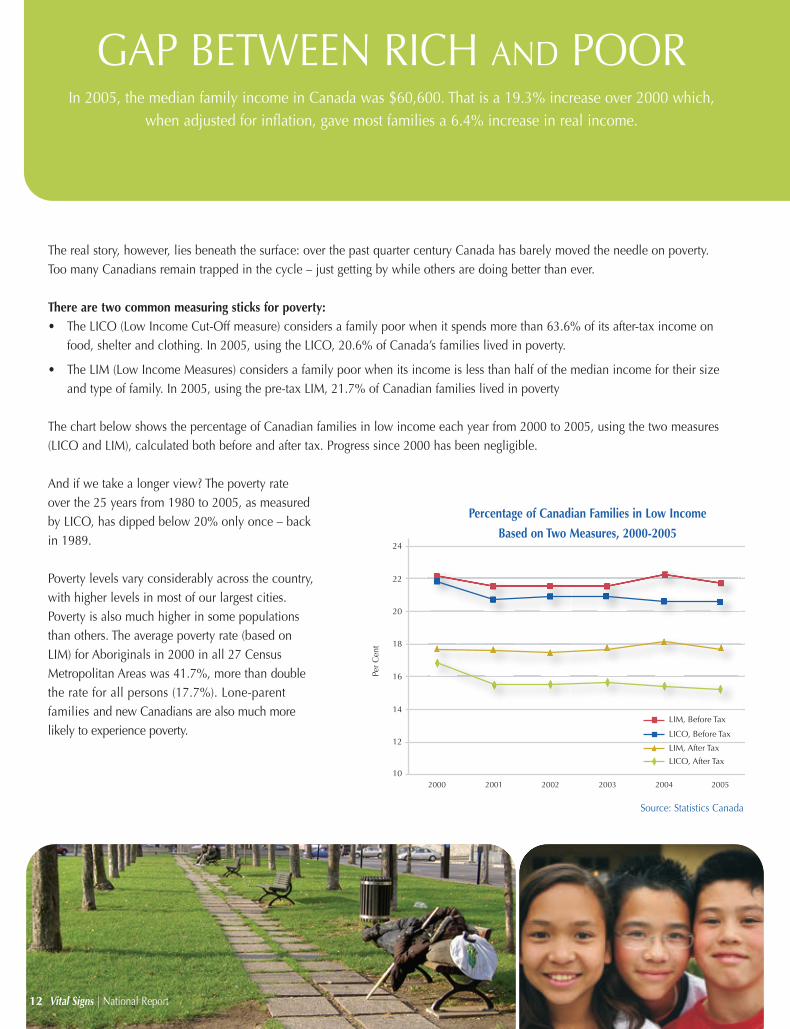
The real story, however, lies beneath the surface: over the past quarter century Canada has barely moved the needle on poverty. Too many Canadians remain trapped in the cycle – just getting by while others are doing better than ever.
There are two common measuring sticks for poverty:• The LICO (Low Income Cut-Off measure) considers a family poor when it spends more than 63.6% of its after-tax income on
food, shelter and clothing. In 2005, using the LICO, 20.6% of Canada’s families lived in poverty.
• The LIM (Low Income Measures) considers a family poor when its income is less than half of the median income for their sizeand type of family. In 2005, using the pre-tax LIM, 21.7% of Canadian families lived in poverty
The chart below shows the percentage of Canadian families in low income each year from 2000 to 2005, using the two measures(LICO and LIM), calculated both before and after tax. Progress since 2000 has been negligible.
And if we take a longer view? The poverty rateover the 25 years from 1980 to 2005, as measuredby LICO, has dipped below 20% only once – backin 1989.
Poverty levels vary considerably across the country,with higher levels in most of our largest cities.Poverty is also much higher in some populationsthan others. The average poverty rate (based onLIM) for Aboriginals in 2000 in all 27 CensusMetropolitan Areas was 41.7%, more than doublethe rate for all persons (17.7%). Lone-parent families and new Canadians are also much morelikely to experience poverty.
12 Vital Signs | National Report
22
24
20
18
16
12
10
14
Per
Cen
t
LIM, Before Tax
LICO, After Tax
LIM, After Tax
2000 2001 2002 2003 2004 2005
LICO, Before Tax
Percentage of Canadian Families in Low Income
Based on Two Measures, 2000-2005
GAP BETWEEN RICH AND POORIn 2005, the median family income in Canada was $60,600. That is a 19.3% increase over 2000 which,
when adjusted for inflation, gave most families a 6.4% increase in real income.
Source: Statistics Canada

Vital Signs | National Report 13
Another perspective on our prosperity is the difference between the wealthiest in our communityand the least well-off. The “income gap” measuresthe ratio between people near the top of the incomespread (those at the 90th percentile) and peoplenear the bottom (those at the 10th percentile). Local Vital Signs reports show an increase in the gap between rich and poor in most of our urbancentres between 2001 and 2005. That growing gapis consistent with various other national measuresthat show increased income inequality over the past quarter century.
Percentage of Canadian Family Units in Low Income (LICO),
1980-2005
26
28
24
22
20
18
16
12
10
14
Per
Cen
t
After Tax
Before Tax
19801981
19821983
19841985
19861987
19881989
19901991
19921993
19941995
19961997
19981999
20002001
20022003
20042005
Vibrant Communities is a national movement dedicated to locally-driven efforts to reduce rather than to alleviate poverty in Canada.Its successful model includes comprehensive multi-sectoral collaboration where citizens, organizations, businesses and governmentsidentify the multiple issues and create innovative solutions to reduce poverty. It’s an approach that allows communities to learn from— and help — each other. Now four years after the program began, Vibrant Communities has linked 15 urban centres from BritishColumbia to Newfoundland in the Vibrant Communities Pan-Canadian Learning Community with seven Trail Builder communities(BC Capital Region, Niagara, Montreal, Saint John, Edmonton, Calgary and Surrey). Local poverty reduction efforts have succeeded inreducing poverty for over 34,000 Canadians through partnering with: 315 non-profit organizations, 209 government agencies, 106low-income leaders and 271 businesses along with 176 other key partners. Vibrant Communities believes that communities have thepotential to reduce poverty but efforts have to be multi-sectoral, deliberate, and positive to be most productive.
Community Foundations of Canada is helping community foundations explore how they can best attack poverty in theircommunities. There are different approaches: in Winnipeg, the community foundation is focusing resources on one neighbourhoodschool, to test the notion that strengthening families and their relationship with education is a pathway out of poverty. In Hamilton, isleading a city-wide, multi-sector initiative to reduce poverty and is dedicating its undesignated granting to poverty reduction and alle-viation programs. In Edmonton, the foundation is beginning a social enterprise fund that will use its assets to help generate affordablehousing. In Red Deer, the community foundation (with other community organizations) is helping the aboriginal community addressits challenges. An important step was creating an annual conference where aboriginal youth could learn about employment andcareers and discuss issues like education and addiction. Concrete progress has come from the conferences. One example:Red Deer now has an important new voice in city government – the Community Facilitator, Aboriginal Affairs. There are manyother approaches being explored and CFC has brought together a small learning community that, with support from the federalgovernment, will share their experience in poverty reduction strategies with the 150+ other community foundations acrossthe country.
TAKING ACTION
Source: Statistics Canada
VITAL COMMENTS
Over the past 25 years there has been barely a ripple in the fight against poverty. In order tofashion a strong social fabric we need to weave in many threads. One is adequate and affordablehousing; others include alternative programs for youth at risk, who learn by doing and many ofwhom have unrecognized, underdeveloped manual skills (skills needed in the labour force oftoday and tomorrow). We need to emphasize prevention in health, encourage parenting skills andprovide affordable childcare options. And we need mentors who live around the corner and whoare there for us. We must raise the public consciousness of the nation and it begins at the top.
- Dr. Erminie J. Cohen, retired Canadian senator, Saint John, New BrunswickFor complete expert commentary, see the expanded on-line version of this report at www.vitalsignscanada.ca

700,000
800,000
600,000
500,000
400,000
300,000
100,000
0
200,000
Tons
of C
O2
equi
vale
ntTransportation
Total Emissions
1990 1991 1992 1993 1994 1995 1996 1997 1998 1999 2000 2001 2002 2003 2004
Greenhouse Gas Emissions in Canada, 1990-2004Between 1990 and 2004, according toEnvironment Canada, our GHG emissions rose25.8% -- or an average of 1.65% per year. On a percapita basis, the increase was 9%, or 0.6% per year.Although the growth rate of per capita emissionshas slowed in this decade as compared to the1990s, it has not yet begun to fall.
According to a survey by Statistics Canada, theindustries that contributed most to total greenhousegases in 2002 were crop and animal production, oiland gas extraction, and electric power generation.Together, these industries accounted for 42.6% oftotal emissions. About one quarter of Canada’sgreenhouse gas emissions are due to transportation.
When we compare ourselves to the rest of theworld, the picture gets worse. According to UnitedNations research, Canada in 2003 had the secondhighest per capita level of carbon dioxide (CO2)emissions out of major OECD (Organization forEconomic Co-operation and Development) countries.Only the USA was higher. And from 1991 to 2003,Canada’s per capita CO2 emissions increased21.4%, the second highest increase among majorOECD countries. Carbon dioxide makes up about80% of greenhouse gases.
Per Capita CO2 Emissions in Selected OECD Countries,1991 vs. 2003 Percent
1991 2003 Change
Canada 14.74 17.89 21.4
Australia 15.12 17.75 17.4
France 6.65 6.05 -9.0
Germany 11.16 9.77 -12.5
Italy 6.99 7.75 10.9
Netherlands 9.34 8.70 -6.9
Spain 5.55 7.37 32.8
Sweden 5.99 5.89 -1.7
United Kingdom 11.18 9.40 -15.9
United States 19.07 19.92 4.5
Japan 8.83 9.66 9.4
Source: United Nations
ENVIRONMENTCanada is paying a high environmental price for our prosperity. We are one of the top per capita producers of
carbon dioxide in the world. And our greenhouse gas (GHG) emissions – contributors to global warming –continue to rise.
Source: Environment Canada
14 Vital Signs | National Report

VITAL COMMENTS
As global anxiety about climate change grows, a number of organizations are finding ways tocontribute to a healthier and more sustainable future. Some of their stories are shared below.
The Pembina Institute is one of the most prominent Canadian organizations working on cli-mate change policy. Though the federal government has backed away from our KyotoProtocol targets, Pembina continues research, education and advocacy on climate changeand is working closely with provinces on their plans. Because nearly half of Canada'sGHG emissions come from large industry, Pembina is working to reduce these emissionsthrough a system of emission targets and emissions trading. Pembina also produces practicaltools and educational resources to help Canadians understand and take action on climatechange and has programs to help companies and communities reduce their GHG emis-sions.
With the passage of the first phase of Toronto's Climate Change, Clean Air and SustainableEnergy Action Plan on July 16, 2007, Toronto is poised to implement the most ambitiousenvironmental plan in North America. Toronto has set targets to reduce GHG emissionsin the city by 6% by 2012; 30% by 2020 and 80% by 2050. The targets are ambitious butthe city is already exceeding its goals while generating jobs and reducing costs of many oper-ations. The Better Buildings Partnership has created more than $80 million in energy retrofits inbuildings; the City's Energy Retrofit Program has carried out $30 million worth of energy-related projects in City facilities. The Toronto Atmospheric Fund, the installation of wind,solar, hydrogen and tri-generation facilities at Exhibition Place, Enwave's Deep Lake WaterCooling system and policies such as the Toronto Green Development Standard are just afew other examples of ways in which the City of Toronto is making a significant effort toreduce greenhouse gas emissions.
In 2006, Community Foundations of Canada announced a new partnership with 1% for thePlanet (1%FTP) to engage local companies in environmental philanthropy. The allianceaims to show that taking environmental responsibility is good for business, as proven byYvon Chouinard, environmental activist and founder of 1%FTP and Patagonia outdoorwear. 1% for the Planet members donate at least 1% of their revenues or sales annually toenvironmental organizations worldwide. CFC is also collaborating with MountainEquipment Coop, a member of 1%FTP, to inspire Canadian businesses to be leaders inenvironmental philanthropy.
TAKING ACTION
Vital Signs | National Report 15
Canada is a nation that is heralded around the world for being a peacemaker, a true multicultural society, and aleader in environmental sustainability. Yet Vital Signs echos what many Canadians are already beginningto realize: Canada is quickly losing the mantle of global environmental leader. Of course, as a country, wetrumpet our vast ecological inheritance, yet reality is painting a stark counter-image – one that suggests thenext generation will inherit an environment far less becoming than the one our generation enjoys and isquickly letting slip away.
- Simon Jackson, Founder and Chairman of the 6 million strong Spirit Bear Youth Coalition, Executive Producerof THE SPIRIT BEAR – the forthcoming Hollywood CGI animated movie
With much of our lives depending on our natural world, you would assume that Canada would be aninternational leader in sustainable living. Unfortunately, this is not the case. Canadians have all the necessaryconditions to make positive choices regarding our environment: information, resources, and opportunity. Yet, westill lack motivation!
- Quinn Runkle, grade eleven student, organizer and speaker for Youth in Philanthropy: Going Green conference, Youth Liaison for Sunshine Coast Botanical Garden Society and Save Our Sunshine CoastFor complete expert commentary, see the expanded on-line version of this report at www.vitalsignscanada.ca

16 Vital Signs | National Report
On the one hand, we are surrounded by opportunity andabundance, and many of us are doing very well. But we cannotlet our apparent prosperity blind us to the reality faced by manyCanadians. We must open our eyes and ask ourselves some difficultquestions.
Can we accept a Canada where poverty is still a blight on ourAboriginal peoples and where newcomers can’t use the skillsthat earned them entrance to this country? Are we comfortablewitnessing the widening divide between the richest and thepoorest among us? And are we content to watch our greenhousegas emissions continue to rise while other countries take action?
Canadians believe in a country that is just and equitable andresponsible. We believe we can be a model for the world – butreality strains that claim on several fronts, as our Vital Signs show.
Many Canadians are convinced we can and must do better. Theyare stepping up to find solutions – to “level the playing field” forall, and to demand responsible stewardship of our environment.
Community foundations are part of that movement, alongwith many others in the voluntary sector, and stand readywith their resources and leadership to tackle issues at thelocal level. But our sector can’t do it alone. Canada needs ourcombined commitment.
Governments, business, community organizations, ordinarycitizens – all of us – must take up the fight against poverty,exclusion, and environmental degradation.
These issues are not too big to solve. The examples in this reportshow how Canadians are already taking action.
In the months ahead, community foundations will use their localVital Signs reports to raise key issues with citizens and communityleaders in their own communities. CFC plans to do the same withVital Signs Canada. This report is the beginning of a process, notthe end.
Working together, we can do better for all Canadians.
What can I do?Discussion. Debate. Action. Those are the next steps for Vital SignsCanada. If you or your organization is moved and motivated bywhat you’ve read in our national report or in a local Vital Signsreport (www.vitalsignscanada.ca), please don’t stop there.
Every mountain is climbed one step at a time. Here are threesimple ways you can take action. Today.
1. Pass it on. Share this report, or your local Vital Signs report withyour employer, your teacher, your best friend, a neighbourhoodbusiness, library or community centre, or a government representativeat any level.
2. Contact us. You can find your local community foundation atwww.cfc-fcc.ca. They know the issues and organizations in yourcommunity. If you’re looking for ways to make a difference, theycan help.
3. Find out more. Visit the websites of the other organizations andexperts featured in this report for more information about their workand opportunities to further their efforts or make your own mark.
THE CANADA WE BELIEVE INThese Vital Signs give us an overview of how Canada is doing in key areas. They show us there are two
realities in our country right now.

About our DataThe core indicators presented in this report are part of a set of common indicators that Community Foundations of Canada collectson behalf of communities participating in Vital Signs. Each Vital Signs community foundation supplements the centrally collecteddata with local research. The central data collection is secondary research, made up primarily of data from Statistics Canada.Geographic units used are, for the most part, Census Metropolitan Areas or Census Agglomerations. Original source documents for data cited in this report are hyperlinked in the expanded on-line version of this report on the national Vital Signs website atwww.vitalsignscanada.ca
The Vital Signs core indicators were identified through a priority-setting exercise with community foundations participating in Vital Signs in 2006, which was in turn based on local community consultations that participating foundations conducted.
Acknowledgements Special thanks to Andrew Sharpe and his colleagues Anne Marie Shaker, Christopher Ross, Bonnie Gunn, Martha Sevigny, andSimon Lapointe at the Centre for the Study of Living Standards, CFC’s research partner on this project. CFC and the CSLS also thankthe following for their assistance in providing data: Statistics Canada (Marcel Bechard, Parvin Fahr, Robert Fortin, Michelle Grimard,Alyson Hazlett, Andrew Heisz, Mary Frances Lawlis, Marc Levesque, Joanne Linekar, Gilbert Mansour, Robert Smith, Andrew Turvey,Nancy-Ann Walker, Jennie Wang, and Michael Wolfson), Environment Canada (Tom Dann), Canadian Real Estate Association (Janet Lemoine), Canadian Association of Food Banks (Shawn Pegg), Canada Mortgage and Housing Corporation (Debra Connor),Canadian Institute for Health Information (John-David Stanway and Robert Kyte), and Canadian Council on Learning (Marc Lachance).May Wong of the Toronto Community Foundation, Katherine Scott of the Canadian Council on Social Development, and Louise Comeau also provided valuable input into the data collection.
Thanks to Our Funders Special thanks to the J.W. McConnell Family Foundation for providing critical support for the national expansion of the Vital Signsprogram. And our thanks to the Strategic Charitable Giving Foundation for contributing to this report in partnership with MackenzieCharitable Giving Fund, and to the Ford Foundation for its ongoing support of Community Foundations of Canada's leadership work.
Photographs in this report were generously provided by the Victoria Foundation (photographer: Tiffany Brown Cooper), Vancouver Foundation, The Calgary Foundation(WAX partnership inc. and photographer: Victor Penner), Red Deer & District Community Foundation, Toronto Community Foundation, the Community Foundation ofOttawa (photographer: Matthew Claydon), The Greater Saint John Community Foundation (photographer: Jane Barry) and the Foundation of Greater Montreal.
Writing: Nancy F. Johnson, Johnson AssociatesDesign and computer graphics: Jacques Jobin and Sylvain Malbeuf
Community foundations taking the pulse of Canadian communities.
VitalSigns®

Community Foundations of Canada301-75 rue Albert StreetOttawa, ON Canada K1P 5E7(613) [email protected]
Please see the expanded on-line version
of this report at www.vitalsignscanada.ca
Également disponible en français