Embed Size (px)
Citation preview

12353/15 ADD 3 KS/am DG E 1A EN
Council of the European Union
Brussels, 24 September 2015 (OR. en)
12353/15 ADD 3
ENV 586 ENT 199 MI 583
COVER NOTE From: European Commission date of receipt: 23 September 2015 To: General Secretariat of the Council No. Cion doc.: D040155/01 - Annex 1 - Part 3/3 Subject: Annex to the Commission Regulation amending Regulation (EC) No
692/2008 as regards emissions from light passenger and commercial vehicles (Euro 6)
Delegations will find attached document D040155/01 - Annex 1 - Part 3/3.
Encl.: D040155/01 - Annex 1 - Part 3/3
077587/EU XXV. GPEingelangt am 24/09/15
www.parlament.gv.at

EUROPEAN COMMISSION
Brussels, XXX D040155/01 […](2015) XXX draft
ANNEX 1 – PART 3/3
ANNEX
to the
Commission Regulation
amending Regulation (EC) No 692/2008 as regards emissions from light passenger and commercial vehicles (Euro 6)
www.parlament.gv.at

ANNEX
Appendix 6
Verification of trip dynamic conditions with method 2 (Power Binning)
1. INTRODUCTION
This Appendix describes the data evaluation according to the power binning method, named in this appendix “evaluation by normalisation to a standardised power frequency (SPF) distribution”
2. SYMBOLS, PARAMETERS AND UNITS
ai ................. Actual acceleration in time step i, if not other defined in an equation:
aref ............... Reference acceleration for Pdrive , [0.45 m/s²]
DWLTC ......... intercept of the Veline from WLTC
f0, f1, f2 ........ Driving resistance coefficients as defined in section 5.2 of Annex 4 to UNECE GTR N° 15 (Worldwide harmonised Light vehicles Test Procedure) in [N], [N/(km/h)], and [N/(km/h)²] respectively
i ................... Time step for instantaneous measurements, minimum resolution 1Hz
j……………Wheel power class, j=1 to 9
kWLTC Slope of the Veline from WLTC
mgas, i ........... Instantaneous mass of the exhaust component “gas” at time step i, [g/s]
mgas, 3s, k ....... 3 second moving average mass flow of the exhaust gas component “gas” in time step k given in 1 Hz resolution [g/s] m , .......... Average emission value of an exhaust gas component in the wheel power class j, g/s
Mgas,d ........... Distance-specific emissions for the exhaust gas component “gas” [g/km]
p .................. phase of WLTC (low, medium, high and extra-high), p=1-4
Pdrag ............. Engine drag power in the Veline approach where fuel injection is zero, [kW]
Prated ............ Maximum rated engine power as declared by the manufacturer, [kW]
www.parlament.gv.at

Prequired,i ....... Power to overcome road load and inertia of a vehicle at time step i, [kW]
Pr,,i ............... Same as Prequired,i defined above used in longer equations
Pwot(nnorm) .... Full load power curve, [kW]
Pc,j ............... Wheel power class limits for class number j, [kW] (Pc,j, lower bound represents the lower limit Pc,j, upper bound the upper limit)
Pc,norm, j ........ Wheel power class limits for class j as normalised power value, [-]
Pr, i ............... Power demand at the vehicles wheel to overcome driving resistances in time step i [kW]
Pw,3s,k .......... 3 second moving average power demand at the vehicles wheel to overcome driving resistances in in time step k in 1 Hz resolution [kW]
Pdrive ............ Power demand at the wheel hub for a vehicle at reference speed and acceleration [kW]
Pnorm ............ Normalised power demand at the wheel hub [-]
ti .................. Total time in step i, [s]
tc,j ................ Time share of the wheel power class j, [%]
ts ................. Start time of the WLTC phase p, [s]
te ................. end time of the WLTC phase p, [s]
TM .............. Test mass of the vehicle, [kg]; to be specified per section: real test weight in PEMS test, NEDC inertia class weight or WLTP masses (TML, TMH or TMind)
SPF ............. Standardised Power Frequency distribution
vi ................. Actual vehicle speed in time step i, [km/h] v ................. Average vehicle speed in the wheel power class j, km/h
vref ............... Reference velocity for Pdrive , [70 km/h]
v3s,k.............. 3 seconds moving average of the vehicle velocity in time step k, [km/h]
3. EVALUATION OF THE MEASURED EMISSIONS USING A STANDARDISED WHEEL POWER FREQUENCY DISTRIBUTION
The power binning method uses the instantaneous emissions of the pollutants, mgas, i (g/s) calculated in accordance with Appendix 4.
www.parlament.gv.at

The mgas, i values shall be classified in accordance with the corresponding power at the wheels and the classified average emissions per power class shall be weighted to obtain the emission values for a test with a normal power distribution according to the following points.
3.1. Sources for the actual wheel power
The actual wheel power Pr,i shall be the total power to overcome air resistance, rolling resistance, longitudinal inertia of the vehicle and rotational inertia of the wheels.
When measured and recorded, the wheel power signal shall use a torque signal meeting the linearity requirements laid down in Appendix 2, point 3.2.
As an alternative, the actual wheel power may be determined from the instantaneous CO2 emissions following the procedure laid down in point 4 of this Appendix.
3.2. Classification of the moving averages to urban, rural and motorway
The standard power frequencies are defined for urban driving and for the total trip (see paragraph 3.4) and a separate evaluation of the emissions shall be made for the total trip and for the urban part. The three second moving averages calculated according to paragraph 3.3 shall therefore be allocated later to urban and extra-urban driving conditions according to the velocity signal (v3s,k) as outlined in Table 1-1.
Table 1-1
Speed ranges for the allocation of test data to urban, rural and motorway conditions in the power binning method
Urban Rural (1) Motorway(1)
v3s,k [km/h] 0 to < 60 >60 to < 90 >90
(1) For the evaluation the three second moving averages need only to be classified later into events under urban velocity conditions for the “urban” part of the trip. For the “total” trip all three second moving averages shall be used independently from the velocity.
Where v3s,k ........ 3 seconds moving average of the vehicle velocity in time step k, [km/h]
k .............. time step for moving average values
3.3. Calculation of the moving averages of the instantaneous test data
Three second moving averages shall be calculated from all relevant instantaneous test data to reduce influences of possibly imperfect time alignment between emission mass flow and wheel power. The moving average values shall be computed in a 1 Hz frequency:
, , = , , , = ,
www.parlament.gv.at

, =
Where k time step for moving average values
i time step from instantaneous test data
3.4. Set up of the wheel power classes for emission classification
3.4.1. The power classes and the corresponding time shares of the power classes in normal driving are defined for normalized power values to be representative for any LDV (Table 1).
Table 1-2
Normalized standard power frequencies for urban driving and for a weighted average for a total trip consisting of 1/3 urban, 1/3 road, 1/3 motorway mileage
Power Pc,norm,j [-] Urban Total trip
class No. From > to < Time share, tC,j
1 -0.1 21.9700% 18.5611%
2 -0.1 0.1 28.7900% 21.8580%
3 0.1 1 44.0000% 43.4583%
4 1 1.9 4.7400% 13.2690%
5 1.9 2.8 0.4500% 2.3767%
6 2.8 3.7 0.0450% 0.4232%
7 3.7 4.6 0.0040% 0.0511%
8 4.6 5.5 0.0004% 0.0024%
9 5.5 0.0003% 0.0003%
The Pc,norm columns in Table 1 shall be de-normalised by multiplication with Pdrive, where Pdrive is the actual wheel power of the tested car in the type approval settings at the chassis dynamometer at vref and aref.
Pc,j [kW] = Pc,norm, j * Pdrive
www.parlament.gv.at

= 3.6 × + × + × + × × 0.001
Where j power class index according to Table 1
TMNEDC inertia class of the vehicle in type approval test, [kg]
3.4.2. Correction of the wheel power classes
The maximum wheel power class to be considered is the highest class in Table 1 which includes (Prated x 0.9). The time shares of all excluded classes shall be added to the highest remaining class.
From each Pc,norm,j the corresponding Pc,j shall be calculated to define the upper and lower bounds in kW per wheel power class for the tested vehicle as shown in Figure 1.
Figure 1
Schematic picture for converting the normalized standardised power frequency into a vehicle specific power frequency
An example for this de-normalisation is given below.
Example for input data:
Parameter Value
f0 [N] 79.19
f1 [N/(km/h)] 0.73
www.parlament.gv.at

f2 [N/(km/h)²] 0.03
TM [kg] 1470
Prated [kW] 120 (Example 1)
Prated [kW] 75 ( Example 2)
Corresponding results:
Pdrive = 70[km/h]/3.6*(79.19+0.73[N/(km/h)]*70[km/h]+0.03[N/(km/h)²]*(70[km/h])^2+1470[kg]*0.45[m/s²])*0.001
Pdrive = 18.25 kW
Table 2
De-normalised standard power frequency values from Table 1. (for Example 1)
Power Pc,j [kW] Urban Total trip
class No. From > to < Time share, tC,j [%]
1 All<-1.825 -1.825 21.97% 18.5611%
2 -1.825 1.825 28.79% 21.8580%
3 1.825 18.25 44.00% 43.4583%
4 18.25 34.675 4.74% 13.2690%
5 34.675 51.1 0.45% 2.3767%
6 51.1 67.525 0.045% 0.4232%
7 67.525 83.95 0.004% 0.0511%
8 83.95 100.375 0.0004% 0.0024%
9 (1) 100.375
All >100.375 0.00025% 0.0003%
(1) The highest class wheel power class to be considered is the one containing 0.9 x Prated. Here 0.9 x 120 = 108.
Table 3
De-normalised standard power frequency values from Table 1.( for Example 2)
Power Pc,j [kW] Urban Total trip
www.parlament.gv.at

class No. From > to < Time share, tC,j [%]
1 All<-1.825 -1.825 21.97% 18.5611%
2 -1.825 1.825 28.79% 21.8580%
3 1.825 18.25 44.00% 43.4583%
4 18.25 34.675 4.74% 13.2690%
5 34.675 51.1 0.45% 2.3767%
6(1) 51.1 All >51.1 0.04965% 0.4770%
7 67.525 83.95 - -
8 83.95 100.375 - -
9 100.375 All >100.375 - -
(1) The highest class wheel power class to be considered is the one containing 0.9 x Prated. Here 0.9 x 75 = 67.5.
3.5. Classification of the moving average values
Each moving average value calculated according to point 3.2 shall be sorted into the de-normalized wheel power class into which the actual 3 second moving average wheel power Pw,3s,k fits. The de-normalised wheel power class limits have to be calculated according to point 3.3.
The classification shall be done for all three second moving averages of the entire valid trip data as well as for the all urban trip parts. Additionally all moving averages classified to urban according to the velocity limits defined in table 1-1 shall be classified into one set of urban power classes independently of the time when the moving average appeared in the trip.
Then the average of all three second moving average values within a wheel power class shall be calculated for each wheel power class per parameter. The equations are described below and shall be applied once for the urban data set and once for the total data set.
Classification of the 3-second moving average values into power class j (j = 1 to 9):
then: class index for emissions and velocity = j
www.parlament.gv.at

The number of 3-second moving average values shall be counted for each power class:
then: countsj = n + 1 (countsj is counting the number of 3 second moving average emission value in a power class to check later the minimum coverage demands)
3.6. Check of power class coverage and of normality of power distribution
For a valid test the time shares of the single wheel power classes shall be in the ranges listed in Table 4.
Table 4
Minimum and maximum shares per power class for a valid test
Pc,norm,j [-] Total trip Urban trip parts
Power class No. From > to < lower bound upper bound lower bound upper bound
Sum 1+2(1) 0.1 15% 60% 5%(1) 60%
3 0.1 1 35% 50% 28% 50%
4 1 1.9 7% 25% 0.7% 25%
5 1.9 2.8 1.0% 10% >5 counts 5%
6 2.8 3.7 >5 counts 2.5% 0% 2%
7 3.7 4.6 0% 1.0% 0% 1%
8 4.6 5.5 0% 0.5% 0% 0.5%
9 5.5 0% 0.25% 0% 0.25%
(1) Representing the total of motoring and low power conditions
In addition to the requirements in Table 4, a minimum coverage of 5 counts is demanded for the total trip in each wheel power class up to the class containing 90% of the rated power to provide a sufficient sample size.
A minimum coverage of 5 counts is required for the urban part of the trip in each wheel power class up to class No. 5. If the counts in the urban part of the trip in a wheel power class above number 5 are less than 5, the average class emission value shall be set to zero.
www.parlament.gv.at

3.7. Averaging of the measured values per wheel power class
The moving averages sorted in each wheel power class shall be averaged as follows:
, = , ,
= ,
Where j wheel power class 1 to 9 according to Table 1
, average emission value of an exhaust gas component in a wheel power class (separate value for total trip data and for the urban parts of the trip), [g/s]
average velocity in a wheel power class (separate value for total trip data and for the urban parts of the trip), [km/h]
k time step for moving average values
3.8. Weighting of the average values per wheel power class
The average values of each wheel power class shall be multiplied with the time share, tC,j per class according to Table 1 and summed up to produce the weighted average value for each parameter. This value represents the weighted result for a trip with the standardised power frequencies. The weighted averages shall be computed for the urban part of the test data using the time shares for urban power distribution as well as for the total trip using the time shares for the total.
The equations are described below and shall be applied once for the urban data set and once for the total data set. = , × ,
= × ,
3.9. Calculation of the weighted distance-specific emission value
The time based weighted averages of the emissions in the test shall be converted into distance based emissions once for the urban data set and once for the total data set as follows:
, , = . ×
Using this formula, weighted averages shall be calculated for the following pollutants:
Mw,NOx,d weighted NOx test result in [mg/km]
Mw,CO,d weighted CO test result in [mg/km]
www.parlament.gv.at

4. ASSESSMENT OF THE WHEEL POWER FROM THE INSTANTANEOUS CO2 MASS FLOW
The power at the wheels (Pw,i) can be computed from the measured CO2 mass flow in 1 Hz basis. For this calculation the vehicle specific CO2 lines (“Veline”) shall be used.
The Veline shall be calculated from the vehicle type approval test in the WLTC according to the test procedure described in UNECE Global Technical Regulation No. 15 - Worldwide harmonized Light vehicles Test Procedure (ECE/TRANS/180/Add.15).
The average wheel power per WLTC phase shall be calculated. in 1 Hz from the driven velocity and from the chassis dynamometer settings. All wheel power values below the drag power shall be set to the drag power value.
, = . × + × + × + × × .
With f0, f1, f2road load coefficients used in in the WLTP test performed with the vehicle
TM test mass of the vehicle in the WLTP test performed with the vehicle in [kg]
= 0.04 × , < , =
The average power per WLTC phase is calculated from the 1 Hz wheel power according to:
, = ,
With p phase of WLTC (low, medium, high and extra-high)
ts Start time of the WLTC phase p, [s]
te end time of the WLTC phase p, [s]
Then a linear regression shall be made with the CO2 mass flow from the bag values of the WLTC on the y-axis and from the average wheel power Pw,p per phase on the x-axis as illustrated in Figure 2.
The resulting Veline equation defines the CO2 mass flow as function of the wheel power: = , + CO2 in [g/h]
www.parlament.gv.at

Where
kWLTC slope of the Veline from WLTC, [g/kWh]
DWLTC intercept of the Veline from WLTC, [g/h]
Figure 2
Schematic picture of setting up the vehicle specific Veline from the CO2 test results in the 4 phases of the WLTC
The actual wheel power shall be calculated from the measured CO2 mass flow according to:
, = 2
With CO2 in [g/h]
PW,j in [kW]
The above equation can be used to provide PWi for the classification of the measured emissions as described in point 3 with following additional conditions in the calculation
if vi < 0.5 and if ai < 0 then P w,i = 0 v in [m/s]
if CO2i < 0.5 X DWLTC then P w,i = Pdrag v in [m/s]
www.parlament.gv.at

Appendix 7
Selection of vehicles for PEMS testing at initial type approval
1. INTRODUCTION
Due to their particular characteristics, PEMS tests are not required to be performed for each “vehicle type with regard to emissions and vehicle repair and maintenance information” as defined in Article 2(1) of this Regulation, which is called in the following “vehicle emission type”. Several vehicle emission types may be put together by the vehicle manufacturer to form a "PEMS test family" according to the requirements of point 3, which shall be validated according to the requirements of point 4.
2. SYMBOLS, PARAMETERS AND UNITS
N - Number of vehicle emission types
NT - Minimum number of vehicle emission types
PMRH - highest power-to-mass-ratio of all vehicles in the PEMS test
family
PMRL - lowest power-to-mass-ratio of all vehicles in the PEMS test
family
V_eng_max - maximum engine volume of all vehicles within the PEMS test
family
3. PEMS TEST FAMILY BUILDING
A PEMS test family shall comprise vehicles with similar emission characteristics. Upon the choice of the manufacturer vehicle emission types may be included in a PEMS test family only if they are identical with respect to the characteristics in points 3.1. and 3.2.
www.parlament.gv.at
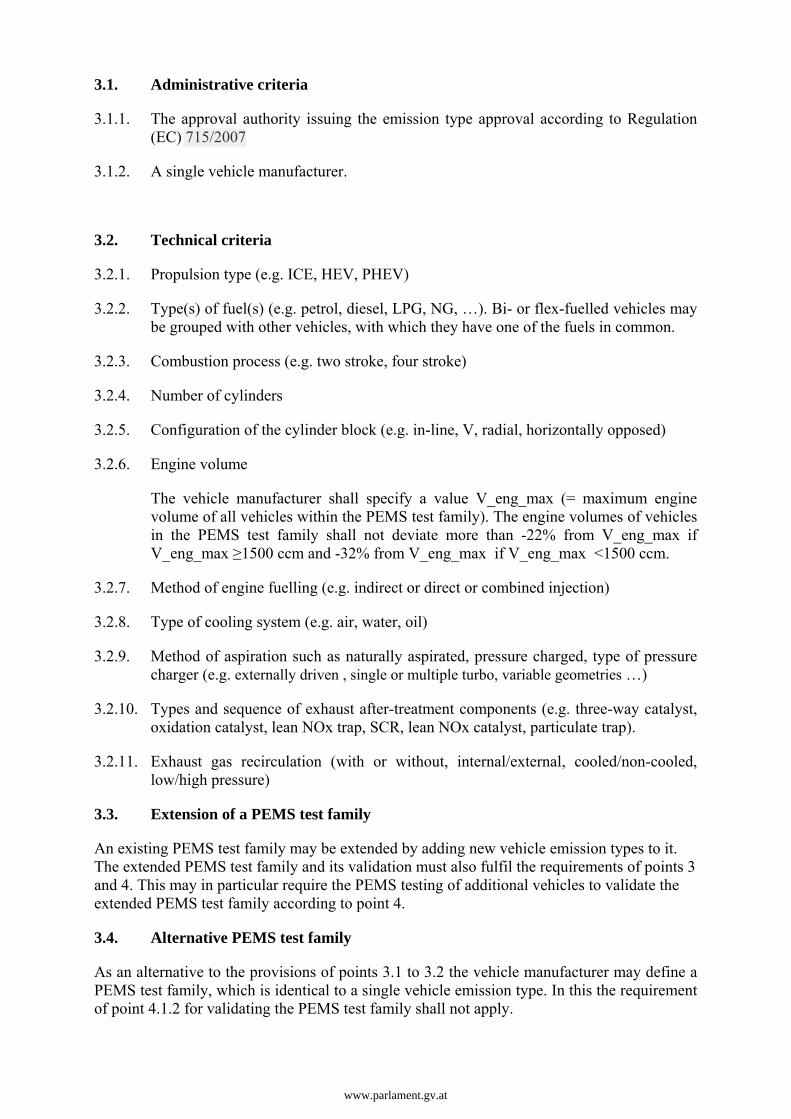
3.1. Administrative criteria
3.1.1. The approval authority issuing the emission type approval according to Regulation (EC) 715/2007
3.1.2. A single vehicle manufacturer.
3.2. Technical criteria
3.2.1. Propulsion type (e.g. ICE, HEV, PHEV)
3.2.2. Type(s) of fuel(s) (e.g. petrol, diesel, LPG, NG, …). Bi- or flex-fuelled vehicles may be grouped with other vehicles, with which they have one of the fuels in common.
3.2.3. Combustion process (e.g. two stroke, four stroke)
3.2.4. Number of cylinders
3.2.5. Configuration of the cylinder block (e.g. in-line, V, radial, horizontally opposed)
3.2.6. Engine volume
The vehicle manufacturer shall specify a value V_eng_max (= maximum engine volume of all vehicles within the PEMS test family). The engine volumes of vehicles in the PEMS test family shall not deviate more than -22% from V_eng_max if V_eng_max 1500 ccm and -32% from V_eng_max if V_eng_max <1500 ccm.
3.2.7. Method of engine fuelling (e.g. indirect or direct or combined injection)
3.2.8. Type of cooling system (e.g. air, water, oil)
3.2.9. Method of aspiration such as naturally aspirated, pressure charged, type of pressure charger (e.g. externally driven , single or multiple turbo, variable geometries …)
3.2.10. Types and sequence of exhaust after-treatment components (e.g. three-way catalyst, oxidation catalyst, lean NOx trap, SCR, lean NOx catalyst, particulate trap).
3.2.11. Exhaust gas recirculation (with or without, internal/external, cooled/non-cooled, low/high pressure)
3.3. Extension of a PEMS test family
An existing PEMS test family may be extended by adding new vehicle emission types to it. The extended PEMS test family and its validation must also fulfil the requirements of points 3 and 4. This may in particular require the PEMS testing of additional vehicles to validate the extended PEMS test family according to point 4.
3.4. Alternative PEMS test family
As an alternative to the provisions of points 3.1 to 3.2 the vehicle manufacturer may define a PEMS test family, which is identical to a single vehicle emission type. In this the requirement of point 4.1.2 for validating the PEMS test family shall not apply.
www.parlament.gv.at

4. VALIDATION OF A PEMS TEST FAMILY
4.1. General requirements for validating a PEMS test family
4.1.1. The vehicle manufacturer presents a representative vehicle of the PEMS test family to the type approval authority. The vehicle shall be subject to a PEMS test carried out by a Technical Service to demonstrate compliance of the representative vehicle with the requirements of this Annex.
4.1.2. The authority responsible for issuing the emission type approval in accordance with Regulation (EC) No 715/2007 selects additional vehicles according to the requirements of point 4.2 of this Appendix for PEMS testing carried out by a Technical Service to demonstrate compliance of the selected vehicles with the requirements of this Annex. The technical criteria for selection of an additional vehicle according to point 4.2 of this Appendix. shall be recorded with the test results.
4.1.3. With agreement of the type approval authority, a PEMS test can also be driven by a different operator witnessed by a Technical Service, provided that at least the tests of the vehicles required by of this Appendix s 4.2.2 and 4.2.6. and in total at least 50% of the PEMS tests required by this Appendix for validating the PEMS test family are driven by a Technical Service. In such case the Technical Service remains responsible for the proper execution of all PEMS tests pursuant to the requirements of this Annex.
4.1.4. A PEMS test results of a specific vehicle may be used for validating different PEMS test families according to the requirements of this Appendix under the following conditions:
– the vehicles included in all PEMS test families to be validated are approved by a single authority according to the requirements of Regulation (EC) 715/2007 and this authority agrees to the use of the specific vehicle's PEMS test results for validating different PEMS test families;
– each PEMS test family to be validated includes a vehicle emission type, which comprises the specific vehicle;
For each validation the applicable responsibilities are considered to be borne by the manufacturer of the vehicles in the respective family, regardless of whether this manufacturer was involved in the PEMS test of the specific vehicle emission type.
4.2. Selection of vehicles for PEMS testing when validating a PEMS test family
By selecting vehicles from a PEMS test family it should be ensured that the following technical characteristics relevant for pollutant emissions are covered by a PEMS test. One vehicle selected for testing can be representative for different technical characteristics. For the validation of a PEMS test family vehicles shall be selected for PEMS testing as follows:
www.parlament.gv.at

4.2.1. For each combination of fuels (e.g. petrol-LPG, petrol-NG, petrol only), on which some vehicle of the PEMS test family can operate, at least one vehicle that can operate on this combination of fuels shall be selected for PEMS testing.
4.2.2. The manufacturer shall specify a value PMRH (= highest power-to-mass-ratio of all vehicles in the PEMS test family) and a value PMRL (= lowest power-to-mass-ratio of all vehicles in the PEMS test family). Here the "power-to-mass-ratio" corresponds to the ratio of the maximum net power of the internal combustion engine as indicated in point 3.2.1.8 of Appendix 3 to Annex I of this Regulation and of the reference mass as defined in Article 3(3) of Regulation (EC) No 715/2007. At least one vehicle configuration representative for the specified PMRH and one vehicle configuration representative for the specified PMRL of a PEMS test family shall be selected for testing. If the power-to-mass ratio of a vehicle deviates by not more than 5% from the specified value for PMRH, or PMRL, the vehicle should be considered as representative for this value.
4.2.3. At least one vehicle for each transmission type (e.g., manual, automatic, DCT) installed in vehicles of the PEMS test family shall be selected for testing.
4.2.4. At least one four-wheel drive vehicle (4x4 vehicle) shall be selected for testing if such vehicles are part of the PEMS test family.
4.2.5. For each engine volume occurring on a vehicle in the PEMS family at least one representative vehicle shall be tested.
4.2.6. At least one vehicle for each number of installed exhaust after-treatment components shall be selected for testing.
4.2.7. Notwithstanding the provisions in points 4.2.1 to 4.2.6, at least the following number of vehicle emission types of a given PEMS test family shall be selected for testing:
www.parlament.gv.at

Number N of vehicle emission types in a PEMS
test family
Minimum number NT of vehicle emission types
selected for PEMS testing
1 1
from 2 to 4 2
from 5 to 7 3
from 8 to 10 4
from 11 to 49 NT = 3 + 0,1 x N (*)
more than 49 NT = 0,15 x N (*)
(*) NT shall be rounded to the next higher integer number
5. REPORTING
5.1. The vehicle manufacturer provides a full description of the PEMS test family, which includes in particular the technical criteria described in point 3.2 and submits it to the responsible type approval authority.
5.2. The manufacturer attributes a unique identification number of the format MS-OEM-X-Y to the PEMS test family and communicates it to the type approval authority. Here MS is the distinguishing number of the Member State issuing the EC type-approval1, OEM is the 3 character manufacturer, X is a sequential number identifying the original PEMS test family and Y is a counter for its extensions (starting with 0 for a PEMS test family not extended yet).
5.3. The type approval authority and the vehicle manufacturer shall maintain a list of vehicle emission types being part of a given PEMS test family on the basis of emission type approval numbers. For each emission type all corresponding combinations of vehicle type approval numbers, types, variants and versions as defined in sections 0.10 and 0.2 of the vehicle's EC certificate of conformity shall be provided as well.
5.4. The type approval authority and the vehicle manufacturer shall maintain a list of vehicle emission types selected for PEMS testing in order validate a PEMS test family in accordance with point 4 , which also provides the necessary information on
1 1 for Germany; 2 for France; 3 for Italy; 4 for the Netherlands; 5 for Sweden; 6 for Belgium; 7 for Hungary; 8 for the Czech Republic; 9 for Spain; 11 for the United Kingdom; 12 for Austria; 13 for Luxembourg; 17 for Finland; 18 for Denmark; 19 for Romania; 20 for Poland; 21 for Portugal; 23 for Greece; 24 for Ireland. 25 for Croatia; 26 for Slovenia; 27 for Slovakia; 29 for Estonia; 32 for Latvia; 34 for Bulgaria; 36 for Lithuania; 49 for Cyprus; 50 for Malta
www.parlament.gv.at

how the selection criteria of point 4.2 are covered. This list shall also indicate whether the provisions of point 4.1.3 were applied for a particular PEMS test.
www.parlament.gv.at

Appendix 8
Data exchange and reporting requirements
1. INTRODUCTION
This Appendix describes the requirements for the data exchange between the measurement systems and the data evaluation software and for the reporting and exchange of intermediate and final results after the completion of the data evaluation.
The exchange and reporting of mandatory and optional parameters shall follow the requirements of point 3.2 of Appendix 1. The data specified in the exchange and reporting files of point 3 shall be reported to ensure a complete traceability of final results.
2. SYMBOLS, PARAMETERS AND UNITS
a1 - coefficient of the CO2 characteristic curve
b1 - coefficient of the CO2 characteristic curve
a2 - coefficient of the CO2 characteristic curve
b2 - coefficient of the CO2 characteristic curve
k11 - coefficient of the weighing function
k12 - coefficient of the weighing function
k21 - coefficient of the weighing function
k22 - coefficient of the weighing function
tol1 - primary tolerance
tol2 - secondary tolerance
www.parlament.gv.at

3. DATA EXCHANGE AND REPORTING FORMAT
3.1. General
Emission values as well as any other relevant parameters shall be reported and exchanged as csv-formatted data file. Parameter values shall be separated by a comma, ASCII-Code #h2C. The decimal marker of numerical values shall be a point, ASCII-Code #h2E. Lines shall be terminated by carriage return, ASCII-Code #h0D. No thousands separators shall be used.
3.2. Data exchange
Data shall be exchanged between the measurement systems and the data evaluation software by means of a standardised reporting file that contains a minimum set of mandatory and optional parameters. The data exchange file shall be structured as follows: The first 195 lines shall be reserved for a header that provides specific information about, e.g., the test conditions, the identity and calibration of the PEMS equipment (Table 1). Lines 198-200 shall contain the labels and units of parameters. Lines 201 and all consecutive data lines shall comprise the body of the data exchange file and report parameter values (Table 2). The body of the data exchange file shall contain at least as many data lines as the test duration in seconds multiplied by the recording frequency in Hertz.
3.3. Intermediate and final results
Manufacturers shall record summary parameters of intermediate results as structured in Table 3. The information in Table 3 shall be obtained prior to the application of the data evaluation methods laid down in Appendices 5 and 6.
The vehicle manufacturer shall record the results of the two data evaluation methods in separate files. The results of the data evaluation with the method described in Appendix 5 shall be reported according to Tables 4, 5 and 6. The results of the data evaluation with the method described in Appendix 6 shall be reported according to Tables 7, 8 and 9. The header of the data reporting file shall be composed of three parts. The first 95 lines shall be reserved for specific information about the settings of the data evaluation method. Lines 101-195 shall report the results of the data evaluation method. Lines 201-490 shall be reserved for reporting the final emission results. Line 501 and all consecutive data lines comprise the body of the data reporting file and shall contain the detailed results of the data evaluation.
4. TECHNICAL REPORTING TABLES
4.1. Data exchange
www.parlament.gv.at

Table 1
Header of the data exchange file
Line Parameter Description/unit
1 TEST ID [code]
2 Test date [day.month.year]
3 Organisation supervising the test [name of the organization]
4 Test location [city, country]
5 Person supervising the test [name of the principal supervisor]
6 Vehicle driver [name of the driver]
7 Vehicle type [vehicle name]
8 Vehicle manufacturer [name]
9 Vehicle model year [year]
10 Vehicle ID [VIN code]
11 Odometer value at test start [km]
12 Odometer value at test end [km]
13 Vehicle category [category]
14 Type approval emissions limit [Euro X]
15 Engine type [e.g., spark ignition, compression ignition]
16 Engine rated power [kW]
17 Peak torque [Nm]
18 Engine displacement [ccm]
19 Transmission [e.g., manual, automatic]
20 Number of forward gears [#]
21 Fuel [e.g., gasoline, diesel]
22 Lubricant [product label]
23 Tire size [width/height/rim diameter]
24 Front and rear axle tire pressure [bar; bar]
25 Road load parameters [F0, F1, F2]
www.parlament.gv.at

26 Type-approval test cycle [NEDC, WLTC]
27 Type-approval CO2 emissions [g/km]
28 CO2 emissions in WLTC mode Low [g/km]
29 CO2 emissions in WLTC mode Mid [g/km]
30 CO2 emissions in WLTC mode High [g/km]
31 CO2 emissions in WLTC mode Extra High [g/km]
32 Vehicle test mass(1) [kg;%(2)]
33 PEMS manufacturer [name]
34 PEMS type [PEMS name]
35 PEMS serial number [number]
36 PEMS power supply [e.g., battery type]
37 Gas analyser manufacturer [name]
38 Gas analyser type [type]
39 Gas analyser serial number [number]
40-50(3) … …
51 EFM manufacturer(4) [name]
52 EFM sensor type(4) [functional principle]
53 EFM serial number(4) [number]
54 Source of exhaust mass flow rate [EFM/ECU/sensor]
55 Air pressure sensor [type, manufacturer]
56 Test date [day.month.year]
57 Start time of pre-test procedure [h:min]
58 Start time of trip [h:min]
59 Start time of post-test procedure [h:min]
60 End time of pre-test procedure [h:min]
61 End time of trip [h:min]
62 End time of post-test procedure [h:min]
63-70(5) … …
www.parlament.gv.at

71 Time correction: Shift THC [s]
72 Time correction: Shift CH4 [s]
73 Time correction: Shift NMHC [s]
74 Time correction: Shift O2 [s]
75 Time correction: Shift PN [s]
76 Time correction: Shift CO [s]
77 Time correction: Shift CO2 [s]
78 Time correction: Shift NO [s]
79 Time correction: Shift NO2 [s]
80 Time correction: Shift exhaust mass flow rate [s]
81 Span reference value THC [ppm]
82 Span reference value CH4 [ppm]
83 Span reference value NMHC [ppm]
84 Span reference value O2 [%]
85 Span reference value PN [#]
86 Span reference value CO [ppm]
87 Span reference value CO2 [%]
88 Span reference value NO [ppm]
89 Span Reference Value NO2 [ppm]
90-95(5) … …
96 Pre-test zero response THC [ppm]
97 Pre-test zero response CH4 [ppm]
98 Pre-test zero response NMHC [ppm]
99 Pre-test zero response O2 [%]
100 Pre-test zero response PN [#]
101 Pre-test zero response CO [ppm]
102 Pre-test zero response CO2 [%]
103 Pre-test zero response NO [ppm]
www.parlament.gv.at

104 Pre-test zero response NO2 [ppm]
105 Pre-test span response THC [ppm]
106 Pre-test span response CH4 [ppm]
107 Pre-test span response NMHC [ppm]
108 Pre-test span response O2 [%]
109 Pre-test span response PN [#]
110 Pre-test span response CO [ppm]
111 Pre-test span response CO2 [%]
112 Pre-test span response NO [ppm]
113 Pre-test span response NO2 [ppm]
114 Post-test zero response THC [ppm]
115 Post-test zero response CH4 [ppm]
116 Post-test zero response NMHC [ppm]
117 Post-test zero response O2 [%]
118 Post-test zero response PN [#]
119 Post-test zero response CO [ppm]
120 Post-test zero response CO2 [%]
121 Post-test zero response NO [ppm]
122 Post-test zero response NO2 [ppm]
123 Post-test span response THC [ppm]
124 Post-test span response CH4 [ppm]
125 Post-test span response NMHC [ppm]
126 Post-test span response O2 [%]
127 Post-test span response PN [#]
128 Post-test span response CO [ppm]
129 Post-test span response CO2 [%]
130 Post-test span response NO [ppm]
131 Post-test span response NO2 [ppm]
www.parlament.gv.at

132 PEMS validation – results THC [mg/km;%](6)
133 PEMS validation – results CH4 [mg/km;%](6)
134 PEMS validation – results NMHC [mg/km;%](6)
135 PEMS validation – results PN [#/km;%](6)
136 PEMS validation – results CO [mg/km;%](6)
137 PEMS validation – results CO2 [g/km;%](6)
138 PEMS validation – results NOX [mg/km;%](6)
…(7) …(7) …(7)
(1) Mass of the vehicle as tested on the road, including the mass of the driver and all PEMS components.
(2) Percentage shall indicate the deviation from the gross vehicle weight.
(3) Placeholders for additional information about analyser manufacturer and serial number in case multiple analysers are used. Number of reserved rows is indicative only; no empty rows shall occur in the completed data reporting file.
(4) Mandatory if the exhaust mass flow rate is determined by an EFM.
(5) If required, additional information may be added here.
(6) PEMS validation is optional; distance-specific emissions as measured with the PEMS; Percentage shall indicate the deviation from the laboratory reference
(7) Additional parameters may be added until line 195 to characterise and label the test.
Table 2
Body of the data exchange file; the rows and columns of this table shall be transposed in the body of the data exchange file
Line 198 199(1) 200 201
Time trip [s] (2)
Vehicle speed(3) Sensor [km/h] (2)
Vehicle speed(3) GPS [km/h] (2)
Vehicle speed(3) ECU [km/h] (2)
Latitude GPS [deg:min:s] (2)
www.parlament.gv.at

Longitude GPS [deg:min:s] (2)
Altitude(3) GPS [m] (2)
Altitude(3) Sensor [m] (2)
Ambient pressure Sensor [kPa] (2)
Ambient temperature Sensor [K] (2)
Ambient humidity Sensor [g/kg; %] (2)
THC concentration Analyser [ppm] (2)
CH4 concentration Analyser [ppm] (2)
NMHC concentration Analyser [ppm] (2)
CO concentration Analyser [ppm] (2)
CO2 concentration Analyser [ppm] (2)
NOX concentration Analyser [ppm] (2)
NO concentration Analyser [ppm] (2)
NO2 concentration Analyser [ppm] (2)
O2 concentration Analyser [ppm] (2)
PN concentration Analyser [#/m3] (2)
Exhaust mass flow rate EFM [kg/s] (2)
Exhaust temperature in the EFM EFM [K] (2)
Exhaust mass flow rate Sensor [kg/s] (2)
Exhaust mass flow rate ECU [kg/s] (2)
THC mass Analyser [g/s] (2)
CH4 mass Analyser [g/s] (2)
NMHC mass Analyser [g/s] (2)
CO mass Analyser [g/s] (2)
CO2 mass Analyser [g/s] (2)
www.parlament.gv.at

NOX mass Analyser [g/s] (2)
NO mass Analyser [g/s] (2)
NO2 mass Analyser [g/s] (2)
O2 mass Analyser [g/s] (2)
PN Analyser [#/s] (2)
Gas measurement active PEMS
[active (1); inactive (0); error (>1)]
(2)
Engine speed ECU [rpm] (2)
Engine torque ECU [Nm] (2)
Torque at driven axle Sensor [Nm] (2)
Wheel rotational speed Sensor [rad/s] (2)
Fuel rate ECU [g/s] (2)
Engine fuel flow ECU [g/s] (2)
Engine intake air flow ECU [g/s] (2)
Coolant temperature ECU [K] (2)
Oil temperature ECU [K] (2)
Regeneration status ECU - (2)
Pedal position ECU [%] (2)
Vehicle status ECU [error (1); normal (0)]
(2)
Per cent torque ECU [%] (2)
Per cent friction torque ECU [%] (2)
State of charge ECU [%] (2)
…(4) …(4) …(4) (2,4)
(1) This column can be omitted if the parameter source is part of the label in column 198.
(2) Actual values to be included from line 201 onward until the end of data
(3) To be determined by at least one method
www.parlament.gv.at

(4) Additional parameters may be added to characterise vehicle and test conditions.
4.2. Intermediate and final results
4.2.1. Intermediate results
Table 3
Reporting file #1 - Summary parameters of intermediate results
Line Parameter Description/unit
1 Total trip distance [km]
2 Total trip duration [h:min:s]
3 Total stop time [min:s]
4 Trip average speed [km/h]
5 Trip maximum speed [km/h]
6 Average THC concentration [ppm]
7 Average CH4 concentration [ppm]
8 Average NMHC concentration [ppm]
9 Average CO concentration [ppm]
10 Average CO2 concentration [ppm]
11 Average NOX concentration [ppm]
12 Average PN concentration [#/m3]
13 Average exhaust mass flow rate [kg/s]
14 Average exhaust temperature [K]
15 Maximum exhaust temperature [K]
16 Cumulated THC mass [g]
17 Cumulated CH4 mass [g]
18 Cumulated NMHC mass [g]
19 Cumulated CO mass [g]
www.parlament.gv.at

20 Cumulated CO2 mass [g]
21 Cumulated NOX mass [g]
22 Cumulated PN [#]
23 Total trip THC emissions [mg/km]
24 Total trip CH4 emissions [mg/km]
25 Total trip NMHC emissions [mg/km]
26 Total trip CO emissions [mg/km]
27 Total trip CO2 emissions [g/km]
28 Total trip NOX emissions [mg/km]
29 Total trip PN emissions [#/km]
30 Distance urban part [km]
31 Duration urban part [h:min:s]
32 Stop time urban part [min:s]
33 Average speed urban part [km/h]
34 Maximum speed urban part [km/h]
35 Average urban THC concentration [ppm]
36 Average urban CH4 concentration [ppm]
37 Average urban NMHC concentration [ppm]
38 Average urban CO concentration [ppm]
39 Average urban CO2 concentration [ppm]
40 Average urban NOX concentration [ppm]
41 Average urban PN concentration [#/m3]
42 Average urban exhaust mass flow rate [kg/s]
43 Average urban exhaust temperature [K]
44 Maximum urban exhaust temperature [K]
45 Cumulated urban THC mass [g]
46 Cumulated urban CH4 mass [g]
47 Cumulated urban NMHC mass [g]
www.parlament.gv.at

48 Cumulated urban CO mass [g]
49 Cumulated urban CO2 mass [g]
50 Cumulated urban NOX mass [g]
51 Cumulated urban PN [#]
52 Urban THC emissions [mg/km]
53 Urban CH4 emissions [mg/km]
54 Urban NMHC emissions [mg/km]
55 Urban CO emissions [mg/km]
56 Urban CO2 emissions [g/km]
57 Urban NOX emissions [mg/km]
58 Urban PN emissions [#/km]
59 Distance rural part [km]
60 Duration rural part [h:min:s]
61 Stop time rural part [min:s]
62 Average speed rural part [km/h]
63 Maximum speed rural part [km/h]
64 Average rural THC concentration [ppm]
65 Average rural CH4 concentration [ppm]
66 Average rural NMHC concentration [ppm]
67 Average rural CO concentration [ppm]
68 Average rural CO2 concentration [ppm]
69 Average rural NOX concentration [ppm]
70 Average rural PN concentration [#/m3]
71 Average rural exhaust mass flow rate [kg/s]
72 Average rural exhaust temperature [K]
73 Maximum rural exhaust temperature [K]
74 Cumulated rural THC mass [g]
75 Cumulated rural CH4 mass [g]
www.parlament.gv.at

76 Cumulated rural NMHC mass [g]
77 Cumulated rural CO mass [g]
78 Cumulated rural CO2 mass [g]
79 Cumulated rural NOX mass [g]
80 Cumulated rural PN [#]
81 Rural THC emissions [mg/km]
82 Rural CH4 emissions [mg/km]
83 Rural NMHC emissions [mg/km]
84 Rural CO emissions [mg/km]
85 Rural CO2 emissions [g/km]
86 Rural NOX emissions [mg/km]
87 Rural PN emissions [#/km]
88 Distance motorway part [km]
89 Duration motorway part [h:min:s]
90 Stop time motorway part [min:s]
91 Average speed motorway part [km/h]
92 Maximum speed motorway part [km/h]
93 Average motorway THC concentration [ppm]
94 Average motorway CH4 concentration [ppm]
95 Average motorway NMHC concentration [ppm]
96 Average motorway CO concentration [ppm]
97 Average motorway CO2 concentration [ppm]
98 Average motorway NOX concentration [ppm]
99 Average motorway PN concentration [#/m3]
100 Average motorway exhaust mass flow rate [kg/s]
101 Average motorway exhaust temperature [K]
102 Maximum motorway exhaust temperature [K]
103 Cumulated motorway THC mass [g]
www.parlament.gv.at
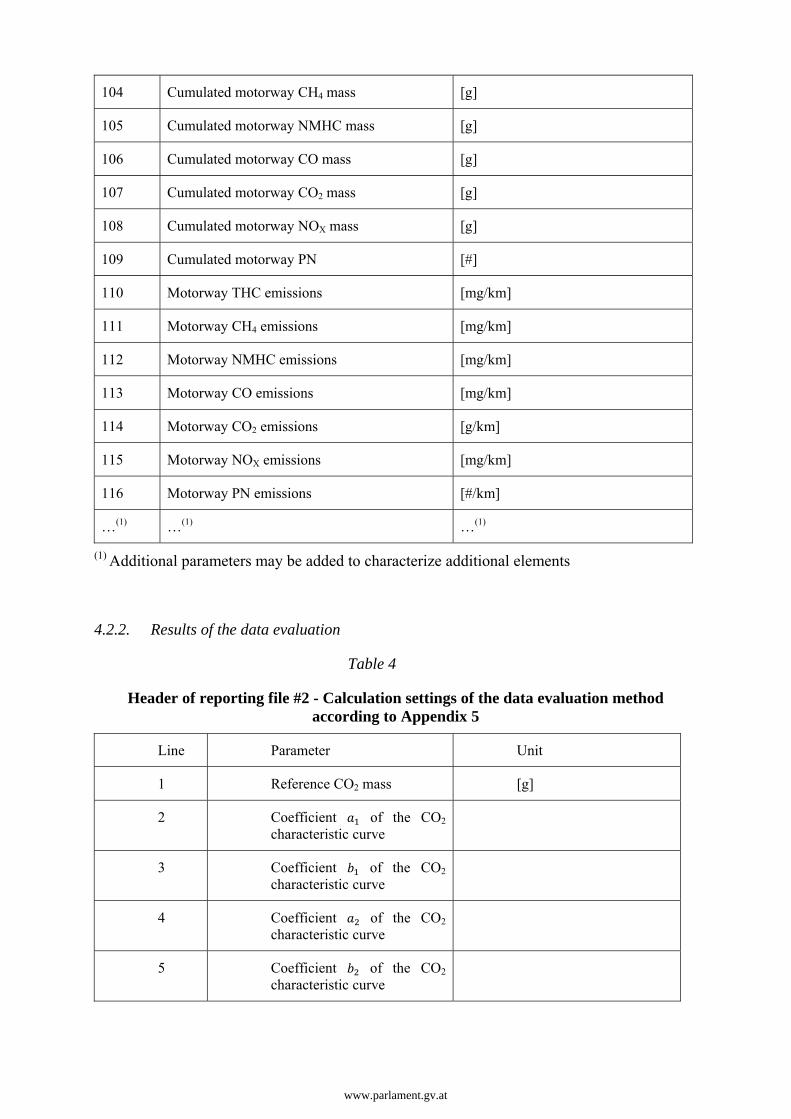
104 Cumulated motorway CH4 mass [g]
105 Cumulated motorway NMHC mass [g]
106 Cumulated motorway CO mass [g]
107 Cumulated motorway CO2 mass [g]
108 Cumulated motorway NOX mass [g]
109 Cumulated motorway PN [#]
110 Motorway THC emissions [mg/km]
111 Motorway CH4 emissions [mg/km]
112 Motorway NMHC emissions [mg/km]
113 Motorway CO emissions [mg/km]
114 Motorway CO2 emissions [g/km]
115 Motorway NOX emissions [mg/km]
116 Motorway PN emissions [#/km]
…(1) …(1) …(1)
(1) Additional parameters may be added to characterize additional elements
4.2.2. Results of the data evaluation
Table 4
Header of reporting file #2 - Calculation settings of the data evaluation method according to Appendix 5
Line Parameter Unit
1 Reference CO2 mass [g]
2 Coefficient of the CO2 characteristic curve
3 Coefficient of the CO2 characteristic curve
4 Coefficient of the CO2 characteristic curve
5 Coefficient of the CO2 characteristic curve
www.parlament.gv.at

6 Coefficient of the weighing function
7 Coefficient of the weighing function
8 Coefficient = of the weighing function
9 Primary tolerance [%]
10 Secondary tolerance [%]
11 Calculation software and version (e.g. EMROAD 5.8)
…(1) …(1) …(1)
(1) Additional parameters may be added until line 95 to characterize calculation settings
Table 5a
Header of reporting file #2 – Results of the data evaluation method according to Appendix 5
Line Parameter Unit
101 Number of windows
102 Number of urban windows
103 Number of rural windows
104 Number of motorway windows
105 Share of urban windows [%]
106 Share of rural windows [%]
107 Share of motorway windows [%]
108 Share of urban windows greater than 15% (1=Yes, 0=No)
109 Share of rural windows greater than 15% (1=Yes, 0=No)
110 Share of motorway windows greater than 15% (1=Yes, 0=No)
www.parlament.gv.at

111 Number of windows within ±
112 Number of urban windows within ±
113 Number of rural windows within ±
114 Number of motorway windows within ±
115 Number of windows within ±
116 Number of urban windows within ±
117 Number of rural windows within ±
118 Number of motorway windows within ±
119 Share of urban windows within ± [%]
120 Share of rural windows within ± [%]
121 Share of motorway windows within ± [%]
122 Share of urban windows within ± greater than 50% (1=Yes, 0=No)
123 Share of rural windows within ± greater than 50% (1=Yes, 0=No)
124 Share of motorway windows within ± greater than 50% (1=Yes, 0=No)
125 Average severity index of all windows [%]
126 Average severity index of urban windows [%]
127 Average severity index of rural windows [%]
128 Average severity index of motorway windows [%]
129 Weighted THC emissions of urban windows [mg/km]
www.parlament.gv.at

130 Weighted THC emissions of rural windows [mg/km]
131 Weighted THC emissions of motorway windows [mg/km]
132 Weighted CH4 emissions of urban windows [mg/km]
133 Weighted CH4 emissions of rural windows [mg/km]
134 Weighted CH4 emissions of motorway windows [mg/km]
135 Weighted NMHC emissions of urban windows [mg/km]
136 Weighted NMHC emissions of rural windows [mg/km]
137 Weighted NMHC emissions of motorway windows [mg/km]
138 Weighted CO emissions of urban windows [mg/km]
139 Weighted CO emissions of rural windows [mg/km]
140 Weighted CO emissions of motorway windows [mg/km]
141 Weighted NOx emissions of urban windows [mg/km]
142 Weighted NOx emissions of rural windows [mg/km]
143 Weighted NOx emissions of motorway windows [mg/km]
144 Weighted NO emissions of urban windows [mg/km]
145 Weighted NO emissions of rural windows [mg/km]
146 Weighted NO emissions of motorway windows [mg/km]
147 Weighted NO2 emissions of urban windows [mg/km]
148 Weighted NO2 emissions of rural [mg/km]
www.parlament.gv.at

windows
149 Weighted NO2 emissions of motorway windows [mg/km]
150 Weighted PN emissions of urban windows [#/km]
151 Weighted PN emissions of rural windows [#/km]
152 Weighted PN emissions of motorway windows [#/km]
…(1) …(1) …(1)
(1) Additional parameters may be added until line 195
Table 5b
Header of reporting file #2 – Final emission results according to Appendix 5
Line Parameter Unit
201 Total trip - THC Emissions [mg/km]
202 Total trip - CH4 Emissions [mg/km]
203 Total trip - NMHC Emissions [mg/km]
204 Total trip - CO Emissions [mg/km]
205 Total trip - NOx Emissions [mg/km]
206 Total trip - PN Emissions [#/km]
…(1) …(1) …(1)
(1) Additional parameters may be added
Table 6
Body of reporting file #2 - Detailed results of the data evaluation method according to Appendix 5; the rows and columns of this table shall be transposed in the body of the
data reporting file
Line 498 499 500 501
Window Start Time [s] (1)
www.parlament.gv.at

Window End Time [s] (1)
Window Duration [s] (1)
Window Distance
Source (1=GPS, 2=ECU, 3=Sensor)
[km] (1)
Window THC emissions [g] (1)
Window CH4 emissions [g] (1)
Window NMHC emissions
[g] (1)
Window CO emissions [g] (1)
Window CO2 emissions [g] (1)
Window NOX emissions [g] (1)
Window NO emissions [g] (1)
Window NO2 emissions [g] (1)
Window O2 emissions [g] (1)
Window PN emissions [#] (1)
Window THC emissions [mg/km
] (1)
Window CH4 emissions [mg/km
] (1)
Window NMHC emissions
[mg/km]
(1)
Window CO emissions [mg/km
] (1)
www.parlament.gv.at

Window CO2 emissions [g/km] (1)
Window NOX emissions [mg/km
] (1)
Window NO emissions [mg/km
] (1)
Window NO2 emissions [mg/km
] (1)
Window O2 emissions [mg/km
] (1)
Window PN emissions [#/km] (1)
Window distance to CO2 characteristic curve hj
[%] (1)
Window weighing factor wj
[-] (1)
Window Average Vehicle Speed
Source (1=GPS, 2=ECU, 3=Sensor)
[km/h] (1)
…(2) …(2) …(2) (1,2)
(1) Actual values to be included from line 501 to line onward until the end of data
(2) Additional parameters may be added to characterise window characteristics
Table 7
Header of reporting file #3 - Calculation settings of the data evaluation method according to Appendix 6
Line Parameter Unit
1 Torque source for the power at the wheels Sensor/ECU/”Veline”
2 Slope of the Veline [g/kWh]
3 Intercept of the Veline [g/h]
4 Moving average duration [s]
www.parlament.gv.at

5 Reference speed for de-normalisation of goal pattern [km/h]
6 Reference acceleration [m/s2]
7 Power demand at the wheel hub for a vehicle at reference speed and acceleration
[kW]
8 Number of power classes including the 90% of Prated
-
9 Goal pattern layout (stretched/shrank)
10 Calculation software and version (e.g. CLEAR 1.8)
…(1) …(1) …(1)
(1) Additional parameters may be added until line 95 to characterize calculation settings
Table 8a
Header of reporting file #3 – Results of data evaluation method according to Appendix 6
Line Parameter Unit
101 Power class coverage (counts >5) (1=Yes, 0=No)
102 Power class normality (1=Yes, 0=No)
103 Total trip - Weighted average THC emissions [g/s]
104 Total trip - Weighted average CH4 emissions [g/s]
105 Total trip - Weighted average NMHC emissions [g/s]
106 Total trip - Weighted average CO emissions [g/s]
107 Total trip - Weighted average CO2 emissions [g/s]
108 Total trip - Weighted average NOX emissions [g/s]
109 Total trip - Weighted s average NO emissions [g/s]
www.parlament.gv.at

110 Total trip - Weighted average NO2 emissions [g/s]
111 Total trip - Weighted average O2 emissions [g/s]
112 Total trip - Weighted average PN emissions [#/s]
113 Total trip - Weighted average Vehicle Speed [km/h]
114 Urban - Weighted average THC emissions [g/s]
115 Urban - Weighted average CH4 emissions [g/s]
116 Urban - Weighted average NMHC emissions [g/s]
117 Urban - Weighted average CO emissions [g/s]
118 Urban - Weighted average CO2 emissions [g/s]
119 Urban - Weighted average NOX emissions [g/s]
120 Urban - Weighted s average NO emissions [g/s]
121 Urban - Weighted average NO2 emissions [g/s]
122 Urban - Weighted average O2 emissions [g/s]
123 Urban - Weighted average PN emissions [#/s]
124 Urban - Weighted average Vehicle Speed [km/h]
…(1) …(1) …(1)
(1) Additional parameters may be added until line 195
Table 8b
Header of reporting file #3 – Final emissions results according to Appendix 6
www.parlament.gv.at

Parameter Unit
Total trip - THC Emissions [mg/km]
Total trip - CH4 Emissions [mg/km]
Total trip - NMHC Emissions [mg/km]
Total trip - CO Emissions [mg/km]
Total trip - NOx Emissions [mg/km]
Total trip - PN Emissions [#/km]
…(1) …(1)
(1) Additional parameters may be added
Table 9
Body of reporting file #3 - Detailed results of the data evaluation method according to Appendix 6; the rows and columns of this table shall be transposed in the body of the
data reporting file
Line 498 499 500 501
Total trip - Power class number (1) -
Total trip - Lower power class limit(1)
[kW]
www.parlament.gv.at

Total trip - Upper power class limit(1) [kW]
Total trip - Goal pattern used (distribution) (1)
[%] (2)
Total trip - Power class occurrence (1) -
(2)
Total trip - Power class coverage >5 counts(1)
- (1=Yes, 0=No) (2)
Total trip - Power class normality(1) -
(1=Yes, 0=No) (2)
Total trip - Power class average THC emissions(1)
[g/s] (2)
Total trip - Power class average CH4 emissions(1)
[g/s] (2)
Total trip - Power class average NMHC emissions(1)
[g/s] (2)
Total trip - Power class average CO emissions(1)
[g/s] (2)
Total trip - Power class average CO2 emissions(1)
[g/s] (2)
Total trip - Power class average NOX emissions(1)
[g/s] (2)
Total trip - Power class average NO emissions(1)
[g/s] (2)
Total trip - Power class average NO2 emissions(1)
[g/s] (2)
Total trip - Power class average O2 emissions(1)
[g/s] (2)
www.parlament.gv.at

Total trip - Power class average PN emissions(1)
[#/s] (2)
Total trip - Power class average Vehicle Speed(1)
Source (1=GPS, 2=ECU, 3=Sensor)
[km/h]
(2)
Urban trip - Power class number (1) -
Urban trip - Lower power class limit(1)
[kW]
Urban trip - Upper power class limit(1) [kW]
Urban trip - Goal pattern used (distribution) (1)
[%] (2)
Urban trip - Power class occurrence(1) -
(2)
Urban trip - Power class coverage >5 counts(3)
- (1=Yes, 0=No) (2)
Urban trip - Power class normality(1) -
(1=Yes, 0=No) (2)
Urban trip - Power class average THC emissions(1)
[g/s] (2)
Urban trip - Power class average CH4 emissions(1)
[g/s] (2)
Urban trip - Power class average NMHC emissions(1)
[g/s] (2)
Urban trip - Power class average CO emissions(1)
[g/s] (2)
Urban trip - Power class average CO2 emissions(1)
[g/s] (2)
Urban trip - Power class average NOX
[g/s] (2)
www.parlament.gv.at

emissions(1)
Urban trip - Power class average NO emissions(1)
[g/s] (2)
Urban trip - Power class average NO2 emissions(1)
[g/s] (2)
Urban trip - Power class average O2 emissions(1)
[g/s] (2)
Urban trip - Power class average PN emissions(1)
[#/s] (2)
Urban trip - Power class average Vehicle Speed(1)
Source (1=GPS, 2=ECU, 3=Sensor)
[km/h]
(2)
…(4) …(4) …(4) (2,4)
(1) Results reported for each power class starting from power class #1 up to power class which includes 90% of Prated
(2) Actual values to be included from line 501 to line onward until the end of data
(3) Results reported for each power class starting from power class #1 up to power class #5
(4) Additional parameters may be added
4.3. Vehicle and engine description
The manufacturer shall provide the vehicle and engine description in accordance with Appendix 4 of Annex I.
www.parlament.gv.at

Appendix 9
Manufacturer's certificate of compliance
Manufacturer’s certificate of compliance with the Real Driving Emissions requirements
(Manufacturer):…………………………………………………………………………………
(Address of the Manufacturer):………………………………………………………………….
Certifies that
The vehicle types listed in the attachment to this Certificate comply with the requirements laid down in point 2.1 of Annex IIIA to Regulation (EC) No 692/2008 relating to real driving emissions for all possible RDE tests, which are in accordance to the requirements of this Annex.
Done at [………………………………………………………………………………(Place)]
On […………………………………………………………………………………….(Date)]
www.parlament.gv.at

………………………………………………………………
(Stamp and signature of the manufacturer’s representative)
Annex:
- List of vehicle types to which this certificate applies
www.parlament.gv.at