Embed Size (px)
Citation preview

EN EN
EN

EN EN
EUROPEAN COMMISSION
Brussels, 18.04.2011 SEC(2011) 526 final
COMMISSION STAFF WORKING DOCUMENT
Progress towards the common European objectives in education and training (2010/2011)
Indicators and benchmarks

2
Preface This is the 7th annual report examining performance and progress under the European Union's Education and Training 2010 Work Programme which was launched following agreement within the Council of Education Ministers in 2001. The new strategic framework for European cooperation in education and training (known as ET 2020) adopted by the Council in May 2009 will carry on the work between now and 2020. The purpose of this report is to provide data and research findings to underpin this policy co-operation at European level. The core of the report consists of an analysis of the progress made towards the common objectives agreed by the Council as the basis for this cooperation. The report reviews both the benchmarks agreed in May 2003 as the basis to monitor progress until 2010; and the updated set of benchmarks to be used to monitor progress until 2020 which were adopted by the Council in May 2009. It is compiled by the Commission services using existing data series and research findings. Member States, through the Standing Group on Indicators and Benchmarks (SGIB; see Annex 1) are invited to verify the data during compilation of the report. The report also reflects the creation during 2010 of the EU's Europe 2020 Strategy for its socio-economic development to 2020. Two of the five benchmarks for ET 2020 – to reduce the number of early school leavers; and to increase the share of young adults holding tertiary education qualifications – have been made headline targets of the process in respect of which Member States are expected to set national targets and outline policies to achieve these. In addition, Europe 2020 envisages a series of seven flagship initiatives of which two actions adopted during 2010 relate strongly to education and training, namely "Youth on the Move" and "An Agenda for New Skills and Jobs". The Commission furthermore adopted in December 2010 a communication on a further flagship initiative which will have important educational content, the "European Platform against Poverty". The focus on education and training within Europe 2020 has huge potential to influence the future of Europe's systems and this report accordingly pays particular attention to the issues addressed in both the headline targets and the flagship actions. The report analyses performance and progress of education systems in EU member states (27), candidate countries (3) and associated countries (3) and how they contribute towards meeting Europe's Lisbon objectives. World reference levels of performance are used in certain areas. The report shows that examples of good performance and progress can be found throughout Europe that have the potential to inspire others for improvement. At the same time, educational systems in many Member States continue to show signs of struggling in the face of major challenges. The Report helps therefore to point to possible areas for the exchange of information, experience and mutual learning, the core purpose of ET 2020, and where concerted action across Member States, as envisaged under Europe 2020, could transform Europe's educational performance. It also points to the scope for further improving the framework of indicators and benchmarks and the evidence base for policy making. Reflecting the strategic framework for future European cooperation in education and training adopted by the Council in May 2009, the report is structured in four chapters in line with the four strategic objectives of the framework, as follows:
1. Making lifelong learning and mobility a reality; 2. Improving the quality and efficiency of education and training; 3. Promoting equity, social cohesion and active citizenship; 4. Enhancing creativity and innovation, including entrepreneurship, at all levels of education and training.
3
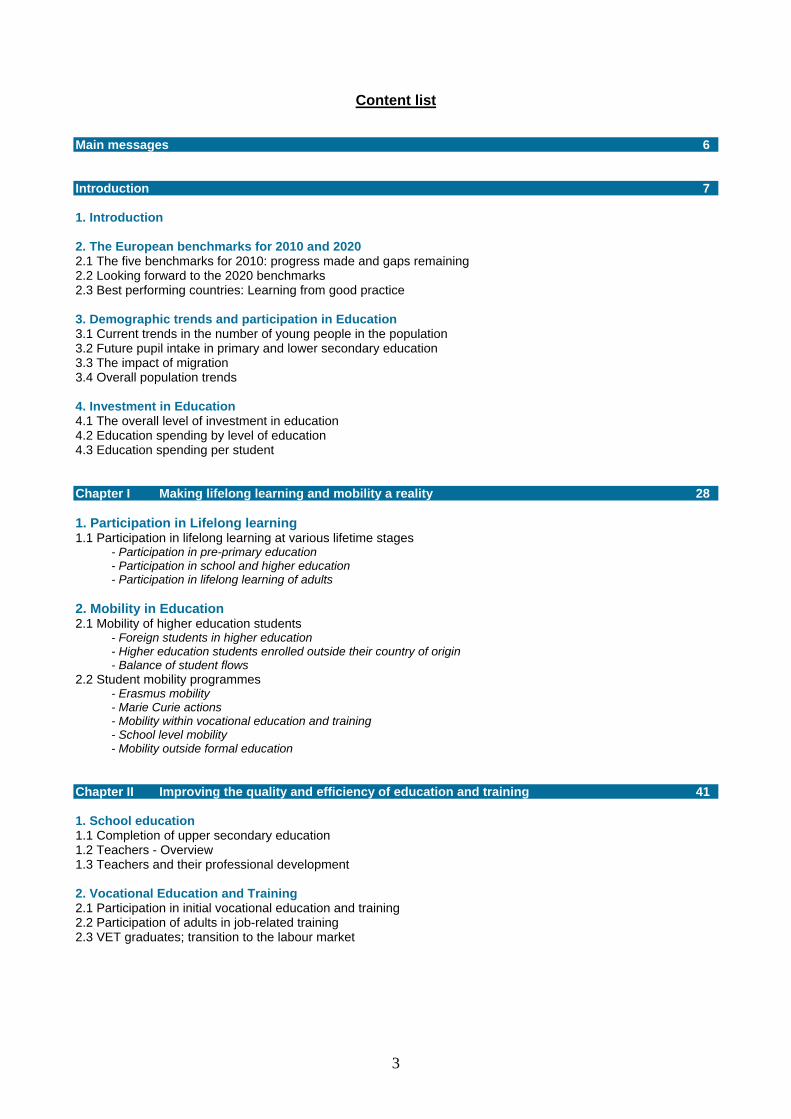
Content list
Main messages 6 Introduction 7 1. Introduction 2. The European benchmarks for 2010 and 2020 2.1 The five benchmarks for 2010: progress made and gaps remaining 2.2 Looking forward to the 2020 benchmarks 2.3 Best performing countries: Learning from good practice 3. Demographic trends and participation in Education 3.1 Current trends in the number of young people in the population 3.2 Future pupil intake in primary and lower secondary education 3.3 The impact of migration 3.4 Overall population trends 4. Investment in Education 4.1 The overall level of investment in education 4.2 Education spending by level of education 4.3 Education spending per student Chapter I Making lifelong learning and mobility a reality 28 1. Participation in Lifelong learning 1.1 Participation in lifelong learning at various lifetime stages
- Participation in pre-primary education - Participation in school and higher education - Participation in lifelong learning of adults
2. Mobility in Education 2.1 Mobility of higher education students
- Foreign students in higher education - Higher education students enrolled outside their country of origin - Balance of student flows
2.2 Student mobility programmes - Erasmus mobility - Marie Curie actions - Mobility within vocational education and training - School level mobility - Mobility outside formal education
Chapter II Improving the quality and efficiency of education and training 41 1. School education 1.1 Completion of upper secondary education 1.2 Teachers - Overview 1.3 Teachers and their professional development 2. Vocational Education and Training 2.1 Participation in initial vocational education and training 2.2 Participation of adults in job-related training 2.3 VET graduates; transition to the labour market
4
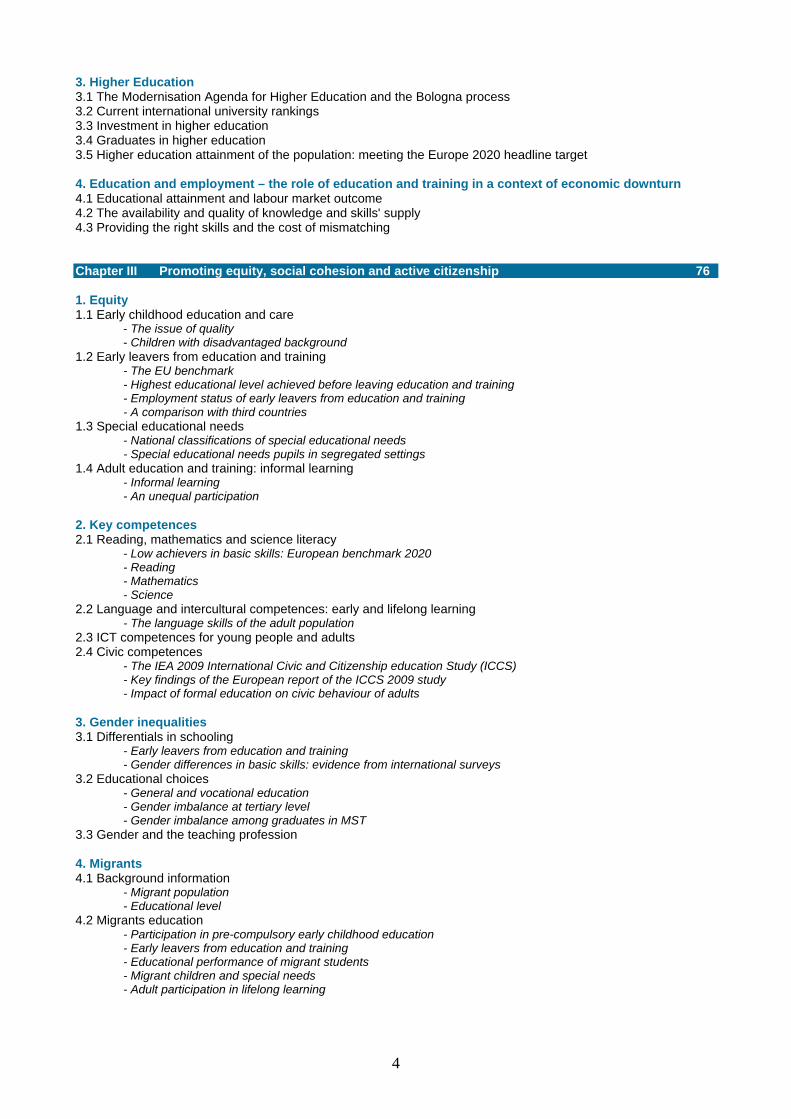
3. Higher Education 3.1 The Modernisation Agenda for Higher Education and the Bologna process 3.2 Current international university rankings 3.3 Investment in higher education 3.4 Graduates in higher education 3.5 Higher education attainment of the population: meeting the Europe 2020 headline target 4. Education and employment – the role of education and training in a context of economic downturn 4.1 Educational attainment and labour market outcome 4.2 The availability and quality of knowledge and skills' supply 4.3 Providing the right skills and the cost of mismatching Chapter III Promoting equity, social cohesion and active citizenship 76 1. Equity 1.1 Early childhood education and care - The issue of quality - Children with disadvantaged background 1.2 Early leavers from education and training - The EU benchmark - Highest educational level achieved before leaving education and training - Employment status of early leavers from education and training - A comparison with third countries 1.3 Special educational needs - National classifications of special educational needs - Special educational needs pupils in segregated settings 1.4 Adult education and training: informal learning - Informal learning - An unequal participation 2. Key competences 2.1 Reading, mathematics and science literacy - Low achievers in basic skills: European benchmark 2020 - Reading - Mathematics - Science 2.2 Language and intercultural competences: early and lifelong learning - The language skills of the adult population 2.3 ICT competences for young people and adults 2.4 Civic competences - The IEA 2009 International Civic and Citizenship education Study (ICCS) - Key findings of the European report of the ICCS 2009 study - Impact of formal education on civic behaviour of adults 3. Gender inequalities 3.1 Differentials in schooling - Early leavers from education and training - Gender differences in basic skills: evidence from international surveys 3.2 Educational choices - General and vocational education - Gender imbalance at tertiary level - Gender imbalance among graduates in MST 3.3 Gender and the teaching profession 4. Migrants 4.1 Background information - Migrant population - Educational level 4.2 Migrants education - Participation in pre-compulsory early childhood education - Early leavers from education and training - Educational performance of migrant students - Migrant children and special needs - Adult participation in lifelong learning

5
Chapter IV Enhancing creativity and Innovation, including entrepreneurship at all levels of education and training 120
Why creativity, innovation and entrepreneurship? 1. Creativity 1.1 Creativity and cultural awareness and expression 2. Innovation 2.1 The role of education in innovation 3. Graduates in Mathematics, Science and Technology 3.1 Evolution of the number of MST students 3.2 Evolution of the number of MST graduates by field and educational levels 3.3 Evolution of the number of MST graduates by type of programme 3.4 MST Graduates and researchers on the labour market 4. Entrepreneurship 4.1 Entrepreneurship education and training: analysis of existing cross-country data Annexes 135 Annex 1: Standing Group on Indicators and Benchmarks Annex 2: List of abbreviations Annex 3: Bibliography Annex 4: Statistical annex Annex 5: Country tables
6
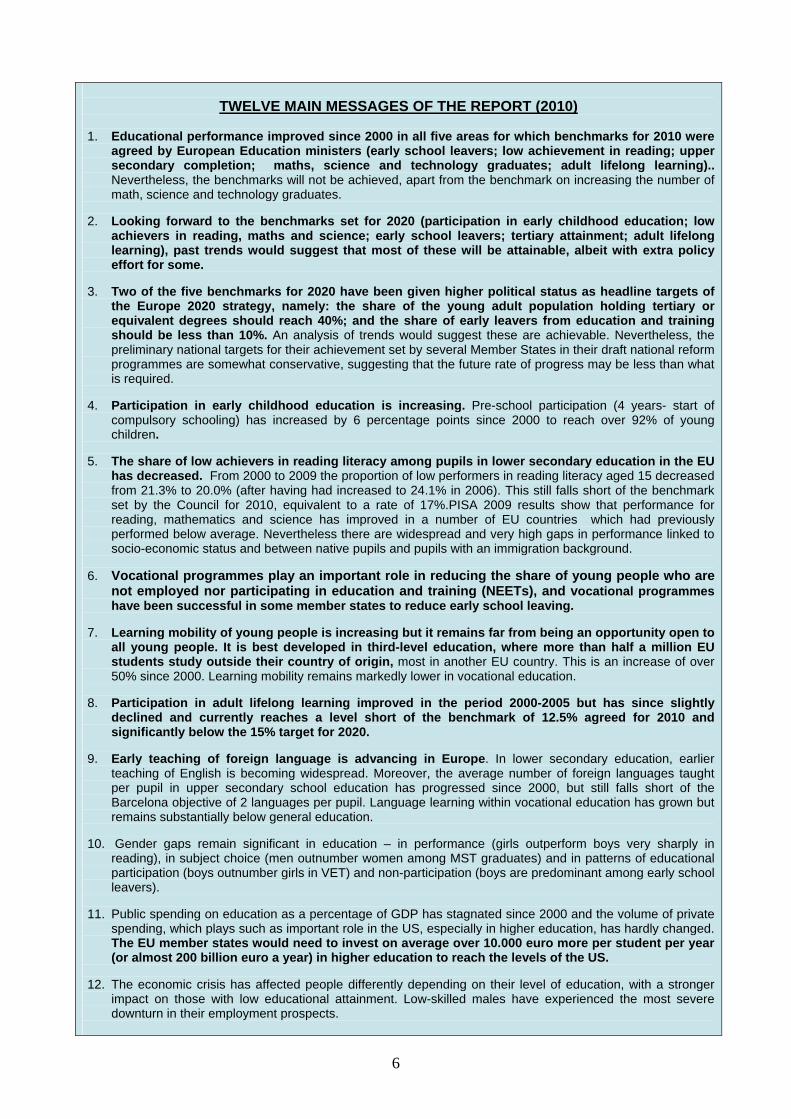
TWELVE MAIN MESSAGES OF THE REPORT (2010)
1. Educational performance improved since 2000 in all five areas for which benchmarks for 2010 were
agreed by European Education ministers (early school leavers; low achievement in reading; upper secondary completion; maths, science and technology graduates; adult lifelong learning).. Nevertheless, the benchmarks will not be achieved, apart from the benchmark on increasing the number of math, science and technology graduates.
2. Looking forward to the benchmarks set for 2020 (participation in early childhood education; low
achievers in reading, maths and science; early school leavers; tertiary attainment; adult lifelong learning), past trends would suggest that most of these will be attainable, albeit with extra policy effort for some.
3. Two of the five benchmarks for 2020 have been given higher political status as headline targets of
the Europe 2020 strategy, namely: the share of the young adult population holding tertiary or equivalent degrees should reach 40%; and the share of early leavers from education and training should be less than 10%. An analysis of trends would suggest these are achievable. Nevertheless, the preliminary national targets for their achievement set by several Member States in their draft national reform programmes are somewhat conservative, suggesting that the future rate of progress may be less than what is required.
4. Participation in early childhood education is increasing. Pre-school participation (4 years- start of
compulsory schooling) has increased by 6 percentage points since 2000 to reach over 92% of young children.
5. The share of low achievers in reading literacy among pupils in lower secondary education in the EU
has decreased. From 2000 to 2009 the proportion of low performers in reading literacy aged 15 decreased from 21.3% to 20.0% (after having had increased to 24.1% in 2006). This still falls short of the benchmark set by the Council for 2010, equivalent to a rate of 17%.PISA 2009 results show that performance for reading, mathematics and science has improved in a number of EU countries which had previously performed below average. Nevertheless there are widespread and very high gaps in performance linked to socio-economic status and between native pupils and pupils with an immigration background.
6. Vocational programmes play an important role in reducing the share of young people who are
not employed nor participating in education and training (NEETs), and vocational programmes have been successful in some member states to reduce early school leaving.
7. Learning mobility of young people is increasing but it remains far from being an opportunity open to
all young people. It is best developed in third-level education, where more than half a million EU students study outside their country of origin, most in another EU country. This is an increase of over 50% since 2000. Learning mobility remains markedly lower in vocational education.
8. Participation in adult lifelong learning improved in the period 2000-2005 but has since slightly
declined and currently reaches a level short of the benchmark of 12.5% agreed for 2010 and significantly below the 15% target for 2020.
9. Early teaching of foreign language is advancing in Europe. In lower secondary education, earlier
teaching of English is becoming widespread. Moreover, the average number of foreign languages taught per pupil in upper secondary school education has progressed since 2000, but still falls short of the Barcelona objective of 2 languages per pupil. Language learning within vocational education has grown but remains substantially below general education.
10. Gender gaps remain significant in education – in performance (girls outperform boys very sharply in
reading), in subject choice (men outnumber women among MST graduates) and in patterns of educational participation (boys outnumber girls in VET) and non-participation (boys are predominant among early school leavers).
11. Public spending on education as a percentage of GDP has stagnated since 2000 and the volume of private
spending, which plays such as important role in the US, especially in higher education, has hardly changed. The EU member states would need to invest on average over 10.000 euro more per student per year (or almost 200 billion euro a year) in higher education to reach the levels of the US.
12. The economic crisis has affected people differently depending on their level of education, with a stronger
impact on those with low educational attainment. Low-skilled males have experienced the most severe downturn in their employment prospects.

7
Introduction
1. Introduction 2. The European benchmarks for 2010 and 2020 2.1 The five benchmarks for 2010: progress made and gaps remaining 2.2 Looking forward to the 2020 benchmarks 2.3 Best performing countries: Learning from good practice 3. Demographic trends and participation in Education 3.1 Current trends in the number of young people in the population 3.2 Future pupil intake in primary and lower secondary education 3.3 The impact of migration 3.4 Overall population trends 4. Investment in Education 4.1 The overall level of investment in education 4.2 Education spending by level of education 4.3 Education spending per student

Introduction
8
1. Introduction In May 2009 the Council agreed an updated strategic framework for European cooperation in education and training as a basis to carry on the cooperative exchange on policies which had been initiated in 2001 under the umbrella of the Lisbon strategy for jobs and growth. The framework for policy cooperation, known as Education and Training 2020, will also serve as the principal mechanism to feed high-level education policy messages into the European Union's Europe 2020 Strategy to mobilise policies across the board for smart, sustainable and socially inclusive growth. Member States and the Commission working in this way use indicators and benchmarks to inform and guide evidence-based policy making and as a means to monitor progress, both at the EU and national levels towards commonly agreed strategic objectives for education and training. The Council in 2003 adopted 5 benchmarks, to be achieved by 2010, to underpin this work of policy exchange.
Five EU benchmarks for 2010 No more than 10% early school leavers; Decrease of at least 20% in the percentage of low-achieving pupils in reading literacy; At least 85% of young people should have completed upper secondary education; Increase of at least 15% in the number of tertiary graduates in Mathematics, Science and
Technology (MST), with a simultaneous decrease in the gender imbalance; 12.5% of the adult population should participate in lifelong learning.
In May 2009 when re-launching the process for the decade ahead, the Council adopted a renewed set of benchmarks to be achieved by 2020. There is by and large continuity with the earlier set of benchmarks. However, there will be new benchmarks on early childhood education and on tertiary attainment among the young adult population; a broadening of the benchmark on low reading achievement to cover mathematics and science; confirmation of the benchmarks for early school leaving and adult participation in lifelong learning, with an increase in the target level for the latter. The 2010 benchmark on increasing the completion rate of upper secondary education has been discontinued on the basis that it is closely linked to the maintained benchmark on early school leaving.
Five EU benchmarks for 2020
at least 95% of children between 4 years old and the age for starting compulsory primary education should participate in early childhood education;
the share of early leavers from education and training should be less than 10%; the share of low-achieving 15-years olds in reading, mathematics and science should be less
than 15%; the share of 30-34 year olds with tertiary educational attainment should be at least 40% an average of at least 15 % of adults should participate in lifelong learning.
Furthermore, two of these five benchmarks – to reduce the number of early school leavers; and to increase the share of young adults holding tertiary education qualifications (they are shown in bold in the above list) – have been given further importance having been selected headline targets for the Europe 2020 for socio-economic development to 2020. These benchmarks link education and the labour market and have great importance for employability and jobs. The main focus of this report is to analyse the progress that has been made in relation to the five benchmarks for 2010; and to take a first look at the trends and prospects for achieving the 2020 benchmarks. In addition, the analysis will draw where appropriate on the wider framework of 16 indicators which the Council agreed in May 2007 as a means to supplement the analysis of education systems. This wider framework allows for discussion of issues which have formed an important part of the policy exchanges between the Commission and Member States but which are not the subject of benchmarks, such as the role of teachers and trends in investment in education.
Sixteen core indicators for monitoring progress towards the Lisbon objectives
Participation in pre-school education Special needs education Early school leavers Literacy in reading, mathematics and
science Language skills ICT skills Civic skills Learning to learn skills Upper secondary completion rates
Professional development of teachers and trainers
Higher education graduates Cross-national mobility of students in
higher education Participation of adults in lifelong learning Adult skills Educational attainment of the population Investment in education and training
Introduction
9
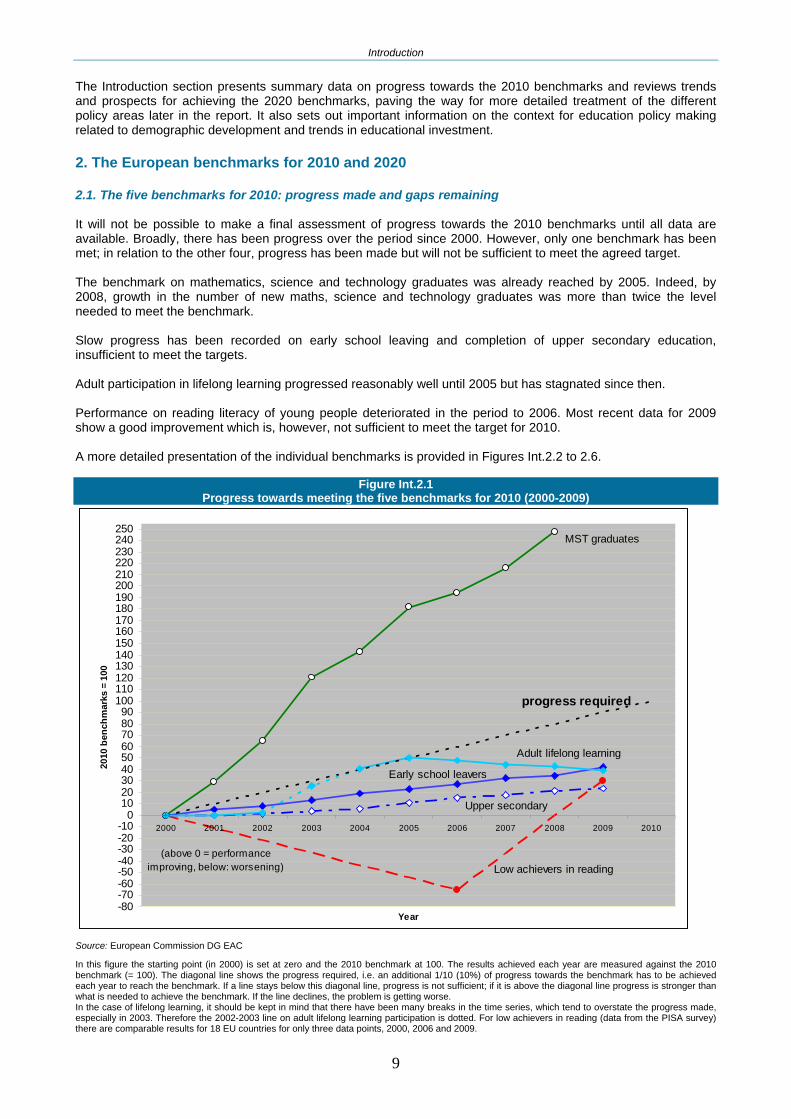
The Introduction section presents summary data on progress towards the 2010 benchmarks and reviews trends and prospects for achieving the 2020 benchmarks, paving the way for more detailed treatment of the different policy areas later in the report. It also sets out important information on the context for education policy making related to demographic development and trends in educational investment. 2. The European benchmarks for 2010 and 2020 2.1. The five benchmarks for 2010: progress made and gaps remaining It will not be possible to make a final assessment of progress towards the 2010 benchmarks until all data are available. Broadly, there has been progress over the period since 2000. However, only one benchmark has been met; in relation to the other four, progress has been made but will not be sufficient to meet the agreed target. The benchmark on mathematics, science and technology graduates was already reached by 2005. Indeed, by 2008, growth in the number of new maths, science and technology graduates was more than twice the level needed to meet the benchmark. Slow progress has been recorded on early school leaving and completion of upper secondary education, insufficient to meet the targets. Adult participation in lifelong learning progressed reasonably well until 2005 but has stagnated since then. Performance on reading literacy of young people deteriorated in the period to 2006. Most recent data for 2009 show a good improvement which is, however, not sufficient to meet the target for 2010. A more detailed presentation of the individual benchmarks is provided in Figures Int.2.2 to 2.6.
Figure Int.2.1 Progress towards meeting the five benchmarks for 2010 (2000-2009)
-80-70-60-50-40-30-20-10
0102030405060708090
100110120130140150160170180190200210220230240250
2000 2001 2002 2003 2004 2005 2006 2007 2008 2009 2010
Year
2010
ben
chm
arks
= 1
00
MST graduates
Adult lifelong learning
Early school leavers
Upper secondary
Low achievers in reading
progress required
(above 0 = performance improving, below: worsening)
Source: European Commission DG EAC In this figure the starting point (in 2000) is set at zero and the 2010 benchmark at 100. The results achieved each year are measured against the 2010 benchmark (= 100). The diagonal line shows the progress required, i.e. an additional 1/10 (10%) of progress towards the benchmark has to be achieved each year to reach the benchmark. If a line stays below this diagonal line, progress is not sufficient; if it is above the diagonal line progress is stronger than what is needed to achieve the benchmark. If the line declines, the problem is getting worse. In the case of lifelong learning, it should be kept in mind that there have been many breaks in the time series, which tend to overstate the progress made, especially in 2003. Therefore the 2002-2003 line on adult lifelong learning participation is dotted. For low achievers in reading (data from the PISA survey) there are comparable results for 18 EU countries for only three data points, 2000, 2006 and 2009.
Introduction
10
Figure Int. 2.2- Benchmark 2010: Low Performers in reading literacy (2000-2009)
LT
BEBG
CZ
DK DE
EE
IE
EL
ESFR
IT
LV
LU
HU
NL AT
PL PT
RO
SI
SK
FI
SE
UK
TR
ISEU27
NO
-10
-5
0
5
10
15
0 10 20 30 40 50
Performance (Students with low lev els of reading literacy in PISA (Lev el 1 and below),
%, 2009)
Prog
ress
(com
poun
d an
nual
gro
wth
rate
00-
09, %
)
EU Member Statesnon-EU countries
2020 benchmark(<15%)
2010 benchmark(<17%)
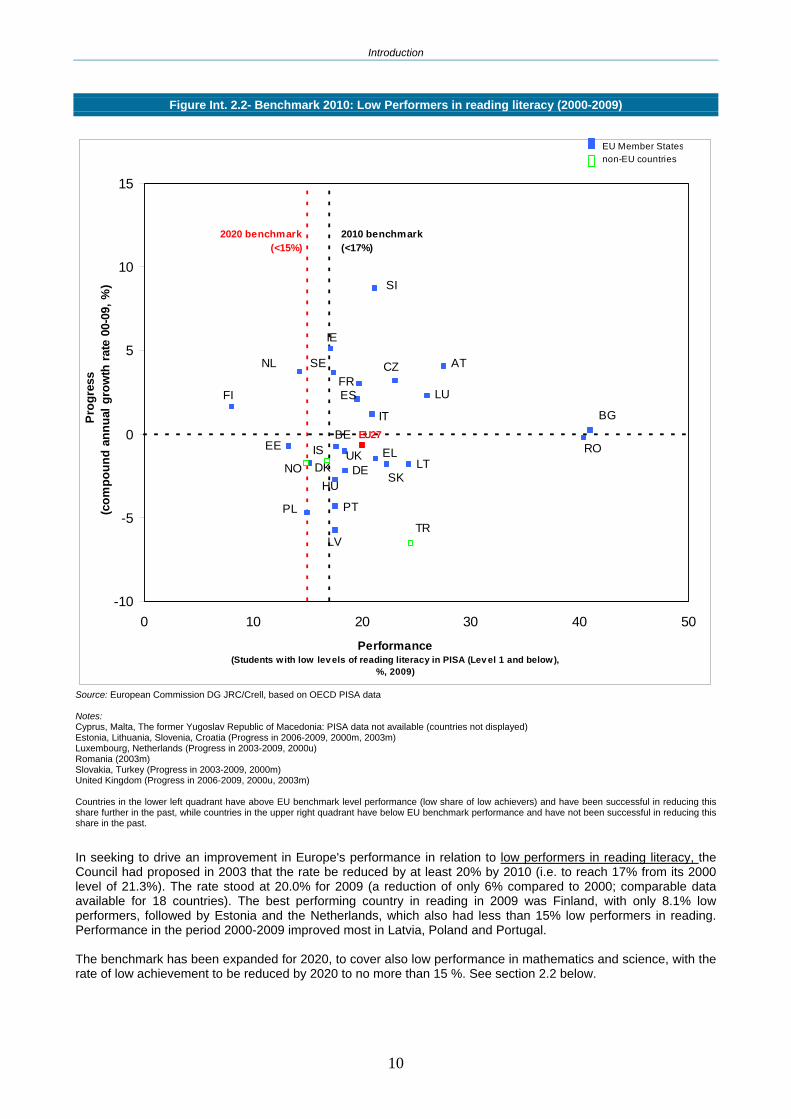
Source: European Commission DG JRC/Crell, based on OECD PISA data Notes: Cyprus, Malta, The former Yugoslav Republic of Macedonia: PISA data not available (countries not displayed) Estonia, Lithuania, Slovenia, Croatia (Progress in 2006-2009, 2000m, 2003m) Luxembourg, Netherlands (Progress in 2003-2009, 2000u) Romania (2003m) Slovakia, Turkey (Progress in 2003-2009, 2000m) United Kingdom (Progress in 2006-2009, 2000u, 2003m) Countries in the lower left quadrant have above EU benchmark level performance (low share of low achievers) and have been successful in reducing this share further in the past, while countries in the upper right quadrant have below EU benchmark performance and have not been successful in reducing this share in the past. In seeking to drive an improvement in Europe's performance in relation to low performers in reading literacy, the Council had proposed in 2003 that the rate be reduced by at least 20% by 2010 (i.e. to reach 17% from its 2000 level of 21.3%). The rate stood at 20.0% for 2009 (a reduction of only 6% compared to 2000; comparable data available for 18 countries). The best performing country in reading in 2009 was Finland, with only 8.1% low performers, followed by Estonia and the Netherlands, which also had less than 15% low performers in reading. Performance in the period 2000-2009 improved most in Latvia, Poland and Portugal. The benchmark has been expanded for 2020, to cover also low performance in mathematics and science, with the rate of low achievement to be reduced by 2020 to no more than 15 %. See section 2.2 below.

Introduction
11
Figure Int. 2.3- Benchmark 2010: Early leavers from education and training (2000-2009)
BE
BG
CZ
DK
DE
EE
IEEL
ES
FR
IT
CY
LV
LT
LU
HU MT
NL
AT
PLPT RO
SI
SK
FI
SE
UK
HR
MK*
TR
IS
EU27
NO
-12
-10
-8
-6
-4
-2
0
2
4
6
0 10 20 30 40 50Performance
(Population aged 18-24 years with at most lower secondary education and not in further education or training,%, 2009)
Prog
ress
(com
poun
d an
nual
gro
wth
rate
00-
09, %
)
EU Member Statesnon-EU countries
2010/2020 benchmark(<10%)
Source: European Commission DG JRC/CRELL Notes: b: break in series; m: missing, u: unreliable/uncertain Slovenia, Croatia: results are uncertain due to small sample size *MK: The former Yugoslav Republic of Macedonia; see Annex 2 Malta, Portugal and Spain are the only EU27 countries with more than 30% early school leavers (all other EU countries have less than 20%). Countries in the lower left quadrant have above EU benchmark level performance (low share of low achievers) and have been successful in reducing this share further in the past, while countries in the upper right quadrant have below EU benchmark performance and have not been successful in reducing this share in the past. This key benchmark – the importance of which has now been highlighted further as a headline target of Europe 2020 – on early leavers from education and training proposed that by 2010 less than 10% of young people (aged 18-24) should be in this group. Figure Int. 2.3 shows that in 2009 the EU 27 rate still stood at 14.4%. Significant progress has been made by many countries and especially by Croatia, Denmark and Lithuania, all of which already perform better than the benchmark level. In addition, a number of Europe's poorest performers, notably Malta, Portugal and Turkey, have decreased their share of early school leavers significantly. However, overall progress in relation to this area has only been moderate.

Introduction
12
Figure Int. 2.4 Benchmark 2010: Upper Secondary Education (2000-2009)
BE
BG
CZ
DK
DE
EE IE
EL
ES
FR
IT CY
LV
LT
LU
HU
MT
NL
AT
PL
PT
RO Sl
SKFI
SE
UK
HR
MK*TR
IS
EU27
NO
-2
-1
0
1
2
3
4
40 50 60 70 80 90 100Performance
(Population aged 20-24y having completed at least upper secondary education, %, 2009)
Pro
gres
s(c
ompo
und
annu
al g
row
th r
ate
00-0
9, %
)
EU Member Statesnon-EU countries
2010 benchmark(>85%)
Source: European Commission DG JRC/CRELL Notes: Breaks in series in Bulgaria (2001), Denmark (2003), Germany (2005), France (2003), Latvia (2002), Lithuania (2002), Luxembourg (2003), Hungary (2003), Malta (2003) *MK: The former Yugoslav Republic of Macedonia; see Annex 2 Countries in the upper right quadrant have above EU benchmark level performance (high share of upper secondary attainment) and have been successful in reducing this share further in the past, while countries in the lower left quadrant have below EU benchmark performance and have not been successful in increasing this share in the past. The benchmark on upper secondary attainment proposed that by 2010 85% of young people (aged 20-24) should have completed secondary level education (Figure Int. 2.4). EU performance by 2009 stood at 78.6%, and hence was well short of the target. Luxembourg and Spain are losing momentum with a decrease in performance while still relatively far from the benchmark level. Croatia is showing the strongest performance, while Turkey and Portugal are progressing notably, even though both are quite far from the benchmark level. Among EU Member States, the Czech Republic, Slovakia, Poland and Slovenia show the best performance. This benchmark has been discontinued for the period to 2020; however, there is a close relationship with the maintained benchmark on early school leaving, the importance of which has been underlined as a Europe 2020 headline target.
Introduction
13
Figure Int.2.5 - Benchmark 2010 : Mathematics, Science and Technology Graduates (2000-2007)
BEBG
CZ
DK
DEEE
IE
EL
ES FR
IT
CY
LV
LT
HU
MT
NL
AT
PL
PT
RO
SI
SK
FI
SE UK
HR
MK* TR
ISEU27
NO
-4
0
4
8
12
16
20
0 10 20 30Performance
(MST graduates per 1000 population aged 20-29, %, 2008)
Prog
ress
(com
poun
d an
nual
gro
wth
rate
00-
08, %
)
EU Member Statesnon-EU countries
2010 benchmark(+12.6)
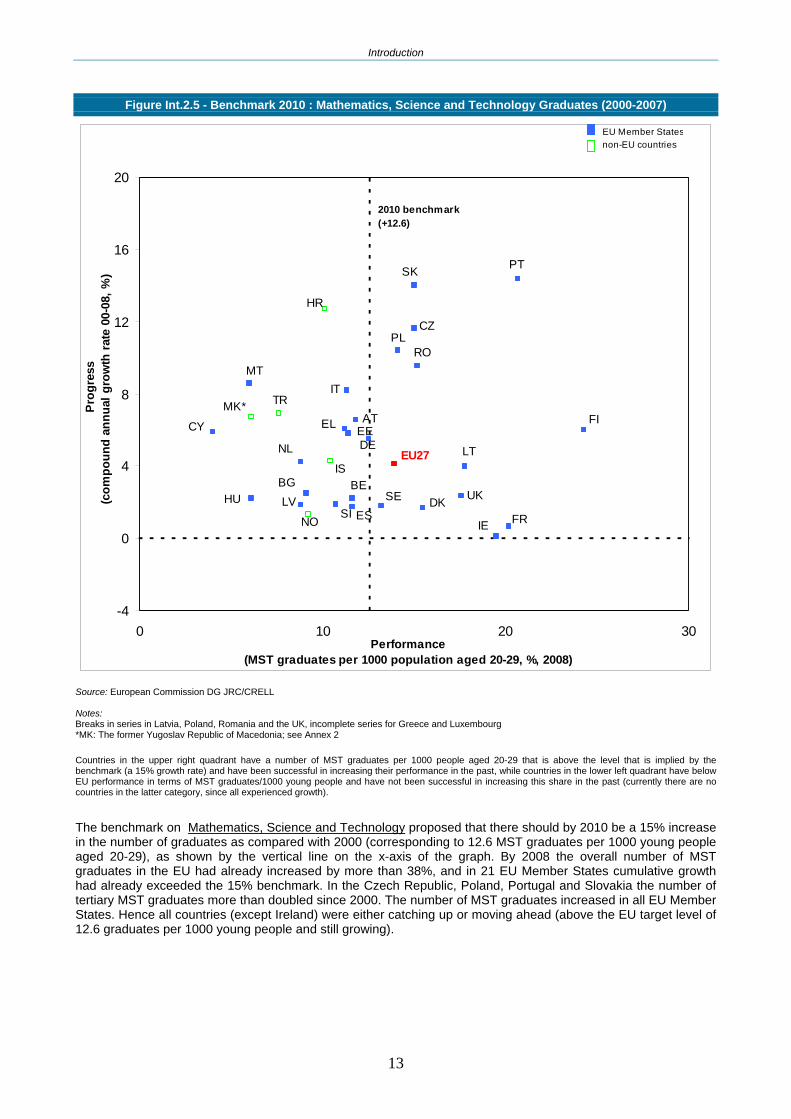
Source: European Commission DG JRC/CRELL Notes: Breaks in series in Latvia, Poland, Romania and the UK, incomplete series for Greece and Luxembourg *MK: The former Yugoslav Republic of Macedonia; see Annex 2 Countries in the upper right quadrant have a number of MST graduates per 1000 people aged 20-29 that is above the level that is implied by the benchmark (a 15% growth rate) and have been successful in increasing their performance in the past, while countries in the lower left quadrant have below EU performance in terms of MST graduates/1000 young people and have not been successful in increasing this share in the past (currently there are no countries in the latter category, since all experienced growth).
The benchmark on Mathematics, Science and Technology proposed that there should by 2010 be a 15% increase in the number of graduates as compared with 2000 (corresponding to 12.6 MST graduates per 1000 young people aged 20-29), as shown by the vertical line on the x-axis of the graph. By 2008 the overall number of MST graduates in the EU had already increased by more than 38%, and in 21 EU Member States cumulative growth had already exceeded the 15% benchmark. In the Czech Republic, Poland, Portugal and Slovakia the number of tertiary MST graduates more than doubled since 2000. The number of MST graduates increased in all EU Member States. Hence all countries (except Ireland) were either catching up or moving ahead (above the EU target level of 12.6 graduates per 1000 young people and still growing).

Introduction
14
Figure Int.2.6- Benchmark 2010: Adult Lifelong Learning participation
BE
BG
CZ DK
DEEE
IE
EL
ES
FRIT
CY
LV
LT
LU
HU
MT
NL
AT
PL
PT
RO SI
SK
FI
SEUK
HR
MK*
TR
IS
EU27 NO
-10
-5
0
5
10
15
20
0 10 20 30 40Performance
(Adults aged 25-64y who receiv ed education or training in the 4 weeks preceding the surv ey, %, 2009)
Prog
ress
(com
poun
d an
nual
gro
wth
rate
00-
09, %
)
EU Member Statesnon-EU countries
2020 benchmark(>15%)
2010 benchmark(>12.5%)
Source: European Commission, JRC/CRELL calculations based on LFS data Notes: *MK: The former Yugoslav Republic of Macedonia; see Annex 2 Countries in the upper right quadrant have performance above the level of the EU benchmark (high share of adults participating in lifelong learning) and have been successful in increasing this share further in the past, while countries in the lower left quadrant have below EU benchmark performance and have not been successful in increasing this share in the past.
Increasing the participation by adults in lifelong learning is a highly important policy objective, the importance of which is underlined by the focus on constantly updating and renewing skills in the New Skills and Jobs flagship action of the Europe 2020 strategy. The 2010 benchmark on Adult Lifelong Learning Participation envisages that 12.5% of the adult population should participate in lifelong learning, as measured by the Labour Force Survey. Figure Int. 2.6 shows that the EU has now reached a participation rate of 9.3%. Even though this is well short of the 2010 benchmark level, many countries showed a solid improvement in their performance in the first half of the decade. Performance has, however, slightly declined since 2005. Best performers, with a participation rate of over 20%, are the Nordic countries (Denmark, Sweden Finland and Iceland) and the UK. Bulgaria, Romania and Greece show the lowest participation rates, but performance in these countries is tending to improve. On the other hand Hungary and especially Slovakia perform well below the benchmark level and their adult lifelong learning participation rates are tending to decline. For 2020, the target level in relation to this indicator has been increased to 15%.

Introduction
15
2.2. Looking forward to the 2020 benchmarks Progress towards achieving the new 2020 benchmarks can not yet be monitored, since the latest data refer to the time before these benchmarks were adopted. However, looking at progress in the period 2000-2009 can help to see if the current trajectory of progress would point towards reaching the EU benchmarks in the future. In addition, the benchmarks on early school leavers and the new benchmark on tertiary attainment are now the subject of national targets within the Europe 2020 process. First, provisional targets have been delivered by Member States in draft National Reform Programmes, which allow for a tentative assessment of the likelihood that the EU targets for 2020 will be met. It should, however, also be borne in mind that spending cuts and behavioural changes linked to the current economic crisis may also impact on future trends. The existing benchmark on low performance in reading has, as outlined above at 2.1 above, been expanded for 2020, to cover also low performance in mathematics and science, with the rate of low achievement to be reduced by 2020 to no more than 15 %. In relation to reading, it is difficult to foresee a future trend at the EU level, given that there was a sharp discontinuity between the worsening of performance between 2000 and 2006 and the reasonably broad recovery evident in 2009 results. Looking at the broader measure to be used in the future, in 2009 Finland, Estonia and the Netherlands already had less than 15% low performers in reading and in maths. In science in addition Germany, Latvia, Hungary, Poland and Slovenia had less than 15% of low performers. In relation to the benchmark on early school leaving which is retained for 2020 with no change in the rate, progress has been slow over the past decade. However, the new focus on this objective as a headline target of Europe 2020 can be expected to have an impact; a number of Member States have set ambitious national targets. First projections based on these and taking account of past trends would suggest that progress in the decade ahead will improve but may still not be sufficient to actually meet this key target. The benchmark on adult participation in lifelong learning has been set to the higher level of 15% for 2020. Performance over the period as a whole has improved but the decline since 2005 described in section 2.1 implies that further efforts are needed if this benchmark is to be reached. 1 The overall trend towards the 2020 benchmarks, derived solely by projecting from the trend in performance since 2000, is summarised in Figure 2.7 below.
Figure Int.2.7 Trends towards the five benchmarks for 2020 (2000-2009)
0
10
20
30
40
50
60
70
80
90
100
2000 2001 2002 2003 2004 2005 2006 2007 2008 2009 2010 2011 2012 2013 2014 2015 2016 2017 2018 2019 2020
Low achievers in reading, maths, science
Pre-primary participation
Tertiary attainment
Adult lifelong learning
Early school leavers
progress required
Source: European Commission - DG EAC
1 The trend is difficult to construct due to be low levels of comparability of data between 2003 and 2005.
Introduction
16
Figure Int. 2.8
Benchmark 2020: Children in early childhood education (between four years and the start of compulsory education, 2000-2008)
IE
FR
ISBE
BG
CZ
DK
DE
EE
EL
ESIT
CYLV
LT
LU
HU
MT
NL
AT
PL
PT
RO
SISK
FI
SE
UK
HR
EU27
NO
-2
-1
0
1
2
3
4
5
50 60 70 80 90 100Performance
(Children aged 4 years that participate in early childhood education, %, 2008)
Pro
gres
s(c
ompo
und
annu
al g
row
th r
ate
00-0
8, %
)
EU Member Statesnon-EU countries
2020 benchmark(>95%)
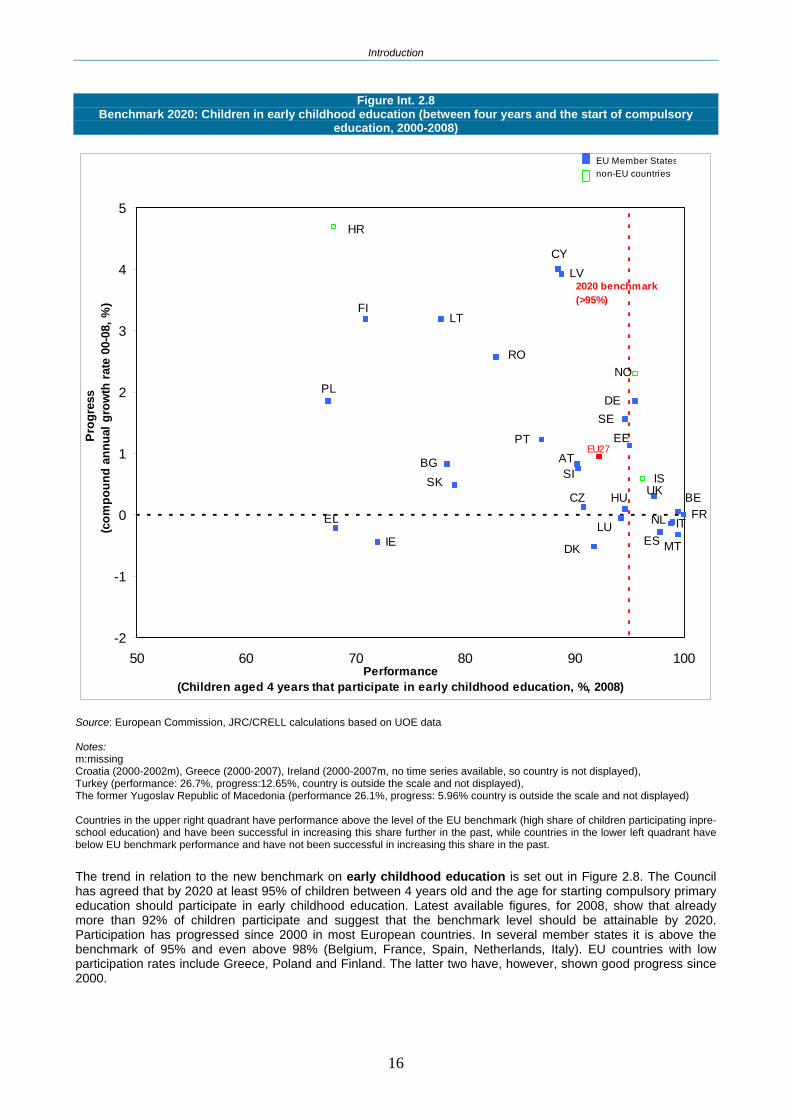
Source: European Commission, JRC/CRELL calculations based on UOE data Notes: m:missing Croatia (2000-2002m), Greece (2000-2007), Ireland (2000-2007m, no time series available, so country is not displayed), Turkey (performance: 26.7%, progress:12.65%, country is outside the scale and not displayed), The former Yugoslav Republic of Macedonia (performance 26.1%, progress: 5.96% country is outside the scale and not displayed) Countries in the upper right quadrant have performance above the level of the EU benchmark (high share of children participating inpre-school education) and have been successful in increasing this share further in the past, while countries in the lower left quadrant have below EU benchmark performance and have not been successful in increasing this share in the past. The trend in relation to the new benchmark on early childhood education is set out in Figure 2.8. The Council has agreed that by 2020 at least 95% of children between 4 years old and the age for starting compulsory primary education should participate in early childhood education. Latest available figures, for 2008, show that already more than 92% of children participate and suggest that the benchmark level should be attainable by 2020. Participation has progressed since 2000 in most European countries. In several member states it is above the benchmark of 95% and even above 98% (Belgium, France, Spain, Netherlands, Italy). EU countries with low participation rates include Greece, Poland and Finland. The latter two have, however, shown good progress since 2000.

Introduction
17
Figure Int 2.9 Benchmark 2020: Share of 30-34y with tertiary educational attainment (2000-2009)
NOBEBG
CZ
DK
DE EE
IE
EL
ES
FRIT
CY
LV
LT
LU
HU
MT
NL
AT
PL
PT RO
SI
SK
FI
SE
UK HR
MK*
TR
IS
EU27
-2
0
2
4
6
8
10
12
14
16
10 20 30 40 50 60Performance
(Share of people aged 30-34y with tertiary education, %, 2009)
Pro
gres
s(c
ompo
und
annu
al g
row
th r
ate
00-0
9, %
)
EU Member Statesnon-EU countries
2020 benchmark(>40%)
Source: European Commission, JRC/CRELL calculations based on LFS data Notes : *MK: The former Yugoslav Republic of Macedonia; see Annex 2 Countries in the upper right quadrant have performance above the level of the EU benchmark (high share of30-34 year olds with tertiary attainment) and have been successful in increasing this share further in the past, while countries in the lower left quadrant have below EU benchmark performance and have not been successful in increasing this share in the past. The new benchmark for tertiary attainment levels among the young adult population foresees that by 2020 at least 40% of 30-34 year olds should hold a university degree or equivalent. The trend since 2000, shown in Figure 2.9, would suggest this is attainable by 2020. Member States' targets, as set out in their first provisional National Reform Programmes, are by and large very cautious and would suggest a lower rate of progress, possibly leading to non-achievement of the target by 2020.

Introduction
18
2.3. Best performing countries: Learning from good practice The overall presentation of performance and progress above clearly shows that all countries have strengths and weaknesses in the five benchmark areas and that no country is "falling behind” in all areas. Countries that show good performance in several areas for the 2010 benchmarks include Finland, which has performance levels above all 5 benchmarks, and Poland, which has performance levels above the EU benchmarks and is moving further ahead in four of the five areas. Given that mutual learning is a core objective of the OMC, the Council asked for the three best performing countries (leaders) in specific policy areas to be identified. Figures Int.2.1 and Int.2.2 present the findings, drawing also on the wider set of core indicators established by the Council in 2007. Half of all Member States can be counted among the leading group of three in at least one benchmark area and adding in the core indicators, three more countries are among the leaders, in participation in early childhood education. Good education performance seems to be widely spread among EU Member States.
Figure Int. 2.10: Best performing countries on benchmarks relating to school education
Target for
2010/2020
Best performing countries in the EU
EU
USA
Japan
2008 Participation in early
childhood education
(4 years-start of comp.
primary), %
2020: 95%
France
100
Netherlands
99.5
Belgium
99.5
92.3
69.2
(2007)
96.4
(2007)
Change in the percentage of low achievers in reading % (2000-2009)
Latvia
-41.5
Poland
-35.3
Portugal
-33.1
-6.1
-1.1
+34.7
Share of low achievers in reading, maths and science, 2009, %
2010: Low-achievers
in reading (15-year-olds, %)
2020: Low-achievers in
reading, maths and science.
2010: At least
20% Decrease
2020: no more than
15%
Finland
7.3
Estonia
11.4
Netherlands
13.6
19.8
19.7
12.3
2009 Early school leavers (18-24)
%)
2010/2020: No more
than 10%
Slovakia
4.9
Poland
5.3
Czech Rep.
5.4a
14.4
-
-
2009
Upper secondary attainment (20-24, %).
2010: At least
85%
Slovakia
93.3
Czech Republic
91.9
Poland
91.3
78.6
-
-
Source: DG Education and Culture Data sources: Eurostat (UOE data collection and LFS); OECD/Pisa

Introduction
19
Figure Int.2.11 : Best performing countries on benchmarks relating to higher education and lifelong learning
2010 target
for EU
Best performing countries in the EU
EU
USA
Japan
Average annual increase 2000-2008
Portugal
+14.4%
Slovakia
+14.0%
Czech Rep.
+11.6%
+4.0%
+1.9%
-1.2%
MST Graduates per 1000 inhabitants (aged 20-29) in 2007
France
20.5
Finland
18.8
Ireland
18.7
13.4
10.1
14.4
% of female graduates in 2008
Graduates in
Mathematics Science
Technology
(per 1000 young people)
2010:
Increase of at least 15% graduates
Luxembourg
48.2
Romania
43.1
Estonia
42.1
32.6
30.9
14.4
Higher education attainment, 2009
Higher education attainment
(age 30-34), %
Ireland
49.0
Denmark
48.1
Luxembourg
46.6 (p)
32.3
Aged 25-34: 29
Aged 25-34: 39
Aged 25-34: 54
2009 Adult Lifelong Learning
participation (25-64, %)
2010: At least 12.5% 2020:
at least 15%
Denmark
31.6
Sweden
22.2
Finland
22.1
9.3
-
- Source: DG Education and Culture Data source: Eurostat (UOE and LFS) a: 2006, p: provisional

Introduction
20
3. Demographic trends and Participation in Education 3.1. Current trends in the number of young people in the population In 2009, young people under 30 years represent about 35% of the total population in the EU27. However, the number of young people in the European Union has declined steadily. Between 1990 and 2009, the population aged 0-9 years in the EU27 decreased by 13.9%, the population aged 10-19 by 16.0%, and the population aged 20-29 by 10.5% (Figure Int 3.1). These trends have a different impact on the different levels of education. While compulsory education (primary and lower secondary education) are currently seeing a lower intake of pupils through smaller cohorts, increases in participation rates in upper secondary education and university are counteracting the demographic decline.
Figure Int. 3.1: Variation of the population in the 0-9, 10-19 and 20-29 age groups in the EU-27 (1990-2020)
0-9
age group 10-19
age group 20-29
age group
1990 59.8 66.1 73.0
1995 56.9 62.9 71.4
2000 53.3 61.2 67.6
2005 51.1 58.8 66.0
2009 51.5 55.5 65.3
2015 52.6 52.4 63.6
50
55
60
65
70
75
1990 1995 2000 2005 2009 2015 2020
aged 20-29
aged 10-19
aged 0-9
Million
2020 52.1 53.1 59.5
Source: Eurostat, population statistics (2015-2020 from the Europop 2008 forecast, convergence scenario) Additional notes France: The data does not include the overseas départements. Cyprus: The data relates to territories under government control. Explanatory note a) National data are contained in the annexes available at http://www.eurydice.org. The population is that of 1st January in the reference year. The population is based on data from the most recent census adjusted by the components of population change produced since the last census, or based on population registers.
This overall trend conceals contrasting situations. For the 0-10 age group, although for the EU-27 figures, as a whole, are slightly increasing since 2005, in Germany and many central and Eastern European member states the population in this age group has decreased each year. Trends are slightly better for the 0-4 years old (and hence the future intake of primary schools) since birth rates have slightly recovered in recent years in some of these countries. At the same time, Ireland and Spain have recorded significant growth rates, partly a result of strong net migration (see figure Int 3.2).

Introduction
21
Figure Int 3.2: Evolution of the population 0-9 years old by country
Data source: Eurostat; estimate for 2010 figure for the UK and EU 27 (based on 2009 UK result) *MK: The former Yugoslav Republic of Macedonia; see Annex 2
In the 10-19 age group, several countries (Bulgaria, Estonia, Latvia and Romania) had a population decrease over three times higher than the average rate for the EU-27. Around 1990 Central and Eastern European countries experienced a strong decline in the number of births. Since 2005 birth rates have stabilized or are increasing again. The strong decline in cohort size in these countries from 1990 is now starting to affect tertiary education. 3.2. Future pupil intake in primary and lower secondary education Against the background of the falling youth population outlined above, the period 2000-2010 saw an overall fall in intake to primary education (of 8.5%) and to lower secondary school ( of 12.9%). Population projections on future pupil intakes suggest that there will be a reversal of this decline and that EU-wide intakes to both levels will increase by around 3%. However, as shown above, this overall increase is made up of contrasting trends among Member States. During the period 2010-2020, Estonia, Ireland, Spain and Cyprus will experience a more than 15% growth in the projected intake. By contrast, Denmark, Germany, Italy, the Netherlands and Romania are projected to experience a fall. In Lower secondary education, Bulgaria, the Czech Republic, Estonia, Ireland, Spain, Latvia and Sweden will face projected increases of more than 10%. Germany, Lithuania, and Malta are likely to experience a more than 10% decrease.
Population 0-4 (000s) Population 5-9 (000s)
2000 2005 2010
Change 2000-2010 2000 2005 2010
Change 2000-2010
EU-27 25451 25241 25782 1.3 27827.0 25816.0 25595.2 -8.0 Belgium 577.2 574.9 628.7 8.9 621.1 589.1 596.5 -4.0 Bulgaria 340.2 33.4 370.1 8.8 434.3 320.7 336.7 -22.5
Czech Republic 455.1 465.6 564.5 24.0 603.7 453.9 471.0 -22.0 Denmark 340.6 328.1 326.1 -4.3 341.8 344.1 329.9 -3.5 Germany 3947.6 3656.3 3409.6 -13.6 4251.6 3975.0 3647.7 -14.2 Estonia 6.1 65.2 76.4 24.4 81.7 61.3 65.1 -20.3 Ireland 264.6 295.8 350.8 32.6 267.7 279.6 310.7 16.1 Greece 518.1 517.9 569.2 9.9 564.9 519.2 525.8 -6.9 Spain 1840.2 2171.5 2461.2 33.7 1954.6 1978.7 2297.9 17.6 France 3752.4 3929.8 4037.8 7.6 3801.6 3865.1 3995.6 5.1
Italy 2624.6 2733.4 2844.7 8.4 2745.4 2686.3 2834.3 3.2 Cyprus 47.4 41.1 44.9 -5.3 54.8 47.6 42.3 -22.8 Latvia 95.9 100.6 114.2 19.1 145.3 95.8 100.0 -31.2
Lithuania 188.1 154.7 164.2 -12.7 245.6 185.8 152.3 -38.0 Luxembourg 28.5 27.9 28.7 0.7 28.4 29.2 29.8 4.9
Hungary 501.7 477.8 489.5 -2.4 596.9 503.1 482.2 -19.2 Malta 23.3 20.1 20.4 -12.4 26.5 23.8 20.2 -23.8
Netherlands 983.5 1010.6 924.9 -6.0 1001.7 987.9 1003.2 0.1 Austria 424.5 397.7 392.9 -7.4 478.1 436.6 406.8 -14.9 Poland 2029.3 1794.5 1952.8 -3.8 2535.7 2045.5 1790.0 -29.4
Portugal 535.9 553.7 519.8 -3.0 539.6 537.3 554.6 2.8 Romania 1144.7 1062.4 1086.2 -5.1 1268.5 1107.8 1060.2 -16.4 Slovenia 92.0 89.5 102.4 11.3 103.6 92.8 91.0 -12.2 Slovakia 291.6 260.0 280.2 -3.9 366.4 290.9 260.1 -29.0 Finland 297.5 283.7 298.1 0.2 329.4 299.4 287.8 -12.6 Sweden 468.7 485.6 548.2 17.0 608.0 479.9 503.9 -17.1
United Kingdom 3576.0 3408.9 3739.0 4.6 3830.0 3579.5 3399.4 -11.2 Croatia : 205.7 214.2 4.1 : 248.4 208.5 -16.1 Iceland 21.3 21.0 23.2 8.9 22.8 21.4 21.4 -6.1
MK* 139.4 119.2 112.9 -19.0 152.8 132.0 118.9 -22.2 Turkey 7127.6 6684.6 6155.3 -13.6 6721.3 7111.1 6201.6 -7.7
Liechtenstein 2.0 1.9 1.9 -5.0 2.0 2.1 1.9 -5.0 Norway 302.4 289.1 0.5 308.8 306.9 298.5 -8.0
Introduction
22
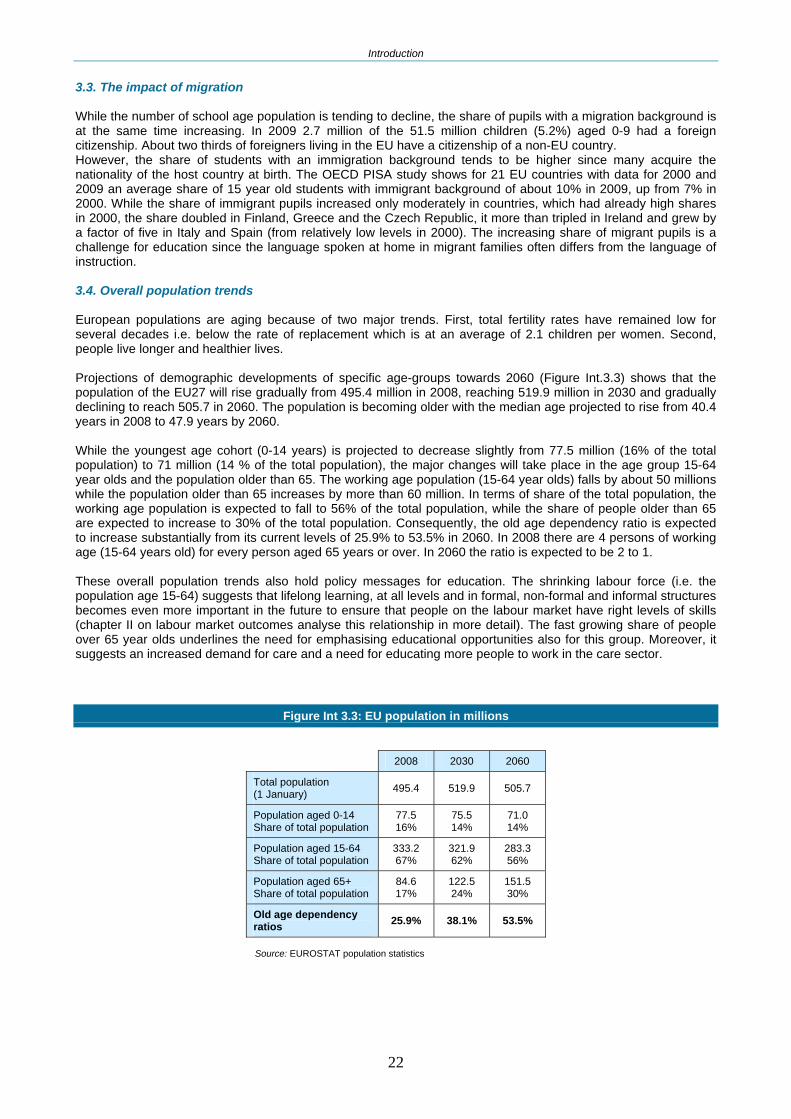
3.3. The impact of migration While the number of school age population is tending to decline, the share of pupils with a migration background is at the same time increasing. In 2009 2.7 million of the 51.5 million children (5.2%) aged 0-9 had a foreign citizenship. About two thirds of foreigners living in the EU have a citizenship of a non-EU country. However, the share of students with an immigration background tends to be higher since many acquire the nationality of the host country at birth. The OECD PISA study shows for 21 EU countries with data for 2000 and 2009 an average share of 15 year old students with immigrant background of about 10% in 2009, up from 7% in 2000. While the share of immigrant pupils increased only moderately in countries, which had already high shares in 2000, the share doubled in Finland, Greece and the Czech Republic, it more than tripled in Ireland and grew by a factor of five in Italy and Spain (from relatively low levels in 2000). The increasing share of migrant pupils is a challenge for education since the language spoken at home in migrant families often differs from the language of instruction. 3.4. Overall population trends European populations are aging because of two major trends. First, total fertility rates have remained low for several decades i.e. below the rate of replacement which is at an average of 2.1 children per women. Second, people live longer and healthier lives. Projections of demographic developments of specific age-groups towards 2060 (Figure Int.3.3) shows that the population of the EU27 will rise gradually from 495.4 million in 2008, reaching 519.9 million in 2030 and gradually declining to reach 505.7 in 2060. The population is becoming older with the median age projected to rise from 40.4 years in 2008 to 47.9 years by 2060. While the youngest age cohort (0-14 years) is projected to decrease slightly from 77.5 million (16% of the total population) to 71 million (14 % of the total population), the major changes will take place in the age group 15-64 year olds and the population older than 65. The working age population (15-64 year olds) falls by about 50 millions while the population older than 65 increases by more than 60 million. In terms of share of the total population, the working age population is expected to fall to 56% of the total population, while the share of people older than 65 are expected to increase to 30% of the total population. Consequently, the old age dependency ratio is expected to increase substantially from its current levels of 25.9% to 53.5% in 2060. In 2008 there are 4 persons of working age (15-64 years old) for every person aged 65 years or over. In 2060 the ratio is expected to be 2 to 1. These overall population trends also hold policy messages for education. The shrinking labour force (i.e. the population age 15-64) suggests that lifelong learning, at all levels and in formal, non-formal and informal structures becomes even more important in the future to ensure that people on the labour market have right levels of skills (chapter II on labour market outcomes analyse this relationship in more detail). The fast growing share of people over 65 year olds underlines the need for emphasising educational opportunities also for this group. Moreover, it suggests an increased demand for care and a need for educating more people to work in the care sector.
Figure Int 3.3: EU population in millions
2008 2030 2060
Total population (1 January) 495.4 519.9 505.7
Population aged 0-14 Share of total population
77.5 16%
75.5 14%
71.0 14%
Population aged 15-64 Share of total population
333.2 67%
321.9 62%
283.3 56%
Population aged 65+ Share of total population
84.6 17%
122.5 24%
151.5 30%
Old age dependency ratios 25.9% 38.1% 53.5%
Source: EUROSTAT population statistics
Introduction
23
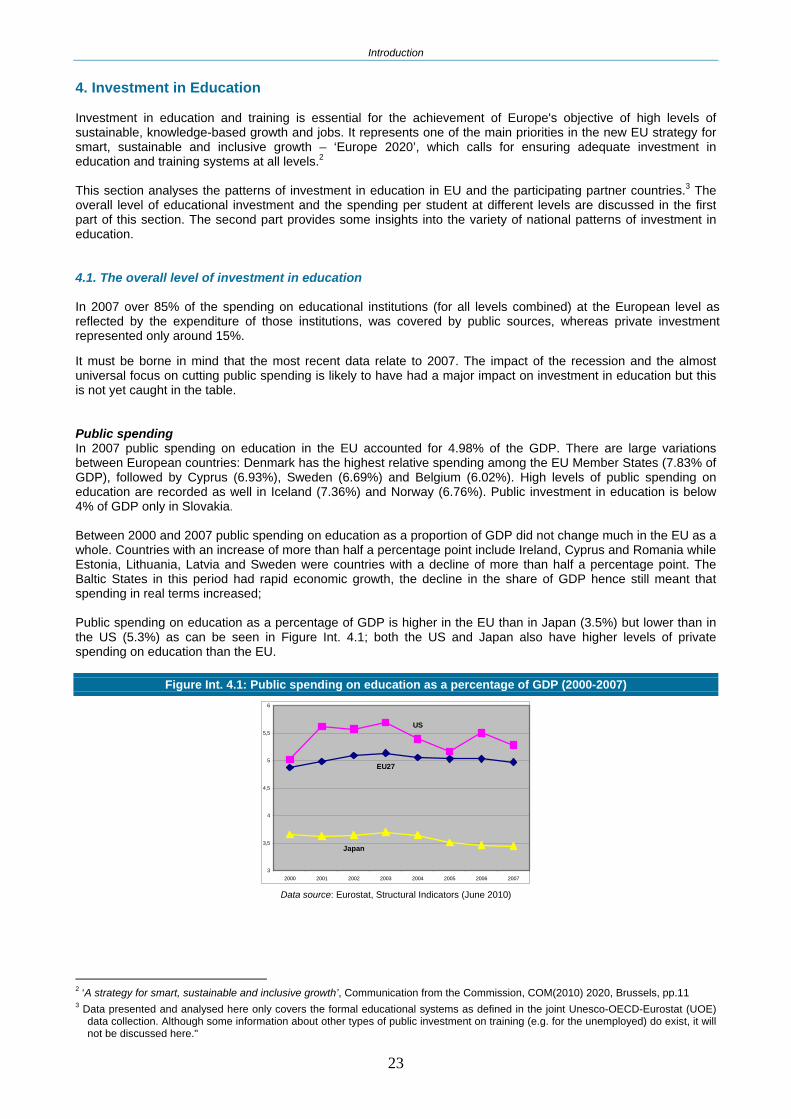
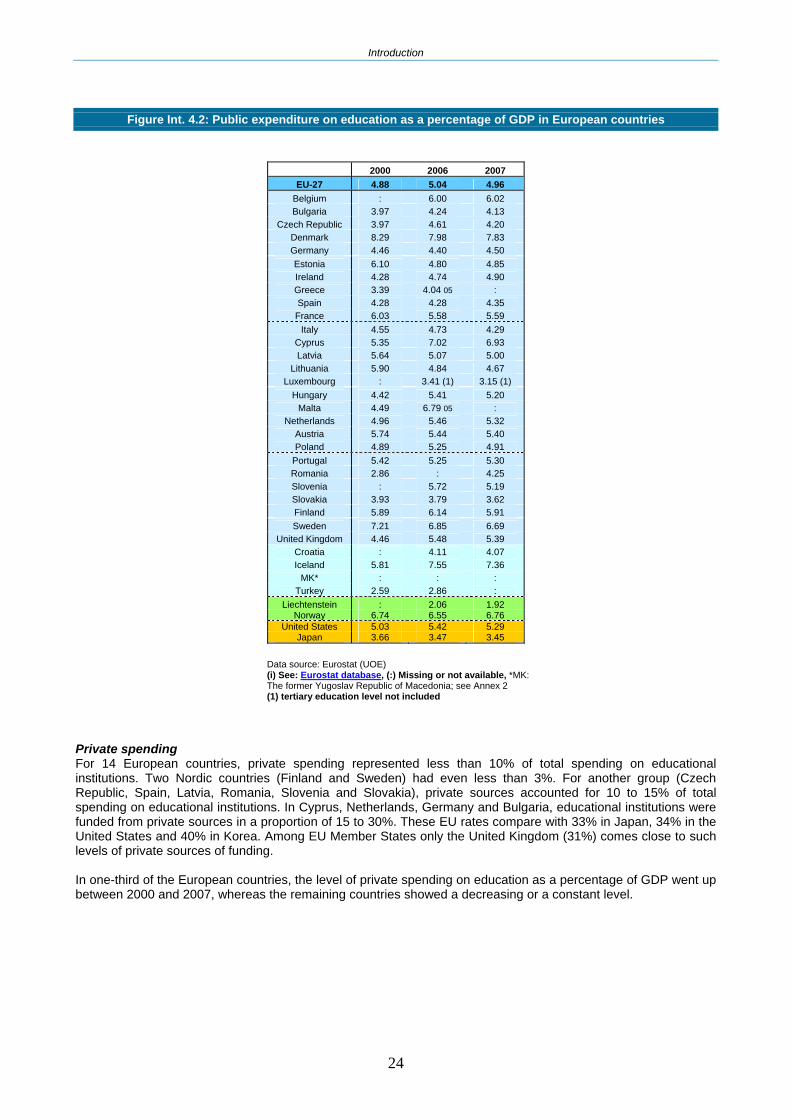
4. Investment in Education Investment in education and training is essential for the achievement of Europe's objective of high levels of sustainable, knowledge-based growth and jobs. It represents one of the main priorities in the new EU strategy for smart, sustainable and inclusive growth – ‘Europe 2020’, which calls for ensuring adequate investment in education and training systems at all levels.2 This section analyses the patterns of investment in education in EU and the participating partner countries.3 The overall level of educational investment and the spending per student at different levels are discussed in the first part of this section. The second part provides some insights into the variety of national patterns of investment in education. 4.1. The overall level of investment in education In 2007 over 85% of the spending on educational institutions (for all levels combined) at the European level as reflected by the expenditure of those institutions, was covered by public sources, whereas private investment represented only around 15%. It must be borne in mind that the most recent data relate to 2007. The impact of the recession and the almost universal focus on cutting public spending is likely to have had a major impact on investment in education but this is not yet caught in the table. Public spending In 2007 public spending on education in the EU accounted for 4.98% of the GDP. There are large variations between European countries: Denmark has the highest relative spending among the EU Member States (7.83% of GDP), followed by Cyprus (6.93%), Sweden (6.69%) and Belgium (6.02%). High levels of public spending on education are recorded as well in Iceland (7.36%) and Norway (6.76%). Public investment in education is below 4% of GDP only in Slovakia. Between 2000 and 2007 public spending on education as a proportion of GDP did not change much in the EU as a whole. Countries with an increase of more than half a percentage point include Ireland, Cyprus and Romania while Estonia, Lithuania, Latvia and Sweden were countries with a decline of more than half a percentage point. The Baltic States in this period had rapid economic growth, the decline in the share of GDP hence still meant that spending in real terms increased; Public spending on education as a percentage of GDP is higher in the EU than in Japan (3.5%) but lower than in the US (5.3%) as can be seen in Figure Int. 4.1; both the US and Japan also have higher levels of private spending on education than the EU.
Figure Int. 4.1: Public spending on education as a percentage of GDP (2000-2007)
EU27
US
Japan
3
3,5
4
4,5
5
5,5
6
2000 2001 2002 2003 2004 2005 2006 2007 Data source: Eurostat, Structural Indicators (June 2010)
2 ‘A strategy for smart, sustainable and inclusive growth’, Communication from the Commission, COM(2010) 2020, Brussels, pp.11 3 Data presented and analysed here only covers the formal educational systems as defined in the joint Unesco-OECD-Eurostat (UOE)
data collection. Although some information about other types of public investment on training (e.g. for the unemployed) do exist, it will not be discussed here."
Introduction
24
Figure Int. 4.2: Public expenditure on education as a percentage of GDP in European countries
2000 2006 2007 EU-27 4.88 5.04 4.96
Belgium : 6.00 6.02 Bulgaria 3.97 4.24 4.13
Czech Republic 3.97 4.61 4.20 Denmark 8.29 7.98 7.83 Germany 4.46 4.40 4.50 Estonia 6.10 4.80 4.85 Ireland 4.28 4.74 4.90 Greece 3.39 4.04 05 : Spain 4.28 4.28 4.35 France 6.03 5.58 5.59
Italy 4.55 4.73 4.29 Cyprus 5.35 7.02 6.93 Latvia 5.64 5.07 5.00
Lithuania 5.90 4.84 4.67 Luxembourg : 3.41 (1) 3.15 (1)
Hungary 4.42 5.41 5.20 Malta 4.49 6.79 05 :
Netherlands 4.96 5.46 5.32 Austria 5.74 5.44 5.40 Poland 4.89 5.25 4.91
Portugal 5.42 5.25 5.30 Romania 2.86 : 4.25 Slovenia : 5.72 5.19 Slovakia 3.93 3.79 3.62 Finland 5.89 6.14 5.91 Sweden 7.21 6.85 6.69
United Kingdom 4.46 5.48 5.39 Croatia : 4.11 4.07 Iceland 5.81 7.55 7.36
MK* : : : Turkey 2.59 2.86 :
Liechtenstein : 2.06 1.92 Norway 6.74 6.55 6.76
United States 5.03 5.42 5.29 Japan 3.66 3.47 3.45
Data source: Eurostat (UOE) (i) See: Eurostat database, (:) Missing or not available, *MK: The former Yugoslav Republic of Macedonia; see Annex 2 (1) tertiary education level not included
Private spending For 14 European countries, private spending represented less than 10% of total spending on educational institutions. Two Nordic countries (Finland and Sweden) had even less than 3%. For another group (Czech Republic, Spain, Latvia, Romania, Slovenia and Slovakia), private sources accounted for 10 to 15% of total spending on educational institutions. In Cyprus, Netherlands, Germany and Bulgaria, educational institutions were funded from private sources in a proportion of 15 to 30%. These EU rates compare with 33% in Japan, 34% in the United States and 40% in Korea. Among EU Member States only the United Kingdom (31%) comes close to such levels of private sources of funding. In one-third of the European countries, the level of private spending on education as a percentage of GDP went up between 2000 and 2007, whereas the remaining countries showed a decreasing or a constant level.

Introduction
25
Figure Int. 4.3: Private spending on education as a percentage of GDP (2000-2007) Expenditure on educational institutions (all levels of education) from private sources as % of GDP and average annual change
Private Spending on education as a % of GDP
2000 2006 2007 EU-27 0.63 i 0.67 i 0.73 i
Belgium 0.42 i 0.34 i 0.34 Bulgaria 0.65 0.65 0.62
Czech Republic 0.42 0.56 0.51 Denmark 0.27 i 0.59 0.53 Germany 0.97 0.7 0.69 Estonia : 0.34 0.32 i Ireland 0.30 0.28 0.24 i Greece 0.22 i : : Spain 0.60 0.52 0.61 i France 0.56 0.54 0.53
Italy 0.44 0.38 0.40 Cyprus 2.59 1.21 1.27 Latvia 0.63 i 0.66 0.56
Lithuania : 0.46 0.45 Luxembourg : : :
Hungary 0.57 0.54 : Malta 0.48 i : :
Netherlands 0.82 0.88 0.90 Austria 0.33 0.59 0.48 Poland : 0.54 i 0.50 i
Portugal 0.08 i 0.44 i 0.46 i Romania 0.25 i : 0.50 Slovenia : 0.78 0.73 Slovakia 0.15 i 0.62 i 0.53 i Finland 0.11 0.15 0.14 Sweden 0.19 0.17 0.16
United Kingdom 0.76 i 1.44 i 1.75 i Croatia : 0.38 0.35 Iceland 0.54 i 0.81 i 0.77 i
MK* : : : Turkey 0.04 i : :
Liechtenstein : : : Norway 0.08 i : :
Data source: Eurostat (UOE) (i) See: Eurostat database, (:) Missing or not available, *MK: The former Yugoslav Republic of Macedonia; see Annex 2
4.2. Education spending by level of education At the EU level, public spending on primary education amounted to 1.1% of GDP in 2007 whereas spending on the secondary level accounted for the biggest share of public education spending - some 2.2% of GDP. About 1.1% of the GDP went to tertiary level of education. The remaining part of the investment (about 0.5% of the GDP) was spent on pre-primary education or went to spending which cannot be allocated to a specific level. The spending at primary level of education as percentage of GDP ranged from between 0.6% (in Czech Republic) and 2.5% (in Iceland) of GDP. As regards the secondary education, spending ranged from less than 1% of GDP in Croatia to over 2.5% in several countries (Belgium, Denmark, France, Cyprus, Austria, Finland, and Sweden). Four European countries (Luxembourg, Slovenia, Croatia, Iceland) show higher levels of investment as proportion of GDP in primary compared to secondary education. For a more detailed analysis of spending on higher education see section 3 of chapter II.

Introduction
26
Figure Int. 4.4: Public spending by level of education as a percentage of GDP (2007) Total public expenditure on education as a percentage of GDP by levels of education and average annual change
2007
Primary Secondary Tertiary
All levels
EU-27 1.16 2.21 1.12 4.98 Belgium 1.42 2.58 1.31 6.02 Bulgaria 0.82 1.84 0.68 4.13
Czech Republic 0.58 2.03 1.07 4.20 Denmark 1.86 2.80 2.29 7.83 Germany 0.63 2.25 1.14 4.50 Estonia 1.13 2.25 1.07 4.85 Ireland 1.72 2.03 1.14 4.90 Greece : : : : Spain 1.10 1.66 0.99 4.35 France 1.17 2.55 1.23 5.59
Italy 1.08 1.98 0.76 4.29 Cyprus 1.95 3.03 1.61 6.93 Latvia 1.24 2.11 0.93 5.00
Lithuania 0.67 2.41 1.01 4.67 Luxembourg 1.69 1.46 : 3.15
Hungary 0.99 2.29 1.03 5.20 Malta : : 0.95 :
Netherlands 1.32 2.16 1.45 5.32 Austria 0.97 2.52 1.50 5.40 Poland 1.59 1.89 0.93 4.91
Portugal 1.48 2.09 1.20 5.30 Romania 0.84 1.52 1.12 4.25 Slovenia 2.26 1.16 1.21 5.19 Slovakia 0.67 1.69 0.79 3.62 Finland 1.20 2.52 1.85 5.91 Sweden 1.68 2.64 1.77 6.69
United Kingdom 1.65 2.45 0.94 5.39 Croatia 1.83 0.87 0.81 4.07 Iceland 2.52 2.40 1.39 7.36
MK* : : : : Turkey : : : :
Liechtenstein : : 0.17 : Norway 1.69 2.36 2.16 6.76
Data source: Eurostat (UOE) (i) See: Eurostat database, (:) Missing or not available *MK: The former Yugoslav Republic of Macedonia; see Annex 2 (**) Investments on pre-primary level and those not allocated by level are not included in this table
4.3. Education spending per student Expenditure per student follows a common pattern throughout European countries: it goes up substantially with the level of education. In 2007, the EU Member States spent between 1900 (Bulgaria) and 11600 (Luxembourg) Purchasing Power Standards (PPS) Euro per primary student, respectively between 1800 (Bulgaria and Romania) and 15200 (Luxembourg) PPS Euro per secondary student (figure Ann. Int. 4.5). At the EU level, the average ratio of tertiary-to-primary expenditure per full-time equivalent student in public institutions was 1.8 in 2007 (with a ratio of 2.5 or over in the Czech Republic, Germany, Cyprus and Romania). 4
4 Differences in student-teaching staff ratios, staffing patterns, teachers' salaries, teaching materials and facilities largely account for the cost differences between levels of education.

Introduction
27
Figure Int. 4.5: Spending per student by level of education Annual expenditure on public educational institutions per pupil/student in EUR PPS, based on full-time equivalents
1000 Euro PPS 2007
Primary Secondary Tertiary
All levels
EU-27 5.2 5.9 9.2 6.1 Belgium 6.9 8.3 12.1 8.0 Bulgaria 1.9 1.8 3.8 2.2 Czech Republic 3.8 4.6 7.4 4.6 Denmark 8.0 8.2 13.7 8.5 Germany 4.6 5.2 11.9 6.2 Estonia 3.4 4.2 5.3 3.6 Ireland 5.7 7.4 11.0 7.2 Greece : : : : Spain 6.2 8.5 10.7 7.8 France 5.3 8.5 11.0 7.2 Italy 6.1 6.7 7.2 6.6 Cyprus 6.8 10.0 17.4 8.7 Latvia 3.4 3.5 3.5 3.4 Lithuania 2.4 2.9 4.7 3.2 Luxembourg 11.6 15.3 38.9 Hungary 3.8 3.5 5.6 4.1 Malta : : : : Netherlands 5.4 7.7 13.1 7.4 Austria : : : : Poland 3.4 3.0 4.6 3.5 Portugal 4.2 5.7 8.6 5.3 Romania 2.2 1.8 5.4 2.6 Slovenia 6.5 4.9 6.0 6.1 Slovakia 2.9 2.7 4.8 3.1 Finland 5.2 6.6 11.6 6.7 Sweden 6.9 7.4 15.5 7.9 United Kingdom 6.1 6.9 : 6.5 Croatia 3.2 3.2 6.4 3.8 Iceland 8.1 7.1 8.6 8.3 MK* : : : : Turkey : : : : Liechtenstein 7.8 8.3 : 7.7 Norway 8.4 9.8 15.3 9.9
Data source: Eurostat (UOE) (i) See: Eurostat database, (:) Missing or not available *MK: The former Yugoslav Republic of Macedonia; see Annex 2

28
CHAPTER I
Making lifelong learning and mobility a reality
1. Participation in Lifelong learning 1.1 Participation in lifelong learning at various lifetime stages - Participation in pre-primary education - Participation in school and higher education - Participation in lifelong learning of adults 2. Mobility in Education 2.1 Mobility of higher education students
- Foreign students in higher education - Higher education students enrolled outside their country of origin - Balance of student flows
2.2 Student mobility programmes - Erasmus mobility
- Marie Curie actions - Mobility within vocational education and training - School level mobility - Mobility outside formal education

Chapter I: Making lifelong learning and mobility a reality
29
1. Participation in Lifelong learning This chapter reflects the wider policy concern with the full range of learning from "cradle to grave" - and not just adult education - and therefore presents information about participation in the different phases of the education continuum. Other European benchmarks, such as participation in pre-school education, early leavers from education after compulsory schooling, as well as higher education graduation, all support the aim of making lifelong learning throughout the life cycle a reality. For a more detailed presentation of participation issues in individual education sectors see chapters II and III. 1.1. Participation in lifelong learning at various lifetime stages Participation in pre-primary education In a number of EU countries, nearly all children (over 98%) between 4 years-old and the starting age for compulsory schooling are enrolled in early childhood education - this is so for France, Belgium, Spain, Italy and the Netherlands. Malta, the UK, Germany and Estonia are close behind; they all exceed the benchmark target of 95% enrolment by 2020. Germany, Cyprus, Latvia, Lithuania, Romania, Finland and Sweden have all achieved strong increases in enrolments since 2000 of over 10 percentage points (see also Chapter III), while the EU average has increased from 85.6% in 2000 to 92.3% in 2008. Participation in school and higher education In most EU countries the starting age for compulsory school education is six years (in addition there is compulsory-pre-primary education in some countries starting at an earlier age). The number of countries with a starting school age of 7 has declined in recent years. Countries that have lowered the starting age from 7 to 6 include Denmark (from August 2008), Romania (from 2003/04) and Poland (in the period 2009/2012).
Figure I.1.1: Starting ages for compulsory education
Country /education system Age
Compulsory school starting age Compulsory pre-primary 4 UK-Northern Ireland Luxembourg 5 UK-England, UK-Scotland, UK-Wales Malta,
Netherlands, Greece (children who have reached the age of 5 by 31 Dec of the year in which they enrol), Hungary, Poland (from September 2011)
6 Austria, Belgium, Cyprus( children 5 years and 8 months old before 1 September), Czech Republic, Denmark, France, Germany, Greece, Hungary, Iceland, Republic of Ireland, Italy, Liechtenstein, Luxembourg, Norway, Poland, Portugal, Romania, Slovakia, Slovenia, Spain, Turkey
Latvia (5-6 year olds)
7 Bulgaria, Estonia, Finland, Latvia, Lithuania, Sweden
Source: Eurydice While children start their education earlier in some countries the final age for compulsory education has also increased in recent years. An example is Portugal where compulsory schooling has been extended from 9 to 12 years, implying a school leaving age of 18. On the other hand, there are countries that reduce the length of upper secondary education. Several Länder in Germany are in the process of reducing the duration of upper secondary from 4 to 3 years (reduction of total years of schooling until graduating from upper secondary from 13 to 12 years).
Figure I.1.2 Final age for compulsory education
Country /education system Age
Full time education Part time education 15 Austria, Belgium, Czech Republic, Cyprus, Greece,
Slovenia
16 Bulgaria, Denmark, Estonia, Finland, France, Germany, Ireland, Latvia, Lithuania, Luxembourg, Romania, Spain, Slovakia, Sweden, UK Iceland, Norway
18 Hungary, Netherlands, Portugal Belgium, Poland, Germany (18-19)
Source: Eurydice

Chapter I: Making lifelong learning and mobility a reality
30
The growth in participation rates in non-compulsory education and, in addition, for some countries the increasing length of compulsory initial education, results in young people staying on average more years in education in many EU countries. Across EU member states the number of years that pupils and students can expect to stay in education from pre-school to higher education, went up by 0.6 years since 2000; in Greece, Cyprus, Latvia, Lithuania and Romania the increase was 2 years or more, as can be seen in figure I.1.3
Figure I.1.3: Expected years in education and training in European countries (d)
Students in all ISCED levels
2000 2007 2008
EU-27 16.7 17.2 17.3 Belgium 18.6 19.6 19.6 Bulgaria 14.2 15.7 15.7 Czech Republic 15.6 17.3 17.5 Denmark 17.8 19.0 18.8 Germany 17.2 i 17.6 i 17.6 i Estonia 16.8 18.0 17.9 Ireland 16.3 17.4 17.3 Greece 15.0 17.4 18.0 Spain 17.0 17.2 17.1 France 16.6 16.6 16.4 Italy 16.1 17.0 17.0 Cyprus 13.0 i 14.8 15.3 Latvia 15.5 17.6 17.6 Lithuania 15.8 17.9 17.9 Luxembourg 14.3 i 13.9 i 14.5 Hungary 16.1 17.8 17.7 Malta 14.4 i 14.7 i 13.5 Netherlands 17.2 17.7 17.8 Austria 15.5 16.5 16.6 Poland 16.4 17.9 17.9 Portugal 16.9 17.0 18.4 Romania 14 i 15.9 16.4 Slovenia 16.7 i 18.0 18.5 Slovakia : 16.4 16.5 Finland 18.6 20.5 20.5 Sweden 19.9 19.7 19.5 United Kingdom 18.9 16.2 16.5 Croatia : 15.2 15.3 MK* 12.9 i 13.7 13.7 Turkey : 12.8 13.6 Iceland 17.9 19.8 19.9 Liechtenstein 13.5 16.3 16.3 Norway 17.8 18.4 18.3
Data source: Eurostat (UOE data collection) (:) Missing or not available, (i) See: Eurostat database (d) Number of years a person of a given age can expect to spend within the specified ISCED levels, including years spent on repetition. This type of estimate will be accurate if current patterns of enrolment continue in the future. Estimates are based on headcount data. *MK: The former Yugoslav Republic of Macedonia; see Annex 2 More and more young people are staying later in education. In 2008 nearly 60% of the age group 15-24 participated in formal education, 5 percentage points more than in 2000. The countries with the highest participation rates (> 70%) were Poland and Slovenia. Countries with low rates (< 50%) include Cyprus, Luxembourg and the UK. For Cyprus and Luxembourg the low rate is partially explained by the fact that many tertiary students study abroad (and hence are not included in the calculation), for the UK by the fact that many tertiary students finish their studies relatively early. In the age group 16-18 over 86% of young people in Europe are still in formal education. In the Czech Republic, in Lithuania, Poland and Sweden over 95% of young people in this age group are still enrolled. Cyprus, Luxembourg, Romania and the UK are the countries with the lowest enrolment rates (< 80%). After the age of 18 enrolment rates strongly decline, since upper secondary education ends for many pupils. At the age of 20 just more than half of young people in the EU are still enrolled. In Greece, Poland and Slovenia more than two thirds of young people in this age group are still enrolled. At the age of 22, students have generally finished upper secondary education and in some countries they have already finished tertiary education. Enrolment rates in the EU hence fall to 36% for this age cohort. In Poland, Slovenia and Finland, however, at this age still more than 50% of the cohortare enrolled, while in Cyprus, Luxembourg and the UK less than ¼ are enrolled.

Chapter I: Making lifelong learning and mobility a reality
31
Figure I.1.4 Students (ISCED 1-6) by sex aged 15-24 years as % of corresponding age population
Students enrolled as a% of corresponding age population at the age of..
15-24 years 16-18 years
20 years 22 years 24 years
2000 2007 2008 2008 2008 2008 2008
EU-27 54.8 59.5 59.7 86.4 51.4 36.3 23.6 Belgium 65.3 68.6 68.2 94.4 66.0 42.7 24.6 Bulgaria 42.5 52.4 51.9 81.0 40.4 34.1 18.2 Czech Republic 47.9 62.1 61.6 95.1 48.8 35.3 23.4 Denmark 58.4 66.9 66.5 85.8 47.3 49.7 44.2 Germany 62.8 (i) 65.4 64.7 (i) 92.1 55.5 39.8 28.9 (i) Estonia 60.7 62.1 60.8 91.4 51.8 38.6 21.7 Ireland 54.3 58.1 57.9 93.2 57.9 28.4 12.6 Greece 53.6 60.1 64.2 83.0 68.5 45.5 27.9 Spain 56.2 55.4 55.4 81.9 49.9 34.7 22.4 France 61.7 58.8 58.3 86.7 50.0 31.6 16.4 Italy 46.9 (i) 56.3 57.5 (i) 85.6 43.4 33.5 24.8 (i) Cyprus 37.0 41.2 43.6 74.2 31.9 19.5 12.0 Latvia 55.4 62.5 61.0 89.5 52.6 45.2 19.9 Lithuania 60.1 68.7 69.0 95.1 65.8 49.4 26.4 Luxembourg 40.8 (i) 41.8 46.3 79.1 33.5 14.5 7.1 Hungary 50.1 63.7 64.5 91.3 62.7 39.9 22.7 Malta 37.1 44.5 : (u) : : (u) : (u) : (u) Netherlands 62.7 67.5 68.1 91.5 65.0 45.5 27.9 Austria 50.9 53.8 54.5 84.4 36.6 31.2 24.6 Poland 61.6 (i) 70.3 70.3 (i) 95.0 69.3 52.6 30.5 (i) Portugal 51.1 53.0 56.2 82.6 47.5 34.3 22.1 Romania 37.3 (i) 53.6 56.9 78.7 44.0 33.3 23.9 Slovenia 59.3 (i) 70.1 71.0 94.6 84.5 50.6 35.9 Slovakia : 56.3 56.5 89.0 43.5 33.7 16.9 Finland 67.5 70.9 70.5 94.4 50.0 57.9 49.1 Sweden 64.5 66.6 65.0 97.9 36.3 43.8 39.2 United Kingdom 54.2 (i) 47.7 47.9 72.9 40.6 20.9 13.4 Croatia : 50.8 51.5 82.2 43.1 29.6 12.0 Iceland 60.8 66.6 65.4 84.5 50.2 32.0 39.6 MK* 35.4 (i) 42.2 43.9 69.1 32.3 24.6 11.7 Turkey 18.3 : 33.1 45.1 27.9 21.2 11.6 Liechtenstein 8.4 54.4 55.0 90.2 33.5 46.9 22.7 Norway 62.5 66.1 65.3 91.7 50.1 27.5 30.8
Data source: Eurostat (UOE data collection) (:) Missing or not available, (i) See: Eurostat database (d) Number of years a person of a given age can expect to spend within the specified ISCED levels, including years spent on repetition. This type of estimate will be accurate if current patterns of enrolment continue in the future. Estimates are based on headcount data. *MK: The former Yugoslav Republic of Macedonia; see Annex 2 The age of 24 is for many students the year they finish tertiary education. At this age in the EU 23.6% of a cohort is still enrolled. In Denmark and Finland, where a large share of young people participate in tertiary education and where the starting age is relatively high still more than 40% of young people are in education. Participation in lifelong learning of adults The European benchmark on lifelong learning concerns what could more strictly be called adult education and training. Originally established in 2003, it now sets the objective that by 2020 15% of adults aged 25-64 should participate in adult learning. Participation rates for this benchmark are measured by the European Labour Force Survey, which asks about participation in formal and non-formal learning in the 4 weeks prior to the survey5. Workplaces are in most countries the main providers of adult lifelong learning. Adult lifelong learning is one of the four components of the flexicurity approach of the European Employment Strategy. Results for 2009 show that 9.3% of 25-64 year olds participated in education and training in the four weeks preceding the survey.6 This is still short of the benchmark of 12.5% for 2010 and far below the 15% foreseen for
5 The 5-yearly Adult Education Survey asks about participation in learning within the last year and hence shows higher participation
figures. AES survey results are used in chapter III of this report. 6 This indicator refers to persons aged 25 to 64 who stated that they received education or training in the four weeks preceding the
survey (numerator). The denominator consists of the total population of the same age group, excluding those who did not answer to the question 'participation to education and training'. Both the numerator and the denominator come from the EU Labour Force Survey. The information collected relates to all education or training whether or not relevant to the respondent's current or possible future job.
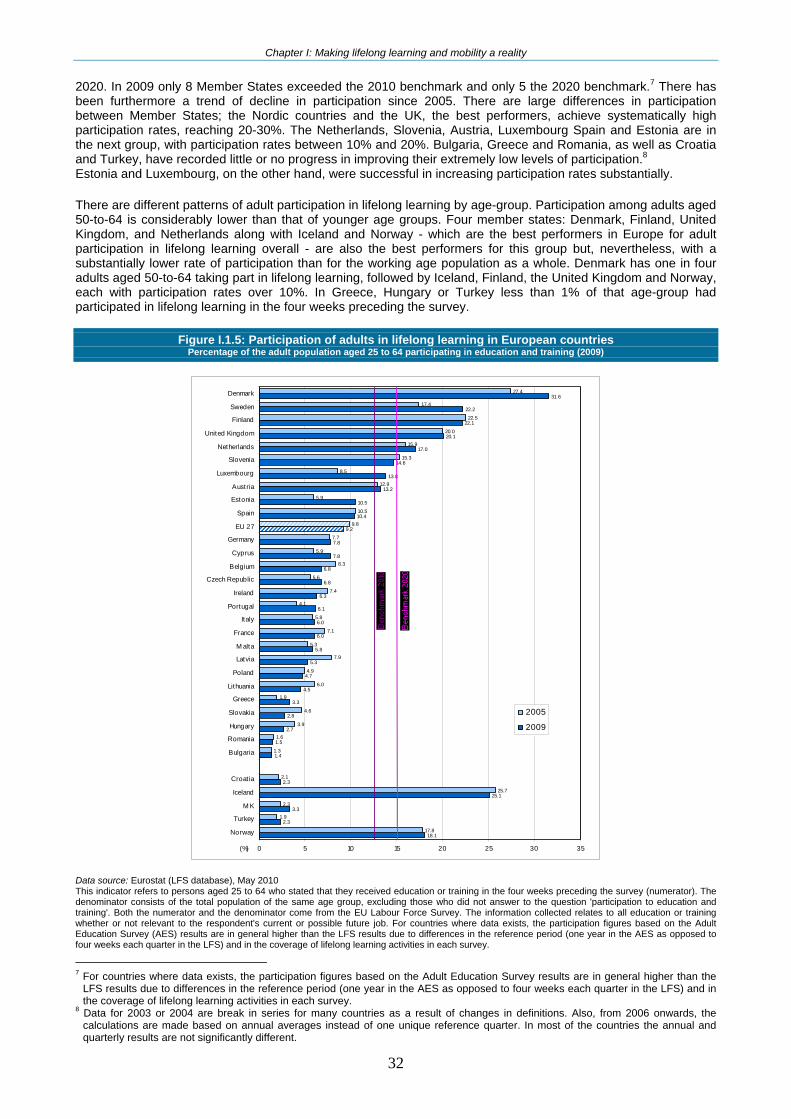
Chapter I: Making lifelong learning and mobility a reality
32
2020. In 2009 only 8 Member States exceeded the 2010 benchmark and only 5 the 2020 benchmark.7 There has been furthermore a trend of decline in participation since 2005. There are large differences in participation between Member States; the Nordic countries and the UK, the best performers, achieve systematically high participation rates, reaching 20-30%. The Netherlands, Slovenia, Austria, Luxembourg Spain and Estonia are in the next group, with participation rates between 10% and 20%. Bulgaria, Greece and Romania, as well as Croatia and Turkey, have recorded little or no progress in improving their extremely low levels of participation.8 Estonia and Luxembourg, on the other hand, were successful in increasing participation rates substantially. There are different patterns of adult participation in lifelong learning by age-group. Participation among adults aged 50-to-64 is considerably lower than that of younger age groups. Four member states: Denmark, Finland, United Kingdom, and Netherlands along with Iceland and Norway - which are the best performers in Europe for adult participation in lifelong learning overall - are also the best performers for this group but, nevertheless, with a substantially lower rate of participation than for the working age population as a whole. Denmark has one in four adults aged 50-to-64 taking part in lifelong learning, followed by Iceland, Finland, the United Kingdom and Norway, each with participation rates over 10%. In Greece, Hungary or Turkey less than 1% of that age-group had participated in lifelong learning in the four weeks preceding the survey.
Figure I.1.5: Participation of adults in lifelong learning in European countries Percentage of the adult population aged 25 to 64 participating in education and training (2009)
18.1
3.3
25.1
2.3
1.4
1.5
2.8
3.3
4.5
4.7
5.3
5.8
6.0
6.0
6.1
6.3
6.8
6.8
7.8
7.8
9.2
10.4
10.5
13.2
13.8
14.6
17.0
20.1
22.1
22.2
31.6
17.8
2.3
2.1
1.3
1.6
3.9
4.6
1.9
6.0
4.9
7.9
5.3
7.1
5.8
4.1
7.4
5.6
8.3
5.9
7.7
9.8
10.5
5.9
12.9
8.5
15.3
15.9
20.0
22.5
17.4
27.4
2.7
2.3
25.7
1.9
0 5 10 15 20 25 30 35
Norway
Turkey
M K
Iceland
Croat ia
Bulgaria
Romania
Hungary
Slovakia
Greece
Lithuania
Poland
Latvia
M alta
France
Italy
Portugal
Ireland
Czech Republic
Belgium
Cyprus
Germany
EU 27
Spain
Estonia
Austria
Luxembourg
Slovenia
Netherlands
United Kingdom
Finland
Sweden
Denmark
(%)
2005
2009
Data source: Eurostat (LFS database), May 2010 This indicator refers to persons aged 25 to 64 who stated that they received education or training in the four weeks preceding the survey (numerator). The denominator consists of the total population of the same age group, excluding those who did not answer to the question 'participation to education and training'. Both the numerator and the denominator come from the EU Labour Force Survey. The information collected relates to all education or training whether or not relevant to the respondent's current or possible future job. For countries where data exists, the participation figures based on the Adult Education Survey (AES) results are in general higher than the LFS results due to differences in the reference period (one year in the AES as opposed to four weeks each quarter in the LFS) and in the coverage of lifelong learning activities in each survey.
7 For countries where data exists, the participation figures based on the Adult Education Survey results are in general higher than the
LFS results due to differences in the reference period (one year in the AES as opposed to four weeks each quarter in the LFS) and in the coverage of lifelong learning activities in each survey.
8 Data for 2003 or 2004 are break in series for many countries as a result of changes in definitions. Also, from 2006 onwards, the calculations are made based on annual averages instead of one unique reference quarter. In most of the countries the annual and quarterly results are not significantly different.
Chapter I: Making lifelong learning and mobility a reality
33
Participation of adults in continuing vocational training follows a similar pattern with Nordic countries showing the highest rates (over 40%) and Eastern and Southern European countries showing the lowest rates (less than 20%). For more details see section 2 of chapter II. 2. Mobility in Education Alongside participation in education, learning mobility – for all learners and in all learning experiences – is part of the first strategic objective for the ET 2020 process. Learning mobility contributes not only to personal development and fulfilment but also to enhancing competence in fields like languages and intercultural understanding and, hence, to employability on an increasingly international labour market. This chapter will analyse learning mobility with a particular focus on the educational sector where it is most developed and where data (though still incomplete) are best developed, namely among students in higher education. In addition, it will look at the evidence for learning mobility in the vocational and secondary sectors drawing on data from the Leonardo da Vinci and the Comenius programmes.
2.1. Mobility of higher education students Higher education is the level where learning mobility is most developed, supported by European (Erasmus) and bilateral programmes. Data availability is better than on other levels, although important gaps remain as regards short term mobility outside programmes. More data are available for the current mobility of students than for the accumulated mobility at graduate level (the proposed benchmark on higher education mobility relates to the mobility rate of those graduating from tertiary education). The analysis of mobility in this section will focus mainly on four indicators:
Foreign students enrolled in tertiary education (ISCED levels 5 and 6) as a percentage of all students enrolled in the country of destination
Percentage of students (ISCED levels 5 and 6) from the country of origin enrolled abroad (in EU, EEA and Candidate countries);
Inward mobility of Erasmus students Outward mobility of Erasmus students.
Foreign students in higher education About 1.5 million students were enrolled in tertiary education in EU-27 countries in 2008 (the 2007/08 academic year) in countries other than their country of citizenship (EU students studying in another EU country and non EU students studying within the EU). This figure compares with 788 000 in 2000, indicating a very rapid annual expansion over the period 2000-2008 of 8.1% on average and hence faster than the annual growth in student numbers (2.3%). Mobility levels have hence increased. An increasing share of tertiary students enrolled in Europe comes from outside Europe. The number of students from India and from China grew six-fold from 2000 to 2008, reaching 43 000 from India and 116 000 from China in 2008. In Cyprus, France, Malta and Portugal more than 80% of all foreign students come from outside the EU, while the corresponding figures in Austria, the Czech Republic, Estonia and Greece were under 40%. There are several reasons for the high proportion of students from other parts of the world studying in EU-27. Firstly, the underlying data mainly relate to students with foreign citizenship (less data are available on mobile students per se); some of these students will in fact be resident in the country where they are studying (see section on quality of data). Another reason could be the wide variety of languages used in higher education in Europe, attracting students from all over the world. Finally, there is clear evidence that students from former colonies of European countries study in the former colonial countries with which they have cultural and linguistic ties.
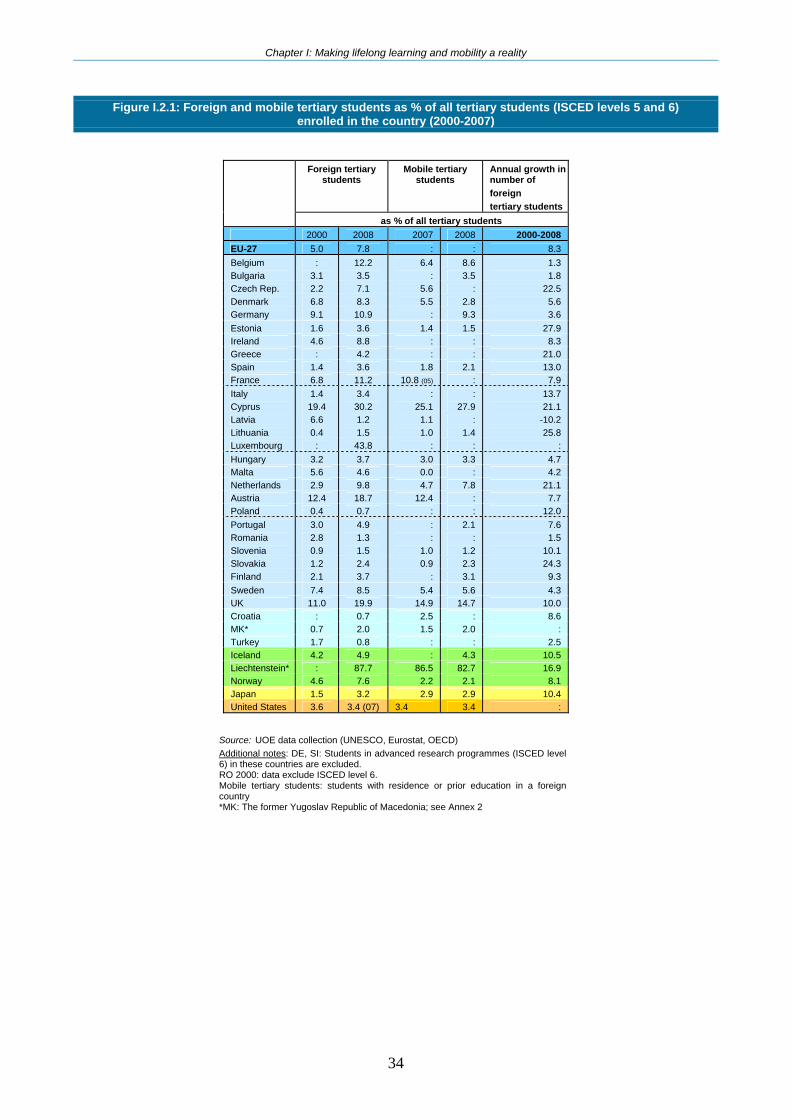
Chapter I: Making lifelong learning and mobility a reality
34
Figure I.2.1: Foreign and mobile tertiary students as % of all tertiary students (ISCED levels 5 and 6) enrolled in the country (2000-2007)
Foreign tertiary students
Mobile tertiary students
Annual growth in number of foreign tertiary students
as % of all tertiary students 2000 2008 2007 2008 2000-2008 EU-27 5.0 7.8 : : 8.3 Belgium : 12.2 6.4 8.6 1.3 Bulgaria 3.1 3.5 : 3.5 1.8 Czech Rep. 2.2 7.1 5.6 : 22.5 Denmark 6.8 8.3 5.5 2.8 5.6 Germany 9.1 10.9 : 9.3 3.6 Estonia 1.6 3.6 1.4 1.5 27.9 Ireland 4.6 8.8 : : 8.3 Greece : 4.2 : : 21.0 Spain 1.4 3.6 1.8 2.1 13.0 France 6.8 11.2 10.8 (05) : 7.9 Italy 1.4 3.4 : : 13.7 Cyprus 19.4 30.2 25.1 27.9 21.1 Latvia 6.6 1.2 1.1 : -10.2 Lithuania 0.4 1.5 1.0 1.4 25.8 Luxembourg : 43.8 : : : Hungary 3.2 3.7 3.0 3.3 4.7 Malta 5.6 4.6 0.0 : 4.2 Netherlands 2.9 9.8 4.7 7.8 21.1 Austria 12.4 18.7 12.4 : 7.7 Poland 0.4 0.7 : : 12.0 Portugal 3.0 4.9 : 2.1 7.6 Romania 2.8 1.3 : : 1.5 Slovenia 0.9 1.5 1.0 1.2 10.1 Slovakia 1.2 2.4 0.9 2.3 24.3 Finland 2.1 3.7 : 3.1 9.3 Sweden 7.4 8.5 5.4 5.6 4.3 UK 11.0 19.9 14.9 14.7 10.0 Croatia : 0.7 2.5 : 8.6 MK* 0.7 2.0 1.5 2.0 : Turkey 1.7 0.8 : : 2.5 Iceland 4.2 4.9 : 4.3 10.5 Liechtenstein* : 87.7 86.5 82.7 16.9 Norway 4.6 7.6 2.2 2.1 8.1 Japan 1.5 3.2 2.9 2.9 10.4 United States 3.6 3.4 (07) 3.4 3.4 :
Source: UOE data collection (UNESCO, Eurostat, OECD) Additional notes: DE, SI: Students in advanced research programmes (ISCED level 6) in these countries are excluded. RO 2000: data exclude ISCED level 6. Mobile tertiary students: students with residence or prior education in a foreign country *MK: The former Yugoslav Republic of Macedonia; see Annex 2
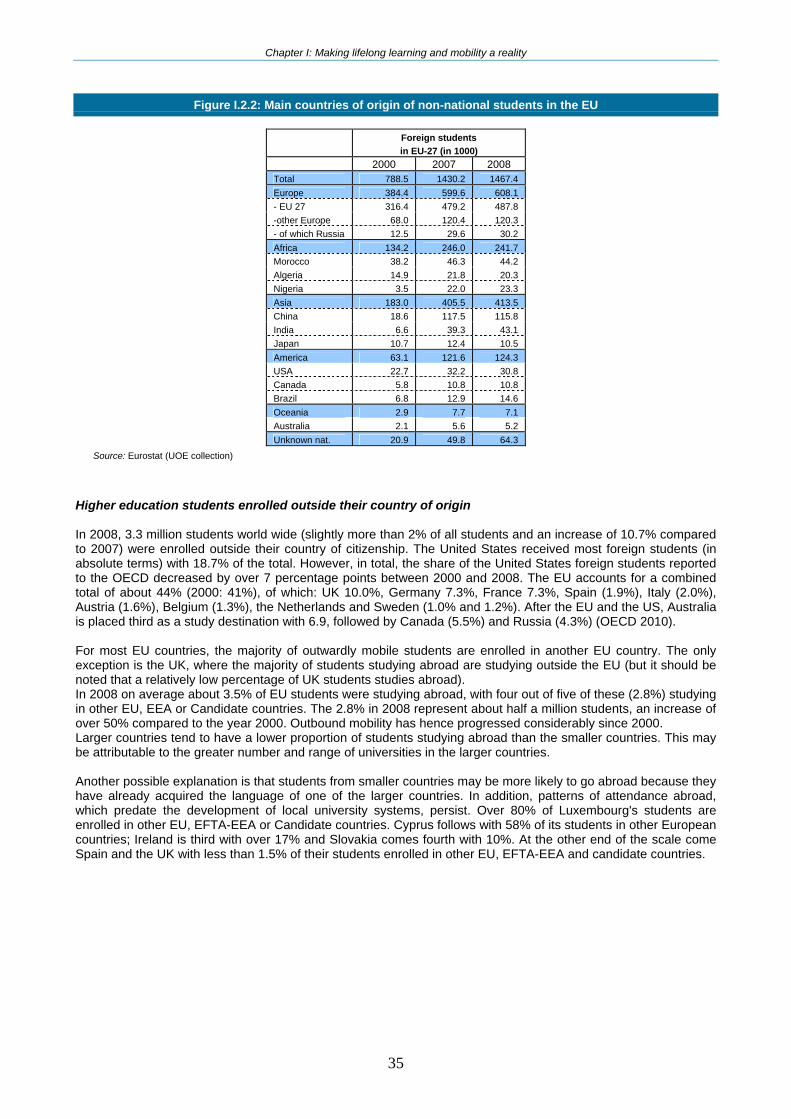
Chapter I: Making lifelong learning and mobility a reality
35
Figure I.2.2: Main countries of origin of non-national students in the EU
Foreign students in EU-27 (in 1000)
2000 2007 2008 Total 788.5 1430.2 1467.4 Europe 384.4 599.6 608.1 - EU 27 316.4 479.2 487.8 -other Europe 68.0 120.4 120.3 - of which Russia 12.5 29.6 30.2 Africa 134.2 246.0 241.7 Morocco 38.2 46.3 44.2 Algeria 14.9 21.8 20.3 Nigeria 3.5 22.0 23.3 Asia 183.0 405.5 413.5 China 18.6 117.5 115.8 India 6.6 39.3 43.1 Japan 10.7 12.4 10.5 America 63.1 121.6 124.3 USA 22.7 32.2 30.8 Canada 5.8 10.8 10.8 Brazil 6.8 12.9 14.6 Oceania 2.9 7.7 7.1 Australia 2.1 5.6 5.2 Unknown nat. 20.9 49.8 64.3
Source: Eurostat (UOE collection)
Higher education students enrolled outside their country of origin In 2008, 3.3 million students world wide (slightly more than 2% of all students and an increase of 10.7% compared to 2007) were enrolled outside their country of citizenship. The United States received most foreign students (in absolute terms) with 18.7% of the total. However, in total, the share of the United States foreign students reported to the OECD decreased by over 7 percentage points between 2000 and 2008. The EU accounts for a combined total of about 44% (2000: 41%), of which: UK 10.0%, Germany 7.3%, France 7.3%, Spain (1.9%), Italy (2.0%), Austria (1.6%), Belgium (1.3%), the Netherlands and Sweden (1.0% and 1.2%). After the EU and the US, Australia is placed third as a study destination with 6.9, followed by Canada (5.5%) and Russia (4.3%) (OECD 2010). For most EU countries, the majority of outwardly mobile students are enrolled in another EU country. The only exception is the UK, where the majority of students studying abroad are studying outside the EU (but it should be noted that a relatively low percentage of UK students studies abroad). In 2008 on average about 3.5% of EU students were studying abroad, with four out of five of these (2.8%) studying in other EU, EEA or Candidate countries. The 2.8% in 2008 represent about half a million students, an increase of over 50% compared to the year 2000. Outbound mobility has hence progressed considerably since 2000. Larger countries tend to have a lower proportion of students studying abroad than the smaller countries. This may be attributable to the greater number and range of universities in the larger countries. Another possible explanation is that students from smaller countries may be more likely to go abroad because they have already acquired the language of one of the larger countries. In addition, patterns of attendance abroad, which predate the development of local university systems, persist. Over 80% of Luxembourg's students are enrolled in other EU, EFTA-EEA or Candidate countries. Cyprus follows with 58% of its students in other European countries; Ireland is third with over 17% and Slovakia comes fourth with 10%. At the other end of the scale come Spain and the UK with less than 1.5% of their students enrolled in other EU, EFTA-EEA and candidate countries.
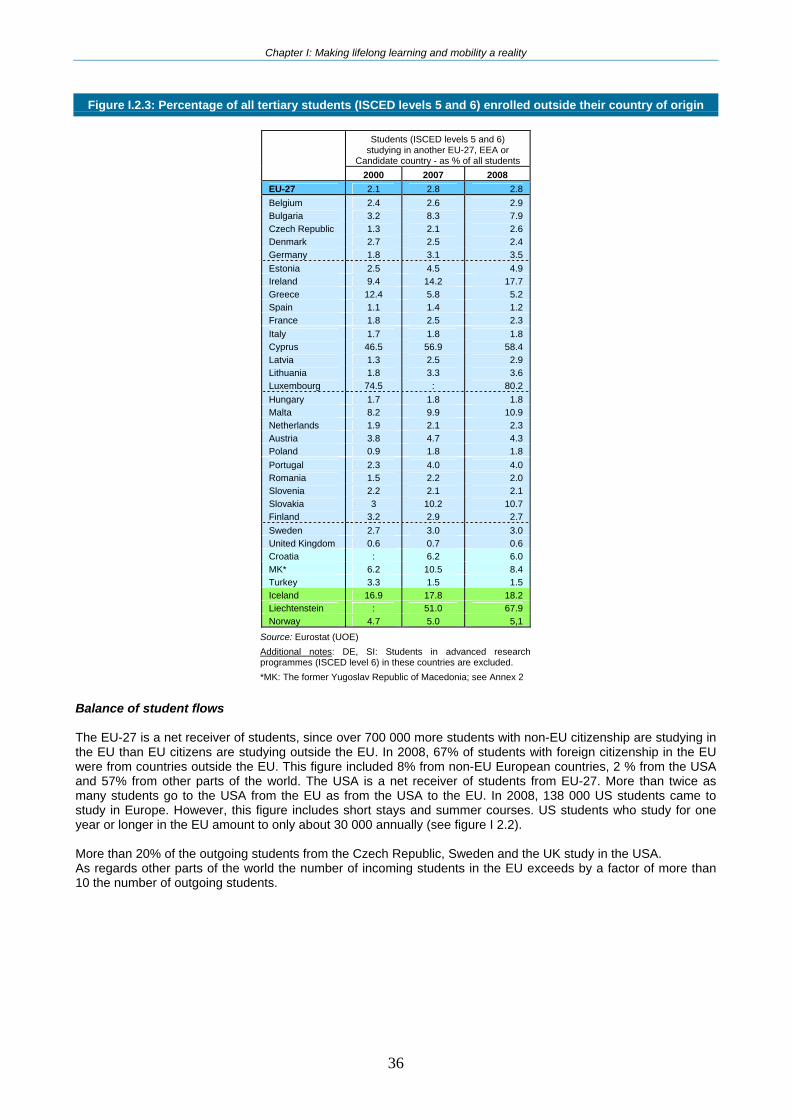
Chapter I: Making lifelong learning and mobility a reality
36
Figure I.2.3: Percentage of all tertiary students (ISCED levels 5 and 6) enrolled outside their country of origin
Students (ISCED levels 5 and 6)
studying in another EU-27, EEA or Candidate country - as % of all students
2000 2007 2008 EU-27 2.1 2.8 2.8 Belgium 2.4 2.6 2.9 Bulgaria 3.2 8.3 7.9 Czech Republic 1.3 2.1 2.6 Denmark 2.7 2.5 2.4 Germany 1.8 3.1 3.5 Estonia 2.5 4.5 4.9 Ireland 9.4 14.2 17.7 Greece 12.4 5.8 5.2 Spain 1.1 1.4 1.2 France 1.8 2.5 2.3 Italy 1.7 1.8 1.8 Cyprus 46.5 56.9 58.4 Latvia 1.3 2.5 2.9 Lithuania 1.8 3.3 3.6 Luxembourg 74.5 : 80.2 Hungary 1.7 1.8 1.8 Malta 8.2 9.9 10.9 Netherlands 1.9 2.1 2.3 Austria 3.8 4.7 4.3 Poland 0.9 1.8 1.8 Portugal 2.3 4.0 4.0 Romania 1.5 2.2 2.0 Slovenia 2.2 2.1 2.1 Slovakia 3 10.2 10.7 Finland 3.2 2.9 2.7 Sweden 2.7 3.0 3.0 United Kingdom 0.6 0.7 0.6 Croatia : 6.2 6.0 MK* 6.2 10.5 8.4 Turkey 3.3 1.5 1.5 Iceland 16.9 17.8 18.2 Liechtenstein : 51.0 67.9 Norway 4.7 5.0 5,1
Source: Eurostat (UOE) Additional notes: DE, SI: Students in advanced research programmes (ISCED level 6) in these countries are excluded. *MK: The former Yugoslav Republic of Macedonia; see Annex 2
Balance of student flows The EU-27 is a net receiver of students, since over 700 000 more students with non-EU citizenship are studying in the EU than EU citizens are studying outside the EU. In 2008, 67% of students with foreign citizenship in the EU were from countries outside the EU. This figure included 8% from non-EU European countries, 2 % from the USA and 57% from other parts of the world. The USA is a net receiver of students from EU-27. More than twice as many students go to the USA from the EU as from the USA to the EU. In 2008, 138 000 US students came to study in Europe. However, this figure includes short stays and summer courses. US students who study for one year or longer in the EU amount to only about 30 000 annually (see figure I 2.2). More than 20% of the outgoing students from the Czech Republic, Sweden and the UK study in the USA. As regards other parts of the world the number of incoming students in the EU exceeds by a factor of more than 10 the number of outgoing students.
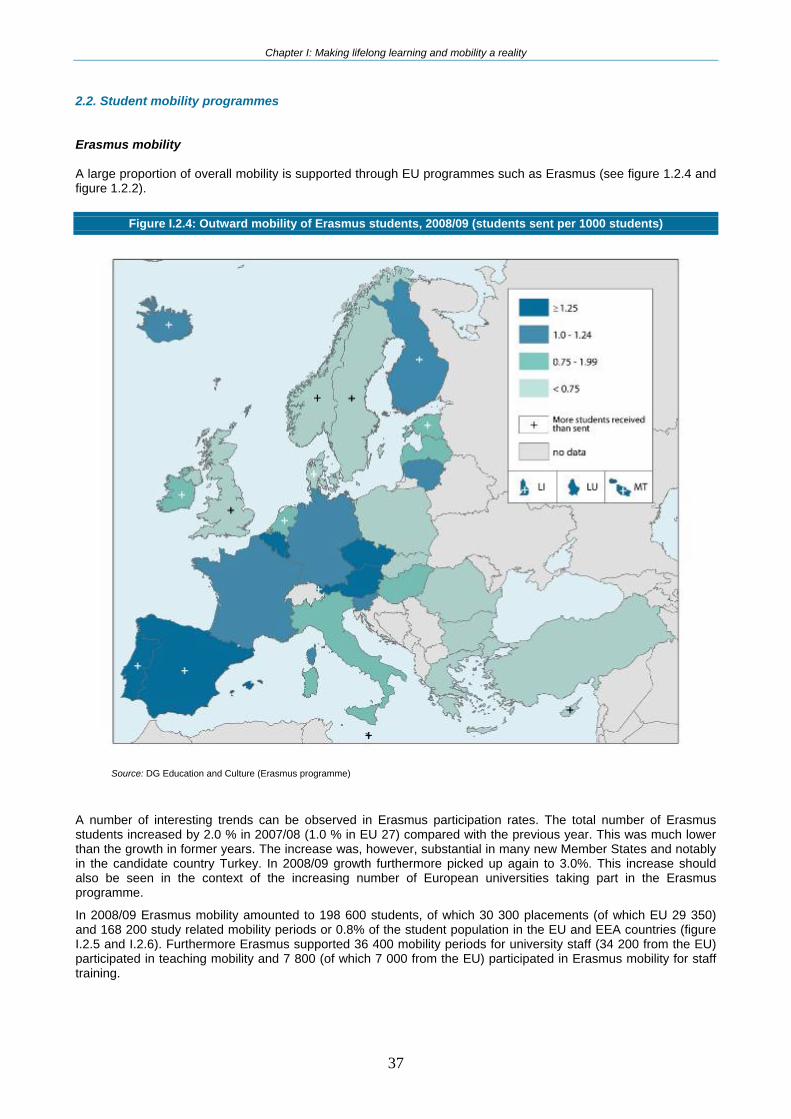
Chapter I: Making lifelong learning and mobility a reality
37
2.2. Student mobility programmes Erasmus mobility A large proportion of overall mobility is supported through EU programmes such as Erasmus (see figure 1.2.4 and figure 1.2.2).
Figure I.2.4: Outward mobility of Erasmus students, 2008/09 (students sent per 1000 students)
Source: DG Education and Culture (Erasmus programme)
A number of interesting trends can be observed in Erasmus participation rates. The total number of Erasmus students increased by 2.0 % in 2007/08 (1.0 % in EU 27) compared with the previous year. This was much lower than the growth in former years. The increase was, however, substantial in many new Member States and notably in the candidate country Turkey. In 2008/09 growth furthermore picked up again to 3.0%. This increase should also be seen in the context of the increasing number of European universities taking part in the Erasmus programme.
In 2008/09 Erasmus mobility amounted to 198 600 students, of which 30 300 placements (of which EU 29 350) and 168 200 study related mobility periods or 0.8% of the student population in the EU and EEA countries (figure I.2.5 and I.2.6). Furthermore Erasmus supported 36 400 mobility periods for university staff (34 200 from the EU) participated in teaching mobility and 7 800 (of which 7 000 from the EU) participated in Erasmus mobility for staff training.

Chapter I: Making lifelong learning and mobility a reality
38
Figure I.2.5: Mobility of Erasmus students, 2008/09
Per 100 students
2006/07
Students sent 2008/09
Students received 2008/09 Students
sent Students received
EU-27 159750 159750 0,8 0,8 Belgium 5041 5283 1,3 1,3 Bulgaria 1283 393 0,5 0,1 Czech Rep. 5440 3764 1,4 1,0 Denmark 1648 5273 0,7 2,3 Germany 23407 17722 1,0 0,8 Estonia 551 591 0,8 0,9 Ireland 1421 4061 0,8 2,3 Greece 2737 1946 0,5 0,3 Spain 24399 28175 1,4 1,6 France 23560 20955 1,1 1,0 Italy 17754 15530 0,9 0,8 Cyprus 144 234 0,6 0,9 Latvia 1104 401 0,9 0,3 Lithuania 2425 1117 1,2 0,5 Luxembourg 426 53 14,1 1,8 Hungary 3518 2205 0,9 0,5 Malta 142 355 1,5 3,7 Netherlands 4902 6894 0,8 1,1 Austria 4053 4039 1,4 1,4 Poland 11784 4528 0,5 0,2 Portugal 4834 5732 1,3 1,5 Romania 3064 990 0,3 0,1 Slovenia 1132 991 1,0 0,9 Slovakia 1703 787 0,7 0,3 Finland 3436 6115 1,1 2,0 Sweden 2413 8206 0,6 2,0 UK 7429 16065 0,3 0,7 Iceland 186 353 1.2 2.2 Turkey 6920 2360 0.3 0.1 Liechtenstein 20 34 3.5 4.8 Norway 1317 3041 0.6 1.4
Source: European Commission, DG Education and Culture
Figure I.2.6.: Mobility of students in the Erasmus programme
1987/88 1989/90 1994/95 1999/00 2000/01 2004/05 2005/06 2006/07 2007/08 2008/09 Total
EU-27 72 341 106 418 109 933 141 391 149 933 153 396 155078 159750 1 818 779
Turkey - - - - - 1142 2852 4438 6274 6920 21 626
Iceland, Liechtenstein and Norway - - 1066 1248 1159 1504 1636 1490 1343 1523 21 017
Total (EU-27 + EEA + CC ) 3 244 19 456 73 407 107 666 111 092 144 037 154 421 159 324 162695 168193 2 014 816
Placements EU-27 19085 29349 48434 Source: European Commission, DG Education and Culture
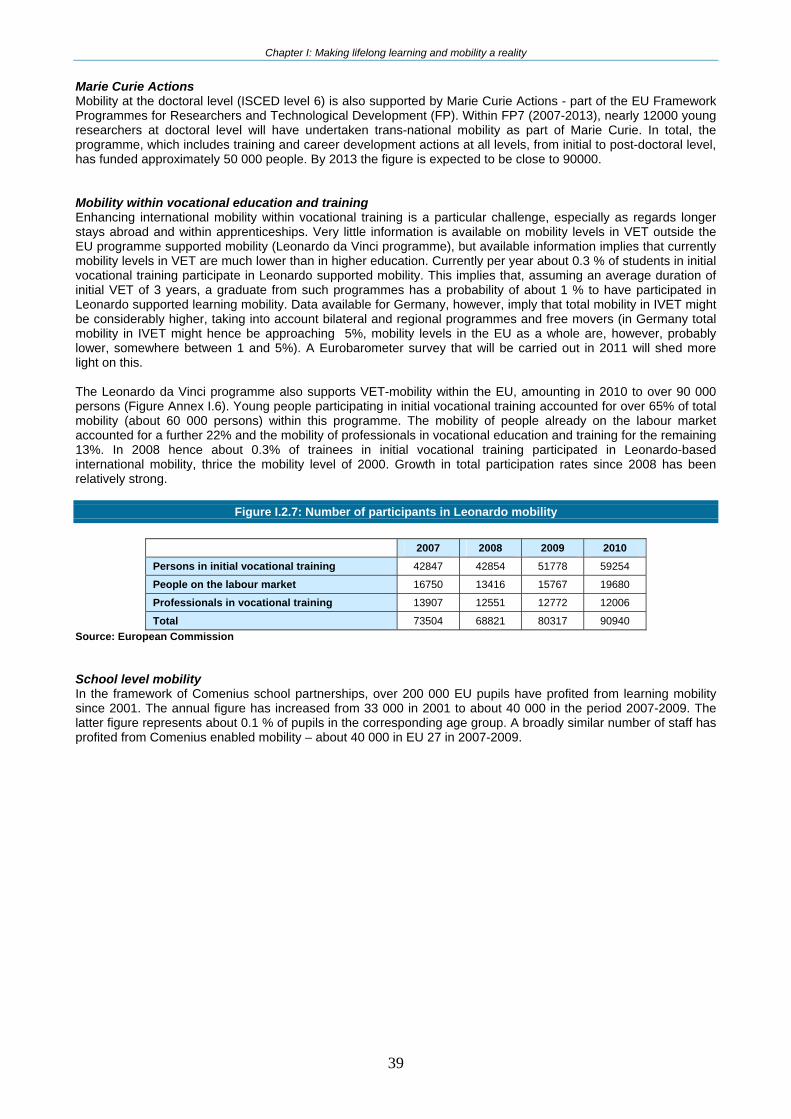
Chapter I: Making lifelong learning and mobility a reality
39
Marie Curie Actions Mobility at the doctoral level (ISCED level 6) is also supported by Marie Curie Actions - part of the EU Framework Programmes for Researchers and Technological Development (FP). Within FP7 (2007-2013), nearly 12000 young researchers at doctoral level will have undertaken trans-national mobility as part of Marie Curie. In total, the programme, which includes training and career development actions at all levels, from initial to post-doctoral level, has funded approximately 50 000 people. By 2013 the figure is expected to be close to 90000. Mobility within vocational education and training Enhancing international mobility within vocational training is a particular challenge, especially as regards longer stays abroad and within apprenticeships. Very little information is available on mobility levels in VET outside the EU programme supported mobility (Leonardo da Vinci programme), but available information implies that currently mobility levels in VET are much lower than in higher education. Currently per year about 0.3 % of students in initial vocational training participate in Leonardo supported mobility. This implies that, assuming an average duration of initial VET of 3 years, a graduate from such programmes has a probability of about 1 % to have participated in Leonardo supported learning mobility. Data available for Germany, however, imply that total mobility in IVET might be considerably higher, taking into account bilateral and regional programmes and free movers (in Germany total mobility in IVET might hence be approaching 5%, mobility levels in the EU as a whole are, however, probably lower, somewhere between 1 and 5%). A Eurobarometer survey that will be carried out in 2011 will shed more light on this. The Leonardo da Vinci programme also supports VET-mobility within the EU, amounting in 2010 to over 90 000 persons (Figure Annex I.6). Young people participating in initial vocational training accounted for over 65% of total mobility (about 60 000 persons) within this programme. The mobility of people already on the labour market accounted for a further 22% and the mobility of professionals in vocational education and training for the remaining 13%. In 2008 hence about 0.3% of trainees in initial vocational training participated in Leonardo-based international mobility, thrice the mobility level of 2000. Growth in total participation rates since 2008 has been relatively strong.
Figure I.2.7: Number of participants in Leonardo mobility
2007 2008 2009 2010 Persons in initial vocational training 42847 42854 51778 59254
People on the labour market 16750 13416 15767 19680
Professionals in vocational training 13907 12551 12772 12006
Total 73504 68821 80317 90940 Source: European Commission School level mobility In the framework of Comenius school partnerships, over 200 000 EU pupils have profited from learning mobility since 2001. The annual figure has increased from 33 000 in 2001 to about 40 000 in the period 2007-2009. The latter figure represents about 0.1 % of pupils in the corresponding age group. A broadly similar number of staff has profited from Comenius enabled mobility – about 40 000 in EU 27 in 2007-2009.
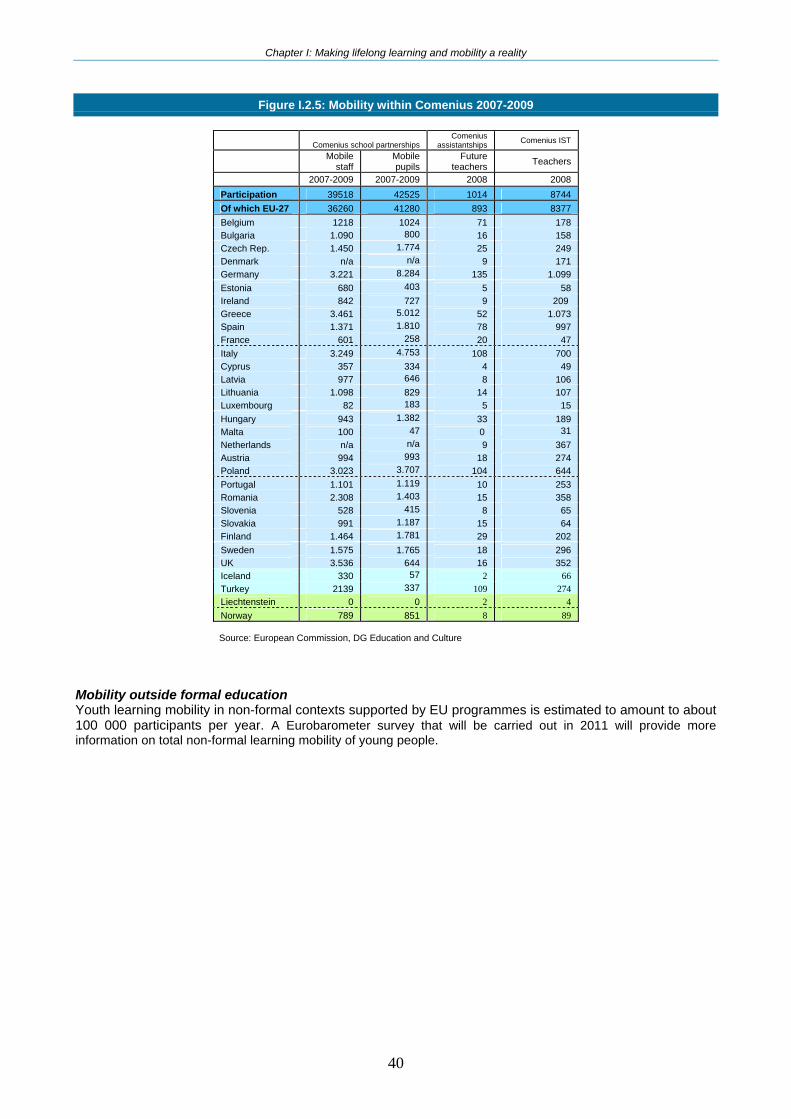
Chapter I: Making lifelong learning and mobility a reality
40
Figure I.2.5: Mobility within Comenius 2007-2009
Comenius school partnerships
Comenius assistantships Comenius IST
Mobile
staff Mobile pupils
Future teachers Teachers
2007-2009 2007-2009 2008 2008 Participation 39518 42525 1014 8744 Of which EU-27 36260 41280 893 8377 Belgium 1218 1024 71 178 Bulgaria 1.090 800 16 158 Czech Rep. 1.450 1.774 25 249 Denmark n/a n/a 9 171 Germany 3.221 8.284 135 1.099 Estonia 680 403 5 58 Ireland 842 727 9 209 Greece 3.461 5.012 52 1.073 Spain 1.371 1.810 78 997 France 601 258 20 47 Italy 3.249 4.753 108 700 Cyprus 357 334 4 49 Latvia 977 646 8 106 Lithuania 1.098 829 14 107 Luxembourg 82 183 5 15 Hungary 943 1.382 33 189 Malta 100 47 0 31 Netherlands n/a n/a 9 367 Austria 994 993 18 274 Poland 3.023 3.707 104 644 Portugal 1.101 1.119 10 253 Romania 2.308 1.403 15 358 Slovenia 528 415 8 65 Slovakia 991 1.187 15 64 Finland 1.464 1.781 29 202 Sweden 1.575 1.765 18 296 UK 3.536 644 16 352 Iceland 330 57 2 66 Turkey 2139 337 109 274 Liechtenstein 0 0 2 4 Norway 789 851 8 89
Source: European Commission, DG Education and Culture
Mobility outside formal education Youth learning mobility in non-formal contexts supported by EU programmes is estimated to amount to about 100 000 participants per year. A Eurobarometer survey that will be carried out in 2011 will provide more information on total non-formal learning mobility of young people.