Embed Size (px)
Citation preview
Name of the subject : CE 2024 Remote SensingTechniques and GIS VSA Educational and Charitable Trust’s Group
of Institutions, Salem – 636 010Department of Civil Engineering
Chapter Referencedetails :
Date of deliverance :Hour :Teaching Aid :
Prepared by Mr.R. yuvaraja, Assistant Professor / Civil Page 1
UNIT –IEMR AND ITS INTERACTION WITH ATMOSPHERE & EARTH MATERIALDefinition of remote sensing and its components – Electromagnetic spectrum – wavelengthregions important to remote sensing – Wave theory, Particle theory, Stefan-Boltzman andWein’s Displacement Law – Atmospheric scattering, absorption – Atmospheric windows – spectralsignature concepts – typical spectral reflective characteristics of water, vegetation and soil.
Remote Sensing
Definition:Remote sensing is the science (and to some extent, art) of acquiring information about the Earth's surfacewithout actually being in contact with it. This is done by sensing and recording reflected or emitted energyand processing, analyzing, and applying that information.
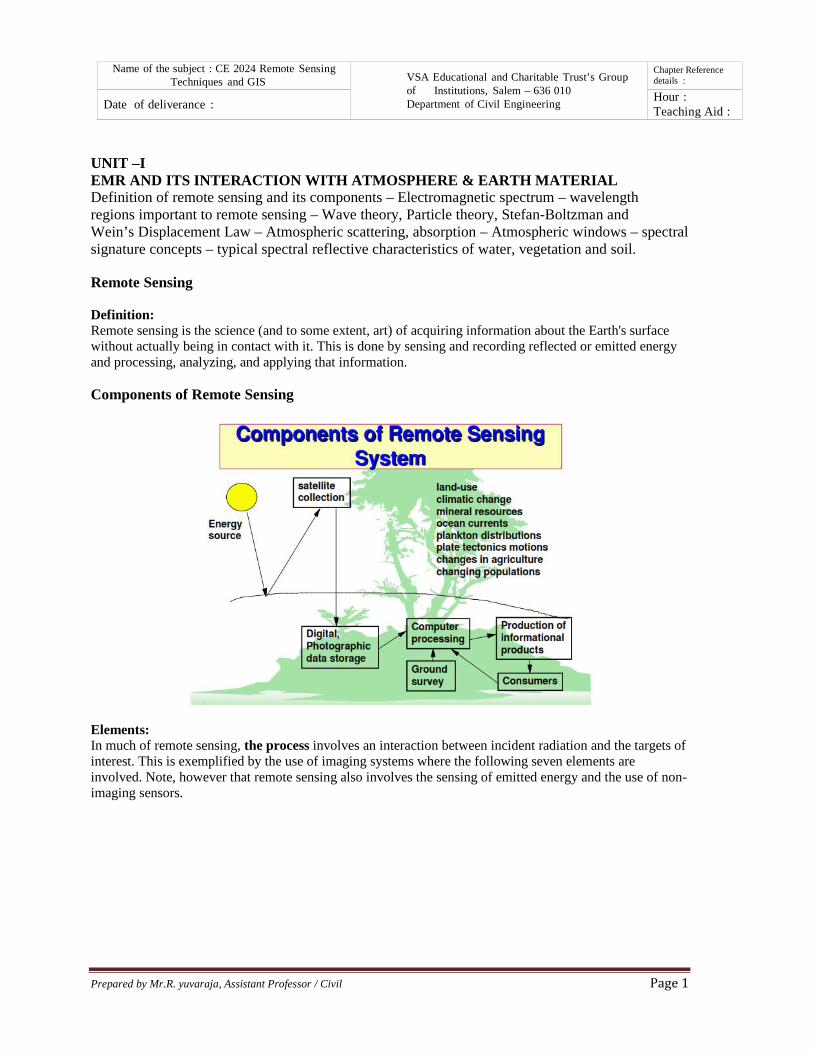
Components of Remote Sensing
Elements:In much of remote sensing, the process involves an interaction between incident radiation and the targets ofinterest. This is exemplified by the use of imaging systems where the following seven elements areinvolved. Note, however that remote sensing also involves the sensing of emitted energy and the use of non-imaging sensors.

Name of the subject : CE 2024 Remote SensingTechniques and GIS VSA Educational and Charitable Trust’s Group
of Institutions, Salem – 636 010Department of Civil Engineering
Chapter Referencedetails :
Date of deliverance :Hour :Teaching Aid :
Prepared by Mr.R. yuvaraja, Assistant Professor / Civil Page 2
1. Energy Source or Illumination (A) - the first requirement for remote sensing is to have an energysource which illuminates or provides electromagnetic energy to the target of interest.2. Radiation and the Atmosphere (B) - as the energy travels from its source to the target, it will come incontact with and interact with the atmosphere it passes through. This interaction may take place a secondtime as the energy travels from the target to the sensor.3. Interaction with the Target (C) - once the energy makes its way to the target through the atmosphere, itinteracts with the target depending on the properties of both the target and the radiation.4. Recording of Energy by the Sensor (D) - after the energy has been scattered by, or emitted from thetarget, we require a sensor (remote - not in contact with the target) to collect and record the electromagneticradiation.5. Transmission, Reception, and Processing (E) - the energy recorded by the sensor has to be transmitted,often in electronic form, to a receiving and processing station where the data are processed into an image(hardcopy and/or digital).6. Interpretation and Analysis (F) - the processed image is interpreted, visually and/or digitally orelectronically, to extract information about the target which was illuminated.7. Application (G) - the final element of the remote sensing process is achieved when we apply theinformation we have been able to extract from the imagery about the target in order to better understand it,reveal some new information, or assist in solving a particular problem.
These seven elements comprise the remote sensing process from beginning to end.
1.2 Electromagnetic RadiationAs was noted in the previous section, the first requirement for remote sensing is to have an energy source toilluminate the target (unless the sensed energy is being emitted by the target). This energy is in the form ofelectromagnetic radiation.

Name of the subject : CE 2024 Remote SensingTechniques and GIS VSA Educational and Charitable Trust’s Group
of Institutions, Salem – 636 010Department of Civil Engineering
Chapter Referencedetails :
Date of deliverance :Hour :Teaching Aid :
Prepared by Mr.R. yuvaraja, Assistant Professor / Civil Page 3
All electromagnetic radiation has fundamental properties and behaves in predictable waysaccording to the basics of wave theory. Electromagnetic radiation consists of an electricalfield (E) which varies in magnitude in a direction perpendicular to the direction in which theradiation is traveling, and a magnetic field (M) oriented at right angles to the electrical field.Both these fields travel at the speed of light (c).
Two characteristics of electromagnetic radiation are particularly important for understandingremote sensing. These are the wavelength and frequency.

Name of the subject : CE 2024 Remote SensingTechniques and GIS VSA Educational and Charitable Trust’s Group
of Institutions, Salem – 636 010Department of Civil Engineering
Chapter Referencedetails :
Date of deliverance :Hour :Teaching Aid :
Prepared by Mr.R. yuvaraja, Assistant Professor / Civil Page 4
The wavelength is the length of one wave cycle, which can be measured as the distance between successivewave crests. Wavelength is usually represented by the Greek letter lambda (λ). Wavelength is measured inmeters (m) or some factor of meters such as nanometers (nm, 10-9 meters), micrometers (µm, 10-6 meters)or centimeters (cm, 10 meters). Frequency refers to the number of cycles of a wave passing a fixed point perunit of time. Frequency is normally measured in hertz (Hz), equivalent to one cycle per second, and variousmultiples of hertz.
Wavelength and frequency are related by the following formula:
Therefore, the two are inversely related to each other. The shorter the wavelength, the higher the frequency.The longer the wavelength, the lower the frequency. Understanding the characteristics of electromagneticradiation in terms of their wavelength and frequency is crucial to understanding the information to beextracted from remote sensing data. Next we will be examining the way in which we categorizeelectromagnetic radiation for just that purpose.
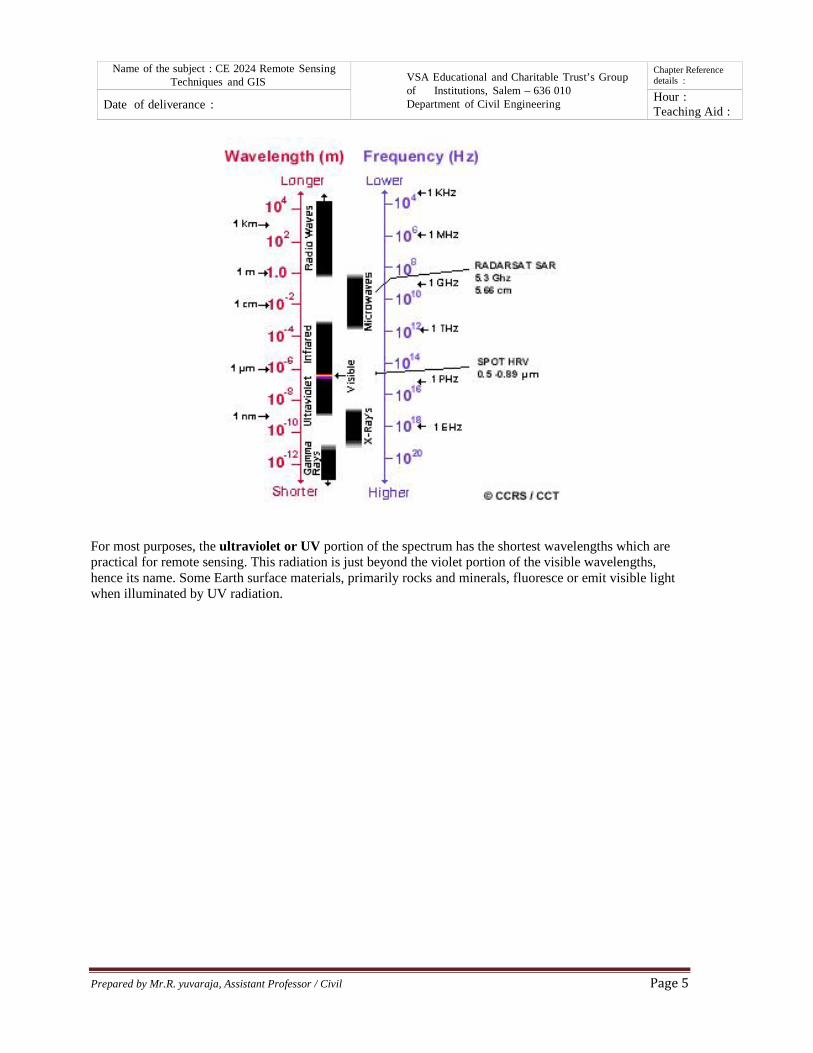
1.3 The Electromagnetic SpectrumThe electromagnetic spectrum ranges from the shorter wavelengths (including gamma and x-rays) to thelonger wavelengths (including microwaves and broadcast radio waves). There are several regions of theelectromagnetic spectrum which are useful for remote sensing.
Name of the subject : CE 2024 Remote SensingTechniques and GIS VSA Educational and Charitable Trust’s Group
of Institutions, Salem – 636 010Department of Civil Engineering
Chapter Referencedetails :
Date of deliverance :Hour :Teaching Aid :
Prepared by Mr.R. yuvaraja, Assistant Professor / Civil Page 4
The wavelength is the length of one wave cycle, which can be measured as the distance between successivewave crests. Wavelength is usually represented by the Greek letter lambda (λ). Wavelength is measured inmeters (m) or some factor of meters such as nanometers (nm, 10-9 meters), micrometers (µm, 10-6 meters)or centimeters (cm, 10 meters). Frequency refers to the number of cycles of a wave passing a fixed point perunit of time. Frequency is normally measured in hertz (Hz), equivalent to one cycle per second, and variousmultiples of hertz.
Wavelength and frequency are related by the following formula:
Therefore, the two are inversely related to each other. The shorter the wavelength, the higher the frequency.The longer the wavelength, the lower the frequency. Understanding the characteristics of electromagneticradiation in terms of their wavelength and frequency is crucial to understanding the information to beextracted from remote sensing data. Next we will be examining the way in which we categorizeelectromagnetic radiation for just that purpose.
1.3 The Electromagnetic SpectrumThe electromagnetic spectrum ranges from the shorter wavelengths (including gamma and x-rays) to thelonger wavelengths (including microwaves and broadcast radio waves). There are several regions of theelectromagnetic spectrum which are useful for remote sensing.
Name of the subject : CE 2024 Remote SensingTechniques and GIS VSA Educational and Charitable Trust’s Group
of Institutions, Salem – 636 010Department of Civil Engineering
Chapter Referencedetails :
Date of deliverance :Hour :Teaching Aid :
Prepared by Mr.R. yuvaraja, Assistant Professor / Civil Page 5
For most purposes, the ultraviolet or UV portion of the spectrum has the shortest wavelengths which arepractical for remote sensing. This radiation is just beyond the violet portion of the visible wavelengths,hence its name. Some Earth surface materials, primarily rocks and minerals, fluoresce or emit visible lightwhen illuminated by UV radiation.

Name of the subject : CE 2024 Remote SensingTechniques and GIS VSA Educational and Charitable Trust’s Group
of Institutions, Salem – 636 010Department of Civil Engineering
Chapter Referencedetails :
Date of deliverance :Hour :Teaching Aid :
Prepared by Mr.R. yuvaraja, Assistant Professor / Civil Page 6
The light which our eyes - our "remote sensors" - can detect is part of the visible spectrum. It is importantto recognize how small the visible portion is relative to the rest of the spectrum.There is a lot of radiation around us which is "invisible" to our eyes, but can be detected by other remotesensing instruments and used to our advantage. The visible wavelengths cover a range from approximately0.4 to 0.7 m. The longest visible wavelength is red and the shortest is violet. Common wavelengths ofwhat we perceive as particular colours from the visible portion of the spectrum are listed below. It isimportant to note that this is the only portion of the spectrum we can associate with the concept of colours.

Name of the subject : CE 2024 Remote SensingTechniques and GIS VSA Educational and Charitable Trust’s Group
of Institutions, Salem – 636 010Department of Civil Engineering
Chapter Referencedetails :
Date of deliverance :Hour :Teaching Aid :
Prepared by Mr.R. yuvaraja, Assistant Professor / Civil Page 7
Violet: 0.4 - 0.446 mBlue: 0.446 - 0.500 mGreen: 0.500 - 0.578 mYellow: 0.578 - 0.592 mOrange: 0.592 - 0.620 mRed: 0.620 - 0.7 m
Blue, green, and red are the primary colours or wavelengths of the visible spectrum. They are defined assuch because no single primary colour can be created from the other two, but all other colours can beformed by combining blue, green, and red in various proportions.Although we see sunlight as a uniform or homogeneous colour, it is actually composed of variouswavelengths of radiation in primarily the ultraviolet, visible and infrared portions of the spectrum. Thevisible portion of this radiation can be shown in its component colours when sunlight is passed through aprism, which bends the light in differing amounts according to wavelength.
The next portion of the spectrum of interest is the infrared (IR) region which covers the wavelength rangefrom approximately 0.7 m to 100 m - more than 100 times as wide as the visible portion! The infraredregion can be divided into two categories based on their radiation properties - the reflected IR, and the
Name of the subject : CE 2024 Remote SensingTechniques and GIS VSA Educational and Charitable Trust’s Group
of Institutions, Salem – 636 010Department of Civil Engineering
Chapter Referencedetails :
Date of deliverance :Hour :Teaching Aid :
Prepared by Mr.R. yuvaraja, Assistant Professor / Civil Page 8
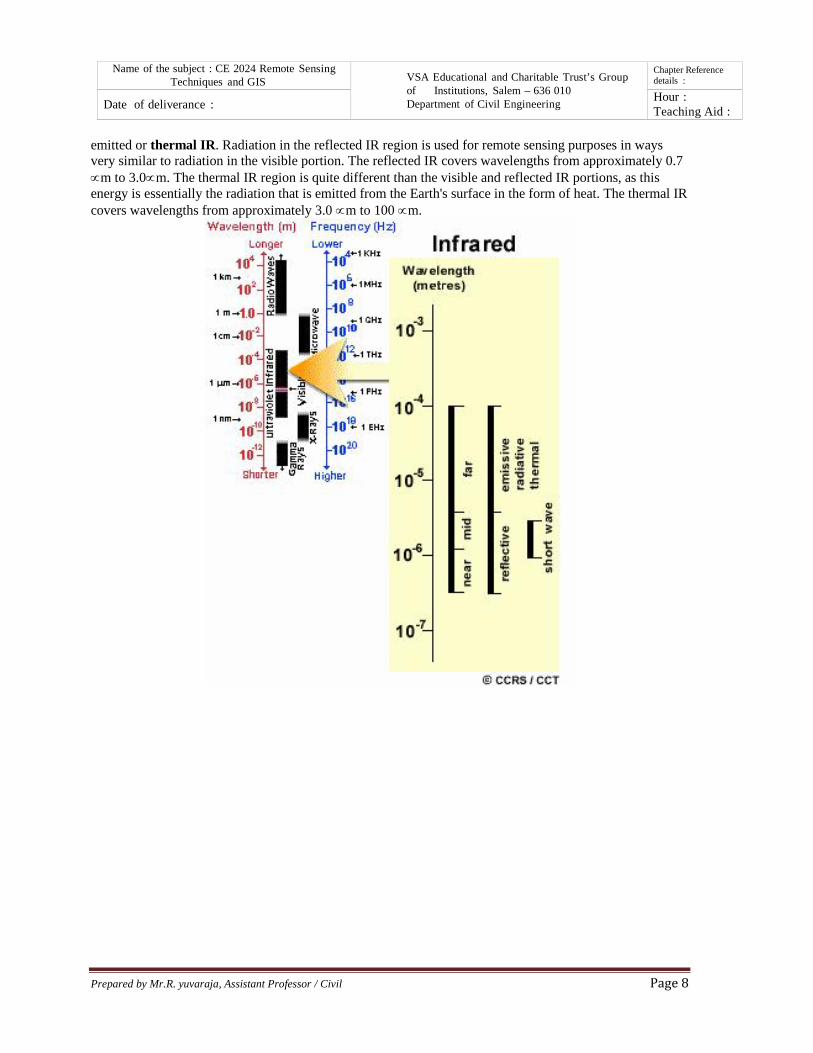
emitted or thermal IR. Radiation in the reflected IR region is used for remote sensing purposes in waysvery similar to radiation in the visible portion. The reflected IR covers wavelengths from approximately 0.7m to 3.0m. The thermal IR region is quite different than the visible and reflected IR portions, as thisenergy is essentially the radiation that is emitted from the Earth's surface in the form of heat. The thermal IRcovers wavelengths from approximately 3.0 m to 100 m.
Name of the subject : CE 2024 Remote SensingTechniques and GIS VSA Educational and Charitable Trust’s Group
of Institutions, Salem – 636 010Department of Civil Engineering
Chapter Referencedetails :
Date of deliverance :Hour :Teaching Aid :
Prepared by Mr.R. yuvaraja, Assistant Professor / Civil Page 9
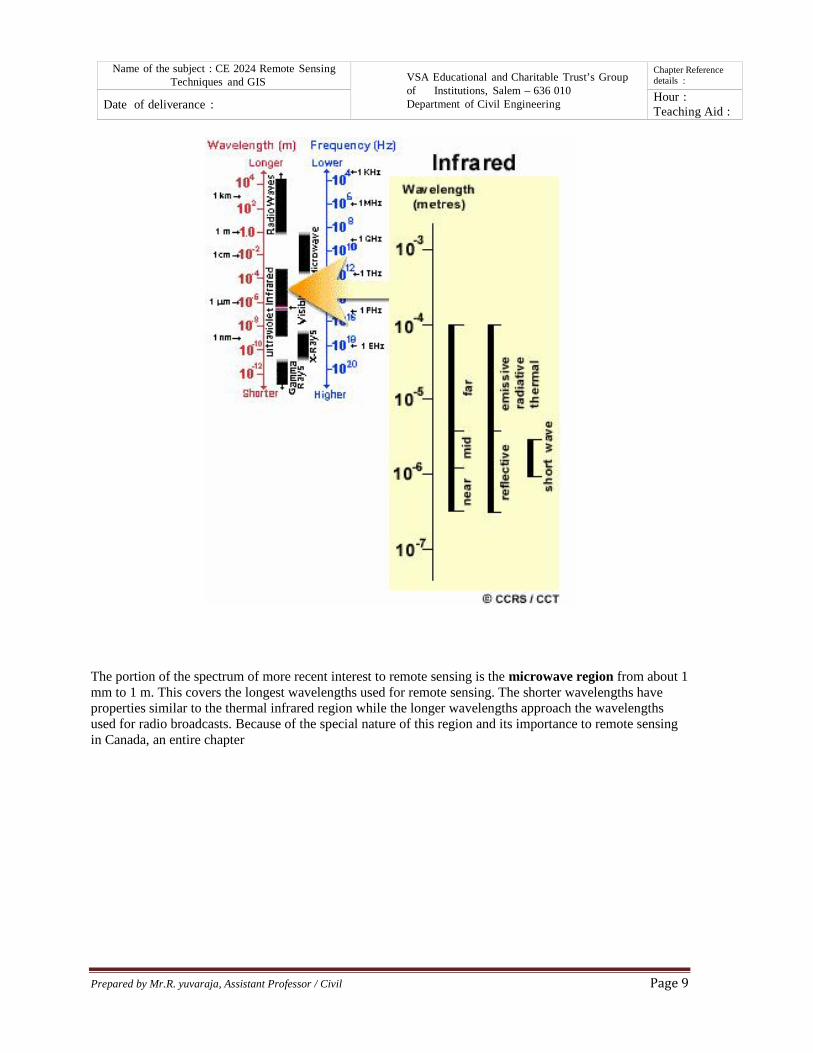
The portion of the spectrum of more recent interest to remote sensing is the microwave region from about 1mm to 1 m. This covers the longest wavelengths used for remote sensing. The shorter wavelengths haveproperties similar to the thermal infrared region while the longer wavelengths approach the wavelengthsused for radio broadcasts. Because of the special nature of this region and its importance to remote sensingin Canada, an entire chapter

Name of the subject : CE 2024 Remote SensingTechniques and GIS VSA Educational and Charitable Trust’s Group
of Institutions, Salem – 636 010Department of Civil Engineering
Chapter Referencedetails :
Date of deliverance :Hour :Teaching Aid :
Prepared by Mr.R. yuvaraja, Assistant Professor / Civil Page 10
Planck Radiation Law
The primary law governing blackbody radiation is the Planck Radiation Law, which governs the intensity ofradiation emitted by unit surface area into a fixed direction (solid angle) from the blackbody as a function ofwavelength for a fixed temperature. The Planck Law can be expressed through the following equation.

Name of the subject : CE 2024 Remote SensingTechniques and GIS VSA Educational and Charitable Trust’s Group
of Institutions, Salem – 636 010Department of Civil Engineering
Chapter Referencedetails :
Date of deliverance :Hour :Teaching Aid :
Prepared by Mr.R. yuvaraja, Assistant Professor / Civil Page 11
The behavior is illustrated in the figure shown above. The Planck Law gives a distribution that peaks at acertain wavelength, the peak shifts to shorter wavelengths for higher temperatures, and the area under thecurve grows rapidly with increasing temperature.
The Wien and Stefan-Boltzmann Laws
The behavior of blackbody radiation is described by the Planck Law, but we can derive from the PlanckLaw two other radiation laws that are very useful. The Wien Displacement Law, and the Stefan-BoltzmannLaw are illustrated in the following equations.
The Wien Law gives the wavelength of the peak of the radiation distribution, while the Stefan-BoltzmannLaw gives the total energy being emitted at all wavelengths by the blackbody (which is the area under thePlanck Law curve). Thus, the Wien Law explains the shift of the peak to shorter wavelengths as thetemperature increases, while the Stefan-Boltzmann Law explains the growth in the height of the curve as thetemperature increases. Notice that this growth is very abrupt, since it varies as the fourth power of thetemperature.
The following figure illustrates the Wien law in action for three different stars of quite different surfacetemperature. The strong shift of the spectrum to shorter wavelengths with increasing temperatures isapparent in this illustration.

Name of the subject : CE 2024 Remote SensingTechniques and GIS VSA Educational and Charitable Trust’s Group
of Institutions, Salem – 636 010Department of Civil Engineering
Chapter Referencedetails :
Date of deliverance :Hour :Teaching Aid :
Prepared by Mr.R. yuvaraja, Assistant Professor / Civil Page 12
For convenience in plotting these distributions have been normalized to unity at the respective peaks; by theStefan-Boltzmann Law, the area under the peak for the hot star Spica is in reality 2094 times the area underthe peak for the cool star Antares.
Wien's Displacement Law
When the temperature of a blackbody radiator increases, the overall radiated energy increases and the peakof the radiation curve moves to shorter wavelengths. When the maximum is evaluated from the Planckradiation formula, the product of the peak wavelength and the temperature is found to be a constant.
Calculation
This relationship is called Wien's displacement law and is useful for the determining thetemperatures of hot radiant objects such as stars, and indeed for a determination of the temperatureof any radiant object whose temperature is far above that of its surroundings.

Name of the subject : CE 2024 Remote SensingTechniques and GIS VSA Educational and Charitable Trust’s Group
of Institutions, Salem – 636 010Department of Civil Engineering
Chapter Referencedetails :
Date of deliverance :Hour :Teaching Aid :
Prepared by Mr.R. yuvaraja, Assistant Professor / Civil Page 13
It should be noted that the peak of the radiation curve in the Wien relationship is the peak onlybecause the intensity is plotted as a function of wavelength. If frequency or some other variable isused on the horizontal axis, the peak will be at a different wavelength.

Name of the subject : CE 2024 Remote SensingTechniques and GIS VSA Educational and Charitable Trust’s Group
of Institutions, Salem – 636 010Department of Civil Engineering
Chapter Referencedetails :
Date of deliverance :Hour :Teaching Aid :
Prepared by Mr.R. yuvaraja, Assistant Professor / Civil Page 14
Name of the subject : CE 2024 Remote SensingTechniques and GIS VSA Educational and Charitable Trust’s Group
of Institutions, Salem – 636 010Department of Civil Engineering
Chapter Referencedetails :
Date of deliverance :Hour :Teaching Aid :
Prepared by Mr.R. yuvaraja, Assistant Professor / Civil Page 15
ATMOSPHERIC Scattering and Absorption
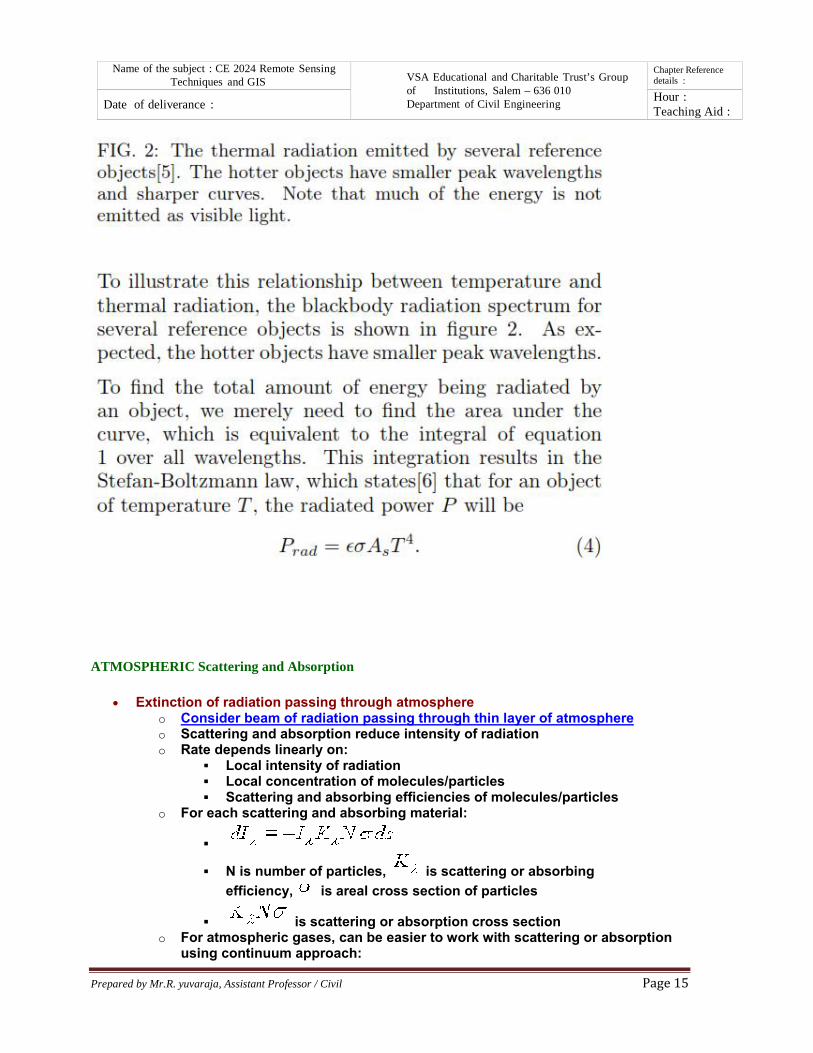
Extinction of radiation passing through atmosphereo Consider beam of radiation passing through thin layer of atmosphereo Scattering and absorption reduce intensity of radiationo Rate depends linearly on:
Local intensity of radiation Local concentration of molecules/particles Scattering and absorbing efficiencies of molecules/particles
o For each scattering and absorbing material:
N is number of particles, is scattering or absorbingefficiency, is areal cross section of particles
is scattering or absorption cross sectiono For atmospheric gases, can be easier to work with scattering or absorption
using continuum approach:

Name of the subject : CE 2024 Remote SensingTechniques and GIS VSA Educational and Charitable Trust’s Group
of Institutions, Salem – 636 010Department of Civil Engineering
Chapter Referencedetails :
Date of deliverance :Hour :Teaching Aid :
Prepared by Mr.R. yuvaraja, Assistant Professor / Civil Page 16
is density, r is mass of scattering gas per mass of air, and ismass scattering efficiency
o Absorption and scattering amounts combined determine extinction:
Scatteringo Change in direction of electromagnetic waveso Scattering efficiency and behavior depends on size of scatterers relative to
wavelengths of radiation Define size parameter as ratio of characteristic particle diameter to
wavelength
Treats particles as identical spheres
Define complex index of refraction as:
Real part is change in speed of light passing through particle Imaginary part is absorption index
Size parameter ranges widely for different common atmosphericconstituents Much less than 1 for gas molecules About 1 for haze and smoke particles Much larger than one for raindrops and ice crystals
o Rayleigh scattering by very small particles (e.g. gas molecules): x << 1 Scattering efficiency relatively low
Strong wavelength dependence: Nearly equal scattering in forward and backward direction Exercise 4.9
Estimate relative efficiencies of scattering red and blue light byair molecules
So violet and blue light scattered more effectively than red
o Mie scattering by particles similar in size to wavelengths of radiation: 0.1 <= x<= 50 Efficiency relatively high and independent of wavelength Scattering in forward direction becomes more pronounced with
increasing sizeo Large particles (e.g. raindrops, ice crystals) scatter according to laws of
geometric optics

Name of the subject : CE 2024 Remote SensingTechniques and GIS VSA Educational and Charitable Trust’s Group
of Institutions, Salem – 636 010Department of Civil Engineering
Chapter Referencedetails :
Date of deliverance :Hour :Teaching Aid :
Prepared by Mr.R. yuvaraja, Assistant Professor / Civil Page 17
Rainbows produced by scattering by raindrops Involve two refractions and one reflection Bright halos produced by forward scattering from ice crystals Hexagonal structure of crystals concentrates light at 22o and 46o
Absorptiono Radiant energy comes in discrete packets, photons
Energy in a photon inversely proportional to wavelength
h = 6.626 X 10⁻³⁴J/s (Planck's constant)
o Absorption continua High energy, short wavelength radiation Wavelengths < 0.1 micron strip electrons from atoms in -
photoionization - in the ionosphere Wavelengths < 0.24 microns breaks oxygen molecules apart -
photodissociation Wavelengths up to 0.31 microns dissociate ozone molecules All wavelengths in range absorbed, with excess energy heating
absorbers Processes remove nearly all wavelengths < 0.31 microns in upper
atmosphereo Absorption lines
Absorption of lower energy, longer wavelength radiation changes inenergy in molecules
Total molecular energy is:
Energy = electron orbit + vibrational + rotational + translational
All but translational energy are quantized Only photons with proper amount of energy to move molecule from
one state to another absorbed or emitted Creates absorption spectra of discrete lines Orbital changes require highest energy, shortest wavelengths -
ultraviolet and visible Vibrational changes require medium energy - infrared Rotational changes lowest energy, longest wavelengths - microwave Primary atmospheric gases, N2 and O2, have no vibrational absorption
bands Greenhouse gases have many vibrational modes, so absorb strongly
in infraredo Line broadening
Motion and collisions of molecules spread out theoretical absorptionlines
Molecular motions cause Doppler shifting of absorption wavelengths Pressure broadening caused by molecular collisions Pressure broadening curve has heavier tails

Name of the subject : CE 2024 Remote SensingTechniques and GIS VSA Educational and Charitable Trust’s Group
of Institutions, Salem – 636 010Department of Civil Engineering
Chapter Referencedetails :
Date of deliverance :Hour :Teaching Aid :
Prepared by Mr.R. yuvaraja, Assistant Professor / Civil Page 18

Name of the subject : CE 2024 Remote SensingTechniques and GIS VSA Educational and Charitable Trust’s Group
of Institutions, Salem – 636 010Department of Civil Engineering
Chapter Referencedetails :
Date of deliverance :Hour :Teaching Aid :
Prepared by Mr.R. yuvaraja, Assistant Professor / Civil Page 19
Atmospheric windows
Some wavelengths cannot be used in remote sensing because our atmosphere
absorbs essentially all the photons at these wavelengths that are produced by the
sun. In particular, the molecules of water, carbon dioxide, oxygen, and ozone in our
atmosphere block solar radiation. The wavelength ranges in which the atmosphere is
transparent are called atmospheric windows. Remote sensing projects must be
conducted in wavelengths that occur within atmospheric windows. Outside of these
Name of the subject : CE 2024 Remote SensingTechniques and GIS VSA Educational and Charitable Trust’s Group
of Institutions, Salem – 636 010Department of Civil Engineering
Chapter Referencedetails :
Date of deliverance :Hour :Teaching Aid :
Prepared by Mr.R. yuvaraja, Assistant Professor / Civil Page 20
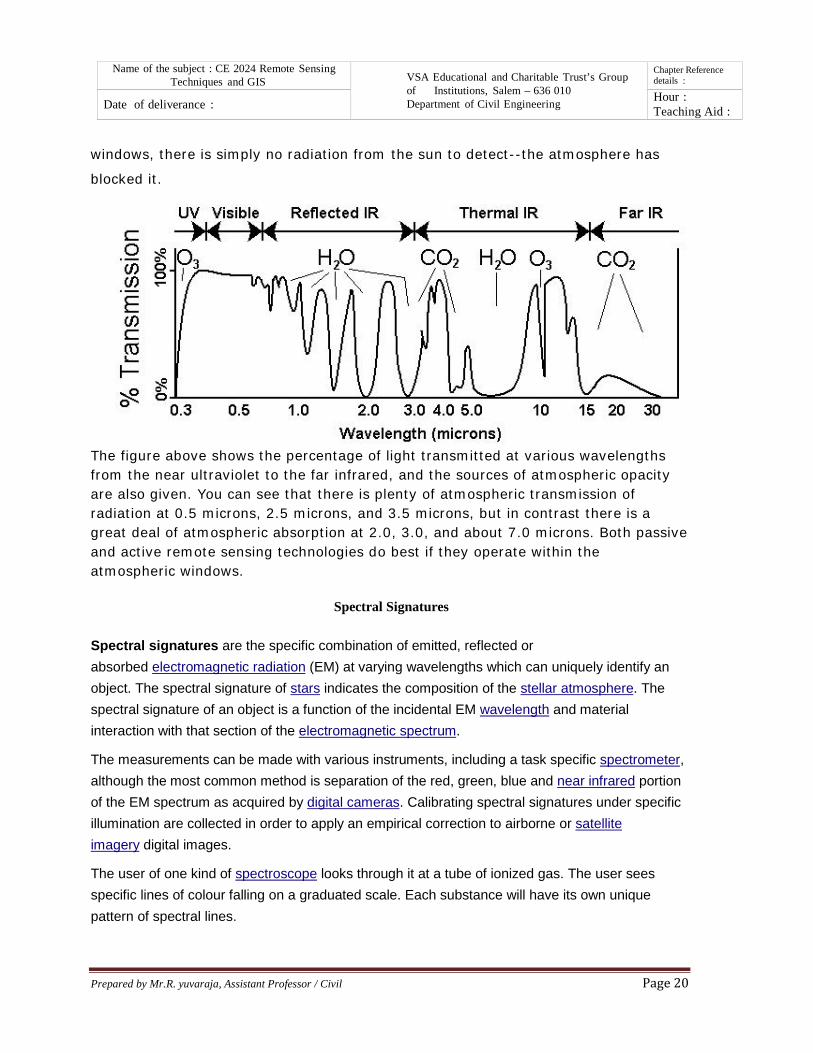
windows, there is simply no radiation from the sun to detect--the atmosphere has
blocked it.
The figure above shows the percentage of light transmitted at various wavelengthsfrom the near ultraviolet to the far infrared, and the sources of atmospheric opacityare also given. You can see that there is plenty of atmospheric transmission ofradiation at 0.5 microns, 2.5 microns, and 3.5 microns, but in contrast there is agreat deal of atmospheric absorption at 2.0, 3.0, and about 7.0 microns. Both passiveand active remote sensing technologies do best if they operate within theatmospheric windows.
Spectral Signatures
Spectral signatures are the specific combination of emitted, reflected orabsorbed electromagnetic radiation (EM) at varying wavelengths which can uniquely identify anobject. The spectral signature of stars indicates the composition of the stellar atmosphere. Thespectral signature of an object is a function of the incidental EM wavelength and materialinteraction with that section of the electromagnetic spectrum.
The measurements can be made with various instruments, including a task specific spectrometer,although the most common method is separation of the red, green, blue and near infrared portionof the EM spectrum as acquired by digital cameras. Calibrating spectral signatures under specificillumination are collected in order to apply an empirical correction to airborne or satelliteimagery digital images.
The user of one kind of spectroscope looks through it at a tube of ionized gas. The user seesspecific lines of colour falling on a graduated scale. Each substance will have its own uniquepattern of spectral lines.

Name of the subject : CE 2024 Remote SensingTechniques and GIS VSA Educational and Charitable Trust’s Group
of Institutions, Salem – 636 010Department of Civil Engineering
Chapter Referencedetails :
Date of deliverance :Hour :Teaching Aid :
Prepared by Mr.R. yuvaraja, Assistant Professor / Civil Page 21
Most remote sensing applications process digital images to extract spectral signatures at eachpixel and use them to divide the image in groups of similar pixels (segmentation) using differentapproaches. As a last step, they assign a class to each group (classification) by comparing withknown spectral signatures. Depending on pixel resolution, a pixel can represent many spectralsignature "mixed" together - that is why much remote sensing analysis is done to "unmixmixtures". Ultimately correct matching of spectral signature recorded by image pixel with spectralsignature of existing elements leads to accurate classification in remote sensing.
For any given material, the amount of solar radiation that reflects, absorbs, or transmits varies withwavelength. This important property of matter makes it possible to identify different substances orclasses and separate them by their spectral signatures (spectral curves), as shown in the figurebelow. *
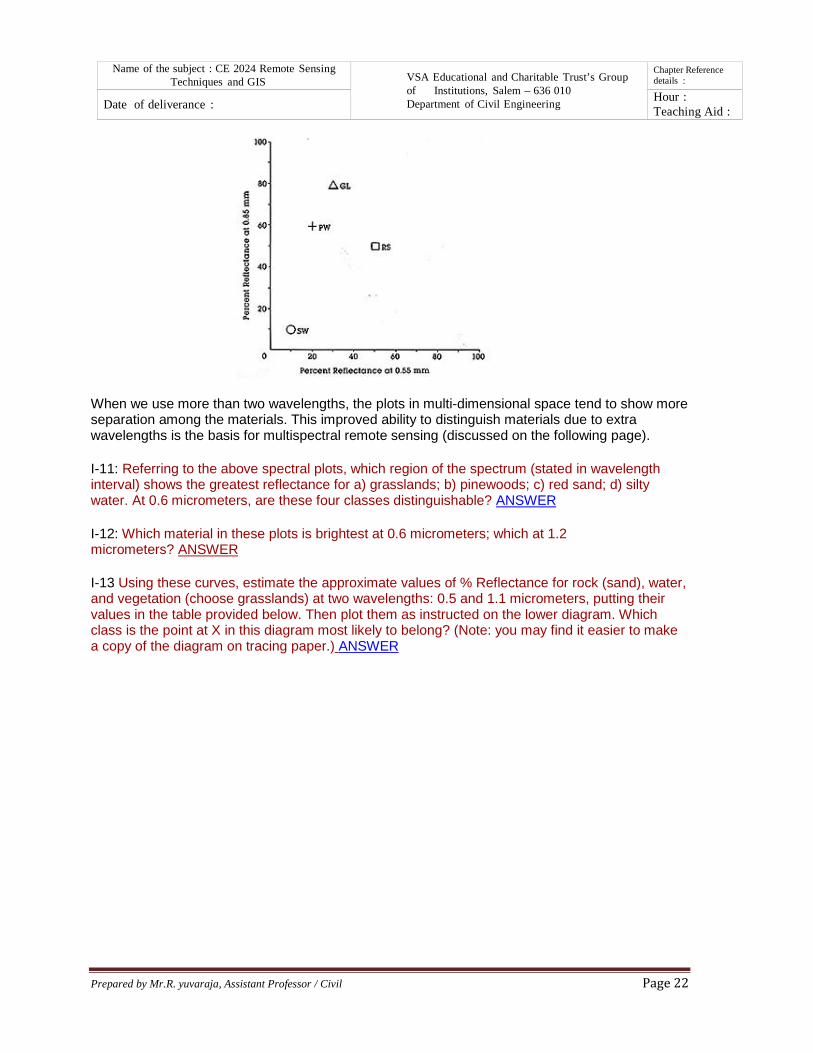
For example, at some wavelengths, sand reflects more energy than green vegetation but at otherwavelengths it absorbs more (reflects less) than does the vegetation. In principle, we canrecognize various kinds of surface materials and distinguish them from each other by thesedifferences in reflectance. Of course, there must be some suitable method for measuring thesedifferences as a function of wavelength and intensity (as a fraction of the amount of irradiatingradiation). Using reflectance differences, we can distinguish the four common surface materials(GL = grasslands; PW = pinewoods; RS = red sand; SW = silty water), shown in the next figure.Please note the positions of points for each plot as a reflectance percentage for just twowavelengths (refer to figure below).
Name of the subject : CE 2024 Remote SensingTechniques and GIS VSA Educational and Charitable Trust’s Group
of Institutions, Salem – 636 010Department of Civil Engineering
Chapter Referencedetails :
Date of deliverance :Hour :Teaching Aid :
Prepared by Mr.R. yuvaraja, Assistant Professor / Civil Page 22
When we use more than two wavelengths, the plots in multi-dimensional space tend to show moreseparation among the materials. This improved ability to distinguish materials due to extrawavelengths is the basis for multispectral remote sensing (discussed on the following page).
I-11: Referring to the above spectral plots, which region of the spectrum (stated in wavelengthinterval) shows the greatest reflectance for a) grasslands; b) pinewoods; c) red sand; d) siltywater. At 0.6 micrometers, are these four classes distinguishable? ANSWER
I-12: Which material in these plots is brightest at 0.6 micrometers; which at 1.2micrometers? ANSWER
I-13 Using these curves, estimate the approximate values of % Reflectance for rock (sand), water,and vegetation (choose grasslands) at two wavelengths: 0.5 and 1.1 micrometers, putting theirvalues in the table provided below. Then plot them as instructed on the lower diagram. Whichclass is the point at X in this diagram most likely to belong? (Note: you may find it easier to makea copy of the diagram on tracing paper.) ANSWER

Name of the subject : CE 2024 Remote SensingTechniques and GIS VSA Educational and Charitable Trust’s Group
of Institutions, Salem – 636 010Department of Civil Engineering
Chapter Referencedetails :
Date of deliverance :Hour :Teaching Aid :
Prepared by Mr.R. yuvaraja, Assistant Professor / Civil Page 23
Spectral signature in remote sensing
Features on the Earth reflect, absorb, transmit, and emit electromagnetic energy from the sun.
Special digital sensors have been developed to measure all types of electromagnetic energy as it
interacts with objects in all of the ways listed above. The ability of sensors to measure these
interactions allows us to use remote sensing to measure features and changes on the Earth and
in our atmosphere. A measurement of energy commonly used in remote sensing of the Earth is
reflected energy (e.g., visible light, near-infrared, etc.) coming from land and water surfaces. The
amount of energy reflected from these surfaces is usually expressed as a percentage of the
amount of energy striking the objects. Reflectance is 100% if all of the light striking and object
bounces off and is detected by the sensor. If none of the light returns from the surface, reflectance
is said to be 0%. In most cases, the reflectance value of each object for each area of the
electromagnetic spectrum is somewhere between these two extremes. Across any range of
wavelengths, the percent reflectance values for landscape features such as water, sand, roads,
forests, etc. can be plotted and compared. Such plots are called “spectral response curves” or
“spectral signatures.” Differences among spectral signatures are used to help classify remotely
sensed images into classes of landscape features since the spectral signatures of like features
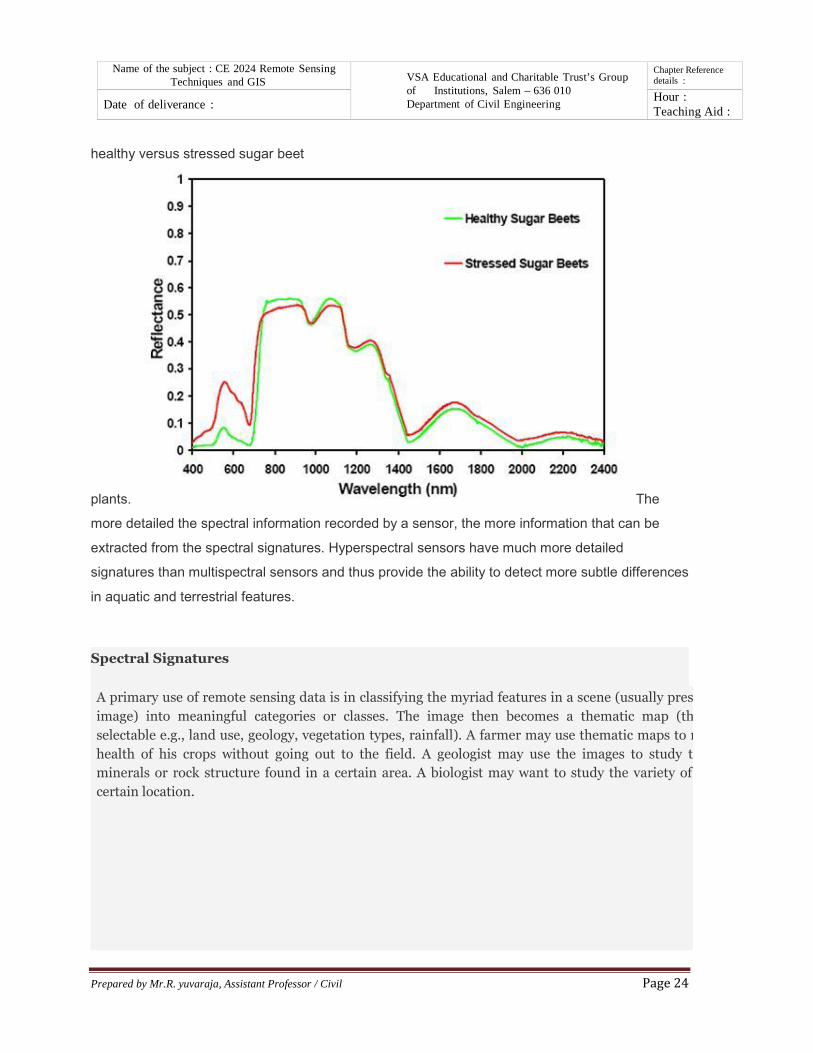
have similar shapes. The figure below shows differences in the spectral response curves for
Name of the subject : CE 2024 Remote SensingTechniques and GIS VSA Educational and Charitable Trust’s Group
of Institutions, Salem – 636 010Department of Civil Engineering
Chapter Referencedetails :
Date of deliverance :Hour :Teaching Aid :
Prepared by Mr.R. yuvaraja, Assistant Professor / Civil Page 24
healthy versus stressed sugar beet
plants. The
more detailed the spectral information recorded by a sensor, the more information that can be
extracted from the spectral signatures. Hyperspectral sensors have much more detailed
signatures than multispectral sensors and thus provide the ability to detect more subtle differences
in aquatic and terrestrial features.
Spectral Signatures
A primary use of remote sensing data is in classifying the myriad features in a scene (usually presented as animage) into meaningful categories or classes. The image then becomes a thematic map (the theme isselectable e.g., land use, geology, vegetation types, rainfall). A farmer may use thematic maps to monitor thehealth of his crops without going out to the field. A geologist may use the images to study the types ofminerals or rock structure found in a certain area. A biologist may want to study the variety of plants in acertain location.

Name of the subject : CE 2024 Remote SensingTechniques and GIS VSA Educational and Charitable Trust’s Group
of Institutions, Salem – 636 010Department of Civil Engineering
Chapter Referencedetails :
Date of deliverance :Hour :Teaching Aid :
Prepared by Mr.R. yuvaraja, Assistant Professor / Civil Page 25
For example, at certain wavelengths, sand reflects more energy than green vegetation while at otherwavelengths it absorbs more (reflects less) energy. Therefore, in principle, various kinds of surfacematerials can be distinguished from each other by these differences in reflectance. Of course, theremust be some suitable method for measuring these differences as a function of wavelength and intensity(as a fraction of the amount of radiation reaching the surface). Using reflectance differences, the fourmost common surface materials (GL = grasslands; PW = pinewoods; RS = red sand; SW = silty water)can be easily distinguished, as shown in the next figure.When more than two wavelengths are used, the resulting images tend to show more separation among theobjects. Imagine looking at different objects through red lenses, or only blue or green lenses. In a similarmanner, certain satellite sensors can record reflected energy in the red, green, blue, or infrared bands of thespectrum, a process called multispectral remote sensing. The improved ability of multispectral sensorsprovides a basic remote sensing data resource for quantitative thematic information, such as the type of landcover. Resource managers use information from multispectral data to monitor fragile lands and other naturalresources, including vegetated areas, wetlands, and forests. These data provide unique identificationcharacteristics leading to a quantitative assessment of the Earth's features.
Electromagnetic Spectrum• Energy transfer from one body to another in theform of electromagnetic waves• A fundamental characteristic of radiation is thewavelength ( ) of propagation

Name of the subject : CE 2024 Remote SensingTechniques and GIS VSA Educational and Charitable Trust’s Group
of Institutions, Salem – 636 010Department of Civil Engineering
Chapter Referencedetails :
Date of deliverance :Hour :Teaching Aid :
Prepared by Mr.R. yuvaraja, Assistant Professor / Civil Page 26

Name of the subject : CE 2024 Remote SensingTechniques and GIS VSA Educational and Charitable Trust’s Group
of Institutions, Salem – 636 010Department of Civil Engineering
Chapter Referencedetails :
Date of deliverance :Hour :Teaching Aid :
Prepared by Mr.R. yuvaraja, Assistant Professor / Civil Page 27
Name of the subject : CE 2024 Remote SensingTechniques and GIS VSA Educational and Charitable Trust’s Group
of Institutions, Salem – 636 010Department of Civil Engineering
Chapter Referencedetails :
Date of deliverance :Hour :Teaching Aid :
Prepared by Mr.R. yuvaraja, Assistant Professor / Civil Page 28

Name of the subject : CE 2024 Remote SensingTechniques and GIS VSA Educational and Charitable Trust’s Group
of Institutions, Salem – 636 010Department of Civil Engineering
Chapter Referencedetails :
Date of deliverance :Hour :Teaching Aid :
Prepared by Mr.R. yuvaraja, Assistant Professor / Civil Page 29