Embed Size (px)
Citation preview

EMQQEXCHANGE TRADED CONCEPTS TRUST
EMQQ The Emerging Markets Internet & Ecommerce ETF
Annual Report
August 31, 2018

1
EMQQ The Emerging Markets Internet & Ecommerce ETF
Table of Contents
Management Discussion of Fund Performance . . . . . . . . . . . . . . . . . . . . . . . . . . . . . . . . . . . . . . . . . . . . . . . . . . . . . . . . . . . . 2
Schedule of Investments . . . . . . . . . . . . . . . . . . . . . . . . . . . . . . . . . . . . . . . . . . . . . . . . . . . . . . . . . . . . . . . . . . . . . . . . . . . . . . . . 5
Statement of Assets and Liabilities . . . . . . . . . . . . . . . . . . . . . . . . . . . . . . . . . . . . . . . . . . . . . . . . . . . . . . . . . . . . . . . . . . . . . . . 7
Statement of Operations . . . . . . . . . . . . . . . . . . . . . . . . . . . . . . . . . . . . . . . . . . . . . . . . . . . . . . . . . . . . . . . . . . . . . . . . . . . . . . . . 8
Statements of Changes in Net Assets . . . . . . . . . . . . . . . . . . . . . . . . . . . . . . . . . . . . . . . . . . . . . . . . . . . . . . . . . . . . . . . . . . . . . 9
Financial Highlights . . . . . . . . . . . . . . . . . . . . . . . . . . . . . . . . . . . . . . . . . . . . . . . . . . . . . . . . . . . . . . . . . . . . . . . . . . . . . . . . . . . . 10
Notes to the Financial Statements . . . . . . . . . . . . . . . . . . . . . . . . . . . . . . . . . . . . . . . . . . . . . . . . . . . . . . . . . . . . . . . . . . . . . . . 11
Report of Independent Registered Public Accounting Firm . . . . . . . . . . . . . . . . . . . . . . . . . . . . . . . . . . . . . . . . . . . . . . . . . 20
Trustees and Officers of the Trust . . . . . . . . . . . . . . . . . . . . . . . . . . . . . . . . . . . . . . . . . . . . . . . . . . . . . . . . . . . . . . . . . . . . . . . . 21
Disclosure of Fund Expenses . . . . . . . . . . . . . . . . . . . . . . . . . . . . . . . . . . . . . . . . . . . . . . . . . . . . . . . . . . . . . . . . . . . . . . . . . . . . 24
Approval of Advisory Agreements . . . . . . . . . . . . . . . . . . . . . . . . . . . . . . . . . . . . . . . . . . . . . . . . . . . . . . . . . . . . . . . . . . . . . . . . 25
Notice to Shareholders . . . . . . . . . . . . . . . . . . . . . . . . . . . . . . . . . . . . . . . . . . . . . . . . . . . . . . . . . . . . . . . . . . . . . . . . . . . . . . . . . 28
Supplemental Information . . . . . . . . . . . . . . . . . . . . . . . . . . . . . . . . . . . . . . . . . . . . . . . . . . . . . . . . . . . . . . . . . . . . . . . . . . . . . . 29
The Fund will file its complete schedule of Fund holdings with the U.S. Securities and Exchange Commission (the
“Commission”) for the first and third quarters of each fiscal year on Form N-Q within sixty days aft er the end of the period.
The Fund’s Forms N-Q are available on the Commission’s website at http://www.sec.gov .
A description of the policies and procedures that Exchange Traded Concepts Trust uses to determine how to vote proxies
relating to Fund securities, as well as information relating to how the Fund voted proxies relating to Fund securities during
the most recent period ended June 30, is available (i) without charge, upon request, by calling 1-855-888-9892; and (ii) on
the Commission’s website at http://www.sec.gov.

2
EMQQ The Emerging Markets Internet & Ecommerce ETF
Management Discussion of Fund Performance (Unaudited)
EMQQ The Emerging Markets Internet & Ecommerce ETF
Dear Shareholders,
On behalf of the entire team, we want to express our appreciation for the confidence you have placed in EMQQ The Emerging
Markets Internet & Ecommerce ETF (“EMQQ” or the “Fund”). The following information pertains to the last fiscal period of
August 31, 2017 through August 31, 2018.
The Fund saw negative performance during the fiscal period ending on August 31, 2018. The market price for EMQQ fell
6.30% and the NAV fell 6.05%, while the S&P 500, a broad market index, returned 19.66% over the same period. The Fund’s
Index, EMQQ The Emerging Markets Internet & Ecommerce Index™, fell 5.19%. Meanwhile, outstanding shares rose to
11,550,000.
For the period, the largest positive contributor to return was Mercadolibre (MELI US), adding 1.13% to the return of the
Fund, gaining 32.61% with an average weighting of 4.79%. The second largest contributor to return was 58.com Inc ADR
(WUBA US), adding 0.84% to the return of the Fund, gaining 21.48% with an average weighting of 3.55%. The third largest
contributor to return was Kingdee International Soft ware (268 HK), adding 0.78% to the return of the Fund, gaining 168.24%
with an average weighting of 0.93%.
For the period, the largest negative contributor to return was JD.com ADR (JD US), detracting 1.88% from the return of the
Fund, declining 25.32% with an average weighting of 5.70%. The security contributing second-most negatively was Netease
ADR (NTES US), detracting 1.67% from the return of the Fund, and declining 27.79% with an average weighting of 5.06%.
The third largest negative contributor to return was CTRIP.com ADR (CTRP US), detracting 1.39% from the return of the
Fund, and declining 23.91% with an average weight of 4.34%.
For the period, the best performing security in the Fund was Kingdee International Soft ware (268 HK) gaining 168.24%
and contributing 0.78% to the return of the Fund. The second-best performing security for the period was Baozun ADR
(BZUN US), gaining 96.36% and contributing 0.27% to the return of the Fund. The third-best performing security was
21 Vianet Group ADR (VNET US), gaining 87.86% for the period and contributing 0.18% to the return of the Fund.
For the period, the worst performing security in the Fund was Link Motion ADR (LKM US), declining 67.27% and reducing
the return of the Fund by 0.09%. The second-worst performing security in the Fund was Meitu Inc (1357 HK), declining
64.86% and reducing the return of the Fund by 0.97%. The third-worst performing security in the Fund was Sohu.com ADR
(SOHU US), declining 59.97% and reducing the return of the Fund by 0.46%.
There is much ahead for the internet and ecommerce sectors of the developing world and we are thankful that you have
joined us. As technology-related companies begin entering the market through high profile acquisitions, we believe the
awareness of and opportunities for our Fund should only increase. We look forward to keeping you well informed as things
progress.
Sincerely,
Garrett Stevens, Chief Executive Off icer
Exchange Traded Concepts, Advisor to the Fund

3
The EMQQ The Emerging Markets Internet & Ecommerce IndexTM (the “Index”) is designed to measure the performance of an investable universe of publicly-traded, emerging market internet and ecommerce companies. The Index covers over 40 companies operating in emerging and frontier markets including China, India, Brazil, Russia, South Korea, Taiwan, South Africa, Mexico, Argentina, Malaysia, Thailand, Indonesia, Vietnam, Philippines, Turkey, Czech Republic, Poland and Colombia.
The S&P 500 Index is a market-value weighted index consisting of 500 stocks chosen for market size, liquidity, and industry group representation, with each stock’s weight in the index proportionate to its market value.
This material represents an assessment of the market environment at a specific point in time and is not intended to be a forecast of future events, or a guarantee of future results. This information should not be relied upon by the reader as research or investment advice.
Growth of a $10,000 Investment‡
(at Net Asset Value)‡
AVERAGE ANNUAL TOTAL RETURN
FOR THE YEAR ENDED AUGUST 31, 2018
One Year Return Three Year Return
Annualized
Inception to Date*
Net Asset
Value
Market
Price
Net Asset
Value
Market
Price
Net Asset
Value
Market
Price
EMQQ The Emerging Markets Internet &
Ecommerce ETF . . . . . . . . . . . . . . . . . . . . . . . . . . . . (6.05)% (6.30)% 19.12% 18.93% 7.01% 6.98%EMQQ The Emerging Markets Internet &
Ecommerce IndexTM . . . . . . . . . . . . . . . . . . . . . . . . . (5.19)% (5.19)% 20.40% 20.40% 8.03% 8.03%S&P 500 Index . . . . . . . . . . . . . . . . . . . . . . . . . . . . . . . . 19.66% 19.66% 16.11% 16.11% 12.02% 12.02%
$17,000
$16,000
$15,000
$14,000
$13,000
$12,000
$11,000
$10,000
$9,000
$8,000
$7,00011/12/14 Aug 15 Aug 16 Aug 17
EMQQ The Emerging Markets Internet & Ecommerce ETF *
S&P 500 IndexEMQQ The Emerging Markets Internet & Ecommerce IndexTM
Aug 18
$12,937$13,415
$15,400
*Fund commenced operations on November 12, 2014.‡Unaudited
EMQQ The Emerging Markets Internet & Ecommerce ETF
Management Discussion of Fund Performance (Unaudited) (Continued)

4
The performance data quoted herein represents past performance and the return and value of an investment in the Fund will fluctuate so that shares, when redeemed or sold in the market, may be worth more or less than their original cost. Past performance is no guarantee of future performance and should not be considered as a representation of the future results of the Fund. The Fund’s performance assumes the reinvestment of all dividends and all capital gains. Index returns assume reinvestment of dividends and, unlike the Fund’s returns, do not reflect any fees or expenses. If such fees and expenses were included in the index returns, the performance would have been lower. Please note that one cannot invest directly in an unmanaged index.
Investors should consider the investment objectives, risks, charges and expenses of the Fund carefully before investing. A prospectus, containing this and other information, is available at www.emqqetf.com. Investors should read the prospectus carefully before investing. There are risks associated with investing, including possible loss of principal.
Current performance may be lower or higher than the performance data shown above.
Performance data current to the most recent month-end is available at www.emqqetf.com.
There are no assurances that the Fund will meet its stated objectives.
The Fund’s holdings and allocations are subject to change and should not be considered recommendations to buy individual securities.
Returns shown do not reflect the deduction of taxes that a shareholder would pay on Fund distributions or the redemption of Fund shares.
See definition of comparative index in Management Discussion of Fund Performance.
EMQQ The Emerging Markets Internet & Ecommerce ETF
Management Discussion of Fund Performance (Unaudited) (Concluded)

The accompanying notes are an integral part of the financial statements.
5
73.3% Information Technology
22.5% Consumer Discretionary
3.5% Financials
0.7% Industrials
†
Sector Weightings (Unaudited)†
Percentages based on total investments.
Description Shares Fair Value
COMMON STOCK — 99.2%
Argentina — 6.1%
Consumer Discretionary — 0.2%Despegar.com* . . . . . . . . . . . . . . . . . 49,995 $ 842,916
Information Technology — 5.9%MercadoLibre . . . . . . . . . . . . . . . . . . 65,686 22,491,543
Total Argentina . . . . . . . . . . . . . . . . . . . . . 23,334,459
Brazil — 1.2% . . . . . . . . . . . . . . . . . . . . . .
Consumer Discretionary — 1.2%B2W Cia Digital* . . . . . . . . . . . . . . . . 302,131 1,930,805
CVC Brasil Operadora e Agencia de Viagens . . . . . . . . . . . . . . . . . . . 255,100 2,619,665
Total Brazil . . . . . . . . . . . . . . . . . . . . . . . . . 4,550,470
China — 49.7%
Consumer Discretionary — 12.0%Cogobuy Group . . . . . . . . . . . . . . . . . 1,022,000 388,024
Ctrip.com International ADR* . . . . 466,592 18,267,077
JD.com ADR* . . . . . . . . . . . . . . . . . . . 724,024 22,661,951
Secoo Holding ADR* . . . . . . . . . . . . 61,766 806,046
Vipshop Holdings ADR* . . . . . . . . . . 534,349 3,729,756
45,852,854
Financials — 2.2%LexinFintech Holdings ADR* . . . . . 176,197 2,089,696
PPDAI Group ADR* . . . . . . . . . . . . . . 280,728 1,824,732
Qudian ADR* . . . . . . . . . . . . . . . . . . . 464,821 2,765,685
Yirendai ADR . . . . . . . . . . . . . . . . . . . 99,573 1,805,259
8,485,372
Industrials — 0.7%51job ADR* . . . . . . . . . . . . . . . . . . . . . 36,138 2,793,829
Information Technology — 34.8%21Vianet Group ADR* . . . . . . . . . . . . 123,939 1,208,405
58.com ADR* . . . . . . . . . . . . . . . . . . . 150,642 11,460,843
Alibaba Group Holding ADR* . . . . . 160,785 28,138,983
Autohome ADR . . . . . . . . . . . . . . . . . 143,206 11,830,248
Baidu ADR* . . . . . . . . . . . . . . . . . . . . 113,752 25,762,553
Baozun ADR* . . . . . . . . . . . . . . . . . . . 29,359 1,567,477
Bitauto Holdings ADR* . . . . . . . . . . 76,338 1,809,974
Changyou.com ADR . . . . . . . . . . . . . 29,902 403,378
Description Shares Fair Value
Cheetah Mobile ADR* . . . . . . . . . . . 62,532 $ 625,320
Fang Holdings ADR* . . . . . . . . . . . . . 517,076 1,587,423
Momo ADR* . . . . . . . . . . . . . . . . . . . . 246,013 11,387,942
NetEase ADR . . . . . . . . . . . . . . . . . . . 88,235 17,444,942
SINA* . . . . . . . . . . . . . . . . . . . . . . . . . . 109,942 7,801,484
Sogou ADR* . . . . . . . . . . . . . . . . . . . . 162,224 1,335,103
Sohu.com ADR* . . . . . . . . . . . . . . . . 53,036 1,132,319
Tian Ge Interactive Holdings . . . . . 857,000 568,866
Weibo ADR* . . . . . . . . . . . . . . . . . . . . 50,627 3,885,116
YY ADR* . . . . . . . . . . . . . . . . . . . . . . . . 60,236 4,603,837
132,554,213
Total China . . . . . . . . . . . . . . . . . . . . . . . . . 189,686,268
Germany — 3.5%
Information Technology — 3.5%Delivery Hero* (A) . . . . . . . . . . . . . . . 175,979 9,717,461
Rocket Internet* . . . . . . . . . . . . . . . . 105,347 3,650,153
Total Germany . . . . . . . . . . . . . . . . . . . . . 13,367,614
Hong Kong — 11.7%
Consumer Discretionary — 0.7%China Literature* . . . . . . . . . . . . . . . 376,000 2,644,345
Financials — 1.3%Chong Sing Holdings FinTech Gr* . . 28,420,000 1,991,489
ZhongAn Online P&C Insurance, Cl H* . . . . . . . . . . . . . . . . . . . . . . . . 697,400 2,989,911
4,981,400
Information Technology — 9.7%HC Group . . . . . . . . . . . . . . . . . . . . . . 950,197 667,047
Kingdee International Software Group . . . . . . . . . . . . . . . . . . . . . . . 4,354,000 4,959,263
Meitu* (A) . . . . . . . . . . . . . . . . . . . . . . 3,620,500 1,960,418
NetDragon Websoft . . . . . . . . . . . . . 280,500 587,525
Tencent Holdings . . . . . . . . . . . . . . . 667,492 28,914,533
37,088,786
Total Hong Kong . . . . . . . . . . . . . . . . . . . . 44,714,531
India — 1.7%
Consumer Discretionary — 1.0%Infibeam Avenues . . . . . . . . . . . . . . . 221,352 712,184
MakeMyTrip* . . . . . . . . . . . . . . . . . . . 96,267 3,046,850
3,759,034
Information Technology — 0.7%Info Edge India . . . . . . . . . . . . . . . . . 111,930 2,584,958
Total India . . . . . . . . . . . . . . . . . . . . . . . . . 6,343,992
Russia — 6.0%
Information Technology — 6.0%Mail.Ru Group GDR* . . . . . . . . . . . . . 307,609 6,613,594
QIWI ADR* . . . . . . . . . . . . . . . . . . . . . 60,710 862,082
Yandex, Cl A* . . . . . . . . . . . . . . . . . . . 482,153 15,491,576
Total Russia . . . . . . . . . . . . . . . . . . . . . . . . 22,967,252
South Africa — 7.3%
Consumer Discretionary — 7.3%Naspers, Cl N . . . . . . . . . . . . . . . . . . . 124,378 $ 27,723,910
Total South Africa . . . . . . . . . . . . . . . . . . 27,723,910
EMQQ The Emerging Markets Internet & Ecommerce ETF
Schedule of InvestmentsAugust 31, 2018

The accompanying notes are an integral part of the financial statements.
6
EMQQ The Emerging Markets Internet & Ecommerce ETF
Schedule of InvestmentsAugust 31, 2018 (Concluded)
Description Shares Fair Value
South Korea — 11.0%
Information Technology — 11.0%AfreecaTV . . . . . . . . . . . . . . . . . . . . . . 13,813 $ 467,817
Cafe24* . . . . . . . . . . . . . . . . . . . . . . . . 9,635 1,400,479
Com2uSCorp . . . . . . . . . . . . . . . . . . . 15,152 2,122,083
Kakao . . . . . . . . . . . . . . . . . . . . . . . . . 70,479 7,914,364
NAVER . . . . . . . . . . . . . . . . . . . . . . . . . 30,780 20,793,747
NCSoft . . . . . . . . . . . . . . . . . . . . . . . . . 24,577 8,555,530
NHN Entertainment* . . . . . . . . . . . . 17,422 943,760
Total South Korea . . . . . . . . . . . . . . . . . . 42,197,780
Taiwan — 0.2%
Information Technology — 0.2%PChome Online . . . . . . . . . . . . . . . . . 150,058 693,740
Total Taiwan . . . . . . . . . . . . . . . . . . . . . . . 693,740
Thailand — 0.8%
Information Technology — 0.8%Sea ADR* . . . . . . . . . . . . . . . . . . . . . . 210,877 3,004,997
Total Thailand . . . . . . . . . . . . . . . . . . . . . . 3,004,997
Total Common Stock
(Cost $399,342,238) . . . . . . . . . . . . . . . 378,585,013
Total Investments in Securities — 99.2%
(Cost $399,342,238) . . . . . . . . . . . . . . . $ 378,585,013
Percentages are based on Net Assets of $381,699,925.
* Non-income producing security.(A) Securities sold within terms of a private placement memorandum,
exempt from registration under Section 144A of the Securities Act of 1933, as amended, and may be sold only to dealers in that program or other “accredited investors.” The total value of these securities at August 31, 2018 was $11,677,879 and represents 3.1% of Net Assets.
ADR — American Depositary ReceiptCl — ClassGDR — Global Depositary Receipt
As of August 31, 2018, all of the Fund’s investments were considered
Level 1, in accordance with the authoritative guidance under U.S. GAAP.
For the year ended August 31, 2018, there have been no transfers between
Level 1, Level 2 or Level 3 investments. It is the Fund’s policy to recognize
transfers into and out of Level 1, Level 2 and Level 3 at the end of the
reporting period.
For the year ended August 31, 2018, there were no Level 3 investments.

The accompanying notes are an integral part of the financial statements.
7
Assets:
Investments at Cost . . . . . . . . . . . . . . . . . . . . . . . . . . . . . . . . . . . . . . . . . . . . . . . . . . . . . . . . . . . . . . . . . . . . . . . . . . . . . . . . . . . . . . . . . . . . . . . . . . $ 399,342,238
Investments at Fair Value . . . . . . . . . . . . . . . . . . . . . . . . . . . . . . . . . . . . . . . . . . . . . . . . . . . . . . . . . . . . . . . . . . . . . . . . . . . . . . . . . . . . . . . . . . . . . $ 378,585,013
Cash and Cash Equivalents . . . . . . . . . . . . . . . . . . . . . . . . . . . . . . . . . . . . . . . . . . . . . . . . . . . . . . . . . . . . . . . . . . . . . . . . . . . . . . . . . . . . . . . . . . . 561,716
Receivable for Investment Securities Sold . . . . . . . . . . . . . . . . . . . . . . . . . . . . . . . . . . . . . . . . . . . . . . . . . . . . . . . . . . . . . . . . . . . . . . . . . . . . . . 2,930,761
Total Assets . . . . . . . . . . . . . . . . . . . . . . . . . . . . . . . . . . . . . . . . . . . . . . . . . . . . . . . . . . . . . . . . . . . . . . . . . . . . . . . . . . . . . . . . . . . . . . . . . . . . . . . . 382,077,490
Liabilities:
Payable for Foreign Currency Due to Custodian (Proceeds $109) . . . . . . . . . . . . . . . . . . . . . . . . . . . . . . . . . . . . . . . . . . . . . . . . . . . . . . . . . . 90
Advisory Fees Payable . . . . . . . . . . . . . . . . . . . . . . . . . . . . . . . . . . . . . . . . . . . . . . . . . . . . . . . . . . . . . . . . . . . . . . . . . . . . . . . . . . . . . . . . . . . . . . . . 291,508
Deferred Foreign Capital Gains Tax on Appreciated Securities . . . . . . . . . . . . . . . . . . . . . . . . . . . . . . . . . . . . . . . . . . . . . . . . . . . . . . . . . . . . 85,967
Total Liabilities . . . . . . . . . . . . . . . . . . . . . . . . . . . . . . . . . . . . . . . . . . . . . . . . . . . . . . . . . . . . . . . . . . . . . . . . . . . . . . . . . . . . . . . . . . . . . . . . . . . . . 377,565
Net Assets . . . . . . . . . . . . . . . . . . . . . . . . . . . . . . . . . . . . . . . . . . . . . . . . . . . . . . . . . . . . . . . . . . . . . . . . . . . . . . . . . . . . . . . . . . . . . . . . . . . . . . . . . . . $ 381,699,925
Net Assets Consist of:
Paid-in Capital . . . . . . . . . . . . . . . . . . . . . . . . . . . . . . . . . . . . . . . . . . . . . . . . . . . . . . . . . . . . . . . . . . . . . . . . . . . . . . . . . . . . . . . . . . . . . . . . . . . . . . $ 424,193,30 2
Distributions in Excess of Net Investment Income . . . . . . . . . . . . . . . . . . . . . . . . . . . . . . . . . . . . . . . . . . . . . . . . . . . . . . . . . . . . . . . . . . . . . . . (2,475,01 8)
Accumulated Net Realized Loss on Investments . . . . . . . . . . . . . . . . . . . . . . . . . . . . . . . . . . . . . . . . . . . . . . . . . . . . . . . . . . . . . . . . . . . . . . . . . (19,175,187)
Net Unrealized Depreciation on Investments . . . . . . . . . . . . . . . . . . . . . . . . . . . . . . . . . . . . . . . . . . . . . . . . . . . . . . . . . . . . . . . . . . . . . . . . . . . (20,757,225)
Net Unrealized Appreciation on Foreign Currency Translations . . . . . . . . . . . . . . . . . . . . . . . . . . . . . . . . . . . . . . . . . . . . . . . . . . . . . . . . . . . 20
Accumulated Foreign Capital Gains Tax on Appreciated Securities . . . . . . . . . . . . . . . . . . . . . . . . . . . . . . . . . . . . . . . . . . . . . . . . . . . . . . . . (85,967)
Net Assets . . . . . . . . . . . . . . . . . . . . . . . . . . . . . . . . . . . . . . . . . . . . . . . . . . . . . . . . . . . . . . . . . . . . . . . . . . . . . . . . . . . . . . . . . . . . . . . . . . . . . . . . . . $ 381,699,925
Outstanding Shares of Beneficial Interest
(unlimited authorization — no par value) . . . . . . . . . . . . . . . . . . . . . . . . . . . . . . . . . . . . . . . . . . . . . . . . . . . . . . . . . . . . . . . . . . . . . . . . . . . . . . . 11,550,000
Net Asset Value, Offering and Redemption Price Per Share . . . . . . . . . . . . . . . . . . . . . . . . . . . . . . . . . . . . . . . . . . . . . . . . . . . . . . . . . . . . . . . . . $ 33.05
EMQQ The Emerging Markets Internet & Ecommerce ETF
Statement of Assets and LiabilitiesAugust 31, 2018

The accompanying notes are an integral part of the financial statements.
8
Investment Income:
Dividend Income . . . . . . . . . . . . . . . . . . . . . . . . . . . . . . . . . . . . . . . . . . . . . . . . . . . . . . . . . . . . . . . . . . . . . . . . . . . . . . . . . . . . . . . . . . . . . . . . . . . . $ 1,192,038
Interest Income. . . . . . . . . . . . . . . . . . . . . . . . . . . . . . . . . . . . . . . . . . . . . . . . . . . . . . . . . . . . . . . . . . . . . . . . . . . . . . . . . . . . . . . . . . . . . . . . . . . . . . 23,941
Less: Foreign Taxes Withheld . . . . . . . . . . . . . . . . . . . . . . . . . . . . . . . . . . . . . . . . . . . . . . . . . . . . . . . . . . . . . . . . . . . . . . . . . . . . . . . . . . . . . . . . . . ( 70,957)
Total Investment Income . . . . . . . . . . . . . . . . . . . . . . . . . . . . . . . . . . . . . . . . . . . . . . . . . . . . . . . . . . . . . . . . . . . . . . . . . . . . . . . . . . . . . . . . . . . . 1, 145,022
Expenses:
Advisory Fees . . . . . . . . . . . . . . . . . . . . . . . . . . . . . . . . . . . . . . . . . . . . . . . . . . . . . . . . . . . . . . . . . . . . . . . . . . . . . . . . . . . . . . . . . . . . . . . . . . . . . . . 3,702,058
Total Expenses . . . . . . . . . . . . . . . . . . . . . . . . . . . . . . . . . . . . . . . . . . . . . . . . . . . . . . . . . . . . . . . . . . . . . . . . . . . . . . . . . . . . . . . . . . . . . . . . . . . . . . 3,702,058
Net Investment Loss . . . . . . . . . . . . . . . . . . . . . . . . . . . . . . . . . . . . . . . . . . . . . . . . . . . . . . . . . . . . . . . . . . . . . . . . . . . . . . . . . . . . . . . . . . . . . . . . (2, 557,036)
Net Realized and Unrealized Gain (Loss) on Investments
Net Realized Gain on Investments . . . . . . . . . . . . . . . . . . . . . . . . . . . . . . . . . . . . . . . . . . . . . . . . . . . . . . . . . . . . . . . . . . . . . . . . . . . . . . . . . . . 663,863(1)
Foreign Taxes on Realized Gains . . . . . . . . . . . . . . . . . . . . . . . . . . . . . . . . . . . . . . . . . . . . . . . . . . . . . . . . . . . . . . . . . . . . . . . . . . . . . . . . . . . . (17,110)
Net Realized Gain on Foreign Currency Transactions . . . . . . . . . . . . . . . . . . . . . . . . . . . . . . . . . . . . . . . . . . . . . . . . . . . . . . . . . . . . . . . . . . 37,366
Net Change in Unrealized Depreciation on Investments . . . . . . . . . . . . . . . . . . . . . . . . . . . . . . . . . . . . . . . . . . . . . . . . . . . . . . . . . . . . . . . (47,174,790)
Net Change in Unrealized Appreciation on Foreign Currency Translations . . . . . . . . . . . . . . . . . . . . . . . . . . . . . . . . . . . . . . . . . . . . . . . 34
Accrued Foreign Capital Gains Tax on Appreciated Securities . . . . . . . . . . . . . . . . . . . . . . . . . . . . . . . . . . . . . . . . . . . . . . . . . . . . . . . . . . (77,646)
Net Realized and Unrealized Loss on Investments . . . . . . . . . . . . . . . . . . . . . . . . . . . . . . . . . . . . . . . . . . . . . . . . . . . . . . . . . . . . . . . . . . (46,568,283)
Net Decrease in Net Assets Resulting from Operations . . . . . . . . . . . . . . . . . . . . . . . . . . . . . . . . . . . . . . . . . . . . . . . . . . . . . . . . . . . . . . . . . . $ (49,125,319)
(1) Includes realized gains (losses) as a result of in-kind redemptions (see Note 4 in Notes to Financial Statements).
EMQQ The Emerging Markets Internet & Ecommerce ETF
Statement of OperationsFor the year ended August 31, 2018

The accompanying notes are an integral part of the financial statements.
9
EMQQ The Emerging Markets Internet
& Ecommerce ETF
Year ended
August 31, 2018
Year ended
August 31, 2017
Operations:
Net Investment Loss . . . . . . . . . . . . . . . . . . . . . . . . . . . . . . . . . . . . . . . . . . . . . . . . . . . . . . . . . . . . . . . . . . . . . . . . . . . . . $ (2, 557,036) $ (127,113)
Net Realized Gain on Investments, Foreign Taxes on Realized Gains and Foreign
Currency Transactions(1) . . . . . . . . . . . . . . . . . . . . . . . . . . . . . . . . . . . . . . . . . . . . . . . . . . . . . . . . . . . . . . . . . . . . . . . 684,119 4,203,672
Net Change in Unrealized Appreciation (Depreciation) on Investments, Foreign Currency Translations
and Accrued Foreign Capital Gains Tax on Appreciated Securities . . . . . . . . . . . . . . . . . . . . . . . . . . . . . . . . . . (47,252,402) 24,627,006
Net Increase (Decrease) in Net Assets Resulting from Operations . . . . . . . . . . . . . . . . . . . . . . . . . . . . . . . . . . (49,125,319) 28,703,565
Dividends and Distributions to Shareholders:
Investment Income . . . . . . . . . . . . . . . . . . . . . . . . . . . . . . . . . . . . . . . . . . . . . . . . . . . . . . . . . . . . . . . . . . . . . . . . . . . . . . (1,442,738) (197,079)
Net Realized Gains . . . . . . . . . . . . . . . . . . . . . . . . . . . . . . . . . . . . . . . . . . . . . . . . . . . . . . . . . . . . . . . . . . . . . . . . . . . . . . . (2,255,627) —
Total Dividends and Distributions to Shareholders . . . . . . . . . . . . . . . . . . . . . . . . . . . . . . . . . . . . . . . . . . . . . . . (3,698,365) (197,079)
Capital Share Transactions:
Issued . . . . . . . . . . . . . . . . . . . . . . . . . . . . . . . . . . . . . . . . . . . . . . . . . . . . . . . . . . . . . . . . . . . . . . . . . . . . . . . . . . . . . . . . . . 250,171,539 235,012,271
Redeemed . . . . . . . . . . . . . . . . . . . . . . . . . . . . . . . . . . . . . . . . . . . . . . . . . . . . . . . . . . . . . . . . . . . . . . . . . . . . . . . . . . . . . . (87,308,038) (9,975,201)
Increase in Net Assets from Capital Share Transactions . . . . . . . . . . . . . . . . . . . . . . . . . . . . . . . . . . . . . . . . . . . 162,863,501 225,037,070
Total Increase in Net Assets . . . . . . . . . . . . . . . . . . . . . . . . . . . . . . . . . . . . . . . . . . . . . . . . . . . . . . . . . . . . . . . . . . . . . 110,039,817 253,543,556
Net Assets:
Beginning of Year . . . . . . . . . . . . . . . . . . . . . . . . . . . . . . . . . . . . . . . . . . . . . . . . . . . . . . . . . . . . . . . . . . . . . . . . . . . . . . . . 271,660,108 18,116,552
End of Year (Includes Distributions in Excess of Net Investment Income of $ (2,475,018)
and $(45,125), respectively) . . . . . . . . . . . . . . . . . . . . . . . . . . . . . . . . . . . . . . . . . . . . . . . . . . . . . . . . . . . . . . . . . . . . $ 381,699,925 $ 271,660,108
Share Transactions:
Issued . . . . . . . . . . . . . . . . . . . . . . . . . . . . . . . . . . . . . . . . . . . . . . . . . . . . . . . . . . . . . . . . . . . . . . . . . . . . . . . . . . . . . . . . . . 6,300,000 7,350,000
Redeemed . . . . . . . . . . . . . . . . . . . . . . . . . . . . . . . . . . . . . . . . . . . . . . . . . . . . . . . . . . . . . . . . . . . . . . . . . . . . . . . . . . . . . . (2,400,000) (400,000)
Net Increase in Shares Outstanding from Share Transactions . . . . . . . . . . . . . . . . . . . . . . . . . . . . . . . . . . . . . 3,900,000 6,950,000
(1) Includes realized gains (losses) as a result of in-kind redemptions (see Note 4 in Notes to Financial Statements).
Amounts designated as “—“ are $0.
EMQQ The Emerging Markets Internet & Ecommerce ETF
Statements of Changes in Net Assets
The accompanying notes are an integral part of the financial statements.
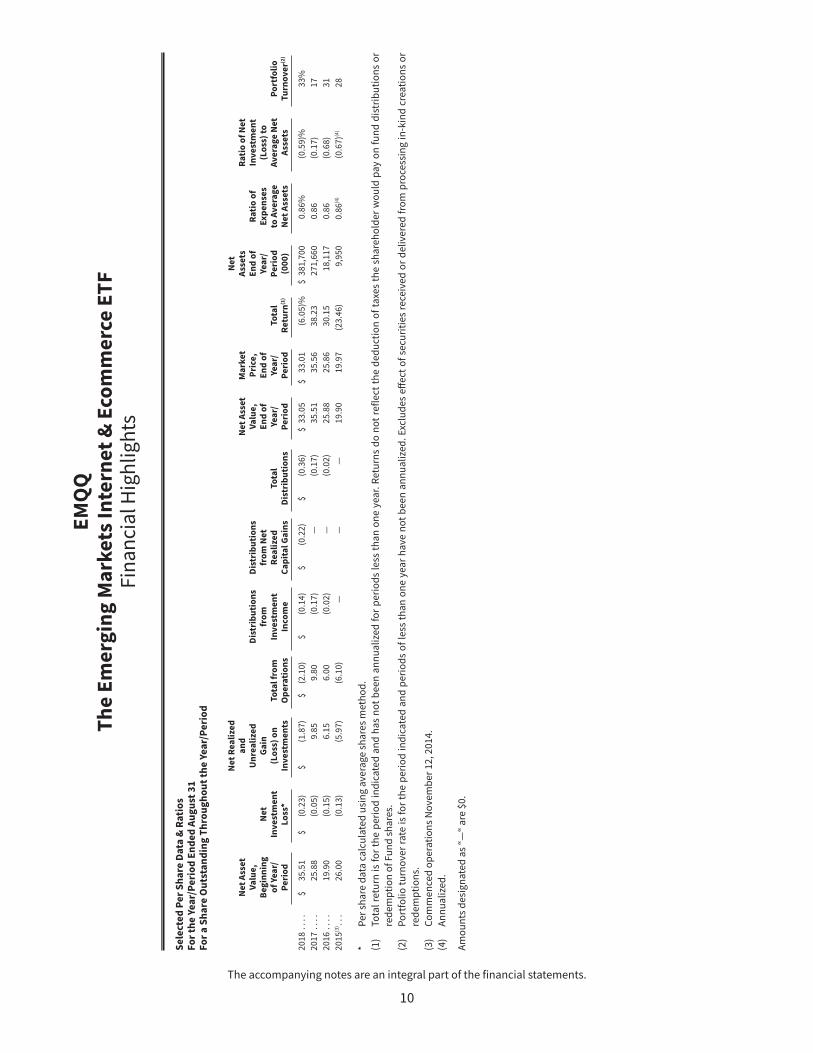
10
EM
T
he
Em
erg
ing
Ma
rke
ts I
nte
rne
t &
Eco
mm
erc
e E
TF
Fin
an
cia
l Hig
hli
gh
ts
Se
lect
ed
Pe
r S
ha
re D
ata
& R
ati
os
Fo
r th
e Y
ea
r/P
eri
od
En
de
d A
ug
ust
31
Fo
r a
Sh
are
Ou
tsta
nd
ing
Th
rou
gh
ou
t th
e Y
ea
r/P
eri
od
Ne
t A
sse
t V
alu
e,
Be
gin
nin
g
of
Yea
r/
Pe
rio
d
Ne
t In
ve
stm
en
t L
oss
*
Ne
t R
ea
lize
d
an
d
Un
rea
lize
d
Ga
in
(Lo
ss)
on
In
ve
stm
en
tsT
ota
l fr
om
O
pe
rati
on
s
Dis
trib
uti
on
s fr
om
In
ve
stm
en
t In
com
e
Dis
trib
uti
on
s fr
om
Ne
t R
ea
lize
d
Ca
pit
al
Ga
ins
To
tal
Dis
trib
uti
on
s
Ne
t A
sse
t V
alu
e,
En
d o
f Ye
ar/
Pe
rio
d
Ma
rke
t P
rice
, E
nd
of
Yea
r/P
eri
od
To
tal
Re
turn
(1)
Ne
t A
sse
ts
En
d o
f Ye
ar/
Pe
rio
d
(00
0)
Ra
tio
of
Ex
pe
nse
s to
Av
era
ge
N
et
Ass
ets
Ra
tio
of
Ne
t In
ve
stm
en
t (L
oss
) to
A
ve
rag
e N
et
Ass
ets
Po
rtfo
lio
T
urn
ov
er(2
)
20
18
. . .
. $
3
5.5
1$
(
0.2
3)
$
(1
.87
)$
(
2.1
0)
$
(0
.14
)$
(
0.2
2)
$
(0
.36
)$
33
.05
$
33
.01
(6.0
5)%
$ 3
81
,70
00
.86
%(0
. 59
)%3
3%
20
17
. . .
. 2
5.8
8(0
.05
)9
.85
9.8
0(0
.17
)—
(0.1
7)
35
.51
35
.56
38
.23
27
1,6
60
0.8
6(0
.17
)1
7
20
16
. . .
. 1
9.9
0(0
.15
)6
.15
6.0
0(0
.02
)—
(0.0
2)
25
.88
25
.86
30
.15
18
,11
70
.86
(0.6
8)
31
20
15
(3) .
. .
26
.00
(0.1
3)
(5.9
7)
(6.1
0)
——
—1
9.9
01
9.9
7(2
3.4
6)
9,9
50
0.8
6(4
)(0
.67
)(4)
28
* P
er
sha
re d
ata
ca
lcu
late
d u
sin
g a
vera
ge
sh
are
s m
eth
od
.
(1)
Tota
l re
turn
is
for
the
pe
rio
d i
nd
ica
ted
an
d h
as
no
t b
ee
n a
nn
ua
lize
d f
or
pe
rio
ds
less
th
an
on
e y
ear.
Ret
urn
s d
o n
ot
refl
ect
th
e d
ed
uct
ion
of
taxe
s th
e s
ha
reh
old
er
wo
uld
pa
y o
n f
un
d d
istr
ibu
tio
ns
or
red
em
pti
on
of
Fun
d s
ha
res.
(2)
Po
rtfo
lio
tu
rno
ver
rate
is f
or
the
pe
rio
d in
dic
ate
d a
nd
pe
rio
ds
of
less
th
an
on
e y
ear
ha
ve n
ot
be
en
an
nu
ali
zed
. E
xclu
de
s e
ff e
ct o
f se
curi
tie
s re
ceiv
ed
or
de
live
red
fro
m p
roce
ssin
g in
-kin
d c
rea
tio
ns
or
red
em
pti
on
s.
(3)
Co
mm
en
ced
op
era
tio
ns
No
vem
be
r 1
2, 2
01
4.
(4)
An
nu
ali
zed
.
Am
ou
nts
de
sig
na
ted
as
“—“
are
$0
.

11
EMQQ
The Emerging Markets Internet & Ecommerce ETF
Notes to the Financial StatementsAugust 31, 2018
1. ORGANIZATION
Exchange Traded Concepts Trust (the “Trust”), is a Delaware statutory trust formed on July 17, 2009. The Trust is registered
with the U.S. Securities and Exchange Commission (the “Commission”) under the Investment Company Act of 1940, as
amended (the “1940 Act”), as an open-end management investment company consisting of multiple investment portfolios.
The financial statements herein are those of EMQQ The Emerging Markets Internet & Ecommerce ETF (the “Fund”). The
Fund seeks to provide investment results that, before fees and expenses, correspond generally to the price and yield
performance of EMQQ The Emerging Markets Internet & Ecommerce ETF IndexTM (the “Index”). The Fund is classified as a
“non-diversified” fund under the 1940 Act. Exchange Traded Concepts, LLC (the “Adviser”), an Oklahoma limited liability
company, serves as the investment adviser for the Fund and is subject to the supervision of the Board of Trustees (the
“Board”). The Adviser is responsible for managing the investment activities of the Fund, the Fund’s business aff airs and
other administrative matters. Penserra Capital Management LLC (the “Sub-Adviser”) serves as the sub-adviser to the Fund.
The Fund commenced operations on November 12, 2014.
Shares of the Fund are listed and traded on the NYSE Arca, Inc. (“NYSE Arca”). Market prices for the Shares may be diff erent
from their net asset value (“NAV”). The Fund will issue and redeem Shares on a continuous basis at NAV only in large blocks
of Shares, typically 50,000 Shares, called “Creation Units”. Creation Units will be issued and redeemed principally in-kind
for securities included in a specified universe. Once created, Shares will trade in a secondary market at market prices that
change throughout the day in amounts less than a Creation Unit.
2. SIGNIFICANT ACCOUNTING POLICIES
The following significant accounting policies, which are consistently followed in the preparation of the financial statements
of the Trust, are in conformity with accounting principles generally accepted in the United States of America (“U.S. GAAP”)
for investment companies. The accompanying financial statements have been prepared in accordance with U.S. GAAP on
the accrual basis of accounting. Management has reviewed Financial Accounting Standards Board (“FASB”) Accounting
Standards Codification (“ASC”) Topic 946, Financial Services – Investment Companies Accounting Standards Codification
(“ASC 946”), and concluded that the Fund meets criteria of an “investment company,” and therefore, the Fund prepares its
financial statements in accordance with investment company accounting as outlined in ASC 946.
Use of Estimates and Indemnifications — The preparation of financial statements in conformity with U.S. GAAP requires
management to make estimates and assumptions that aff ect the reported amounts of assets and liabilities and disclosure
of contingent assets and liabilities at the date of the financial statements and the reported amounts of increases and
decreases in net assets from operations during the reporting period. Actual results could diff er from those estimates.
In the normal course of business, the Trust, on behalf of the Fund, enters into contracts that contain a variety of
representations which provide general indemnifications. The Fund’s maximum exposure under these arrangements cannot
be known; however, the Fund expects any risk of loss to be remote.
Security Valuation — Securities listed on a securities exchange, market or automated quotation system for which
quotations are readily available (except for securities traded on NASDAQ), including securities traded over the counter,
are valued at the last quoted sale price on the primary exchange or market (foreign or domestic) on which they are traded
(or at approximately 4:00 pm Eastern Time if a security’s primary exchange is normally open at that time), or, if there is no
such reported sale, at the most recent quoted bid for long positions and the most recent ask price for short positions. For
securities traded on NASDAQ, the NASDAQ Off icial Closing Price will be used. If available, debt securities are priced based
upon valuations provided by independent, third-party pricing agents. Such values generally reflect the last reported sales
price if the security is actively traded.

12
EMQQ
The Emerging Markets Internet & Ecommerce ETF
Notes to the Financial StatementsAugust 31, 2018 (Continued)
2. SIGNIFICANT ACCOUNTING POLICIES (continued)
The third-party pricing agents may also value debt securities at an evaluated bid price by employing methodologies that
utilize actual market transactions, broker-supplied valuations, or other methodologies designed to identify the fair value
for such securities. Debt obligations with remaining maturities of sixty days or less when acquired will be valued at their
market value. If a market value is not available from a pricing vendor or from an independent broker, the security shall be
fair valued according to the Trust’s Fair Value Procedures. Prices for most securities held in the Fund are provided daily by
recognized independent pricing agents. If a security price cannot be obtained from an independent, third-party pricing
agent, the Fund seeks to obtain a bid price from at least one independent broker.
Securities for which market prices are not “readily available” are valued in accordance with Fair Value Procedures established
by the Board. The Fund’s Fair Value Procedures are implemented through a Fair Value Committee (the “Committee”)
designated by the Board. Some of the more common reasons that may necessitate that a security be valued using Fair
Value Procedures include: the security’s trading has been halted or suspended; the security has been de-listed from a
national exchange; the security’s primary trading market is temporarily closed at a time when under normal conditions it
would be open; the security has not been traded for an extended period of time; the security’s primary pricing source is not
able or willing to provide a price; or trading of the security is subject to local government-imposed restrictions. In addition,
the Fund may fair value its securities if an event that may materially aff ect the value of the Fund’s securities that traded
outside of the United States (a “Significant Event”) has occurred between the time of the security’s last close and the time
that the Fund calculates its net asset value. A Significant Event may relate to a single issuer or to an entire market sector.
Events that may be Significant Events include: government actions, natural disasters, armed conflict, acts of terrorism
and significant market fluctuations. If the Adviser becomes aware of a Significant Event that has occurred with respect to
a security or group of securities aft er the closing of the exchange or market on which the security or securities principally
trade, but before the time at which the Fund calculates its net asset value, it may request that a Committee meeting be
called. When a security is valued in accordance with the Fair Value Procedures, the Committee will determine the fair value
aft er taking into consideration relevant information reasonably available to the Committee.
In accordance with the authoritative guidance on fair value measurements and disclosure under U.S. GAAP, the Fund
discloses fair value of its investments in a hierarchy that prioritizes the inputs to valuation techniques used to measure
the fair value. The objective of a fair value measurement is to determine the price that would be received to sell an asset or
paid to transfer a liability in an orderly transaction between market participants at the measurement date (an exit price).
Accordingly, the fair value hierarchy gives the highest priority to quoted prices (unadjusted) in active markets for identical
assets or liabilities (Level 1) and the lowest priority to unobservable inputs (Level 3). The three levels of the fair value
hierarchy are described below:
• Level 1 — Unadjusted quoted prices in active markets for identical, unrestricted assets or liabilities that the Fund
has the ability to access at the measurement date;
• Level 2 — Quoted prices which are not active, or inputs that are observable (either directly or indirectly) for
substantially the full term of the asset or liability; and
• Level 3 — Prices, inputs or exotic modeling techniques which are both significant to the fair value measurement
and unobservable (supported by little or no market activity).
The valuation techniques used by the Fund to measure fair value during the year ended August 31, 2018 maximized the use
of observable inputs and minimized the use of unobservable inputs.
For the year ended August 31, 2018, there have been no significant changes to the Fund’s fair valuation methodologies.
Federal Income Taxes — It is the Fund’s intention to qualify as a regulated investment company for Federal income tax
purposes by complying with the appropriate provisions of Subchapter M of the Internal Revenue Code of 1986, as amended.
Accordingly, no provisions for Federal income taxes have been made in the financial statements.
13
EMQQ
The Emerging Markets Internet & Ecommerce ETF
Notes to the Financial StatementsAugust 31, 2018 (Continued)
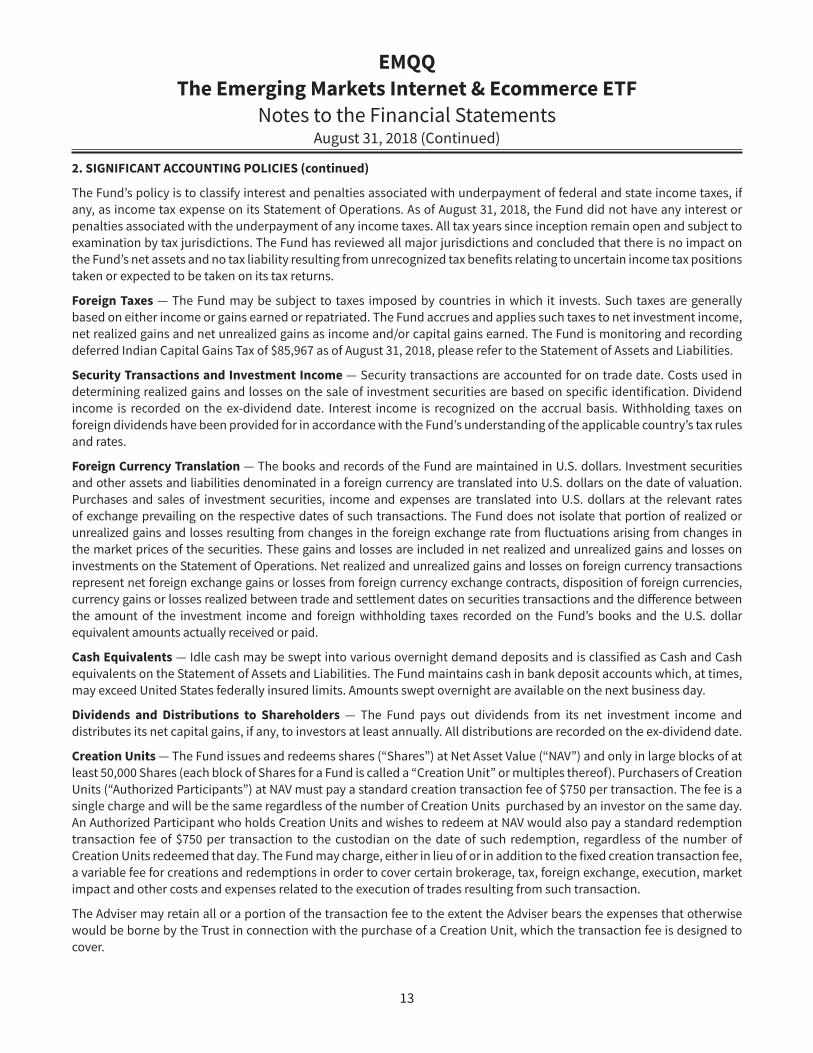
2. SIGNIFICANT ACCOUNTING POLICIES (continued)
The Fund’s policy is to classify interest and penalties associated with underpayment of federal and state income taxes, if
any, as income tax expense on its Statement of Operations. As of August 31, 2018, the Fund did not have any interest or
penalties associated with the underpayment of any income taxes. All tax years since inception remain open and subject to
examination by tax jurisdictions. The Fund has reviewed all major jurisdictions and concluded that there is no impact on
the Fund’s net assets and no tax liability resulting from unrecognized tax benefits relating to uncertain income tax positions
taken or expected to be taken on its tax returns.
Foreign Taxes — The Fund may be subject to taxes imposed by countries in which it invests. Such taxes are generally
based on either income or gains earned or repatriated. The Fund accrues and applies such taxes to net investment income,
net realized gains and net unrealized gains as income and/or capital gains earned. The Fund is monitoring and recording
deferred Indian Capital Gains Tax of $85,967 as of August 31, 2018, please refer to the Statement of Assets and Liabilities.
Security Transactions and Investment Income — Security transactions are accounted for on trade date. Costs used in
determining realized gains and losses on the sale of investment securities are based on specific identification. Dividend
income is recorded on the ex-dividend date. Interest income is recognized on the accrual basis. Withholding taxes on
foreign dividends have been provided for in accordance with the Fund’s understanding of the applicable country’s tax rules
and rates.
Foreign Currency Translation — The books and records of the Fund are maintained in U.S. dollars. Investment securities
and other assets and liabilities denominated in a foreign currency are translated into U.S. dollars on the date of valuation.
Purchases and sales of investment securities, income and expenses are translated into U.S. dollars at the relevant rates
of exchange prevailing on the respective dates of such transactions. The Fund does not isolate that portion of realized or
unrealized gains and losses resulting from changes in the foreign exchange rate from fluctuations arising from changes in
the market prices of the securities. These gains and losses are included in net realized and unrealized gains and losses on
investments on the Statement of Operations. Net realized and unrealized gains and losses on foreign currency transactions
represent net foreign exchange gains or losses from foreign currency exchange contracts, disposition of foreign currencies,
currency gains or losses realized between trade and settlement dates on securities transactions and the diff erence between
the amount of the investment income and foreign withholding taxes recorded on the Fund’s books and the U.S. dollar
equivalent amounts actually received or paid.
Cash Equivalents — Idle cash may be swept into various overnight demand deposits and is classified as Cash and Cash
equivalents on the Statement of Assets and Liabilities. The Fund maintains cash in bank deposit accounts which, at times,
may exceed United States federally insured limits. Amounts swept overnight are available on the next business day.
Dividends and Distributions to Shareholders — The Fund pays out dividends from its net investment income and
distributes its net capital gains, if any, to investors at least annually. All distributions are recorded on the ex-dividend date.
Creation Units — The Fund issues and redeems shares (“Shares”) at Net Asset Value (“NAV”) and only in large blocks of at
least 50,000 Shares (each block of Shares for a Fund is called a “Creation Unit” or multiples thereof). Purchasers of Creation
Units (“Authorized Participants”) at NAV must pay a standard creation transaction fee of $750 per transaction. The fee is a
single charge and will be the same regardless of the number of Creation Units purchased by an investor on the same day.
An Authorized Participant who holds Creation Units and wishes to redeem at NAV would also pay a standard redemption
transaction fee of $750 per transaction to the custodian on the date of such redemption, regardless of the number of
Creation Units redeemed that day. The Fund may charge, either in lieu of or in addition to the fixed creation transaction fee,
a variable fee for creations and redemptions in order to cover certain brokerage, tax, foreign exchange, execution, market
impact and other costs and expenses related to the execution of trades resulting from such transaction.
The Adviser may retain all or a portion of the transaction fee to the extent the Adviser bears the expenses that otherwise
would be borne by the Trust in connection with the purchase of a Creation Unit, which the transaction fee is designed to
cover.

14
EMQQ
The Emerging Markets Internet & Ecommerce ETF
Notes to the Financial StatementsAugust 31, 2018 (Continued)
2. SIGNIFICANT ACCOUNTING POLICIES (continued)
Except when aggregated in Creation Units, Shares are not redeemable securities. Shares of the Fund may only be
purchased or redeemed by Authorized Participants. An Authorized Participant is either (i) a broker-dealer or other
participant in the clearing process through the Continuous Net Settlement System of the National Securities Clearing
Corporation or (ii) a Depository Trust Company (“DTC”) participant and, in each case, must have executed an Authorized
Participant Agreement with the Fund’s distributor. Most retail investors will not qualify as Authorized Participants or have
the resources to buy and sell whole Creation Units. Therefore, they will be unable to purchase or redeem the Shares
directly from the Fund. Rather, most retail investors will purchase Shares in the secondary market with the assistance of
a broker and will be subject to customary brokerage commissions or fees.
If a Creation Unit is purchased or redeemed for cash, a higher transaction fee will be charged. The following table discloses
the Creation Unit breakdown based on the NAV as of August 31, 2018:
Creation
Unit Shares
Creation
Transaction Fee Value
Redemption
Transaction
Fee
EMQQ The Emerging Markets Internet & Ecommerce
ETF . . . . . . . . . . . . . . . . . . . . . . . . . . . . . . . . . . . . . . . . . . . . . . . . . . . . . 50,000 $ 750 $ 1,652, 500 $ 750
To the extent the Fund permits the contribution of securities in exchange for the purchase of shares (contribution in-kind),
shares may be issued in advance of receipt by the Fund at all or a portion of the applicable deposit securities. In these
circumstances, the Fund may require the Authorized Participant to maintain with the Trust an amount of 115% of the daily
mark-to-market of the missing deposit securities. Amounts are disclosed as Segregated Cash Balances with Authorized
Participants for Deposit Securities and Collateral Payable upon Return of Deposits Securities on the Statement of Assets
and Liabilities.
3. AGREEMENTS
Investment Advisory Agreement
The Adviser serves as the investment adviser to the Trust, including the Fund, pursuant to an investment advisory
agreement (“Advisory Agreement”). Under the Advisory Agreement, the Adviser provides investment advice to the Fund
primarily in the form of oversight of the Sub-Adviser, including daily monitoring of purchases and sales of securities by the
Sub-Adviser and regular review of the Sub-Adviser’s performance. The Adviser also arranges for transfer agency, custody,
fund administration and accounting, and other non-distribution related services necessary for the Fund to operate. The
Adviser administers the Fund’s business aff airs, provides off ice facilities and equipment and certain clerical, bookkeeping
and administrative services, and provides its off icers and employees to serve as off icers or Trustees of the Trust.
For the services it provides to the Fund, the Adviser receives a fee, which is calculated daily and paid monthly, at an annual
rate of 0.86% of average daily net assets of the Fund.
Under the Advisory Agreement, the Adviser has agreed to pay all expenses of the Fund except for the advisory fee, interest,
taxes, brokerage commissions and other expenses incurred in placing orders for the purchase and sale of securities
and other investment instruments, acquired fund fees and expenses, extraordinary expenses, and distribution fees and
expenses paid by the Trust under any distribution plan adopted pursuant to Rule 12b-1 under the 1940 Act.
Certain off icers or interested trustees of the Trust are also off icers or employees of the Adviser or its aff iliates. They receive
no fees for serving as off icers of the Trust.
The Adviser has entered into a license agreement with Big Tree Capital LLC, the Fund’s index provider, pursuant to which
the Adviser pays a fee to use the Index. The Adviser is sub-licensing rights to the Index to the Fund at no charge.

15
EMQQ
The Emerging Markets Internet & Ecommerce ETF
Notes to the Financial StatementsAugust 31, 2018 (Continued)
3. AGREEMENTS (continued)
Sub-Advisory Agreements
The Sub-Adviser is a New York limited liability company located at 4 Orinda Way, Suite 100-A, Orinda, California 94563.
The Sub-Adviser is responsible for trading portfolio securities on behalf of the Fund, including selecting broker-dealers to
execute purchase and sale transactions as instructed by the Adviser or in connection with any rebalancing or reconstitution
of the Index, subject to the supervision of the Adviser and the Board. Under a sub-advisory agreement, the Adviser pays
the Sub-Adviser a fee calculated daily and paid monthly, at an annual rate of 0.05% on the average daily net assets of the
Fund, subject to a $25,000 minimum fee.
The Sub-Adviser’s aff iliated broker-dealer, Penserra Securities LLC (“Penserra Securities”), also holds a minority interest in
the Sub-Adviser. The Fund may execute brokerage or other agency transactions through registered broker dealer aff iliates
of either of the Fund, the Adviser, the Sub-Adviser or the Distributor for a commission in conformity with the 1940 Act,
the Securities Exchange Act of 1934 (the “1934 Act”) and rules promulgated by the Commission. For the fiscal year ended
August 31, 2018, the Fund paid commissions to aff iliated brokers in the amount of $112,653.
Distribution Agreement
SEI Investments Distribution Co. (the “Distributor”) serves as the Fund’s underwriter and distributor of Shares pursuant to
a Distribution Agreement. Under the Distribution Agreement, the Distributor, as agent, receives orders to purchase shares
in Creation Units and transmits such orders to the Fund’s custodian and transfer agent. The Distributor has no obligation to
sell any specific quantity of Fund shares. The Distributor bears the following costs and expenses relating to the distribution
of shares: (i) the expenses of maintaining its registration or qualification as a dealer or broker under federal or state laws;
(ii) filing fees; and (iii) all other expenses incurred in connection with the distribution services, that are not reimbursed by
the Adviser, as contemplated in the Distribution Agreement. The Distributor does not maintain any secondary market in
Fund Shares.
The Fund has adopted a Distribution and Service Plan (the “Plan”) pursuant to Rule 12b-1 under the 1940 Act. In
accordance with the Plan, the Fund is authorized to pay an amount up to 0.25% of its average net assets each year for
certain distribution-related activities. For the year ended August 31, 2018, no fees were charged by the Distributor under
the Plan and the Plan will only be implemented with approval of the Board.
Administrator, Custodian and Transfer Agent
SEI Investments Global Funds Services (the “Administrator”) serves as the Fund’s Administrator pursuant to an
Administration Agreement. Brown Brothers Harriman & Co. (the “Custodian” and “Transfer Agent”) serves as the Fund’s
Custodian and Transfer Agent pursuant to a Custodian Agreement and Transfer Agency Services Agreement. The Adviser of
the Fund pays these fees.
Certain off icers of the Trust may also be off icers of the Administrator or its aff iliates. They receive no fees for serving as
off icers of the Trust.
4. INVESTMENT TRANSACTIONS
For the year ended August 31, 2018, the purchases and sales of investments in securities, excluding in-kind transactions,
long-term U.S. Government and short-term securities were:
Purchases
Sales and
Maturities
EMQQ The Emerging Markets Internet & Ecommerce ETF . . . . . . . . . $ 151,866,011 $ 137,346,683
There were no purchases or sales of long-term U.S. Government securities by the Fund.

16
EMQQ
The Emerging Markets Internet & Ecommerce ETF
Notes to the Financial StatementsAugust 31, 2018 (Continued)
4. INVESTMENT TRANSACTIONS (continued)
For the year ended August 31, 2018, in-kind transactions associated with creations and redemptions were:
Purchases Sales Realized Gain
EMQQ The Emerging Markets Internet & Ecommerce ETF . . . . . . . . . $ 214,979,381 $ 75,796,629 $ 18,345,678
For the year ended August 31, 2017, the Fund had $1,705,878 of net realized gains as a result of in-kind redemptions.
5. TAX INFORMATION
The amount and character of income and capital gain distributions to be paid, if any, are determined in accordance with
federal income tax regulations, which may diff er from U.S. GAAP. As a result, net investment income (loss) and net realized
gain (loss) on investment transactions for a reporting period may diff er significantly from distributions during such period.
These book/tax diff erences may be temporary or permanent. To the extent these diff erences are permanent in nature, they
are charged or credited to paid-in capital, accumulated undistributed net investment income (loss), or accumulated net
realized gain (loss), as appropriate, in the period that the diff erences arise.
Accordingly, the following permanent diff erences which are primarily attributable to Passive Foreign Investment Company
gains and losses, foreign currency gains and losses and redemption in -kind transactions, have been reclassified within the
components of net assets for the year ended August 31, 2018:
Undistributed
Net Investment
Income
Accumulated
Net Realized
Loss
Paid-in-
Capital
EMQQ The Emerging Markets Internet & Ecommerce ETF . . . . . . . . . . . . . . $ 1,569,881 $ (19,773,223) $ 18,203,342
The tax character of dividends paid during the years ended August 31, 2018 and August 31, 2017 were as follows:
Ordinary
Income
Long-Term
Capital Gain Totals
EMQQ The Emerging Markets Internet & Ecommerce ETF
2018 . . . . . . . . . . . . . . . . . . . . . . . . . . . . . . . . . . . . . . . . . . . . . . . . . . . . . . . . . . . . . . . $ 2,628,803 $ 1,069,562 $ 3,698,365
2017 . . . . . . . . . . . . . . . . . . . . . . . . . . . . . . . . . . . . . . . . . . . . . . . . . . . . . . . . . . . . . . . 197,079 — 197,079
As of August 31, 2018, the components of tax basis accumulated losses were as follows:
EMQQ The Emerging Markets
Internet & Ecommerce ETF
Post-October Losses . . . . . . . . . . . . . . . . . . . . . . . . . . . . . . . . . . . . . . . . . . . . . . . . . . . . . . . . . . . $ (9,619,336)
Capital Loss Carryforwards . . . . . . . . . . . . . . . . . . . . . . . . . . . . . . . . . . . . . . . . . . . . . . . . . . . . . (2,693,718)
Late-Year Loss Deferral . . . . . . . . . . . . . . . . . . . . . . . . . . . . . . . . . . . . . . . . . . . . . . . . . . . . . . . . . (1,219,223)
Unrealized Depreciation . . . . . . . . . . . . . . . . . . . . . . . . . . . . . . . . . . . . . . . . . . . . . . . . . . . . . . . (28,961,10 0)
Total Accumulated Losses . . . . . . . . . . . . . . . . . . . . . . . . . . . . . . . . . . . . . . . . . . . . . . . . . . . . . . $ (42,493,37 7)

17
EMQQ
The Emerging Markets Internet & Ecommerce ETF
Notes to the Financial StatementsAugust 31, 2018 (Continued)
5. TAX INFORMATION (continued)
Post-October capital losses represent capital losses realized on investment transactions from November 1, 2017 through
August 31, 2018, that, in accordance with Federal income tax regulations, the Fund may elect to defer and treat as having
arisen in the following fiscal year.
Deferred Late-Year Losses represent ordinary losses realized on investment transactions from January 1, 2018 through
August 31, 2018 and specified losses realized on investment transactions from November 1, 2017 through August 31, 2018,
that, in accordance with federal income tax regulations, the Fund defers and treats as having arisen in the following fiscal
year.
The Fund is permitted to utilize capital losses that are carried forward and will retain their character as either short-term or
long-term capital losses. As of August 31, 2018, the Fund has the following capital/loss carry forwards to off set capital gains
for an unlimited period:
Short-Term Long-Term
Total Capital
Losses
Carryforwards
EMQQ The Emerging Markets Internet & Ecommerce ETF
2018 . . . . . . . . . . . . . . . . . . . . . . . . . . . . . . . . . . . . . . . . . . . . . . . . . . . . . . . . . . . . . . . $ 1,979,758 $ 713,960 $ 2,693,718
For federal income tax purposes, the cost of investments owned at August 31, 2018, and the net realized gains or losses on
securities sold for the period, were diff erent from amounts reported for financial reporting purposes primarily due to wash
sales and Passive Foreign Investment Company gains and losses, which cannot be used for Federal income tax purposes
in the current year and have been deferred for use in future years. The federal tax cost and aggregate gross unrealized
appreciation and depreciation on investments held by the Fund at August 31, 2018, were as follows:
Federal Tax Cost
Aggregated Gross Unrealized
Appreciation
Aggregated Gross Unrealized
DepreciationNet Unrealized
Depreciation
EMQQ The Emerging Markets Internet &
Ecommerce ETF . . . . . . . . . . . . . . . . . . . . . . . . . . . . . . . . . . . . $ 407, 460,056 $ 36,950,757 $ ( 65,825,890) $ ( 28,875,133)
6. RISKS OF INVESTING IN THE FUND
As with all exchange traded funds (“ETFs”), a shareholder of the Fund is subject to the risk that his or her investment could
lose money. The Fund is subject to the principal risks noted below, any of which may adversely aff ect the NAV, trading price,
yield, total return and ability to meet its investment objective. A more complete description of principal risks is included in
the prospectus under the heading “Principal Risks”.
The Fund will normally invest at least 80% of its total assets in securities of the Index or in depositary receipts representing
securities of the Index. The Index is designed to measure the performance of an investable universe of publicly-traded,
emerging market internet and ecommerce companies.
Emerging Markets Securities Risk
Emerging markets are subject to greater market volatility, lower trading volume, political and economic instability,
uncertainty regarding the existence of trading markets and more governmental limitations on foreign investment than
more developed markets. In addition, securities in emerging markets may be subject to greater price fluctuations than
securities in more developed markets. An investment in securities of foreign companies may be in the form of depositary
receipts or other securities convertible into securities of foreign issuers.

18
EMQQ
The Emerging Markets Internet & Ecommerce ETF
Notes to the Financial StatementsAugust 31, 2018 (Continued)
6. RISKS OF INVESTING IN THE FUND (continued)
Geographic Investment Risk
To the extent the Fund invests a significant portion of its assets in the securities of companies of a single country or region,
it is more likely to be impacted by events or conditions aff ecting that country or region.
Information Technology Sector Risk
Information technology companies may also be smaller and less experienced companies, with limited product lines,
markets or financial resources and fewer experienced management or marketing personnel. Information technology
company stocks, especially those which are internet related, have experienced extreme price and volume fluctuations that
are oft en unrelated to their operating performance.
Investing in China Risk
As of the date of this report, a significant portion of the Index consists of securities of Chinese issuers. Consequently, the
Fund’s performance is expected to be closely tied to social, political, and economic conditions within China and to be more
volatile than the performance of more geographically diversified funds. The government of China maintains strict currency
controls in order to achieve economic, trade and political objectives and regularly intervenes in the currency market. The
Chinese government also plays a major role in the country’s economic policies regarding foreign investments. Foreign
investors are subject to the risk of loss from expropriation or nationalization of their investment assets and property,
governmental restrictions on foreign investments and the repatriation of capital invested. In addition, the rapid growth
rate of the Chinese economy over the past several years may not continue, and the trend toward economic liberalization
and disparities in wealth may result in social disorder, including violence and labor unrest. These and other factors could
have a negative impact on the Fund’s performance and increase the volatility of an investment in the Fund.
Internet Companies Risk
The Fund invests in the securities of Internet Companies, including internet services companies and internet retailers.
Internet Companies are subject to rapid changes in technology, worldwide competition, rapid obsolescence of products
and services, loss of patent protections, cyclical market patterns, evolving industry standards, frequent new product
introductions and the considerable risk of owning small capitalization companies that have recently begun operations.
Information Technology Sector Risk
The Fund is subject to the risk that market or economic factors impacting technology companies and companies that rely
heavily on technology advances could have a major eff ect on the value of the Fund’s investments. The value of stocks
of technology companies and companies that rely heavily on technology is particularly vulnerable to rapid changes
in technology product cycles, rapid product obsolescence, the loss of patent, copyright and trademark protections,
government regulation and competition, both domestically and internationally, including competition from foreign
competitors with lower production costs.
7. OTHER
At August 31, 2018, the records of the Trust reflected that 100% of the Fund’s total Shares outstanding were held by four
Authorized Participants, in the form of Creation Units. However, the individual shares comprising such Creation Units are
listed and traded on the NYSE Arca and have been purchased and sold by persons other than Authorized Participants.

19
EMQQ
The Emerging Markets Internet & Ecommerce ETF
Notes to the Financial StatementsAugust 31, 2018 (Concluded)
8. NEW ACCOUNTING PRONOUNCEMENTS
In August 2018, the FASB issued Accounting Standards Update 2018-13, Fair Value Measurement (Topic 820). The new
guidance includes additions and modifications to disclosures requirements for fair value measurements. For public
entities, the amendments are eff ective for financial statements issued for fiscal years beginning aft er December 15, 2019,
and interim periods within those fiscal years. At this time, management is currently evaluating the impact of this new
guidance on the financial statements and disclosures.
9. SUBSEQUENT EVENTS
The Fund has evaluated the need for additional disclosures and/or adjustments resulting from subsequent events through
the date the financial statements were issued.

20
EMQQ
The Emerging Markets Internet & Ecommerce ETF
Report of Independent Registered Public Accounting Firm
To the Shareholders of EMQQ The Emerging Markets Internet & Ecommerce ETF and
Board of Trustees of Exchange Traded Concepts Trust
Opinion on the Financial Statements
We have audited the accompanying statement of assets and liabilities, including the schedule of investments, of EMQQ The
Emerging Markets Internet & Ecommerce ETF (the “Fund”), a series of Exchange Traded Concepts Trust, as of August 31,
2018, and the related statement of operations for the year then ended, the statements of changes in net assets for each of
the two years in the period then ended, including the related notes, and the financial highlights for each of the four periods
in the period then ended (collectively referred to as the “financial statements”). In our opinion, the financial statements
present fairly, in all material respects, the financial position of the Fund as of August 31, 2018, the results of its operations
for the year then ended, the changes in its net assets for each of the two years in the period then ended, and the financial
highlights for each of the four periods in the period then ended, in conformity with accounting principles generally accepted
in the United States of America.
Basis for Opinion
These financial statements are the responsibility of the Fund’s management. Our responsibility is to express an opinion on
the Fund’s financial statements based on our audits. We are a public accounting firm registered with the Public Company
Accounting Oversight Board (United States) (“PCAOB”) and are required to be independent with respect to the Fund in
accordance with the U.S. federal securities laws and the applicable rules and regulations of the Securities and Exchange
Commission and the PCAOB.
We conducted our audits in accordance with the standards of the PCAOB. Those standards require that we plan and perform
the audit to obtain reasonable assurance about whether the financial statements are free of material misstatement,
whether due to error or fraud.
Our audits include performing procedures to assess the risks of material misstatement of the financial statements, whether
due to error or fraud, and performing procedures that respond to those risks. Such procedures include examining, on
a test basis, evidence regarding the amounts and disclosures in the financial statements and confirmation of securities
owned as of August 31, 2018, by correspondence with the custodian and brokers. Our audits also included evaluating the
accounting principles used and significant estimates made by management, as well as evaluating the overall presentation
of the financial statements. We believe that our audits provide a reasonable basis for our opinion.
We have served as the auditor of one or more investment companies advised by Exchange Traded Concepts, LLC since 2012.
COHEN & COMPANY, LTD.
Cleveland, Ohio
October 29, 2018
21
EMQQ
The Emerging Markets Internet & Ecommerce ETF
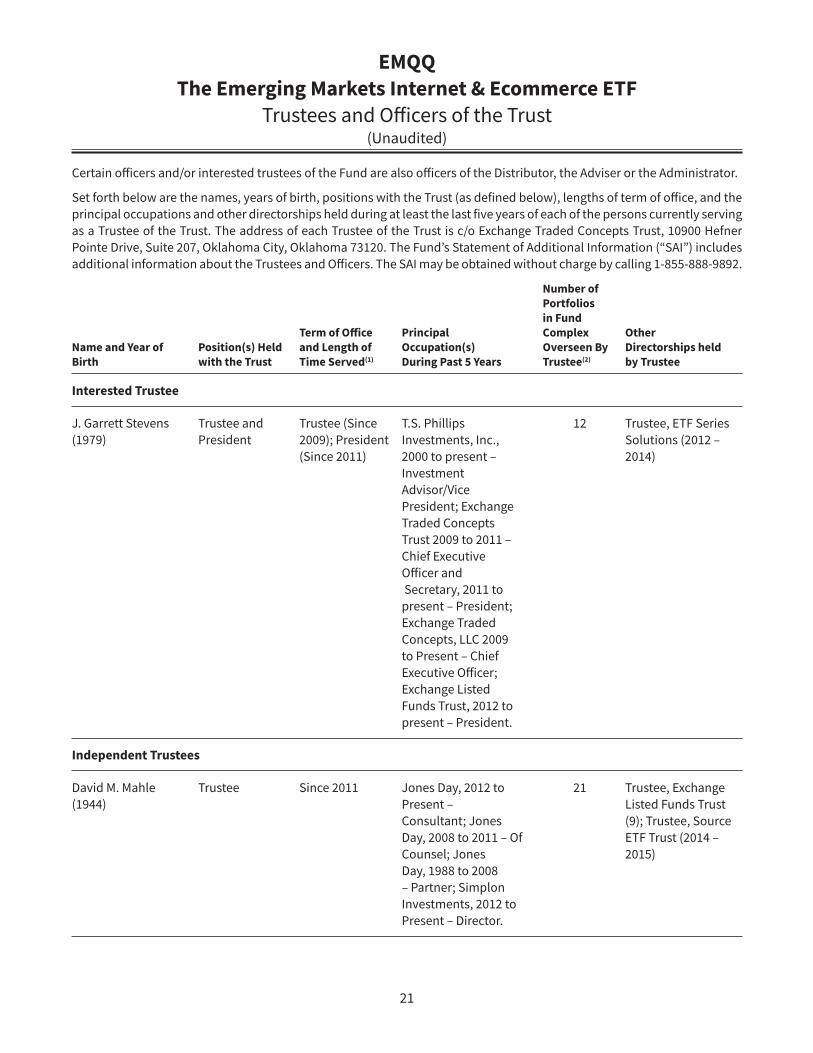
Trustees and Off icers of the Trust(Unaudited)
Certain off icers and/or interested trustees of the Fund are also off icers of the Distributor, the Adviser or the Administrator.
Set forth below are the names, years of birth, positions with the Trust (as defined below), lengths of term of off ice, and the
principal occupations and other directorships held during at least the last five years of each of the persons currently serving
as a Trustee of the Trust. The address of each Trustee of the Trust is c/o Exchange Traded Concepts Trust, 10900 Hefner
Pointe Drive, Suite 207, Oklahoma City, Oklahoma 73120. The Fund’s Statement of Additional Information (“SAI”) includes
additional information about the Trustees and Off icers. The SAI may be obtained without charge by calling 1-855-888-9892.
Name and Year of
Birth
Position(s) Held
with the Trust
Term of Office
and Length of
Time Served(1)
Principal
Occupation(s)
During Past 5 Years
Number of
Portfolios
in Fund
Complex
Overseen By
Trustee(2)
Other
Directorships held
by Trustee
Interested Trustee
J. Garrett Stevens
(1979)
Trustee and
President
Trustee (Since
2009); President
(Since 2011)
T.S. Phillips
Investments, Inc.,
2000 to present –
Investment
Advisor/Vice
President; Exchange
Traded Concepts
Trust 2009 to 2011 –
Chief Executive
Officer and
Secretary , 2011 to
present – President;
Exchange Traded
Concepts, LLC 2009
to Present – Chief
Executive Officer;
Exchange Listed
Funds Trust, 2012 to
present – President.
1 2 Trustee, ETF Series
Solutions (2012 –
2014)
Independent Trustees
David M. Mahle
(1944)
Trustee Since 2011 Jones Day, 2012 to
Present –
Consultant; Jones
Day, 2008 to 2011 – Of
Counsel; Jones
Day, 1988 to 2008
– Partner; Simpl on
Investments, 2012 to
Present – Director.
21 Trustee, Exchange
Listed Funds Trust
( 9); Trustee, Source
ETF Trust (2014 –
2015)

22
EMQQ
The Emerging Markets Internet & Ecommerce ETF
Trustees and Off icers of the Trust(Unaudited) (Continued)
Name and Year of
Birth
Position(s) Held
with the Trust
Term of Office
and Length of
Time Served(1)
Principal
Occupation(s)
During Past 5 Years
Number of
Portfolios
in Fund
Complex
Overseen By
Trustee
Other
Directorships held by
Trustee
Independent Trustees (continued)
Kurt Wolfgruber
(1950)
Trustee Since 2012 Amherst Asset
Management, 2010
to present –
Independent
Advisor; Oppenheimer
Funds, Inc., 2007-
2009 – President
21 Director, New
Mountain Finance
Corp.; Trustee,
Exchange Listed
Funds Trust (9);
Trustee, Source ETF
Trust (2014-2015)
Mark Zurack
(1957)
Trustee Since 2011 Columbia Business
School, 2002 to
Present – Professor
12 Trustee, AQR Funds
(49); Trustee,
Source ETF Trust
(2014-2015)
Timothy Jacoby
(1952)
Trustee Since 2014 Deloitte & Touche LLP,
2000 to 2014 – Partner
21 Trustee, Exchange
Listed Funds
Trust (9); Trustee,
Source ETF Trust
(2014-2015);
Trustee, Edward
Jones Money Market
Fund
(1) Each Trustee shall serve during the continued life of the Trust until he or she dies, resigns, is declared bankrupt or incompetent by
a court of competent jurisdiction, or is removed.(2) The Fund Complex includes each series of the Trust and of Exchange Listed Funds Trust.

23
EMQQ
The Emerging Markets Internet & Ecommerce ETF
Trustees and Off icers of the Trust(Unaudited) (Concluded)
Set forth below are the names, years of birth, positions with the Trust (as defined below), lengths and term of off ice, and the
principal occupations held during at least the last five years of each of the persons currently serving as off icers of the Trust.
The address of J. Garrett Stevens, Richard Hogan, and James J. Baker is c/o Exchange Traded Concepts Trust, 10900 Hefner
Pointe Drive, Suite 207, Oklahoma City, Oklahoma 73120, the address of Eric Kleinschmidt is SEI Investments Company, One
Freedom Valley Drive, Oaks, Pennsylvania 19456, and the address of Joseph Scavetti is Cipperman Compliance Services,
480 E. Swedesford Road, Suite 300, Wayne, PA 19087.
Name and Year of
Birth
Position(s)
Held with
the Trust
Term of Office and Length of
Time Served(1)
Principal Occupation(s)
During Past 5 Years
Other
Directorships Held
Officers
J. Garrett Stevens
(1979)
Trustee and
President
Trustee (Since
2009); President
(Since 2011)
T.S. Phillips Investments, Inc., 2000 to
present – Investment Advisor/Vice
President; Exchange Traded Concepts
Trust 2009 to 2011 – Chief Executive
Officer and Secretary , 2011 to present –
President; Exchange Traded Concepts,
LLC, 2009 to present – Chief Executive
Officer; and Exchange Listed Funds Trust,
2012 to present – President.
ETF Series Solutions
2012 –
2014 – Trustee
Richard Hogan
(1961)
Secretary Since 2011 Exchange Traded Concepts, LLC, 2011 to
present — Director;
Private Investor — 2003 to present;
Exchange Traded Concepts Trust, 2011 to
present — Secretary;
Exchange Listed Funds Trust, 2012 to
present — Trustee and Secretary; Peconic
Land Trust, 2012 to
present — Board Member and Treasurer;
Yorkville ETF Advisors, 2011 to 2016 —
Managing Member.
Board Member of
Peconic Land
Trust of Suffolk
County, NY;
Exchange Listed
Funds Trust ( 9) –
Trustee
James J. Baker Jr.
(1951)
Treasurer Since 2015 Exchange Traded Concepts, LLC, 2011
to present – Managing Partner; Yorkville
ETF Advisors, 2012 to 2016 –
Managing Partner; Goldman Sachs, 2000
to 2011 – Vice President.
None
Eric Kleinschmidt
(1968)
Assistant
Treasurer
Since 2013 SEI Investments Global Funds Services,
2004 to present — Director, Fund
Accounting.
None
Joseph J. Scavetti, Jr.
( 1968)
Chief
Compliance
Officer
Since 2018 Cipperman Compliance Services, LLC,
2018 to present – Compliance Director;
Palladiem, LLC, 2011 to January 2018 –
Compliance Manager.
None
(1) Each Off icer serves at the pleasure of the Board of Trustees.

24
EMQQ
The Emerging Markets Internet & Ecommerce ETF
Disclosure of Fund Expenses(Unaudited)
All Exchange Traded Funds (“ETF”) have operating expenses. As a shareholder of the Funds you incur an Advisory fee. In
addition to the Advisory fee, a shareholder may pay brokerage expenses, taxes, interest, litigation expenses, acquired fund
fees and expenses, and extraordinary expenses, if any. It is important for you to understand the impact of these ongoing
costs on your investment returns. Shareholders may incur brokerage commissions on their purchases and sales of Fund
shares, which are not reflected in these examples.
The following examples use the annualized expense ratio and are intended to help you understand the ongoing costs (in
dollars) of investing in each Fund and to compare these costs with those of other funds. The examples are based on an
investment of $1,000 made at the beginning of the period shown and held for the entire period (March 1, 2018 to August 31,
2018) (unless otherwise noted below). The table below illustrates each Fund’s cost in two ways:
Actual Fund Return. This section helps you to estimate the actual expenses aft er fee waivers that your Fund incurred
over the period. The “Expenses Paid During Period” column shows the actual dollar expense cost incurred by a $1,000
investment in the Fund, and the “Ending Account Value” number is derived from deducting that expense cost from the
Fund’s gross investment return.
You can use this information, together with the actual amount you invested in the Fund, to estimate the expenses you paid
over that period. Simply divide your actual account value by $1,000 to arrive at a ratio (for example, an $8,600 account value
divided by $1,000 = 8.6), then multiply that ratio by the number shown for your Fund under “Expenses Paid During Period.”
Hypothetical 5% Return. This section helps you compare your Fund’s costs with those of other funds. It assumes that
the Fund had an annual 5% return before expenses during the year, but that the expense ratio (Column 3) for the period
is unchanged. This example is useful in making comparisons because the Commission requires all funds to make this
5% calculation. You can assess your Fund’s comparative cost by comparing the hypothetical result for your Fund in the
“Expenses Paid During Period” column with those that appear in the same charts in the shareholder reports for other funds.
NOTE: Because the return is set at 5% for comparison purposes — NOT your Fund’s actual return — the account values
shown may not apply to your specific investment.
Beginning
Account Value
3/01/18
Ending
Account
Value
8/31/18
Annualized
Expense
Ratios
Expenses
Paid
During
Period(1)
EMQQ The Emerging Markets Internet & Ecommerce ETFActual Fund Return . . . . . . . . . . . . . . . . . . . . . . . . . . . . . . . $ 1,000.00 $ 814.60 0.86% $3.93
Hypothetical 5% Return . . . . . . . . . . . . . . . . . . . . . . . . . . . $ 1,000.00 $ 1,020.87 0.86% $4.38
(1) Expenses are equal to the Fund’s annualized expense ratio multiplied by the average account value over the period, multiplied 184/365 (to reflect the one-half year period).

25
EMQQ
The Emerging Markets Internet & Ecommerce ETF
Approval of Advisory AgreementsAugust 31, 2018 (Unaudited)
At a meeting of the Board of Trustees (the “Board”) of Exchange Traded Concepts Trust (the “Trust”) on May 22, 2018,
the Board considered and approved the continuance of the following agreements (the “Agreements”) with respect to the
EMQQ The Emerging Markets Internet & Ecommerce ETF (the “Fund”):
The investment advisory agreement between the Trust, on behalf of the Fund, and Exchange Traded Concepts, LLC
(“ETC”), pursuant to which ETC currently provides advisory services to the Fund; and
The investment sub-advisory agreement between ETC and Penserra Capital Management LLC (“Penserra”), pursuant
to which Penserra currently provides sub-advisory services to the Fund.
Pursuant to Section 15 of the Investment Company Act of 1940 (the “1940 Act”), the continuance of the Agreements
must be approved: (i) by the vote of a majority of the Trustees who are not parties to the Agreements or “interested persons”
of any party thereto, as defined in the 1940 Act (the “Independent Trustees”), cast in person at a meeting called for the
purpose of voting on such approval. In connection with its consideration of such approvals, the Board must request and
evaluate, and ETC and Penserra are required to furnish, such information as may be reasonably necessary to evaluate the
terms of the Agreements. In addition, rules under the 1940 Act require an investment company to disclose in its shareholder
reports the material factors and the conclusions with respect thereto that formed the basis for the Board’s approval of an
investment advisory agreement.
Consistent with these responsibilities, prior to the Meeting, the Board reviewed written materials from ETC and
Penserra, and at the Meeting, representatives from ETC and Penserra presented additional oral and written information to
help the Board evaluate the Agreements. Among other things, representatives from ETC and Penserra provided overviews
of their advisory businesses, including investment personnel and investment processes. The representatives discussed
the services provided by ETC and Penserra, the Fund’s fees, and the operational aspects of the Fund. During the Meeting,
the Board discussed the materials it received, including a memorandum detailing the responsibilities of the Trustees in
considering the approval of investment advisory agreements under the 1940 Act, considered the oral presentations of
ETC and Penserra, and deliberated on the approval of the continuance of the Agreements in light of this information.
Throughout the process, the Trustees were aff orded the opportunity to ask questions of and request additional materials
from ETC and Penserra.
In considering whether to approve the continuance of the Agreements, the Board took into consideration (i) the
nature, extent, and quality of the services provided by ETC and Penserra to the Fund; (ii) the performance of the Fund; (iii)
ETC’s and Penserra’s costs and profits realized from providing such services, including any fall-out benefits enjoyed by ETC
and Penserra or their aff iliates; (iv) comparative fee and expense data for the Fund; (v) the extent to which the advisory
fees for the Fund reflects economies of scale shared with Fund shareholders; and (vi) other factors the Board deemed to
be relevant. The Independent Trustees were assisted in their review by independent legal counsel and met with counsel
separately without management present.
In considering the nature, extent, and quality of the services provided to the Fund, the Board considered ETC’s and
Penserra’s specific responsibilities in all aspects of day-to-day management of the Fund. The Board noted that ETC’s
responsibilities include overseeing the activities of Penserra and monitoring compliance with various Fund policies and
procedures and applicable securities regulations, while Penserra’s responsibilities include trading portfolio securities and
other investment instruments on behalf of the Fund, selecting broker-dealers to execute purchase and sale transactions,
determining the daily baskets of deposit securities and cash components; executing portfolio securities trades for purchases
and redemptions of Fund shares conducted on a cash-in-lieu basis; quarterly reporting to the Board; and implementing
Board directives as they relate to the Fund, subject to the supervision of ETC and the oversight of the Board. The Board
considered the qualifications, experience, and responsibilities of ETC’s and Penserra’s investment personnel, the quality
of ETC’s and Penserra’s compliance infrastructures, and the determination of the Trust’s Chief Compliance Off icer that ETC
and Penserra have appropriate compliance policies and procedures in place. The Board noted that it had recently reviewed
ETC’s registration form on Form ADV as well as ETC’s responses to a detailed series of questions, which included a description

26
EMQQ
The Emerging Markets Internet & Ecommerce ETF
Approval of Advisory AgreementsAugust 31, 2018 (Unaudited) (Continued)
of ETC’s operations, service off erings, personnel, compliance program, risk management program, and financial condition,
and that it was provided with a memorandum from ETC updating the information previously provided. The Board further
noted that it had reviewed Penserra’s registration form on Form ADV as well as Penserra’s responses to a detailed series
of questions, which included a description of Penserra’s operations, service off erings, personnel, compliance program,
risk management program, and financial condition. The Board considered ETC’s and Penserra’s experience working with
ETFs, including the Fund, other series of the Trust, and other ETFs managed by ETC and Penserra outside of the Trust.
The Board also considered other services provided to the Fund by ETC, such as arranging for transfer agency, custody,
fund administration and accounting, and other non-distribution related services necessary for the Fund to operate,
administering the Fund’s business aff airs, providing off ice facilities and equipment and certain clerical, bookkeeping, and
administrative services, and providing its off icers and employees to serve as off icers or Trustees of the Trust.
The Board was provided with reports regarding the past performance of the Fund, including a report prepared by an
independent third party comparing the Fund’s performance with the performance of a group of peer funds and a report
comparing the Fund’s performance with the performance of the Fund’s underlying index, in each case for various time
periods. The Board noted that the index-based investment objective of the Fund made analysis of investment performance,
in absolute terms, less of a priority for the Fund than that which normally attaches to the performance of actively managed
funds. Instead, the Board focused on the extent to which the Fund achieved its investment objective as a passively managed
fund. In that regard, the Board reviewed information regarding factors impacting the performance of the Fund, including
the construction of its underlying index and the addition or deletion of securities from the underlying index. The Board
reviewed information regarding the Fund’s index tracking, noting, as applicable, various factors which contributed to the
Fund’s tracking error over certain periods of time. The Board considered ETC’s supervision of Penserra, including whether
the Fund was exhibiting significant tracking error, as part of the Board’s consideration of the nature, quality, and extent of
ETC’s services, as described above. The Board noted that the Fund had underperformed its underlying index over certain
periods, but that such underperformance was to be expected as it partially was the result of costs incurred by the Fund not
incurred by its underlying index. The Board also noted that the Fund’s performance was nonetheless generally in line with
that of its underlying index and believed that the extent of the underperformance therefore did not necessitate significant
additional review. The Board further noted that it received regular reports regarding the Fund’s performance at its quarterly
meetings.
Based on the factors discussed above, as well as those discussed below, the Board concluded that it was satisfied
with the nature, extent, and quality of the services provided to the Fund by ETC and Penserra.
The Board reviewed the advisory and sub-advisory fees paid to ETC and Penserra for their respective services provided
to the Fund under the Agreements. The Board reviewed a report prepared by an independent third party comparing the
Fund’s advisory fee to those paid by a group of peer funds. The Board noted that the Fund’s advisory fee was at the high end
of the range of advisory fees paid by the peer funds. The Board took into account that due to the specialized nature of the
Fund’s strategy, there are limitations in comparing its advisory fee to those of other funds and the information provided by
the third party report may not provide meaningful direct comparisons to the Fund. The Board noted that the sub-advisory
fee was consistent with the range of fees received by Penserra for its service as sub-adviser to other funds. The Board
took into consideration that the advisory fee for the Fund is a “unified fee,” meaning that the Fund pays no expenses
other than certain expenses customarily excluded from unitary fee arrangements, such as brokerage commissions, taxes,
and interest. The Board noted that ETC is responsible for compensating the Fund’s other service providers and paying
the Fund’s other expenses out of its own fee and resources. The Board further noted that the sub-advisory fee has two
components: 1) a basis point fee based on assets under management and 2) a minimum annual fee. The Board considered
that the sub-advisory fee is paid by ETC, not the Fund, and that the fee reflects an arm’s length negotiation between ETC
and Penserra. The Board further found that the fee reflected a reasonable allocation of the advisory fee paid to ETC given
the work performed by each firm. The Board considered the costs and expenses incurred by ETC and Penserra in providing
advisory and sub-advisory services, evaluated the compensation and benefits received by ETC and Penserra from its
relationship with the Fund, and reviewed profitability analyses from ETC and Penserra with respect to the Fund. In light of

27
EMQQ
The Emerging Markets Internet & Ecommerce ETF
Approval of Advisory AgreementsAugust 31, 2018 (Unaudited) (Concluded)
this information, the Board concluded for the Fund that the advisory and sub-advisory fees appeared reasonable in light of
the services rendered. In addition, the Board considered for the Fund whether economies of scale have been realized. The
Board concluded that no significant economies of scale have been realized by the Fund and that the Board will have the
opportunity to periodically reexamine whether such economies have been achieved.
No single factor was determinative of the Board’s decision to approve the continuance of the Agreements on behalf of
the Fund; rather, the Board based its determination on the total mix of information available to it. Based on a consideration
of all the factors in their totality, the Board, including a majority of the Independent Trustees, determined that the
Agreements, including the compensation payable thereunder, were fair and reasonable to the Fund. The Board, including
a majority of the Independent Trustees, therefore determined that the approval of the continuance of the Agreements was
in the best interests of the Fund and its shareholders.

28
EMQQ
The Emerging Markets Internet & Ecommerce ETF
Notice to Shareholders(Unaudited)
For shareholders that do not have an August 31, 2018 tax year end, this notice is for informational purposes only. For
shareholders with an August 31, 2018 tax year end, please consult your tax advisor as to the pertinence of this notice.
For the fiscal year ended August 31, 2018, the Fund is designating the following items with regard to distributions paid
during the year.
Long-Term Capital Gain
Distributions
Ordinary Income
DistributionsTotal
Distributions
Qualifying For
Corporate Dividend Received
Deduction(1)
Qualifying Dividend Income(2)
U.S. Government
Interest(3)
Qualified Interest
Income(4)
Qualified Short-Term
Capital Gain(5)
EMQQ
The Emerging Markets
Internet & Ecommerce
ETF . . . . . . . . . . . . . . . . . . . 28.25% 71.75% 100.00% 0.00% 7.91% 0.00% 0.00% 100.00%
(1) Qualifying dividends represent dividends which qualify for the corporate dividends received deduction and is reflected as a
percentage ordinary Income distributions (the total of short-term capital gain and net investment income distributions).(2) The percentage in this column represents the amount of “Qualifying Dividend Income” as created by the Jobs and Growth Relief
Reconciliation Act of 2003 and its reflected as a percentage of ordinary income distributions (the total of short-term capital gain and
net investment income distributions). It is the intention of the Fund to designate the maximum amount permitted by law.(3) “U.S. Government Interest represents the amount of interest that was derived from U.S. Government obligations and distributed
during the fiscal year. Generally, interest from direct U.S. Government obligations is exempt from state income tax.(4) The percentage in this column represents the amount of “Qualifying Interest Income” as created by the American Jobs Creation Act
of 2004 and is a percentage of net investment income that is exempt from U.S. withholding tax when paid for foreign investors.(5) The percentage in this column represents the amount of “Qualifying Short-Term Capital Gain” as created by the American Jobs
Creation Act of 2004 and is reflected as a percentage of short-term capital gain distributions that is exempt from U.S. withholding
tax when paid to foreign investors.
The Fund intends to pass through a foreign tax credit to shareholders. For fiscal year ended 2018 the total amount of foreign
source income is $ 27,707. The total amount of foreign tax paid is $88,066. Your allocable share of the foreign tax credit will
be reported on Form 1099 DIV.
29
EMQQ
The Emerging Markets Internet & Ecommerce ETF
Supplemental Information(Unaudited)
NAV is the price per share at which the Fund issues and redeems shares. It is calculated in accordance with the standard
formula for valuing mutual fund shares. The “Market Price” of the Fund generally is determined using the midpoint between
the highest bid and the lowest off er on the stock exchange on which the Shares of the Fund are listed for trading, as of the
time that the Fund’s NAV is calculated. The Fund’s Market Price may be at, above or below its NAV. The NAV of the Fund will
fluctuate with changes in the market value of the Fund’s holdings. The NAV of the Fund may also be impacted by the accrual
of deferred taxes. The Market Price of the Fund will fluctuate in accordance with changes in its NAV, as well as market supply
and demand.
Premiums or discounts are the diff erences (expressed as a percentage) between the NAV and Market Price of the Fund on
a given day, generally at the time NAV is calculated. A premium is the amount that the Fund is trading above the reported
NAV, expressed as a percentage of the NAV. A discount is the amount that the Fund is trading below the reported NAV,
expressed as a percentage of the NAV.
Further information regarding premiums and discounts is available on the Fund’s website at www.emqqetf.com.

10900 Hefner Point Drive, Suite 207
Oklahoma City, OK 73120
Investment Adviser:
Exchange Traded Concepts, LLC
10900 Hefner Point Drive, Suite 207
Oklahoma City, OK 73120
Investment Sub-Adviser:
Penserra Capital Management LLC
4 Orinda Way, 100-A
Orinda, CA 94563
Distributor:
SEI Investments Distribution Co.
One Freedom Valley Drive
Oaks, PA 19456
Administrator:
SEI Investments Global Funds Services
One Freedom Valley Drive
Oaks, PA 19456
Legal Counsel:
Morgan, Lewis & Bockius LLP
1111 Pennsylvania Avenue, NW
Washington, DC 20004
Independent Registered Public Accounting Firm:
Cohen & Company, Ltd.
1350 Euclid Ave.
Suite 800
Cleveland, OH 44115
This information must be preceded or accompanied by a current prospectus for the Fund.
EMQ-AR-001-0400