Embed Size (px)
Citation preview
1
Empresa de Transporte de Pasajeros Metro S.A. and Subsidiary
Interim Consolidated Financial Statements
For the periods ended
As of March 31, 2017 and December 31, 2016
1
EMPRESA DE TRANSPORTE DE PASAJEROS METRO S.A. AND SUBSIDIARY
INTERIM CONSOLIDATED FINANCIAL STATEMENTS
For the periods ended As of March 31, 2017 and December 31, 2016
Contents:
Interim Consolidated Statements of Financial Position
Interim Consolidated Statements of Comprehensive Income by Function
Interim Consolidated Statements of Changes in Equity
Interim Consolidated Statements of Cash Flows
Notes to the Interim Consolidated Financial Statements
ThCh$ : Figures expressed in thousands of Chilean Pesos MCh$ : Figures expressed in millions of Chilean Pesos US$ : Figures expressed in United States dollars
ThUS$ : Figures expressed in thousands of United States dollars
MUS$ : Figures expressed in millions of United States dollars
2
Consolidated Financial Statements
CONTENTS
Interim Consolidated Statements of Financial Position .........................................................................5
Interim Consolidated Statements of Comprehensive Income ...............................................................7
Interim Consolidated Statements of Changes in Equity ........................................................................8
Interim Consolidated Statements of Cash Flows ..................................................................................9
Note 1. General information ..................................................................................................................10
Note 2. Summary of significant accounting policies .............................................................................10
2.1 Basis of preparation ...........................................................................................................10
2.2 Basis of consolidation ........................................................................................................11
2.3 Foreign currency transactions ...........................................................................................12
2.3.1 Functional and presentation currency ..........................................................................12
2.3.2 Transactions and balances in foreign currency and adjustment units .........................12
2.3.3 Foreign currency translations ......................................................................................13
2.4 Property, plant and equipment ..........................................................................................13
2.5 Investment property ...........................................................................................................14
2.6 Intangible assets other than goodwill ................................................................................14
2.6.1 Easements ...................................................................................................................14
2.6.2 Software .......................................................................................................................14
2.7 Finance income and finance costs ....................................................................................15
2.8 Losses due to impairment of non-financial assets ............................................................15
2.9 Financial assets .................................................................................................................15
2.9.1 Financial assets at fair value through profit or loss ......................................................16
2.9.2 Loans and accounts receivables ..................................................................................16
2.9.3 Financial assets held-to-maturity .................................................................................16
2.9.4 Financial assets available-for-sale ...............................................................................16
2.9.5 Recognition and measurement of financial assets ......................................................16
2.10 Inventories .......................................................................................................................17
2.11 Trade and other receivables ............................................................................................18
3
2.12 Cash and cash equivalents .............................................................................................18
2.13 Share capital ....................................................................................................................18
2.14 Trade and other payables ................................................................................................18
2.15 Other financial liabilities ...................................................................................................18
2.16 Income tax and deferred taxes ........................................................................................19
2.17 Employee benefits ...........................................................................................................19
2.17.1 Accrued vacations ...................................................................................................19
2.17.2 Severance indemnity payments .............................................................................19
2.17.3 Incentive bonuses ...................................................................................................19
2.18 Provisions ........................................................................................................................20
2.19 Classification of balances (current and non-current) .......................................................20
2.20 Revenue and expense recognition ..................................................................................20
2.21 Lease agreements ...........................................................................................................20
2.22 New IFRS and Interpretations issued by the IFRS Interpretations Committee (IFRIC) .21
Note 3. Management estimates and accounting criteria ......................................................................22
3.1 Severance indemnity payments .......................................................................................22
3.2 Useful life of property, plant and equipment .....................................................................22
3.3 Litigation and other contingencies ....................................................................................22
3.4 Measurement and/or valuations at fair value ...................................................................23
Note 4. Cash and cash equivalents ....................................................................................................25
Note 5. Trade and other receivables, current .....................................................................................27
Note 6. Inventories ..............................................................................................................................28
Note 7. Intangible assets other than goodwill .....................................................................................28
Note 8. Property, plant and equipment ...............................................................................................30
Note 9. Investment property ...............................................................................................................33
Note 10. Other financial assets, current and non-current .....................................................................35
Note 11. Other non-financial assets, current and non-current .............................................................38
Note 12. Other financial liabilities, current and non-current .................................................................38
Note 13. Other non-financial liabilities, current and non-current ..........................................................46
Note 14. Balances and transactions with related parties .....................................................................46
Note 15. Trade and other payables ......................................................................................................47
Note 16. Segmented information ..........................................................................................................47
Note 17. Employee benefits .................................................................................................................48
4
Note 18. Income taxes .........................................................................................................................51
Note 19. Provisions, contingencies and guarantees ............................................................................51
Note 20. Changes in equity ..................................................................................................................53
Note 21. Income and expenses ............................................................................................................55
Note 22. Third-party guarantees ..........................................................................................................59
Note 23. Risk management policies .....................................................................................................60
23.1 Description of the market in which the Company operates ..........................................60
23.2 Financial risks ...............................................................................................................61
23.3 Capital risk management..............................................................................................67
23.4 Commodities risk ..........................................................................................................67
Note 24. Environment ...........................................................................................................................68
Note 25. Sanctions ...............................................................................................................................68
Note 26. Subsequent events ................................................................................................................68
5
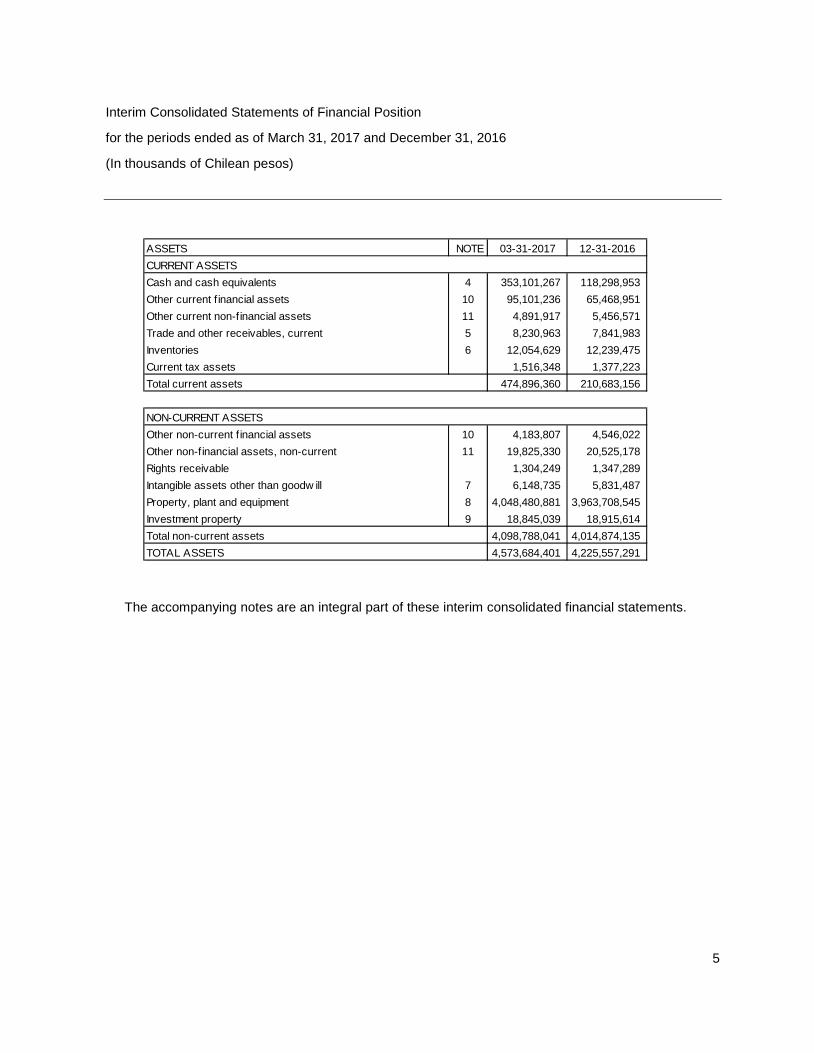
Interim Consolidated Statements of Financial Position
for the periods ended as of March 31, 2017 and December 31, 2016
(In thousands of Chilean pesos)
ASSETS NOTE 03-31-2017 12-31-2016CURRENT ASSETS Cash and cash equivalents 4 353,101,267 118,298,953Other current f inancial assets 10 95,101,236 65,468,951Other current non-financial assets 11 4,891,917 5,456,571Trade and other receivables, current 5 8,230,963 7,841,983Inventories 6 12,054,629 12,239,475Current tax assets 1,516,348 1,377,223Total current assets 474,896,360 210,683,156
NON-CURRENT ASSETS Other non-current f inancial assets 10 4,183,807 4,546,022Other non-financial assets, non-current 11 19,825,330 20,525,178Rights receivable 1,304,249 1,347,289Intangible assets other than goodw ill 7 6,148,735 5,831,487Property, plant and equipment 8 4,048,480,881 3,963,708,545Investment property 9 18,845,039 18,915,614Total non-current assets 4,098,788,041 4,014,874,135TOTAL ASSETS 4,573,684,401 4,225,557,291
The accompanying notes are an integral part of these interim consolidated financial statements.
6
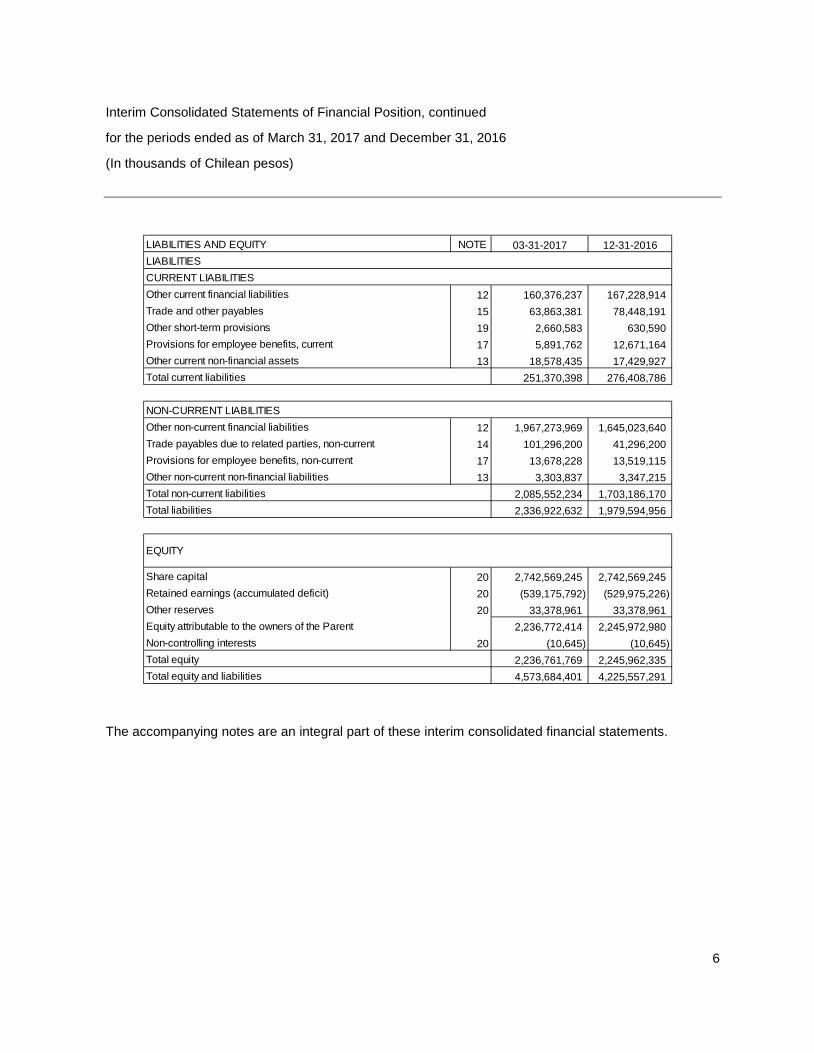
Interim Consolidated Statements of Financial Position, continued
for the periods ended as of March 31, 2017 and December 31, 2016
(In thousands of Chilean pesos)
LIABILITIES AND EQUITY NOTE 03-31-2017 12-31-2016LIABILITIESCURRENT LIABILITIES Other current financial liabilities 12 160,376,237 167,228,914Trade and other payables 15 63,863,381 78,448,191Other short-term provisions 19 2,660,583 630,590Provisions for employee benefits, current 17 5,891,762 12,671,164Other current non-financial assets 13 18,578,435 17,429,927Total current liabilities 251,370,398 276,408,786
NON-CURRENT LIABILITIES Other non-current financial liabilities 12 1,967,273,969 1,645,023,640Trade payables due to related parties, non-current 14 101,296,200 41,296,200Provisions for employee benefits, non-current 17 13,678,228 13,519,115Other non-current non-financial liabilities 13 3,303,837 3,347,215Total non-current liabilities 2,085,552,234 1,703,186,170Total liabilities 2,336,922,632 1,979,594,956
Share capital 20 2,742,569,245 2,742,569,245Retained earnings (accumulated deficit) 20 (539,175,792) (529,975,226)Other reserves 20 33,378,961 33,378,961Equity attributable to the owners of the Parent 2,236,772,414 2,245,972,980Non-controlling interests 20 (10,645) (10,645)Total equity 2,236,761,769 2,245,962,335Total equity and liabilities 4,573,684,401 4,225,557,291
EQUITY
The accompanying notes are an integral part of these interim consolidated financial statements.
7
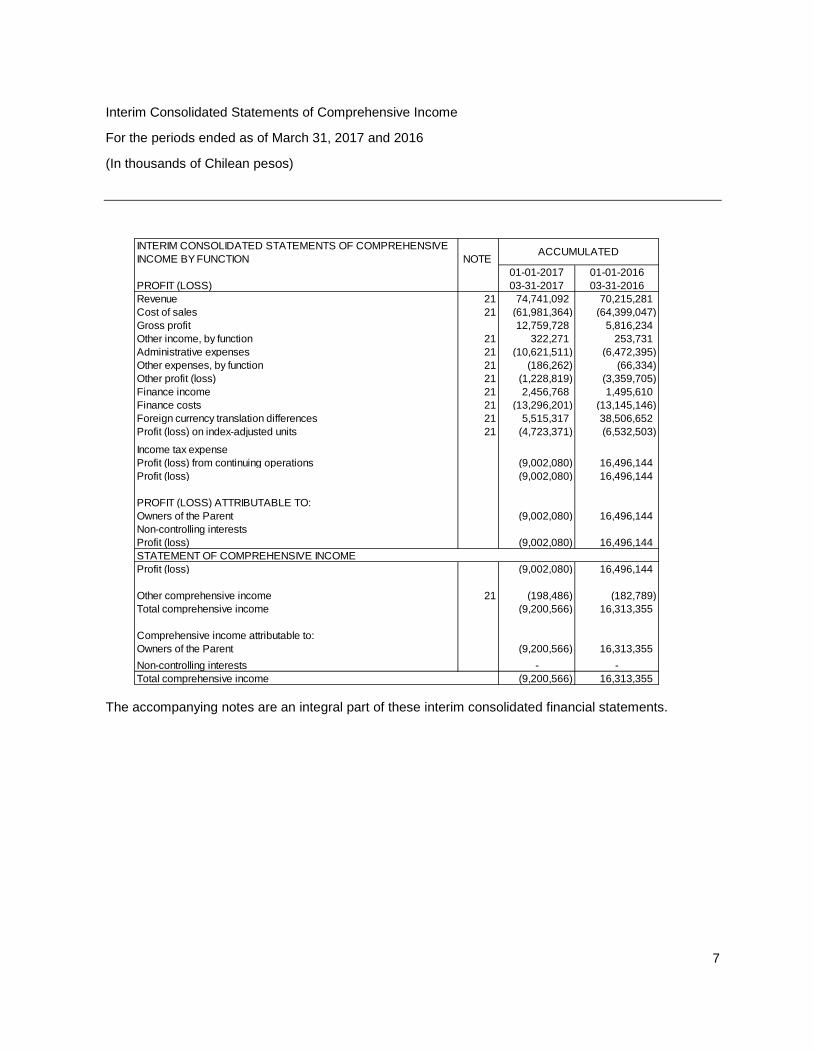
Interim Consolidated Statements of Comprehensive Income
For the periods ended as of March 31, 2017 and 2016
(In thousands of Chilean pesos)
INTERIM CONSOLIDATED STATEMENTS OF COMPREHENSIVE INCOME BY FUNCTION NOTE
01-01-2017 01-01-2016PROFIT (LOSS) 03-31-2017 03-31-2016Revenue 21 74,741,092 70,215,281Cost of sales 21 (61,981,364) (64,399,047)Gross profit 12,759,728 5,816,234Other income, by function 21 322,271 253,731Administrative expenses 21 (10,621,511) (6,472,395)Other expenses, by function 21 (186,262) (66,334)Other profit (loss) 21 (1,228,819) (3,359,705)Finance income 21 2,456,768 1,495,610Finance costs 21 (13,296,201) (13,145,146)Foreign currency translation differences 21 5,515,317 38,506,652Profit (loss) on index-adjusted units 21 (4,723,371) (6,532,503)Income tax expenseProfit (loss) from continuing operations (9,002,080) 16,496,144Profit (loss) (9,002,080) 16,496,144
PROFIT (LOSS) ATTRIBUTABLE TO:Owners of the Parent (9,002,080) 16,496,144Non-controlling interestsProfit (loss) (9,002,080) 16,496,144STATEMENT OF COMPREHENSIVE INCOMEProfit (loss) (9,002,080) 16,496,144
Other comprehensive income 21 (198,486) (182,789)Total comprehensive income (9,200,566) 16,313,355
Comprehensive income attributable to: Owners of the Parent (9,200,566) 16,313,355Non-controlling interests - -Total comprehensive income (9,200,566) 16,313,355
ACCUMULATED
The accompanying notes are an integral part of these interim consolidated financial statements.
8
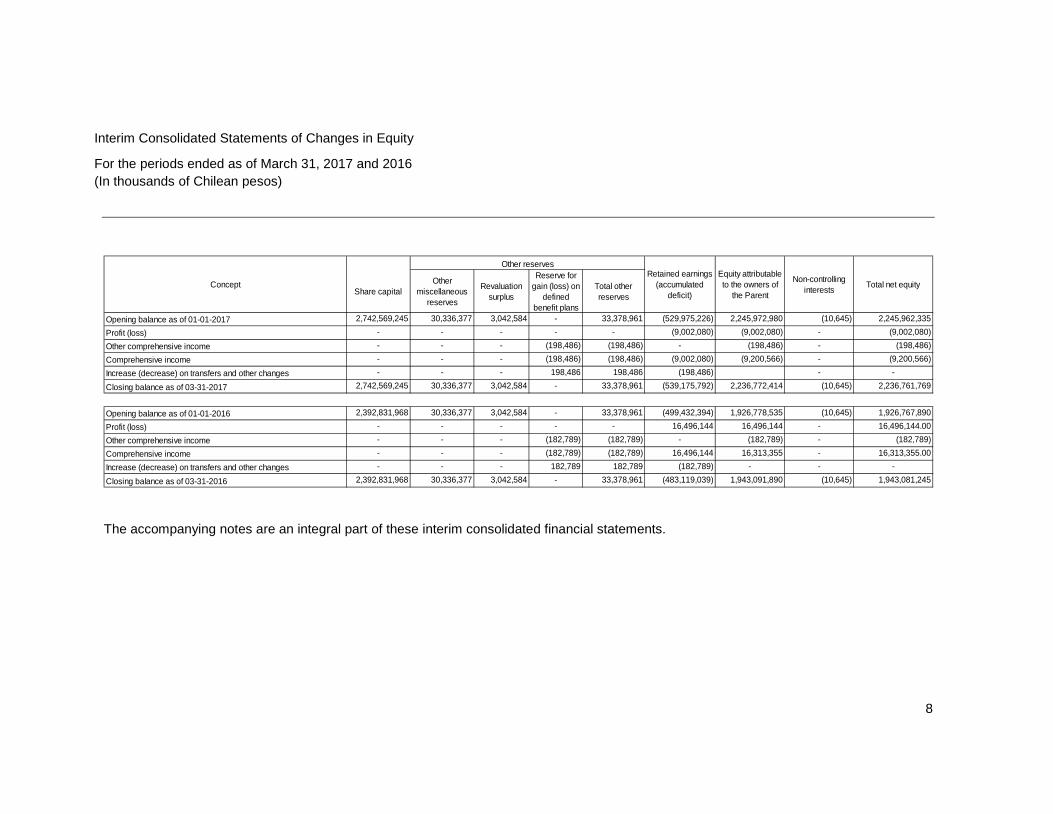
Interim Consolidated Statements of Changes in Equity
For the periods ended as of March 31, 2017 and 2016 (In thousands of Chilean pesos)
Share capital Other
miscellaneous reserves
Revaluation surplus
Reserve for gain (loss) on
defined benefit plans
Total other reserves
Opening balance as of 01-01-2017 2,742,569,245 30,336,377 3,042,584 - 33,378,961 (529,975,226) 2,245,972,980 (10,645) 2,245,962,335 Profit (loss) - - - - - (9,002,080) (9,002,080) - (9,002,080)Other comprehensive income - - - (198,486) (198,486) - (198,486) - (198,486) Comprehensive income - - - (198,486) (198,486) (9,002,080) (9,200,566) - (9,200,566)Increase (decrease) on transfers and other changes - - - 198,486 198,486 (198,486) - -
Closing balance as of 03-31-2017 2,742,569,245 30,336,377 3,042,584 - 33,378,961 (539,175,792) 2,236,772,414 (10,645) 2,236,761,769
Opening balance as of 01-01-2016 2,392,831,968 30,336,377 3,042,584 - 33,378,961 (499,432,394) 1,926,778,535 (10,645) 1,926,767,890 Profit (loss) - - - - - 16,496,144 16,496,144 - 16,496,144.00 Other comprehensive income - - - (182,789) (182,789) - (182,789) - (182,789) Comprehensive income - - - (182,789) (182,789) 16,496,144 16,313,355 - 16,313,355.00 Increase (decrease) on transfers and other changes - - - 182,789 182,789 (182,789) - - -
Closing balance as of 03-31-2016 2,392,831,968 30,336,377 3,042,584 - 33,378,961 (483,119,039) 1,943,091,890 (10,645) 1,943,081,245
Concept
Other reservesRetained earnings
(accumulated deficit)
Equity attributable to the owners of
the Parent
Non-controlling interests Total net equity
The accompanying notes are an integral part of these interim consolidated financial statements.
9
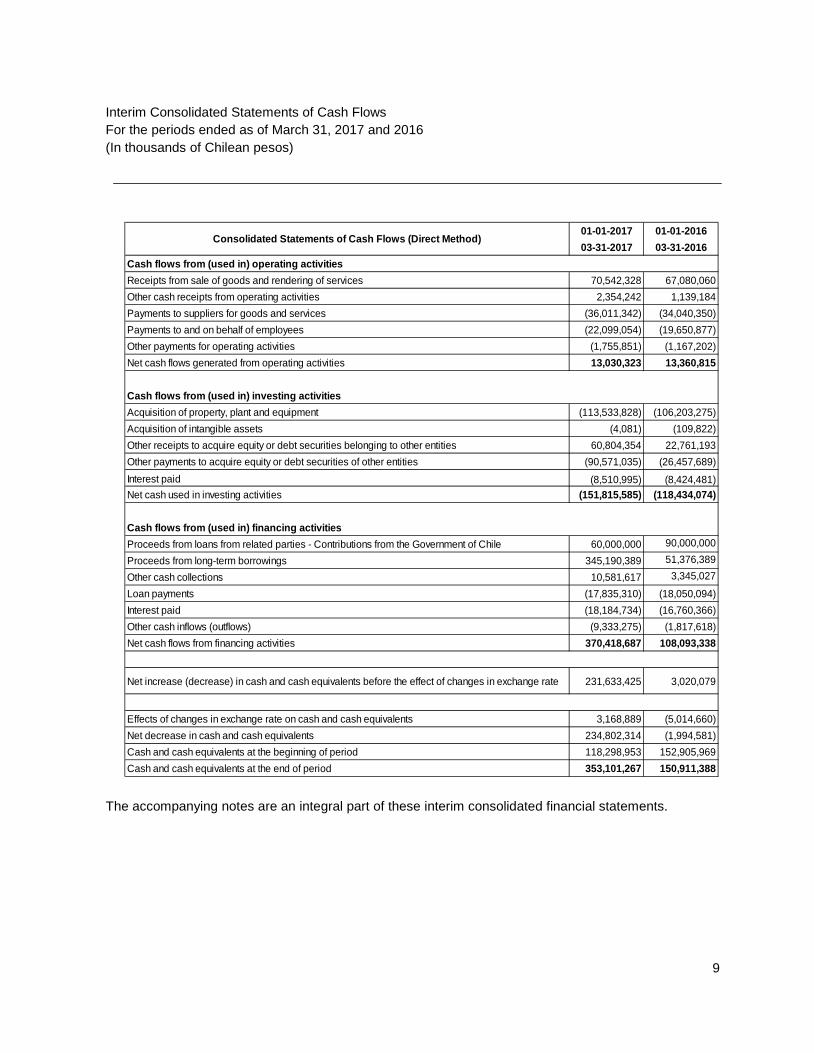
Interim Consolidated Statements of Cash Flows For the periods ended as of March 31, 2017 and 2016 (In thousands of Chilean pesos)
01-01-2017 01-01-201603-31-2017 03-31-2016
Cash flows from (used in) operating activitiesReceipts from sale of goods and rendering of services 70,542,328 67,080,060Other cash receipts from operating activities 2,354,242 1,139,184Payments to suppliers for goods and services (36,011,342) (34,040,350)Payments to and on behalf of employees (22,099,054) (19,650,877)Other payments for operating activities (1,755,851) (1,167,202)Net cash flows generated from operating activities 13,030,323 13,360,815
Cash flows from (used in) investing activitiesAcquisition of property, plant and equipment (113,533,828) (106,203,275)Acquisition of intangible assets (4,081) (109,822)Other receipts to acquire equity or debt securities belonging to other entities 60,804,354 22,761,193Other payments to acquire equity or debt securities of other entities (90,571,035) (26,457,689)Interest paid (8,510,995) (8,424,481)Net cash used in investing activities (151,815,585) (118,434,074)
Cash flows from (used in) financing activitiesProceeds from loans from related parties - Contributions from the Government of Chile 60,000,000 90,000,000 Proceeds from long-term borrowings 345,190,389 51,376,389 Other cash collections 10,581,617 3,345,027 Loan payments (17,835,310) (18,050,094)Interest paid (18,184,734) (16,760,366)Other cash inflows (outflows) (9,333,275) (1,817,618)Net cash flows from financing activities 370,418,687 108,093,338
Net increase (decrease) in cash and cash equivalents before the effect of changes in exchange rate 231,633,425 3,020,079
Effects of changes in exchange rate on cash and cash equivalents 3,168,889 (5,014,660)Net decrease in cash and cash equivalents 234,802,314 (1,994,581)Cash and cash equivalents at the beginning of period 118,298,953 152,905,969Cash and cash equivalents at the end of period 353,101,267 150,911,388
Consolidated Statements of Cash Flows (Direct Method)
The accompanying notes are an integral part of these interim consolidated financial statements.
10
NOTES TO THE INTERIM CONSOLIDATED FINANCIAL STATEMENTS FOR THE PERIODS ENDED MARCH 31, 2017, 2016 AND DECEMBER 31, 2016
(In thousands of Chilean pesos)
1. General information
Empresa de Transporte de Pasajeros Metro S.A., (hereinafter referred to as the Company) is a Chilean state-owned enterprise created by Law 18.772 on January 28, 1989 as the legal successor, in all the rights and obligations, to the Dirección General de Metro.
The Company is a stock corporation bound by the principles applicable to open stock corporations, and has its legal domicile at 1414 Avenida Libertador Bernardo O’Higgins, Santiago, Chile.
The Company is registered on the Register of Securities under file number 421 and is subject to the supervision of the Chilean Superintendence of Securities and Insurance (SVS).
The purpose of the Company is to carry out all activities related to providing passenger transportation services on subways or other complementary electric modes of transportation and the performance of surface transportation services through buses or vehicles using any technology, as well as all activities related to such line of business.
These consolidated financial statements are presented in thousands of Chilean pesos (unless expressly stated otherwise) since this is the functional currency of the main jurisdiction in which the Company operates.
2. Summary of significant accounting policies
The main accounting policies adopted in the preparation of these consolidated financial statements, as required by IAS 1, have been designed in accordance with International Financial Reporting Standards (hereinafter "IFRS") in effect as of March 31, 2017 and have been applied on a consistent basis to all accounting periods presented in these consolidated financial statements.
2.1. Basis of preparation
The consolidated financial statements comprise the statements of financial position as of March 31, 2017 and December 31, 2016, and the consolidated statements of comprehensive income, consolidated statements of changes in equity and consolidated statements of cash flows for the years ended March 31, 2017 and 2016, which have been prepared in accordance with specific instructions and standards issued by the Superintendence of Securities and Insurance (hereinafter "SVS"). These instructions and standards require that the Company complies with the International Financial Reporting Standards (IFRS) and IAS 34 "Interim Financial Information" issued by the International Accounting Standards Board (hereinafter the "IASB") except for certain IFRS standards. Through Ordinary Official Letter No. 6158 dated March 5, 2012, the Company was authorized by the SVS to exceptionally apply Public Sector International Accounting Standard (hereinafter "IPSAS") 21, instead of IAS 36. Note 2.8 provides more details regarding this exception.
These Consolidated Financial Statements were approved by the Board on May 8, 2017, authorizing their publication by management.
These consolidated financial statements have been prepared in accordance with historical cost principles, although modified by the revaluation of certain assets included in financial assets
11
and liabilities (including derivative financial instruments) at fair value through profit or loss, as applicable.
The preparation of Consolidated Financial Statements in accordance with IFRS, and specific instructions issued by the SVS, requires the use of certain critical accounting estimates, necessary for the quantification of certain assets, liabilities, income and expenses.
It also requires that management use its judgment in the process of applying the Company's accounting policies. The areas that involve a greater degree of judgment or complexity, in which assumptions or estimates are significant for the financial statements, are described in Note 3 "Management's Estimates and Accounting Criteria".
The translation of these financial statements is provided as a free translation from the Spanish language original, which is the official and binding version. Such translation has been made solely for the convenience of non-Spanish readers.
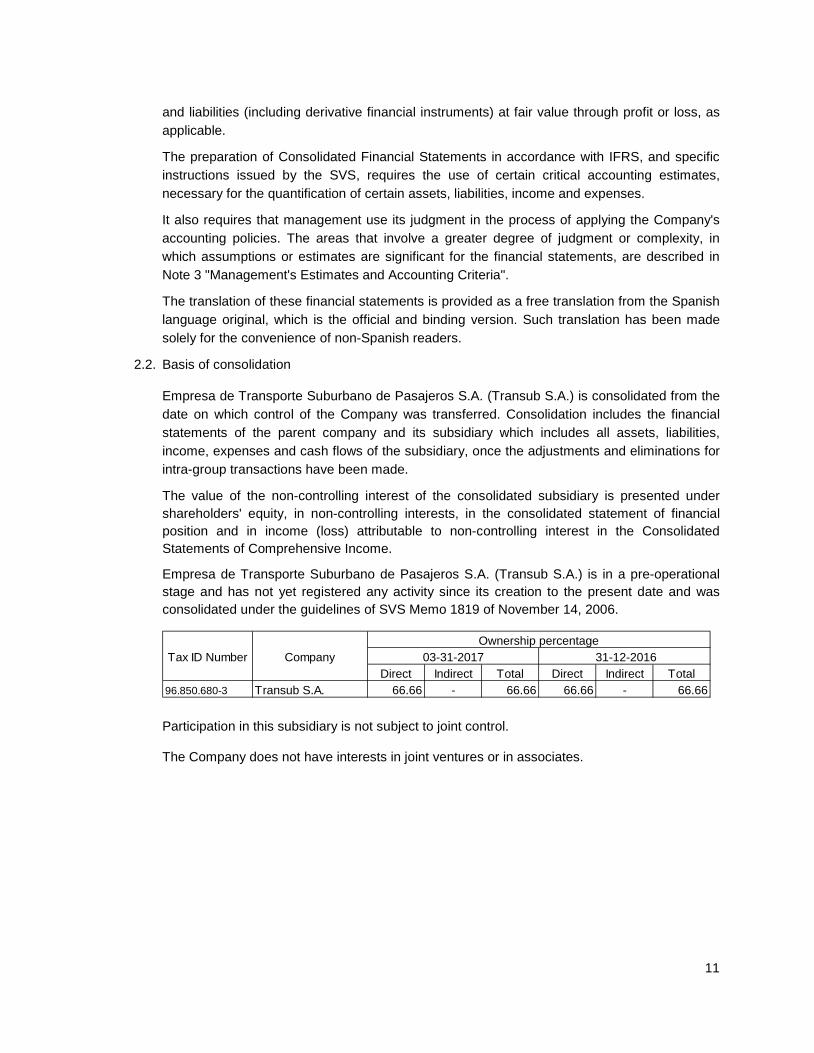
2.2. Basis of consolidation
Empresa de Transporte Suburbano de Pasajeros S.A. (Transub S.A.) is consolidated from the date on which control of the Company was transferred. Consolidation includes the financial statements of the parent company and its subsidiary which includes all assets, liabilities, income, expenses and cash flows of the subsidiary, once the adjustments and eliminations for intra-group transactions have been made.
The value of the non-controlling interest of the consolidated subsidiary is presented under shareholders' equity, in non-controlling interests, in the consolidated statement of financial position and in income (loss) attributable to non-controlling interest in the Consolidated Statements of Comprehensive Income.
Empresa de Transporte Suburbano de Pasajeros S.A. (Transub S.A.) is in a pre-operational stage and has not yet registered any activity since its creation to the present date and was consolidated under the guidelines of SVS Memo 1819 of November 14, 2006.
Tax ID Number CompanyDirect Indirect Total Direct Indirect Total
96.850.680-3 Transub S.A. 66.66 - 66.66 66.66 - 66.66
03-31-2017 31-12-2016Ownership percentage
Participation in this subsidiary is not subject to joint control. The Company does not have interests in joint ventures or in associates.
12
2.3. Foreign currency transactions
2.3.1. Functional and presentation currency
The items included in the consolidated financial statements are presented using the currency of the main jurisdiction in which the reporting entity operates in (functional currency). The Company's functional currency is the Chilean peso, all information is presented in thousands of Chilean pesos (ThCh$) rounded to the nearest unit.
2.3.2. Transactions and balances in foreign currency and adjustment units
Transactions in foreign currency and adjustment units are converted to the functional currency using the exchange rates in effect on the transaction dates. Profits and losses in foreign currency that result from the settlement of these transactions and from conversion at the closing exchange rates for monetary assets and liabilities denominated in foreign currency are recognized in the comprehensive income statement, unless they have to be deferred, then they are recorded in equity, as in the case of cash flow hedges, if any.
Exchange rate differences affecting financial assets measured at fair value are included in gains or losses.
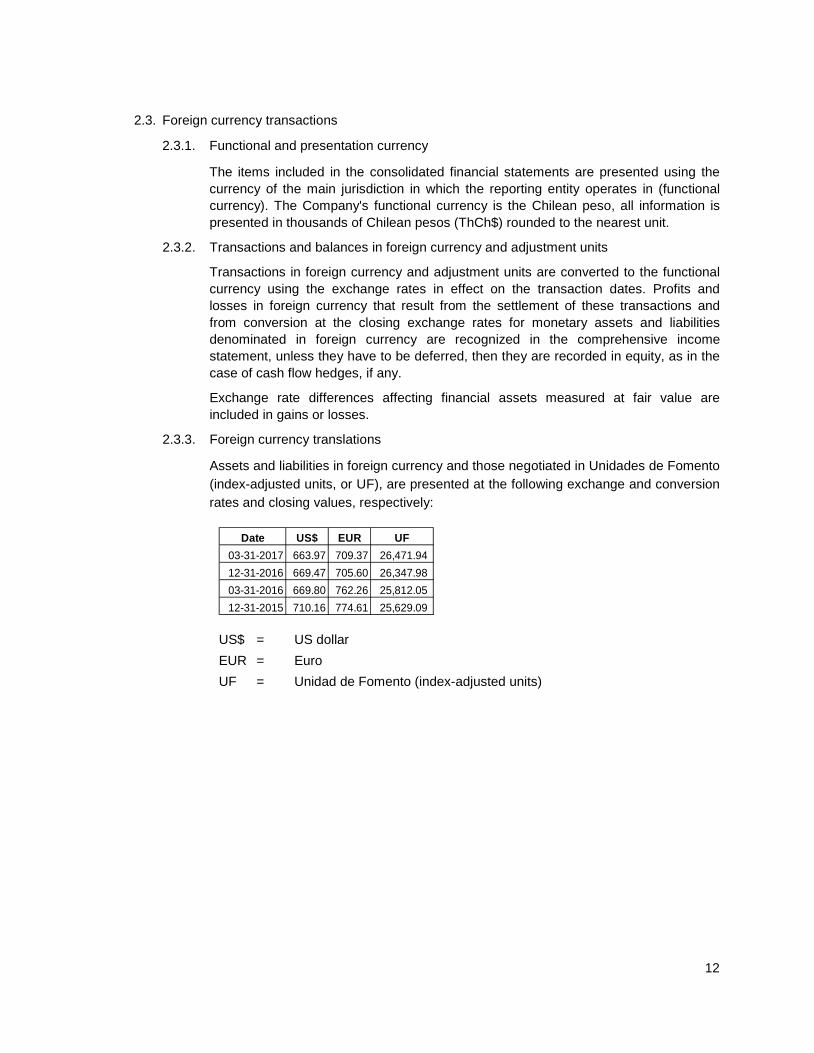
2.3.3. Foreign currency translations
Assets and liabilities in foreign currency and those negotiated in Unidades de Fomento (index-adjusted units, or UF), are presented at the following exchange and conversion rates and closing values, respectively:
Date US$ EUR UF03-31-2017 663.97 709.37 26,471.9412-31-2016 669.47 705.60 26,347.9803-31-2016 669.80 762.26 25,812.0512-31-2015 710.16 774.61 25,629.09
US$ = US dollar EUR = Euro UF = Unidad de Fomento (index-adjusted units)
13
2.4. Property, plant and equipment
Property, plant and equipment items are initially measured at their acquisition price, plus all costs directly attributable to getting the asset to operating conditions for its intended use.
Subsequent to initial measurement it should be calculated using the historical cost model discounting the corresponding accumulated depreciation and impairment losses, which are recorded in the consolidated statement of comprehensive income.
Costs include expenditure directly attributable to the acquisition of assets and the capitalized interest incurred during the construction and development period.
The cost of self-constructed assets includes the cost of materials and direct labor costs; any other cost directly attributable to bringing the asset to the location and condition necessary for it to be capable of operating in the manner intended by management; and the costs of dismantling and removing the items and restoring the site in which they are located.
Work in progress is reclassified as operating assets under the same property, plant and equipment heading once the testing period has been completed and the assets are available for use, at which point their depreciation begins.
Costs of extensions, modernization or improvements that represent an increase in productivity, capacity, efficiency or lengthening of the useful lives of assets, are capitalized as higher cost of the corresponding assets.
Substitutions or renovation of assets that increase their useful lives, or their economic capacity, are recorded as higher value of the respective assets, with the consequent accounting derecognition of the substituted or renovated assets.
Periodic maintenance, conservation and repair expenses are recorded directly in the statement of income as costs for the period in which they are incurred.
Major maintenance costs of rolling stock, which includes among other things, replacement of parts and pieces, are capitalized as an asset that is independent from the main asset, if it is probable that future economic benefits related to the costs are received.
Depreciation of property, plant and equipment items is calculated using the straight-line method to allocate costs over their estimated economic useful lives, except in the case of certain technical components identified in rolling stock, which are depreciated on the basis of cycles and kilometers traveled.
Amortization (depreciation) of property, plant and equipment according to IAS 16 must be recorded separately for each significant part that composes a final property, plant and equipment item. In the case of rolling stock, the Company separately depreciates the significant components of a property, plant and equipment item that have different useful lives than the rest of the elements that compose it.
14
Residual values, in the cases defined and useful lives of assets are reviewed and adjusted prospectively in each statement of financial position, in order to have remaining useful lives that are in accordance with the current service use and with the effective use of the asset.
Gains and losses on the sale of property, plant and equipment, are calculated comparing the income obtained to the carrying amount and are included in the consolidated statement of comprehensive income.
At least once a year the Company evaluates the existence of possible impairment of property, plant and equipment, in accordance with Public Sector IAS 21, as described in Note 2.8.
The effects of the impairment analysis are recognized directly in profit or loss.
2.5. Investment property
Relates to real state (land and buildings) held by the Company to obtain economic benefits derived from their rental or to obtain capital appreciation from holding on to them.
The Company has commercial stores, land and buildings leased under operating leases.
Investment property that corresponds to land and buildings are valued using the cost model.
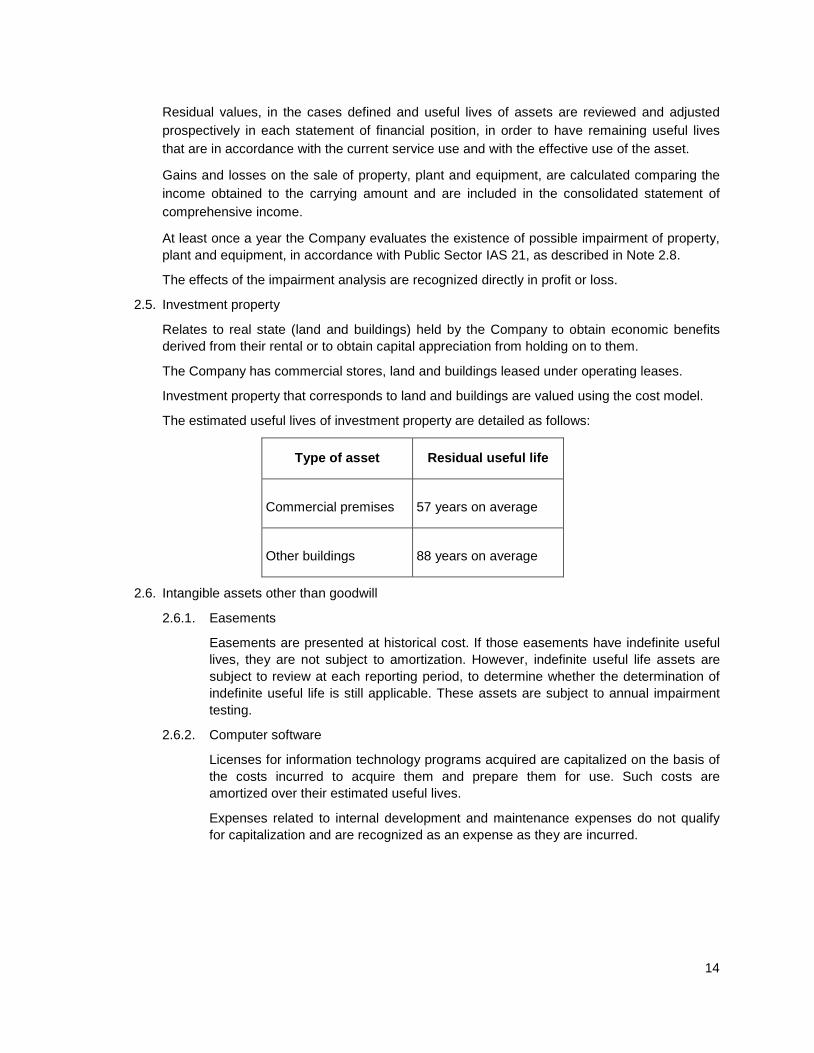
The estimated useful lives of investment property are detailed as follows:
Type of asset Residual useful life
Commercial premises 57 years on average
Other buildings 88 years on average
2.6. Intangible assets other than goodwill
2.6.1. Easements
Easements are presented at historical cost. If those easements have indefinite useful lives, they are not subject to amortization. However, indefinite useful life assets are subject to review at each reporting period, to determine whether the determination of indefinite useful life is still applicable. These assets are subject to annual impairment testing.
2.6.2. Computer software
Licenses for information technology programs acquired are capitalized on the basis of the costs incurred to acquire them and prepare them for use. Such costs are amortized over their estimated useful lives.
Expenses related to internal development and maintenance expenses do not qualify for capitalization and are recognized as an expense as they are incurred.
15
2.7. Finance income and finance costs
Finance income, composed of interest from investing cash and cash equivalents, from derivative transactions and other finance income is recognized in the Consolidated Statement of Comprehensive Income over the term of the financial instrument, using the effective interest method and fair value in the case of derivative transactions.
Finance costs, both interest and expenses on bank loans, obligations with the public, bonds and other finance expenses are recognized in the Consolidated Statement of Comprehensive Income over the term of the debt using the effective interest method. Costs of interest incurred in the construction of any asset qualified as Property, plant and equipment, are capitalized over the period necessary to complete the asset for its intended use. Other interest costs are recorded as an expense in the consolidated statement of comprehensive income.
2.8. Losses due to impairment of non-financial assets
Since the Company is a state-owned entity, its business model is oriented toward public service with emphasis on social benefits. It has an operating, services and infrastructure operation model, which means that its main source of income is established through a technical tariff, determined by the authority that does not cover recovery of its assets.
This business model defined by its shareholders, the Ministry of Finance (Ministerio de Hacienda) and the Corporación de Fomento de la Producción, or CORFO, goes against the concept of economic profitability of assets, as per IAS 36, where the value of use corresponds to the present value of estimated future cash flows expected to be obtained from the operation of the assets.
Therefore, the Company formally requested authorization from the SVS to apply IPSAS 21 instead of IAS 36, which is a standard that is specifically for State-owned entities with assets that are not cash generating. Through Ordinary Official Letter 6158 dated March 5, 2012 the SVS authorized the Company to apply IPSAS 21 to assess the impairment of its assets.
The application of this standard allows the financial statements of the Company present its economic and financial reality, and enables it to compare the carrying amount to the replacement cost.
This standard defines the value of use of a non-cash generating asset as the present value of an asset maintaining its potential service. This is determined using depreciated replacement cost or cost of reinstatement methods.
However, under specific circumstances in which certain assets lose their service potential, the loss of value is recognized directly in income.
2.9. Financial assets
The Company classifies its financial assets in the following categories: financial assets at fair value through profit or loss, loans and accounts receivable, financial assets held to maturity and available-for-sale assets. The classification depends on the purpose for which the financial assets were acquired. Management determines the classification of its financial assets at the time of their initial recognition.
16
In accordance with IFRS 7 "Financial Instruments: Disclosure", we consider that the carrying amounts of assets valued at amortized cost are a reasonable approximation of their fair value, therefore, as indicated in IFRS 7, it is no necessary to provide disclosures related to fair value for each of them.
2.9.1. Financial assets at fair value through profit or loss
They are financial assets held for trading. A financial asset is designated as at fair value through profit or loss if it was acquired mainly with the purpose of selling it in the short term. Derivatives are also included in this category unless they are designated as hedges. Assets classified in this category are classified as non-current assets and obligations for accrued interest is classified as current.
2.9.2. Loans and receivables
Loans and accounts receivables are non-derivative financial assets, with fixed or determinable payments, that are not traded in the local financial market. They are included in current assets, except for those maturing in excess of 12 months as of the date of the statement of financial position, which are classified as non-current assets. Loans and accounts receivable include trade and other accounts receivable. These items are initially recorded at fair value plus any directly attributable transaction costs. These are subsequently valued at amortized cost, using the effective interest method less impairment losses.
2.9.3. Financial assets held to maturity
They are non-derivative financial assets, with fixed or determinable payments and fixed maturity date that the Company owns and which it has the intention and capacity to hold to maturity. They are valued at amortized cost.
2.9.4. Financial assets available-for-sale
Financial assets available-for-sale are non-derivative financial assets that are designated under this category or do not classify for any of the other categories. They are included in non-current assets unless management has the intention of disposing of the investment within the 12 months following the date of the statement of financial position.
2.9.5. Recognition and measurement of financial assets
Financial assets and liabilities are initially recognized at their fair value. In the case of assets and liabilities that are not accounted for at fair value through profit or loss, the fair value shall be adjusted by the cost of transactions that are directly attributable to their purchase or issuance.
Subsequent valuation depends on the category in which the asset has been classified.
17
Financial assets at fair value through profit or loss: A financial asset is recorded at fair value through profit or loss if it is classified as held-for-trading or is designated as such upon initial recognition. Directly attributable transaction costs are recognized in profit or loss as incurred. Financial assets recorded at fair value through adjustments in profit or loss are measured at fair value and changes therein, including any interest or dividend income, are recognized in profit or loss.
Loans and receivables: These assets are initially recognized at fair value plus any directly attributable transaction costs. Subsequent to initial recognition, loans and receivables are measured at amortized cost using the effective interest method.
Held-to maturity financial assets: These assets are initially recognized at fair value plus any directly attributable transaction costs. Subsequent to initial recognition, they are measured at amortized cost using the effective interest method.
Available-for-sale financial assets: These assets are initially recognized at fair value plus any directly attributable transaction costs. Subsequent to initial recognition, they are measured at fair value and the changes therein, other than impairment losses and foreign currency differences on debt instruments are recognized in other comprehensive income and accumulated in the fair value reserve. When these assets are derecognized, the gain or loss accumulated in equity is reclassified to profit or loss.
When a derivative financial instrument is not designated for a relationship that qualifies as a hedge, all changes in fair value are recognized immediately in income.
Profits and losses that arise from changes in the fair value of financial assets at fair value through profit or loss are included in the income statement under other profits (losses), in the period in which such changes to fair value have occurred.
Investments are derecognized in the accounting when the rights to receive their cash flows have expired or have been transferred and the Company has substantially transferred all the risks and advantages derived from its ownership of such investments.
At each date of the statement of financial position, the Company evaluates whether there is objective evidence that a financial asset, or a group of financial assets, might have suffered impairment losses.
2.10. Inventories
Inventories correspond to spare/parts required for the operations and which are estimated to be used or consumed during one year.
Inventory is valued initially at acquisition cost. Inventory items are subsequently valued at the lower of cost value or net realizable value. Cost is determined using their weighted average purchase price.
Spare parts classified as inventory are adjusted to their net realizable value, recognizing their technological obsolescence with a direct charge to profit or loss.
18
2.11. Trade and other receivables
Trade and other receivable are initially recognized at their fair value (nominal value that includes implicit interest) and thereafter at their amortized cost using the effective interest method, less impairment losses. An impairment loss provision is established for trade accounts receivable when there is objective evidence that the Company will not be able to collect all the amounts owed to it in accordance with the original terms of the account receivable. The amount of the provision is the difference between the carrying amount of the asset and the real value of estimated future cash flows discounted at the effective interest rate.
Trade receivables are netted against the allowance for doubtful accounts and the amount of losses is recognized with a charge to the Consolidated Statement of Comprehensive Income.
2.12. Cash and cash equivalents
Cash and cash equivalents include cash, checking account balances, term deposits and other highly liquid short-term investments with original maturities of three months or less.
2.13. Share capital
The Company´s share capital is represented by Series A and Series B common shares.
2.14. Trade and other payables
Suppliers and other accounts payable are initially recognized at their fair value net of directly attributable costs. They are subsequently valued at amortized cost.
2.15. Other financial liabilities
Loans, obligations with the public and other financial liabilities of a similar nature are initially recognized at their fair value net of the costs incurred in the original transaction. They are subsequently valued at their amortized cost and any difference between the proceeds obtained by the Company (net of the costs necessary to obtain them) and their reimbursement value is recognized in the Consolidated Statement of Comprehensive Income during the term of the debt using the effective interest method.
Financial obligations are classified as current liabilities and non-current liabilities in accordance with the contractual maturity date of the nominal principal.
For loans with financial institutions the nominal rate is similar to the effective rate, since there are no additional transaction costs that must be taken into consideration.
19
2.16. Income tax and deferred taxes
The income tax provision is determined through the application of the tax rate on the taxable net income base for the period, after applying the permitted tax deductions, plus variations in deferred tax assets and liabilities and tax credits.
Differences between the carrying amount of the assets and liabilities and their tax base generate deferred tax assets or liabilities balances, which are calculated using the tax rates that are expected to be in force when the assets and liabilities are realized.
The tax regime that will apply to the Company starting from January 1, 2017, as a stock company not related to final taxpayers, is the corporate income tax associated with profit generated from the performance of its business activities.
The deferred tax rate is measured using the tax rates expected to be applicable to the temporary differences in the period when they are reversed using tax rates that by default will be applicable to the Company at the reporting date.
Deferred tax assets are reviewed at each reporting date and are reduced to the extent that it is no longer probable that the related tax benefit will be realized. (See Note 18).
2.17. Employee benefits
2.17.1. Accrued vacations The Company recognizes accrued vacation expenses using the accrual method.
2.17.2. Severance indemnity payments The Company has created provisions for its obligations to pay severance indemnity payments to all employees whose contracts and collective agreements state that they are entitled to this benefit in all cases. The liability recognized is the present value of that obligation plus/minus adjustments on actuarial profits or losses and discounted debt service. The present value of the obligation is determined by discounting estimated outgoing cash flows, at a market interest rate for long-term debt instruments that approximates the term of the termination benefits obligation up to their expiration date.
2.17.3. Incentive bonuses The Company has an annual incentive bonus plan for compliance with objectives, based on the individual conditions of each employment contract. These incentives consist of a percentage of the applicable monthly salary and are accrued on the basis of the estimated amount to be paid.
20
2.18. Provisions
The Company recognizes provisions when:
It has a present obligation, legal or implicit, as a result of past events;
It is probable that an outflow of resources will be necessary to settle the obligation; and
The amount of the obligation can be estimated reliably.
The amount recognized as a provision must be the best estimate of the disbursement necessary to pay the present obligation at the end of the reporting period.
2.19. Classification of balances (current and non-current)
In the consolidated classified statements of financial position, balances are classified as current when the maturity is equal to twelve months or less from the cut-off date of the Consolidated Financial Statements and as non-current, when it is in excess of that period.
2.20. Revenue and expenses recognition
Revenue is recognized when it is probable that the economic benefit associated with the compensation received or to be received, will flow to the Company and the amount can be reliably measured. The Company recognizes revenues at their fair value, net of value added tax, returns, rebates and discounts.
a) Revenue from transportation of passengers is recognized when the service has been provided.
b) Revenue from operating leases is recognized on an accrual basis.
c) Income from sale of assets relates to exceptional sales of items of property, plant and equipment and is recognized when the asset has been delivered to the client and there is no pending obligation to be fulfilled that might affect its acceptance.
d) Revenue from interest is recognized using the effective interest rate method.
e) Other revenue is recognized when the services have been rendered.
Expenses include both the losses and expenses that arise from the Company's ordinary activities. Expenses also include cost of sales, remuneration and depreciation. Generally, expenses represent an outflow or decrease in assets, such as cash and cash equivalent and inventory or property, plant and equipment.
2.21. Lease agreements
The Company has a contract that has the characteristics of a financial lease, which has been recorded as established in IAS 17 "Leases". When assets are leased under a financial lease agreement, the value of the lease payments is recognized as an account receivable. The difference between the gross amount receivable and the real value of the amount is recognized as financial yield of the principal.
Income from financial leases is recognized over the term of the lease using the net investment method, which reflects a constant periodic yield rate.
Contracts that do not fulfill the characteristics of a financial lease are classified as operating leases.
21
A lease is an operating lease when the lessor conserves a significant part of the risks and benefits derived from ownership of the leased goods.
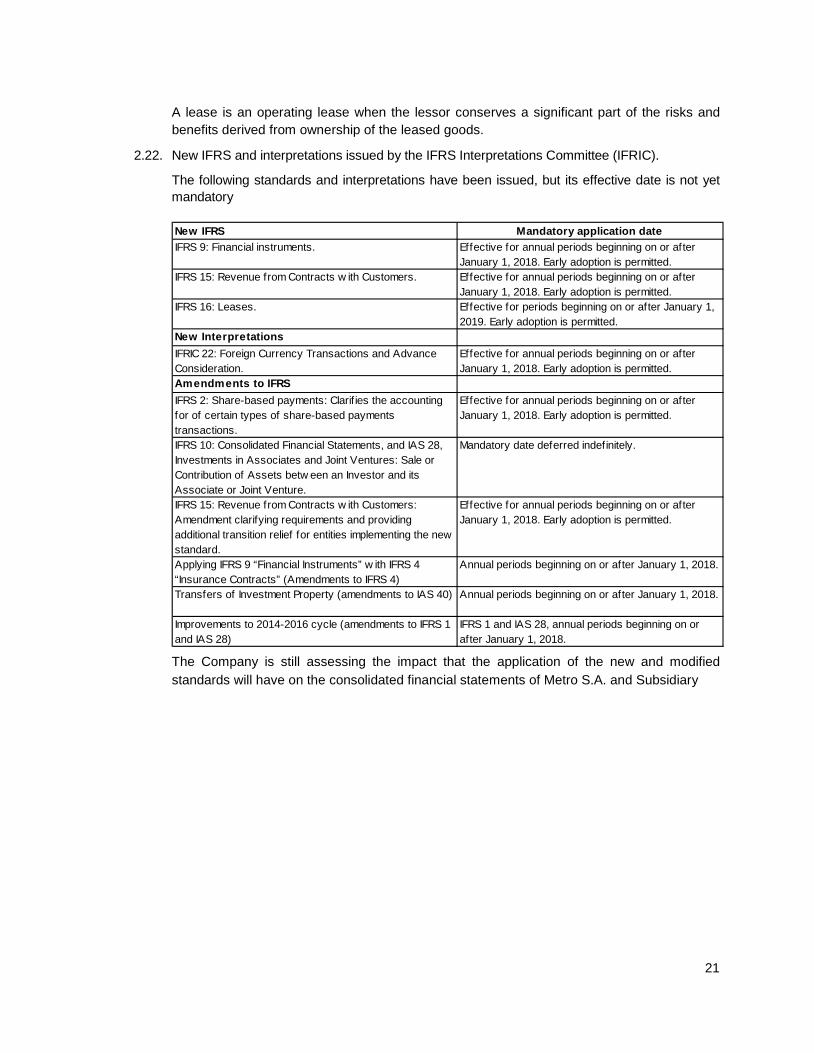
2.22. New IFRS and interpretations issued by the IFRS Interpretations Committee (IFRIC).
The following standards and interpretations have been issued, but its effective date is not yet mandatory
New IFRS Mandatory application dateIFRS 9: Financial instruments. Effective for annual periods beginning on or after
January 1, 2018. Early adoption is permitted.IFRS 15: Revenue from Contracts w ith Customers. Effective for annual periods beginning on or after
January 1, 2018. Early adoption is permitted.IFRS 16: Leases. Effective for periods beginning on or after January 1,
2019. Early adoption is permitted.New InterpretationsIFRIC 22: Foreign Currency Transactions and Advance Consideration.
Effective for annual periods beginning on or after January 1, 2018. Early adoption is permitted.
Amendments to IFRSIFRS 2: Share-based payments: Clarif ies the accounting for of certain types of share-based payments transactions.
Effective for annual periods beginning on or after January 1, 2018. Early adoption is permitted.
IFRS 10: Consolidated Financial Statements, and IAS 28, Investments in Associates and Joint Ventures: Sale or Contribution of Assets betw een an Investor and its Associate or Joint Venture.
Mandatory date deferred indefinitely.
IFRS 15: Revenue from Contracts w ith Customers: Amendment clarifying requirements and providing additional transition relief for entities implementing the new standard.
Effective for annual periods beginning on or after January 1, 2018. Early adoption is permitted.
Applying IFRS 9 “Financial Instruments” w ith IFRS 4 “Insurance Contracts” (Amendments to IFRS 4)
Annual periods beginning on or after January 1, 2018.
Transfers of Investment Property (amendments to IAS 40) Annual periods beginning on or after January 1, 2018.
Improvements to 2014-2016 cycle (amendments to IFRS 1 and IAS 28)
IFRS 1 and IAS 28, annual periods beginning on or after January 1, 2018.
The Company is still assessing the impact that the application of the new and modified standards will have on the consolidated financial statements of Metro S.A. and Subsidiary
22
3. Management estimates and accounting criteria
The estimates and criteria used by management are continuously assessed and are based on historical experience and other factors, including the expectation of occurrence of future events that are considered reasonable based on the circumstances.
The most relevant management estimates and accounting criteria are detailed as follows:
3.1. Severance indemnity payments
The Company recognizes a liability for the agreed upon obligations for severance payments using an actuarial methodology that considers factors such as the discount rate, effective turnover and other factors inherent to the Company. Any change in these factors and assumptions, shall have an impact on the carrying amount of the severance obligation.
The Company determines the discount rate at the end of each year considering the market conditions as of the valuation date. This interest rate is used to determine the present value of estimated future cash outflows required to settle the severance obligation. When determining interest rates, the Company considers representative rates of financial instruments that are denominated in the currency in which the obligation is expressed and which have expiry terms that are close to the payment terms of such obligation.
Actuarial gains and losses arise from variances between estimated and actual performance of actuarial assumptions or the restatement of established actuarial assumptions, which are reported directly in Other Comprehensive Income for the period.
3.2. Useful life of property, plant and equipment
Property, plant and equipment and intangible assets with finite useful lives are depreciated using the straight-line method on the basis of an estimated useful life. Such estimate takes into consideration technical aspects, nature and conditions of use of those assets and might vary significantly as a consequence of technological innovations or other variables, which will imply adjusting the remaining useful lives, recognizing higher or lower depreciation, as applicable. Likewise, residual values are determined based on technical aspects that might vary in accordance with the specific conditions of each asset.
3.3. Litigation and other contingencies
The Company is involved in different types of legal and administrative proceedings for which it is not possible to exactly determine the economic effect that their outcome might have on the consolidated financial statements of the Company. In cases where the Company’s management and legal counsel expect an unfavorable outcome, provisions have been established with a charge to expenses based on estimates of the maximum amounts to be paid.
23
3.4. Measurements and/or valuations at fair value
The fair value is the price that would be received for selling an asset or paid for transferring a liability in an orderly transaction between market participants on the measurement date. The Company uses the assumptions that market participants would use when establishing the price of the asset or liability under current market conditions, including assumptions regarding risk. To measure fair value the following must be determined:
a) the concrete asset or liability to be measured.
b) for a non-financial asset, the maximum and best use of the asset and if the asset is used in combination with other assets or in an independent manner.
c) the market in which an orderly transaction would take place for the asset or liability; and
d) the appropriate valuation technique(s) to be used when measuring fair value. The valuation technique(s) used must maximize the use of relevant observable entry data and minimize non-observable entry data.
Market value hierarchies for items at fair value:
Each of the market values for the financial instruments is supported by a methodology for calculation and entry of information. Each of them has been analyzed to determine at which of the following levels they can be allocated:
Level 1, corresponds to methodologies using market units (without adjustment) in active markets and considering the same assets and liabilities valued.
Level 2, corresponds to methodologies using market trading data, not included in Level 1, which are observable for the assets and liabilities valued, whether directly (prices) or indirectly (derived from prices).
Level 3, corresponds to methodologies using valuation techniques, which include data on the assets and liabilities valued, which are not supported on observable market data.
The Company measures and/or evaluates all financial instruments at their fair value upon initial measurement and they are subsequently valued at amortized cost, except for derivative transactions and cross currency swaps (CCS), which continue to be valued at their fair value after their initial recognition.
The Company hierarchically classifies its measurement of fair value under level 2, as established in IFRS 13, and the costs of transactions attributable to those instruments are recognized in income as they are incurred.
In all cases changes in the fair value of these items are considered components of net income for the period.
Valuation techniques used to measure fair value for assets and liabilities.
24
The valuation techniques used by the Company are appropriate under the circumstances and there is sufficient data available on the Company’s assets and liabilities to measure their fair value, maximizing the use of observable variables and minimizing the use of non-observable variables. The specific technique used by the Company to valuate and/or measure the fair value of its assets (derivative financial instruments) is the discounted cash flow method, based on market demand curves.
Entry data for fair value measurement:
Level 1:
Quoted prices (unadjusted) in active markets for identical assets or liabilities.
Level 2:
Quoted prices for identical or similar assets in markets that are not active.
Variables other than quoted prices that is observable for the asset, for example: Interest rates, observable yield curves at commonly quoted intervals and implicit volatilities.
Level 3:
Unobservable inputs.
Items where gains (losses) are recognized on fair value measurements.
Income items where gains (losses) are recognized on fair value measurements are recognized as other gains (losses).
Fair value measurement for assets and liabilities.
A fair value measurement requires determining the particular asset or liability to be measured (Derivative financial instruments). This is why, when measuring fair value the Company keeps in mind the characteristics of the asset or liability in the same manner as market participants would take into account when establishing the price of that asset or liability on the measurement date. The characteristics include the restrictions for asset recognition or the payment of the liability (if any).
25
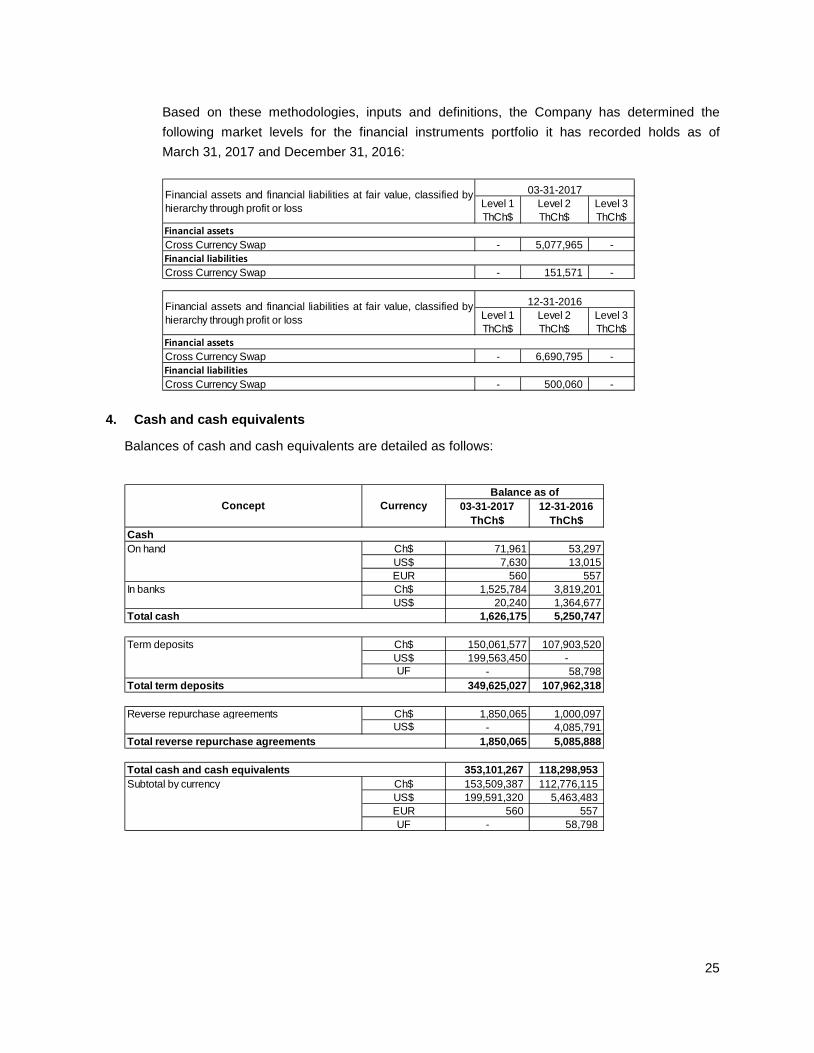
Based on these methodologies, inputs and definitions, the Company has determined the following market levels for the financial instruments portfolio it has recorded holds as of March 31, 2017 and December 31, 2016:
Level 1 ThCh$
Level 2 ThCh$
Level 3 ThCh$
Financial assetsCross Currency Swap - 5,077,965 -Financial liabilitiesCross Currency Swap - 151,571 -
Level 1 ThCh$
Level 2 ThCh$
Level 3 ThCh$
Financial assetsCross Currency Swap - 6,690,795 -Financial liabilitiesCross Currency Swap - 500,060 -
Financial assets and financial liabilities at fair value, classified byhierarchy through profit or loss
03-31-2017
Financial assets and financial liabilities at fair value, classified byhierarchy through profit or loss
12-31-2016
4. Cash and cash equivalents
Balances of cash and cash equivalents are detailed as follows:
03-31-2017 12-31-2016ThCh$ ThCh$
CashOn hand Ch$ 71,961 53,297
US$ 7,630 13,015EUR 560 557
In banks Ch$ 1,525,784 3,819,201US$ 20,240 1,364,677
Total cash 1,626,175 5,250,747
Term deposits Ch$ 150,061,577 107,903,520US$ 199,563,450 -UF - 58,798
Total term deposits 349,625,027 107,962,318
Reverse repurchase agreements Ch$ 1,850,065 1,000,097US$ - 4,085,791
Total reverse repurchase agreements 1,850,065 5,085,888
Total cash and cash equivalents 353,101,267 118,298,953Subtotal by currency Ch$ 153,509,387 112,776,115
US$ 199,591,320 5,463,483EUR 560 557UF - 58,798
Concept CurrencyBalance as of
26
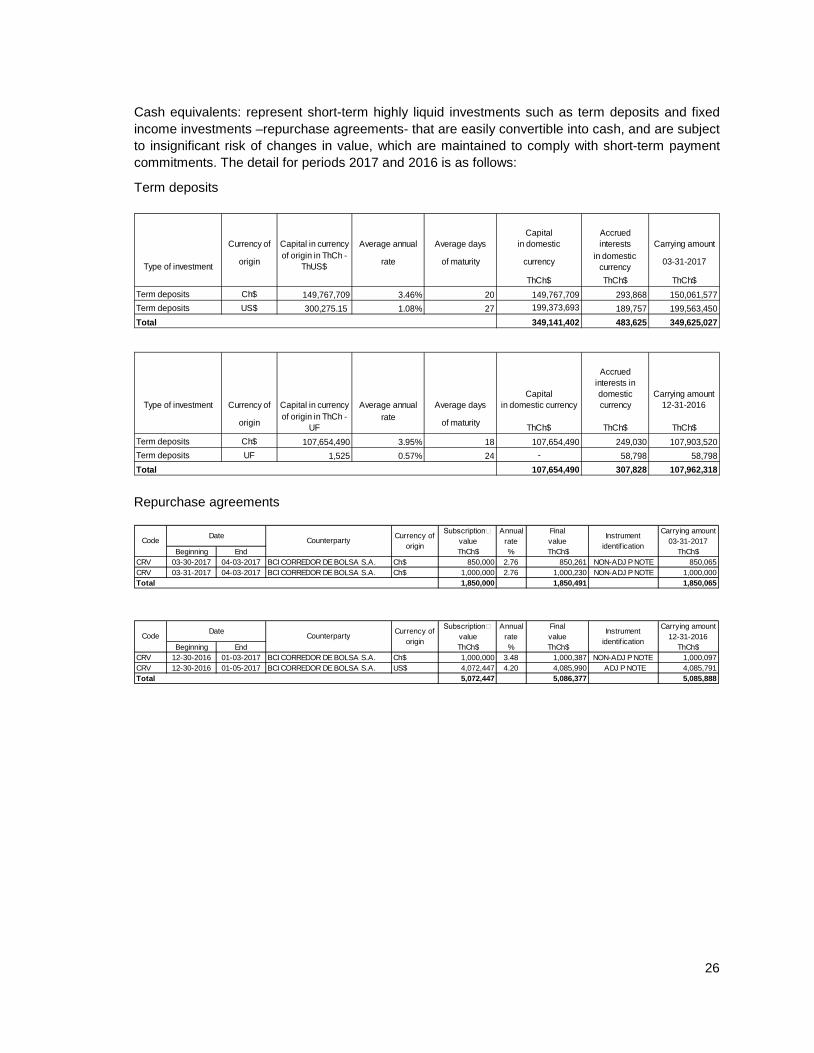
Cash equivalents: represent short-term highly liquid investments such as term deposits and fixed income investments –repurchase agreements- that are easily convertible into cash, and are subject to insignificant risk of changes in value, which are maintained to comply with short-term payment commitments. The detail for periods 2017 and 2016 is as follows:
Term deposits
Currency of Capital in currency Average annual Average daysCapital
in domesticAccrued interests Carrying amount
Type of investment originof origin in ThCh -
ThUS$ rate of maturity currency in domesticcurrency 03-31-2017
ThCh$ ThCh$ ThCh$Term deposits Ch$ 149,767,709 3.46% 20 149,767,709 293,868 150,061,577Term deposits US$ 300,275.15 1.08% 27 199,373,693 189,757 199,563,450Total 349,141,402 483,625 349,625,027
Type of investment Currency of Capital in currency Average annual Average daysCapital
in domestic currency
Accrued interests in domesticcurrency
Carrying amount12-31-2016
originof origin in ThCh -
UFrate of maturity ThCh$ ThCh$ ThCh$
Term deposits Ch$ 107,654,490 3.95% 18 107,654,490 249,030 107,903,520Term deposits UF 1,525 0.57% 24 - 58,798 58,798Total 107,654,490 307,828 107,962,318
Repurchase agreements
Subscription Annual Final Carrying amount value rate value 03-31-2017
Beginning End ThCh$ % ThCh$ ThCh$CRV 03-30-2017 04-03-2017 BCI CORREDOR DE BOLSA S.A. Ch$ 850,000 2.76 850,261 NON-ADJ P NOTE 850,065CRV 03-31-2017 04-03-2017 BCI CORREDOR DE BOLSA S.A. Ch$ 1,000,000 2.76 1,000,230 NON-ADJ P NOTE 1,000,000
1,850,000 1,850,491 1,850,065
Subscription Annual Final Carrying amount value rate value 12-31-2016
Beginning End ThCh$ % ThCh$ ThCh$CRV 12-30-2016 01-03-2017 BCI CORREDOR DE BOLSA S.A. Ch$ 1,000,000 3.48 1,000,387 NON-ADJ P NOTE 1,000,097CRV 12-30-2016 01-05-2017 BCI CORREDOR DE BOLSA S.A. US$ 4,072,447 4.20 4,085,990 ADJ P NOTE 4,085,791
5,072,447 5,086,377 5,085,888
Code Date Counterparty Currency of origin
Instrument identif ication
Total
Code Date Counterparty Currency of origin
Instrument identif ication
Total
27
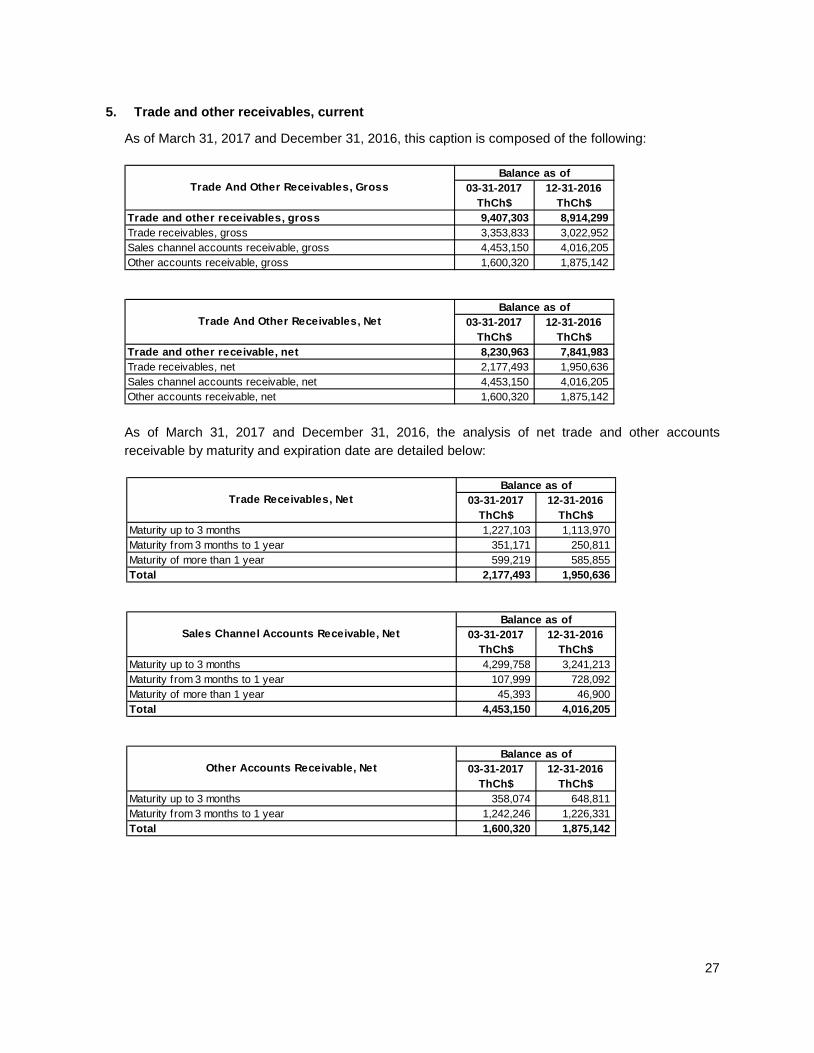
5. Trade and other receivables, current
As of March 31, 2017 and December 31, 2016, this caption is composed of the following:
03-31-2017 ThCh$
12-31-2016 ThCh$
Trade and other receivables, gross 9,407,303 8,914,299Trade receivables, gross 3,353,833 3,022,952Sales channel accounts receivable, gross 4,453,150 4,016,205Other accounts receivable, gross 1,600,320 1,875,142
03-31-2017 ThCh$
12-31-2016 ThCh$
Trade and other receivable, net 8,230,963 7,841,983Trade receivables, net 2,177,493 1,950,636Sales channel accounts receivable, net 4,453,150 4,016,205Other accounts receivable, net 1,600,320 1,875,142
Trade And Other Receivables, GrossBalance as of
Trade And Other Receivables, NetBalance as of
As of March 31, 2017 and December 31, 2016, the analysis of net trade and other accounts receivable by maturity and expiration date are detailed below:
03-31-2017 ThCh$
12-31-2016 ThCh$
Maturity up to 3 months 1,227,103 1,113,970Maturity from 3 months to 1 year 351,171 250,811Maturity of more than 1 year 599,219 585,855Total 2,177,493 1,950,636
03-31-2017 ThCh$
12-31-2016 ThCh$
Maturity up to 3 months 4,299,758 3,241,213Maturity from 3 months to 1 year 107,999 728,092Maturity of more than 1 year 45,393 46,900Total 4,453,150 4,016,205
03-31-2017 ThCh$
12-31-2016 ThCh$
Maturity up to 3 months 358,074 648,811Maturity from 3 months to 1 year 1,242,246 1,226,331Total 1,600,320 1,875,142
Balance as of
Other Accounts Receivable, NetBalance as of
Trade Receivables, NetBalance as of
Sales Channel Accounts Receivable, Net
28
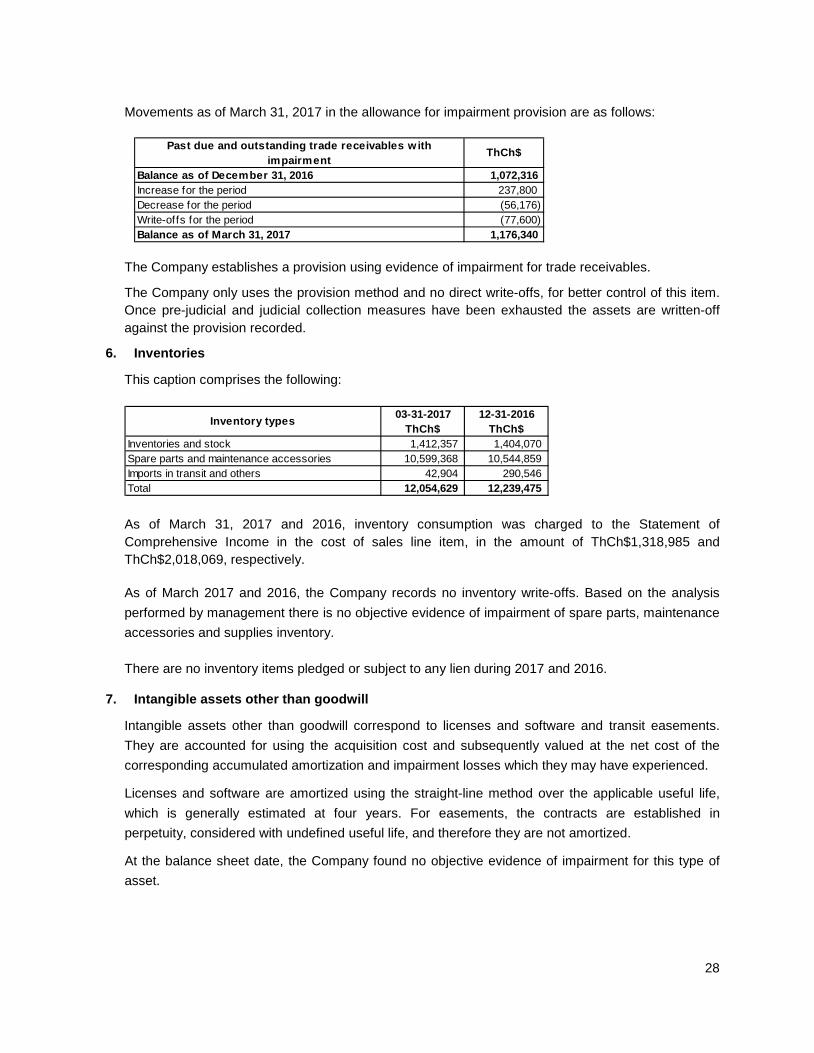
Movements as of March 31, 2017 in the allowance for impairment provision are as follows:
Past due and outstanding trade receivables w ith impairment
ThCh$
Balance as of December 31, 2016 1,072,316Increase for the period 237,800Decrease for the period (56,176)Write-offs for the period (77,600)Balance as of March 31, 2017 1,176,340
The Company establishes a provision using evidence of impairment for trade receivables.
The Company only uses the provision method and no direct write-offs, for better control of this item. Once pre-judicial and judicial collection measures have been exhausted the assets are written-off against the provision recorded.
6. Inventories
This caption comprises the following:
03-31-2017 12-31-2016ThCh$ ThCh$
Inventories and stock 1,412,357 1,404,070Spare parts and maintenance accessories 10,599,368 10,544,859Imports in transit and others 42,904 290,546Total 12,054,629 12,239,475
Inventory types
As of March 31, 2017 and 2016, inventory consumption was charged to the Statement of Comprehensive Income in the cost of sales line item, in the amount of ThCh$1,318,985 and ThCh$2,018,069, respectively.
As of March 2017 and 2016, the Company records no inventory write-offs. Based on the analysis performed by management there is no objective evidence of impairment of spare parts, maintenance accessories and supplies inventory.
There are no inventory items pledged or subject to any lien during 2017 and 2016.
7. Intangible assets other than goodwill
Intangible assets other than goodwill correspond to licenses and software and transit easements. They are accounted for using the acquisition cost and subsequently valued at the net cost of the corresponding accumulated amortization and impairment losses which they may have experienced.
Licenses and software are amortized using the straight-line method over the applicable useful life, which is generally estimated at four years. For easements, the contracts are established in perpetuity, considered with undefined useful life, and therefore they are not amortized.
At the balance sheet date, the Company found no objective evidence of impairment for this type of asset.
29
The items within the Consolidated Statement of Comprehensive Income that include amortization of intangible assets with finite useful lives are in the cost of sales and administrative expenses line items.
There are no intangible assets with ownership restrictions or that provide security for any liabilities of the Company.
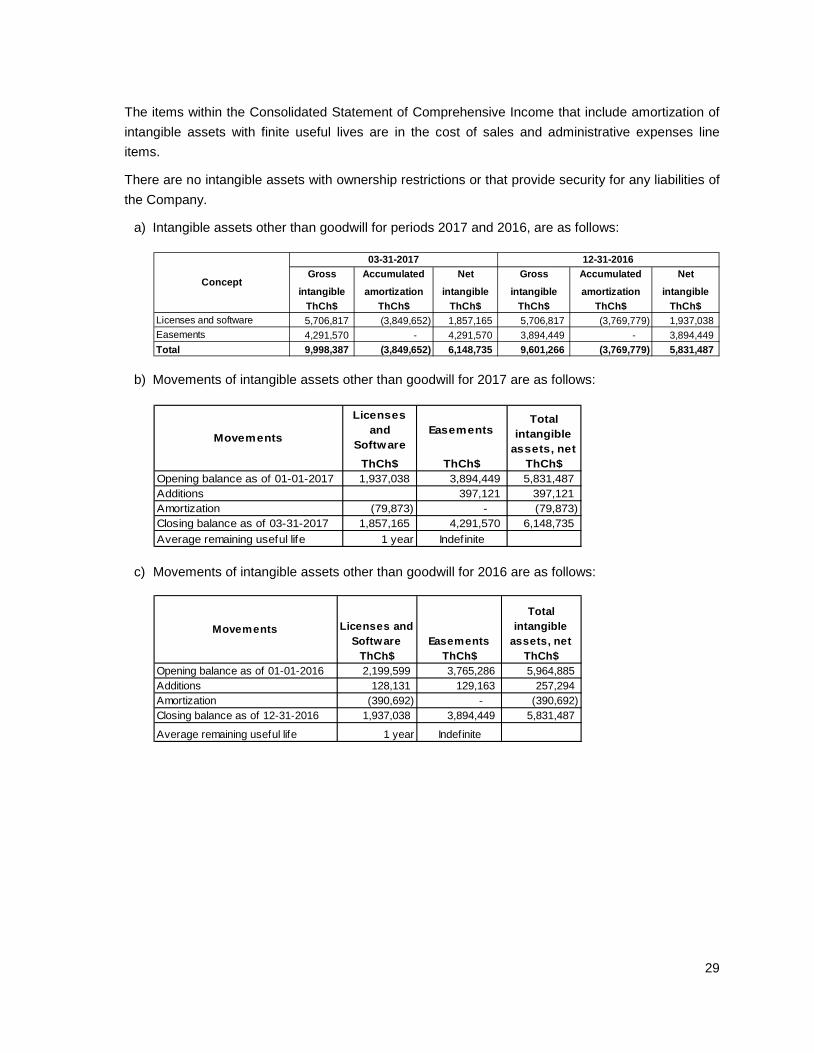
a) Intangible assets other than goodwill for periods 2017 and 2016, are as follows:
Gross intangible
Accumulated amortization
Net intangible
Gross intangible
Accumulated amortization
Net intangible
ThCh$ ThCh$ ThCh$ ThCh$ ThCh$ ThCh$Licenses and software 5,706,817 (3,849,652) 1,857,165 5,706,817 (3,769,779) 1,937,038Easements 4,291,570 - 4,291,570 3,894,449 - 3,894,449Total 9,998,387 (3,849,652) 6,148,735 9,601,266 (3,769,779) 5,831,487
Concept
03-31-2017 12-31-2016
b) Movements of intangible assets other than goodwill for 2017 are as follows:
ThCh$ ThCh$ ThCh$Opening balance as of 01-01-2017 1,937,038 3,894,449 5,831,487Additions 397,121 397,121Amortization (79,873) - (79,873)Closing balance as of 03-31-2017 1,857,165 4,291,570 6,148,735Average remaining useful life 1 year Indefinite
EasementsTotal
intangible assets, net
Movements
Licenses and
Software
c) Movements of intangible assets other than goodwill for 2016 are as follows:
ThCh$ ThCh$ ThCh$Opening balance as of 01-01-2016 2,199,599 3,765,286 5,964,885Additions 128,131 129,163 257,294Amortization (390,692) - (390,692)Closing balance as of 12-31-2016 1,937,038 3,894,449 5,831,487
Average remaining useful life 1 year Indefinite
Easements
Total intangible
assets, netMovements Licenses and
Software
30
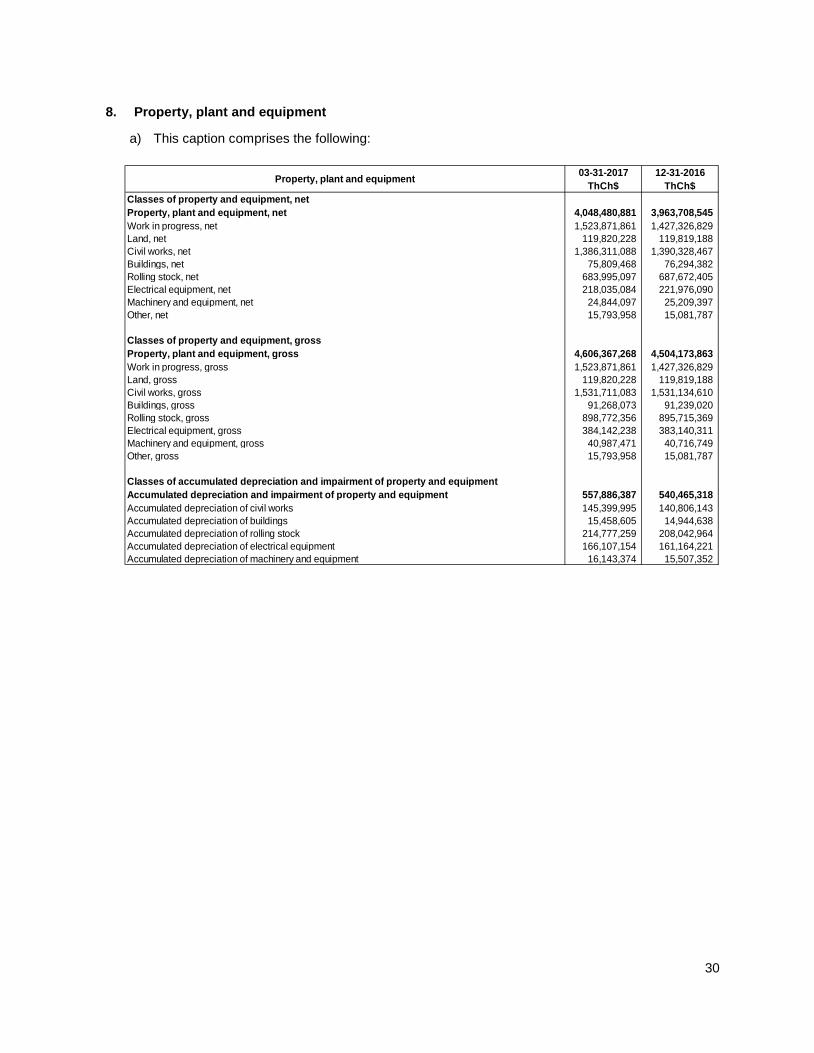
8. Property, plant and equipment
a) This caption comprises the following:
03-31-2017 12-31-2016ThCh$ ThCh$
Classes of property and equipment, netProperty, plant and equipment, net 4,048,480,881 3,963,708,545Work in progress, net 1,523,871,861 1,427,326,829Land, net 119,820,228 119,819,188Civil works, net 1,386,311,088 1,390,328,467Buildings, net 75,809,468 76,294,382Rolling stock, net 683,995,097 687,672,405Electrical equipment, net 218,035,084 221,976,090Machinery and equipment, net 24,844,097 25,209,397Other, net 15,793,958 15,081,787
Classes of property and equipment, grossProperty, plant and equipment, gross 4,606,367,268 4,504,173,863Work in progress, gross 1,523,871,861 1,427,326,829Land, gross 119,820,228 119,819,188Civil works, gross 1,531,711,083 1,531,134,610Buildings, gross 91,268,073 91,239,020Rolling stock, gross 898,772,356 895,715,369Electrical equipment, gross 384,142,238 383,140,311Machinery and equipment, gross 40,987,471 40,716,749Other, gross 15,793,958 15,081,787
Classes of accumulated depreciation and impairment of property and equipmentAccumulated depreciation and impairment of property and equipment 557,886,387 540,465,318Accumulated depreciation of civil works 145,399,995 140,806,143Accumulated depreciation of buildings 15,458,605 14,944,638Accumulated depreciation of rolling stock 214,777,259 208,042,964Accumulated depreciation of electrical equipment 166,107,154 161,164,221Accumulated depreciation of machinery and equipment 16,143,374 15,507,352
Property, plant and equipment
31
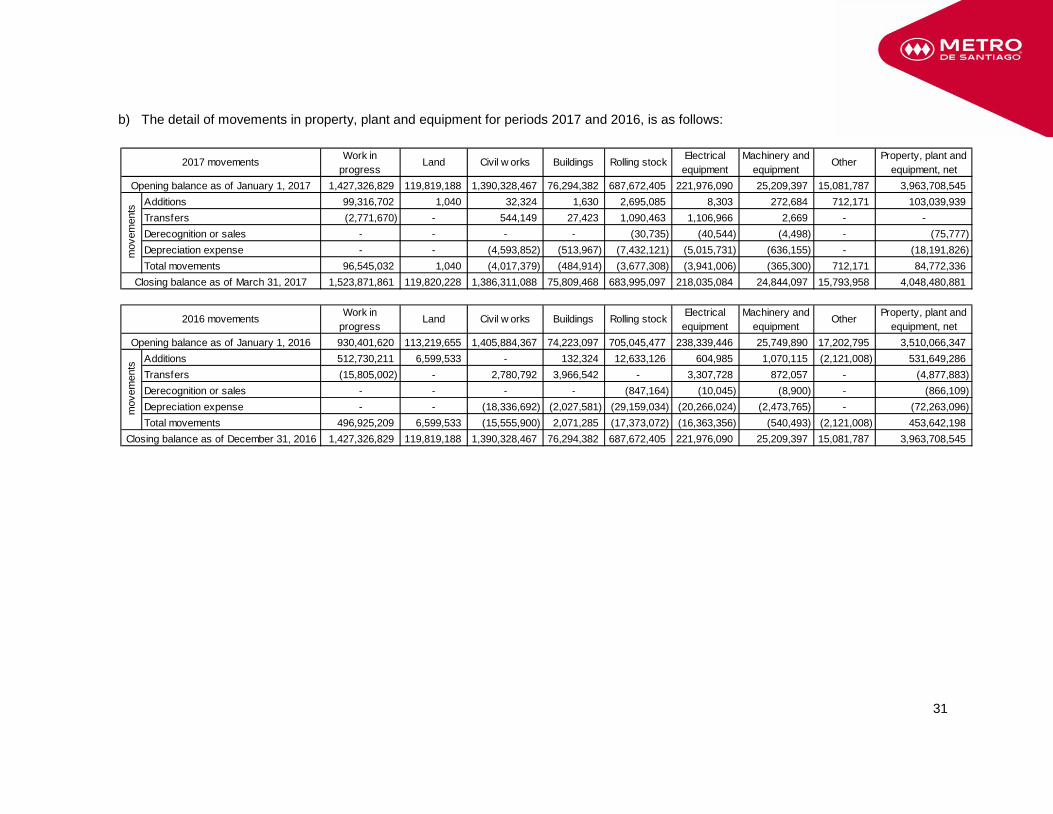
b) The detail of movements in property, plant and equipment for periods 2017 and 2016, is as follows:
Work in progress
Land Civil w orks Buildings Rolling stock Electrical equipment
Machinery and equipment
Other Property, plant and equipment, net
1,427,326,829 119,819,188 1,390,328,467 76,294,382 687,672,405 221,976,090 25,209,397 15,081,787 3,963,708,545Additions 99,316,702 1,040 32,324 1,630 2,695,085 8,303 272,684 712,171 103,039,939Transfers (2,771,670) - 544,149 27,423 1,090,463 1,106,966 2,669 - -Derecognition or sales - - - - (30,735) (40,544) (4,498) - (75,777)Depreciation expense - - (4,593,852) (513,967) (7,432,121) (5,015,731) (636,155) - (18,191,826)Total movements 96,545,032 1,040 (4,017,379) (484,914) (3,677,308) (3,941,006) (365,300) 712,171 84,772,336
1,523,871,861 119,820,228 1,386,311,088 75,809,468 683,995,097 218,035,084 24,844,097 15,793,958 4,048,480,881
Work in progress
Land Civil w orks Buildings Rolling stock Electrical equipment
Machinery and equipment
Other Property, plant and equipment, net
930,401,620 113,219,655 1,405,884,367 74,223,097 705,045,477 238,339,446 25,749,890 17,202,795 3,510,066,347Additions 512,730,211 6,599,533 - 132,324 12,633,126 604,985 1,070,115 (2,121,008) 531,649,286Transfers (15,805,002) - 2,780,792 3,966,542 - 3,307,728 872,057 - (4,877,883)Derecognition or sales - - - - (847,164) (10,045) (8,900) - (866,109)Depreciation expense - - (18,336,692) (2,027,581) (29,159,034) (20,266,024) (2,473,765) - (72,263,096)Total movements 496,925,209 6,599,533 (15,555,900) 2,071,285 (17,373,072) (16,363,356) (540,493) (2,121,008) 453,642,198
1,427,326,829 119,819,188 1,390,328,467 76,294,382 687,672,405 221,976,090 25,209,397 15,081,787 3,963,708,545
mov
emen
ts
Closing balance as of December 31, 2016
2017 movements
Opening balance as of January 1, 2017
mov
emen
ts
Closing balance as of March 31, 2017
2016 movements
Opening balance as of January 1, 2016
32
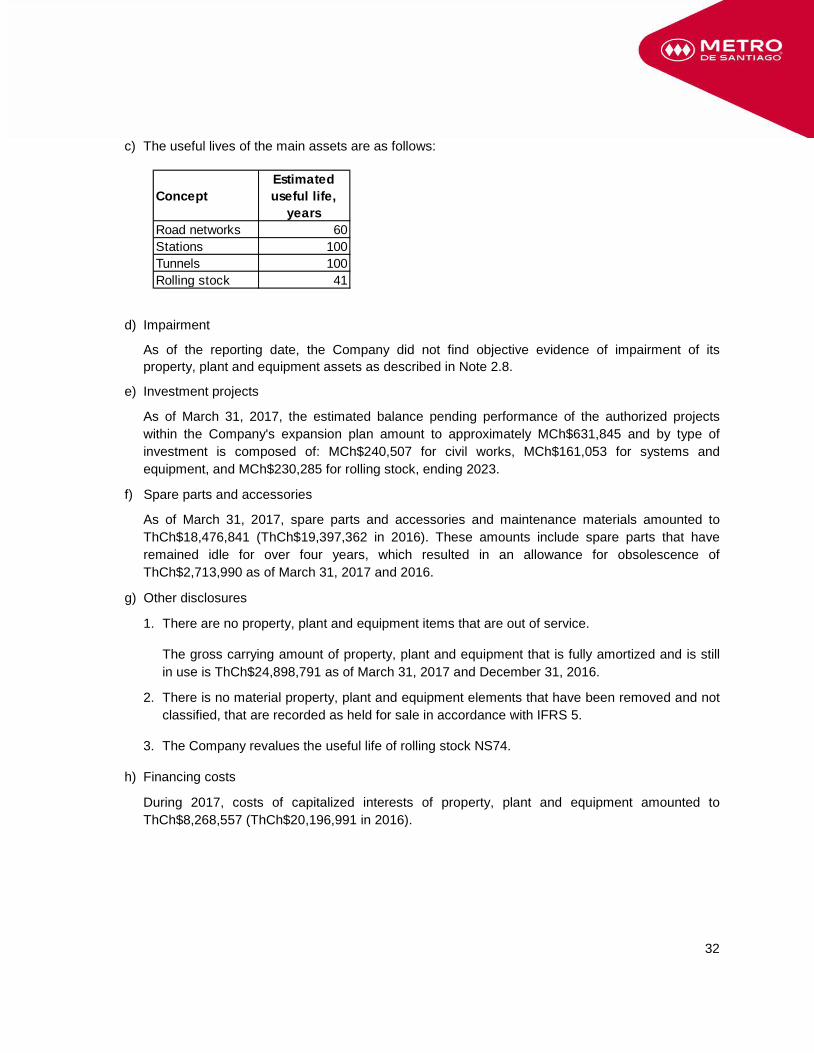
c) The useful lives of the main assets are as follows:
ConceptEstimated useful life,
yearsRoad networks 60Stations 100Tunnels 100Rolling stock 41
d) Impairment
As of the reporting date, the Company did not find objective evidence of impairment of its property, plant and equipment assets as described in Note 2.8.
e) Investment projects
As of March 31, 2017, the estimated balance pending performance of the authorized projects within the Company's expansion plan amount to approximately MCh$631,845 and by type of investment is composed of: MCh$240,507 for civil works, MCh$161,053 for systems and equipment, and MCh$230,285 for rolling stock, ending 2023.
f) Spare parts and accessories
As of March 31, 2017, spare parts and accessories and maintenance materials amounted to ThCh$18,476,841 (ThCh$19,397,362 in 2016). These amounts include spare parts that have remained idle for over four years, which resulted in an allowance for obsolescence of ThCh$2,713,990 as of March 31, 2017 and 2016.
g) Other disclosures
1. There are no property, plant and equipment items that are out of service.
The gross carrying amount of property, plant and equipment that is fully amortized and is still in use is ThCh$24,898,791 as of March 31, 2017 and December 31, 2016.
2. There is no material property, plant and equipment elements that have been removed and not classified, that are recorded as held for sale in accordance with IFRS 5.
3. The Company revalues the useful life of rolling stock NS74.
h) Financing costs
During 2017, costs of capitalized interests of property, plant and equipment amounted to ThCh$8,268,557 (ThCh$20,196,991 in 2016).
33
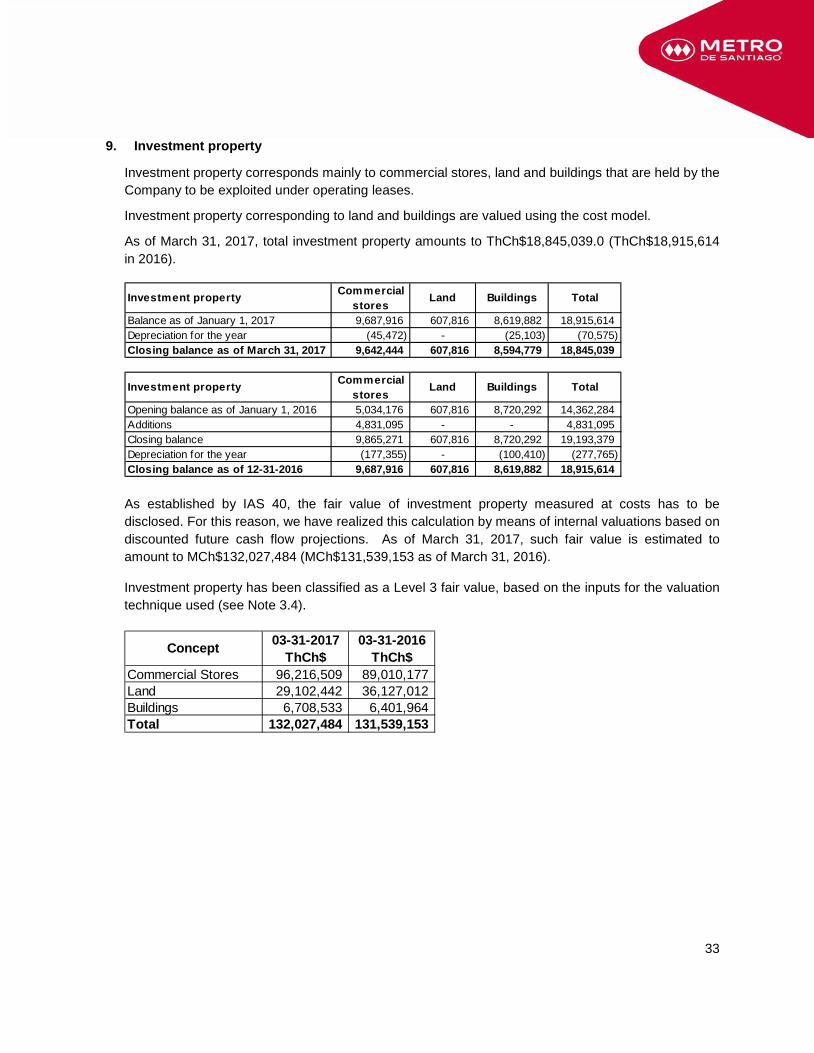
9. Investment property
Investment property corresponds mainly to commercial stores, land and buildings that are held by the Company to be exploited under operating leases.
Investment property corresponding to land and buildings are valued using the cost model.
As of March 31, 2017, total investment property amounts to ThCh$18,845,039.0 (ThCh$18,915,614 in 2016).
Commercialstores
Balance as of January 1, 2017 9,687,916 607,816 8,619,882 18,915,614Depreciation for the year (45,472) - (25,103) (70,575)Closing balance as of March 31, 2017 9,642,444 607,816 8,594,779 18,845,039
Commercialstores
Opening balance as of January 1, 2016 5,034,176 607,816 8,720,292 14,362,284Additions 4,831,095 - - 4,831,095Closing balance 9,865,271 607,816 8,720,292 19,193,379Depreciation for the year (177,355) - (100,410) (277,765)Closing balance as of 12-31-2016 9,687,916 607,816 8,619,882 18,915,614
Investment property Land Buildings Total
Investment property Land Buildings Total
As established by IAS 40, the fair value of investment property measured at costs has to be disclosed. For this reason, we have realized this calculation by means of internal valuations based on discounted future cash flow projections. As of March 31, 2017, such fair value is estimated to amount to MCh$132,027,484 (MCh$131,539,153 as of March 31, 2016).
Investment property has been classified as a Level 3 fair value, based on the inputs for the valuation technique used (see Note 3.4).
03-31-2017 03-31-2016ThCh$ ThCh$
Commercial Stores 96,216,509 89,010,177Land 29,102,442 36,127,012Buildings 6,708,533 6,401,964Total 132,027,484 131,539,153
Concept
34
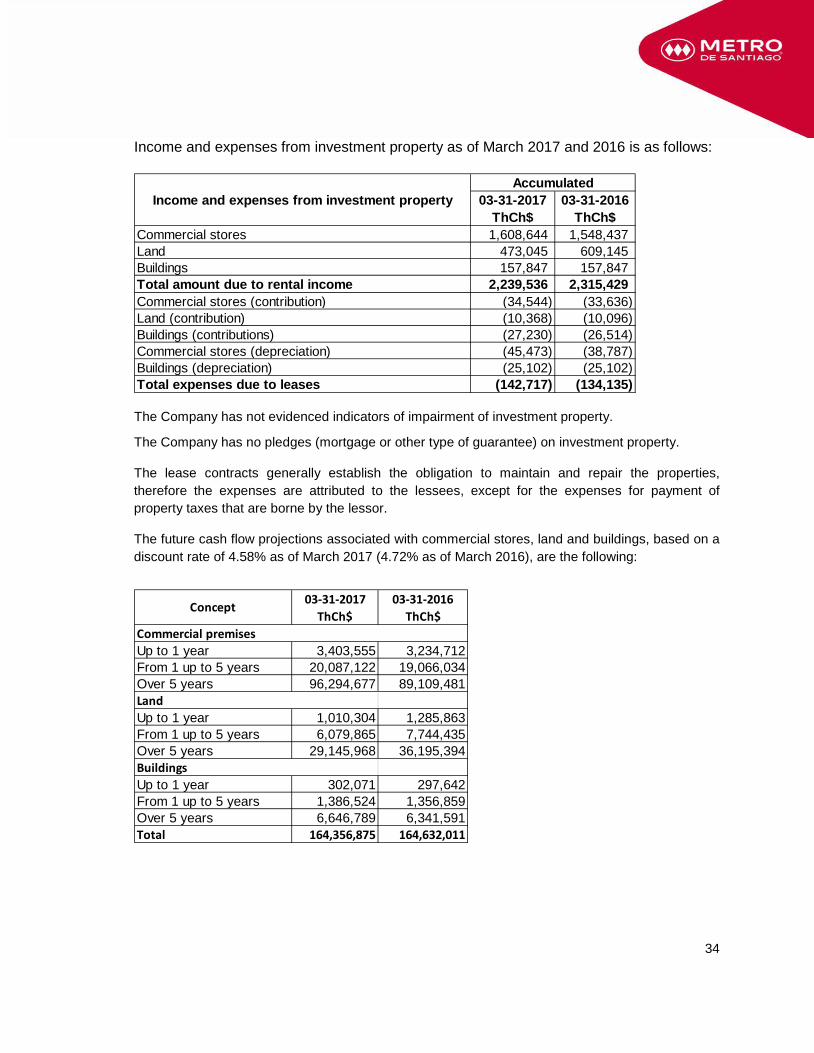
Income and expenses from investment property as of March 2017 and 2016 is as follows:
Income and expenses from investment property 03-31-2017 03-31-2016ThCh$ ThCh$
Commercial stores 1,608,644 1,548,437Land 473,045 609,145Buildings 157,847 157,847Total amount due to rental income 2,239,536 2,315,429Commercial stores (contribution) (34,544) (33,636)Land (contribution) (10,368) (10,096)Buildings (contributions) (27,230) (26,514)Commercial stores (depreciation) (45,473) (38,787)Buildings (depreciation) (25,102) (25,102)Total expenses due to leases (142,717) (134,135)
Accumulated
The Company has not evidenced indicators of impairment of investment property.
The Company has no pledges (mortgage or other type of guarantee) on investment property.
The lease contracts generally establish the obligation to maintain and repair the properties, therefore the expenses are attributed to the lessees, except for the expenses for payment of property taxes that are borne by the lessor.
The future cash flow projections associated with commercial stores, land and buildings, based on a discount rate of 4.58% as of March 2017 (4.72% as of March 2016), are the following:
03-31-2017 03-31-2016ThCh$ ThCh$
Commercial premisesUp to 1 year 3,403,555 3,234,712From 1 up to 5 years 20,087,122 19,066,034Over 5 years 96,294,677 89,109,481LandUp to 1 year 1,010,304 1,285,863From 1 up to 5 years 6,079,865 7,744,435Over 5 years 29,145,968 36,195,394BuildingsUp to 1 year 302,071 297,642From 1 up to 5 years 1,386,524 1,356,859Over 5 years 6,646,789 6,341,591Total 164,356,875 164,632,011
Concept
35
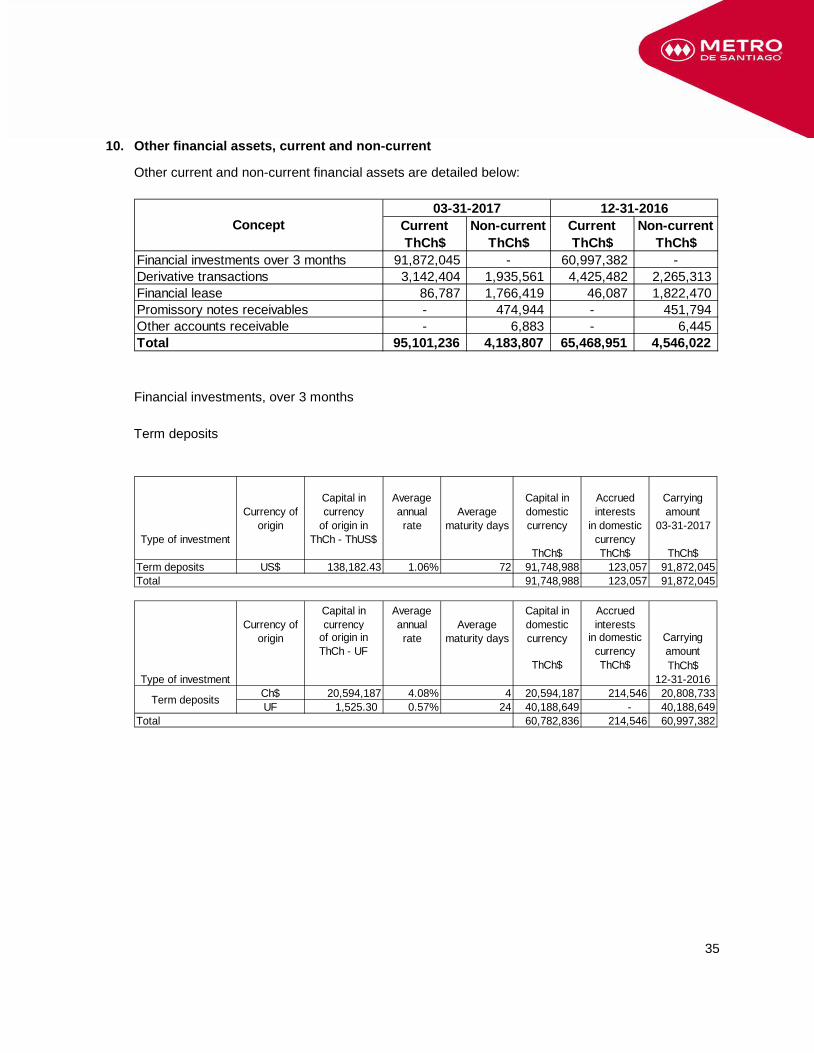
10. Other financial assets, current and non-current
Other current and non-current financial assets are detailed below:
Current Non-current Current Non-currentThCh$ ThCh$ ThCh$ ThCh$
Financial investments over 3 months 91,872,045 - 60,997,382 -Derivative transactions 3,142,404 1,935,561 4,425,482 2,265,313Financial lease 86,787 1,766,419 46,087 1,822,470Promissory notes receivables - 474,944 - 451,794Other accounts receivable - 6,883 - 6,445Total 95,101,236 4,183,807 65,468,951 4,546,022
Concept03-31-2017 12-31-2016
Financial investments, over 3 months Term deposits
Currency ofCapital incurrency
Averageannual Average
Capital indomestic
Accruedinterests
Carryingamount
Type of investmentorigin of origin in
ThCh - ThUS$rate maturity days currency in domestic
currency03-31-2017
ThCh$ ThCh$ ThCh$Term deposits US$ 138,182.43 1.06% 72 91,748,988 123,057 91,872,045Total 91,748,988 123,057 91,872,045
Currency ofCapital incurrency
Averageannual Average
Capital indomestic
Accruedinterests
origin of origin inThCh - UF
rate maturity days currency in domesticcurrency
Type of investmentThCh$ ThCh$ ThCh$
12-31-2016Ch$ 20,594,187 4.08% 4 20,594,187 214,546 20,808,733UF 1,525.30 0.57% 24 40,188,649 - 40,188,649
Total 60,782,836 214,546 60,997,382
Term deposits
Carryingamount
36
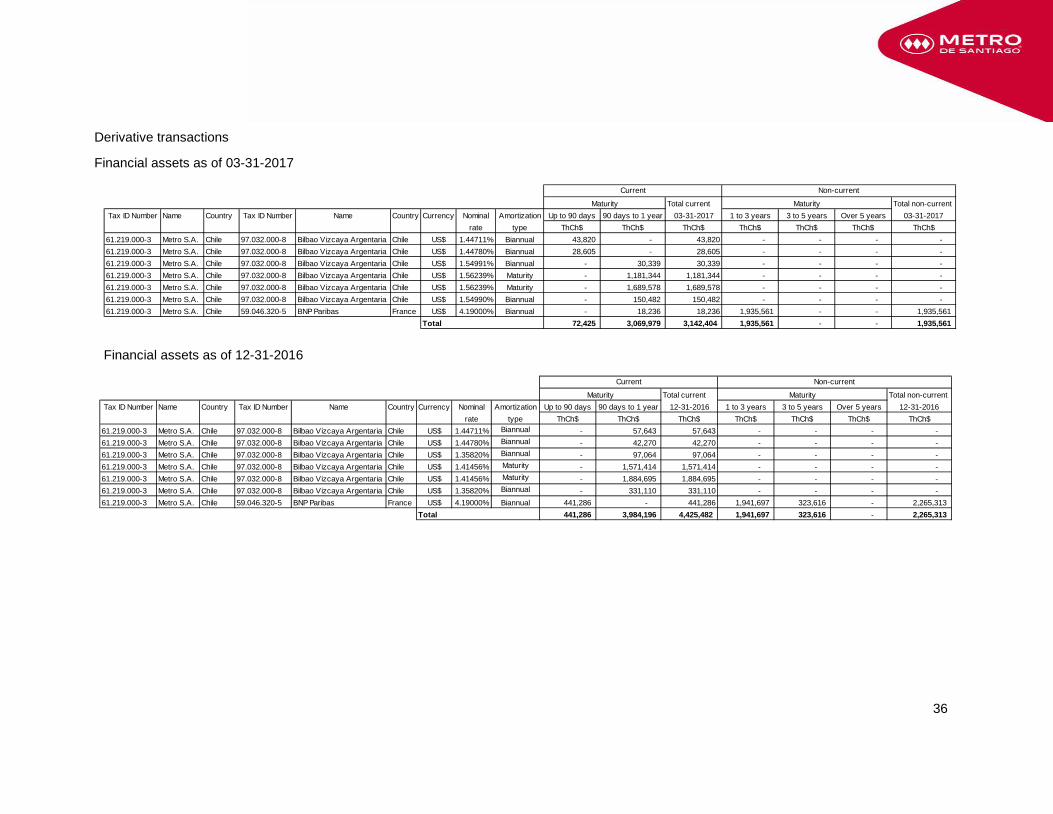
Derivative transactions
Financial assets as of 03-31-2017
Total current Total non-currentTax ID Number Name Country Tax ID Number Name Country Currency Nominal Amortization Up to 90 days 90 days to 1 year 03-31-2017 1 to 3 years 3 to 5 years Over 5 years 03-31-2017
rate type ThCh$ ThCh$ ThCh$ ThCh$ ThCh$ ThCh$ ThCh$61.219.000-3 Metro S.A. Chile 97.032.000-8 Bilbao Vizcaya Argentaria Chile US$ 1.44711% Biannual 43,820 - 43,820 - - - - 61.219.000-3 Metro S.A. Chile 97.032.000-8 Bilbao Vizcaya Argentaria Chile US$ 1.44780% Biannual 28,605 - 28,605 - - - - 61.219.000-3 Metro S.A. Chile 97.032.000-8 Bilbao Vizcaya Argentaria Chile US$ 1.54991% Biannual - 30,339 30,339 - - - - 61.219.000-3 Metro S.A. Chile 97.032.000-8 Bilbao Vizcaya Argentaria Chile US$ 1.56239% Maturity - 1,181,344 1,181,344 - - - - 61.219.000-3 Metro S.A. Chile 97.032.000-8 Bilbao Vizcaya Argentaria Chile US$ 1.56239% Maturity - 1,689,578 1,689,578 - - - - 61.219.000-3 Metro S.A. Chile 97.032.000-8 Bilbao Vizcaya Argentaria Chile US$ 1.54990% Biannual - 150,482 150,482 - - - - 61.219.000-3 Metro S.A. Chile 59.046.320-5 BNP Paribas France US$ 4.19000% Biannual - 18,236 18,236 1,935,561 - - 1,935,561
Total 72,425 3,069,979 3,142,404 1,935,561 - - 1,935,561
Current Non-current
Maturity Maturity
Financial assets as of 12-31-2016
Total current Total non-currentTax ID Number Name Country Tax ID Number Name Country Currency Nominal Amortization Up to 90 days 90 days to 1 year 12-31-2016 1 to 3 years 3 to 5 years Over 5 years 12-31-2016
rate type ThCh$ ThCh$ ThCh$ ThCh$ ThCh$ ThCh$ ThCh$61.219.000-3 Metro S.A. Chile 97.032.000-8 Bilbao Vizcaya Argentaria Chile US$ 1.44711% Biannual - 57,643 57,643 - - - - 61.219.000-3 Metro S.A. Chile 97.032.000-8 Bilbao Vizcaya Argentaria Chile US$ 1.44780% Biannual - 42,270 42,270 - - - - 61.219.000-3 Metro S.A. Chile 97.032.000-8 Bilbao Vizcaya Argentaria Chile US$ 1.35820% Biannual - 97,064 97,064 - - - - 61.219.000-3 Metro S.A. Chile 97.032.000-8 Bilbao Vizcaya Argentaria Chile US$ 1.41456% Maturity - 1,571,414 1,571,414 - - - - 61.219.000-3 Metro S.A. Chile 97.032.000-8 Bilbao Vizcaya Argentaria Chile US$ 1.41456% Maturity - 1,884,695 1,884,695 - - - - 61.219.000-3 Metro S.A. Chile 97.032.000-8 Bilbao Vizcaya Argentaria Chile US$ 1.35820% Biannual - 331,110 331,110 - - - - 61.219.000-3 Metro S.A. Chile 59.046.320-5 BNP Paribas France US$ 4.19000% Biannual 441,286 - 441,286 1,941,697 323,616 - 2,265,313
Total 441,286 3,984,196 4,425,482 1,941,697 323,616 - 2,265,313
Maturity Maturity
Current Non-current
37
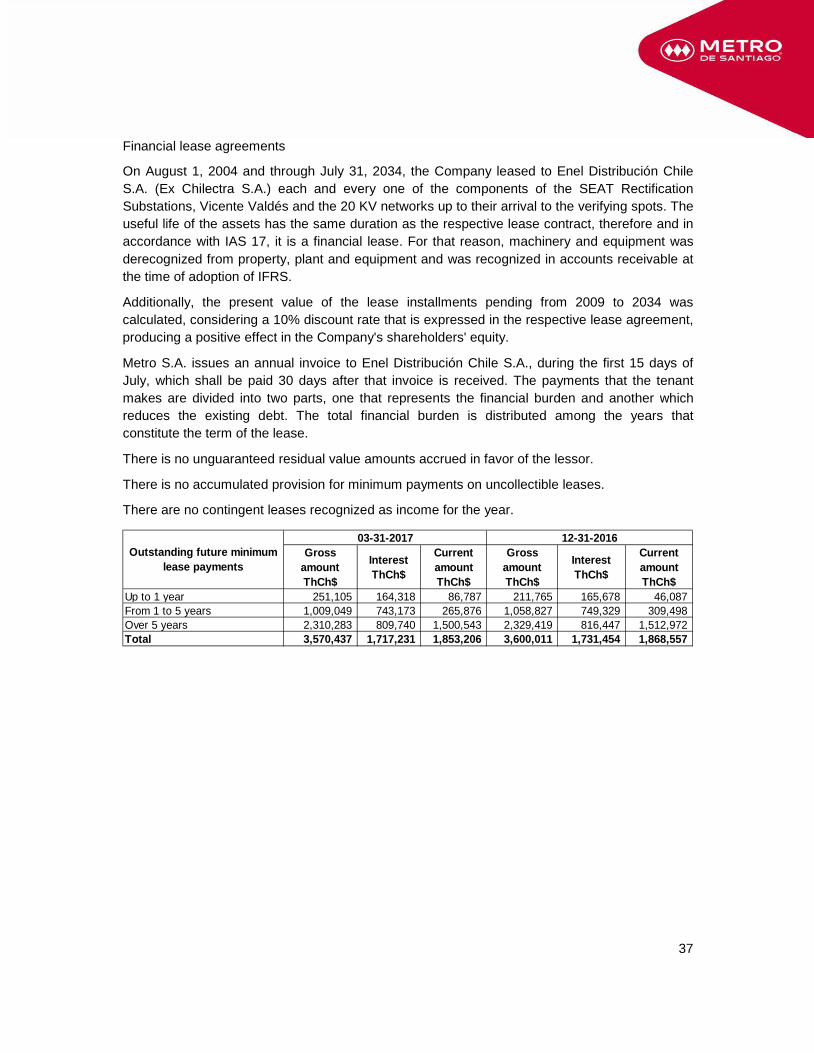
Financial lease agreements
On August 1, 2004 and through July 31, 2034, the Company leased to Enel Distribución Chile S.A. (Ex Chilectra S.A.) each and every one of the components of the SEAT Rectification Substations, Vicente Valdés and the 20 KV networks up to their arrival to the verifying spots. The useful life of the assets has the same duration as the respective lease contract, therefore and in accordance with IAS 17, it is a financial lease. For that reason, machinery and equipment was derecognized from property, plant and equipment and was recognized in accounts receivable at the time of adoption of IFRS.
Additionally, the present value of the lease installments pending from 2009 to 2034 was calculated, considering a 10% discount rate that is expressed in the respective lease agreement, producing a positive effect in the Company's shareholders' equity.
Metro S.A. issues an annual invoice to Enel Distribución Chile S.A., during the first 15 days of July, which shall be paid 30 days after that invoice is received. The payments that the tenant makes are divided into two parts, one that represents the financial burden and another which reduces the existing debt. The total financial burden is distributed among the years that constitute the term of the lease.
There is no unguaranteed residual value amounts accrued in favor of the lessor.
There is no accumulated provision for minimum payments on uncollectible leases.
There are no contingent leases recognized as income for the year.
Gross amount ThCh$
Interest ThCh$
Current amount ThCh$
Gross amount ThCh$
Interest ThCh$
Current amount ThCh$
Up to 1 year 251,105 164,318 86,787 211,765 165,678 46,087From 1 to 5 years 1,009,049 743,173 265,876 1,058,827 749,329 309,498Over 5 years 2,310,283 809,740 1,500,543 2,329,419 816,447 1,512,972Total 3,570,437 1,717,231 1,853,206 3,600,011 1,731,454 1,868,557
Outstanding future minimum lease payments
03-31-2017 12-31-2016
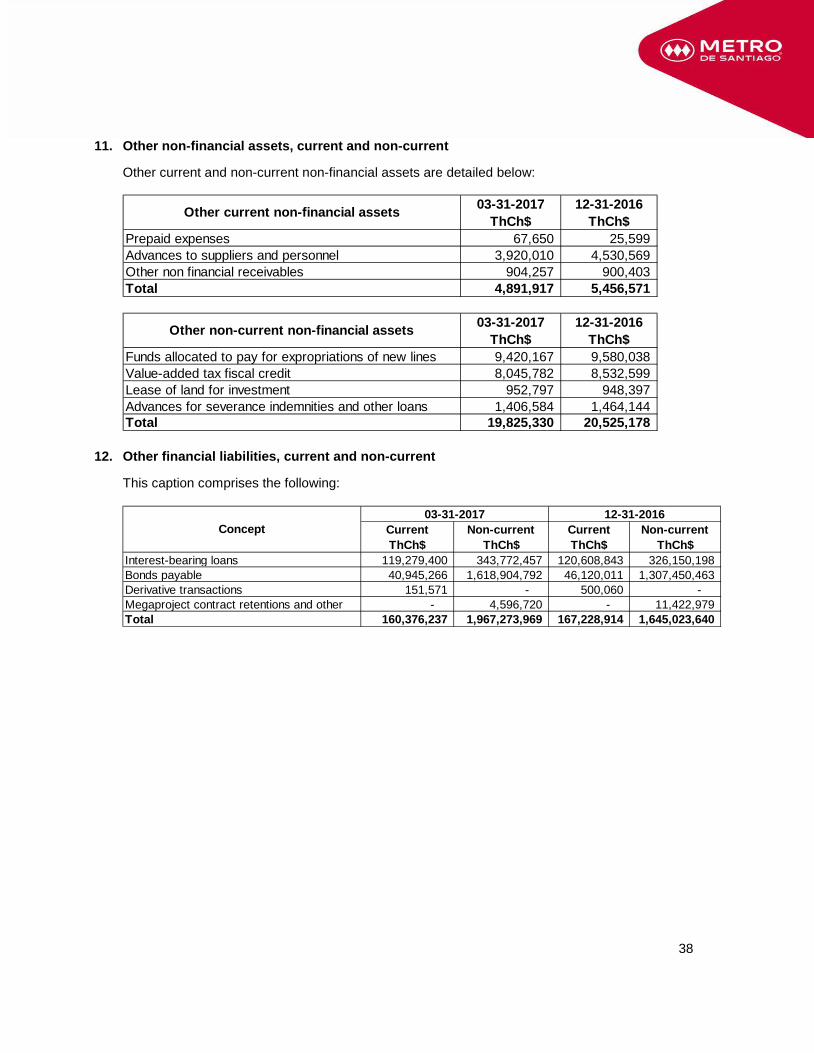
38
11. Other non-financial assets, current and non-current
Other current and non-current non-financial assets are detailed below:
03-31-2017 12-31-2016ThCh$ ThCh$
Prepaid expenses 67,650 25,599Advances to suppliers and personnel 3,920,010 4,530,569Other non financial receivables 904,257 900,403Total 4,891,917 5,456,571
03-31-2017 12-31-2016ThCh$ ThCh$
Funds allocated to pay for expropriations of new lines 9,420,167 9,580,038Value-added tax fiscal credit 8,045,782 8,532,599Lease of land for investment 952,797 948,397Advances for severance indemnities and other loans 1,406,584 1,464,144Total 19,825,330 20,525,178
Other current non-financial assets
Other non-current non-financial assets
12. Other financial liabilities, current and non-current
This caption comprises the following:
Current Non-current Current Non-currentThCh$ ThCh$ ThCh$ ThCh$
Interest-bearing loans 119,279,400 343,772,457 120,608,843 326,150,198Bonds payable 40,945,266 1,618,904,792 46,120,011 1,307,450,463Derivative transactions 151,571 - 500,060 - Megaproject contract retentions and other - 4,596,720 - 11,422,979Total 160,376,237 1,967,273,969 167,228,914 1,645,023,640
Concept03-31-2017 12-31-2016
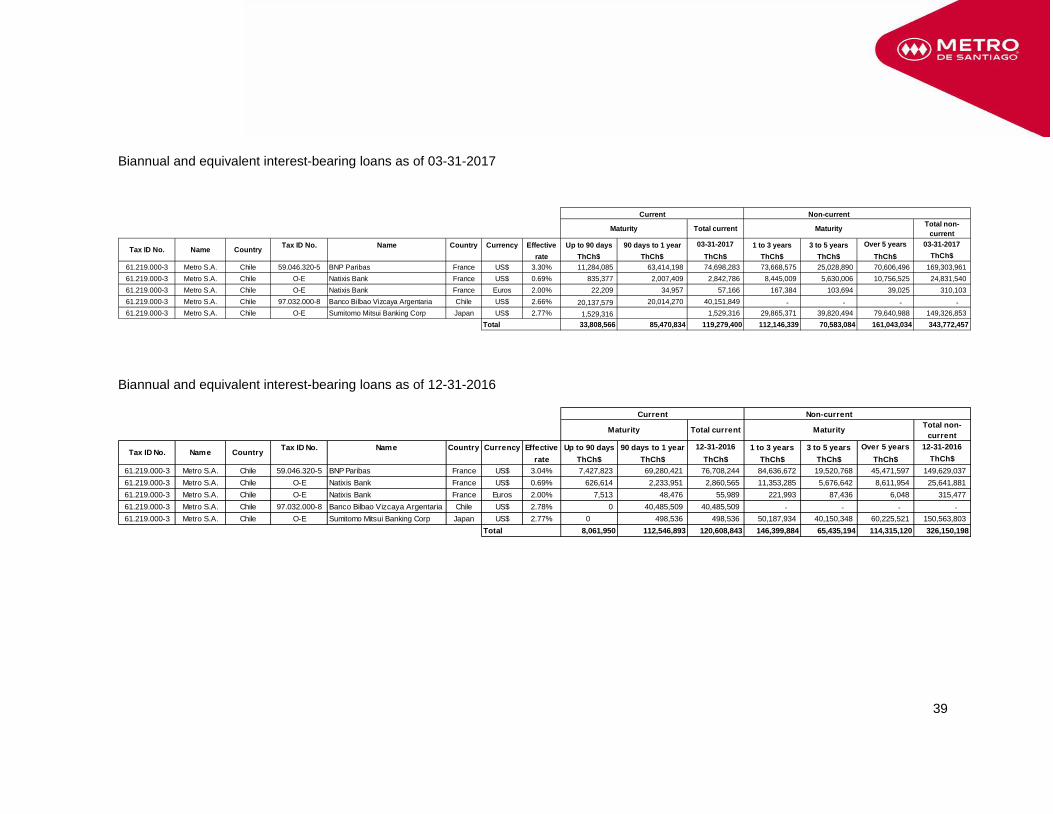
39
Biannual and equivalent interest-bearing loans as of 03-31-2017
Total current Total non-current
Tax ID No. Name Country Currency Effective Up to 90 days 90 days to 1 year 03-31-2017 1 to 3 years 3 to 5 years Over 5 years 03-31-2017rate ThCh$ ThCh$ ThCh$ ThCh$ ThCh$ ThCh$ ThCh$
61.219.000-3 Metro S.A. Chile 59.046.320-5 BNP Paribas France US$ 3.30% 11,284,085 63,414,198 74,698,283 73,668,575 25,028,890 70,606,496 169,303,96161.219.000-3 Metro S.A. Chile O-E Natixis Bank France US$ 0.69% 835,377 2,007,409 2,842,786 8,445,009 5,630,006 10,756,525 24,831,54061.219.000-3 Metro S.A. Chile O-E Natixis Bank France Euros 2.00% 22,209 34,957 57,166 167,384 103,694 39,025 310,10361.219.000-3 Metro S.A. Chile 97.032.000-8 Banco Bilbao Vizcaya Argentaria Chile US$ 2.66% 20,137,579 20,014,270 40,151,849 - - - - 61.219.000-3 Metro S.A. Chile O-E Sumitomo Mitsui Banking Corp Japan US$ 2.77% 1,529,316 1,529,316 29,865,371 39,820,494 79,640,988 149,326,853
Total 33,808,566 85,470,834 119,279,400 112,146,339 70,583,084 161,043,034 343,772,457
Tax ID No. Name Country
Current Non-current
Maturity Maturity
Biannual and equivalent interest-bearing loans as of 12-31-2016
Total current Total non-current
Tax ID No. Name Country Currency Effective Up to 90 days 90 days to 1 year 12-31-2016 1 to 3 years 3 to 5 years Over 5 years 12-31-2016rate ThCh$ ThCh$ ThCh$ ThCh$ ThCh$ ThCh$ ThCh$
61.219.000-3 Metro S.A. Chile 59.046.320-5 BNP Paribas France US$ 3.04% 7,427,823 69,280,421 76,708,244 84,636,672 19,520,768 45,471,597 149,629,03761.219.000-3 Metro S.A. Chile O-E Natixis Bank France US$ 0.69% 626,614 2,233,951 2,860,565 11,353,285 5,676,642 8,611,954 25,641,88161.219.000-3 Metro S.A. Chile O-E Natixis Bank France Euros 2.00% 7,513 48,476 55,989 221,993 87,436 6,048 315,47761.219.000-3 Metro S.A. Chile 97.032.000-8 Banco Bilbao Vizcaya Argentaria Chile US$ 2.78% 0 40,485,509 40,485,509 - - - - 61.219.000-3 Metro S.A. Chile O-E Sumitomo Mitsui Banking Corp Japan US$ 2.77% 0 498,536 498,536 50,187,934 40,150,348 60,225,521 150,563,803
Total 8,061,950 112,546,893 120,608,843 146,399,884 65,435,194 114,315,120 326,150,198
Maturity Maturity
Tax ID No. Name Country
Current Non-current
40
Interest-bearing loans:
Loan from Natixis Bank (financial protocol of the French Government to the Chilean government) in the amount of US$87,793,769.88. As of March 31, 2017, it has been fully used, leaving a principal balance of US$41,638,242.03. (US$42,541,417.03 in 2016).
Loan from Natixis Bank (financial protocol of the French Government to the Chilean government) in the amount of €1,573,093.76. As of March 31, 2017, it has been fully used, leaving a principal balance of €515,806.36. (€525,758.08 in 2016).
Buyer Credit Facility Agreement for the Metro Line 4 Project, with a syndicate of international banks led by BNP Paribas, in the amount of US$340,000,000.00 which is State guaranteed. As of March 31, 2017, it has been fully used, leaving a principal balance of US$2,797,746.93. (US$5,595,494.01 in 2016).
Buyer Credit Facility Agreement for the acquisition of rolling stock, with a syndicate of international banks led by BNP Paribas in the amount of US$46,855,822.64. This financing is not guaranteed by the Government. As of March 31, 2017 and December 31, 2016, it has been fully used, leaving a principal balance of US$5,028,229.27.
Buyer Credit Agreement for Extension Projects on Line 5 to Maipú and Extension of Line 1 to Los Dominicos, with a syndicate of international banks headed by BNP Paribas, in the amount of US$260,000,000.00. This financing is not guaranteed by the Government. As of March 31, 2017 and December 31, 2016, it has been fully used, leaving a principal balance of US$89,658,146.16.
Financial Loan Agreement for Extension Projects on Line 5 to Maipú and Extension of Line 1 to Los Dominicos, with a syndicate of international banks headed by BNP Paribas, in the amount of US$130,000,000, without guarantees by the Government. As of March 31, 2017, it has been fully used, leaving a principal balance of US$24,375,000.00. (US$32,500,000.00 in 2016).
Such agreement establishes that, at March 31, 2017, the maximum debt/equity ratio must be equal to or less than 1.70 times with minimum equity of ThCh$700 million. Note that as of March 31, 2017, this debt/equity ratio is 1.04 times and equity amounts to ThCh$2,237 million, calculated as set forth in the relevant loan agreement.
Debt Restructuring Loan Agreement, with BNP Paribas, in the amount of US$90,000,000 (bullet payment at maturity date). This financing is state guaranteed in the amount of US$60,000,000. As of March 31, 2017 and December 31, 2016, it has been fully used, leaving a principal balance of US$60,000,000.00.
Such agreement establishes that, at March 31, 2017, the maximum debt/equity ratio must be equal to or less than 1.70 times with minimum equity of ThCh$700 million. Note that as of March 31, 2017, this debt/equity ratio is 1.04 times and equity amounts to ThCh$2,237 million, calculated as set forth in the relevant loan agreement.
41
Debt Restructuring Loan Agreement, with Banco Bilbao Vizcaya Argentaria, for US$60,000,000 (bullet payment at maturity date). This financing is not guaranteed by the Government. As of March 31, 2017 and December 31, 2016, it has been fully used, leaving a principal balance of US$60,000,000.
Such agreement establishes that, at March 31, 2017, the maximum debt/equity ratio must be equal to or less than 1.70 times with minimum equity of ThCh$700 million. Note that as of March 31, 2017, this debt/equity ratio is 1.04 times and equity amounts to ThCh$2,237 million, calculated as set forth in the relevant loan agreement.
Buyer Credit Agreement for Extension Projects on Lines 3 and 6, with a syndicate of international banks headed by BNP Paribas, of US$550,000,000.00, without guarantees and signed on December 18, 2014. On October 26, 2016, the Company agreed with the bank on reducing the authorized amount to US$450,000,000.00. This financing is not guaranteed by the Government. As of March 31, 2017, it has been used US$183,126,274.28 (US$143,517,631.57 in 2016)
Such agreement establishes that, at March 31, 2017, the maximum debt/equity ratio must be equal to or less than 1.70 times with minimum equity of ThCh$700 million. Note that as of March 31, 2017, this debt/equity ratio is 1.04 times and equity amounts to ThCh$2,237 million, calculated as set forth in the relevant loan agreement.
Financial Loan Agreement for Extension Projects on Lines 3 and 6, with a syndicate of international banks headed by Sumitomo Mitsui Banking, in the amount of US$250,000,000.00, without guarantees and signed on December 18, 2014. On October 26, 2016, the Company agreed with the bank on reducing the authorized amount to US$225,000,000.00. This financing is not guaranteed by the Government. As of March 31, 2017 and December 31, 2016, US$224,900,000.00 have been used of such financing
Such agreement establishes that, at March 31, 2017, the maximum debt/equity ratio must be equal to or less than 1.70 times with minimum equity of ThCh$700 million. Note that as of March 31, 2017, this debt/equity ratio is 1.04 times and equity amounts to ThCh$2,237 million, calculated as set forth in the relevant loan agreement.
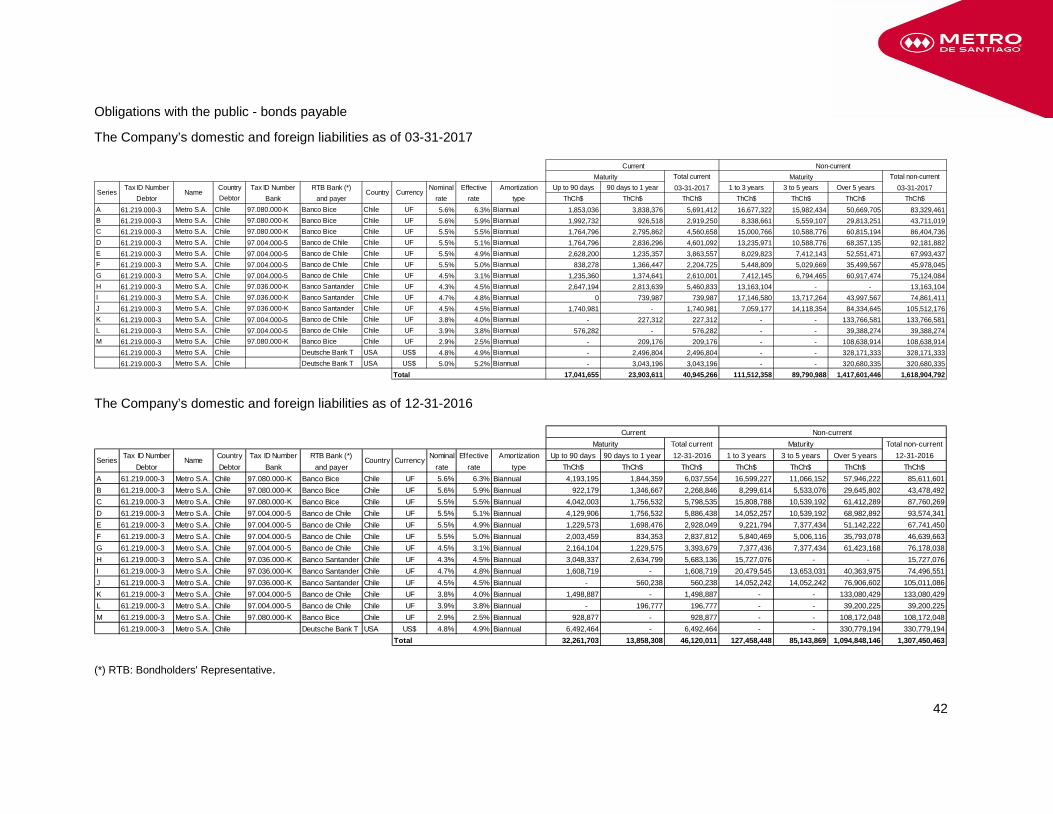
42
Obligations with the public - bonds payable
The Company’s domestic and foreign liabilities as of 03-31-2017
Total current Total non-current Tax ID Number Country Tax ID Number RTB Bank (*) Nominal Effective Amortization Up to 90 days 90 days to 1 year 03-31-2017 1 to 3 years 3 to 5 years Over 5 years 03-31-2017
Debtor Debtor Bank and payer rate rate type ThCh$ ThCh$ ThCh$ ThCh$ ThCh$ ThCh$ ThCh$A 61.219.000-3 Metro S.A. Chile 97.080.000-K Banco Bice Chile UF 5.6% 6.3% Biannual 1,853,036 3,838,376 5,691,412 16,677,322 15,982,434 50,669,705 83,329,461B 61.219.000-3 Metro S.A. Chile 97.080.000-K Banco Bice Chile UF 5.6% 5.9% Biannual 1,992,732 926,518 2,919,250 8,338,661 5,559,107 29,813,251 43,711,019C 61.219.000-3 Metro S.A. Chile 97.080.000-K Banco Bice Chile UF 5.5% 5.5% Biannual 1,764,796 2,795,862 4,560,658 15,000,766 10,588,776 60,815,194 86,404,736D 61.219.000-3 Metro S.A. Chile 97.004.000-5 Banco de Chile Chile UF 5.5% 5.1% Biannual 1,764,796 2,836,296 4,601,092 13,235,971 10,588,776 68,357,135 92,181,882E 61.219.000-3 Metro S.A. Chile 97.004.000-5 Banco de Chile Chile UF 5.5% 4.9% Biannual 2,628,200 1,235,357 3,863,557 8,029,823 7,412,143 52,551,471 67,993,437F 61.219.000-3 Metro S.A. Chile 97.004.000-5 Banco de Chile Chile UF 5.5% 5.0% Biannual 838,278 1,366,447 2,204,725 5,448,809 5,029,669 35,499,567 45,978,045G 61.219.000-3 Metro S.A. Chile 97.004.000-5 Banco de Chile Chile UF 4.5% 3.1% Biannual 1,235,360 1,374,641 2,610,001 7,412,145 6,794,465 60,917,474 75,124,084H 61.219.000-3 Metro S.A. Chile 97.036.000-K Banco Santander Chile UF 4.3% 4.5% Biannual 2,647,194 2,813,639 5,460,833 13,163,104 - - 13,163,104I 61.219.000-3 Metro S.A. Chile 97.036.000-K Banco Santander Chile UF 4.7% 4.8% Biannual 0 739,987 739,987 17,146,580 13,717,264 43,997,567 74,861,411J 61.219.000-3 Metro S.A. Chile 97.036.000-K Banco Santander Chile UF 4.5% 4.5% Biannual 1,740,981 - 1,740,981 7,059,177 14,118,354 84,334,645 105,512,176K 61.219.000-3 Metro S.A. Chile 97.004.000-5 Banco de Chile Chile UF 3.8% 4.0% Biannual - 227,312 227,312 - - 133,766,581 133,766,581L 61.219.000-3 Metro S.A. Chile 97.004.000-5 Banco de Chile Chile UF 3.9% 3.8% Biannual 576,282 - 576,282 - - 39,388,274 39,388,274M 61.219.000-3 Metro S.A. Chile 97.080.000-K Banco Bice Chile UF 2.9% 2.5% Biannual - 209,176 209,176 - - 108,638,914 108,638,914
61.219.000-3 Metro S.A. Chile Deutsche Bank T USA US$ 4.8% 4.9% Biannual - 2,496,804 2,496,804 - - 328,171,333 328,171,33361.219.000-3 Metro S.A. Chile Deutsche Bank T USA US$ 5.0% 5.2% Biannual - 3,043,196 3,043,196 - - 320,680,335 320,680,335
Total 17,041,655 23,903,611 40,945,266 111,512,358 89,790,988 1,417,601,446 1,618,904,792
CountrySeries Name
Current Non-current Maturity Maturity
Currency
The Company’s domestic and foreign liabilities as of 12-31-2016
Total current Total non-current Tax ID Number Country Tax ID Number RTB Bank (*) Nominal Effective Amortization Up to 90 days 90 days to 1 year 12-31-2016 1 to 3 years 3 to 5 years Over 5 years 12-31-2016
Debtor Debtor Bank and payer rate rate type ThCh$ ThCh$ ThCh$ ThCh$ ThCh$ ThCh$ ThCh$A 61.219.000-3 Metro S.A. Chile 97.080.000-K Banco Bice Chile UF 5.6% 6.3% Biannual 4,193,195 1,844,359 6,037,554 16,599,227 11,066,152 57,946,222 85,611,601B 61.219.000-3 Metro S.A. Chile 97.080.000-K Banco Bice Chile UF 5.6% 5.9% Biannual 922,179 1,346,667 2,268,846 8,299,614 5,533,076 29,645,802 43,478,492C 61.219.000-3 Metro S.A. Chile 97.080.000-K Banco Bice Chile UF 5.5% 5.5% Biannual 4,042,003 1,756,532 5,798,535 15,808,788 10,539,192 61,412,289 87,760,269D 61.219.000-3 Metro S.A. Chile 97.004.000-5 Banco de Chile Chile UF 5.5% 5.1% Biannual 4,129,906 1,756,532 5,886,438 14,052,257 10,539,192 68,982,892 93,574,341E 61.219.000-3 Metro S.A. Chile 97.004.000-5 Banco de Chile Chile UF 5.5% 4.9% Biannual 1,229,573 1,698,476 2,928,049 9,221,794 7,377,434 51,142,222 67,741,450F 61.219.000-3 Metro S.A. Chile 97.004.000-5 Banco de Chile Chile UF 5.5% 5.0% Biannual 2,003,459 834,353 2,837,812 5,840,469 5,006,116 35,793,078 46,639,663G 61.219.000-3 Metro S.A. Chile 97.004.000-5 Banco de Chile Chile UF 4.5% 3.1% Biannual 2,164,104 1,229,575 3,393,679 7,377,436 7,377,434 61,423,168 76,178,038H 61.219.000-3 Metro S.A. Chile 97.036.000-K Banco Santander Chile UF 4.3% 4.5% Biannual 3,048,337 2,634,799 5,683,136 15,727,076 - - 15,727,076I 61.219.000-3 Metro S.A. Chile 97.036.000-K Banco Santander Chile UF 4.7% 4.8% Biannual 1,608,719 - 1,608,719 20,479,545 13,653,031 40,363,975 74,496,551J 61.219.000-3 Metro S.A. Chile 97.036.000-K Banco Santander Chile UF 4.5% 4.5% Biannual - 560,238 560,238 14,052,242 14,052,242 76,906,602 105,011,086K 61.219.000-3 Metro S.A. Chile 97.004.000-5 Banco de Chile Chile UF 3.8% 4.0% Biannual 1,498,887 - 1,498,887 - - 133,080,429 133,080,429L 61.219.000-3 Metro S.A. Chile 97.004.000-5 Banco de Chile Chile UF 3.9% 3.8% Biannual - 196,777 196,777 - - 39,200,225 39,200,225M 61.219.000-3 Metro S.A. Chile 97.080.000-K Banco Bice Chile UF 2.9% 2.5% Biannual 928,877 - 928,877 - - 108,172,048 108,172,048
61.219.000-3 Metro S.A. Chile Deutsche Bank T USA US$ 4.8% 4.9% Biannual 6,492,464 - 6,492,464 - - 330,779,194 330,779,194Total 32,261,703 13,858,308 46,120,011 127,458,448 85,143,869 1,094,848,146 1,307,450,463
Current Non-current Maturity Maturity
Series Name Country Currency
(*) RTB: Bondholders' Representative.
43
On July 31, 2001, December 5, 2001, August 9, 2002, December 3, 2003, June 23, 2004 and December 14, 2005, the Company placed Series A to G bonds in the domestic market, all calculated on the basis of a 360-day year, at a 25-year term with 10 years of grace period for the principal payment, with biannual interest payments and without early redemption.
On December 3, 2008, the Company placed Series H and I bonds in the domestic market, calculated on the basis of a 360-day year, with a 12-year term and 7 years of grace period for series H and a 21-year term with 10 years of grace period for Series I, with biannual interest payments and early redemption.
On November 18, 2009, the Company placed Series J bonds in the domestic market, calculated on the basis of a 360-day year, at a 25-year term with 10 years of grace period, with biannual payment of interest and without early redemption.
On October 6, 2011, the Company placed series K bonds in the domestic market, calculated on the basis of a 360-day year, at a 21-year term with 16 years of grace period for principal payment, with semiannual interest payments and early redemption.
On May 24, 2012, the Company placed Series L bonds in the domestic market, calculated on the basis of a 360-day year, at a 21-year term with 21 years of grace period for principal payment, with payment of biannual interest and early redemption.
On February 4, 2014, the Company placed a bond in the international market for MUS$500 with a 4.846% interest rate for placement. The bond’s coupon rate is 4.75%, calculated in the basis of a 360-day year, at 10-year term with 10 years of grace period for principal payment, with payment of biannual interest and early redemption.
On September 29, 2016, the Company placed Series M bonds in the domestic market, calculated on the basis of a 360-day year, at a 30-year term with 26 years of grace period for principal payment, with payment of biannual interest and early redemption.
On January 25, 2017, the Company placed a bond in the international market for MUS$500 with a 5.151% interest rate for placement. The bond’s coupon rate is 5.00%, calculated in the basis of a 360-day year, at 30-year term with 30 years of grace period for principal payment, with payment of biannual interest and early redemption.
The Series A and B bonds are have a State guarantee, in accordance with Law Decree 1.263 and Laws No. 18.196, 18.382 and 19.702, in Exempt Decree 117, issued by the Ministries of Finance and Economy and of Development and Reconstruction, and Supreme Decree 389 issued by the Ministry of Finance, both on April 20, 2001.
The Series C bonds are guaranteed by the State, in accordance with Law Decree 1.263 and Laws No. 18.196, 18.382 and 19.774, in Exempt Decree 274 issued by the Ministries of Finance and Economy and of Development and Reconstruction, and Supreme Decree 363 issued by the Ministry of Finance, both on May 13, 2002.
44
The Series D and E bonds are guaranteed by the State, in accordance with Law Decree 1.263 and Laws No. 18.196 and 19.847, Exempt Decree 222 dated April 29, 2003 issued by the Ministries of Finance and Economy and of Development and Reconstruction, and Supreme Decree 356 issued by the Ministry of Finance on May 7, 2003.
The Series F bonds are guaranteed by the State, in accordance with Law Decree 1.263 and Laws No. 18.196 and 19.847. The authorization to issue and guarantee bonds in the domestic market was authorized by Supreme Decree 1,024, dated November 11, 2003 issued by the Ministries of Finance and Economy and of Development and Reconstruction.
The Series G bonds are guaranteed by the State, in accordance with Law Decree 1.263 and Laws No. 18.196 and 19.847. The authorization to issue and guarantee bonds in the domestic market was authorized by Supreme Decree 592, dated May 11, 2005 issued by the Ministries of Finance and Economy and of Development and Reconstruction.
The Series H, I, J, K, L, M and International bonds are not guaranteed, notwithstanding the creditors’ general pledge right set forth in Chilean law.
The Company is not subject to any financial or other restrictive covenants under the instruments governing its Series A to G bonds. For the Series H, I, J, K and L bonds, the Company is required during each calendar year to maintain a debt/equity ratio that is lower than 1.7, equity in excess of ThCh$700 million and an interest coverage ratio greater than 1.0. Those covenants are calculated and determined using the financial statements prepared as of December 31 of each calendar year and filed with the SVS. International bond is not subject to related restrictions or covenants.
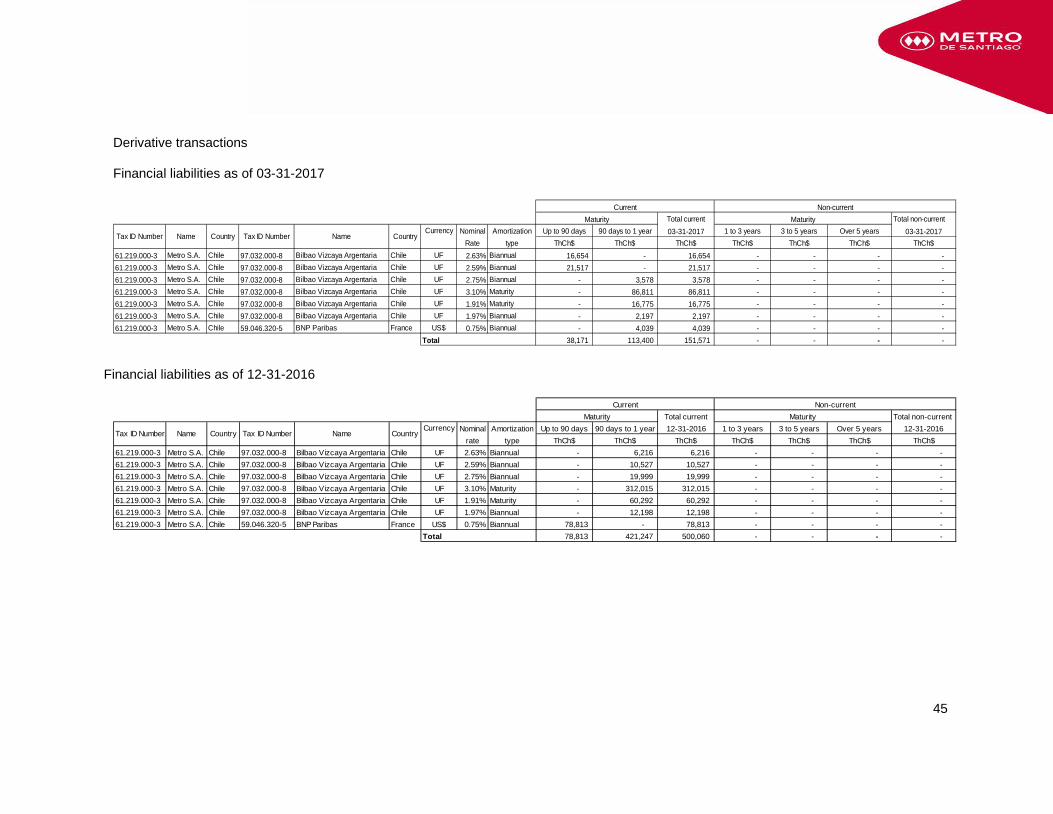
45
Derivative transactions
Financial liabilities as of 03-31-2017
Total current Total non-currentCurrency Nominal Amortization Up to 90 days 90 days to 1 year 03-31-2017 1 to 3 years 3 to 5 years Over 5 years 03-31-2017
Rate type ThCh$ ThCh$ ThCh$ ThCh$ ThCh$ ThCh$ ThCh$61.219.000-3 Metro S.A. Chile 97.032.000-8 Bilbao Vizcaya Argentaria Chile UF 2.63% Biannual 16,654 - 16,654 - - - - 61.219.000-3 Metro S.A. Chile 97.032.000-8 Bilbao Vizcaya Argentaria Chile UF 2.59% Biannual 21,517 - 21,517 - - - - 61.219.000-3 Metro S.A. Chile 97.032.000-8 Bilbao Vizcaya Argentaria Chile UF 2.75% Biannual - 3,578 3,578 - - - - 61.219.000-3 Metro S.A. Chile 97.032.000-8 Bilbao Vizcaya Argentaria Chile UF 3.10% Maturity - 86,811 86,811 - - - - 61.219.000-3 Metro S.A. Chile 97.032.000-8 Bilbao Vizcaya Argentaria Chile UF 1.91% Maturity - 16,775 16,775 - - - - 61.219.000-3 Metro S.A. Chile 97.032.000-8 Bilbao Vizcaya Argentaria Chile UF 1.97% Biannual - 2,197 2,197 - - - - 61.219.000-3 Metro S.A. Chile 59.046.320-5 BNP Paribas France US$ 0.75% Biannual - 4,039 4,039 - - - -
Total 38,171 113,400 151,571 - - - -
Current Non-currentMaturity Maturity
Tax ID Number Name Country Tax ID Number Name Country
Financial liabilities as of 12-31-2016
Total current Total non-currentCurrency Nominal Amortization Up to 90 days 90 days to 1 year 12-31-2016 1 to 3 years 3 to 5 years Over 5 years 12-31-2016
rate type ThCh$ ThCh$ ThCh$ ThCh$ ThCh$ ThCh$ ThCh$61.219.000-3 Metro S.A. Chile 97.032.000-8 Bilbao Vizcaya Argentaria Chile UF 2.63% Biannual - 6,216 6,216 - - - - 61.219.000-3 Metro S.A. Chile 97.032.000-8 Bilbao Vizcaya Argentaria Chile UF 2.59% Biannual - 10,527 10,527 - - - - 61.219.000-3 Metro S.A. Chile 97.032.000-8 Bilbao Vizcaya Argentaria Chile UF 2.75% Biannual - 19,999 19,999 - - - - 61.219.000-3 Metro S.A. Chile 97.032.000-8 Bilbao Vizcaya Argentaria Chile UF 3.10% Maturity - 312,015 312,015 - - - - 61.219.000-3 Metro S.A. Chile 97.032.000-8 Bilbao Vizcaya Argentaria Chile UF 1.91% Maturity - 60,292 60,292 - - - - 61.219.000-3 Metro S.A. Chile 97.032.000-8 Bilbao Vizcaya Argentaria Chile UF 1.97% Biannual - 12,198 12,198 - - - - 61.219.000-3 Metro S.A. Chile 59.046.320-5 BNP Paribas France US$ 0.75% Biannual 78,813 - 78,813 - - - -
Total 78,813 421,247 500,060 - - - -
Current Non-currentMaturity Maturity
Tax ID Number Name Country Tax ID Number Name Country
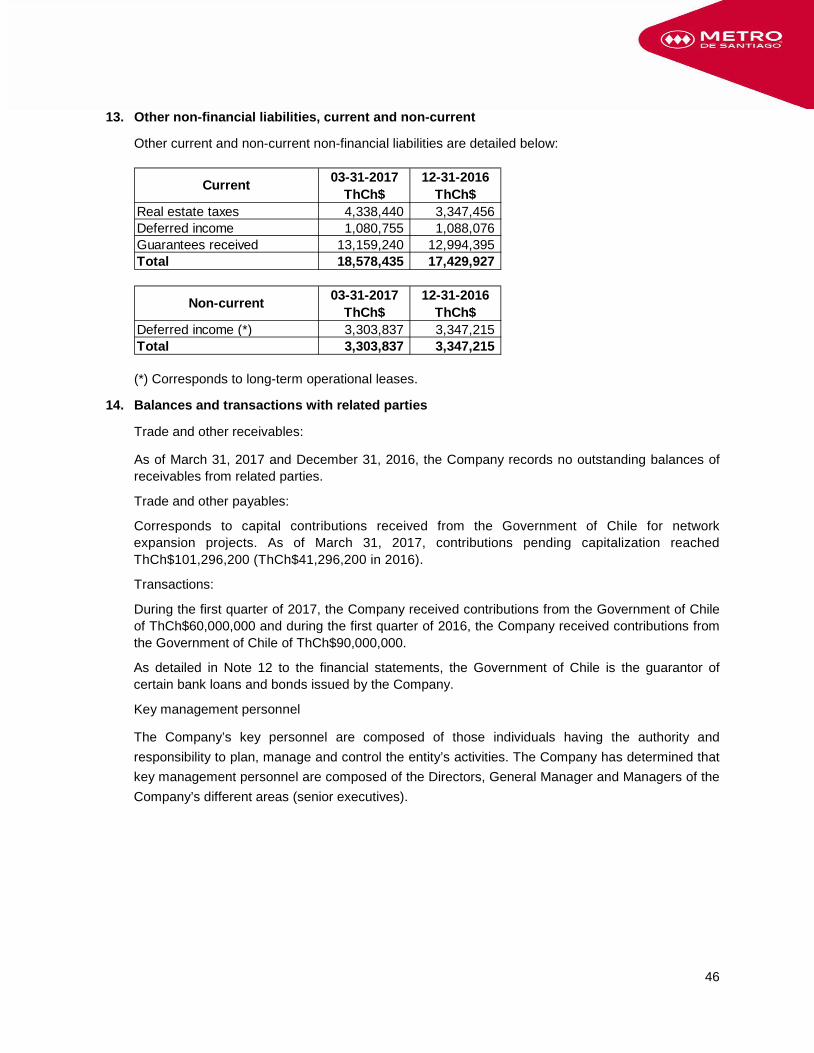
46
13. Other non-financial liabilities, current and non-current
Other current and non-current non-financial liabilities are detailed below:
03-31-2017 12-31-2016ThCh$ ThCh$
Real estate taxes 4,338,440 3,347,456Deferred income 1,080,755 1,088,076Guarantees received 13,159,240 12,994,395Total 18,578,435 17,429,927
03-31-2017 12-31-2016ThCh$ ThCh$
Deferred income (*) 3,303,837 3,347,215Total 3,303,837 3,347,215
Current
Non-current
(*) Corresponds to long-term operational leases.
14. Balances and transactions with related parties
Trade and other receivables:
As of March 31, 2017 and December 31, 2016, the Company records no outstanding balances of receivables from related parties.
Trade and other payables:
Corresponds to capital contributions received from the Government of Chile for network expansion projects. As of March 31, 2017, contributions pending capitalization reached ThCh$101,296,200 (ThCh$41,296,200 in 2016).
Transactions:
During the first quarter of 2017, the Company received contributions from the Government of Chile of ThCh$60,000,000 and during the first quarter of 2016, the Company received contributions from the Government of Chile of ThCh$90,000,000.
As detailed in Note 12 to the financial statements, the Government of Chile is the guarantor of certain bank loans and bonds issued by the Company.
Key management personnel
The Company’s key personnel are composed of those individuals having the authority and responsibility to plan, manage and control the entity’s activities. The Company has determined that key management personnel are composed of the Directors, General Manager and Managers of the Company’s different areas (senior executives).
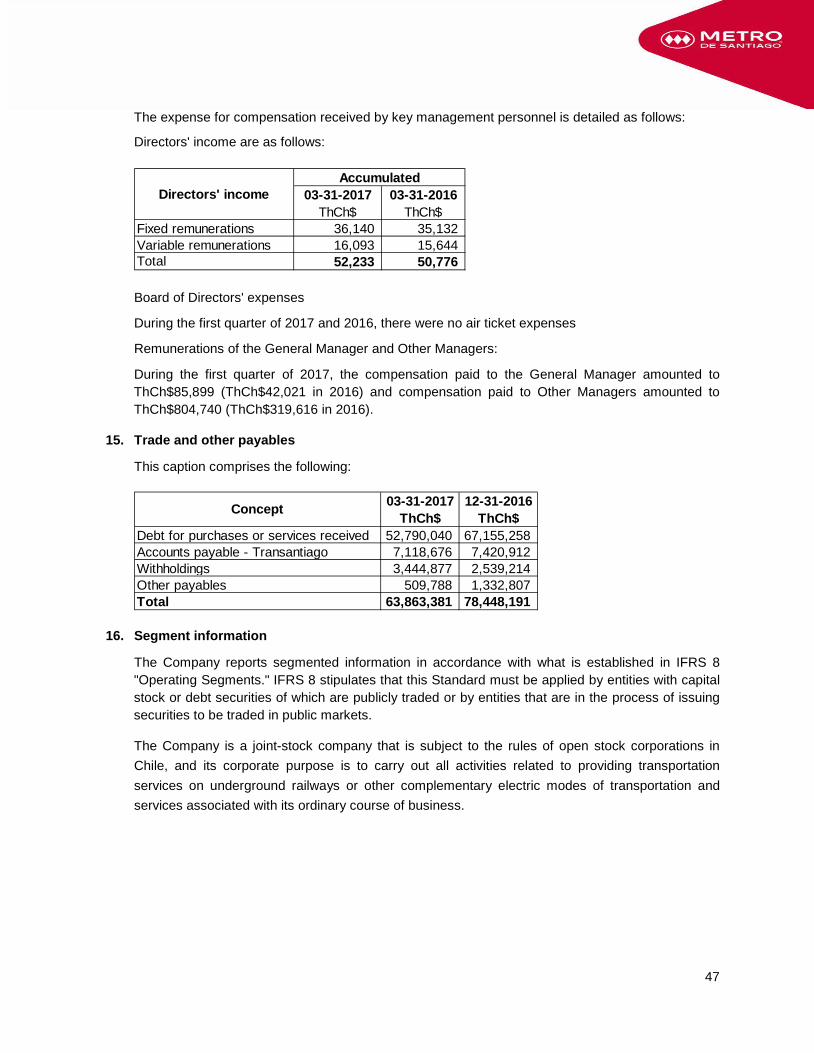
47
The expense for compensation received by key management personnel is detailed as follows:
Directors' income are as follows:
03-31-2017 03-31-2016ThCh$ ThCh$
Fixed remunerations 36,140 35,132Variable remunerations 16,093 15,644Total 52,233 50,776
Directors' incomeAccumulated
Board of Directors' expenses
During the first quarter of 2017 and 2016, there were no air ticket expenses
Remunerations of the General Manager and Other Managers:
During the first quarter of 2017, the compensation paid to the General Manager amounted to ThCh$85,899 (ThCh$42,021 in 2016) and compensation paid to Other Managers amounted to ThCh$804,740 (ThCh$319,616 in 2016).
15. Trade and other payables
This caption comprises the following:
03-31-2017 12-31-2016ThCh$ ThCh$
Debt for purchases or services received 52,790,040 67,155,258Accounts payable - Transantiago 7,118,676 7,420,912Withholdings 3,444,877 2,539,214Other payables 509,788 1,332,807Total 63,863,381 78,448,191
Concept
16. Segment information
The Company reports segmented information in accordance with what is established in IFRS 8 "Operating Segments." IFRS 8 stipulates that this Standard must be applied by entities with capital stock or debt securities of which are publicly traded or by entities that are in the process of issuing securities to be traded in public markets.
The Company is a joint-stock company that is subject to the rules of open stock corporations in Chile, and its corporate purpose is to carry out all activities related to providing transportation services on underground railways or other complementary electric modes of transportation and services associated with its ordinary course of business.
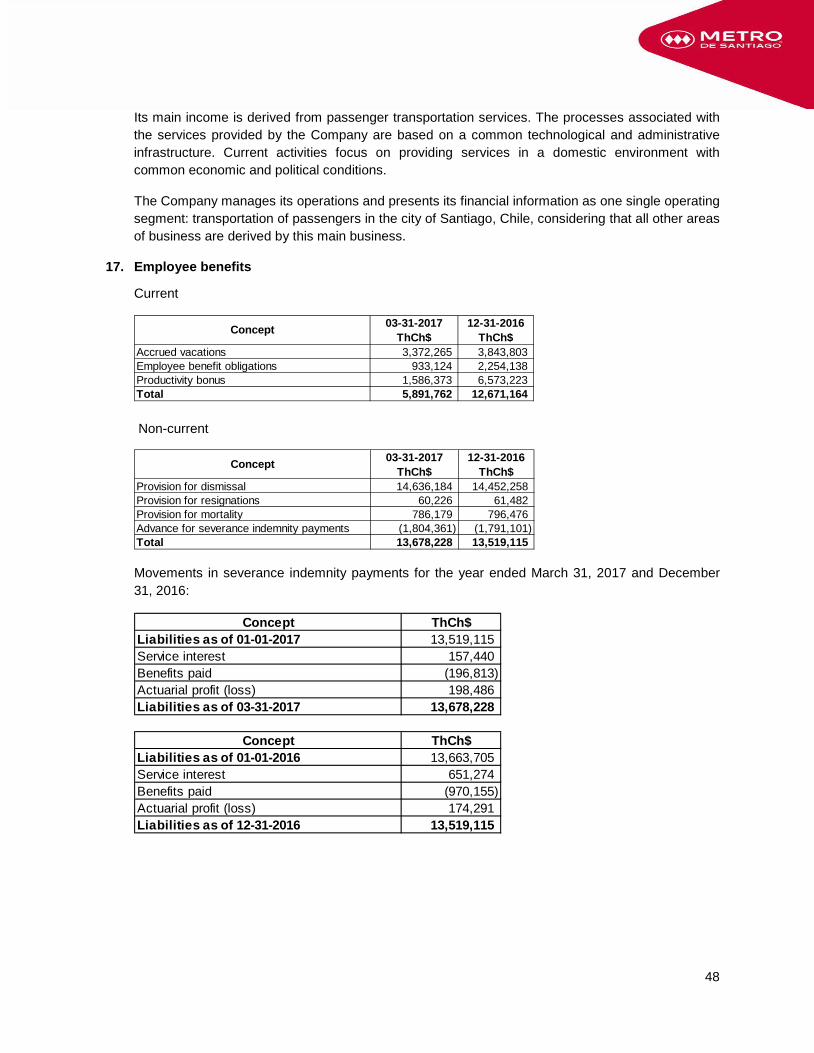
48
Its main income is derived from passenger transportation services. The processes associated with the services provided by the Company are based on a common technological and administrative infrastructure. Current activities focus on providing services in a domestic environment with common economic and political conditions.
The Company manages its operations and presents its financial information as one single operating segment: transportation of passengers in the city of Santiago, Chile, considering that all other areas of business are derived by this main business.
17. Employee benefits
Current
03-31-2017 12-31-2016ThCh$ ThCh$
Accrued vacations 3,372,265 3,843,803Employee benefit obligations 933,124 2,254,138Productivity bonus 1,586,373 6,573,223Total 5,891,762 12,671,164
Concept
Non-current
03-31-2017 12-31-2016ThCh$ ThCh$
Provision for dismissal 14,636,184 14,452,258Provision for resignations 60,226 61,482Provision for mortality 786,179 796,476Advance for severance indemnity payments (1,804,361) (1,791,101)Total 13,678,228 13,519,115
Concept
Movements in severance indemnity payments for the year ended March 31, 2017 and December 31, 2016:
Concept ThCh$Liabilities as of 01-01-2017 13,519,115Service interest 157,440Benefits paid (196,813)Actuarial profit (loss) 198,486Liabilities as of 03-31-2017 13,678,228
Concept ThCh$Liabilities as of 01-01-2016 13,663,705Service interest 651,274Benefits paid (970,155)Actuarial profit (loss) 174,291Liabilities as of 12-31-2016 13,519,115
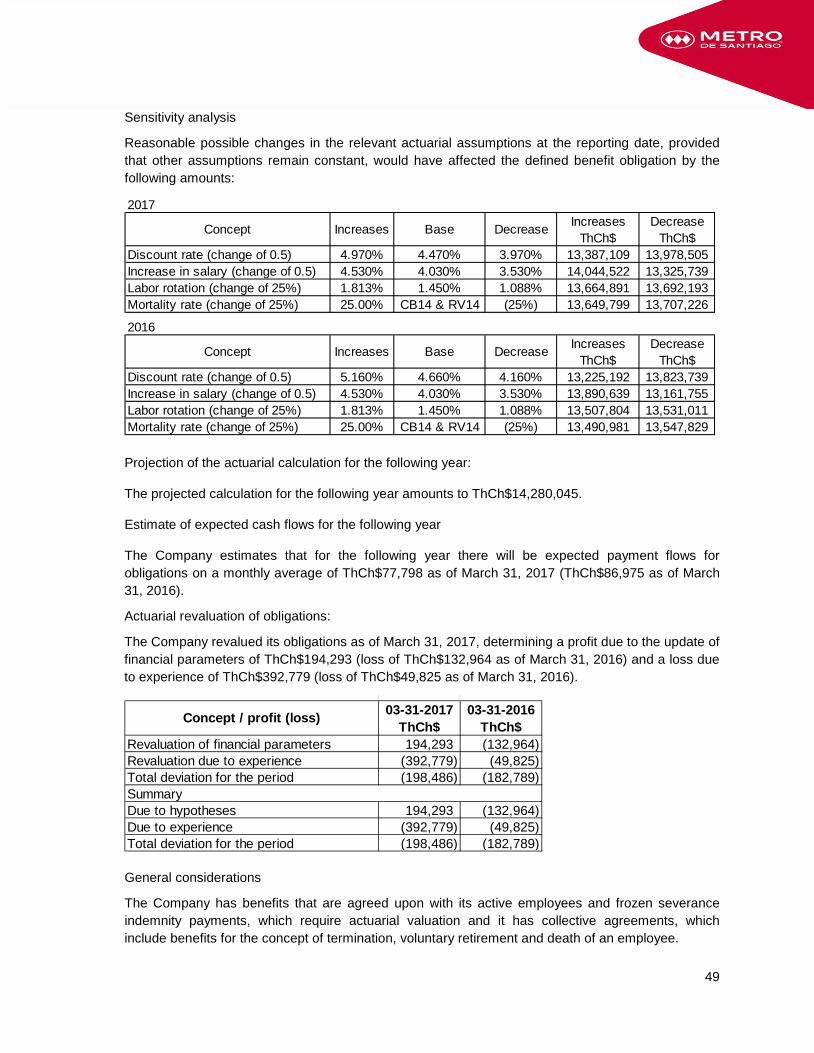
49
Sensitivity analysis
Reasonable possible changes in the relevant actuarial assumptions at the reporting date, provided that other assumptions remain constant, would have affected the defined benefit obligation by the following amounts:
2017Increases Decrease
ThCh$ ThCh$Discount rate (change of 0.5) 4.970% 4.470% 3.970% 13,387,109 13,978,505Increase in salary (change of 0.5) 4.530% 4.030% 3.530% 14,044,522 13,325,739Labor rotation (change of 25%) 1.813% 1.450% 1.088% 13,664,891 13,692,193Mortality rate (change of 25%) 25.00% CB14 & RV14 (25%) 13,649,799 13,707,226
2016Increases Decrease
ThCh$ ThCh$Discount rate (change of 0.5) 5.160% 4.660% 4.160% 13,225,192 13,823,739Increase in salary (change of 0.5) 4.530% 4.030% 3.530% 13,890,639 13,161,755Labor rotation (change of 25%) 1.813% 1.450% 1.088% 13,507,804 13,531,011Mortality rate (change of 25%) 25.00% CB14 & RV14 (25%) 13,490,981 13,547,829
Concept Increases Base Decrease
Concept Increases Base Decrease
Projection of the actuarial calculation for the following year:
The projected calculation for the following year amounts to ThCh$14,280,045.
Estimate of expected cash flows for the following year
The Company estimates that for the following year there will be expected payment flows for obligations on a monthly average of ThCh$77,798 as of March 31, 2017 (ThCh$86,975 as of March 31, 2016).
Actuarial revaluation of obligations:
The Company revalued its obligations as of March 31, 2017, determining a profit due to the update of financial parameters of ThCh$194,293 (loss of ThCh$132,964 as of March 31, 2016) and a loss due to experience of ThCh$392,779 (loss of ThCh$49,825 as of March 31, 2016).
03-31-2017 03-31-2016ThCh$ ThCh$
Revaluation of financial parameters 194,293 (132,964)Revaluation due to experience (392,779) (49,825)Total deviation for the period (198,486) (182,789)SummaryDue to hypotheses 194,293 (132,964)Due to experience (392,779) (49,825)Total deviation for the period (198,486) (182,789)
Concept / profit (loss)
General considerations
The Company has benefits that are agreed upon with its active employees and frozen severance indemnity payments, which require actuarial valuation and it has collective agreements, which include benefits for the concept of termination, voluntary retirement and death of an employee.
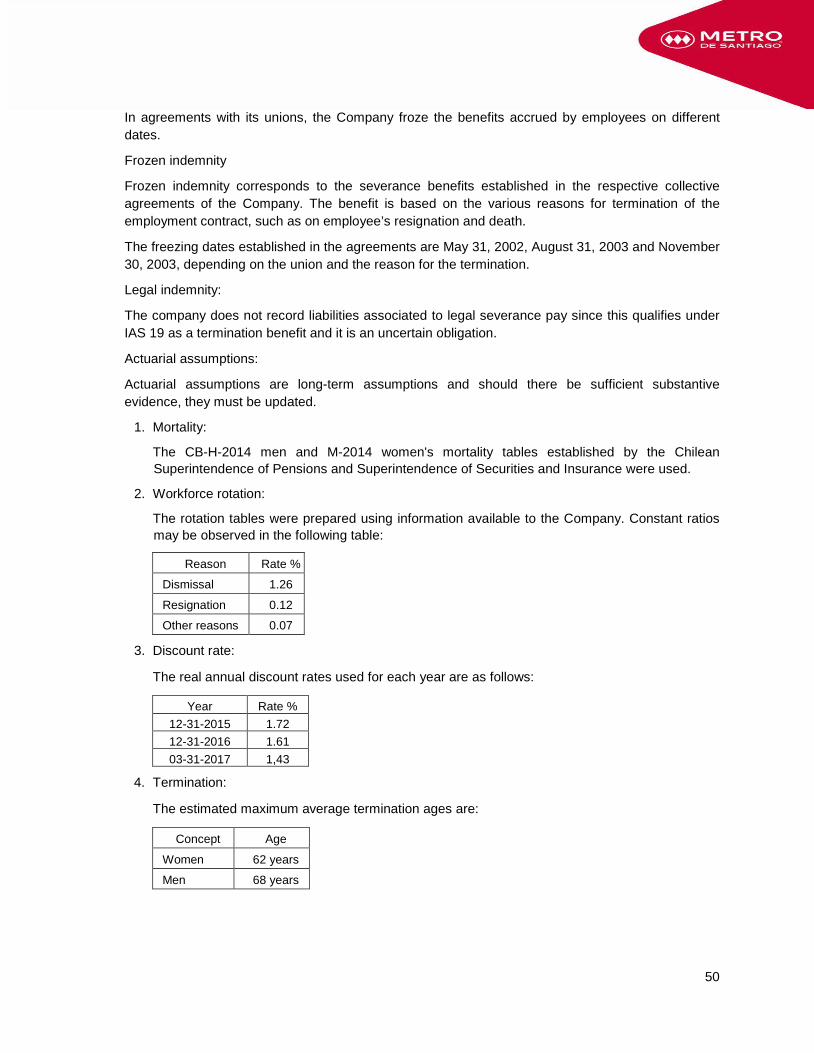
50
In agreements with its unions, the Company froze the benefits accrued by employees on different dates.
Frozen indemnity
Frozen indemnity corresponds to the severance benefits established in the respective collective agreements of the Company. The benefit is based on the various reasons for termination of the employment contract, such as on employee’s resignation and death.
The freezing dates established in the agreements are May 31, 2002, August 31, 2003 and November 30, 2003, depending on the union and the reason for the termination.
Legal indemnity:
The company does not record liabilities associated to legal severance pay since this qualifies under IAS 19 as a termination benefit and it is an uncertain obligation.
Actuarial assumptions:
Actuarial assumptions are long-term assumptions and should there be sufficient substantive evidence, they must be updated.
1. Mortality:
The CB-H-2014 men and M-2014 women's mortality tables established by the Chilean Superintendence of Pensions and Superintendence of Securities and Insurance were used.
2. Workforce rotation:
The rotation tables were prepared using information available to the Company. Constant ratios may be observed in the following table:
Reason Rate %
Dismissal 1.26
Resignation 0.12
Other reasons 0.07
3. Discount rate:
The real annual discount rates used for each year are as follows:
Year Rate % 12-31-2015 1.72 12-31-2016 1.61 03-31-2017 1,43
4. Termination:
The estimated maximum average termination ages are:
Concept Age
Women 62 years
Men 68 years
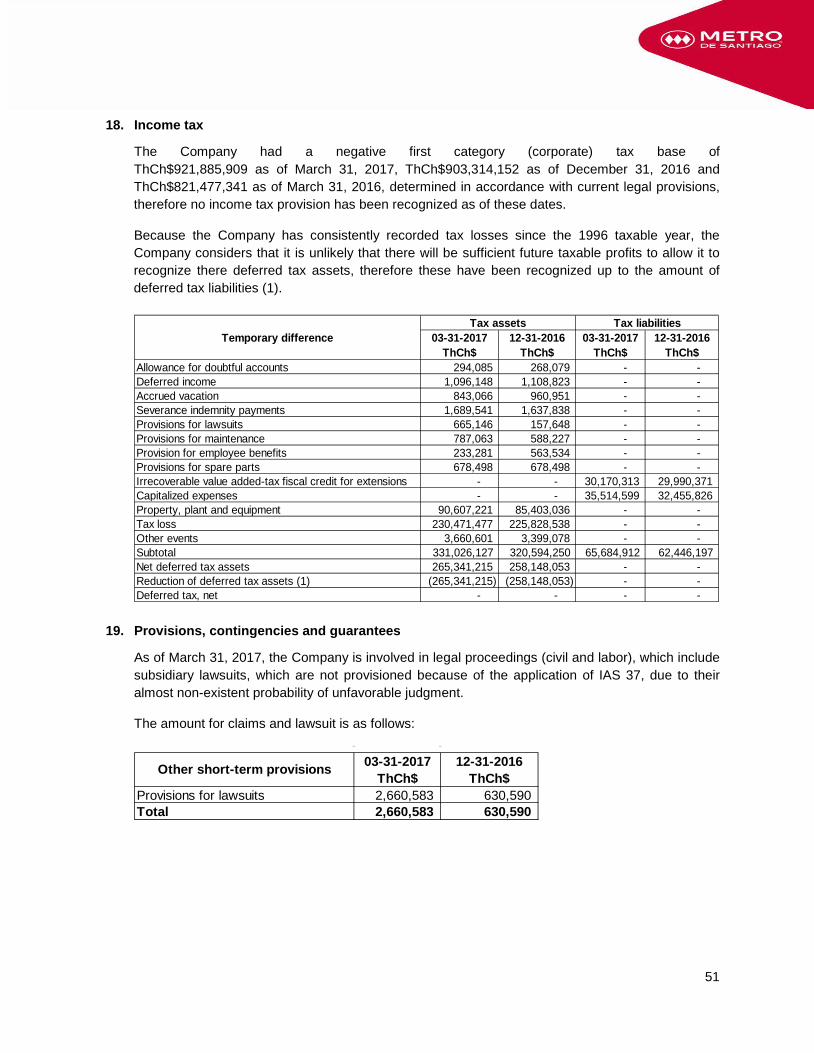
51
18. Income tax
The Company had a negative first category (corporate) tax base of ThCh$921,885,909 as of March 31, 2017, ThCh$903,314,152 as of December 31, 2016 and ThCh$821,477,341 as of March 31, 2016, determined in accordance with current legal provisions, therefore no income tax provision has been recognized as of these dates.
Because the Company has consistently recorded tax losses since the 1996 taxable year, the Company considers that it is unlikely that there will be sufficient future taxable profits to allow it to recognize there deferred tax assets, therefore these have been recognized up to the amount of deferred tax liabilities (1).
Temporary difference 03-31-2017 12-31-2016 03-31-2017 12-31-2016ThCh$ ThCh$ ThCh$ ThCh$
Allowance for doubtful accounts 294,085 268,079 - - Deferred income 1,096,148 1,108,823 - - Accrued vacation 843,066 960,951 - - Severance indemnity payments 1,689,541 1,637,838 - - Provisions for lawsuits 665,146 157,648 - - Provisions for maintenance 787,063 588,227 - - Provision for employee benefits 233,281 563,534 - - Provisions for spare parts 678,498 678,498 - - Irrecoverable value added-tax fiscal credit for extensions - - 30,170,313 29,990,371Capitalized expenses - - 35,514,599 32,455,826Property, plant and equipment 90,607,221 85,403,036 - - Tax loss 230,471,477 225,828,538 - - Other events 3,660,601 3,399,078 - - Subtotal 331,026,127 320,594,250 65,684,912 62,446,197Net deferred tax assets 265,341,215 258,148,053 - - Reduction of deferred tax assets (1) (265,341,215) (258,148,053) - - Deferred tax, net - - - -
Tax assets Tax liabilities
19. Provisions, contingencies and guarantees
As of March 31, 2017, the Company is involved in legal proceedings (civil and labor), which include subsidiary lawsuits, which are not provisioned because of the application of IAS 37, due to their almost non-existent probability of unfavorable judgment.
The amount for claims and lawsuit is as follows:
03-31-2017 12-31-2016ThCh$ ThCh$
Provisions for lawsuits 2,660,583 630,590Total 2,660,583 630,590
Other short-term provisions
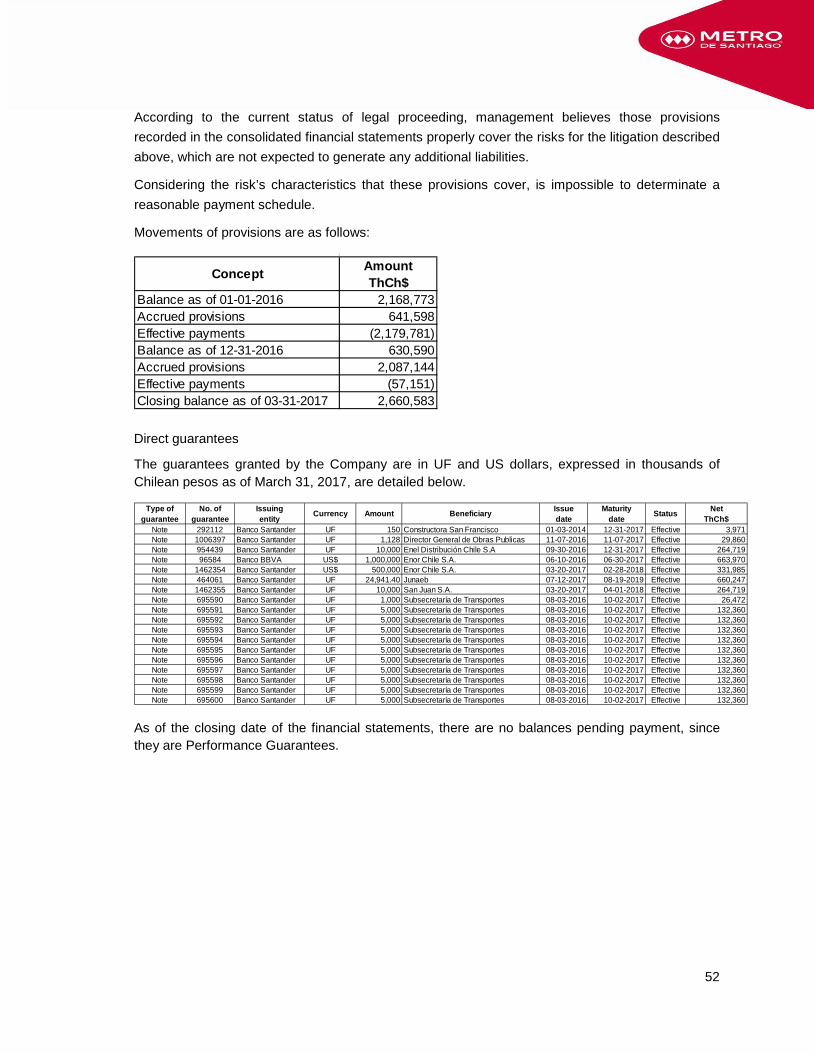
52
According to the current status of legal proceeding, management believes those provisions recorded in the consolidated financial statements properly cover the risks for the litigation described above, which are not expected to generate any additional liabilities.
Considering the risk’s characteristics that these provisions cover, is impossible to determinate a reasonable payment schedule.
Movements of provisions are as follows:
AmountThCh$
Balance as of 01-01-2016 2,168,773Accrued provisions 641,598Effective payments (2,179,781)Balance as of 12-31-2016 630,590Accrued provisions 2,087,144Effective payments (57,151)Closing balance as of 03-31-2017 2,660,583
Concept
Direct guarantees
The guarantees granted by the Company are in UF and US dollars, expressed in thousands of Chilean pesos as of March 31, 2017, are detailed below.
Type of No. of Issuing Issue Maturity Netguarantee guarantee entity date date ThCh$
Note 292112 Banco Santander UF 150 Constructora San Francisco 01-03-2014 12-31-2017 Effective 3,971Note 1006397 Banco Santander UF 1,128 Director General de Obras Publicas 11-07-2016 11-07-2017 Effective 29,860Note 954439 Banco Santander UF 10,000 Enel Distribución Chile S.A 09-30-2016 12-31-2017 Effective 264,719Note 96584 Banco BBVA US$ 1,000,000 Enor Chile S.A. 06-10-2016 06-30-2017 Effective 663,970Note 1462354 Banco Santander US$ 500,000 Enor Chile S.A. 03-20-2017 02-28-2018 Effective 331,985Note 464061 Banco Santander UF 24,941.40 Junaeb 07-12-2017 08-19-2019 Effective 660,247Note 1462355 Banco Santander UF 10,000 San Juan S.A. 03-20-2017 04-01-2018 Effective 264,719Note 695590 Banco Santander UF 1,000 Subsecretaría de Transportes 08-03-2016 10-02-2017 Effective 26,472Note 695591 Banco Santander UF 5,000 Subsecretaría de Transportes 08-03-2016 10-02-2017 Effective 132,360Note 695592 Banco Santander UF 5,000 Subsecretaría de Transportes 08-03-2016 10-02-2017 Effective 132,360Note 695593 Banco Santander UF 5,000 Subsecretaría de Transportes 08-03-2016 10-02-2017 Effective 132,360Note 695594 Banco Santander UF 5,000 Subsecretaría de Transportes 08-03-2016 10-02-2017 Effective 132,360Note 695595 Banco Santander UF 5,000 Subsecretaría de Transportes 08-03-2016 10-02-2017 Effective 132,360Note 695596 Banco Santander UF 5,000 Subsecretaría de Transportes 08-03-2016 10-02-2017 Effective 132,360Note 695597 Banco Santander UF 5,000 Subsecretaría de Transportes 08-03-2016 10-02-2017 Effective 132,360Note 695598 Banco Santander UF 5,000 Subsecretaría de Transportes 08-03-2016 10-02-2017 Effective 132,360Note 695599 Banco Santander UF 5,000 Subsecretaría de Transportes 08-03-2016 10-02-2017 Effective 132,360Note 695600 Banco Santander UF 5,000 Subsecretaría de Transportes 08-03-2016 10-02-2017 Effective 132,360
Currency Amount StatusBeneficiary
As of the closing date of the financial statements, there are no balances pending payment, since they are Performance Guarantees.
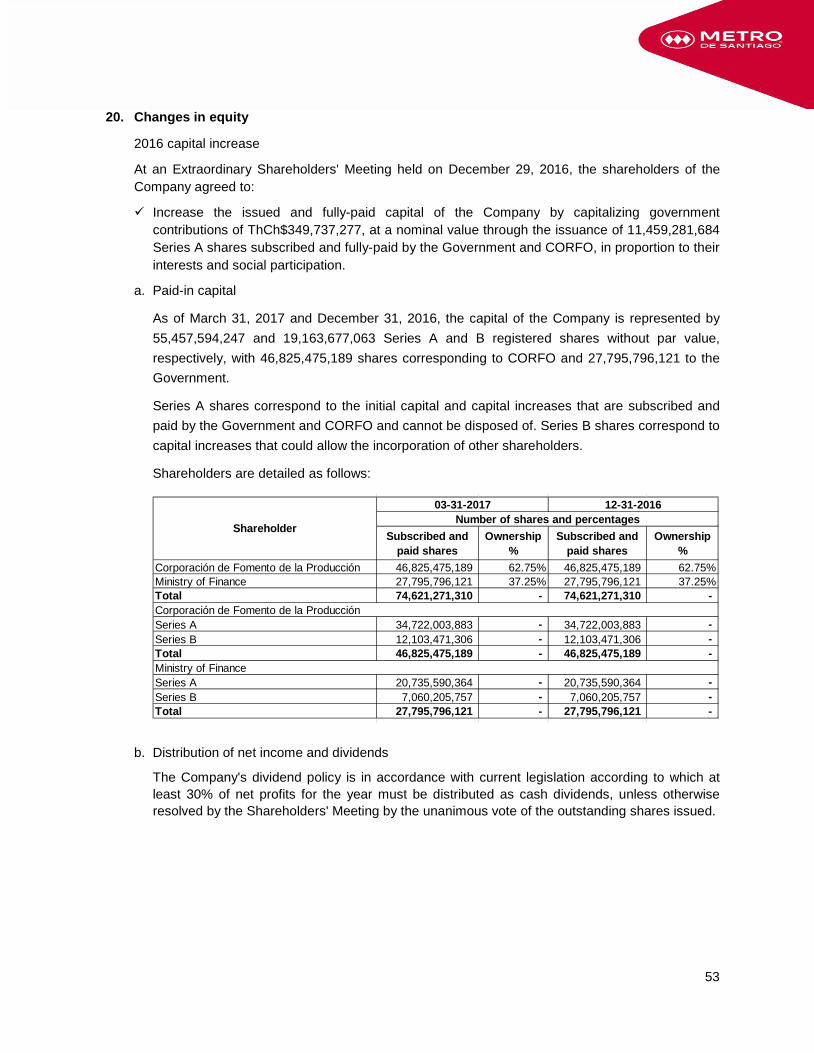
53
20. Changes in equity
2016 capital increase
At an Extraordinary Shareholders' Meeting held on December 29, 2016, the shareholders of the Company agreed to:
Increase the issued and fully-paid capital of the Company by capitalizing government contributions of ThCh$349,737,277, at a nominal value through the issuance of 11,459,281,684 Series A shares subscribed and fully-paid by the Government and CORFO, in proportion to their interests and social participation.
a. Paid-in capital
As of March 31, 2017 and December 31, 2016, the capital of the Company is represented by 55,457,594,247 and 19,163,677,063 Series A and B registered shares without par value, respectively, with 46,825,475,189 shares corresponding to CORFO and 27,795,796,121 to the Government.
Series A shares correspond to the initial capital and capital increases that are subscribed and paid by the Government and CORFO and cannot be disposed of. Series B shares correspond to capital increases that could allow the incorporation of other shareholders.
Shareholders are detailed as follows:
Subscribed and paid shares
Ownership %
Subscribed and paid shares
Ownership %
Corporación de Fomento de la Producción 46,825,475,189 62.75% 46,825,475,189 62.75%Ministry of Finance 27,795,796,121 37.25% 27,795,796,121 37.25%Total 74,621,271,310 - 74,621,271,310 - Corporación de Fomento de la ProducciónSeries A 34,722,003,883 - 34,722,003,883 - Series B 12,103,471,306 - 12,103,471,306 - Total 46,825,475,189 - 46,825,475,189 - Ministry of FinanceSeries A 20,735,590,364 - 20,735,590,364 - Series B 7,060,205,757 - 7,060,205,757 - Total 27,795,796,121 - 27,795,796,121 -
Shareholder
03-31-2017 12-31-2016Number of shares and percentages
b. Distribution of net income and dividends
The Company's dividend policy is in accordance with current legislation according to which at least 30% of net profits for the year must be distributed as cash dividends, unless otherwise resolved by the Shareholders' Meeting by the unanimous vote of the outstanding shares issued.
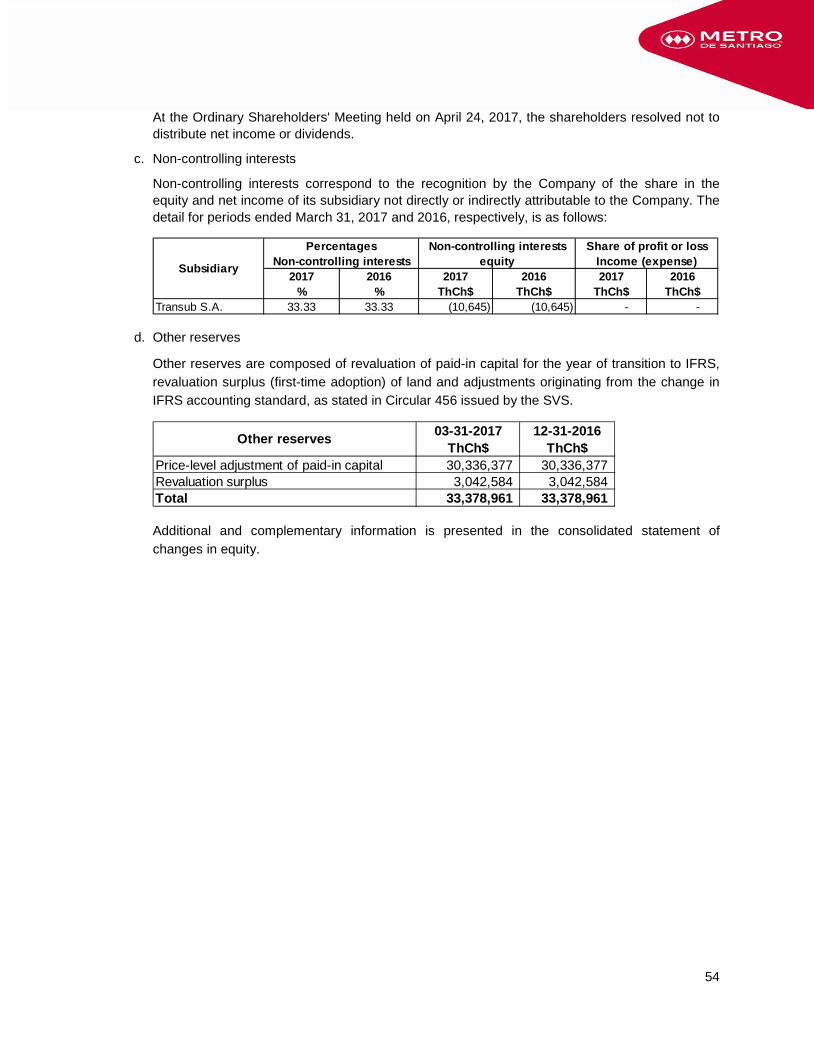
54
At the Ordinary Shareholders' Meeting held on April 24, 2017, the shareholders resolved not to distribute net income or dividends.
c. Non-controlling interests
Non-controlling interests correspond to the recognition by the Company of the share in the equity and net income of its subsidiary not directly or indirectly attributable to the Company. The detail for periods ended March 31, 2017 and 2016, respectively, is as follows:
2017 2016 2017 2016 2017 2016% % ThCh$ ThCh$ ThCh$ ThCh$
Transub S.A. 33.33 33.33 (10,645) (10,645) - -
Subsidiary
Percentages Non-controlling interests Share of profit or lossNon-controlling interests equity Income (expense)
d. Other reserves
Other reserves are composed of revaluation of paid-in capital for the year of transition to IFRS, revaluation surplus (first-time adoption) of land and adjustments originating from the change in IFRS accounting standard, as stated in Circular 456 issued by the SVS.
03-31-2017 12-31-2016ThCh$ ThCh$
Price-level adjustment of paid-in capital 30,336,377 30,336,377 Revaluation surplus 3,042,584 3,042,584 Total 33,378,961 33,378,961
Other reserves
Additional and complementary information is presented in the consolidated statement of changes in equity.
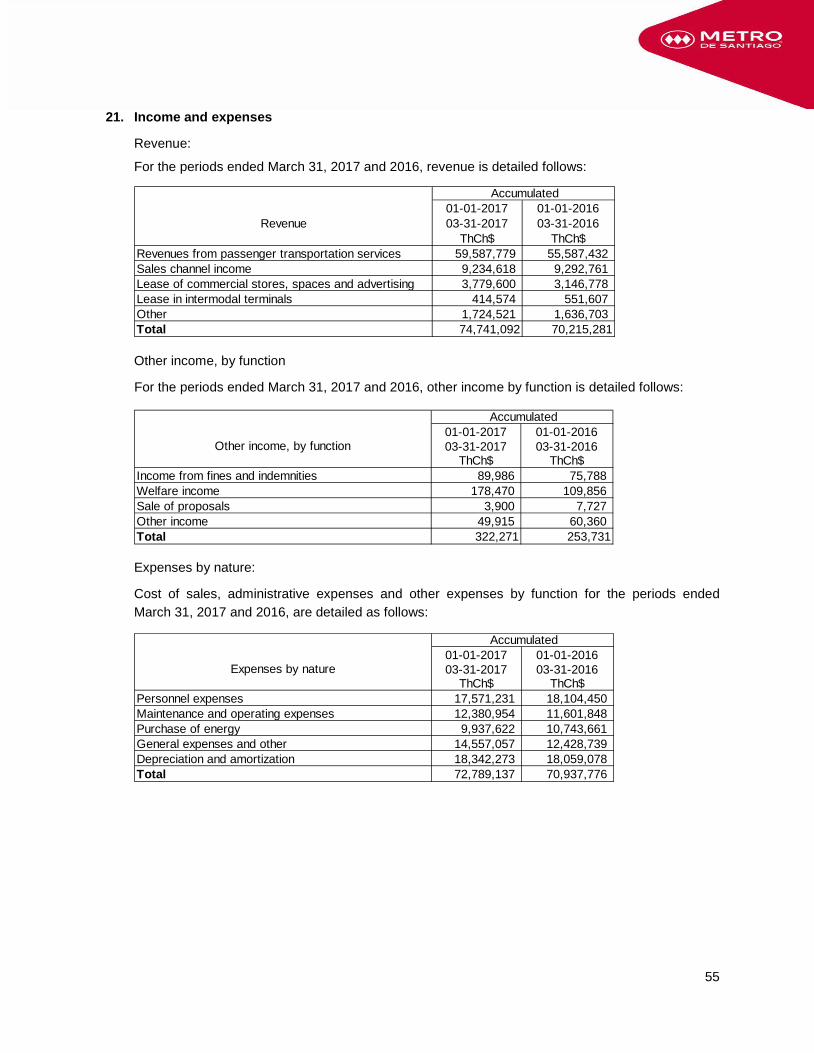
55
21. Income and expenses
Revenue:
For the periods ended March 31, 2017 and 2016, revenue is detailed follows:
01-01-2017 01-01-2016Revenue 03-31-2017 03-31-2016
ThCh$ ThCh$Revenues from passenger transportation services 59,587,779 55,587,432 Sales channel income 9,234,618 9,292,761 Lease of commercial stores, spaces and advertising 3,779,600 3,146,778 Lease in intermodal terminals 414,574 551,607 Other 1,724,521 1,636,703 Total 74,741,092 70,215,281
Accumulated
Other income, by function
For the periods ended March 31, 2017 and 2016, other income by function is detailed follows:
01-01-2017 01-01-201603-31-2017 03-31-2016
ThCh$ ThCh$Income from fines and indemnities 89,986 75,788 Welfare income 178,470 109,856 Sale of proposals 3,900 7,727 Other income 49,915 60,360 Total 322,271 253,731
Accumulated
Other income, by function
Expenses by nature:
Cost of sales, administrative expenses and other expenses by function for the periods ended March 31, 2017 and 2016, are detailed as follows:
01-01-2017 01-01-201603-31-2017 03-31-2016
ThCh$ ThCh$Personnel expenses 17,571,231 18,104,450 Maintenance and operating expenses 12,380,954 11,601,848 Purchase of energy 9,937,622 10,743,661 General expenses and other 14,557,057 12,428,739 Depreciation and amortization 18,342,273 18,059,078 Total 72,789,137 70,937,776
Accumulated
Expenses by nature
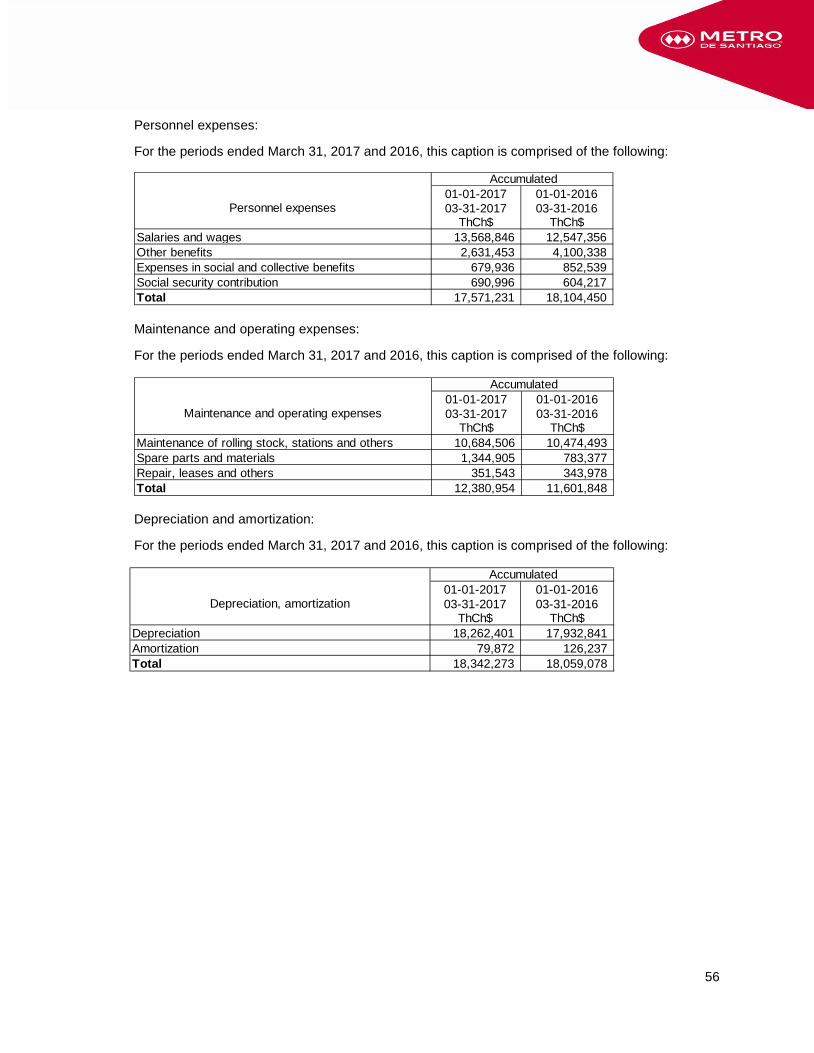
56
Personnel expenses:
For the periods ended March 31, 2017 and 2016, this caption is comprised of the following:
01-01-2017 01-01-201603-31-2017 03-31-2016
ThCh$ ThCh$Salaries and wages 13,568,846 12,547,356 Other benefits 2,631,453 4,100,338 Expenses in social and collective benefits 679,936 852,539 Social security contribution 690,996 604,217 Total 17,571,231 18,104,450
Accumulated
Personnel expenses
Maintenance and operating expenses:
For the periods ended March 31, 2017 and 2016, this caption is comprised of the following:
01-01-2017 01-01-201603-31-2017 03-31-2016
ThCh$ ThCh$Maintenance of rolling stock, stations and others 10,684,506 10,474,493 Spare parts and materials 1,344,905 783,377 Repair, leases and others 351,543 343,978 Total 12,380,954 11,601,848
Maintenance and operating expenses
Accumulated
Depreciation and amortization:
For the periods ended March 31, 2017 and 2016, this caption is comprised of the following:
01-01-2017 01-01-201603-31-2017 03-31-2016
ThCh$ ThCh$Depreciation 18,262,401 17,932,841 Amortization 79,872 126,237 Total 18,342,273 18,059,078
Depreciation, amortization
Accumulated
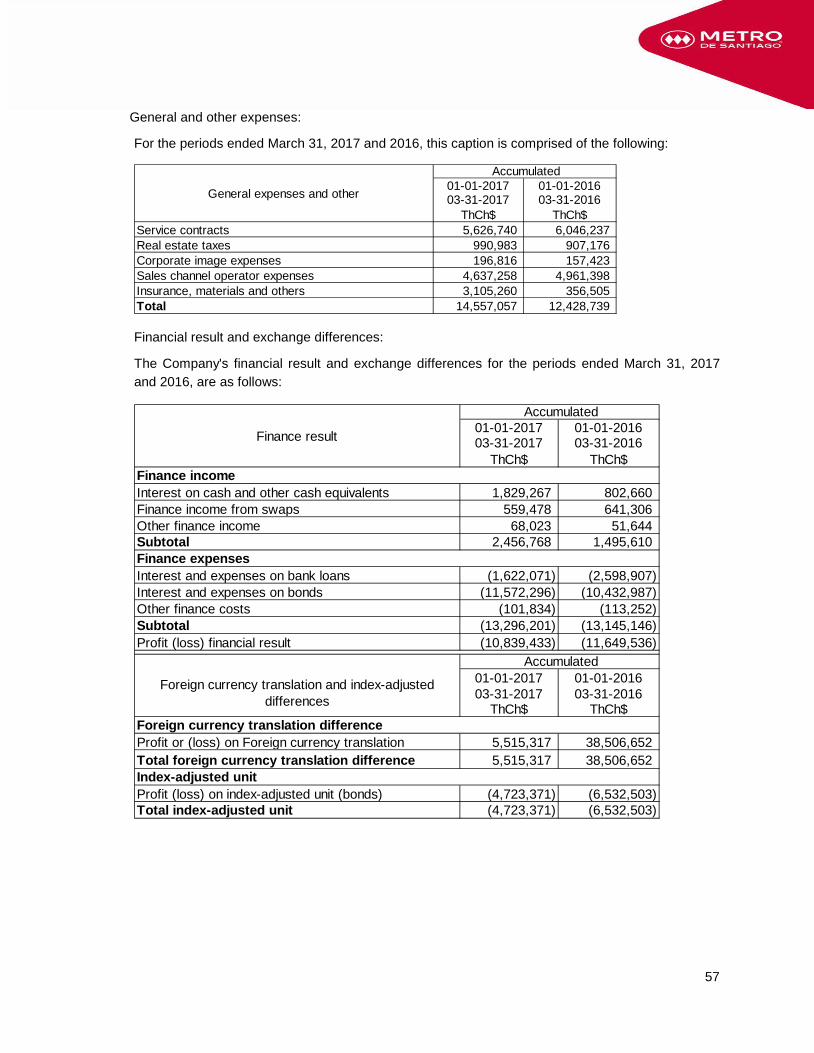
57
General and other expenses:
For the periods ended March 31, 2017 and 2016, this caption is comprised of the following:
01-01-2017 01-01-201603-31-2017 03-31-2016
ThCh$ ThCh$Service contracts 5,626,740 6,046,237 Real estate taxes 990,983 907,176 Corporate image expenses 196,816 157,423 Sales channel operator expenses 4,637,258 4,961,398 Insurance, materials and others 3,105,260 356,505 Total 14,557,057 12,428,739
Accumulated
General expenses and other
Financial result and exchange differences:
The Company's financial result and exchange differences for the periods ended March 31, 2017 and 2016, are as follows:
01-01-2017 01-01-201603-31-2017 03-31-2016
ThCh$ ThCh$Finance incomeInterest on cash and other cash equivalents 1,829,267 802,660 Finance income from swaps 559,478 641,306 Other finance income 68,023 51,644 Subtotal 2,456,768 1,495,610 Finance expenses Interest and expenses on bank loans (1,622,071) (2,598,907) Interest and expenses on bonds (11,572,296) (10,432,987) Other finance costs (101,834) (113,252) Subtotal (13,296,201) (13,145,146) Profit (loss) financial result (10,839,433) (11,649,536)
01-01-2017 01-01-201603-31-2017 03-31-2016
ThCh$ ThCh$Foreign currency translation difference Profit or (loss) on Foreign currency translation 5,515,317 38,506,652 Total foreign currency translation difference 5,515,317 38,506,652 Index-adjusted unitProfit (loss) on index-adjusted unit (bonds) (4,723,371) (6,532,503) Total index-adjusted unit (4,723,371) (6,532,503)
Foreign currency translation and index-adjusted differences
Accumulated
Accumulated
Finance result
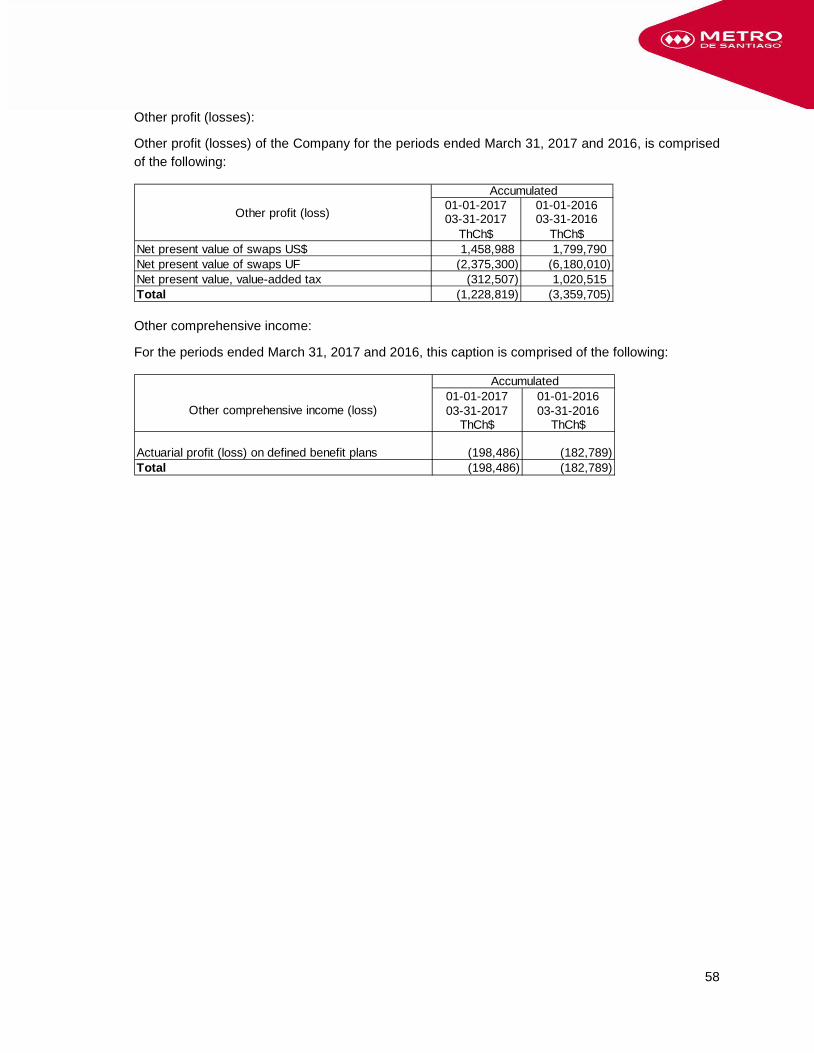
58
Other profit (losses):
Other profit (losses) of the Company for the periods ended March 31, 2017 and 2016, is comprised of the following:
01-01-2017 01-01-201603-31-2017 03-31-2016
ThCh$ ThCh$Net present value of swaps US$ 1,458,988 1,799,790 Net present value of swaps UF (2,375,300) (6,180,010) Net present value, value-added tax (312,507) 1,020,515 Total (1,228,819) (3,359,705)
Other profit (loss)
Accumulated
Other comprehensive income:
For the periods ended March 31, 2017 and 2016, this caption is comprised of the following:
01-01-2017 01-01-201603-31-2017 03-31-2016
ThCh$ ThCh$
Actuarial profit (loss) on defined benefit plans (198,486) (182,789) Total (198,486) (182,789)
Other comprehensive income (loss)
Accumulated
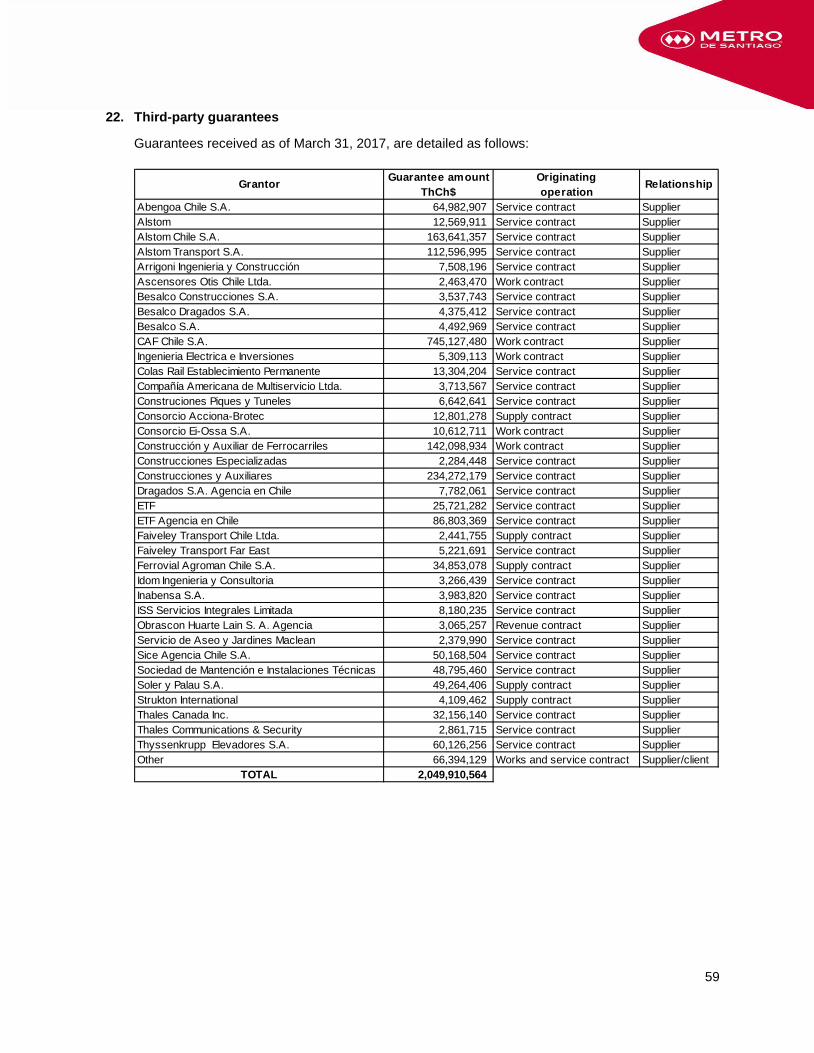
59
22. Third-party guarantees
Guarantees received as of March 31, 2017, are detailed as follows:
Guarantee amount Originating ThCh$ operation
Abengoa Chile S.A. 64,982,907 Service contract SupplierAlstom 12,569,911 Service contract SupplierAlstom Chile S.A. 163,641,357 Service contract SupplierAlstom Transport S.A. 112,596,995 Service contract SupplierArrigoni Ingenieria y Construcción 7,508,196 Service contract SupplierAscensores Otis Chile Ltda. 2,463,470 Work contract SupplierBesalco Construcciones S.A. 3,537,743 Service contract SupplierBesalco Dragados S.A. 4,375,412 Service contract SupplierBesalco S.A. 4,492,969 Service contract SupplierCAF Chile S.A. 745,127,480 Work contract SupplierIngenieria Electrica e Inversiones 5,309,113 Work contract SupplierColas Rail Establecimiento Permanente 13,304,204 Service contract SupplierCompañía Americana de Multiservicio Ltda. 3,713,567 Service contract SupplierConstruciones Piques y Tuneles 6,642,641 Service contract SupplierConsorcio Acciona-Brotec 12,801,278 Supply contract SupplierConsorcio Ei-Ossa S.A. 10,612,711 Work contract SupplierConstrucción y Auxiliar de Ferrocarriles 142,098,934 Work contract SupplierConstrucciones Especializadas 2,284,448 Service contract SupplierConstrucciones y Auxiliares 234,272,179 Service contract SupplierDragados S.A. Agencia en Chile 7,782,061 Service contract SupplierETF 25,721,282 Service contract SupplierETF Agencia en Chile 86,803,369 Service contract SupplierFaiveley Transport Chile Ltda. 2,441,755 Supply contract SupplierFaiveley Transport Far East 5,221,691 Service contract SupplierFerrovial Agroman Chile S.A. 34,853,078 Supply contract SupplierIdom Ingenieria y Consultoria 3,266,439 Service contract SupplierInabensa S.A. 3,983,820 Service contract SupplierISS Servicios Integrales Limitada 8,180,235 Service contract SupplierObrascon Huarte Lain S. A. Agencia 3,065,257 Revenue contract SupplierServicio de Aseo y Jardines Maclean 2,379,990 Service contract SupplierSice Agencia Chile S.A. 50,168,504 Service contract SupplierSociedad de Mantención e Instalaciones Técnicas 48,795,460 Service contract SupplierSoler y Palau S.A. 49,264,406 Supply contract SupplierStrukton International 4,109,462 Supply contract SupplierThales Canada Inc. 32,156,140 Service contract SupplierThales Communications & Security 2,861,715 Service contract SupplierThyssenkrupp Elevadores S.A. 60,126,256 Service contract SupplierOther 66,394,129 Works and service contract Supplier/client
TOTAL 2,049,910,564
Grantor Relationship
60
23. Risk management policies
The Company is exposed to several risks which are inherent to the activities that are carried out in the public passenger transportation services, in addition to risks of an economic and financial nature associated to changes in market conditions or fortuitous or force majeure cases, among others.
23.1 Description of the market in which the Company operates
The main market in which the Company participates is that of public transportation of passengers in the Metropolitan Region of Santiago and is composed of users seeking a quick and safe journey.
Secondary activities to the Company's main line of business include collection of transportation fees and sale of means of payment (Tarjeta Bip and tickets), leasing of advertising spaces, and leasing of business premises at the network stations, among others.
Rates
On February 10, 2007, the Company became part of the Integrated Public Passenger Transportation System of Santiago, or Transantiago, and its fare revenues was originally based on the effectively confirmed number of passengers transported and the technical tariff established in Exhibit 1 of the Tender Documents for the Use of the Thoroughfares of the City of Santiago.
On December 14, 2012 a new transportation agreement was signed by the Company with the Ministry of Transportation and Telecommunications of Chile to replace the aforementioned Exhibit 1, which established a flat-rate technical tariff of Ch$302.06 per confirmed transported passenger, taking December 2012 as a base, and which is updated monthly by the indexation polynomial, included in this new agreement, which takes into consideration the variation of the variables that compose the Company's long-term cost structure (CPI, US dollar, euro, price of power and electric energy). This allows for a natural match in case of cost variations, due to an increase in any of the variables that compose the polynomial.
The fare paid by the public is different than the one received by the Company per transported passenger. In March 2017, customers paid Ch$740 at peak hours, Ch$660 at valley hours and Ch$610 at low hours, while, on average the Company received during the same month a technical tariff of Ch$394.55 per passenger.
As from July 1, 2013 starts the new contract between the Ministry of Transportation and Telecommunication of Chile and Metro S.A. to provide additional issuance, after-sales, trading services and charging of the public passenger transport system of Santiago.
Demand
To date, the Company is the structuring pillar of the Integrated System of Public Passengers Transportation (Transantiago) and during the period from January to March 2017 reached a level of 2.36 million trips on a business day.
The risk related to the demand of Metro passengers is mainly associated with the level of economic activity in Chile, level of use and quality of the ground passenger transportation service (buses). In fact, the demand for passenger transportation is derived from the rest of the
61
economic activities. During the period between January to March 2017, an increase of 4.0 million trips was observed, 2.7% compared to 2016, mainly due to an increase of 6.8% in passenger flow in March, due to an increase in business days and lower amount of holidays compared to the same period of 2016.
23.2 Financial risks
The main risks to which the Santiago Metro is exposed to and which arise from financial assets and liabilities are: market risk, liquidity risk and credit risk.
In loans with financial institutions, the nominal rate is similar to the effective rate since there are no additional transaction costs to be considered.
Market risk
The technical tariff received by the Company is updated monthly by the indexation polynomial which takes into consideration changes in the variables that compose the Company's long-term cost structure (CPI, US dollar, euro, price of power and electric energy). This allows for a natural hedge in case of cost variations due to an increase in certain variables that compose the polynomial.
To reduce the Company’s exposure to financial debt denominated in US dollars and to interest rate changes, the Company has a financial risks economic hedge policy. In the framework of this policy, the Company performed derivative transactions (cross currency swap ("CCS")) of MUS$68 as of March 31, 2017 (MUS$71 as of December 31, 2016), which do not meet the hedge accounting criteria.
In January 2017, the Company placed bonds in the international financial market for the second time for an amount of MUS$500 at a 30-year term with a rate of 5.151%, highlighting the high degree of participation from the foreign investors, which reached a supply of 8 times the placement amount.
Particularly, the Company is exposed to two market risks, which are: interest rate risk and foreign currency exchange risk.
Interest rate risk
Market risks include possible changes in the Libor rate, affecting foreign loans obtained by the Company at variable rates.
In order to mitigate the risks of interest rate fluctuation, the Company has entered into derivative transactions (cross currency swaps) and placed fixed rate bond in dollar and UF.
62
As of March 2017, the share of the debt at a variable rate records a significant change with respect to December 2016, as indicated in the following table:
03-31-2017 12-31-2016% %
Fixed rate 82.9 80.3Variable rate 17.1 19.7Total 100.0 100.0
Debt composition
In conducting a sensitivity analysis as of March 31, 2017, on the net debt at a variable Libor rate, not hedged by current derivatives, which amounts to MUS$544 (MUS$520 as of March 31, 2016), we note in the following table, the effect on profit or loss in a scenario where the Libor rate is increased by 100 basis points, would result in an annual increase in finance expenses of MUS$5.4 (MUS$5.2 as of December 31, 2016).
Equivalent in Total MUS$ %
Total debt (equivalent to MUS$) 3,172 100%Debt at LIBOR rate 560IRS 52CCS (68) Total variable rate debt 544 17%Total fixed rate debt 2,628 83%
Sensitivity analysis
Variation in financial expenses MCh$ Equivalent in MUS$
Impact on financial expenses of a variation of 100 basis points in LIBOR 3,612.1 5.4
Exchange rate risk and inflation
The Company has obligations with financial institutions and has issued bonds in foreign markets, agreed in foreign currencies, to finance the extensions in the Metro network. To minimize exchange currency risks, the Company has contracted cross currency swap (CCS) financial derivatives, which amount to MUS$68 as of March 31, 2017.
The Company is also confronted with inflationary risk, as it maintains a debt with bondholders related to bonds issued in the domestic market in UF.
The following table shows the composition of the Company's debt, expressed in millions of US dollars (considers current derivatives transactions):
Original Currency
Eq. in MUS$
Original Currency
Eq. in MUS$
Debt UF MUF 38,833 1,548 49% MUF 39,308 1,547 59%Debt US$ MUS$1,624 1,624 51% MUS$1,094 1,094 41%Total financial debt 3,172 100% 2,641 100%
%Financial debt structure03-31-2017
%12-31-2016
The structure of the financial debt as of March 31, 2017, is mainly denominated in UF 49% and in US dollars 51%.
63
This is in line with the operating flows of Metro, given the adjustment formula, which updates the Company's technical tariff in case of changes in the US dollar and the Euro, in addition to other variables, which produces a natural hedge in long-term operating cash flows.
When we analyze the sensitivity of the comprehensive income statement as of March 31, 2017, in case of a possible 10% depreciation/appreciation of the Chilean peso in respect to the US dollar, leaving all the rest of the parameters constant, we estimate that a loss or profit of ThCh$86,781,970.
Sensitivity analysis 10% depreciation 10% appreciationEffect on profit or loss as of March 2017 ThCh$ ThCh$
Impact on profit or loss of 10% variation in the Ch$/US$ exchange rate (86,781,970) 86,781,970
Likewise, an estimation in the event of a possible appreciation of 3% of the value of UF, considering that all other parameters remain constant, would result in a loss of ThCh$28,623,771.
Sensitivity analysis 3% appreciationEffect on profit or loss as of March 2017 ThCh$
Impact on profit or loss of 3% variation in UF 28,632,771
Liquidity risk
Income from tariffs associated with Metro passenger transportation, based on the new transport contract, are discounted daily from the funds collected by the Company's sales channel, generating the liquidity necessary to cover the Company's commitments. This income corresponds to 80% of total revenue.
Additionally, the Company has duly approved bank credit lines, which reduces liquidity risk (see Note 12).
The expiration of interest bearing debt, by terms, separated in principal and interest payable, is detailed as follows:
Up to 1 year 1 to 3 years 3 to 5 years Over 5 years TotalThCh$ ThCh$ ThCh$ ThCh$ ThCh$
Capital 141,201,576 223,731,562 160,374,072 1,581,126,898 2,106,434,108 Interests 86,057,936 252,154,420 154,980,687 629,567,378 1,122,760,421 Total 227,259,512 475,885,982 315,354,759 2,210,694,276 3,229,194,529
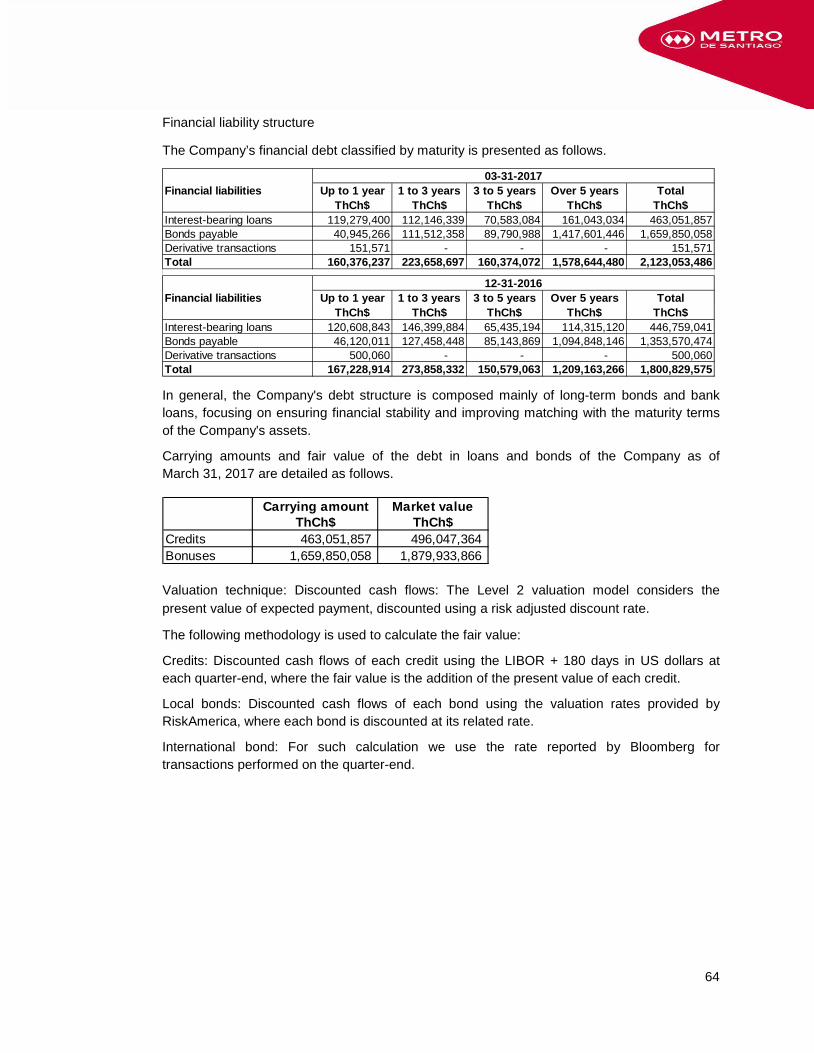
64
Financial liability structure
The Company’s financial debt classified by maturity is presented as follows.
Financial liabilities Up to 1 year 1 to 3 years 3 to 5 years Over 5 years TotalThCh$ ThCh$ ThCh$ ThCh$ ThCh$
Interest-bearing loans 119,279,400 112,146,339 70,583,084 161,043,034 463,051,857Bonds payable 40,945,266 111,512,358 89,790,988 1,417,601,446 1,659,850,058Derivative transactions 151,571 - - - 151,571Total 160,376,237 223,658,697 160,374,072 1,578,644,480 2,123,053,486
Financial liabilities Up to 1 year 1 to 3 years 3 to 5 years Over 5 years TotalThCh$ ThCh$ ThCh$ ThCh$ ThCh$
Interest-bearing loans 120,608,843 146,399,884 65,435,194 114,315,120 446,759,041Bonds payable 46,120,011 127,458,448 85,143,869 1,094,848,146 1,353,570,474Derivative transactions 500,060 - - - 500,060Total 167,228,914 273,858,332 150,579,063 1,209,163,266 1,800,829,575
03-31-2017
12-31-2016
In general, the Company's debt structure is composed mainly of long-term bonds and bank loans, focusing on ensuring financial stability and improving matching with the maturity terms of the Company's assets.
Carrying amounts and fair value of the debt in loans and bonds of the Company as of March 31, 2017 are detailed as follows.
Carrying amount Market value ThCh$ ThCh$
Credits 463,051,857 496,047,364Bonuses 1,659,850,058 1,879,933,866
Valuation technique: Discounted cash flows: The Level 2 valuation model considers the present value of expected payment, discounted using a risk adjusted discount rate.
The following methodology is used to calculate the fair value:
Credits: Discounted cash flows of each credit using the LIBOR + 180 days in US dollars at each quarter-end, where the fair value is the addition of the present value of each credit.
Local bonds: Discounted cash flows of each bond using the valuation rates provided by RiskAmerica, where each bond is discounted at its related rate.
International bond: For such calculation we use the rate reported by Bloomberg for transactions performed on the quarter-end.
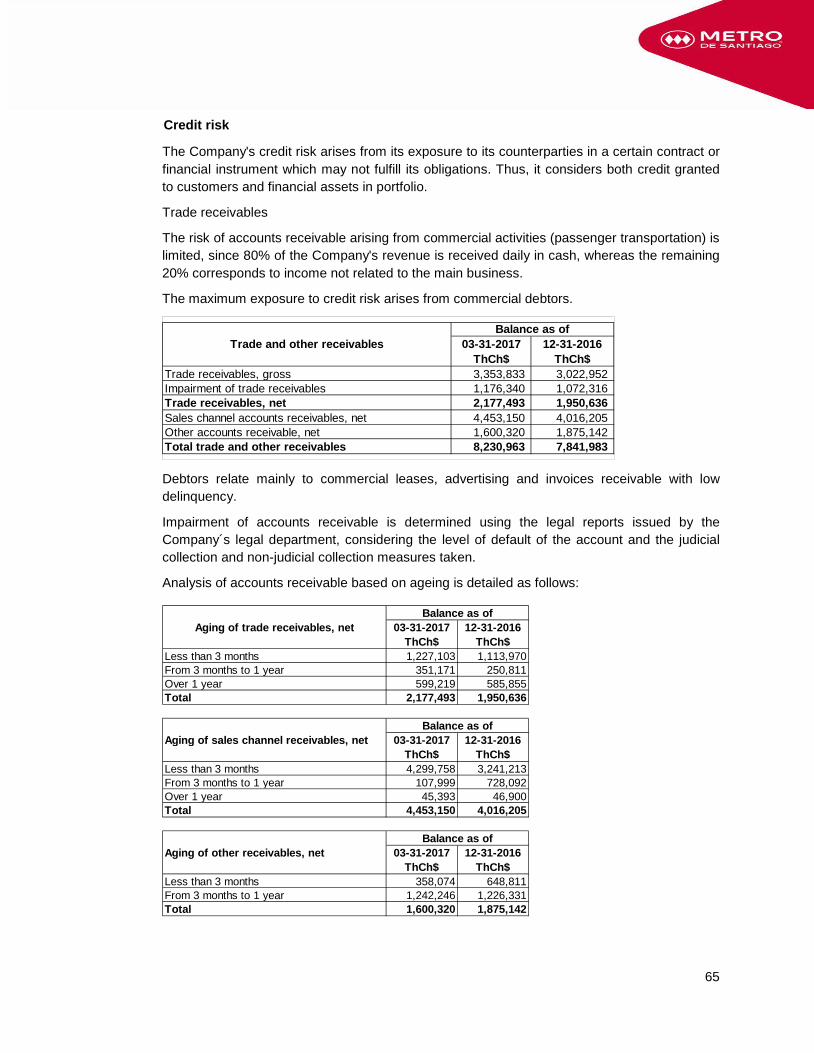
65
Credit risk
The Company's credit risk arises from its exposure to its counterparties in a certain contract or financial instrument which may not fulfill its obligations. Thus, it considers both credit granted to customers and financial assets in portfolio.
Trade receivables
The risk of accounts receivable arising from commercial activities (passenger transportation) is limited, since 80% of the Company's revenue is received daily in cash, whereas the remaining 20% corresponds to income not related to the main business.
The maximum exposure to credit risk arises from commercial debtors.
Trade and other receivables 03-31-2017 12-31-2016ThCh$ ThCh$
Trade receivables, gross 3,353,833 3,022,952Impairment of trade receivables 1,176,340 1,072,316Trade receivables, net 2,177,493 1,950,636Sales channel accounts receivables, net 4,453,150 4,016,205Other accounts receivable, net 1,600,320 1,875,142Total trade and other receivables 8,230,963 7,841,983
Balance as of
Debtors relate mainly to commercial leases, advertising and invoices receivable with low delinquency.
Impairment of accounts receivable is determined using the legal reports issued by the Company´s legal department, considering the level of default of the account and the judicial collection and non-judicial collection measures taken.
Analysis of accounts receivable based on ageing is detailed as follows:
Aging of trade receivables, net 03-31-2017 12-31-2016ThCh$ ThCh$
Less than 3 months 1,227,103 1,113,970From 3 months to 1 year 351,171 250,811Over 1 year 599,219 585,855Total 2,177,493 1,950,636
Aging of sales channel receivables, net 03-31-2017 12-31-2016ThCh$ ThCh$
Less than 3 months 4,299,758 3,241,213From 3 months to 1 year 107,999 728,092Over 1 year 45,393 46,900Total 4,453,150 4,016,205
Aging of other receivables, net 03-31-2017 12-31-2016ThCh$ ThCh$
Less than 3 months 358,074 648,811From 3 months to 1 year 1,242,246 1,226,331Total 1,600,320 1,875,142
Balance as of
Balance as of
Balance as of
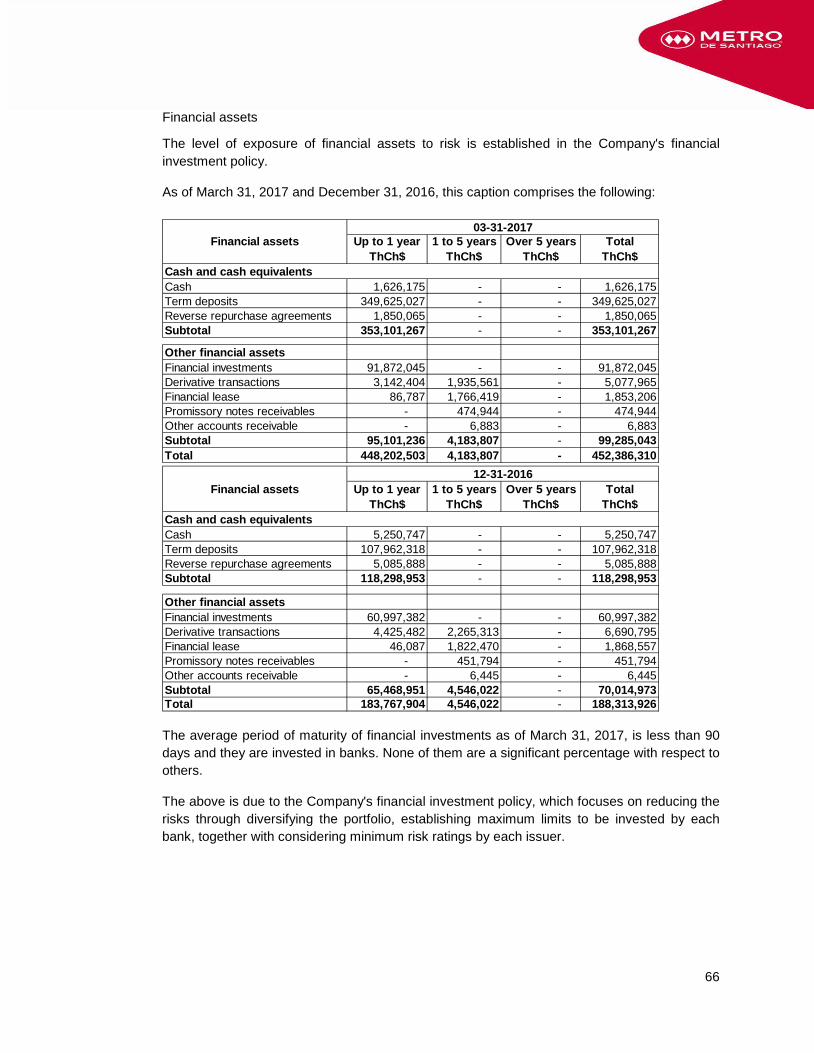
66
Financial assets
The level of exposure of financial assets to risk is established in the Company's financial investment policy.
As of March 31, 2017 and December 31, 2016, this caption comprises the following:
Financial assets Up to 1 year 1 to 5 years Over 5 years TotalThCh$ ThCh$ ThCh$ ThCh$
Cash and cash equivalentsCash 1,626,175 - - 1,626,175Term deposits 349,625,027 - - 349,625,027Reverse repurchase agreements 1,850,065 - - 1,850,065Subtotal 353,101,267 - - 353,101,267
Other financial assetsFinancial investments 91,872,045 - - 91,872,045Derivative transactions 3,142,404 1,935,561 - 5,077,965Financial lease 86,787 1,766,419 - 1,853,206Promissory notes receivables - 474,944 - 474,944Other accounts receivable - 6,883 - 6,883Subtotal 95,101,236 4,183,807 - 99,285,043Total 448,202,503 4,183,807 - 452,386,310
Financial assets Up to 1 year 1 to 5 years Over 5 years TotalThCh$ ThCh$ ThCh$ ThCh$
Cash and cash equivalentsCash 5,250,747 - - 5,250,747Term deposits 107,962,318 - - 107,962,318Reverse repurchase agreements 5,085,888 - - 5,085,888Subtotal 118,298,953 - - 118,298,953
Other financial assetsFinancial investments 60,997,382 - - 60,997,382Derivative transactions 4,425,482 2,265,313 - 6,690,795Financial lease 46,087 1,822,470 - 1,868,557Promissory notes receivables - 451,794 - 451,794Other accounts receivable - 6,445 - 6,445Subtotal 65,468,951 4,546,022 - 70,014,973Total 183,767,904 4,546,022 - 188,313,926
03-31-2017
12-31-2016
The average period of maturity of financial investments as of March 31, 2017, is less than 90 days and they are invested in banks. None of them are a significant percentage with respect to others.
The above is due to the Company's financial investment policy, which focuses on reducing the risks through diversifying the portfolio, establishing maximum limits to be invested by each bank, together with considering minimum risk ratings by each issuer.
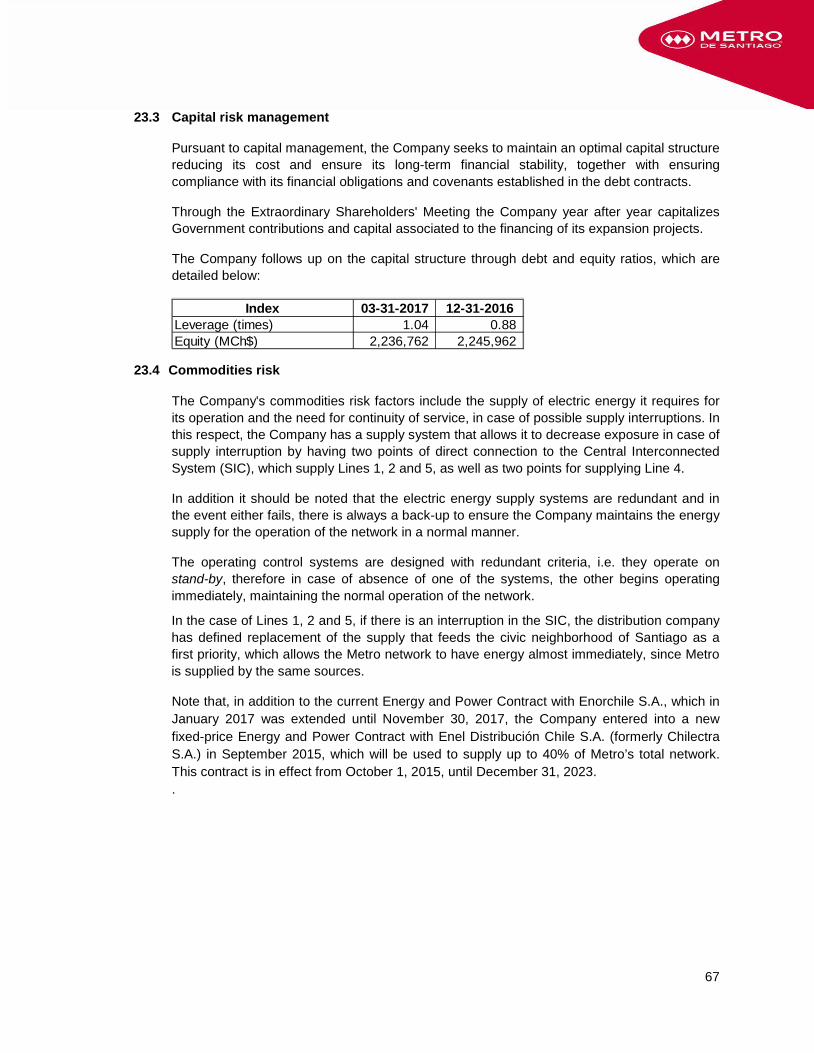
67
23.3 Capital risk management
Pursuant to capital management, the Company seeks to maintain an optimal capital structure reducing its cost and ensure its long-term financial stability, together with ensuring compliance with its financial obligations and covenants established in the debt contracts.
Through the Extraordinary Shareholders' Meeting the Company year after year capitalizes Government contributions and capital associated to the financing of its expansion projects.
The Company follows up on the capital structure through debt and equity ratios, which are detailed below:
Index 03-31-2017 12-31-2016Leverage (times) 1.04 0.88Equity (MCh$) 2,236,762 2,245,962
23.4 Commodities risk
The Company's commodities risk factors include the supply of electric energy it requires for its operation and the need for continuity of service, in case of possible supply interruptions. In this respect, the Company has a supply system that allows it to decrease exposure in case of supply interruption by having two points of direct connection to the Central Interconnected System (SIC), which supply Lines 1, 2 and 5, as well as two points for supplying Line 4.
In addition it should be noted that the electric energy supply systems are redundant and in the event either fails, there is always a back-up to ensure the Company maintains the energy supply for the operation of the network in a normal manner.
The operating control systems are designed with redundant criteria, i.e. they operate on stand-by, therefore in case of absence of one of the systems, the other begins operating immediately, maintaining the normal operation of the network.
In the case of Lines 1, 2 and 5, if there is an interruption in the SIC, the distribution company has defined replacement of the supply that feeds the civic neighborhood of Santiago as a first priority, which allows the Metro network to have energy almost immediately, since Metro is supplied by the same sources.
Note that, in addition to the current Energy and Power Contract with Enorchile S.A., which in January 2017 was extended until November 30, 2017, the Company entered into a new fixed-price Energy and Power Contract with Enel Distribución Chile S.A. (formerly Chilectra S.A.) in September 2015, which will be used to supply up to 40% of Metro’s total network. This contract is in effect from October 1, 2015, until December 31, 2023. .
68
24. Environment
Disbursements related to improvements and/or investments that directly or indirectly affect protection of the environment, for the periods ended March 31, 2017 and 2016, are detailed as follows:
01-01-2017 01-01-2016 01-01-2017 01-01-2016 2017 201803-31-2017 03-31-2016 03-31-2017 03-31-2016 Amount Amount
ThCh$ ThCh$ ThCh$ ThCh$ ThCh$ ThCh$Noise and vibrations - - 66,657 129,859 1,493,404 - Waste treatment 1,141 17,719 42,223 41,434 320,732 58,770Run-off water 10,985 31,620 - - 124,788 136,087Environmental management - - 238,761 271,229 596,994 - Monitoring of polluting parameters - 882 - - 41,536 - Total 12,126 50,221 347,641 442,522 2,577,454 194,857
Project
administrative expenses plant and equipment the futureAllocated to Allocated to property, Expenditures committed in
The aforementioned projects are currently in progress as of March 31, 2017.
25. Sanctions
During 2017 and 2016, the Company has not been sanctioned by the SVS or any other supervising entity.
26. Subsequent events
Through letter No.220 dated April 24, 2017, the Company informed that at the meeting held on the same date, the 26th Extraordinary Shareholders' Meeting was held and the following was agreed:
The Annual Report, Balance Sheet and Consolidated Financial Statements, and External Auditors'
Report for 2016 were approved, including the notes to the Consolidated Financial Statements, as
well as, the Board of Directors' expenses contained in the Annual Report.
The Company agreed not to distribute profit or dividends.
The Company established a dividends policy.
Mr. Rodrigo Azócar Hidalgo, Mrs. Paulina Soriano Fuenzalida, Mr. Carlos Mladinic Alonso, Mr.
Vicente Pardo Díaz, Mrs. Karen Poniachick Pollak, Mr. Claudio Soto Gamboa and Mr. Vladimir
Glasinovic Peña, were elected as the Company's Directors.
The Directors' remunerations were agreed.
KPMG Auditores Consultores Limitada was ratified as external auditor for the year 2017.
Empresas Feller Rate Clasificadora de Riesgo Ltda. and Clasificadora de Riesgo Humphreys Ltda.
were appointed as Risk Rating Agencies of local bonds issues of Metro S.A. during one year, which
can be renewed for two periods of one year.
The e-newspaper La Nación was selected to send summonings for the Shareholders' meetings.
69
Through letter No.225 dated April 27, 2017, the Company informed that at the meeting held on April 24, 2017, the Company's Board of Directors agreed to appoint Mr. Rodrigo Azócar Hidalgo as the Company's President and Mrs. Paulina Soriano Fuenzalida as Vice-President.
Except for that indicated above, between April 1 and May 8, 2017, there have been no other subsequent events that would significantly affect the Company's financial position or profit or loss.
Julio E. Pérez Silva General Accountant
Rubén Alvarado Vigar General Manager
ANALYSIS OF THE CONSOLIDATED FINANCIAL STATEMENTS
INTRODUCTION
This document aims to present an analysis of the economic/financial position of the Company and its subsidiary as of March 31, 2017, analyzing the financial structure and its main trends, through comparative tables of the Consolidated Statements of Financial Position as of March 31, 2017 and December 31, 2016, and the Consolidated Statements of Comprehensive Income as of as of March 31, 2017 and 2016, expressed in millions of Chilean pesos.
STATEMENT OF FINANCIAL POSITION
As of March 31, 2017, Total Assets and Liabilities amounted to MCh$ 4,573,684, reflecting an increase of MCh$ 348,127, equivalent to 8.2% compared to December 2016.
In terms of total assets, they are clearly dominated by the fixed portion of the resources. Accordingly, as of March 31, 2017, Property, Plant & Equipment and Net Investment Properties represent 88.9% of total Assets. Additionally, Current Assets and the Other Non-current Assets represent 10.4% and 0.7% of total Assets, respectively.
Net Property, Plant & Equipment and Investment Properties - commercial premises and other properties granted under operating lease - increased by 2.1% or MCh$ 84,702 – as of March 31, 2017 compared to December 2016, as a result of the acquisition of assets which amounted to -MCh$ 103,040- associated with expansion projects of the Metro subway network, mainly on Lines 3 and 6, that include MCh$ 99,317 for Works In Progress, MCh$ 2,695 for railway rolling stock and MCh$ 1,028 for Machinery, equipment and Other. This was offset by depreciation expenses associated with the Company's assets of MCh$ 18,192, and to a lesser extent MCh$ 76 for disposals. In addition, Investment Property decreased by MCh$ 70.
Current assets as of March 2017 increased by 125.4% - MCh$ 264,213 - compared to December 2016, mainly due to an increase in Cash and cash Equivalent of MCh$ 234,802, resulting from an increase in the level of investments in term deposits lower than 90 days of MCh$ 241,663, despite a decrease in cash on hand of MCh$ 3,625 and resale agreements of MCh$ 3,236. To a lesser extent, Other current financial assets increased by MCh$ 29,632, resulting from an increase in the level of investments in term deposits exceeding 90 days. All these investments are mainly due to proceeds from the last issue and placement of Series 2 bonds in the international market for MUS$500 on January 25, 2017, and fiscal contributions received from the Chilean Government. Other increases were reflected in trade and other receivables for MCh$ 389 and current tax assets for MCh$ 139. This is offset by a decrease in Other non-financial assets of MCh$ 564 and Inventories of MCh$ 185. Amongst the main components of Current assets, there are items including Cash and cash equivalents of MCh$ 353,101, Other current financial assets of MCh$ 95,101,-Financial investments greater than three months- Inventories of MCh$ 12,055, Trade receivables of MCh$ 8,231, Other non-financial assets of MCh$ 4,892 and Current tax assets of MCh$ 1,516.
Non-current assets excluding Property, plant and equipment and Investment Properties decreased by 2.4% or MCh$ 788 and the movement was mainly due to decreases in Other financial assets of MCh$ 362, Other non-financial assets of MCh$ 700 and non-current receivables increased by MCh$ 43. This is offset by an increase in Intangible assets of MCh$ 317.
In terms of total Liabilities, the main variations were reflected in non-current liabilities which increased by MCh$ 382,366, current liabilities and equity decreased by MCh$ 25,039 and MCh$ 9,200, respectively. The movement in non-current liabilities was due to an increase in Other non-current financial liabilities resulting from a second placement of Series 2 bonds in the international market - MUS$ 500 or MCh$ 322,250, Trade payables due to related parties, non-current of MCh$ 60,000, due to new contributions received from the Chilean Government for expansion projects of the Metro subway network (Lines 3 and 6) and to a lesser extent due to an increase in Non-current provisions for employee benefits of MCh$ 159. This was offset by a decrease in Other non-financial liabilities of MCh$ 43. Equity decreased because of an increase of MCh$ 9,200 in accumulated losses, due to the loss recognized in the first quarter of 2017. Current liabilities increased because of decreases in Trade payables of MCh$ 14,584, Other current financial liabilities of MCh$ 6,853, due to new maturity dates of short-term installments of Interest-bearing loans and employee benefits, current of MCh$ 6,779. This was offset by an increase in Other current non-financial liabilities of MCh$ 1,148, because of the refund of guarantees received from third parties and other short-term provisions of MCh$ 2,029.
Non-current liabilities of MCh$ 2,085,552 are composed of 47.6% or MCh$ 992,624 in foreign currency obligations, 47.5% or MCh$ 991,632 in obligations in local currency readjustable and 4.9% or MCh$ 101,296 in local currency non-readjustable. Interest-bearing loans of MCh$ 343,772 and Public obligations of MCh$ 648,852 are included in obligations in foreign currency with banks and financial institutions. The readjustable local currency component is comprised of Public obligations (Bonds) of MCh$ 970,053, Non-current provisions for employee benefits of MCh$ 13,678, Other non-current non-financial liabilities of MCh$ 3,304 and Other financial liabilities of MCh$ 4,597. The local currency component of MCh$ 101,296 is comprised of Accounts payable to related companies for the contributions received by the Chilean Government for various ongoing projects.
In terms of liquidity ratios, net working capital is positive by MCh$ 223,526, however, during 2017, it increased by MCh$ 289,252 compared to December 2016. Current liquidity ranged from 0.76 to 1.89 times and the acid ratio ranged from 0.43 to 1.40 times. All these changes are due to increases in Current assets of MCh$ 264,213 and a decrease in Current liabilities of MCh$ 25,039.
In terms of indebtedness ratios, total debt-to-equity ratio ranged from 0.88 to 1.04 times; the current portion of short-term debt from 13.96% to 10.76% and the portion of long-term debt from 86.04% to 89.24%.
STATEMENT OF COMPREHENSIVE INCOME
As of March 31, 2017, the Company recorded a Gross profit (Revenue less Cost of sales) of MCh$ 12,759, a Loss from results other than Cost of sales of MCh$ 21,762, reaching an after tax loss for the year of MCh$ 9,003. A loss of MCh$ 198 for Other comprehensive income is added to the previous result, with a total comprehensive loss of MCh$ 9,201.
As of March 31, 2017, operating income amounted to MCh$ 74,741, which represents an increase of MCh$ 4,526 (6.4%) when compared to the same period last year. The main increases include: Revenue from passenger transportation services of MCh$ 4,001 due to higher average prices of the technical fare per passenger of Ch$ 16.52 compared to 2017, due to increases in variables included in the indexation polynomial, mainly U.S. dollars and inflation. Notwithstanding this, as of March 2017, an increase of 4.0 million trips or -2.7%- was observed compared to the same period of 2016, mainly due to an increase of 6.8% in passenger flow during March 2017, because of an increase in business days and a lower
number of holidays compared to the same months of 2016. To a lesser extent, Rental income increased by MCh$ 495 and Other operating income increased by MCh$ 88, despite a decrease in Sales channel income of MCh$ 58.
Cost of sales of MCh$ 61,982 decreased by 3.8% or MCh$ 2,417 compared to March 2016, mainly due to a decrease in Personnel expenses of MCh$ 1,365, General expenses of MCh$ 934 and Energy expenses of MCh$ 806. This was offset by increases in Depreciation and amortization of MCh$ 283 and Operation and maintenance expenses of MCh$ 405.
Energy expenses decreased as a result of lower average prices compared to March 2016. Note that from September 2015, the Company signed a new electricity supply contract with Enel Distribución Chile S.A (former Chilectra S.A.), in addition to the current contract with Enorchile S.A. which is effective through March 31, 2017, where a fixed price is established, which will supply up to 40% of the total Metro energy supply. This contract is effective from October 1, 2015 through December 31, 2023.
General expenses included in cost of sales decreased, mainly due to lower costs related to the Sale channel management. Personnel expenses varied mainly due to lower employee benefit expenses. Movement in operation and maintenance expenses is explained by increases in expenses in contractor services for rolling stock, stations, railways and other maintenance contracts mainly due to higher train load and an increase in average amounts for such services.
Results other than gross profit, showed a loss of MCh$ 21,762 due to the negative effect of Finance expenses of MCh$ 13,296, External credits, Bonds and derivative transaction interests, Management fees of MCh$ 10,488, Results from Inflation Adjusted Units MCh$ 4,723, Other losses of MCh$ 1,229, Net swap valuation, Other expenses by function of MCh$ 186 and Depreciation and amortization of MCh$ 134. This was offset by the positive effects of Foreign currency exchange differences of MCh$ 5,515, Finance income of MCh$ 2,457 (Financial investment revenue) and Other income by function of MCh$ 322. Complementing the aforementioned, the profit result of the foreign currency exchange differences, was due to an appreciation of 0.82% of the Chilean peso compared to the US dollar (from Ch$ 669.47 in December 2016 to Ch$ 663.97 in March 2017), which generates a greater profit for the year 2017, mainly as a result of liabilities being held in US dollars.
Compared to the same period last year, Results other than gross profit increased their losses by MCh$ 32,442, because of the negative effects of Foreign currency exchange differences and Results from inflation-adjusted units, which decreased their gains by MCh$ 31,182 and Finance expenses which increased by MCh$ 151, Management fees, which increased by MCh$ 4,150 and other expenses by function increased by MCh$ 120. This was offset by the positive effects of the decrease in expenses, other losses and swap valuations of MCh$ 2,131, Financial income of MCh$ 962 and other expenses by function of MCh$ 68.
VALUATION OF MAIN ASSETS
No information is available in relation to differences between the carrying amounts and economic and/or market values that are worth mentioning, except for those that may arise in property, plant and equipment, given the particular characteristics of the Company's assets, such as tunnels, stations and civil works.
STATEMENT OF CASH FLOWS
Net cash generated from operating activities.
As of March 31, 2017, total net cash generated from operating activities was MCh$ 13,030, which at the same date in prior year was also positive by MCh$ 13,361. Positive cash flows include: Collection from sales of assets and the rendering of services of MCh$ 70,543, representing an increase of MCh$ 3,462 when compared to March 2016, which represents the main source of the Company's revenue, which are the transport of passengers, sales channel and non-tariff related revenue (leases). To a lesser extent Other operating activities amounted to MCh$ 2,354 and primarily include interests and financial investments of less than 90 days and other operating charges.
The negative operating cash flows consist of payments of MCh$ 36,012 to suppliers for the provision of goods and services, MCh$ 22,099 for payment to or on behalf of employees and MCh$ 1,756 for Other payments for operating activities associated with the payment of performance bonds for contracts, taxes and other operating payments.
Operating cash flows are of the same nature as in the prior year, reflecting a decrease in positive net cash flow of MCh$ 330 due to higher negative cash flows of MCh$ 5,007, and higher positive cash flows of MCh$ 4,677.
Net cash generated from financing activities.
Net cash flows as of March 31, 2017 was positive and amounted to MCh$ 370,419, while on the same date last year it amounted to MCh$ 108,094. As of March 2017, cash was obtained from Loans from related entities of MCh$ 60,000, related to contributions received from the Chilean Government for investment in projects, mainly associated with Lines 3 and 6. In addition, proceeds from a long-term loan received amounted to MCh$ 345,190, which includes a new placement of Series 2 Bonds of US$ 500,000,000 in the international market on January 25, 2017, in addition to Other cash receipts of MCh$ 10,582 from cash inflows associated with Cross Currency Swap derivative transactions.
Cash outflows include the Payment of loans -External loans and Public obligations- of MCh$ 17,835, Interest paid of MCh$ 18,185 -External loans and Bonds to the public- and Other cash outflows of MCh$ 9,333 associated with payments of Cross Currency Swap derivative transactions.
Compared to the same period last year, net positive cash flows increased by MCh$262,325, as a result of higher cash inflows of MCh$ 301,265, which are offset by lower cash inflows of MCh$ 30,000 and higher cash outflows of MCh$ 8,940. Among the positive variations are the increase in proceeds from long-term loans of MCh$ 293,814, other cash receipts of MCh$ 7,236 and lower cash outflows of MCh$ 215 for the payment of loans. Among the negative variances are the decrease in proceeds from loans from related entities of MCh$ 30,000, higher cash outflows of MCh$ 1,424 for payment of interests and higher cash outflows of MCh$ 7,516.
Net cash generated from investment activities.
As of March 31, 2017, investing activities recorded negative net cash flows of MCh$ 151,816, while at the same date last year net investing activities were also negative of MCh$ 118,434. Positive cash flows include: Other receipts of equity or debt instruments from other entities of MCh$ 60,804 relating to term deposit investments for periods greater than 90 days. Negative cash flows include: Purchase of property, plant and equipment of MCh$ 113,534, mainly associated with Line 3 and 6 projects, the
acquisition of intangible assets -software and transit easements- of MCh$ 4, Interest paid of MCh$ 8,511 (Financing Cost of International Bond and certain external loans), and Other payments related to the acquisition of debt instruments from other entities of MCh$ 90,571. Negative cash flows increased by MCh$ 33,382 compared to last year, due to higher cash outflows from debt securities from other entities (purchase greater than 90 days) of MCh$ 64,113, higher payments for the acquisition of property, plant and equipment of MCh$ 7,331 and higher interest paid of MCh$ 87. This was offset by an increase in cash inflows from debt securities from other entities (redemption) by MCh$ 38,043 and, to a lesser extent, by a decrease in the acquisition of intangible assets of MCh$ 106.
Increase (decrease) in cash and cash equivalents.
At the beginning of the year 2017, an opening balance of cash and cash equivalents (financial investments not exceeding 90 days) amounted to MCh$ 118,299. The closing balance of cash and cash equivalents as of March 31, 2017 amounted to MCh$ 353,101. Consequently, the net variation in cash and cash equivalents for the year was a positive variation of MCh$ 234,802.
In comparison with 2016, the opening balance of cash and cash equivalents amounted to MCh$ 152,906. The closing balance for cash and cash equivalents amounted to MCh$ 150,911; accordingly, the net change for the period was negative and amounted to MCh$ 1,995. The effects of the variation in exchange rates on cash and cash equivalents had a positive effect of MCh$ 3,169 as of March 31, 2017, as result of a decrease in the exchange rate, (0.8%) mainly US dollars. A positive effect of MCh$ 5,015 was recognized at the same date in the prior year.
MARKET RISK ANALYSIS
The Company faces various risks inherent to the activities performed in the public transportation of passengers, in addition to the risks associated with economic/financial changes in market conditions, accidental events or force majeure, among others.
Pricing structure.
The Company is part of the Integrated System of Public Passenger Transport of Santiago. Transantiago, and its tariff revenue is based on the number of transported passengers effectively validated and the technical fare established in Appendix No.1 based on the Tender Conditions for the use of Ways in Santiago.
On December 14, 2012, a new Transport agreement was entered into replacing the aforementioned Appendix No.1, where a flat fee of Ch$ 302.06 per validated transported passenger was established, using September 2012 as the basis. It is updated monthly by an indexation polynomial, which is included in such new agreement and results in an adjustment for fluctuations in variables associated with the structure of the Company’s long-term expenses (CPI, US dollars, Euros, price of power and electricity). This allows a natural hedge for changes in costs resulting from an increase in any of the variables included in such polynomial.
Passenger demand
The demand for passenger transport is driven by economic activities. During the period between January to March 2017, an increase of 4.0 million trips, a positive variation of 2.7% was observed, compared to 2016, mainly due to an increase of 6.8% in passenger flow in March, due to an increase in business days and lower amount of holidays compared to the same period of 2016.
Interest rate and exchange rate risk.
In order to reduce the exposure to changes in exchange and interest rates of financial debt, the Company has a Financial Risk Coverage Policy. Within the framework of this policy, the Company undertook derivative transactions which amounted to MUS$ 68 as of March 31, 2017, and in January 2017, it placed, for the second time, bonds in the international financial market for MUS$ 500 for 30 year term and at a rate of 5.151%, highlighting the high degree of participation of foreign investors, which reached an over supply of 8 times the placement amount. These actions helped reduce the level of exposure to changes in the aforementioned variables.
In addition, it is worth noting that the indexation polynomial, through which the technical rate of Metro S.A. is updated, includes the US dollar and Euro variables, among others, which is a “natural hedge” in the long-term cash flow.
Liquidity risk and financial liabilities structure
Income from tariffs associated with Metro passenger transportation, based on the new transport contract, are discounted daily from the funds collected by the Company's sales channel, generating the liquidity necessary to cover the Company's commitments. This income corresponds to 80% of total revenue.
In general, the Company's debt structure is composed mainly of long-term bonds and bank loans, focusing on ensuring financial stability and improving matching with the maturity terms of the Company's assets.
Credit risk
Credit risk of accounts receivable from commercial activity (passenger transportation) is limited as 80% of the revenue received by the Company is in cash, received on a daily basis, while the remaining 20% corresponds to revenue not related to the main business.
Debtors relate mainly to commercial leases, advertising and invoices receivable with low delinquency. In addition, there are no customers who owe significant amounts relative to the total of accounts receivable.
Credit risk of financial assets (cash and short-term investments), is limited as the Company's Financial Investments Policy aims to reduce risks by means of portfolio diversification, setting maximum investment limits for each bank, as well as considering minimal risk classifications by issuers.
Electricity Supply Risk
One of the main risk factors is the supply of electrical energy required to operate the Metro and the need for service continuity, to avoid interruptions in supply. In this regard, the Company has a feeding system that allows it to reduce exposure to outages, having a direct connection to two points of the Central Interconnected System (SIC), which feeds Lines 1, 2 and 5, as well as two points for the feeding of Line 4.
Additionally, please note the following:
The electricity feeding systems are duplicated and in the event of failure of one of them there is always a backup that keeps the power supply for the regular operation of the network.
The operating control systems are designed with redundant criteria, i.e. they operate on stand-by, therefore in case of absence of one of the systems, the other begins operating immediately, maintaining the normal operation of the network.
For Lines 1, 2 and 5, in the event of a crash of the Central Interconnected System, the distributing company has defined as a first priority the replenishment of the supply that feeds the center of Santiago, which allows the Metro network to have energy simultaneously, since Metro is supplied by the same feeder.
Note that, in addition to the current Energy and Power Contract with Enorchile S.A., which during January 2017 was extended until November 30, 2017, the Company signed a fixed-price Energy and Power Contract with Enel Distribución Chile S.A (former Chilectra S.A) in September 2015, which will be used to supply up to 40% of Metro’s total network. This contract is in effect from October 1, 2015, until December 31, 2023.
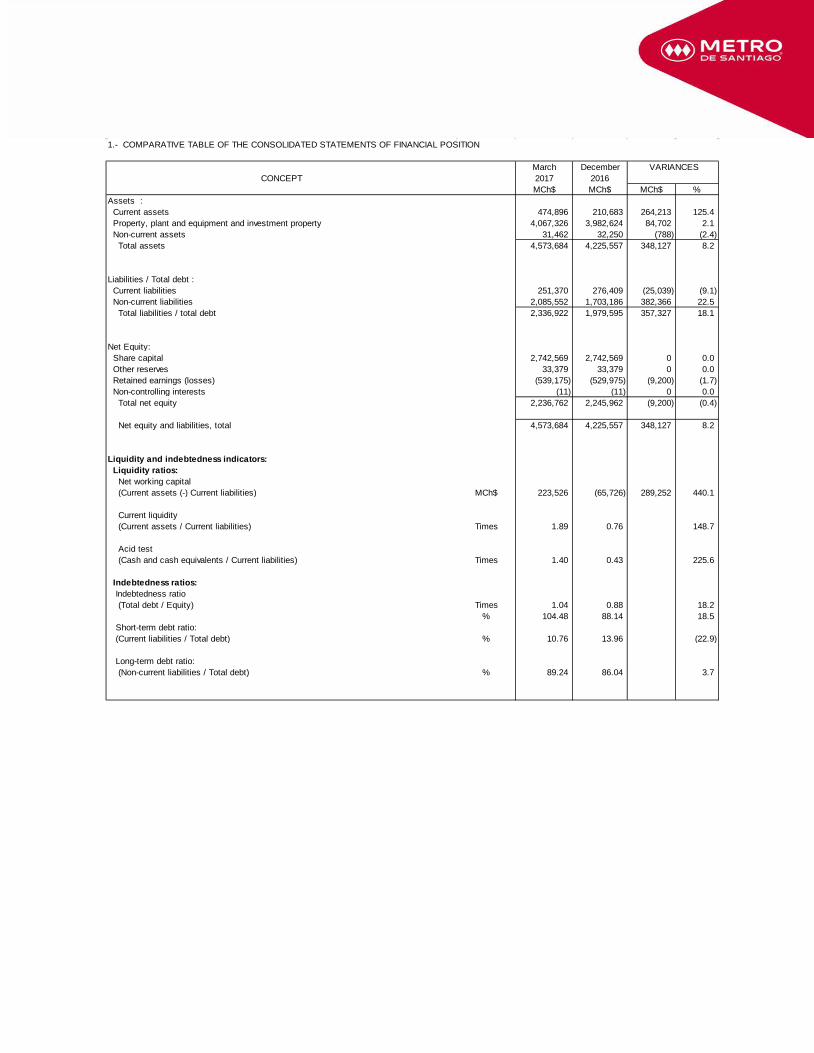
1.- COMPARATIVE TABLE OF THE CONSOLIDATED STATEMENTS OF FINANCIAL POSITION
March DecemberCONCEPT 2017 2016
MCh$ MCh$ MCh$ %Assets : Current assets 474,896 210,683 264,213 125.4 Property, plant and equipment and investment property 4,067,326 3,982,624 84,702 2.1 Non-current assets 31,462 32,250 (788) (2.4) Total assets 4,573,684 4,225,557 348,127 8.2
Liabilities / Total debt : Current liabilities 251,370 276,409 (25,039) (9.1) Non-current liabilities 2,085,552 1,703,186 382,366 22.5 Total liabilities / total debt 2,336,922 1,979,595 357,327 18.1
Net Equity: Share capital 2,742,569 2,742,569 0 0.0 Other reserves 33,379 33,379 0 0.0 Retained earnings (losses) (539,175) (529,975) (9,200) (1.7) Non-controlling interests (11) (11) 0 0.0 Total net equity 2,236,762 2,245,962 (9,200) (0.4)
Net equity and liabilities, total 4,573,684 4,225,557 348,127 8.2
Liquidity and indebtedness indicators: Liquidity ratios: Net working capital (Current assets (-) Current liabilities) MCh$ 223,526 (65,726) 289,252 440.1
Current liquidity (Current assets / Current liabilities) Times 1.89 0.76 148.7
Acid test (Cash and cash equivalents / Current liabilities) Times 1.40 0.43 225.6
Indebtedness ratios: Indebtedness ratio (Total debt / Equity) Times 1.04 0.88 18.2
% 104.48 88.14 18.5 Short-term debt ratio: (Current liabilities / Total debt) % 10.76 13.96 (22.9)
Long-term debt ratio: (Non-current liabilities / Total debt) % 89.24 86.04 3.7
VARIANCES
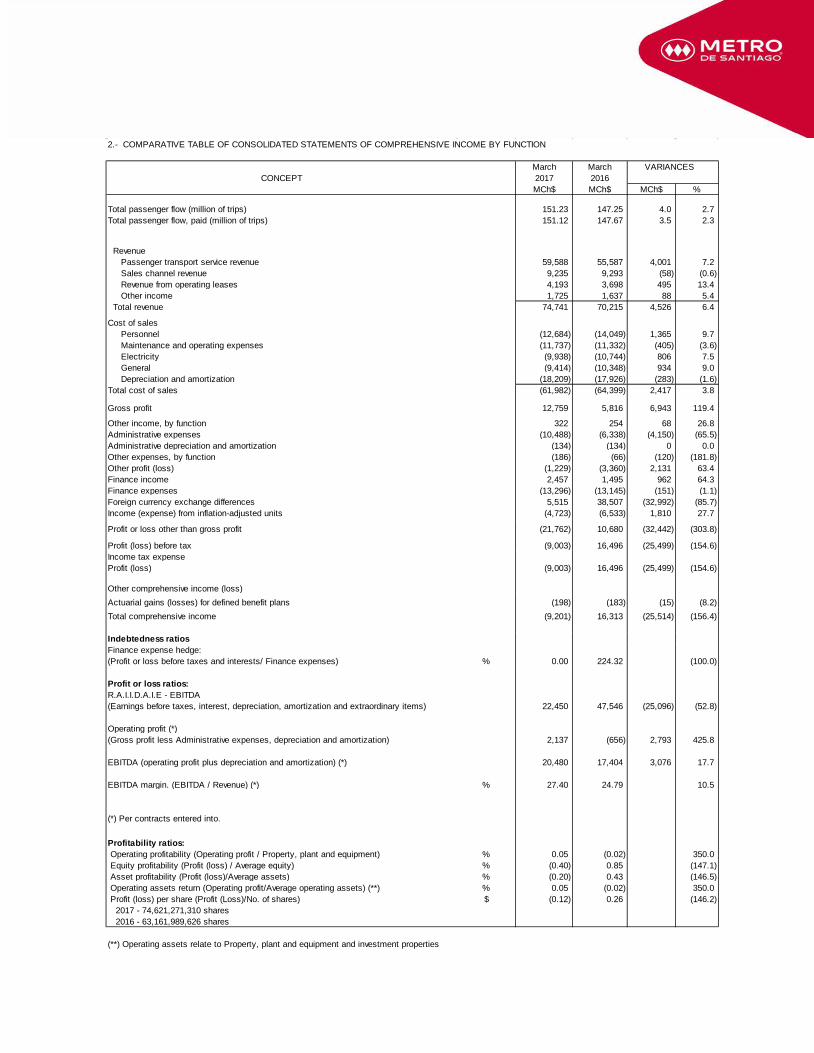
2.- COMPARATIVE TABLE OF CONSOLIDATED STATEMENTS OF COMPREHENSIVE INCOME BY FUNCTION
March March VARIANCESCONCEPT 2017 2016
MCh$ MCh$ MCh$ %
Total passenger flow (million of trips) 151.23 147.25 4.0 2.7Total passenger flow, paid (million of trips) 151.12 147.67 3.5 2.3
Revenue Passenger transport service revenue 59,588 55,587 4,001 7.2 Sales channel revenue 9,235 9,293 (58) (0.6) Revenue from operating leases 4,193 3,698 495 13.4 Other income 1,725 1,637 88 5.4 Total revenue 74,741 70,215 4,526 6.4
Cost of sales Personnel (12,684) (14,049) 1,365 9.7 Maintenance and operating expenses (11,737) (11,332) (405) (3.6) Electricity (9,938) (10,744) 806 7.5 General (9,414) (10,348) 934 9.0 Depreciation and amortization (18,209) (17,926) (283) (1.6)Total cost of sales (61,982) (64,399) 2,417 3.8
Gross profit 12,759 5,816 6,943 119.4
Other income, by function 322 254 68 26.8Administrative expenses (10,488) (6,338) (4,150) (65.5)Administrative depreciation and amortization (134) (134) 0 0.0Other expenses, by function (186) (66) (120) (181.8)Other profit (loss) (1,229) (3,360) 2,131 63.4Finance income 2,457 1,495 962 64.3Finance expenses (13,296) (13,145) (151) (1.1)Foreign currency exchange differences 5,515 38,507 (32,992) (85.7)Income (expense) from inflation-adjusted units (4,723) (6,533) 1,810 27.7
Profit or loss other than gross profit (21,762) 10,680 (32,442) (303.8)
Profit (loss) before tax (9,003) 16,496 (25,499) (154.6)Income tax expenseProfit (loss) (9,003) 16,496 (25,499) (154.6)
Other comprehensive income (loss)Actuarial gains (losses) for defined benefit plans (198) (183) (15) (8.2)Total comprehensive income (9,201) 16,313 (25,514) (156.4)
Indebtedness ratiosFinance expense hedge:(Profit or loss before taxes and interests/ Finance expenses) % 0.00 224.32 (100.0)
Profit or loss ratios:R.A.I.I.D.A.I.E - EBITDA(Earnings before taxes, interest, depreciation, amortization and extraordinary items) 22,450 47,546 (25,096) (52.8)
Operating profit (*)(Gross profit less Administrative expenses, depreciation and amortization) 2,137 (656) 2,793 425.8
EBITDA (operating profit plus depreciation and amortization) (*) 20,480 17,404 3,076 17.7
EBITDA margin. (EBITDA / Revenue) (*) % 27.40 24.79 10.5
(*) Per contracts entered into.
Profitability ratios: Operating profitability (Operating profit / Property, plant and equipment) % 0.05 (0.02) 350.0 Equity profitability (Profit (loss) / Average equity) % (0.40) 0.85 (147.1) Asset profitability (Profit (loss)/Average assets) % (0.20) 0.43 (146.5) Operating assets return (Operating profit/Average operating assets) (**) % 0.05 (0.02) 350.0 Profit (loss) per share (Profit (Loss)/No. of shares) $ (0.12) 0.26 (146.2) 2017 - 74,621,271,310 shares 2016 - 63,161,989,626 shares
(**) Operating assets relate to Property, plant and equipment and investment properties