Embed Size (px)
Citation preview
1
Empowering Providers with Data to Affect Behavior and Reduce Cost
Session #297, February 15, 2019
Lauren Onken, MHA , Executive Director of Heart & Vascular, UNC Health Care
Shaun McDonald, Enterprise Architect – Analytics, UNC Health Care
2
Lauren Onken, MHAHas no real or apparent conflicts of interest to report.
Shaun McDonaldHas no real or apparent conflicts of interest to report.
Conflict of Interest
3
• UNC Health Care System Overview
• Local Problem
• Design and Implementation
• Leveraging Health IT
• Value Derived
• Next Steps
Agenda
4
• Recognize the value of detailed data in driving change and program development
• Illustrate how to statistically account for variations and complexity
• Demonstrate how to affect behaviors through the use of accurate and meaningful data
Learning Objectives
5
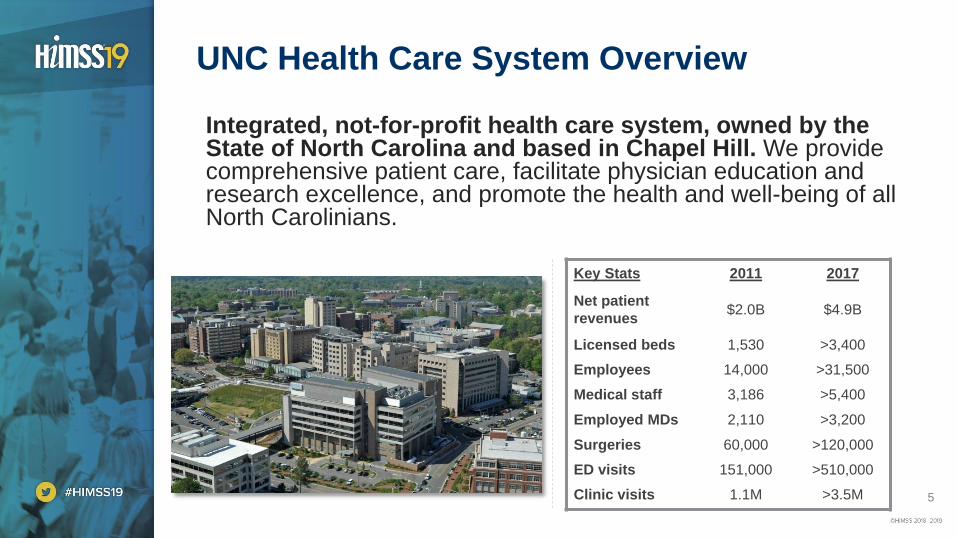
Integrated, not-for-profit health care system, owned by the State of North Carolina and based in Chapel Hill. We provide comprehensive patient care, facilitate physician education and research excellence, and promote the health and well-being of all North Carolinians.
UNC Health Care System Overview
Key Stats 2011 2017
Net patient
revenues$2.0B $4.9B
Licensed beds 1,530 >3,400
Employees 14,000 >31,500
Medical staff 3,186 >5,400
Employed MDs 2,110 >3,200
Surgeries 60,000 >120,000
ED visits 151,000 >510,000
Clinic visits 1.1M >3.5M
6
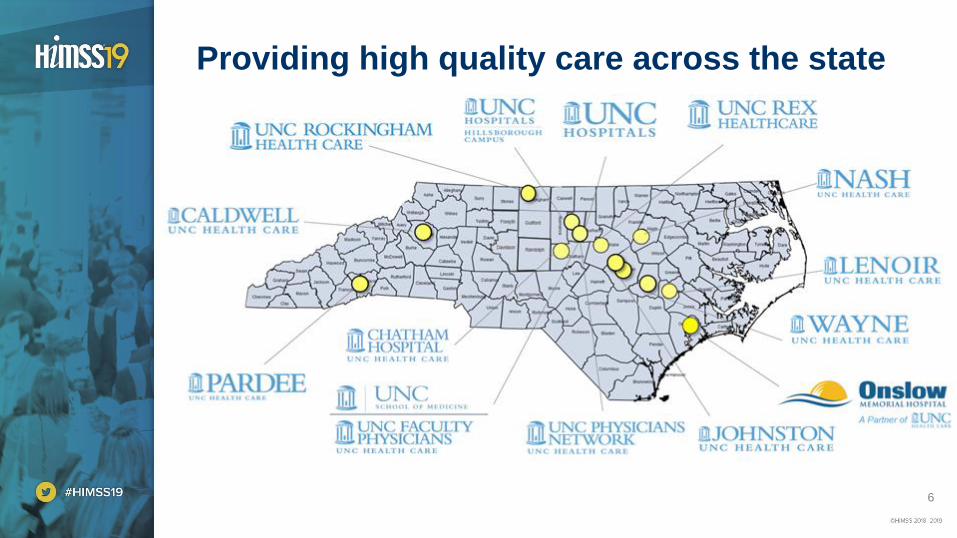
Providing high quality care across the state
7
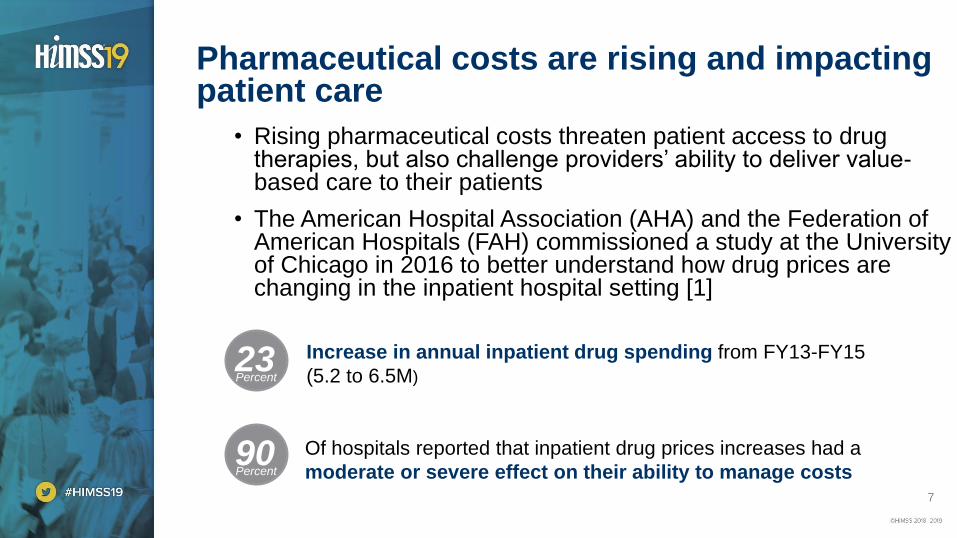
Pharmaceutical costs are rising and impacting patient care
Percent
23Percent
90Percent
Increase in annual inpatient drug spending from FY13-FY15
(5.2 to 6.5M)
Of hospitals reported that inpatient drug prices increases had a
moderate or severe effect on their ability to manage costs
• Rising pharmaceutical costs threaten patient access to drug therapies, but also challenge providers’ ability to deliver value-based care to their patients
• The American Hospital Association (AHA) and the Federation of American Hospitals (FAH) commissioned a study at the University of Chicago in 2016 to better understand how drug prices are changing in the inpatient hospital setting [1]
8
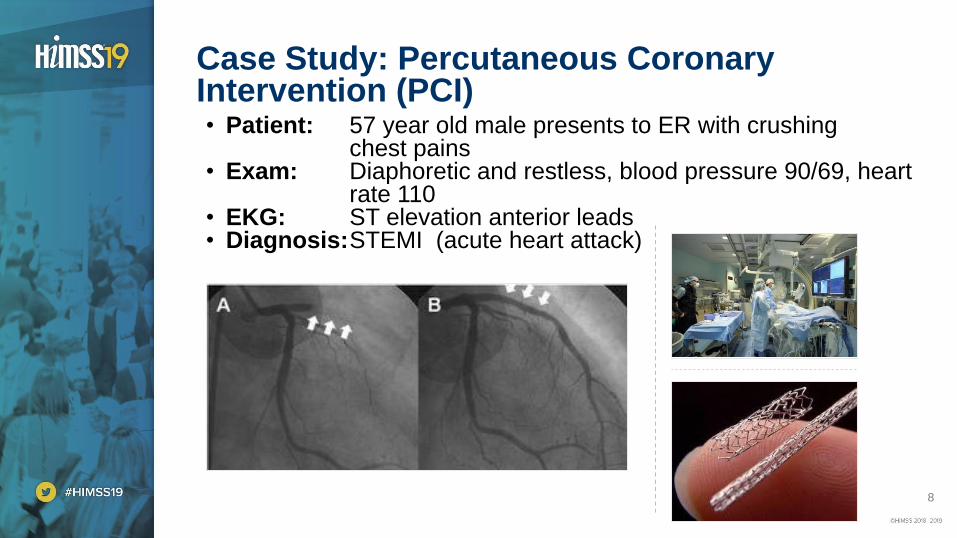
• Patient: 57 year old male presents to ER with crushing chest pains
• Exam: Diaphoretic and restless, blood pressure 90/69, heart rate 110
• EKG: ST elevation anterior leads• Diagnosis:STEMI (acute heart attack)
Case Study: Percutaneous Coronary Intervention (PCI)
9
• 2008: “HORIZONS-AMI” study Resulted in a nationwide increase in bivalirudin use for all PCI
• 2008 – 2014:
• Transradial PCI becomes more widespread reducing bleeding risk
• Sporadic cases of stent thrombosis with bivalirudin reported in the literature
• 2014: “HEAT-PPCI” study challenged the use of bivalirudin
• Suggested that a heparin strategy reduced the incidence of major adverse ischaemic events with no increase in bleeding complications
• Showed bivalirudin was about 300 times more expensive than heparin. It was estimated that switching to heparin would reduce the cost of their annual 1000 PPCI cases by £500 000, ~ $640,000 (US dollars)
• Despite the new information from the “HEAT-PPCI” study and our own cost data, many physicians were reluctant to stop using the bivalirudin.
Best practices changed with new studies
Sources : [2] NEJM. Bivalirudin during Primary PCI in Acute Myocardial Infarction (2008)
[3] American College of Cardiology. How Effective are Antithrombotic Therapies in Primary PCI – HEAT PCI (2014)
10
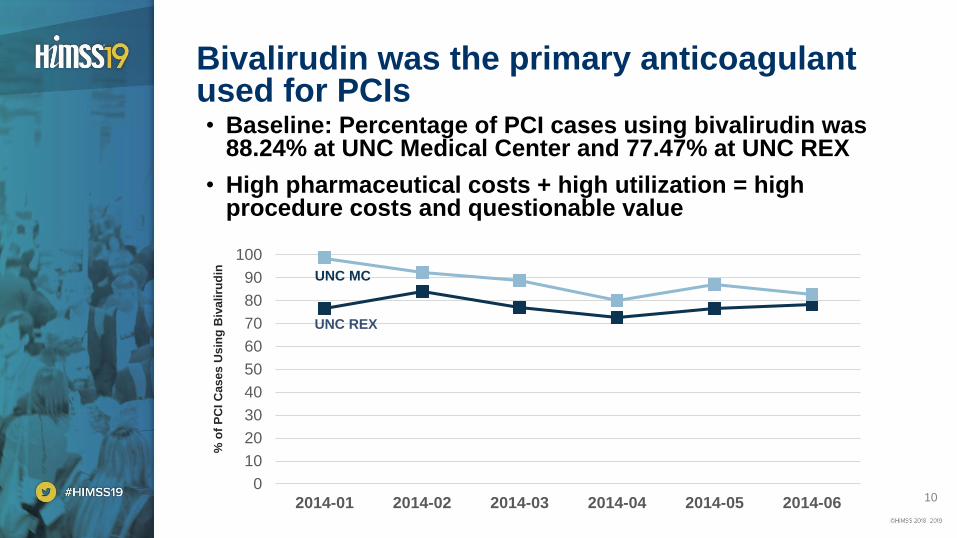
• Baseline: Percentage of PCI cases using bivalirudin was 88.24% at UNC Medical Center and 77.47% at UNC REX
• High pharmaceutical costs + high utilization = high procedure costs and questionable value
Bivalirudin was the primary anticoagulant used for PCIs
0
10
20
30
40
50
60
70
80
90
100
2014-01 2014-02 2014-03 2014-04 2014-05 2014-06
% o
f P
CI
Cases U
sin
g B
ivaliru
din UNC MC
UNC REX
11
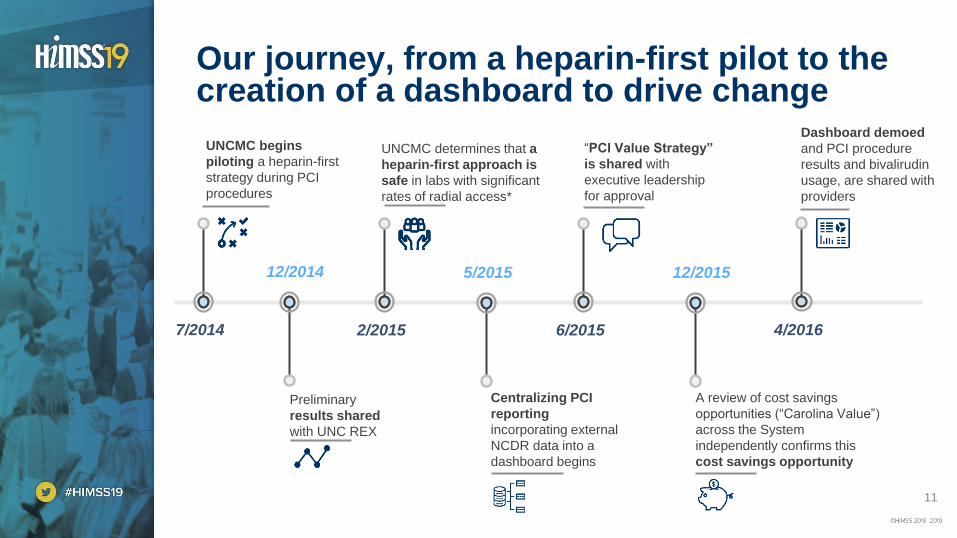
Our journey, from a heparin-first pilot to the creation of a dashboard to drive change
UNCMC begins
piloting a heparin-first
strategy during PCI
procedures
7/2014 2/2015
UNCMC determines that a
heparin-first approach is
safe in labs with significant
rates of radial access*
12/2014
Preliminary
results shared
with UNC REX
5/2015
Centralizing PCI
reporting
incorporating external
NCDR data into a
dashboard begins
6/2015
“PCI Value Strategy”
is shared with
executive leadership
for approval
12/2015
A review of cost savings
opportunities (“Carolina Value”)
across the System
independently confirms this
cost savings opportunity
4/2016
Dashboard demoed
and PCI procedure
results and bivalirudin
usage, are shared with
providers
12
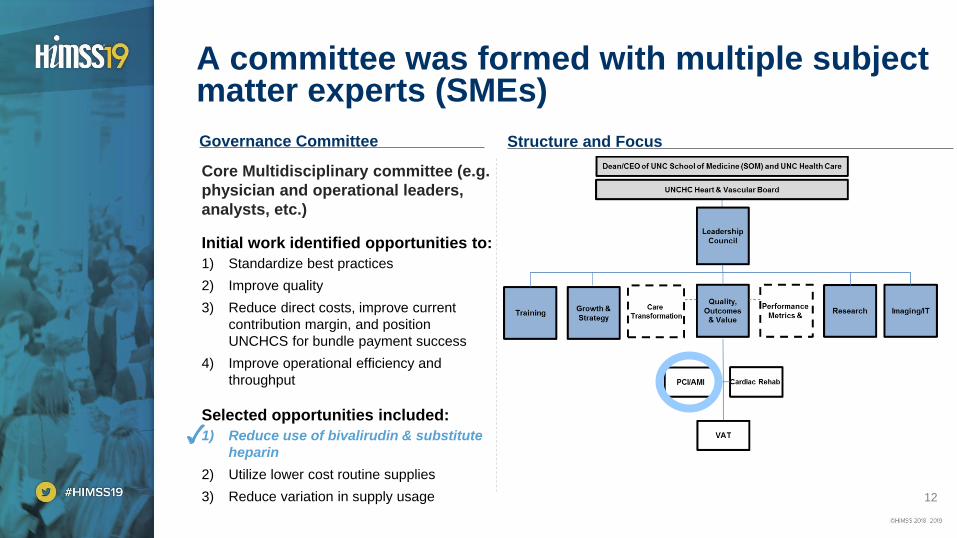
A committee was formed with multiple subject matter experts (SMEs)
Governance Committee Structure and Focus
Core Multidisciplinary committee (e.g.
physician and operational leaders,
analysts, etc.)
Initial work identified opportunities to:
1) Standardize best practices
2) Improve quality
3) Reduce direct costs, improve current
contribution margin, and position
UNCHCS for bundle payment success
4) Improve operational efficiency and
throughput
Selected opportunities included:
1) Reduce use of bivalirudin & substitute
heparin
2) Utilize lower cost routine supplies
3) Reduce variation in supply usage
13
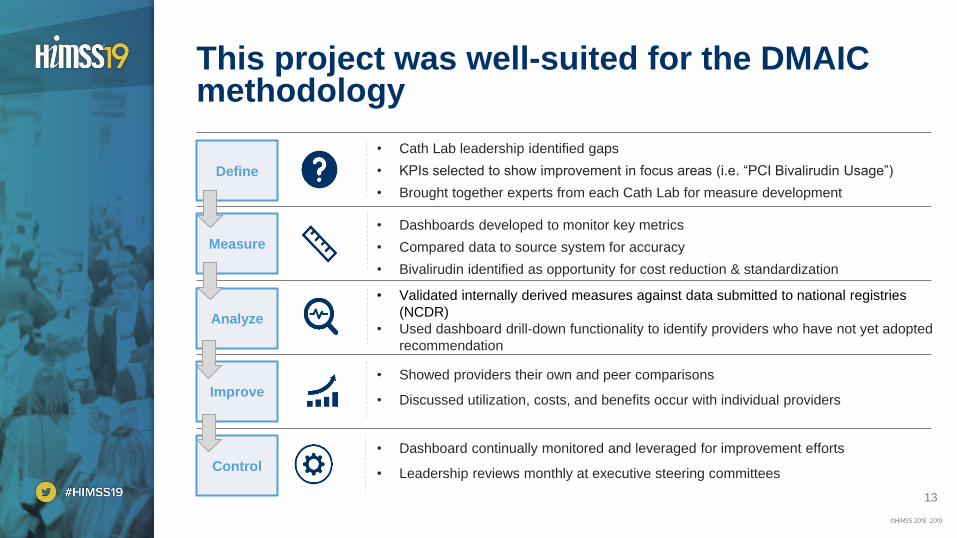
This project was well-suited for the DMAIC methodology
Define
Measure
Analyze
Improve
Control
• Cath Lab leadership identified gaps
• KPIs selected to show improvement in focus areas (i.e. “PCI Bivalirudin Usage”)
• Brought together experts from each Cath Lab for measure development
• Dashboards developed to monitor key metrics
• Compared data to source system for accuracy
• Bivalirudin identified as opportunity for cost reduction & standardization
• Validated internally derived measures against data submitted to national registries
(NCDR)
• Used dashboard drill-down functionality to identify providers who have not yet adopted
recommendation
• Showed providers their own and peer comparisons
• Discussed utilization, costs, and benefits occur with individual providers
• Dashboard continually monitored and leveraged for improvement efforts
• Leadership reviews monthly at executive steering committees
14
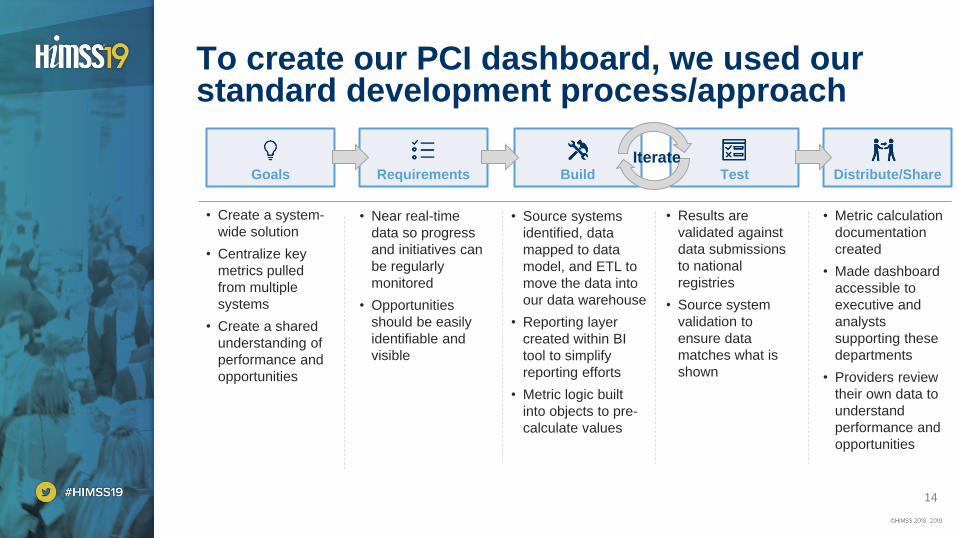
To create our PCI dashboard, we used our standard development process/approach
Goals Requirements Build Test Distribute/Share
• Create a system-
wide solution
• Centralize key
metrics pulled
from multiple
systems
• Create a shared
understanding of
performance and
opportunities
• Near real-time
data so progress
and initiatives can
be regularly
monitored
• Opportunities
should be easily
identifiable and
visible
• Source systems
identified, data
mapped to data
model, and ETL to
move the data into
our data warehouse
• Reporting layer
created within BI
tool to simplify
reporting efforts
• Metric logic built
into objects to pre-
calculate values
• Results are
validated against
data submissions
to national
registries
• Source system
validation to
ensure data
matches what is
shown
• Metric calculation
documentation
created
• Made dashboard
accessible to
executive and
analysts
supporting these
departments
• Providers review
their own data to
understand
performance and
opportunities
Iterate
15
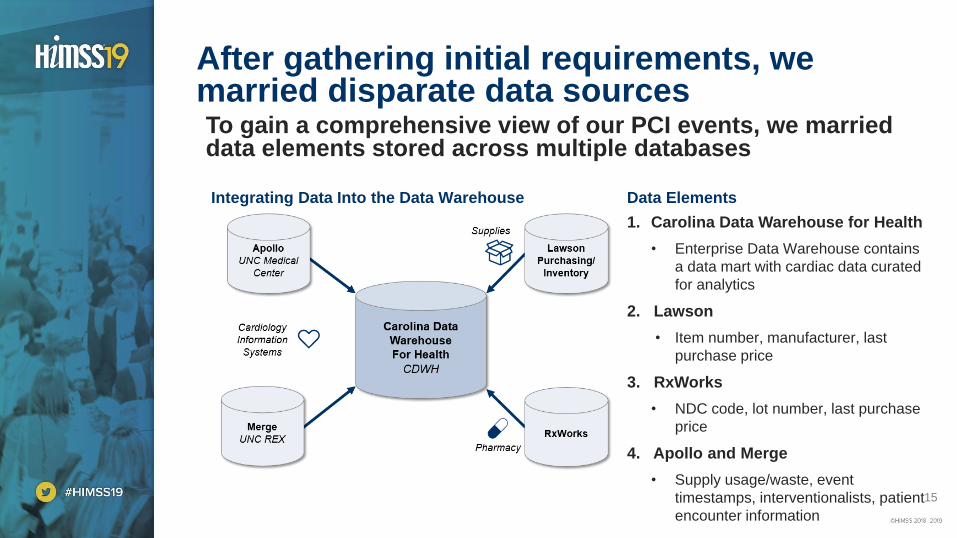
To gain a comprehensive view of our PCI events, we married data elements stored across multiple databases
After gathering initial requirements, we married disparate data sources
Integrating Data Into the Data Warehouse
1. Carolina Data Warehouse for Health
• Enterprise Data Warehouse contains
a data mart with cardiac data curated
for analytics
2. Lawson
• Item number, manufacturer, last
purchase price
3. RxWorks
• NDC code, lot number, last purchase
price
4. Apollo and Merge
• Supply usage/waste, event
timestamps, interventionalists, patient
encounter information
Data Elements
16
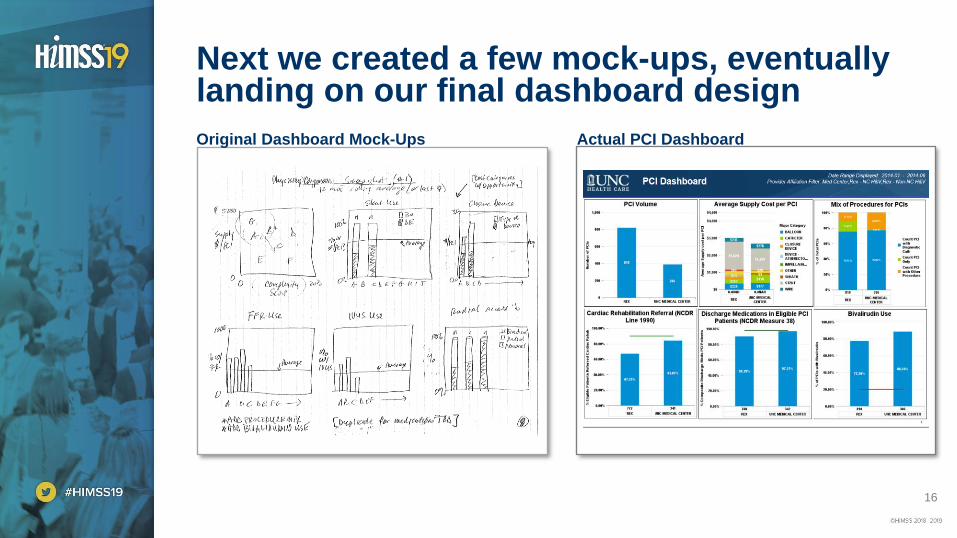
Next we created a few mock-ups, eventually landing on our final dashboard design
Actual PCI DashboardOriginal Dashboard Mock-Ups
17
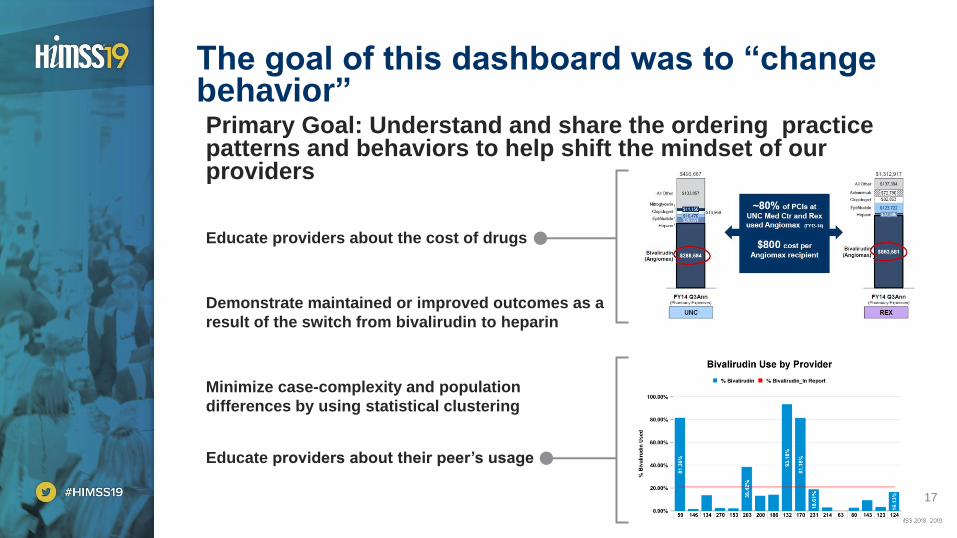
Primary Goal: Understand and share the ordering practice patterns and behaviors to help shift the mindset of our providers
The goal of this dashboard was to “change behavior”
Educate providers about the cost of drugs
Demonstrate maintained or improved outcomes as a
result of the switch from bivalirudin to heparin
Minimize case-complexity and population
differences by using statistical clustering
Educate providers about their peer’s usage
18
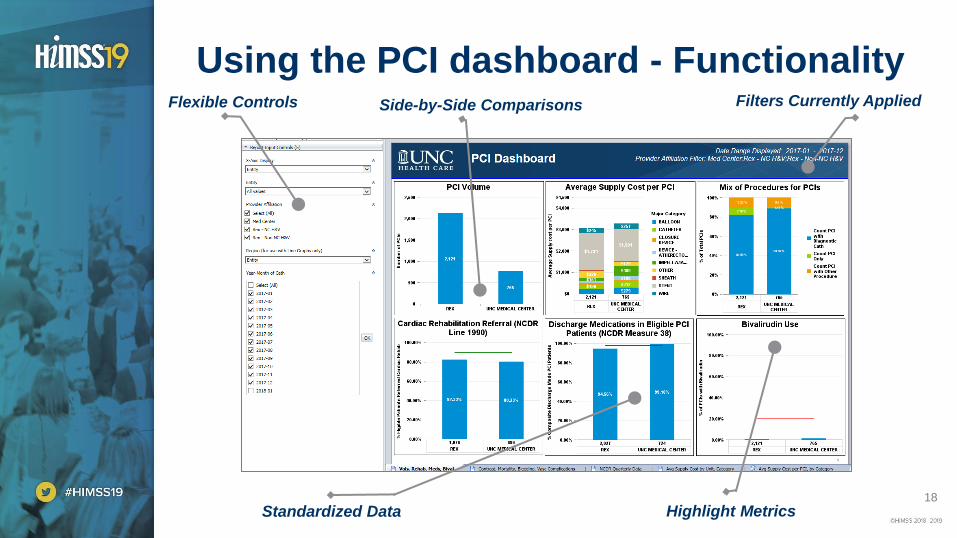
Using the PCI dashboard - FunctionalityFlexible Controls Side-by-Side Comparisons
Standardized Data
Filters Currently Applied
Highlight Metrics
19
Providing accurate and meaningful data can change physician behavior
Sharing Data With Colleagues
“The cardiologists received the information in an extremely
positive fashion. After training, most doctors and us
interventional cardiologists work independently during
cases and patient care with limited exposure to our
partners. Being able to share practice patterns and
understand cost/quality among peers resulted in positive
change in behavior.” - Dr. Joel Schneider, UNC REX
Physician Champion
• The dashboard was shared at many meetings and other forums to
maximize awareness
• Physicians received un-blinded dashboards and had access to their
colleagues’ information. Staff received blinded dashboards.
20
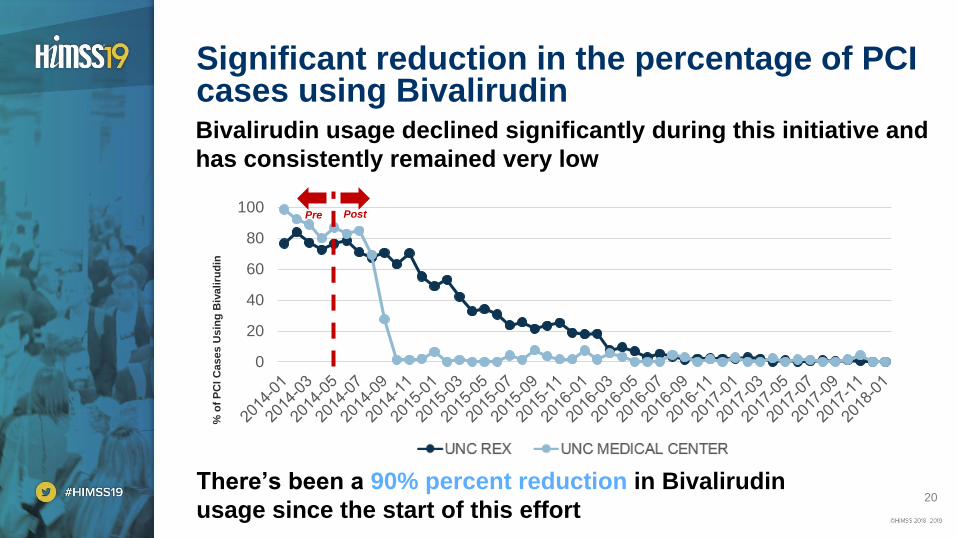
Significant reduction in the percentage of PCI cases using BivalirudinBivalirudin usage declined significantly during this initiative and
has consistently remained very low
0
20
40
60
80
100
REX UNCMC
% o
f P
CI
Ca
se
s U
sin
g B
iva
liru
din
Pre Post
There’s been a 90% percent reduction in Bivalirudin
usage since the start of this effort
21
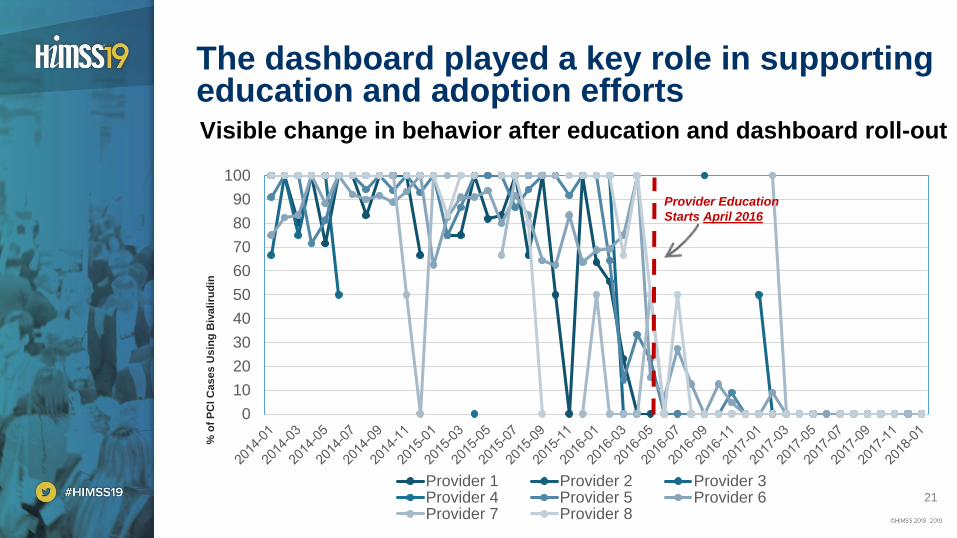
The dashboard played a key role in supporting education and adoption efforts
0
10
20
30
40
50
60
70
80
90
100
Provider 1 Provider 2 Provider 3Provider 4 Provider 5 Provider 6Provider 7 Provider 8
Visible change in behavior after education and dashboard roll-out
Provider Education
Starts April 2016%
of
PC
I C
as
es
Us
ing
Biv
ali
rud
in
22
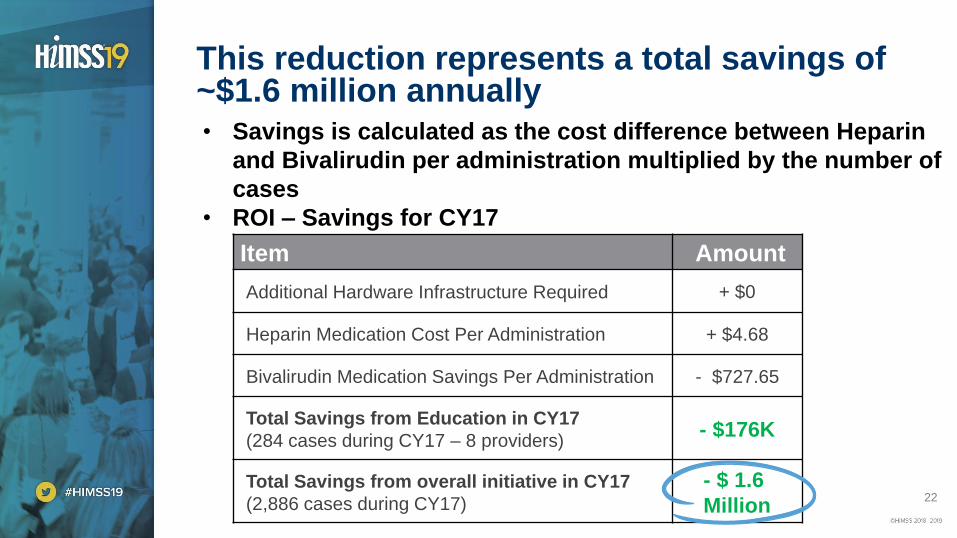
This reduction represents a total savings of ~$1.6 million annually• Savings is calculated as the cost difference between Heparin
and Bivalirudin per administration multiplied by the number of
cases
• ROI – Savings for CY17
Item Amount
Additional Hardware Infrastructure Required + $0
Heparin Medication Cost Per Administration + $4.68
Bivalirudin Medication Savings Per Administration - $727.65
Total Savings from Education in CY17
(284 cases during CY17 – 8 providers)- $176K
Total Savings from overall initiative in CY17
(2,886 cases during CY17)
- $ 1.6
Million
23
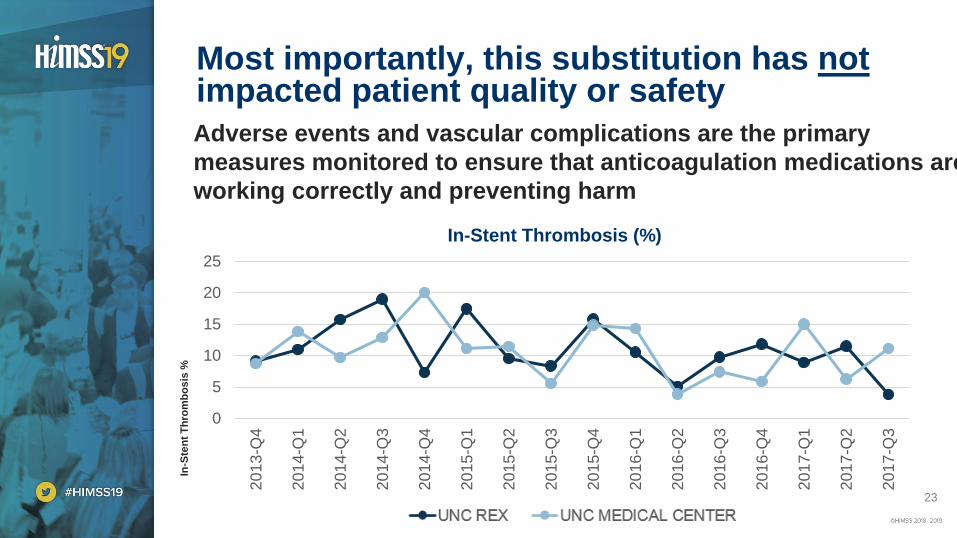
Most importantly, this substitution has notimpacted patient quality or safety
Adverse events and vascular complications are the primary
measures monitored to ensure that anticoagulation medications are
working correctly and preventing harm
In-Stent Thrombosis (%)
0
5
10
15
20
252
01
3-Q
4
20
14
-Q1
20
14
-Q2
20
14
-Q3
20
14
-Q4
20
15
-Q1
20
15
-Q2
20
15
-Q3
20
15
-Q4
20
16
-Q1
20
16
-Q2
20
16
-Q3
20
16
-Q4
20
17
-Q1
20
17
-Q2
20
17
-Q3
REX UNCMC
In-S
ten
t T
hro
mb
os
is %
24
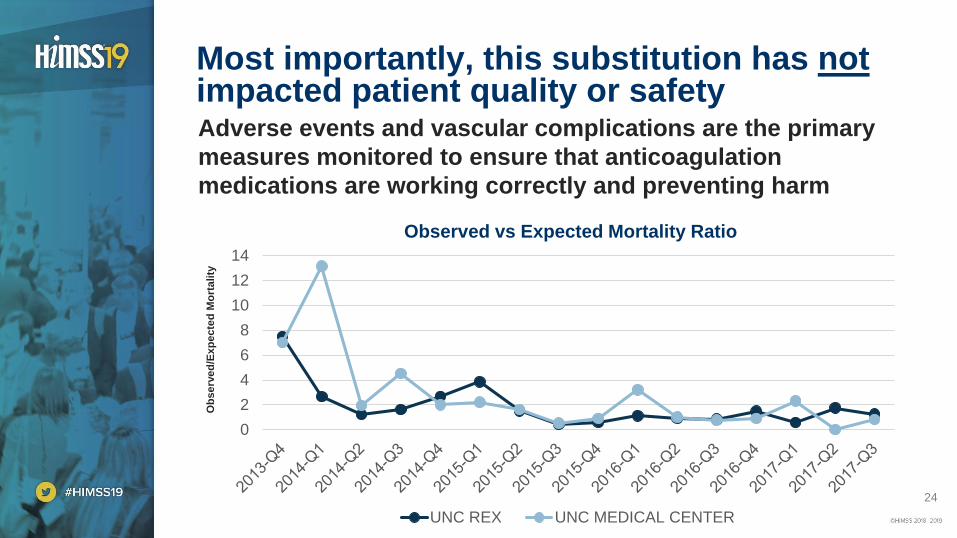
Most importantly, this substitution has notimpacted patient quality or safetyAdverse events and vascular complications are the primary
measures monitored to ensure that anticoagulation
medications are working correctly and preventing harm
Observed vs Expected Mortality Ratio
0
2
4
6
8
10
12
14
UNC REX UNC MEDICAL CENTER
Ob
se
rve
d/E
xp
ec
ted
Mo
rta
lity
25
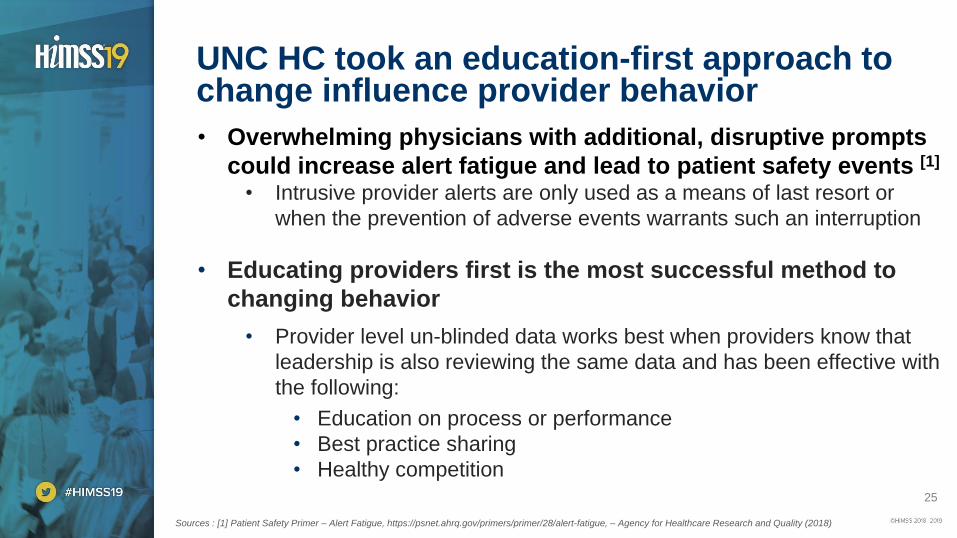
UNC HC took an education-first approach to change influence provider behavior
• Overwhelming physicians with additional, disruptive prompts
could increase alert fatigue and lead to patient safety events [1]
• Intrusive provider alerts are only used as a means of last resort or
when the prevention of adverse events warrants such an interruption
• Educating providers first is the most successful method to
changing behavior
• Provider level un-blinded data works best when providers know that
leadership is also reviewing the same data and has been effective with
the following:
• Education on process or performance
• Best practice sharing
• Healthy competition
Sources : [1] Patient Safety Primer – Alert Fatigue, https://psnet.ahrq.gov/primers/primer/28/alert-fatigue, – Agency for Healthcare Research and Quality (2018)
26
Next Steps – Continuous Improvement
1. The PCI dashboard allows continued monitoring for adverse
events as well as other supply cost opportunities for savings
and standardization
2. The translational model of moving positive findings from one
institution to another by leveraging comparative can lead to
other value-added opportunities at other hospitals across
the Health Care System
3. Analyzing and sharing practice patterns through the
dashboard can identify new opportunities and influence
individual physicians to adopt best practices
4. Scale this concept to other procedures and entities in
cardiology such as AICD implantation, STEMI management,
stress testing, etc.
27
• Reminder: please complete the online session evaluation
• Contact information:
• Lauren Onken, MHA
• Shaun McDonald
Questions