Embed Size (px)
Citation preview
Empowering e-fleets for business
and private purposes in cities
Programme: STEER
Project number: IEE/12/713/SI2.644746
e-Mobility Fleet Schemes and Market
Potentials in the United Kingdom
Date: 30/01/14
Main author(s): Carla Piñeiro – INOVA
e-mail: [email protected]
Dimitrios Xenias – CARDIFF
e-mail: [email protected]
Project coordinator: Aida Abdulah – CHOICE
e-mail: [email protected]
e-Mobility Fleet Schemes and Market Potentials – UNITED KINGDOM
Simone Signorile2
2
Table of contents
1. Executive Summary ......................................................................................................................... 4
2. Introduction ...................................................................................................................................... 5
2.1 The eBRIDGE Project ................................................................................................................... 5
2.2 Scope of the report ........................................................................................................................ 6
2.3 Methodology .................................................................................................................................. 6
3. Electric Mobility in United Kingdom ................................................................................................. 7
3.1 Starting point ................................................................................................................................. 7
3.2 General Aspects of Mobility .......................................................................................................... 9
Demography .................................................................................................................................... 9
Mobility patterns............................................................................................................................. 10
3.3 The British Carpool ..................................................................................................................... 11
Vehicle Figures .............................................................................................................................. 11
Environment ................................................................................................................................... 14
3.4 Charging Infrastructure ............................................................................................................... 15
Main Operators .............................................................................................................................. 15
3.5 British Fleet Hot Spots ................................................................................................................ 15
Main Locations for Car Sharing ..................................................................................................... 15
Business Car Sharing Operators ................................................................................................... 16
3.6 Research & Development ........................................................................................................... 17
Key Running R&D Projects on Electric Vehicles ........................................................................... 17
Demonstrative e-Fleet Projects ..................................................................................................... 17
3.7 Policy Framework ........................................................................................................................ 18
Key Regulations regarding Electric Vehicles ................................................................................. 18
Financial Incentives ....................................................................................................................... 18
4. Market Potential ............................................................................................................................. 20
4.1 Main Drivers and Constraints ...................................................................................................... 20
5. Local Assessment.......................................................................................................................... 21
5.1 Starting Point ............................................................................................................................... 21
5.2 General aspects of Mobility ......................................................................................................... 21
Demography .................................................................................................................................. 21
EVs user profiles............................................................................................................................ 22
5.3 The Carmarthenshire County Council Carpool ........................................................................... 22
5.4 Main Local Drivers and Constraints ............................................................................................ 22
6. General outlook ............................................................................................................................. 23
7. References .................................................................................................................................... 24
e-Mobility Fleet Schemes and Market Potentials – UNITED KINGDOM
Simone Signorile3
3
Index of figures
Figure 1 Time Plan Methodology............................................................................................................. 6
Figure 2 Demographic data and driver’s license 2011 ............................................................................ 9
Figure 3 Share of cities according to population size ............................................................................ 10
Figure 4 Modal share 2011 .................................................................................................................... 10
Figure 5 Total vehicles registered 2008 - 2012 ..................................................................................... 11
Figure 6 Total vehicles powertrain type 2008 - 2012 ............................................................................ 12
Figure 7 Total ownership of passenger vehicles 2008 - 2012 ............................................................... 12
Figure 8 Selection of most registered EVs 2012 .................................................................................. 13
Figure 9 Greenhouse gas emissions from transport 2008 - 2011 ......................................................... 14
Figure 10 CO2 emissions per kWh from electricity generation 2008 - 2010 ......................................... 15
Figure 11 Demographic trends and driver’s license .............................................................................. 21
Index of tables
Table 1 Main charging operators ........................................................................................................... 15
Table 2 Main business car sharing operators ....................................................................................... 16
Table 3 Key running R&D projects on electric vehicles ........................................................................ 17
Table 4 Demonstrative e-fleet projects .................................................................................................. 17
Table 5 Key regulations regarding electric vehicles .............................................................................. 18
Table 6 Financial incentives .................................................................................................................. 18
Table 7 Drivers and Constraints Electric Mobility .................................................................................. 20
Table 8 Drivers and Constraints Electric Mobility at Carmarthen .......................................................... 22
e-Mobility Fleet Schemes and Market Potentials – UNITED KINGDOM
Simone Signorile4
4
1. Executive Summary
Electric mobility is a highly promising technology that, properly used, can help addressing
severe global challenges such as climate change and fossil fuel dependency; it can
contribute to reducing local CO2 emissions and noise pollution coming from transport and
enable synergies with smart grids and so favour a greater percentage of renewable energy
production.1
The large potential of electric vehicles in urban fleets encompasses: (a) improving electric
mobility markets through niche development, thus accelerating mass market adoption of
electric vehicles and (b) supporting the achievement of energy and climate protection goals;
and (c) contributing to tackling global recession by revitalising the industrial fabric and
fostering innovation, growth and job creation, as, for example, with the manufacturing plant
for Nissan Leaf in Sunderland, UK.
British gross domestic product (GDP) of 1,747 billion EUR in 2011 represents 13.82% of EU
27 GDP2.
With a population of 63 million (2012), United Kingdom represents 12.69% of total European
population (500.35 million)3 and 73.08 % of this population lives in cities that have between
50,000 and 300,000 inhabitants. The British modal share shows that in 2011 most of the trips
(64%) were accomplished by individual motorised means (car/motorbike), 16% by public
transport, 14% walked or cycled and the remaining 6% by other means.
With a car fleet of 28.5 million vehicles in 2011, United Kingdom has the fourth largest
European carpool representing 12.1% of the total EU fleet.4
Based on the Committee on Climate Change (2010) recommendations, the UK Government
should aim for 1.7 million EVs on the road by 2020, in order to move towards the carbon
emissions reduction target of 50% by 2025. This means that over 250,000 new EVs per year
must be introduced in the UK.
To promote electric vehicle implementation, in 2011, the UK government committed to
supporting a national recharging network for electric and plug-in hybrid vehicles. The Plug-In
Vehicle Infrastructure Strategy includes a Plugged-In Places (PIP) programme with a budget
of £30 million to match-fund eight pilot projects (east of England, Greater Manchester,
London, Midlands, Milton Keynes, north east England, Northern Ireland, Scotland) installing
and trialling recharging infrastructure in the UK to support the Carbon Plan commitment to
install up to 8,500 charging points.
According to the Office for Low Emission Vehicles (OLEV), over 4,000 charging points were
installed in the frame of the Plugged-in Places programme by mid 2013. About 65% of these
charging points are publicly accessible. Moreover, some local councils and private sector
providers are also installing charging points. Based on data provided by charging points
manufacturers, it is estimated that organisations may have also installed about 5,000
charging points nationwide (not supported by Plugged-in Places programme).5
1 Council of the European Union. 2010.
2 Eurostat, (2013a). GDP at current market prices.
3 Eurostat, (2013b). Population on 1 January. 4 European Automobile Manufacturers' Association (ACEA). Pocket guide 2013.
5 UK Government (2013). Guidance Plugged-in Places
e-Mobility Fleet Schemes and Market Potentials – UNITED KINGDOM
Simone Signorile5
5
2. Introduction
2.1 The eBRIDGE Project
eBRIDGE is a co-funded EU project to promote electric fleets for urban travel in European
cities. The project aims to bring innovation and new technologies to make today’s mobility
cleaner, more efficient and sustainable.
During eBRIDGE, alternatives to current mobility patterns will be explored in order to analyze
whether electric mobility is a feasible option to make cities cleaner and more sustainable.
Although electric vehicles fulfil all the requirements to
be among the most important players in urban
transport systems of the near future – they are clean,
efficient, silent, and incur low running costs –
significant barriers to a wider diffusion and use of
electric vehicles remain to be addressed, including
low user acceptance and higher purchase costs
compared to conventional cars.
On this backdrop, eBRIDGE aims to demonstrate how
the introduction of electric vehicles in fleets for
business and private urban travel can efficiently
contribute to the improvement of market conditions for
the electric mobility sector.
Seven case studies with heterogeneous starting
conditions assure a broad-spectrum outcome. Berlin
(Germany), Milan (Italy), Lisbon (Portugal), Vigo (Spain), Valencia (Spain), a selection of
Austrian municipalities and Carmarthen (Wales) are developing actions to optimise
operational fleet performance, test and launch solutions to increase the convenience and
ease of use of car sharing offers and finally, raise awareness among the target groups and
further relevant stakeholders through engaging marketing approaches on the suitability of
electric mobility for urban transport and commuting.
The eBRIDGE team involves technical experts, academics, associations, public
administrations, mobility providers and public transport and car sharing operators:
- choice GmbH (Coord.), Germany
- DB FuhrparkService GmbH, Germany
- Allmenda Social Business e.G., Austria
- Forschungsgesellschaft Mobilität – Austrian Mobility Research gem. GmbH, Austria
- I Nova Consultores en Excelencia e Innovación Estratégica, S.L., Spain
- Galician Cluster of Automotive Companies, Spain
- Movilidad Urbana Sostenible S.L., Spain
- Comunitat Autònoma de les Illes Balears, Spain
- Fondazione Legambiente Innovazione, Italy
- Azienda Trasporti Milanesi S.p.A, Italy
- Occam, Portugal
- Câmara Municipal de Lisboa, Portugal
- Cardiff University, United Kingdom
e-Mobility Fleet Schemes and Market Potentials – UNITED KINGDOM
Simone Signorile6
6
2.2 Scope of the report
The goal of the “Work Package 2: Market Analysis”, is to analyse the current situation and
trends of electric fleets in the eBRIDGE targeted regions by assessing information about all
context relevant issues such as market overview, best practice, legal framework, policy, and
environmental impacts. The work package will also assess the market potential of electric
mobility, mainly for fleets.
The present report “e-Mobility Fleet Schemes and Market Potentials – UNITED KINGDOM”,
gathered this information for United Kingdom and particularly Carmarthenshire County
Council, the British case study site.
2.3 Methodology
In the course of this work package, data from Germany, Austria, Spain, Italy, Portugal and
United Kingdom have been gathered and analysed for the period 2008-2012.
The overall goal has been to establish the current state of play on electric urban fleets for
every participant country. A factsheet on transferability at a European scale will be based on
this report series.
Relevant data regarding national carpools such as registrations, power train type, ownership,
registered EVs models, car sharing hot spots, main charging operators, as well as main
national policy and R&D aspects e.g. incentives and favouring policies have been collected
and analysed.
Additionally, a brief assessment of the market potential of electric vehicles including identified
national barriers and drivers is provided.
Finally, the assessment of the Carmarthenshire County Council case study facilitates the
comparison of the local and national levels, showing to what extent the British energy and
climate targets are on track.
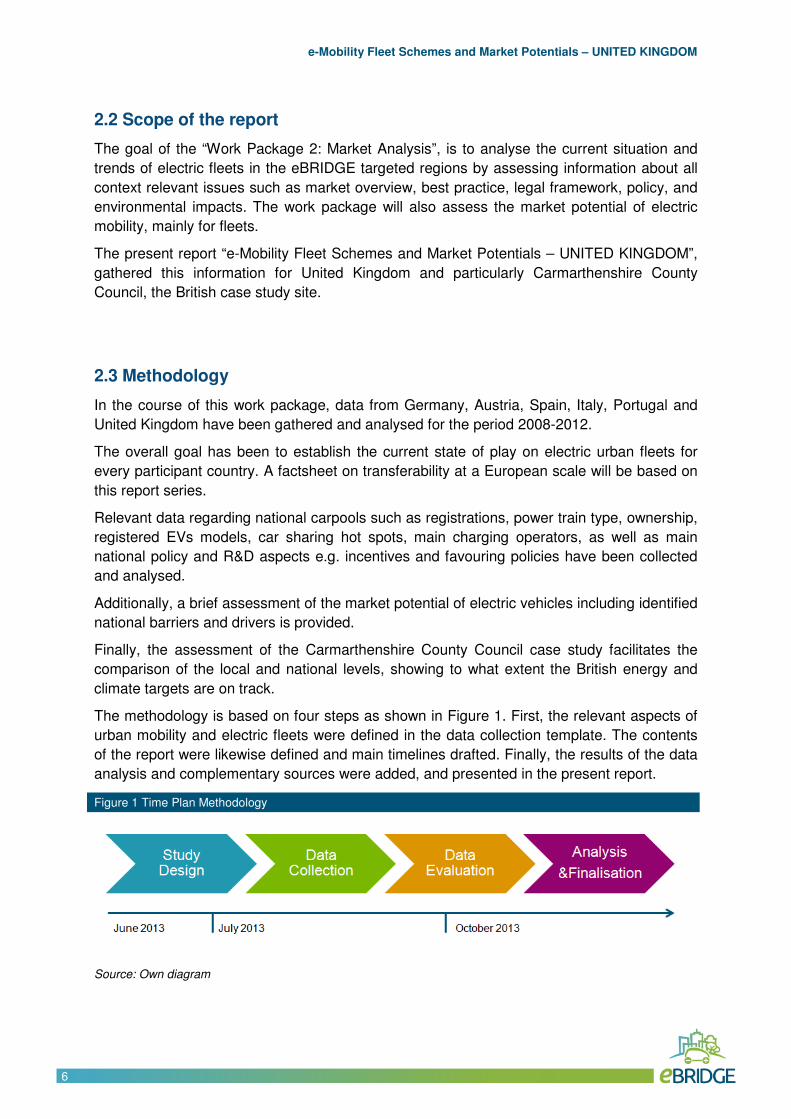
The methodology is based on four steps as shown in Figure 1. First, the relevant aspects of
urban mobility and electric fleets were defined in the data collection template. The contents
of the report were likewise defined and main timelines drafted. Finally, the results of the data
analysis and complementary sources were added, and presented in the present report.
Figure 1 Time Plan Methodology
Source: Own diagram
e-Mobility Fleet Schemes and Market Potentials – UNITED KINGDOM
Simone Signorile7
7
3. Electric Mobility in United Kingdom
3.1 Starting point
Accelerating Electric Vehicle (EV) uptake is important for reaching the UK Government
carbon emissions reduction target of 50% by 2025. The Committee on Climate Change
(2010) recommends that the Government should aim for 1.7 million EVs on the road by
2020. To reach this target, over 250,000 new EVs per year must be introduced in the UK. By
October 2011, there were 1,100 EVs registered in the UK of the total 28.5m vehicles in
circulation (Vaughan, 2011). The total number rose to around 5,000 vehicles at the time of
writing this report (SMMT 2013, SMMT 2012), and is only a small fraction of what the UK
government intended to achieve. Therefore, there is a significant challenge ahead if the
government wishes to reach anywhere near their targets, in the stated timescale.
Half of all new cars in the UK are bought by fleets; and this should be the case for EVs as
well. There is an additional reason for this: the high cost of acquisition. Thus, if the purchase
of EVs starts to materialise in fleets, it will help accelerate their deployment to consumers
across the UK. Further incentives include tax or charges savings and exemptions such as
free parking and permanent exemption of all EVs from the London congestion charge, or
enhanced capital allowances for EVs bought for fleets6.
In 2011, the UK government committed to supporting a national recharging network for
electric and plug-in hybrid vehicles. This includes the “Plugged in Places” scheme, which
offers matched-funding to consortia of businesses and public sector organisations to install
electric vehicle recharging infrastructure in eight areas (in London, Manchester, Milton
Keynes and North East England). Outside these areas, some private firms and local
authorities are installing charging points, but so far geographical coverage is limited7. With
over 90% of car journeys in the UK being less than 80 kilometres, there is significant
potential for local and fleet adopters (Ernst & Young, 2010).
In autumn 2013 the UK government re-affirmed their pledge of £400 million worth of support
for EV infrastructure between 2010 and 2015. However, only £92 million was spent by
autumn 2013, casting doubts on the potential to reach the intended target in the remaining
time (Foy, 2013).
Research on UK public attitudes to EVs, suggests understanding about EVs is limited, but
interest in low-emission vehicles is high (e.g., DEFRA, 2009) demonstrated by the recent
rapid growth in sales of small, energy-efficient vehicles (Nykvist & Whitmarsh, 2008). EST
(2010) found two-thirds of UK public would like a low-carbon car if they could afford one;
75% would consider fuel efficiency an important factor when buying their next car; but half of
respondents do not know whether they can use an EV where they live and only one in four
would consider an electric car at that time. In addition, few people thought EVs can now
perform as well as conventional cars for many types of travel. Similarly, Graham-Rowe et al
(2012) found mainstream car consumers perceived the current generation of EVs as a “work
in progress” and too costly, despite offering environmental benefits. Range concerns have
also been expressed (e.g. Xenias & Whitmarsh, 2013; Ernst & Young, 2010).
6 http://www.automotivecouncil.co.uk/low-carbon-technology/grants-and-incentives/
7 Source: www.ev-network.org.uk/
e-Mobility Fleet Schemes and Market Potentials – UNITED KINGDOM
Simone Signorile8
8
Other research shows cost savings, followed by environmental benefits, are the most
important factors that would positively influence consumers’ decision to purchase an EV as
their next vehicle; access to charging points and battery driving range, and price, are the
most important factors discouraging purchase of an EV (Ernst & Young, 2010). In some
cases, members of the public have some (limited) experience with EVs (Graham-Rowe et al.,
2012), but commonly public perceptions are based on little knowledge of current EV
technologies. This suggests a major barrier to EV update is familiarity and experience of EV
use, both of which will be addressed in this project.
UK consumers’ interest in lower-cost mobility solutions has also contributed to a growth in
car share schemes and car clubs in recent years (Nykvist & Whitmarsh, 2008). There are
nearly 500 UK-based “closed” (i.e. organisation-based, local, or regional) car share schemes,
over 40 ‘open’ schemes, and 26 active UK-based commercial car club schemes. As of 2006,
there were 11,000 members in the UK (Nykvist & Whitmarsh, 2008), rising to over 161,000
members and 3,055 vehicles in 2011 (Carplus, 2011), representing 0.26% of the UK
population. Estimates for 2013 raised this figure to 180,000-200,000, representing 0.28%-
0.31% of the UK population..Indeed, car sharing and car clubs are growing more than car
ownership and have not yet reached their full potential.
Importantly, this potential extends to broader benefits, e.g. use of alternative transport
modes: car club members reported local bus trips (66%), walking 20 mins or more (78%),
and cycling (32%) at least once a week (CarPlus, 2011).
As far as market development is concerned, early purchasers are expected to be fleet or
business users and consumers in urban and suburban locations. It is the owners in these
segments of the market who are most likely to reap the full environmental and cost-of-
ownership benefits of plug-in vehicles. The UK market will expand its reach as consumer and
business acceptance continues to grow.
Fleets, including car-share schemes, are particularly likely to adopt EVs. For example,
London established a “green” taxi company in which all fleet cars are HEVs (Nykvist &
Whitmarsh, 2008). Furthermore, the Niches project highlighted the City of London’s scheme
to promote EV adoption in car share schemes, which can lead to a Benefit-to-Cost ratio of up
to 4.1 (Niches, 2012). Previous research highlights that fleet demonstration projects create
initial infrastructure build-up necessary for mainstream adoption (see Nykvist & Whitmarsh,
2008).
In the design of the fleet trials best practices of the UK, existing demonstration projects will
be used. For example the Centre of Excellence for low carbon vehicle technologies
(CENEX), published the results of a six months trial of four types of electric passenger cars in
North Eastern England (http://www.cenex.co.uk/projects/electric-vehicle-trials/smart-move).
Qualitative and quantitative data were recorded (perception and attitudes towards the EV, for
fleet users, fleet managers and public drive event). Detailed information related to vehicle
performance was also recorded.
e-Mobility Fleet Schemes and Market Potentials – UNITED KINGDOM
Simone Signorile9
9
3.2 General Aspects of Mobility
DEMOGRAPHY
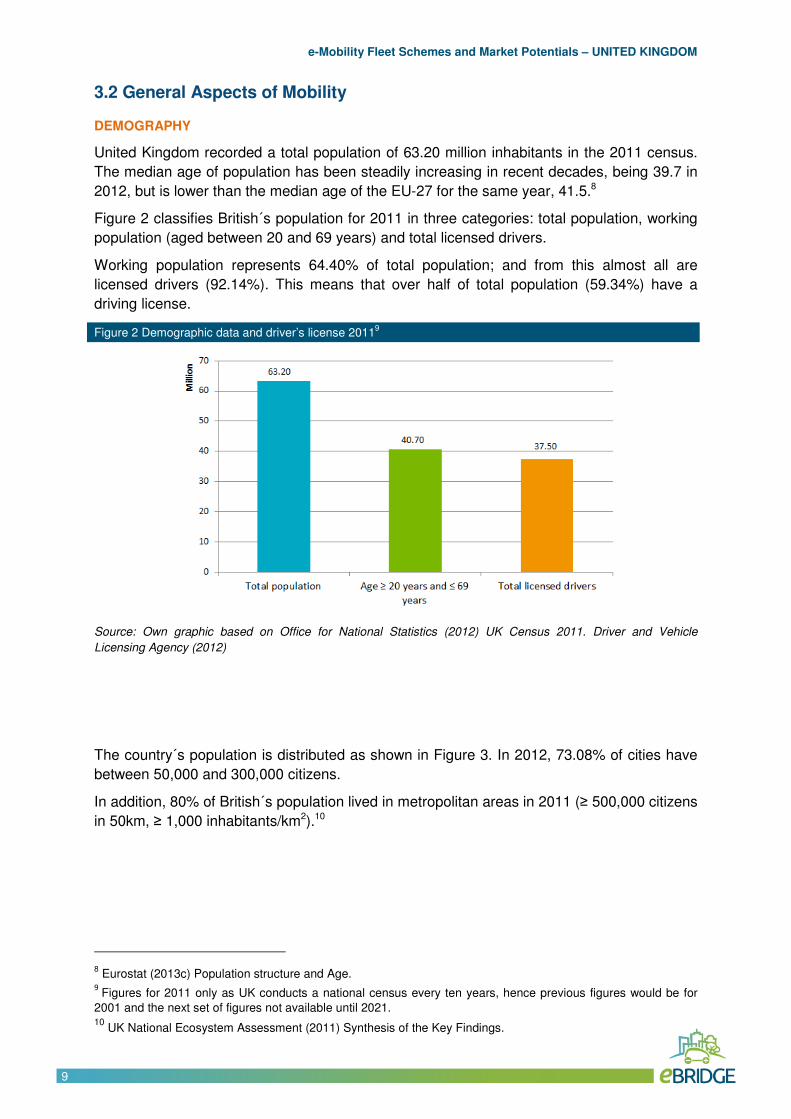
United Kingdom recorded a total population of 63.20 million inhabitants in the 2011 census.
The median age of population has been steadily increasing in recent decades, being 39.7 in
2012, but is lower than the median age of the EU-27 for the same year, 41.5.8
Figure 2 classifies British´s population for 2011 in three categories: total population, working
population (aged between 20 and 69 years) and total licensed drivers.
Working population represents 64.40% of total population; and from this almost all are
licensed drivers (92.14%). This means that over half of total population (59.34%) have a
driving license.
Figure 2 Demographic data and driver’s license 20119
Source: Own graphic based on Office for National Statistics (2012) UK Census 2011. Driver and Vehicle
Licensing Agency (2012)
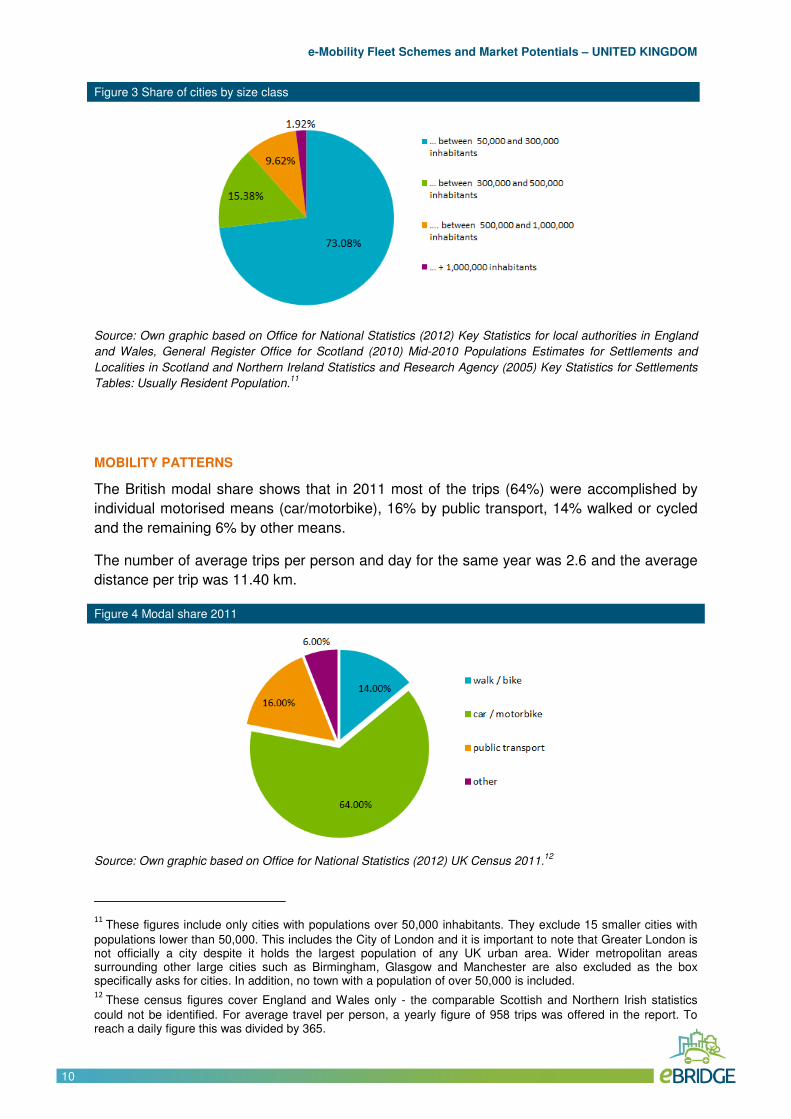
The country´s population is distributed as shown in Figure 3. In 2012, 73.08% of cities have
between 50,000 and 300,000 citizens.
In addition, 80% of British´s population lived in metropolitan areas in 2011 (≥ 500,000 citizens
in 50km, ≥ 1,000 inhabitants/km2).10
8 Eurostat (2013c) Population structure and Age.
9 Figures for 2011 only as UK conducts a national census every ten years, hence previous figures would be for
2001 and the next set of figures not available until 2021. 10
UK National Ecosystem Assessment (2011) Synthesis of the Key Findings.
e-Mobility Fleet Schemes and Market Potentials – UNITED KINGDOM
Simone Signorile10
10
Figure 3 Share of cities by size class
Source: Own graphic based on Office for National Statistics (2012) Key Statistics for local authorities in England
and Wales, General Register Office for Scotland (2010) Mid-2010 Populations Estimates for Settlements and
Localities in Scotland and Northern Ireland Statistics and Research Agency (2005) Key Statistics for Settlements
Tables: Usually Resident Population.11
MOBILITY PATTERNS
The British modal share shows that in 2011 most of the trips (64%) were accomplished by
individual motorised means (car/motorbike), 16% by public transport, 14% walked or cycled
and the remaining 6% by other means.
The number of average trips per person and day for the same year was 2.6 and the average
distance per trip was 11.40 km.
Figure 4 Modal share 2011
Source: Own graphic based on Office for National Statistics (2012) UK Census 2011.12
11
These figures include only cities with populations over 50,000 inhabitants. They exclude 15 smaller cities with
populations lower than 50,000. This includes the City of London and it is important to note that Greater London is not officially a city despite it holds the largest population of any UK urban area. Wider metropolitan areas surrounding other large cities such as Birmingham, Glasgow and Manchester are also excluded as the box specifically asks for cities. In addition, no town with a population of over 50,000 is included. 12
These census figures cover England and Wales only - the comparable Scottish and Northern Irish statistics
could not be identified. For average travel per person, a yearly figure of 958 trips was offered in the report. To reach a daily figure this was divided by 365.
e-Mobility Fleet Schemes and Market Potentials – UNITED KINGDOM
Simone Signorile11
11
3.3 The British Carpool
VEHICLE FIGURES
Total vehicles registered
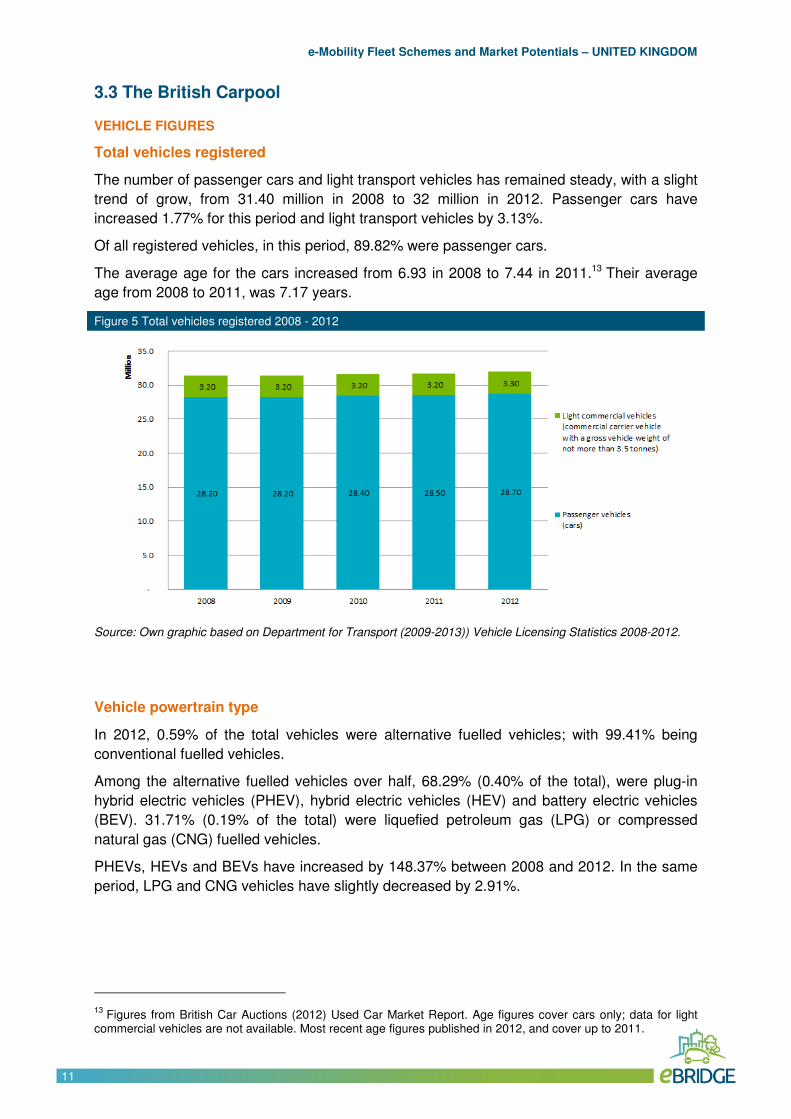
The number of passenger cars and light transport vehicles has remained steady, with a slight
trend of grow, from 31.40 million in 2008 to 32 million in 2012. Passenger cars have
increased 1.77% for this period and light transport vehicles by 3.13%.
Of all registered vehicles, in this period, 89.82% were passenger cars.
The average age for the cars increased from 6.93 in 2008 to 7.44 in 2011.13 Their average
age from 2008 to 2011, was 7.17 years.
Figure 5 Total vehicles registered 2008 - 2012
Source: Own graphic based on Department for Transport (2009-2013)) Vehicle Licensing Statistics 2008-2012.
Vehicle powertrain type
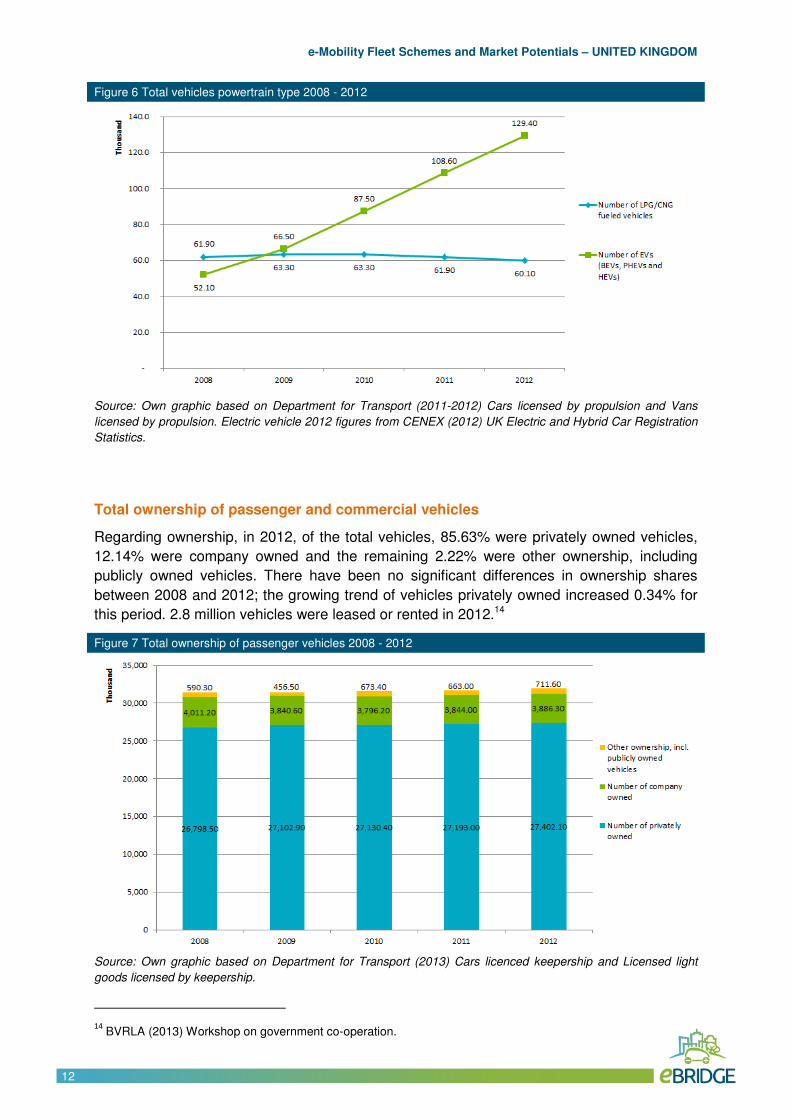
In 2012, 0.59% of the total vehicles were alternative fuelled vehicles; with 99.41% being
conventional fuelled vehicles.
Among the alternative fuelled vehicles over half, 68.29% (0.40% of the total), were plug-in
hybrid electric vehicles (PHEV), hybrid electric vehicles (HEV) and battery electric vehicles
(BEV). 31.71% (0.19% of the total) were liquefied petroleum gas (LPG) or compressed
natural gas (CNG) fuelled vehicles.
PHEVs, HEVs and BEVs have increased by 148.37% between 2008 and 2012. In the same
period, LPG and CNG vehicles have slightly decreased by 2.91%.
13
Figures from British Car Auctions (2012) Used Car Market Report. Age figures cover cars only; data for light commercial vehicles are not available. Most recent age figures published in 2012, and cover up to 2011.
e-Mobility Fleet Schemes and Market Potentials – UNITED KINGDOM
Simone Signorile12
12
Figure 6 Total vehicles powertrain type 2008 - 2012
Source: Own graphic based on Department for Transport (2011-2012) Cars licensed by propulsion and Vans
licensed by propulsion. Electric vehicle 2012 figures from CENEX (2012) UK Electric and Hybrid Car Registration
Statistics.
Total ownership of passenger and commercial vehicles
Regarding ownership, in 2012, of the total vehicles, 85.63% were privately owned vehicles,
12.14% were company owned and the remaining 2.22% were other ownership, including
publicly owned vehicles. There have been no significant differences in ownership shares
between 2008 and 2012; the growing trend of vehicles privately owned increased 0.34% for
this period. 2.8 million vehicles were leased or rented in 2012.14
Figure 7 Total ownership of passenger vehicles 2008 - 2012
Source: Own graphic based on Department for Transport (2013) Cars licenced keepership and Licensed light
goods licensed by keepership.
14
BVRLA (2013) Workshop on government co-operation.
e-Mobility Fleet Schemes and Market Potentials – UNITED KINGDOM
Simone Signorile13
13
EVs ownership
No figures were found for electric vehicle ownership segments, likely due to their recently
coming to market and the small market share they hold.
However, research outlined in the International Energy Agency (2012) EV City Casebook
suggests that 85% of electric vehicles are purchased by companies in some sections of the
UK. The ENEVATE project (2013) highlights that a significant proportion of the UK's electric
vehicle stock is utilised by local authorities. Vaughan (2011) reports that electric car sales in
the UK were expected to double in 2013 as prices started to fall.
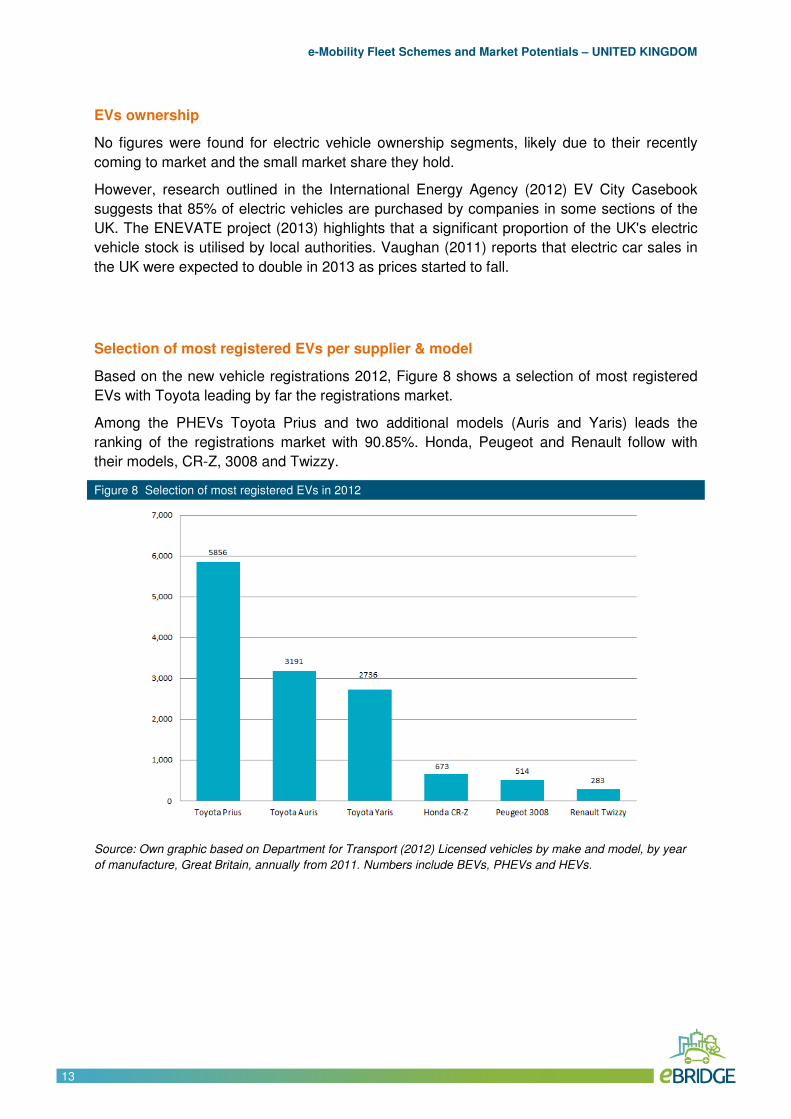
Selection of most registered EVs per supplier & model
Based on the new vehicle registrations 2012, Figure 8 shows a selection of most registered
EVs with Toyota leading by far the registrations market.
Among the PHEVs Toyota Prius and two additional models (Auris and Yaris) leads the
ranking of the registrations market with 90.85%. Honda, Peugeot and Renault follow with
their models, CR-Z, 3008 and Twizzy.
Figure 8 Selection of most registered EVs in 2012
Source: Own graphic based on Department for Transport (2012) Licensed vehicles by make and model, by year
of manufacture, Great Britain, annually from 2011. Numbers include BEVs, PHEVs and HEVs.
e-Mobility Fleet Schemes and Market Potentials – UNITED KINGDOM
Simone Signorile14
14
ENVIRONMENT
The EU has called for the need to drastically reduce world greenhouse gas (GHG)
emissions, with the goal of limiting climate change below 2 ºC. Overall, the EU needs to
reduce emissions by 80-95 % below 1990 levels by 2050, in the context of the necessary
reductions of the developed countries as a group, in order to reach this goal.
European Commission analysis shows that while deeper cuts can be achieved in other
sectors of the economy, a reduction of at least 60% of GHGs by 2050 with respect to 1990
levels is required from the transport sector, which is a significant and still growing source of
GHGs. By 2030, the goal for transport will be to reduce GHG emissions to around 20%
below their 2008 level.
Accordingly, the White Paper on Transport (2011) establishes as first goal to halve the use of
conventionally fuelled cars in urban transport by 2030; phase them out in cities by 2050 and
achieve essentially CO2-free city logistics in major urban centres by 2030.15
Moreover, the European Union’s ten-year growth strategy, Europe 2020, established a set of
targets including climate, energy and sustainability targets. The EU targets are translated into
national targets in each EU country.
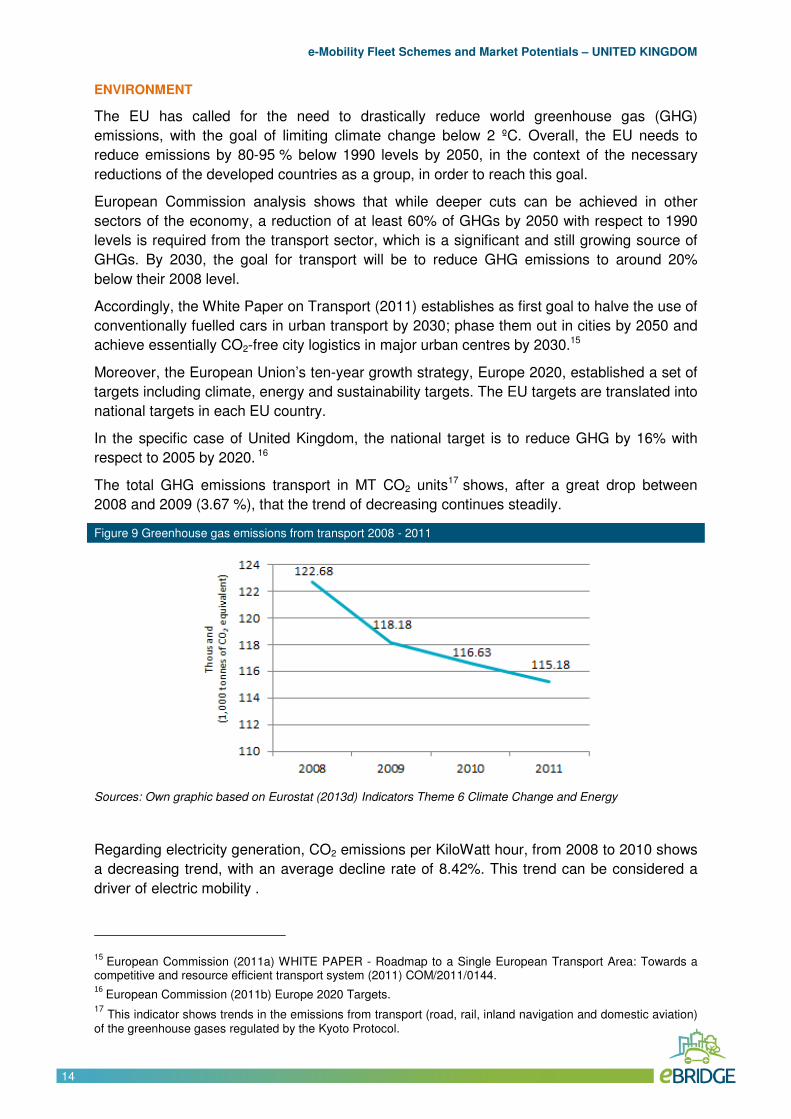
In the specific case of United Kingdom, the national target is to reduce GHG by 16% with
respect to 2005 by 2020. 16
The total GHG emissions transport in MT CO2 units17 shows, after a great drop between
2008 and 2009 (3.67 %), that the trend of decreasing continues steadily.
Figure 9 Greenhouse gas emissions from transport 2008 - 2011
Sources: Own graphic based on Eurostat (2013d) Indicators Theme 6 Climate Change and Energy
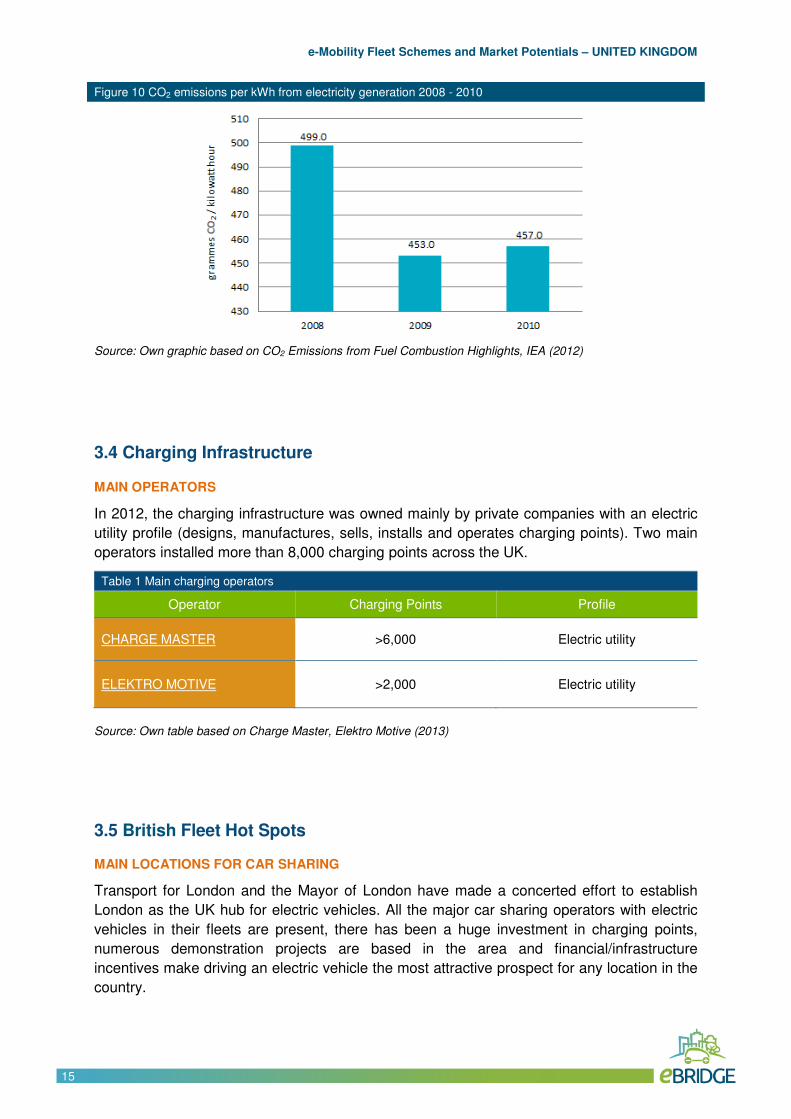
Regarding electricity generation, CO2 emissions per KiloWatt hour, from 2008 to 2010 shows
a decreasing trend, with an average decline rate of 8.42%. This trend can be considered a
driver of electric mobility .
15 European Commission (2011a) WHITE PAPER - Roadmap to a Single European Transport Area: Towards a
competitive and resource efficient transport system (2011) COM/2011/0144. 16
European Commission (2011b) Europe 2020 Targets. 17
This indicator shows trends in the emissions from transport (road, rail, inland navigation and domestic aviation) of the greenhouse gases regulated by the Kyoto Protocol.
e-Mobility Fleet Schemes and Market Potentials – UNITED KINGDOM
Simone Signorile15
15
Figure 10 CO2 emissions per kWh from electricity generation 2008 - 2010
Source: Own graphic based on CO2 Emissions from Fuel Combustion Highlights, IEA (2012)
3.4 Charging Infrastructure
MAIN OPERATORS
In 2012, the charging infrastructure was owned mainly by private companies with an electric
utility profile (designs, manufactures, sells, installs and operates charging points). Two main
operators installed more than 8,000 charging points across the UK.
Table 1 Main charging operators
Operator Charging Points Profile
CHARGE MASTER >6,000 Electric utility
ELEKTRO MOTIVE >2,000 Electric utility
Source: Own table based on Charge Master, Elektro Motive (2013)
3.5 British Fleet Hot Spots
MAIN LOCATIONS FOR CAR SHARING
Transport for London and the Mayor of London have made a concerted effort to establish
London as the UK hub for electric vehicles. All the major car sharing operators with electric
vehicles in their fleets are present, there has been a huge investment in charging points,
numerous demonstration projects are based in the area and financial/infrastructure
incentives make driving an electric vehicle the most attractive prospect for any location in the
country.
e-Mobility Fleet Schemes and Market Potentials – UNITED KINGDOM
Simone Signorile16
16
In 2012, London had more than 2,000 charging points for more than 2,000 EVs, and at least
five car sharing operators
The Greater London Authority also plans to deliver 1,000 electric vehicles into the Greater
London Authority fleet by 201518.
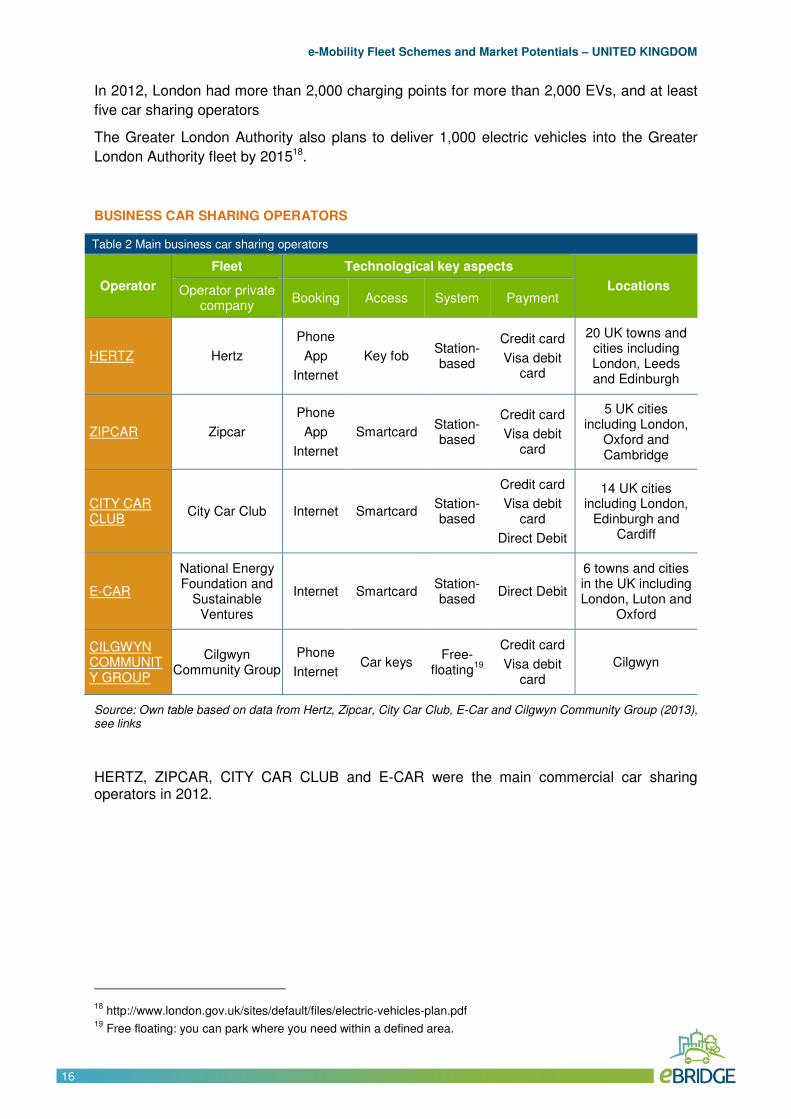
BUSINESS CAR SHARING OPERATORS
Table 2 Main business car sharing operators
Operator
Fleet Technological key aspects
Locations Operator private company
Booking Access System Payment
HERTZ Hertz
Phone
App
Internet
Key fob Station-based
Credit card
Visa debit card
20 UK towns and cities including London, Leeds and Edinburgh
ZIPCAR Zipcar
Phone
App
Internet
Smartcard Station-based
Credit card
Visa debit card
5 UK cities including London,
Oxford and Cambridge
CITY CAR CLUB
City Car Club Internet Smartcard Station-based
Credit card
Visa debit card
Direct Debit
14 UK cities including London,
Edinburgh and Cardiff
E-CAR
National Energy Foundation and
Sustainable Ventures
Internet Smartcard Station-based
Direct Debit
6 towns and cities in the UK including London, Luton and
Oxford
CILGWYN COMMUNITY GROUP
Cilgwyn Community Group
Phone
Internet Car keys
Free-floating
19
Credit card
Visa debit card
Cilgwyn
Source: Own table based on data from Hertz, Zipcar, City Car Club, E-Car and Cilgwyn Community Group (2013), see links
HERTZ, ZIPCAR, CITY CAR CLUB and E-CAR were the main commercial car sharing operators in 2012.
18
http://www.london.gov.uk/sites/default/files/electric-vehicles-plan.pdf 19
Free floating: you can park where you need within a defined area.
e-Mobility Fleet Schemes and Market Potentials – UNITED KINGDOM
Simone Signorile17
17
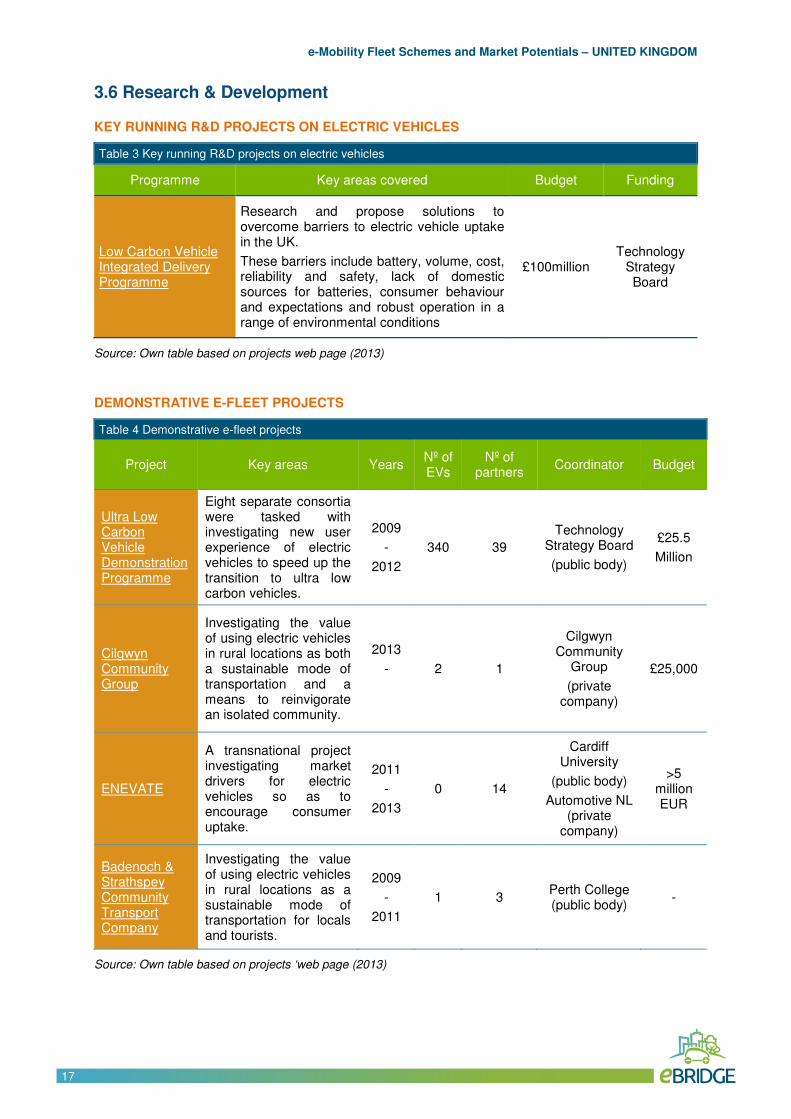
3.6 Research & Development
KEY RUNNING R&D PROJECTS ON ELECTRIC VEHICLES
Table 3 Key running R&D projects on electric vehicles
Programme Key areas covered Budget Funding
Low Carbon Vehicle Integrated Delivery Programme
Research and propose solutions to overcome barriers to electric vehicle uptake in the UK.
These barriers include battery, volume, cost, reliability and safety, lack of domestic sources for batteries, consumer behaviour and expectations and robust operation in a range of environmental conditions
£100million Technology
Strategy Board
Source: Own table based on projects web page (2013)
DEMONSTRATIVE E-FLEET PROJECTS
Table 4 Demonstrative e-fleet projects
Project Key areas Years Nº of EVs
Nº of partners
Coordinator Budget
Ultra Low Carbon Vehicle Demonstration Programme
Eight separate consortia were tasked with investigating new user experience of electric vehicles to speed up the transition to ultra low carbon vehicles.
2009
-
2012
340 39
Technology Strategy Board
(public body)
£25.5
Million
Cilgwyn Community Group
Investigating the value of using electric vehicles in rural locations as both a sustainable mode of transportation and a means to reinvigorate an isolated community.
2013
-
2 1
Cilgwyn Community
Group
(private company)
£25,000
ENEVATE
A transnational project investigating market drivers for electric vehicles so as to encourage consumer uptake.
2011
-
2013
0 14
Cardiff University
(public body)
Automotive NL (private
company)
>5 million EUR
Badenoch & Strathspey Community Transport Company
Investigating the value of using electric vehicles in rural locations as a sustainable mode of transportation for locals and tourists.
2009
-
2011
1 3 Perth College (public body)
-
Source: Own table based on projects ‘web page (2013)
e-Mobility Fleet Schemes and Market Potentials – UNITED KINGDOM
Simone Signorile18
18
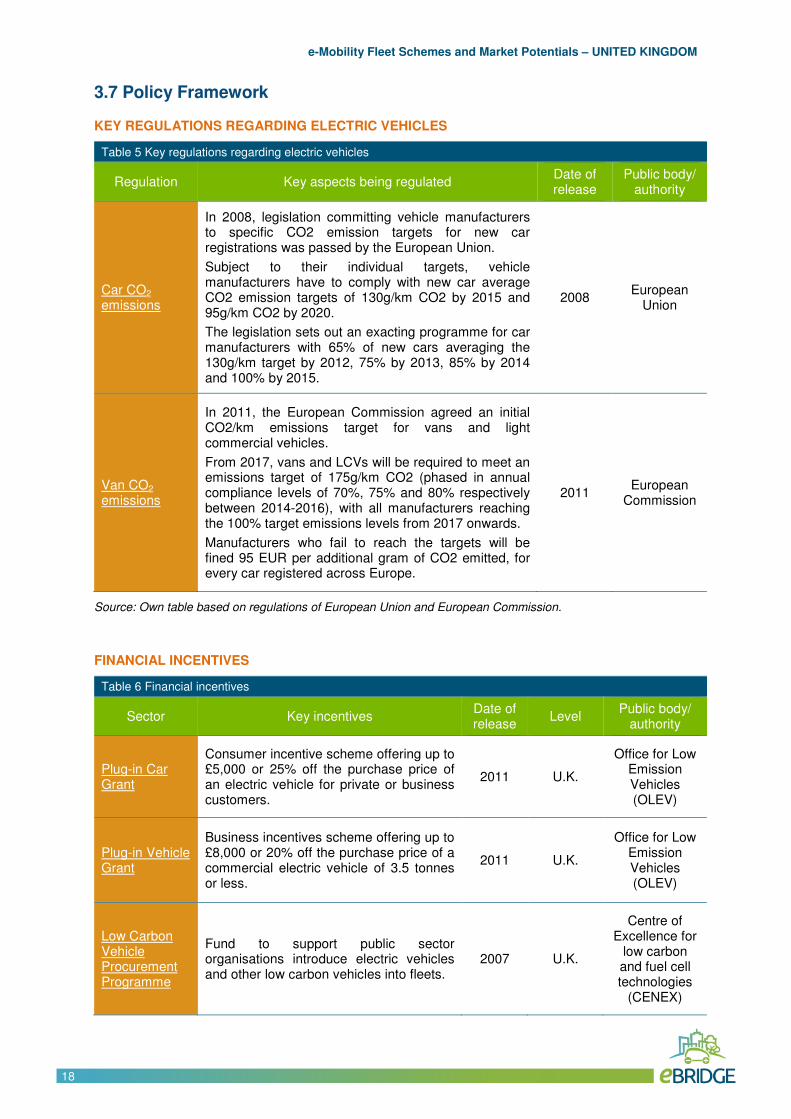
3.7 Policy Framework
KEY REGULATIONS REGARDING ELECTRIC VEHICLES
Table 5 Key regulations regarding electric vehicles
Regulation Key aspects being regulated Date of release
Public body/ authority
Car CO2
emissions
In 2008, legislation committing vehicle manufacturers to specific CO2 emission targets for new car registrations was passed by the European Union.
Subject to their individual targets, vehicle manufacturers have to comply with new car average CO2 emission targets of 130g/km CO2 by 2015 and 95g/km CO2 by 2020.
The legislation sets out an exacting programme for car manufacturers with 65% of new cars averaging the 130g/km target by 2012, 75% by 2013, 85% by 2014 and 100% by 2015.
2008 European
Union
Van CO2
emissions
In 2011, the European Commission agreed an initial CO2/km emissions target for vans and light commercial vehicles.
From 2017, vans and LCVs will be required to meet an emissions target of 175g/km CO2 (phased in annual compliance levels of 70%, 75% and 80% respectively between 2014-2016), with all manufacturers reaching the 100% target emissions levels from 2017 onwards.
Manufacturers who fail to reach the targets will be fined 95 EUR per additional gram of CO2 emitted, for every car registered across Europe.
2011 European
Commission
Source: Own table based on regulations of European Union and European Commission.
FINANCIAL INCENTIVES
Table 6 Financial incentives
Sector Key incentives Date of release
Level Public body/
authority
Plug-in Car Grant
Consumer incentive scheme offering up to £5,000 or 25% off the purchase price of an electric vehicle for private or business customers.
2011 U.K.
Office for Low Emission Vehicles (OLEV)
Plug-in Vehicle Grant
Business incentives scheme offering up to £8,000 or 20% off the purchase price of a commercial electric vehicle of 3.5 tonnes or less.
2011 U.K.
Office for Low Emission Vehicles (OLEV)
Low Carbon Vehicle Procurement Programme
Fund to support public sector organisations introduce electric vehicles and other low carbon vehicles into fleets.
2007 U.K.
Centre of Excellence for
low carbon and fuel cell technologies
(CENEX)
e-Mobility Fleet Schemes and Market Potentials – UNITED KINGDOM
Simone Signorile19
19
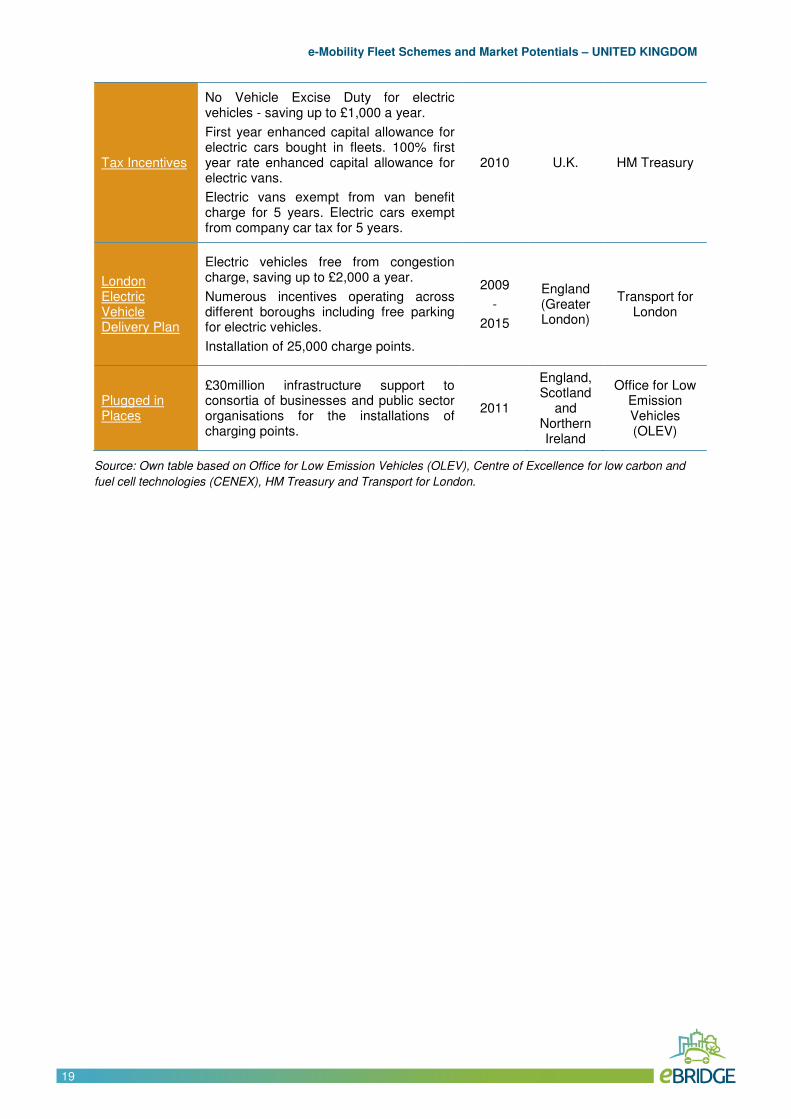
Tax Incentives
No Vehicle Excise Duty for electric vehicles - saving up to £1,000 a year.
First year enhanced capital allowance for electric cars bought in fleets. 100% first year rate enhanced capital allowance for electric vans.
Electric vans exempt from van benefit charge for 5 years. Electric cars exempt from company car tax for 5 years.
2010 U.K. HM Treasury
London Electric Vehicle Delivery Plan
Electric vehicles free from congestion charge, saving up to £2,000 a year.
Numerous incentives operating across different boroughs including free parking for electric vehicles.
Installation of 25,000 charge points.
2009
-
2015
England (Greater London)
Transport for London
Plugged in Places
£30million infrastructure support to consortia of businesses and public sector organisations for the installations of charging points.
2011
England, Scotland
and Northern Ireland
Office for Low Emission Vehicles (OLEV)
Source: Own table based on Office for Low Emission Vehicles (OLEV), Centre of Excellence for low carbon and
fuel cell technologies (CENEX), HM Treasury and Transport for London.
e-Mobility Fleet Schemes and Market Potentials – UNITED KINGDOM
Simone Signorile20
20
4. Market Potential
4.1 Main Drivers and Constraints
In general terms and at European level, the main market barriers for the successful
integration of electric mobility into European transport systems include technological,
infrastructural and cost-related aspects. Finding integrative solutions to overcoming the
current challenges concerning battery technology, standardisation of the recharging
infrastructure, interaction with electricity generation systems and cost and business case of
large scale introduction is crucial for the development of the electric mobility market in the
short and long term. The increased demand for EVs, along with the sharing of best practice
and extensive public and organisational awareness-raising activities, will help encourage
infrastructure and technological investments and reduce costs.
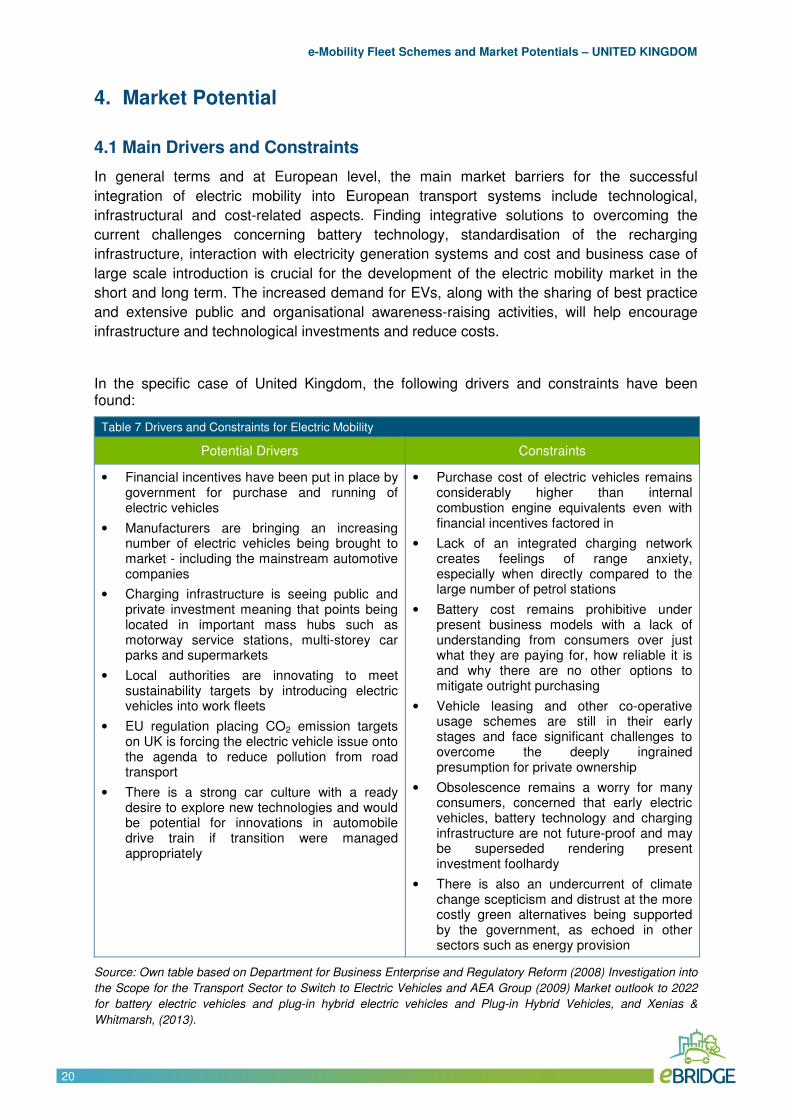
In the specific case of United Kingdom, the following drivers and constraints have been found:
Table 7 Drivers and Constraints for Electric Mobility
Potential Drivers Constraints
• Financial incentives have been put in place by government for purchase and running of electric vehicles
• Manufacturers are bringing an increasing number of electric vehicles being brought to market - including the mainstream automotive companies
• Charging infrastructure is seeing public and private investment meaning that points being located in important mass hubs such as motorway service stations, multi-storey car parks and supermarkets
• Local authorities are innovating to meet sustainability targets by introducing electric vehicles into work fleets
• EU regulation placing CO2 emission targets on UK is forcing the electric vehicle issue onto the agenda to reduce pollution from road transport
• There is a strong car culture with a ready desire to explore new technologies and would be potential for innovations in automobile drive train if transition were managed appropriately
• Purchase cost of electric vehicles remains considerably higher than internal combustion engine equivalents even with financial incentives factored in
• Lack of an integrated charging network creates feelings of range anxiety, especially when directly compared to the large number of petrol stations
• Battery cost remains prohibitive under present business models with a lack of understanding from consumers over just what they are paying for, how reliable it is and why there are no other options to mitigate outright purchasing
• Vehicle leasing and other co-operative usage schemes are still in their early stages and face significant challenges to overcome the deeply ingrained presumption for private ownership
• Obsolescence remains a worry for many consumers, concerned that early electric vehicles, battery technology and charging infrastructure are not future-proof and may be superseded rendering present investment foolhardy
• There is also an undercurrent of climate change scepticism and distrust at the more costly green alternatives being supported by the government, as echoed in other sectors such as energy provision
Source: Own table based on Department for Business Enterprise and Regulatory Reform (2008) Investigation into
the Scope for the Transport Sector to Switch to Electric Vehicles and AEA Group (2009) Market outlook to 2022
for battery electric vehicles and plug-in hybrid electric vehicles and Plug-in Hybrid Vehicles, and Xenias &
Whitmarsh, (2013).
e-Mobility Fleet Schemes and Market Potentials – UNITED KINGDOM
Simone Signorile21
21
5. Local Assessment
5.1 Starting Point
In April 2011 Carmarthenshire County Council (CCC) introduced two Mitsubishi iMiEVs
battery electric vehicles to their car pool, bringing the total number of vehicles to 8 (of which
six were diesel cars). This made Carmarthenshire County Council the first local authority in
Wales to introduce electric vehicles to its fleet. These vehicles are provided for employees to
utilise in their day-to-day duties as an efficiency saving in both economical and
environmental matters.
In late 2012 Carmarthenshire County Council investigated the possibility of expanding the
Parc Myrddin's Campus current fleet of 2 Mitsubishi iMiEVs to 6 electric vehicles in the
duration of the eBRIDGE project. 4 of these will remain at Parc Myrddin and will be
accessible to employees based at this site, whilst the other 2 will be based at other locations.
As of summer 2013, two of the new EVs were tested and established at Parc Myrddin, two
were under assessment and two more were delivered at another location at Carmarthen.
5.2 General aspects of Mobility
DEMOGRAPHY
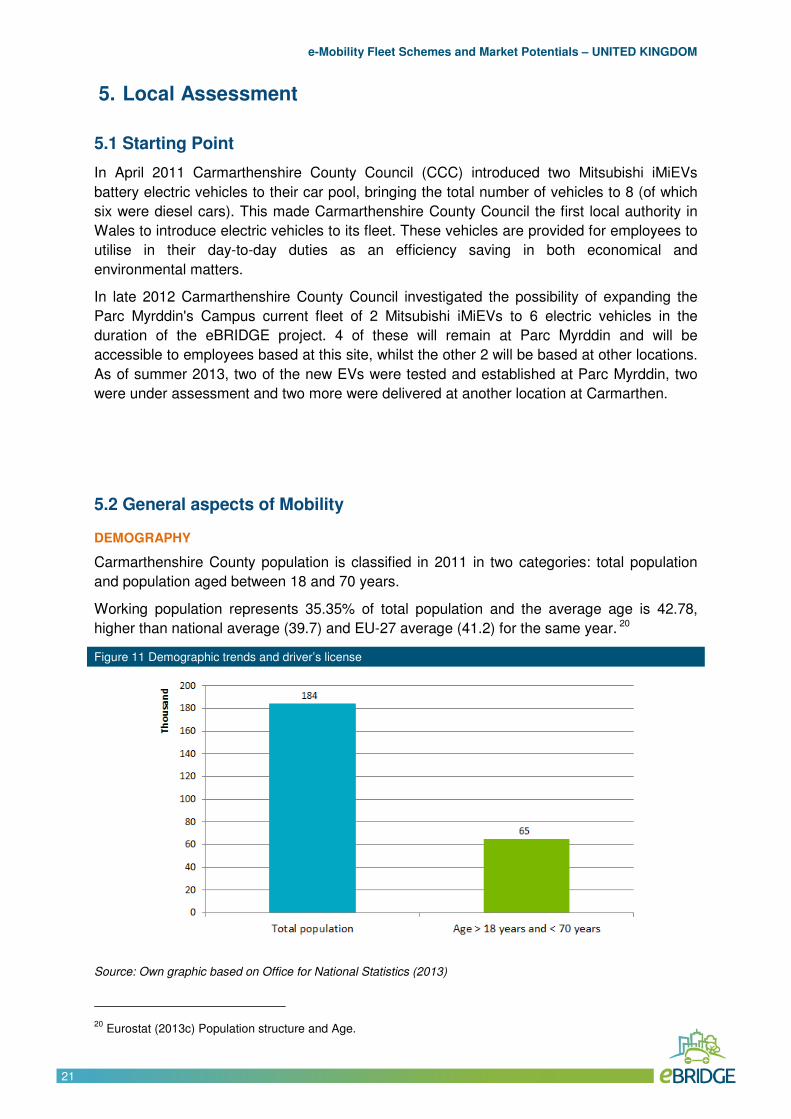
Carmarthenshire County population is classified in 2011 in two categories: total population
and population aged between 18 and 70 years.
Working population represents 35.35% of total population and the average age is 42.78,
higher than national average (39.7) and EU-27 average (41.2) for the same year. 20
Figure 11 Demographic trends and driver’s license
Source: Own graphic based on Office for National Statistics (2013)
20
Eurostat (2013c) Population structure and Age.
e-Mobility Fleet Schemes and Market Potentials – UNITED KINGDOM
Simone Signorile22
22
EVS USER PROFILES
Based CCC figures, in 2012 70% of the CCC employees who drove an electric car were
male and on average 43.5 years-old.21
5.3 The Carmarthenshire County Council Carpool
Two Mitsubishi iMiEV have been acquired by Carmarthenshire County, by 2012. Both
vehicles are owned by a public body, one acquired in 2011 and one in 2012. Four more EVs
were acquired in 2013, bringing the total to six.
Source: Carmarthenshire County Council
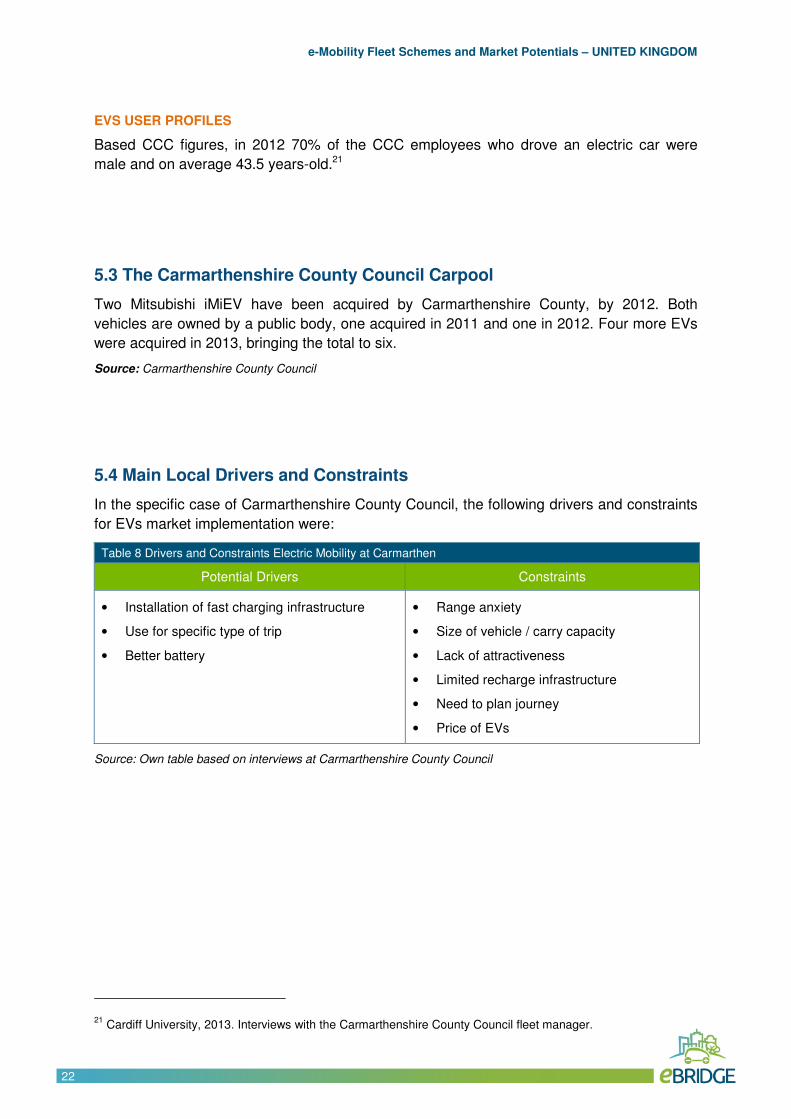
5.4 Main Local Drivers and Constraints
In the specific case of Carmarthenshire County Council, the following drivers and constraints
for EVs market implementation were:
Table 8 Drivers and Constraints Electric Mobility at Carmarthen
Potential Drivers Constraints
• Installation of fast charging infrastructure
• Use for specific type of trip
• Better battery
• Range anxiety
• Size of vehicle / carry capacity
• Lack of attractiveness
• Limited recharge infrastructure
• Need to plan journey
• Price of EVs
Source: Own table based on interviews at Carmarthenshire County Council
21 Cardiff University, 2013. Interviews with the Carmarthenshire County Council fleet manager.

e-Mobility Fleet Schemes and Market Potentials – UNITED KINGDOM
Simone Signorile23
23
6. General outlook
In conclusion, there are considerable policy measures supportive of EVs in the UK. These
include direct subsidies, tax allowances and exemptions as well as funding for infrastructure
and subsidies for EV purchase. Despite this array of measures, and the recent increases in
EV sales, total numbers are only a fraction of the UK government envisaged targets for 2020.
e-Mobility Fleet Schemes and Market Potentials – UNITED KINGDOM
Simone Signorile24
24
7. References
• AEA Group (2009) Market outlook to 2022 for battery electric vehicles and plug-in
hybrid electric vehicles and Plug-in Hybrid Vehicles.
• BBC (2013). Councils spend £1,750 per car on charging points.
http://www.bbc.co.uk/news/uk-23521924 (retrieved December 2013)
• Business car sharing operators.
• BVRLA (2013) Workshop on government co-operation.
• Council of the European Union (2010). Conclusions on clean and energy-efficient
vehicles for a competitive automotive industry and decarbonised road transport.
Brussels, 2010.
http://www.consilium.europa.eu/uedocs/cms_Data/docs/pressdata/en/intm/114617.pdf
• Carplus (2011). Annual survey of car clubs. Carplus, UK.
• Charging infrastructure operators.
• Centre of Excellence for low carbon vehicle technologies, CENEX (2012) UK Electric
and Hybrid Car Registration Statistics.
• DEFRA (2009). Attitudes and Behaviour Towards the Environment. Department for
Environment, Food and Rural Affairs.
• Department for Business Enterprise and Regulatory Reform (2008) Investigation into
the Scope for the Transport Sector to Switch to Electric Vehicles.
• Department for Transport (2009-2013)
- Vehicle Licensing Statistics 2008-2012.
- Cars licensed by propulsion and Vans licensed by propulsion
- Cars licensed keepership and Licensed light goods licensed by keepership.
- Licensed vehicles by make and model, by year of manufacture, Great Britain,
annually from 2011
• Driver and Vehicle Licensing Agency (2012) Driver license data
• ENEVATE project (2013). Final report.
http://www.enevate.eu/final_conference2013/report.pdf (retrieved December 2013).
• Ernst & Young (2010). Gauging interest for plug-in hybrid and electric vehicles in
select markets Compared results. Ernst & Young Global Automotive Center.
• EST (2010). Energy Saving Trust attitude tracker. London: Energy Saving Trust.
• European Environment Agency (EEA)
www.eea.europa.eu/es
• European Commission (2011a) WHITE PAPER - Roadmap to a Single European
Transport Area: Towards a competitive and resource efficient transport system (2011)
COM/2011/0144 final.
e-Mobility Fleet Schemes and Market Potentials – UNITED KINGDOM
Simone Signorile25
25
• European Commission (2011b) Europe 2020 Targets
http://ec.europa.eu/europe2020/pdf/targets_en.pdf
• Eurostat (2013a) GDP at current market prices (accessed October 2013).
http://epp.eurostat.ec.europa.eu/statistics_explained/index.php/National_accounts_%E2%80%93_GDP
• Eurostat (2013b) Population on 1 January.
http://epp.eurostat.ec.europa.eu/tgm/table.do?tab=table&language=en&pcode=tps00001&tableSelection
=1&footnotes=yes&labeling=labels&plugin=1 (accessed October 2013)
• Eurostat (2013c) Population structure and Age (accessed October 2013)
http://epp.eurostat.ec.europa.eu/statistics_explained/index.php/Population_structure_and_ageing
Eurostat (2013d) Indicators Theme 6 Climate Change and Energy
http://epp.eurostat.ec.europa.eu/portal/page/portal/sdi/indicators/theme6 (accessed October 2013)
• Eurostat (2013e) Indicators Theme 7 Transport (accessed October 2013)
http://epp.eurostat.ec.europa.eu/portal/page/portal/sdi/indicators/theme7
• European Automobile Manufacturers' Association (ACEA). Pocket guide 2013.
http://www.acea.be/images/uploads/files/POCKET_GUIDE_13.pdf
• Foy, H. (2013). Spending to encourage use of electric cars falls flat. Financial Times,
15/12/2013. Retrieved 16/12/2013.
"Spending to encourage use of electric cars falls flat". Financial Times.
• General Register Office for Scotland (2010) Mid-2010 Populations Estimates for
Settlements and Localities in Scotland and Northern Ireland Statistics
• Graham-Rowe, E., Gardner, B., Abraham, C., Skippon, S., Dittmar, H., Hutchins, R.,
& Stannard, J. (2012). Mainstream consumers driving plug-in battery-electric and
plug-in hybrid electric cars: A qualitative analysis of responses and evaluations.
Transportation Research Part A: Policy and Practice, 46 (1), 140-153.
Hybrid & Electric Vehicle Implementing Agreement (IA-HEV), United Kingdom
http://www.ieahev.org/by-country/united-kingdom/ (accessed September 2013)
• International Energy Agency (2012) EV City Casebook
https://www.iea.org/publications/freepublications/publication/EVCityCasebook.pdf
• International Energy Agency (2013 a) Electric Vehicle Sales and Government Targets
2013 http://www.iea.org/etp/tracking/electric-vehicles/
• IEA (2013 b) Tracking Clean Energy Progress 2013
http://www.iea.org/publications/TCEP_web.pdf
• IEA (2011) CO2 Emissions from fuel combustion 2011. Highlights.
http://www.iea.org/media/statistics/CO2highlights.pdf
• Interview with fleet manager of Carmarthenshire County Council.
• Niches (2012). Guidelines for Implementers of Electric Cars in Car Share Clubs. WG4
Report.
e-Mobility Fleet Schemes and Market Potentials – UNITED KINGDOM
Simone Signorile26
26
• Nykvist, B. & Whitmarsh, L. (2008). A multi-level analysis of sustainable mobility
transitions: Niche development in the UK and Sweden. Technological Forecasting &
Social Change
• Office for National Statistics (2012-2013)
- UK Census 2011
- Key Statistics for local authorities in England and Wales,
• Research Agency (2005) Key Statistics for Settlements Tables: Usually Resident
Population.
• Society of Motor Manufacturers (SMMT) (2013). September 2013 EV and AFV
registrations
http://www.smmt.co.uk/2013/10/september-2013-ev-registrations/ (retrieved December 2013)
• Society of Motor Manufacturers (SMMT) (2012). December 2011 EV and AFV
registrations
http://www.smmt.co.uk/2012/01/december-2011-–-ev-and-afv-registrations/ (retrieved December
2013)
• Society of Motor Manufacturers and Traders (SMMT) (2013) Motor Industry Facts
2012.
• UK Climate Change Committee (2010). The Fourth Carbon Budget. Chapter 4 –
Decarbonising Surface Transport.
http://www.theccc.org.uk/wp-content/uploads/2013/12/1785a-CCC_AdviceRep_Chap4.pdf
• UK National Ecosystem Assessment (2011) Synthesis of the Key Findings.
• Vaughan, A. (2011). Electric car UK sales sputter out. The Guardian. 21 Oct.
http://www.guardian.co.uk/environment/2011/oct/21/electric-car-uk-sales-sputter
• Xenias, D. & Whitmarsh, L. (2013). Dimensions and determinants of expert and public
preferences for low-carbon transport policies and technologies. Transportation
Research Part A, Policy and Practice,48, 75-85.

e-Mobility Fleet Schemes and Market Potentials – UNITED KINGDOM
Simone Signorile27
27
eBRIDGE: Empowering e-fleets for business
and private purposes in cities
The sole responsibility for the content of this publication lies with the authors. It does not necessarily reflect the
opinion of the European Union. Neither the EASME nor the European Commission are responsible for any use
that may be made of the information contained therein.