Embed Size (px)
Citation preview
1
Empowered Lives.Resilient Nations.
VegetablesFood Security
Pove
rty
Redu
ctio
n
Agriculture
PoultryFeasibilty
farmers
Job Creation
Harvesting
Poultry
Harv
e
s
Agriculture
AFRICAN AGRIBUSINESS SUPPLIER DEVELOPMENT PROGRAMME (AASDP) TOOLKIT
Growing inclusive agri-food value chains benefitting African famers and SMEs
Supply Chain
ii
African Agribusiness Supplier Development Programme (AASDP) Toolkit
Acknowledgements
Toolkit and Training Material Design, Development and Coordination: Tomas Sales, Pascale Bonzom, Juergen Nagler (UNDP AFIM)
Toolkit and Training Material Authors: Marije Boomsma, Remco Mur, Ellen Mangnus (Royal Tropical Insti-tute (KIT))
We also would like to thank all contributors for their valuable input and feedback, including Tiina Turunen, Dan Acquaye, Robert Nyam-baka, Kurauone Murwisi, Murray Smith, Seliatou Kayode-Anglade and Dr Hans Balyamujura.
Finally, we are grateful to all the organizations that attended the AASDP workshop in Nairobi, Kenya, on October 9 and 10, 2013, for their contributions.
iii
Foreword
UNDP is a leading agency in promoting inclusive eco-nomic growth and sustainable human development. We bring a wealth of experience through global and region-al initiatives and country support. We have extensive experience in partnering with governments, the private sector, local communities and all relevant stakeholders.
Our strategy for inclusive economic growth is to facilitate the development of ‘inclusive markets and businesses’ integrating low-income people into local, regional and international value chains. This strengthens smallholders and entrepreneurs, thus creating jobs and income op-portunities, for the provision of basic goods and services including food.
Agriculture employs around 60 percent of Africa’s labour force and growth in agriculture is key to poverty eradi-cation as well as hunger reduction. Development goals cannot be achieved without good governance and a vi-brant, inclusive private sector. Food security cannot be achieved without an inclusive agribusiness sector.
2014 is the Year of Agriculture and Food Security in Afri-ca. It is also the 10th anniversary of the Comprehensive Africa Agriculture Development Programme (CAADP). Clearly the transformation of agriculture is at the top of the African Agenda and the challenge in the next 10 years for CAADP is to move from advocacy and planning to greater country level implementation and results.
It is in this spirit and in support of the AU and CAADP agenda that UNDP, especially through our African Facility for Inclusive Markets (AFIM), has been working on inclu-sive agribusiness for several years to promote inclusive market development, inclusive business and to foster regional value chains in job creating sectors. AFIM also has been instrumental in the Johannesburg Declaration of 2011 on Engaging the Private Sector in Furthering Af-rica’s Agribusiness and Food Security Agenda.
From 2012 to 2013, AFIM together with EAC, ECOWAS and COMESA , held Project Facilitation Platforms to ad-vance cross-border and regional agrifood value chains. Together the first six projects already benefit over 20,000 smallholder farmers and hundreds of SMEs. To achieve even greater impact, AFIM has developed the African Agribusiness Supplier Development Programme (AAS-DP).
The objectives of such agricultural supplier develop-ment programmes are three-fold: first, to improve the quantity and quality supply of agricultural products by farmers and SMEs to markets; second, to provide small-holder farmers and SMEs with support in accessing the growing agricultural supply chains of lead firms; third, to contribute to the development of national African econ-omies by developing agricultural products that meet market quality standards.
This toolkit and its related training material are key mile-stone to the success of this programme and have been validated in a major workshop with representatives of 10 countries and partner organizations (technical and de-velopment partners and business organizations), in Oc-tober 2013 in Nairobi, Kenya. The UNDP Regional Service Centre for Africa with AFIM stands ready to provide the support required and follow through on the next steps for national roll outs of agribusiness supplier develop-ment programmes.
We hope you find these tools useful and call upon each of you to join in and within your spheres of compe-tence contribute to the implementation of this initiative through technical and financial resources.
Lebogang Motlana, Director, UNDP Regional Service Center for Africa
iv
African Agribusiness Supplier Development Programme (AASDP) Toolkit
Abbreviations
AASDP African Agribusiness Supplier Development Programme
ABDS Agricultural Business Development Services
AFIM African Facility for Inclusive Markets
AU African Union
CAADP Comprehensive Africa Agricultural Development Programme
CO Country Offices
COMESA Common Markets for Eastern and Southern Africa
DFID UK aid (Department for International Development)
ECO Organic standard
ECOWAS Economic Community for West African States
FAO Food and Agricultural Organisation
FDI Foreign Direct Investment
GAP Good Agricultural Practices
GDP Gross Domestic Product
GMP Good Manufacturing Practices
GiZ German Development Organization
HACCP Hazard Analysis Critical Control Points
IFAD International Fund for Agricultural Development
IFPRI International Food Policy Research Institute
IMD Inclusive Markets Development
v
IMF International Monetary Fund
IO International Organizations
KIT Royal Tropical Institute
LED Local Economic Development
MDGs Millennium Development Goals
MFI Micro Finance Institution
MOAAS Market Oriented Agricultural Advisory Services
NEPAD New Partnership for Africa’s Development
OECD Organization for Economic Cooperation and Development
RBA Regional Bureau for Africa
SADC Southern African Development Community
SDP Supplier Development Programme
SMART Specific Measurable Acceptable Realistic Time bound
SME Small and Medium Enterprises
SSA Sub-Saharan Africa
UN United Nations
UNDP United Nations Development Programme
UNIDO United Nations Industrial Development Organization
USD US dollar
WFP World Food Programme
vi
African Agribusiness Supplier Development Programme (AASDP) Toolkit
Definitions
African Agribusiness Supplier Development Programme (AASDP)
An AASDP intends to improve the competitiveness of farmers and SME suppliers of off-takers by providing sup-port (training, advice, access to inputs, organization etc.) and linking up with other service suppliers.
Agricultural business development services
Services that improve the performance of an agricultural enterprise, be it individual or cooperative, in its access to markets, financial services, production inputs and en-hanced agribusiness environments.
Farmer organizations Farmer organizations are membership-based organiza-tions or federations of organizations with elected leaders accountable to their constituents. They take on different forms, varying in both size and the services they provide, such as farmer groups, associations, cooperatives (primary, unions, etc.), societies, federations and chambers of agri-culture.
Inclusive Market Development Development of markets that extend choices and oppor-tunities to the poor (and other excluded groups) as pro-ducers, consumers and wage earners.
Inclusive value chains Value chains that are fit to smallholder realities, including those of women.
Off-taker A buyer (agri processing or food businesses, institutional buyers etc.) who, in the course of doing business with SMEs, provides information, technology or other support and as such takes the lead in value chain development.
Service providers Public, not for profit (NGOs) as well as for profit (commer-cial) organizations that provide Agricultural business devel-opment services (see above).
Small and Medium Enterprises (SMEs)
SMEs according to the IFC are registered business with less than 300 employees. This can be further narrowed down by distinguishing SMEs from microenterprises (<10 em-ployees). Other criteria are assets and turnover.
Smallholder farmers Smallholder farms have access to two hectares or less land. They represent 80 percent of all farms in Sub-Saharan Af-rica and contribute up to 90 percent of the production in some countries.
vii
Sub-sector A sector that produces a particular product or service and the related broader market system, for example the mango sub-sector (as part of the fruits sector).
Suppliers In this tool book we usually speak about suppliers when talking about agricultural product suppliers to off-takers. This is different from service suppliers to farmer producers (e.g. seed suppliers and fertilizer suppliers, but also govern-ment extension and NGO support).
Supply chain The physical flow of materials from its origin (for instance farm production) to final consumption. A supply chain includes purchasing, manufacturing, warehousing, trans-portation, customer service, demand planning, supply planning and supply chain management.
Supply chain development project An SDP consists of multiple supply chain Development Projects. A single supply chain project consists of interven-tions in a supply chain of an off-taker with the aim of im-proving supply and the competitiveness of the suppliers.
Sustainable local sourcing With sustainable local sourcing a processing company cre-ates a sustainable (profitable and socially and environmen-tally responsible) business for its own enterprise as well as local suppliers.
Value chain A value chain is a sequence of related value adding busi-ness activities for a specific product or service, from prima-ry production through processing, transformation,marketing, and up to the final sale of the particular prod-uct to consumers. In this toolkit supply chains and value chains can be used similarly.
Value chain development Development programmes that aim to improve activities and relations in a value chain by analysing value chains in a wider context and as such also considering the impact of the meso and macro environment on a value chain.
Table of Contents
Executive Summary 1
1. Introduction to the African ASDP 41.1 African Facility for Inclusive Markets (AFIM) 51.2 History of UNDP SDPs 61.3 Rationale for the African ASDP 71.4 Objectives of an ASDP 91.5 Beneficiaries of an ASDP 101.6 The AASDP toolkit 101.7 Final note 10
2. Smallholders and agricultural development in Sub-Saharan Africa 122.1 Introduction 132.2 Smallholder farmers in Sub-Saharan Africa 152.3 Smallholder agricultural production in Sub-Saharan Africa 182.4 Smallholder access to markets 202.5 Access to services 202.6 Infrastructure 212.7 Organization of smallholders 222.8 Small and Medium Enterprises 242.9 Agribusiness sector 25
3. ASDP Roadmap 283.1 ASDP Premise 293.2 Program implementation phases 303.3 Milestones 333.4 Timing 343.5 Key actors involved 353.6 Budget considerations 383.7 Funding 393.8 Success factors 403.9 SDP Approach in action - Example from El Salvador 41
Intervention Approach 41 Methodology 42
4. Phase 1: Feasibility 464.1 Government consultations 474.2 Identification and selection of commodity subsectors 494.3 Conducting a feasibility study for a country ASDP 52
5. Phase 2: Program preparations 565.1 Develop a programme document and strategy 575.2 Select an implementing partner 585.3 Develop programme systems 595.4 Commit partners 61
6. Phase 3: Supply chain diagnostics 686.1 Analyse constraints and opportunities 69 Value chain analysis 71 Livelihood analysis including environmental conditions 77 Gender analysis 806.2 Report constraints and opportunities 81
7. Phase 4: Supply chain development planning 827.1 Select strategies and business models 837.2 Develop project implementation plans 897.3 Set-up supply chain partnership agreements 89
8. Phase 5: Supply chain development implementation 908.1 Organizing support 92
Production inputs 93 Farm and SME supply management skills 94
Quality and control systems 96 Farmers organizations and SME clusters / networks 98 Access to finance 1028.2 Sharing information 1088.3 Facilitating supply chain linkages 109 The role of ICT in facilitating supply chain linkages 1098.4 Policy advise 112
9. Phase 6: Phasing out from supply chains and sustaining the ASDP 116
10. M&E, Impact Measurement & Learning 12010.1 M&E and impact measurement 12110.2 Learning 123
References 128Consultations: 132Annex 134
Executive Summary
1
Contributing over 60 percent towards regional employment and accounting for over 25 percent of the regions Gross Domestic Product (GDP), agriculture remains one of Sub-Saharan Africa’s (SSA) most important sectors. Africa remains a strategic continent for the world’s agro-food in-dustry as it holds 60 percent of the world’s uncul-tivated land. This makes agriculture a lead sector in Africa, with sufficient scale and comparative advantage, to engender broad based economic growth and poverty reduction towards achiev-ing the Millennium Development Goals (MDGs).
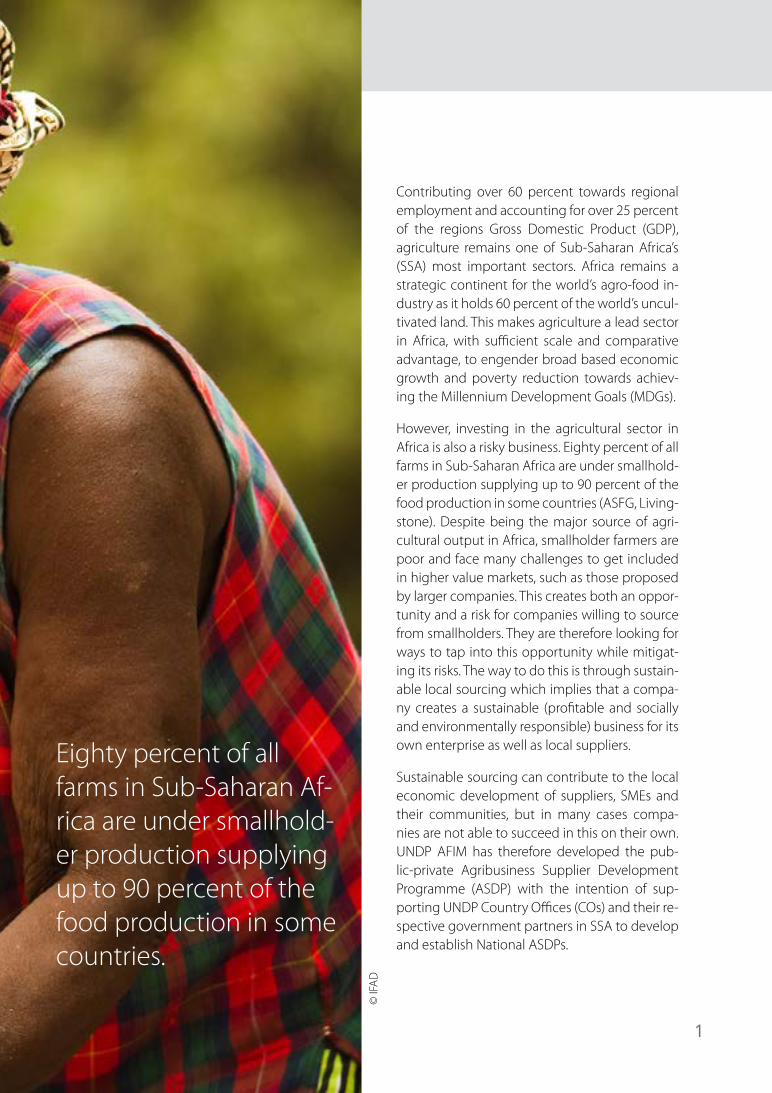
However, investing in the agricultural sector in Africa is also a risky business. Eighty percent of all farms in Sub-Saharan Africa are under smallhold-er production supplying up to 90 percent of the food production in some countries (ASFG, Living-stone). Despite being the major source of agri-cultural output in Africa, smallholder farmers are poor and face many challenges to get included in higher value markets, such as those proposed by larger companies. This creates both an oppor-tunity and a risk for companies willing to source from smallholders. They are therefore looking for ways to tap into this opportunity while mitigat-ing its risks. The way to do this is through sustain-able local sourcing which implies that a compa-ny creates a sustainable (profitable and socially and environmentally responsible) business for its own enterprise as well as local suppliers.
Sustainable sourcing can contribute to the local economic development of suppliers, SMEs and their communities, but in many cases compa-nies are not able to succeed in this on their own. UNDP AFIM has therefore developed the pub-lic-private Agribusiness Supplier Development Programme (ASDP) with the intention of sup-porting UNDP Country Offices (COs) and their re-spective government partners in SSA to develop and establish National ASDPs.
© IF
AD
Eighty percent of all farms in Sub-Saharan Af-rica are under smallhold-er production supplying up to 90 percent of the food production in some countries.
2
African Agribusiness Supplier Development Programme (AASDP) Toolkit
An ASDP intends to improve the productivity of smallholder farmers and SME agribusinesses by facilitating support (training, advice, access to inputs, organization, standardization etc.) and linking up with off-takers. Sustainability and in-clusion aspects, especially women and youth play an important role.
The objectives of an ASDP include:• To improve the supply of African agricultural
products by farmers and SMEs meeting mar-ket quality standards, with quicker delivery times, reduced transportation and reduced inventory costs, and as such to access the growing markets that are provided by off-tak-ers;
• To secure and offer off-takers an efficient and high quality local agricultural products sup-ply;
• To contribute to the development of nation-al African economies (through attracting Foreign Direct Investments (FDI), increased government income through taxation, job creation, an improved trade balance etc.) by developing agricultural products that can substitute imports and can access export markets;
• To contribute to sustainable development goals, especially food security, poverty reduc-tion and gender equity, through job creation and income generation.
At the heart of the programme are 4 key func-tions, namely Organizing support for suppliers, Sharing supply chain information through the supply chain, Facilitating linkages in a subsec-tor, and Policy advice. Cross sector learning is a cross-cutting function.
The target beneficiaries of the programme are in the first place small-scale farmers and SMEs, in-cluding farmer organizations. Secondly, off-tak-ers (agri-food processors but also for instance institutional buyers) and other stakeholders in agricultural supply chains, such as input suppli-ers and financial institutions benefit.
Key actors in developing an ASDP are a UNDP CO and its main governmental partner. They play a facilitating and enabling role in framing the ASDP and selecting the subsectors and cor-responding supply chains. In the selected sub-sectors and their supply chains the triangular relations and interactions between suppliers (farmers/SME suppliers), off-takers and service providers (including government agencies and NGO/International Organizations (IO) support) that are facilitated by an implementing partner are key. They are based on equality principles, yet the starting point for ASDP supply chain projects is based on the demand for agricultural inputs by off-takers.
An ASDP is in principle funded both by public partners (governments, donors, NGOs) and pri-vate partners (contributions by off-takers, SMEs, consultants etc.).
This toolkit sets out the programme’s conditions for starting up an ASDP in an African country and it suggests several tools for implementing the programme. It is firstly targeted towards UNDP COs willing to design an ASDP. The tool will form a framework to create commitment of National Governments (UNDP’s client) and to facilitate linkages between partners (off-tak-ers), beneficiaries (smallholders and SMEs) and service suppliers involved in agricultural supply chains. The complementary training manual will be used in capacity development training of all relevant stakeholders.
3
After a brief introduction Section, the toolkit con-tinues in Section 2 with providing an in-depth background on the African agricultural economy and the position of smallholders suppliers, SMEs and business in this. Section 3 lays out an over-view of the programme’s phases and activities, its governance model, the roles and responsibil-ities of the various actors within a supply chain, as well as budget and finance, and the setup of a Monitoring and Evaluation (M&E) system, plus an exit strategy. Sections 4 till 10, provide a range of applied tools and methodologies for implement-ing the six phases of an ASDP, M&E and impact measurement:
The six phases include:
• Phase 1: Feasibility. u The commitment and potential for setting
up a country ASDP are researched as well as potential subsectors for an ASDP are short-listed.
• Phase 2: Programme preparations. u The programme document and strategy
for a country ASDP is developed, the imple-menting partner is appointed, programme systems are developed and private and (semi) public partners are committed to the programme.
• Phase 3: Supply chain diagnostics. u Constraints and opportunities in the devel-
opment of local supply to off-takers in the selected subsectors are analysed in-depth.
• Phase 4: Supply chain development planning. u Strategies are developed for mitigating risks
and opening up markets in the selected subsectors. This is translated into practical supply chain implementation plans which are approved by all stakeholders before im-plementation starts.
• Phase 5: Supply chain development imple-mentation.
u All identified interventions are implement-ed.
• Phase 6: Phasing-out: u A phasing out strategy is designed and im-
plemented to ensure continuation of supply chain activities as well as the impact of the ASDP.
M&E, impact measurement and learning: During the full course of the implementation of the pro-gramme, M&E and impact measurement takes place to inform stakeholders on progress on the development and the implementation as well as achievements of the ASDP. A learning programme needs to be in place to generate knowledge and to share it in order to make more impact.
Final note, the ASDP toolkit is a generic toolkit for developing and implementing national AS-DPs. The toolkit provides guidelines to ASDPs but is not a blue print. Each and every ASDP needs to be tailor-made and adapted to its local needs and circumstances.
1. Introduction to the African ASDP
Introduction to the African ASDP
Introduction to the African ASDP
5
1.1 African Facility for Inclusive Markets (AFIM)
The UNDP recently launched a strategic, regional Pri-vate Sector and Inclusive Market Development for Poverty Reduction in Africa project, entitled: the “Af-rican Facility for Inclusive Markets” (UNDP AFIM). This project is led by the Regional Bureau for Africa (RBA) which is supported by the Bureau for External Relations and Advocacy (BERA), and coordinated from UNDP’s Regional Service Centre in Johannesburg and Addis Ababa. UNDP AFIM’s particular focus is on the promo-tion of Inclusive Market Development (IMD) in Africa through the development and expansion of regional value chains in job creating sectors such as agribusi-ness, tourism, renewable energy, retailing and mining.
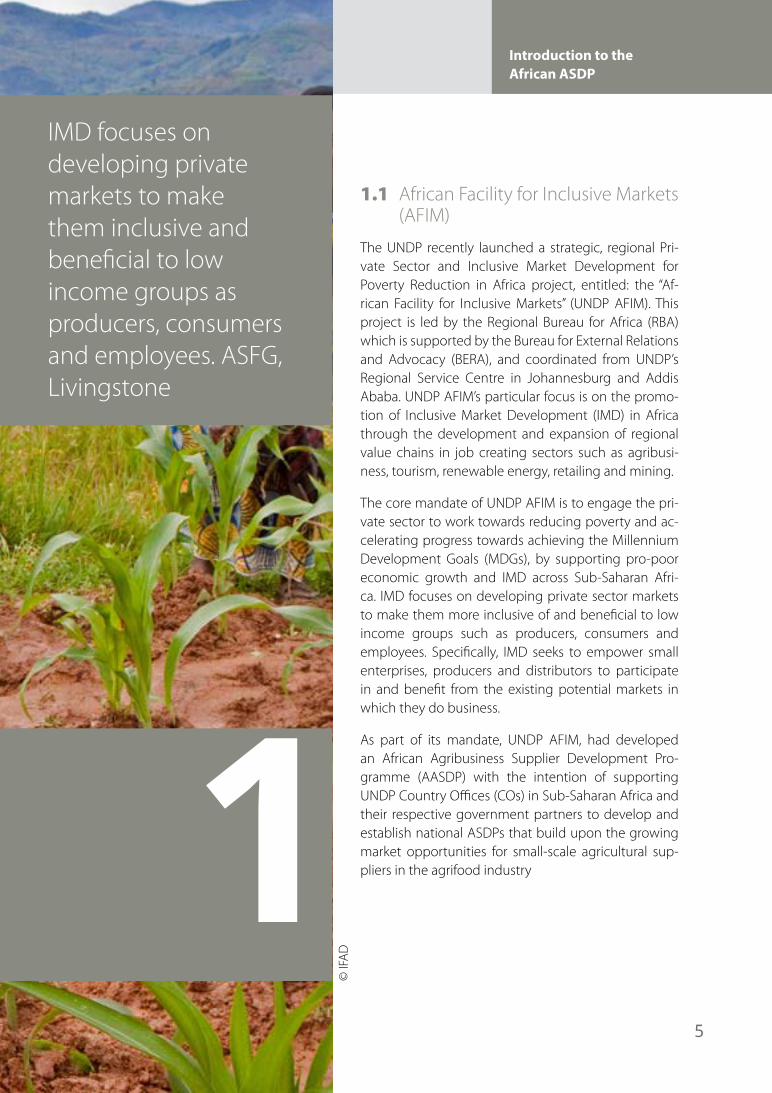
The core mandate of UNDP AFIM is to engage the pri-vate sector to work towards reducing poverty and ac-celerating progress towards achieving the Millennium Development Goals (MDGs), by supporting pro-poor economic growth and IMD across Sub-Saharan Afri-ca. IMD focuses on developing private sector markets to make them more inclusive of and beneficial to low income groups such as producers, consumers and employees. Specifically, IMD seeks to empower small enterprises, producers and distributors to participate in and benefit from the existing potential markets in which they do business.
As part of its mandate, UNDP AFIM, had developed an African Agribusiness Supplier Development Pro-gramme (AASDP) with the intention of supporting UNDP Country Offices (COs) in Sub-Saharan Africa and their respective government partners to develop and establish national ASDPs that build upon the growing market opportunities for small-scale agricultural sup-pliers in the agrifood industry
Introduction to the African ASDP 1
© IF
AD
IMD focuses on developing private markets to make them inclusive and beneficial to low income groups as producers, consumers and employees. ASFG, Livingstone
1
6
African Agribusiness Supplier Development Programme (AASDP) Toolkit
1.2 History of UNDP SDPs
An Agribusiness Supplier Development Pro-gramme (ASDP) in the UNDP context intends to improve the productivity of smallholder farmers and SME agribusinesses by facilitating support (training, advice, access to inputs, organization, standardization etc.) and linking up with off-tak-ers. Sustainability and inclusion aspects, espe-cially women and youth play an important role. UNDP worldwide has a history of over ten years in running SDPs (Supplier Development Pro-grammes).
Mexican SDP
In 2001 UNDP Mexico started the programme as the first UNDP country office. The main objec-tives were to:
• Integrate small and medium enterprises (SMEs) as suppliers into the global commer-cial and financial flows present in Mexico;
• Raise the competitive capacity of the largest companies through the consolidation of a high performance network of business allies;
• Improve the efficiency of the companies by the development of market focused channels and flows of information;
• Contribute to the strengthening of the inter-nal market.
At this stage SMEs were mostly existing first tier suppliers in industrial supply chains, such as in the automotive and energy industries.
The programme’s focus was on improving local knowledge on global market requirements and standards through a flow of activities namely:
• Promotion activities: in which the off-takers were selected;
• Diagnostics: Financial, technical and opera-tional analysis and an identification of con-straints and opportunities;
• Negotiation between the off-taker and sup-pliers in order to come to agreements;
• Action planning resulting in clear actions and roles and responsibilities;
• Implementation of the action plan;• Replication amongst other suppliers and sup-
ply chains.
In order to implement the activities in an effi-cient way the following systems were built:
1. Clear methodologies for analysis, interven-tion and monitoring results;
2. An information system in order to identify key players and collect and share informa-tion/data;
3. A governance model to facilitate and imple-ment the programme.
The Mexico SDP was successful. It resulted in higher productivity and more efficient use of assets by involved SMEs, which again improved the competitiveness of local SMEs. Indicators of the success were improved profitability of SMEs and off-takers, business taxation and local employment. The output and outcomes of the Mexican SDP clearly illustrate the potential eco-nomic and developmental benefits which can accrue to all parties involved in an SDP.
Introduction to the African ASDP
7
El Salvadorian SDP
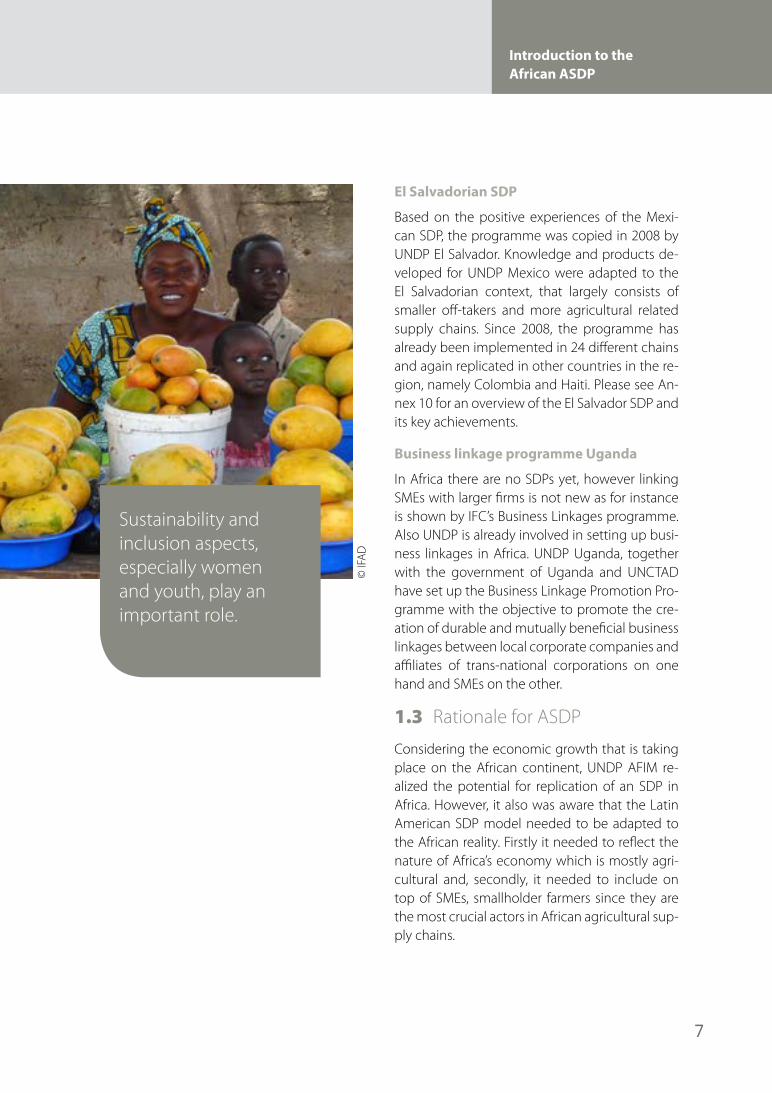
Based on the positive experiences of the Mexi-can SDP, the programme was copied in 2008 by UNDP El Salvador. Knowledge and products de-veloped for UNDP Mexico were adapted to the El Salvadorian context, that largely consists of smaller off-takers and more agricultural related supply chains. Since 2008, the programme has already been implemented in 24 different chains and again replicated in other countries in the re-gion, namely Colombia and Haiti. Please see An-nex 10 for an overview of the El Salvador SDP and its key achievements.
Business linkage programme Uganda
In Africa there are no SDPs yet, however linking SMEs with larger firms is not new as for instance is shown by IFC’s Business Linkages programme. Also UNDP is already involved in setting up busi-ness linkages in Africa. UNDP Uganda, together with the government of Uganda and UNCTAD have set up the Business Linkage Promotion Pro-gramme with the objective to promote the cre-ation of durable and mutually beneficial business linkages between local corporate companies and affiliates of trans-national corporations on one hand and SMEs on the other.
1.3 Rationale for ASDP
Considering the economic growth that is taking place on the African continent, UNDP AFIM re-alized the potential for replication of an SDP in Africa. However, it also was aware that the Latin American SDP model needed to be adapted to the African reality. Firstly it needed to reflect the nature of Africa’s economy which is mostly agri-cultural and, secondly, it needed to include on top of SMEs, smallholder farmers since they are the most crucial actors in African agricultural sup-ply chains.
Sustainability and inclusion aspects, especially women and youth, play an important role.
© IF
AD
1
8
African Agribusiness Supplier Development Programme (AASDP) Toolkit
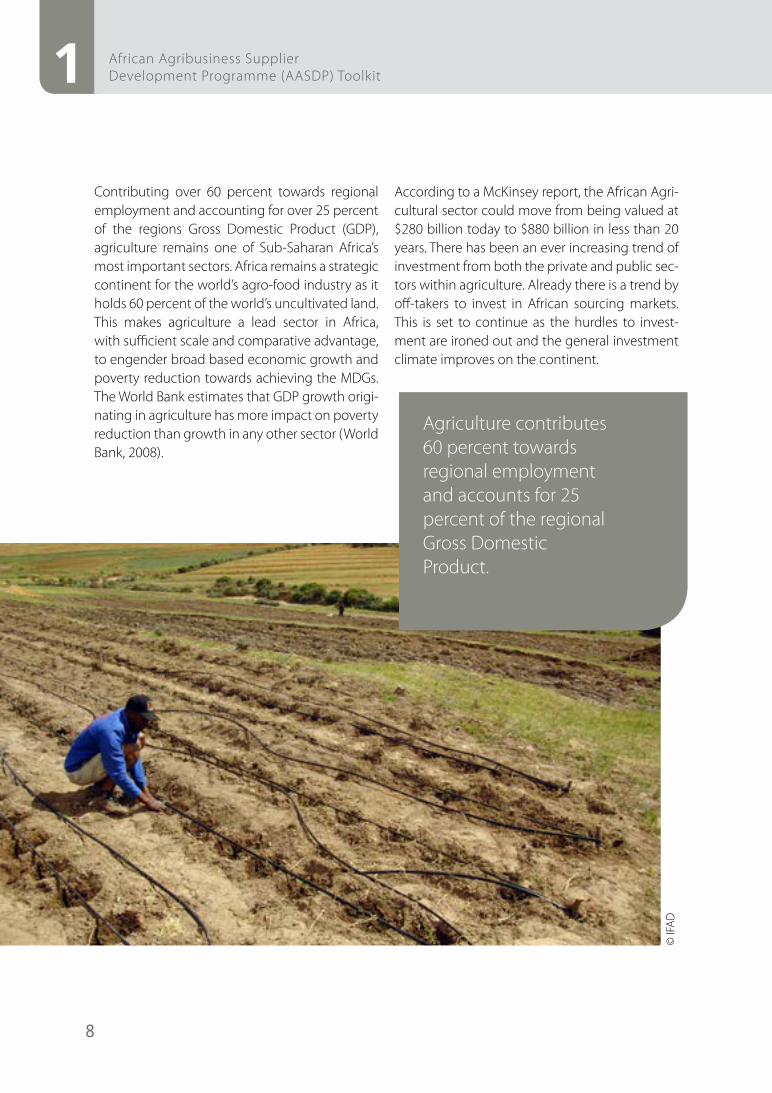
Contributing over 60 percent towards regional employment and accounting for over 25 percent of the regions Gross Domestic Product (GDP), agriculture remains one of Sub-Saharan Africa’s most important sectors. Africa remains a strategic continent for the world’s agro-food industry as it holds 60 percent of the world’s uncultivated land. This makes agriculture a lead sector in Africa, with sufficient scale and comparative advantage, to engender broad based economic growth and poverty reduction towards achieving the MDGs. The World Bank estimates that GDP growth origi-nating in agriculture has more impact on poverty reduction than growth in any other sector (World Bank, 2008).
According to a McKinsey report, the African Agri-cultural sector could move from being valued at $280 billion today to $880 billion in less than 20 years. There has been an ever increasing trend of investment from both the private and public sec-tors within agriculture. Already there is a trend by off-takers to invest in African sourcing markets. This is set to continue as the hurdles to invest-ment are ironed out and the general investment climate improves on the continent.
Agriculture contributes 60 percent towards regional employment and accounts for 25 percent of the regional Gross Domestic Product.
© IF
AD
Introduction to the African ASDP
9
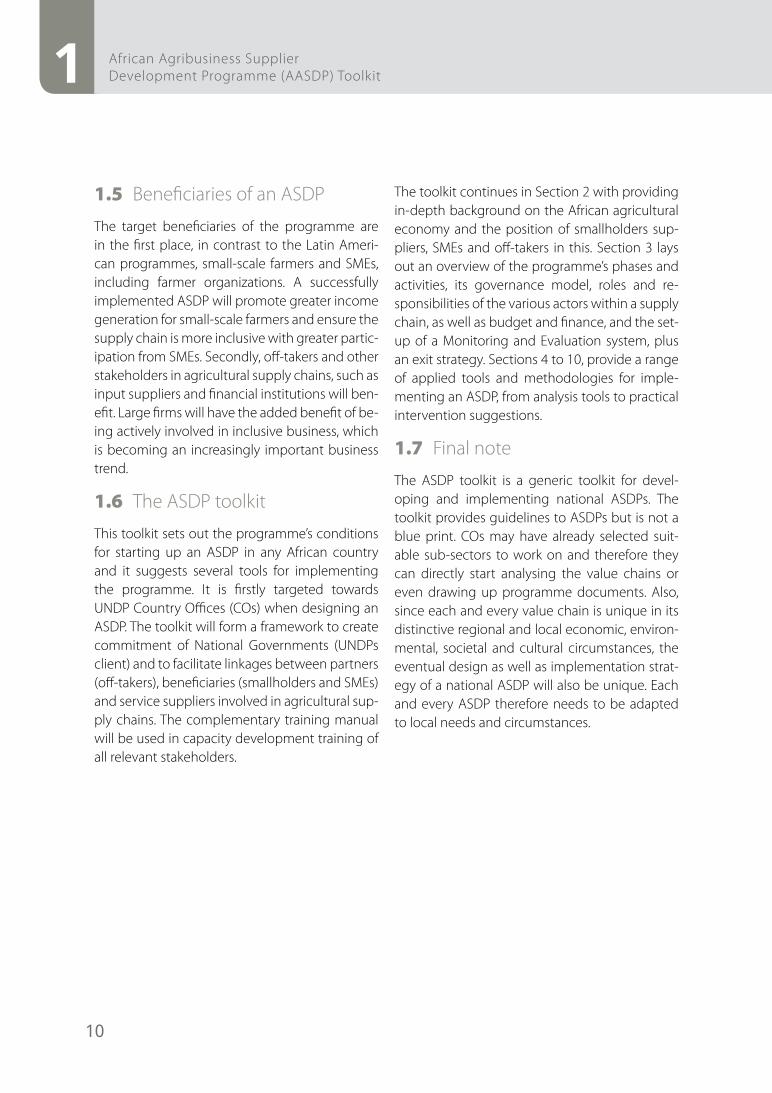
Despite the positive trends, the commercial agri-cultural sector in Africa is however still in its infan-cy. 80 percent of all farms in Sub-Saharan Africa are under smallholder production supplying up to 90 percent of the food production in some countries (ASFG, Livingstone). Despite being the major source of agricultural output in Africa, smallholder farmers are poor and face many chal-lenges that include lack of good inputs supply, knowledge on agricultural practices, processing technology, commercial farming skills, collabora-tion with and presence of SMEs and markets, and public support, including decent infrastructure.
In order to develop the African agricultural econ-omy and to produce food in a more efficient way as well as creating an opportunity to positively impact the livelihoods of smallholder farmers (and thus contributing to achieving the MDGs), the productivity of the sector needs to be signifi-cantly improved. The active participation of both the public and private sector through a collabo-rative market driven process should pave the way for realizing this. An African SDP that enhances public- private (off-taker) collaboration in increas-ing productivity in agribusiness supply chains comes therefore right in time. It will lead to raised farmers’ incomes, lower food prices, increased food availability and food security, increased employment opportunities for unskilled labour, increased entrepreneurial activities, growth in the rural services sector and an emergence of agro-processing industries. Aspects that perfect-ly fit the core mandate of UNDP AFIM, which is to support pro-poor economic growth and IMD across Sub-Saharan Africa. And as such the Af-rican agribusiness supplier development pro-gramme (AASDP) was born.
1.4 Objectives of an ASDP
The objectives of an ASDP to be implemented by UNDP Country Offices (CO) and their partner governments include:
• To improve the supply of African agricultural products by farmers and SMEs meeting mar-ket quality standards, with timely deliveries, re-duced transportation and inventory costs, and as such to access the growing markets that are provided by off-takers;
• To secure and offer off-takers efficient and high quality local agricultural products supply;
• To contribute to the development of national African economies (through attracting Foreign Direct Investments (FDI), increased govern-ment income through taxation, job creation, an improved trade balance etc.) by developing agricultural products that can substitute im-ports and can access export markets;
• To contribute to sustainable development goals, especially food security and poverty reduction, through job creation and income generation.
All the above need to happen in a sustainable and inclusive manner, meaning that the ASDPs should not compete with local food security, should not negatively impact the natural envi-ronment nor climate change, and should at all times refrain from discrimination of vulnerable groups, including women, ethnic minorities and youth.
1
10
African Agribusiness Supplier Development Programme (AASDP) Toolkit
1.5 Beneficiaries of an ASDP
The target beneficiaries of the programme are in the first place, in contrast to the Latin Ameri-can programmes, small-scale farmers and SMEs, including farmer organizations. A successfully implemented ASDP will promote greater income generation for small-scale farmers and ensure the supply chain is more inclusive with greater partic-ipation from SMEs. Secondly, off-takers and other stakeholders in agricultural supply chains, such as input suppliers and financial institutions will ben-efit. Large firms will have the added benefit of be-ing actively involved in inclusive business, which is becoming an increasingly important business trend.
1.6 The ASDP toolkit
This toolkit sets out the programme’s conditions for starting up an ASDP in any African country and it suggests several tools for implementing the programme. It is firstly targeted towards UNDP Country Offices (COs) when designing an ASDP. The toolkit will form a framework to create commitment of National Governments (UNDPs client) and to facilitate linkages between partners (off-takers), beneficiaries (smallholders and SMEs) and service suppliers involved in agricultural sup-ply chains. The complementary training manual will be used in capacity development training of all relevant stakeholders.
The toolkit continues in Section 2 with providing in-depth background on the African agricultural economy and the position of smallholders sup-pliers, SMEs and off-takers in this. Section 3 lays out an overview of the programme’s phases and activities, its governance model, roles and re-sponsibilities of the various actors within a supply chain, as well as budget and finance, and the set-up of a Monitoring and Evaluation system, plus an exit strategy. Sections 4 to 10, provide a range of applied tools and methodologies for imple-menting an ASDP, from analysis tools to practical intervention suggestions.
1.7 Final note
The ASDP toolkit is a generic toolkit for devel-oping and implementing national ASDPs. The toolkit provides guidelines to ASDPs but is not a blue print. COs may have already selected suit-able sub-sectors to work on and therefore they can directly start analysing the value chains or even drawing up programme documents. Also, since each and every value chain is unique in its distinctive regional and local economic, environ-mental, societal and cultural circumstances, the eventual design as well as implementation strat-egy of a national ASDP will also be unique. Each and every ASDP therefore needs to be adapted to local needs and circumstances.
Introduction to the African ASDP
11
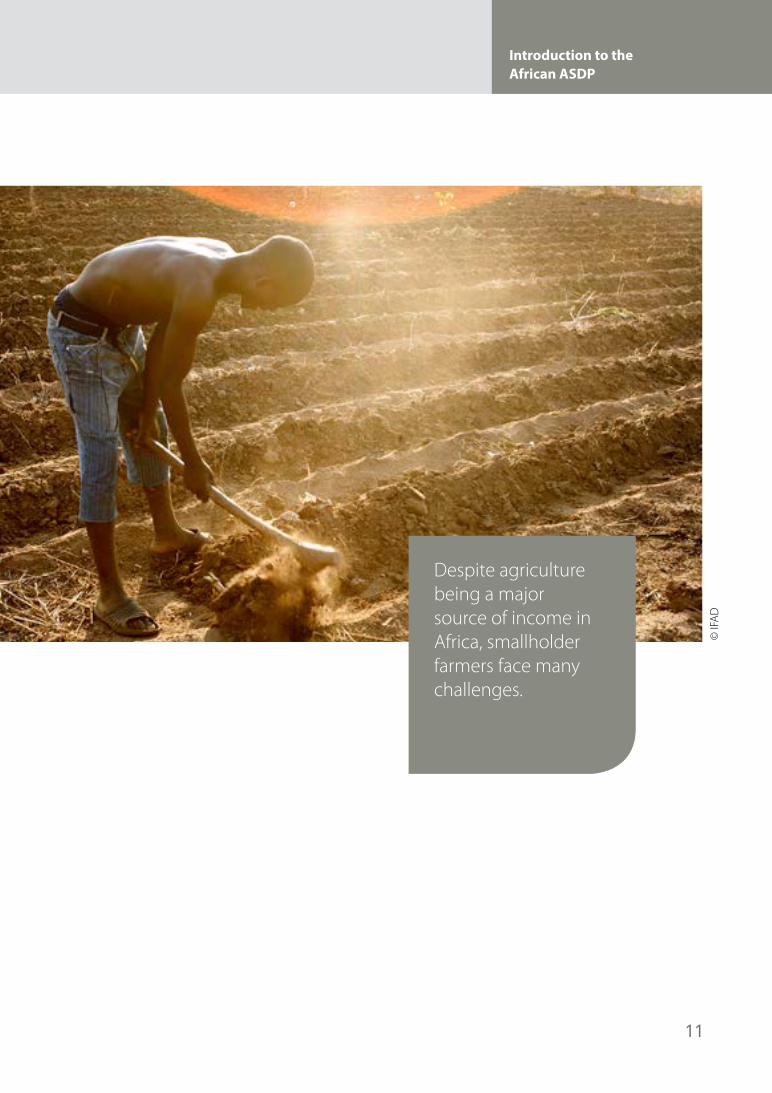
Despite agriculture being a major source of income in Africa, smallholder farmers face many challenges.
© IF
AD
12
2 African Agribusiness Supplier Development Programme (AASDP) Toolkit
2. Smallholders and agricultural development in Sub-Saharan Africa
Smallholders and Agricultural Development in Sub-Saharan Africa
13
Smallholders and agricultural development in Sub-Saharan Africa
2.1 Introduction
The proportion of poor people in the population has decreased slowly since the late 1990s, and is currently about 53 percent (Livingstone et al, 2011). Despite this positive trend, Sub-Saharan Africa’s population is poor-er than other regions of the world. While other regions have managed to reduce the absolute number of poor despite population growth, in Sub-Saharan Africa the number of poor has steadily grown.
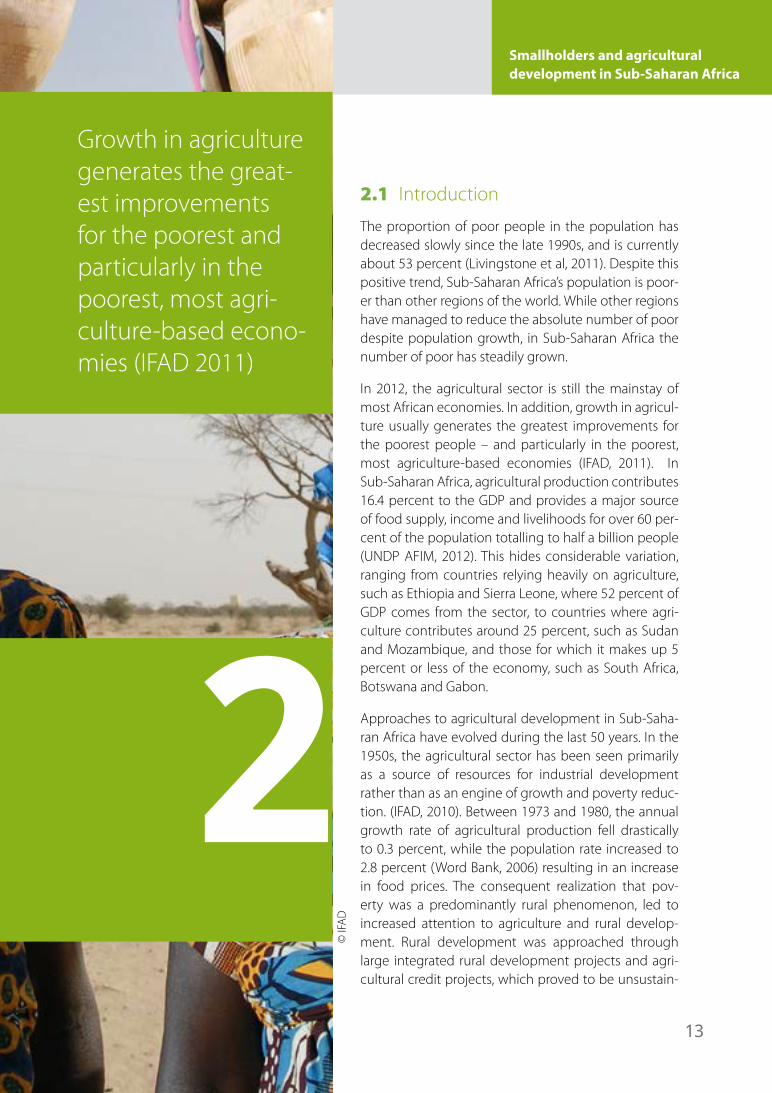
In 2012, the agricultural sector is still the mainstay of most African economies. In addition, growth in agricul-ture usually generates the greatest improvements for the poorest people – and particularly in the poorest, most agriculture-based economies (IFAD, 2011). In Sub-Saharan Africa, agricultural production contributes 16.4 percent to the GDP and provides a major source of food supply, income and livelihoods for over 60 per-cent of the population totalling to half a billion people (UNDP AFIM, 2012). This hides considerable variation, ranging from countries relying heavily on agriculture, such as Ethiopia and Sierra Leone, where 52 percent of GDP comes from the sector, to countries where agri-culture contributes around 25 percent, such as Sudan and Mozambique, and those for which it makes up 5 percent or less of the economy, such as South Africa, Botswana and Gabon.
Approaches to agricultural development in Sub-Saha-ran Africa have evolved during the last 50 years. In the 1950s, the agricultural sector has been seen primarily as a source of resources for industrial development rather than as an engine of growth and poverty reduc-tion. (IFAD, 2010). Between 1973 and 1980, the annual growth rate of agricultural production fell drastically to 0.3 percent, while the population rate increased to 2.8 percent (Word Bank, 2006) resulting in an increase in food prices. The consequent realization that pov-erty was a predominantly rural phenomenon, led to increased attention to agriculture and rural develop-ment. Rural development was approached through large integrated rural development projects and agri-cultural credit projects, which proved to be unsustain-
Smallholders and Agricultural Development in Sub-Saharan Africa
2
© IF
AD
Growth in agriculture generates the great-est improvements for the poorest and particularly in the poorest, most agri-culture-based econo-mies (IFAD 2011)
14
2 African Agribusiness Supplier Development Programme (AASDP) Toolkit
able and which rarely reached smallholder farm-ers. Large-scale projects paid little attention to user-driven institutions or to environmental and social sustainability (IFAD, 2010). The aim of agri-cultural development policies and programmes was simply to increase production without tak-ing into account market demand.
In the early 1980s, most countries in Sub-Saharan Africa adopted the structural adjustment pro-grammes and other macro-economic reforms, which focused on introducing price and trade reforms and reducing the role of the State in di-rect production and distribution activities. Privat-ization of parastatal enterprises served both of these objectives. Fiscal stringency reduced the availability of funding for smallholder services, including agricultural extension. It was assumed that the private sector would quickly step into the emerging gaps within the agricultural sector, but this never materialised (World Bank, 2006; IFAD, 2010).
In the early 2000s, the emerging development paradigm revolved around market driven, pri-vate-sector-led economic development, with agriculture as the largest private sector activity. The regulating role of government was to set ap-propriate rules, provide public goods and make sure the playing field was level, fair and open. (IFAD, 2010). The World Bank (2006) identified the following six changes in the context for agricul-tural development, determining the directions of agricultural research and development in the first decades of the 21st century1:
1. Markets increasingly drive agricultural devel-opment.
2. The production, trade, and consumption envi-ronment for agriculture and agricultural prod-ucts is growing more dynamic and evolving in unpredictable ways.
3. Knowledge, information, and technology increasingly are generated, diffused, and ap-plied through the private sector.
4. Exponential growth in information and com-munications technology has transformed the ability to take advantage of knowledge devel-oped in other places or for other purposes.
5. Agricultural development increasingly takes place in a globalized setting.
Private investment in agriculture, and particular-ly agro-industry, has been slowly increasing in sub-Saharan Africa. As a whole, it is small com-pared to other regions, but when viewed in rela-tion to GDP, it is on par with others. Recognizing the role of agriculture in combating poverty and food insecurity, in 2003 African governments had agreed to increase public investment in agricul-ture by a minimum of 10 percent of their national budgets and to raise agricultural productivity by
1 Enhancing Agricultural Innovation: How to Go Beyond the Strengthening of Research Systems (2006) The International Bank for Reconstruction and Development / The World Bank, Washington
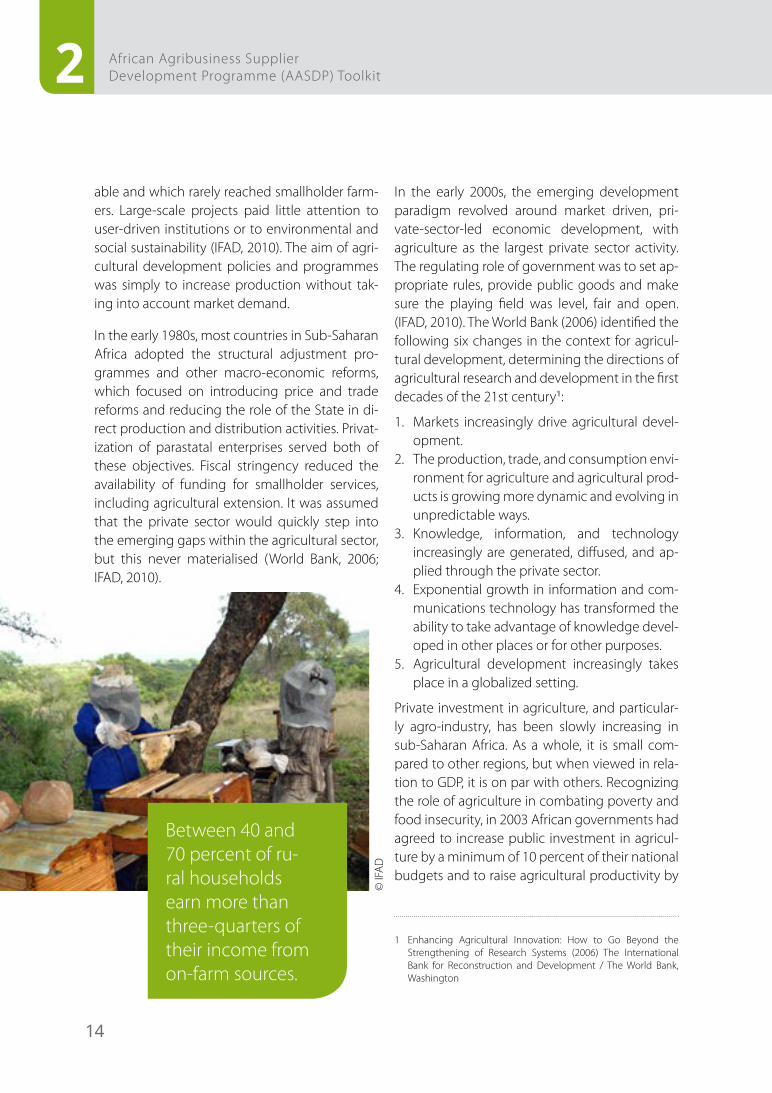
Between 40 and 70 percent of ru-ral households earn more than three-quarters of their income from on-farm sources.
© IF
AD
15
Smallholders and agricultural development in Sub-Saharan Africa
at least 6 percent2. However, only a few countries have actually realized this. Sub-Saharan African countries, on average, currently devote 5-7 per-cent of their public expenditures to agriculture, as compared to 8-10 percent in Asia (Livingston et al, 2011). The African Union (AU) New partner-ship for Africa’s Development (NEPAD) initiated the Comprehensive Africa Agricultural Develop-ment Programme (CAADP) in 2003.
The main objective of CAADP is to help Afri-can countries reach a path of higher economic growth through agriculture-led development, which eliminates hunger, reduces poverty and food insecurity, and enables expansion of ex-ports (UNDP AFIM, 2012).
This is to be done through’s the strategic func-tions of CAADP, regional and economic commu-nities, national roundtables and four key pillars:
Pillar 1 - Extending the area under sustainable land management Pillar 2 - Improving rural infrastructure and trade-related capacities for market access Pillar 3 - Increasing food supply and reducing hunger Pillar 4 - Agricultural research, technology dissemination and adoption
Especially Pillar 2 provides a suitable framework for the SDP. Pillar 2 aims to increase market access through improved rural infrastructure and other trade-related interventions. The objectives of Pil-lar 2 are to:
• Accelerate growth in the agricultural sector by raising the capacities of private entrepreneurs (including commercial and smallholder farm-ers) to meet the increasingly complex quality and logistic requirements of markets, focus-ing on selected agricultural commodities that
2 www.nepad-caadp.net
offer the potential to raise rural (on- and off-farm) incomes.
• Create the required regulatory and policy framework that would facilitate the emer-gence of regional economic spaces that would spur the expansion of regional trade and cross-country investments.
At the regional level, various frameworks are put in place to enhance agricultural and agribusi-ness development and stimulate farmers’ access to markets. These regional policy frameworks amongst others are:
1. ECOWAS Investment Plan (West Africa)2. SADC Investment Plan (Southern Africa)3. COMESA Strategy in Agro-foods (Eastern and
Southern Africa)
Countries are continuously adapting the CAADP Agenda into their agriculture and rural develop-ment strategies and programmes.
2.2 Smallholder farmers in Sub-Saharan Africa
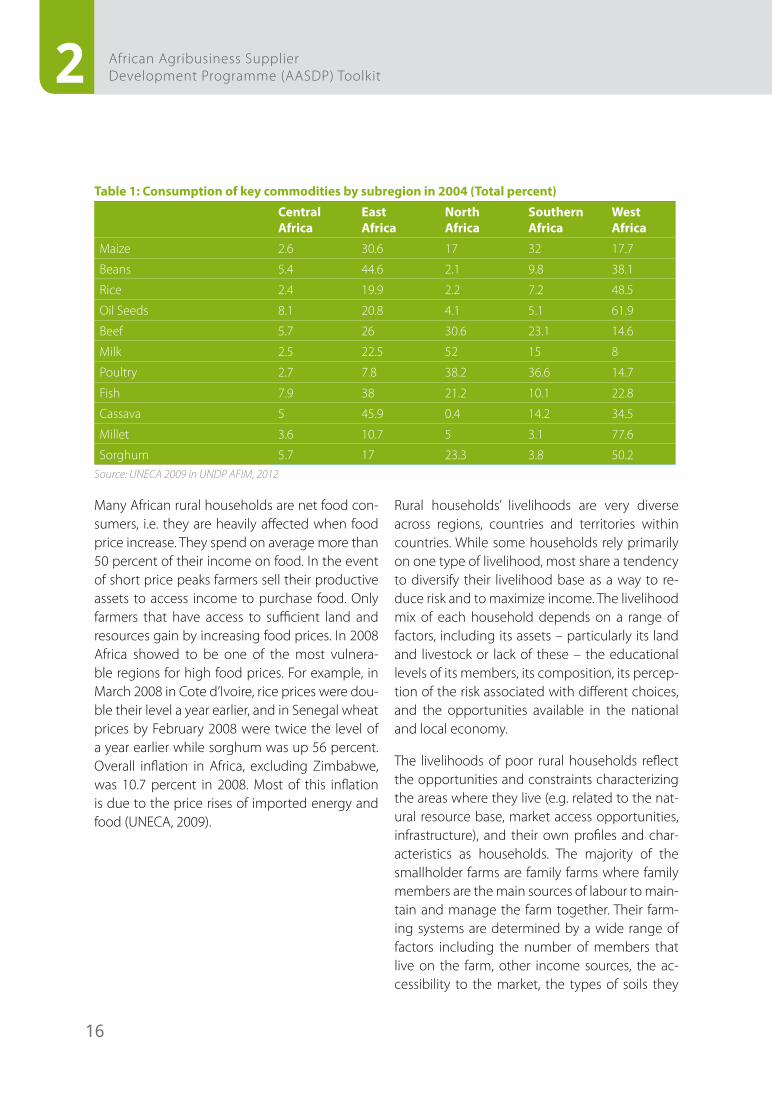
Smallholder farms are generally defined as being of up to two hectares or less. They represent 80 percent of all farms in Sub-Saharan Africa, and contribute up to 90 percent of the production in some countries (Livingston et al, 2011). The majority of the smallholder farmers produce for subsistence. To a limited extent they are linked to markets with one or two cash crops or by selling a surplus of food crops (see Table 1 for the con-sumption of key commodities). On-farm produc-tion is an important source of income in sub-Sa-haran African households. At the national level, between 40 and 70 percent of rural households earn more than three-quarters of their income from on-farm sources. In addition, smallholders derive income from agricultural wage labour, be it wage or self-employment in the rural non-farm economy. Diversification of their livelihood base is a way to reduce risk (IFAD, 2011).
16
2 African Agribusiness Supplier Development Programme (AASDP) Toolkit
Table 1: Consumption of key commodities by subregion in 2004 (Total percent)
CentralAfrica
EastAfrica
NorthAfrica
SouthernAfrica
WestAfrica
Maize 2.6 30.6 17 32 17.7
Beans 5.4 44.6 2.1 9.8 38.1
Rice 2.4 19.9 2.2 7.2 48.5
Oil Seeds 8.1 20.8 4.1 5.1 61.9
Beef 5.7 26 30.6 23.1 14.6
Milk 2.5 22.5 52 15 8
Poultry 2.7 7.8 38.2 36.6 14.7
Fish 7.9 38 21.2 10.1 22.8
Cassava 5 45.9 0.4 14.2 34.5
Millet 3.6 10.7 5 3.1 77.6
Sorghum 5.7 17 23.3 3.8 50.2Source: UNECA 2009 in UNDP AFIM, 2012
Many African rural households are net food con-sumers, i.e. they are heavily affected when food price increase. They spend on average more than 50 percent of their income on food. In the event of short price peaks farmers sell their productive assets to access income to purchase food. Only farmers that have access to sufficient land and resources gain by increasing food prices. In 2008 Africa showed to be one of the most vulnera-ble regions for high food prices. For example, in March 2008 in Cote d’Ivoire, rice prices were dou-ble their level a year earlier, and in Senegal wheat prices by February 2008 were twice the level of a year earlier while sorghum was up 56 percent. Overall inflation in Africa, excluding Zimbabwe, was 10.7 percent in 2008. Most of this inflation is due to the price rises of imported energy and food (UNECA, 2009).
Rural households’ livelihoods are very diverse across regions, countries and territories within countries. While some households rely primarily on one type of livelihood, most share a tendency to diversify their livelihood base as a way to re-duce risk and to maximize income. The livelihood mix of each household depends on a range of factors, including its assets – particularly its land and livestock or lack of these – the educational levels of its members, its composition, its percep-tion of the risk associated with different choices, and the opportunities available in the national and local economy.
The livelihoods of poor rural households reflect the opportunities and constraints characterizing the areas where they live (e.g. related to the nat-ural resource base, market access opportunities, infrastructure), and their own profiles and char-acteristics as households. The majority of the smallholder farms are family farms where family members are the main sources of labour to main-tain and manage the farm together. Their farm-ing systems are determined by a wide range of factors including the number of members that live on the farm, other income sources, the ac-cessibility to the market, the types of soils they
17
Smallholders and agricultural development in Sub-Saharan Africa
have, the machinery available and the number of seasons they can harvest, etc. They may use high-ly diversified cropping or mixed farming systems and use non-farm activities to complement and supplement their livelihoods.
Sub-Saharan Africa is home to a large diversity of agroecological climates, ranging from the arid dry land of northern Mali, to the humid tropics of the Congo. Sub-Saharan Africa has a wide di-versity of soil types, differing dramatically in their ability to retain and supply nutrients to plants, to hold or drain water, to withstand erosion or com-paction and to allow for root penetration. About 55 percent of the continent is considered unsuit-able for cultivated agriculture. Of the remaining land, 16 percent is considered high quality, 13 percent medium, and 16 percent of low poten-tial. Many of these already low-fertility soils have suffered further losses in nutrients, biodiversity and structure over the years due to poor and un-sustainable soil management practices. This im-pacts greatly on the productive capacity of the soils and therefore farmers’ income.
African farmers work in an environmentally vul-nerable context. Degradation currently affects 65 percent of cropland and 30 percent of pasture-land. With 500 million hectares of moderately or severely degraded land, Africa accounts for 27 percent of the world’s land degradation (UNECA, 2009). Characteristic for many rural areas in Africa is the lack of formal land-titles. Conflict between traditional rulers for land-ownership and mod-ern legislation has made land inaccessible and unavailable. It is assumed that insecurity in land ownership stimulates accelerated land deteriora-tion and limits long-term investments in sustain-able land management (UNECA, 2009).
Illiteracy poses a challenge for African farmers ac-cessing markets and operating as entrepreneurs. In countries like Mali and Niger 70 percent of the total population is illiterate (CIA, 2012) with even higher percentages in rural areas. However, na-tional education programmes do start to show their impact. The literacy rate for young women in SSA increased from 58.6 percent for the period 1985-1994 to 67.3 percent in 2007 (UNECA, 2009).
Women play a critical role in the agricultural sec-tor. They are often heavily involved in growing food and cash crops and caring for livestock. They contribute to family businesses, and they are at the frontline when it comes to feeding their fam-ilies. Conditions in agriculture are especially hard for women. Although women represent at least half of the workforce in agriculture, they lag be-hind men in many ways. Often the work women do in agriculture is not visible, or it is simply not valued. They are often excluded from the more profitable aspects of agricultural enterprises. Land usually belongs to their husbands, brothers or fathers. Women are often ineligible to join co-operatives or receive credit, and are not target-ed in technical training. Along with the burden of unpaid work at home, high levels of illiteracy and lack of bargaining power create significant economic disadvantages for women. As a result they do not reach their potential as workers, en-trepreneurs or consumers. Women often lack access to labour and trade markets. This “gender gap” hinders their productivity and reduces their contributions to the agriculture sector and to the achievement of broader economic and social de-velopment goals. For a rural business, overlook-ing or excluding women means reduced profits. (FAO 2011b, KIT 2012).
18
2 African Agribusiness Supplier Development Programme (AASDP) Toolkit
Youth play an important role in agriculture en-suring food security for future generations, but they face many challenges. Over 60 percent of the world’s rural population is made of youth, with half of them being young women and girls (IFAD, 2010). Due to their limited access to assets (in particular land), markets, finance, education and skills training, rural youth are often unem-ployed or work informally – often in unpaid, very low-skilled, insecure and sometimes hazardous jobs. If young people living in rural areas do not find enough incentives, profitable economic op-portunities and attractive environments in which to live and work, they will continue to migrate to cities. This trend would not only contribute to the urbanization and growing urban unemploy-ment that is already under way, but is expected to affect global food production (IFAD, 2010). It is therefore important to involve young smallhold-er producers in SDPs and creating job opportu-nities.
2.3 Smallholder agricultural production in Sub-Saharan Africa
Between 1961 and 2007, crop production in sub-Saharan Africa grew at over 2.5 percent an-nually. Increased yields accounted for less than 40 percent of this increase; the remainder (more than 60 percent of the increase) was as a result of expansion of land under cultivation and shorter fallow periods (IFAD, 2011). Crop yields in Africa are in general far below average yields in other parts of the world. Land productivity in Africa is estimated at 42 percent and 50 percent to that of Asia and Latin America.
Besides low land productivity, labour productiv-ity is also low and compares to only 57 and 58 percent of those of Latin America and Asia, re-spectively. This among others is caused by the fact that agriculture is manual or semi-mecha-nized (UNECA, 2009).
While Africa’s relatively abundant uncultivated arable land suggests significant scope for expan-sion, it is limited by high land cost and high cost of inputs (Livingston, 2011). Production growth will require increased investments in intensification to enable smallholders increase production with less additional land and without major increases in labour inputs. They will need to increase their own productivity through greater capital and technology investments (Livingston et al, 2011) as well as access to finance and advisory services.
Smallholder supply response will depend on in-creased on-farm investments, such as appropri-ate seeds and fertilizers, irrigation and mechaniza-tion technologies, and reductions in postharvest losses (PHL). On average, farmers in Sub-Saharan Africa apply less than 10 kg of nutrients/ha, com-pared to around 140 kg/ha in both Latin Amer-ica and South Asia (IFAD, 2011, Livingston et al, 2011). Use of high quality seed is also much lower than it could be. From 1997 to 2007 in West Afri-ca, there was only enough improved maize seed to meet one-third of farmers’ demand.
Productivity improvements will furthermore re-quire more efficient use of water resources. Less than 3 percent of land is irrigated in Sub-Saharan Africa (IFAD 2010). While there is considerable po-tential to expand irrigation in SSA, opportunities vary greatly across the region, due to differences in rainfall, renewable water resources and land.
19
Smallholders and agricultural development in Sub-Saharan Africa
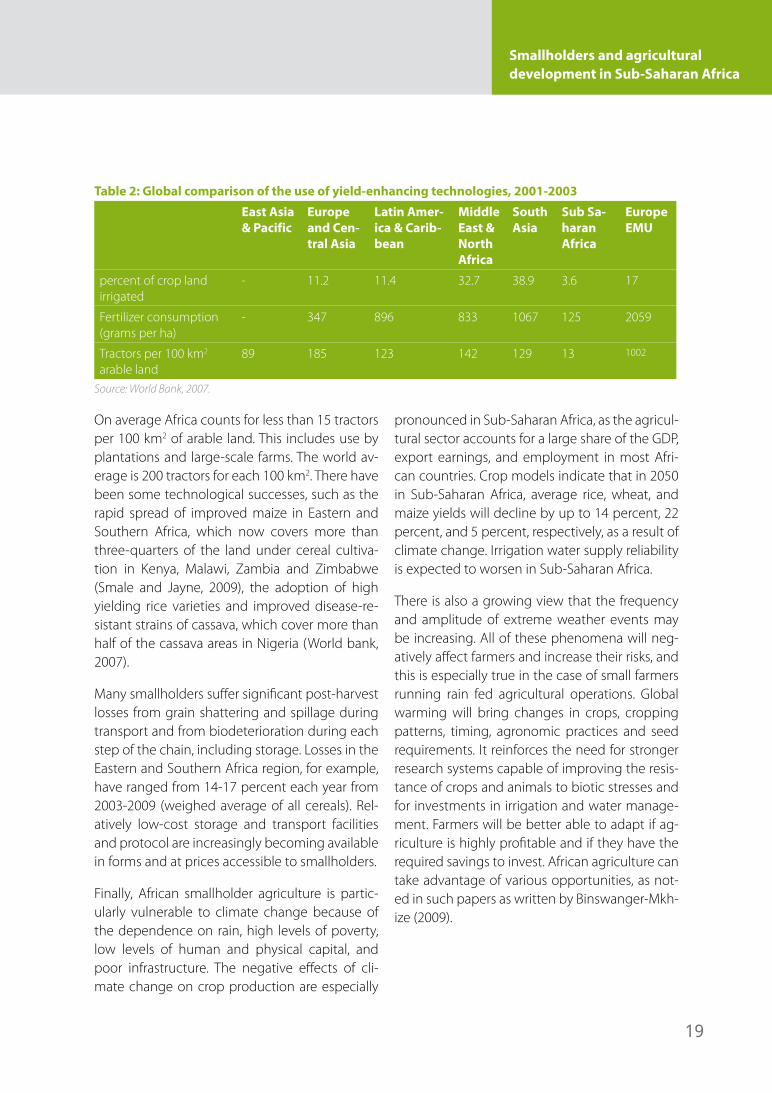
Table 2: Global comparison of the use of yield-enhancing technologies, 2001-2003
East Asia & Pacific
Europe and Cen-tral Asia
Latin Amer-ica & Carib-bean
Middle East & North Africa
South Asia
Sub Sa-haran Africa
Europe EMU
percent of crop land irrigated
- 11.2 11.4 32.7 38.9 3.6 17
Fertilizer consumption (grams per ha)
- 347 896 833 1067 125 2059
Tractors per 100 km2 arable land
89 185 123 142 129 13 1002
Source: World Bank, 2007.
On average Africa counts for less than 15 tractors per 100 km2 of arable land. This includes use by plantations and large-scale farms. The world av-erage is 200 tractors for each 100 km2. There have been some technological successes, such as the rapid spread of improved maize in Eastern and Southern Africa, which now covers more than three-quarters of the land under cereal cultiva-tion in Kenya, Malawi, Zambia and Zimbabwe (Smale and Jayne, 2009), the adoption of high yielding rice varieties and improved disease-re-sistant strains of cassava, which cover more than half of the cassava areas in Nigeria (World bank, 2007).
Many smallholders suffer significant post-harvest losses from grain shattering and spillage during transport and from biodeterioration during each step of the chain, including storage. Losses in the Eastern and Southern Africa region, for example, have ranged from 14-17 percent each year from 2003-2009 (weighed average of all cereals). Rel-atively low-cost storage and transport facilities and protocol are increasingly becoming available in forms and at prices accessible to smallholders.
Finally, African smallholder agriculture is partic-ularly vulnerable to climate change because of the dependence on rain, high levels of poverty, low levels of human and physical capital, and poor infrastructure. The negative effects of cli-mate change on crop production are especially
pronounced in Sub-Saharan Africa, as the agricul-tural sector accounts for a large share of the GDP, export earnings, and employment in most Afri-can countries. Crop models indicate that in 2050 in Sub-Saharan Africa, average rice, wheat, and maize yields will decline by up to 14 percent, 22 percent, and 5 percent, respectively, as a result of climate change. Irrigation water supply reliability is expected to worsen in Sub-Saharan Africa.
There is also a growing view that the frequency and amplitude of extreme weather events may be increasing. All of these phenomena will neg-atively affect farmers and increase their risks, and this is especially true in the case of small farmers running rain fed agricultural operations. Global warming will bring changes in crops, cropping patterns, timing, agronomic practices and seed requirements. It reinforces the need for stronger research systems capable of improving the resis-tance of crops and animals to biotic stresses and for investments in irrigation and water manage-ment. Farmers will be better able to adapt if ag-riculture is highly profitable and if they have the required savings to invest. African agriculture can take advantage of various opportunities, as not-ed in such papers as written by Binswanger-Mkh-ize (2009).
20
2 African Agribusiness Supplier Development Programme (AASDP) Toolkit
2.4 Smallholder access to markets
Well-functioning agricultural markets are essen-tial for rural growth and poverty reduction. How-ever, for African farmers it is not uncommon to receive only 10-20 percent of the market value of the products they sell, with the remaining 80-90 percent being allocated to transportation and marketing costs (Diao & Hazell, 2004). The extent to which rural households are involved in mar-kets varies considerably. For them, market partici-pation is often uncertain, risky and conducted on unfavourable terms. Many households therefore seek to grow their own food rather than buying it in local markets, while others limit their invest-ments in market-oriented crops in the absence of reliable produce markets. (IFAD, 2010).
Increasingly there are interesting market oppor-tunities for smallholders. The population of Af-rica will continue to grow from a 770 million in 2005 to between 1.5 and 2 billion by 2050 and so will the demand for agricultural produce and high-value food products (FAO, 2009). Youth un-der fourteen now make up 42 percent of the in-habitants of the region (Livingston et al, 2011). This population growth is particularly an urban growth. In 2050 approximately 60 percent of the total African population is expected to live in cit-ies (FAO, 2011a), an enormous growth, consider-ing the fact that in 1980 this was only 28 percent. Sub-Saharan African governments, recognizing the need to feed an increasingly urbanized pop-ulation, as well as the opportunity to develop agro-processing industries, are also focused on rapidly increasing agricultural production. Small-holders are positioned to be beneficiaries of the improving opportunities in agricultural markets. Smallholder production costs at the farm gate for several key crops are competitive with other regions, despite lower productivity, making them competitive suppliers in local markets.
In order to seize opportunities, a number of con-straints have to be overcome. Farmers need to comply with market requirements in terms of quality and quantity of produce, timely deliv-ery and competitive prices. Production related challenges including the ability to produce suf-ficient quality and quantity of goods, adherence to good agricultural practices (GAP), application of improved production technologies, efficient supply chain linkages, access to inputs, services, finance and information have to be addressed to increase farmers’ competitiveness to exploit market opportunities. Without access to markets, rural households cannot use their scarce resourc-es like land and labour efficiently, and their de-cision-making may be constrained (IFAD, 2011).
2.5 Access to services
Smallholder farmers need services for intensifi-cation of production, including input provision, advisory services, agricultural research, business development services, market information and trade promotion services, logistics services and diverse financing mechanisms. In the last centu-ry governments and various public institutions were actively involved in service provision in Afri-can agriculture through fertilizer subsidies, exten-sion services, price controls and guarantees, gov-ernment food purchases and distribution system and market regulations. Farmers were obliged to sell their export crops to state companies and in turn received inputs and advisory services. How-ever in the 1990s most of the countries imple-mented the Structural Adjustment Programmes (SAP) that led to trade liberalization and privat-ization of agricultural services and products. Structural adjustment and a commitment to market-based agricultural development have reduced the direct role of the state in providing services. Private systems are emerging but there remains a question mark about their ability to fill adequately the gap left by state withdrawal, es-pecially in the short-term.
21
Smallholders and agricultural development in Sub-Saharan Africa
With regard to agricultural research, extension services public services have never been re-placed by a well-functioning private sector, and in most cases, these services and products are hardly accessible for small-scale farmers (Smale and Jayne 2009).
Smallholders in general face enormous difficul-ties accessing improved seeds, improved ani-mal breeds and other inputs including fertilizers and pesticides. The current yields of farmers in Sub-Saharan Africa are far below potential yields leaving a huge gap between farmer yields and potential yields. For example farmers can achieve 40 to 50 percent more yields for wheat, 100 per-cent for rice, and as much as 200 percent for maize in Sub-Saharan Africa (Fischer et al, 2009).
With regards to financial services, only about 10 percent of the total portfolio of commercial banks in Africa is committed to agriculture, including agro-industries, and loans are rarely extended to smallholders (African Development Bank, 2012). Furthermore micro-finance institutions are ori-ented towards retail and small business custom-ers in regional centres rather than agricultural producers. Generally banks refrain from financing the agricultural sector because of the high risks involved in agriculture as well as the relatively high costs that are related to small-scale farming. Another bottleneck is that generally small-scale farmers lack collateral to get loans. Without fi-nance, farmers cannot buy inputs, hire workers or invest in equipment; traders cannot finance trade without access to credits and processors cannot fund investments in expanding their business.
2.6 Infrastructure
Infrastructure, while improving in some areas, re-mains a major constraint relative to other regions. Road conditions are poor and density is general-ly very low. Africa’s limited infrastructure restrain African farmers’ access to markets. Paved road density is only 23 percent of the average in de-veloping countries. Most roads in Africa are sand roads and impassable during the wet seasons (UNECA, 2009). Arbitrary road blocks, adulterat-ed fuel, problems getting imported spare parts, and monopolies and cartels all add to the costs of transportation and to the risk environment fac-ing smallholder farmers (IFAD, 2011).
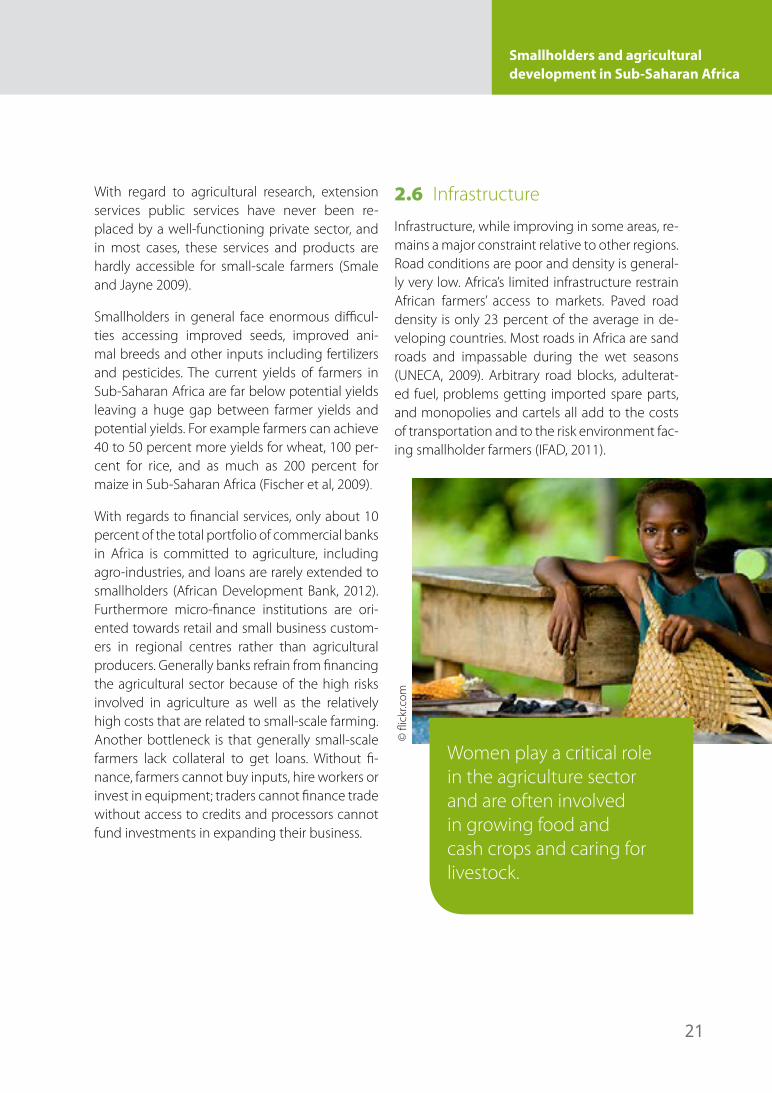
Women play a critical role in the agriculture sector and are often involved in growing food and cash crops and caring for livestock.
© fl
ickr
.com
22
2 African Agribusiness Supplier Development Programme (AASDP) Toolkit
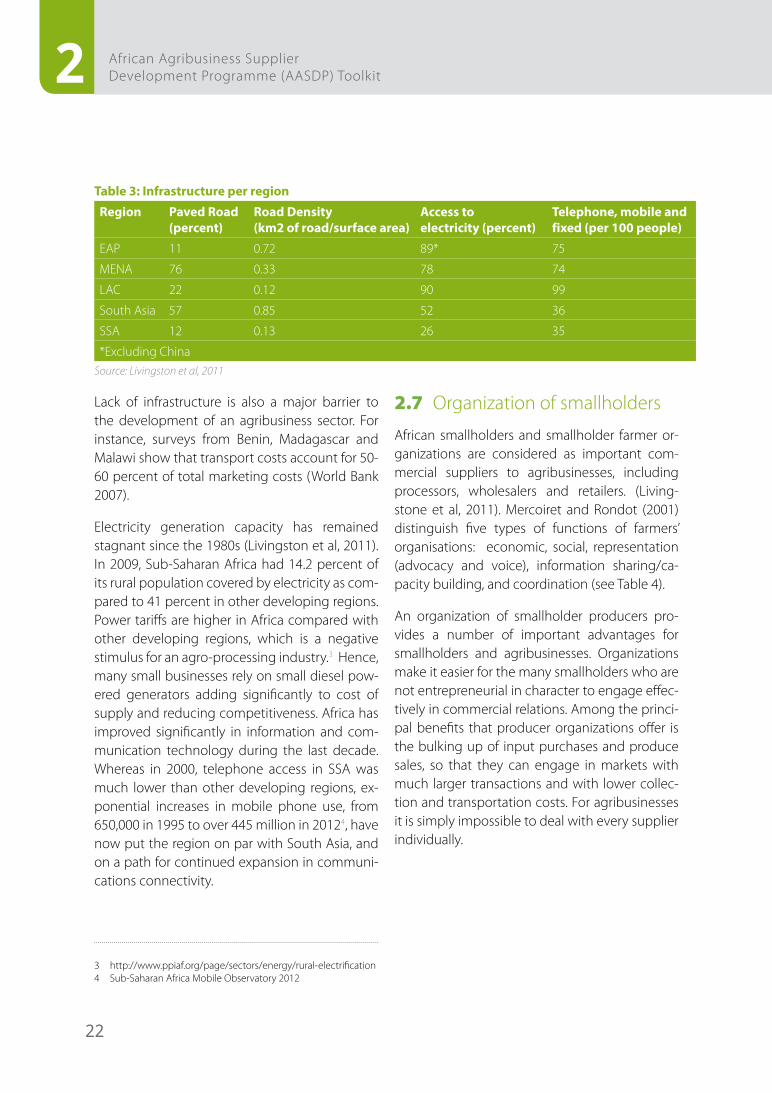
Table 3: Infrastructure per region
Region Paved Road (percent)
Road Density (km2 of road/surface area)
Access to electricity (percent)
Telephone, mobile and fixed (per 100 people)
EAP 11 0.72 89* 75
MENA 76 0.33 78 74
LAC 22 0.12 90 99
South Asia 57 0.85 52 36
SSA 12 0.13 26 35
*Excluding ChinaSource: Livingston et al, 2011
Lack of infrastructure is also a major barrier to the development of an agribusiness sector. For instance, surveys from Benin, Madagascar and Malawi show that transport costs account for 50-60 percent of total marketing costs (World Bank 2007).
Electricity generation capacity has remained stagnant since the 1980s (Livingston et al, 2011). In 2009, Sub-Saharan Africa had 14.2 percent of its rural population covered by electricity as com-pared to 41 percent in other developing regions. Power tariffs are higher in Africa compared with other developing regions, which is a negative stimulus for an agro-processing industry.3 Hence, many small businesses rely on small diesel pow-ered generators adding significantly to cost of supply and reducing competitiveness. Africa has improved significantly in information and com-munication technology during the last decade. Whereas in 2000, telephone access in SSA was much lower than other developing regions, ex-ponential increases in mobile phone use, from 650,000 in 1995 to over 445 million in 20124, have now put the region on par with South Asia, and on a path for continued expansion in communi-cations connectivity.
3 http://www.ppiaf.org/page/sectors/energy/rural-electrification4 Sub-Saharan Africa Mobile Observatory 2012
2.7 Organization of smallholders
African smallholders and smallholder farmer or-ganizations are considered as important com-mercial suppliers to agribusinesses, including processors, wholesalers and retailers. (Living-stone et al, 2011). Mercoiret and Rondot (2001) distinguish five types of functions of farmers’ organisations: economic, social, representation (advocacy and voice), information sharing/ca-pacity building, and coordination (see Table 4).
An organization of smallholder producers pro-vides a number of important advantages for smallholders and agribusinesses. Organizations make it easier for the many smallholders who are not entrepreneurial in character to engage effec-tively in commercial relations. Among the princi-pal benefits that producer organizations offer is the bulking up of input purchases and produce sales, so that they can engage in markets with much larger transactions and with lower collec-tion and transportation costs. For agribusinesses it is simply impossible to deal with every supplier individually.
23
Smallholders and agricultural development in Sub-Saharan Africa
Organizations offer more reliable relationships, in-cluding contracts which may be associated with input credit and production support services. For smallholder, the access to advisory and financial services can be improved through organizations. In addition, smallholder organizations play an important role in ensuring required quality and quantity of produce.
The success of a producer organization is crit-ically dependent on at least three factors: first, there must be a strong economic rationale and common interest for its formation; second, its geographical space, size, structure, governance, management arrangements and legal status
must all reflect the purpose for which it has been established; and third, its members must be ac-tively committed to pursuing agreed objectives and abiding by an agreed set of rules (Berdegue et all, 2008; IFAD, 2011).
In practice, producer organizations face many challenges. These typically include financial sus-tainability as well as issues of governance and the probity of their leadership, heterogeneous mem-bership and potentially divergent interests, the trade-off between equity and efficiency, their ca-pacity to effectively manage the collective action of their members and the compromises and loss of vision that can result from outside support.
Table 4: IFC’s working definitions of SMEs
Indicator Micro enterprise Small enterprise Medium enterprise
Employees <10 10<50 50<300
Assets (US$) <100.000 100.000<3 mil. 3 mil.<15 mil
Sales (US$) <100.000 100.000<3 mil 3 mil.<15 milSource: IFC, 2012
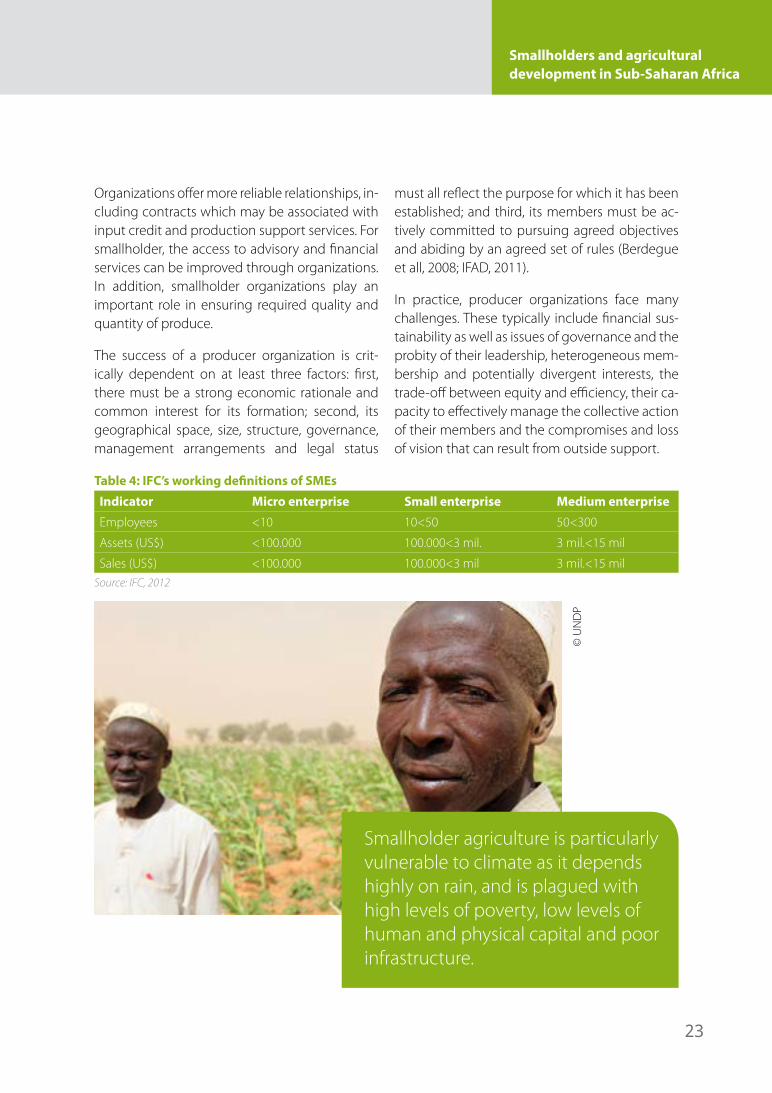
Smallholder agriculture is particularly vulnerable to climate as it depends highly on rain, and is plagued with high levels of poverty, low levels of human and physical capital and poor infrastructure.
© U
ND
P
24
2 African Agribusiness Supplier Development Programme (AASDP) Toolkit
2.8 Small and Medium Enterprises
According to the IFC, SMEs are registered busi-nesses with less than 300 employees. This can be further narrowed down by distinguishing SMEs from microenterprises with a minimum number of employees. Other criteria are assets and turn-over (see Table 4).
SMEs form the backbone of modern economies. They are key to local job creation, increased food security and poverty alleviation (UNDP 2010C). Relatively they employ more labour than larg-er companies due to the more labour intensive technologies they usually apply. In developed countries SMEs account for about 70 percent of net job creation and in developing countries even up to 90 percent (IFC, 2010). This is related to the general absence of larger enterprises in these countries.
SMEs have a positive impact not only on added value, but also on food security. FAO (2009) distin-guishes four major ways in which local agro-pro-cessing of food commodities increases food se-curity:
• By reducing post-harvest losses (estimated 50 percent for roots and tubers and up to 70 per-cent for fruits and vegetables).
• By extending shelf life, thus enabling transpor-tation to urban centres.
• By adding value, thus increasing income and purchasing power.
• By improving food quality and safety aspects and reducing food-based health hazards.
SMEs contribute to the development of agricul-tural smallholder producers since they:
• Provide access to markets for smallholder farmers by establishing new supply chains and expanding existing ones;
• Are seed-beds for innovation due to their rela-tive flexibility and risk-taking attitude;
• Are less dependent on world-market price fluctuations and regarded as more stable and sustainable than large agricultural enterprises;
• Contribute to domestic value addition and processing;
• Distribute seeds, fertilizers and other inputs farmers need, closest to the farmers.
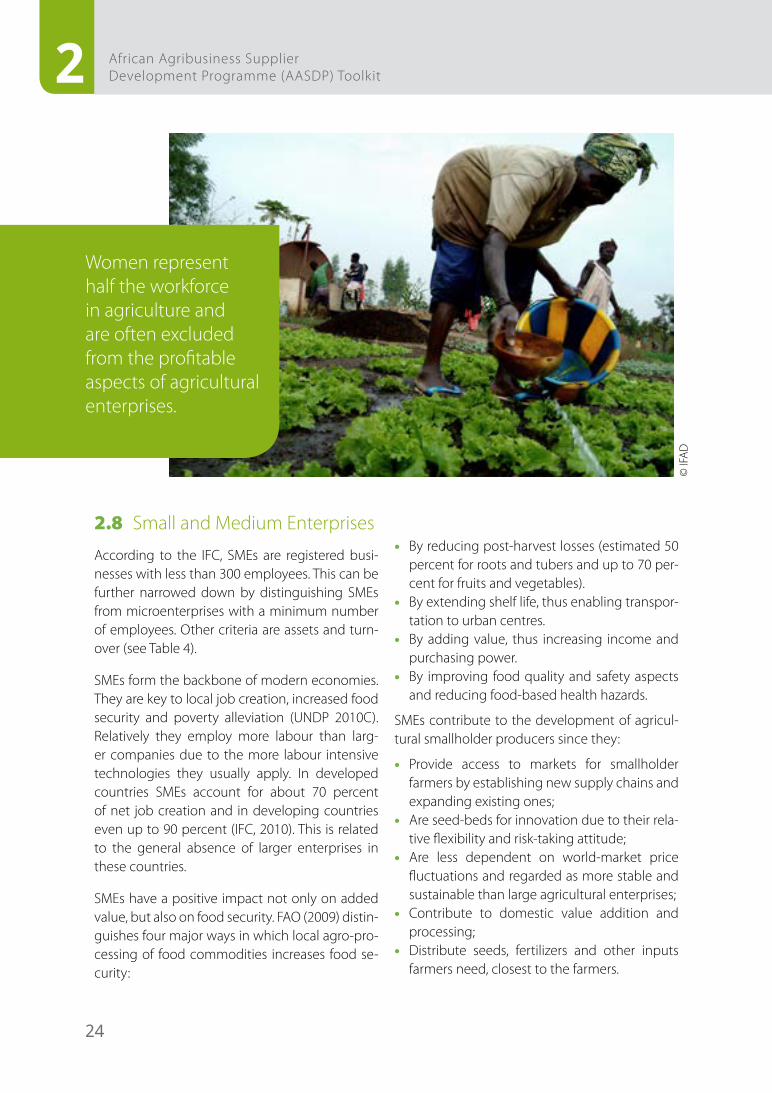
Women represent half the workforce in agriculture and are often excluded from the profitable aspects of agricultural enterprises.
© IF
AD
25
Smallholders and agricultural development in Sub-Saharan Africa
With respect to agribusiness, SMEs are not only found in food processing, they are also found as suppliers of the various goods and services need-ed by agribusiness lead firms of all sizes to carry out their business model such as packaging ma-terial supplier or repair services.
Also in Sub-Saharan Africa SMEs are emerging. For instance, they already account for 70 percent of Ghana’s GDP, 91 percent of formalized business in South Africa and 70 percent of the manufac-turing sector in Nigeria (CAI, 2012). At the same time, however, SMEs in Sub-Saharan Africa are seriously hampered in playing their role. To what extent, it varies from country to country. In coun-tries like Chad, the Republic of Congo, Nigeria and Eritrea, SMEs suffer from high levels of regu-latory and institutional barriers.
On the contrary, in countries like Ghana, South Africa, Mauritius, Botswana and Tanzania, policies regarding SMEs have substantially improved (CAI, 2012). The key obstacle of SMEs in doing business is access to finance. Next to access to finance, in order to support SMEs, governments should in-vest in creating an enabling environment for business through transparent regulation and pol-icies, improved tax policies, labour law, property rights and contract protection.
2.9 Agribusiness Sector
Although the agricultural sector represents such a large part of economies in SSA, there is little known about the agribusiness sector in SSA. The Evans School of Public Affairs carried out a liter-ature review in risks that limits investments in agriculture in SSA (2010). It clearly came out that there are many risks in investing in the agricultur-al sector in SSA, see the table below.
Table 5: Risks to Agribusiness Investment in SSA
Category ExamplesPolitical War and civil disturbance, Corruption, Expropriation, Breach of contract,
Non-honouring of sovereign obligations
Economic/Financial Credit risk, Financial risk, Currency inconvertibility, Volatile terms of trade, Price risk, Illiquidity, Cost and availability of capital, Uncertainty of invest-ment returns, Limited availability to maintain and grow equity
Social Low education/productivity, Disease, Lack of social capital
Environmental Crop loss, Climate risks, Drought, Flood, Wind, Climate change
Source: Collection of sources in Evans School Policy Analysis and Research Group, 2010
26
2 African Agribusiness Supplier Development Programme (AASDP) Toolkit
On the other hand, with a growing population, Africa does offer an enormous market growth potential for food consumption and thus good reason for companies to increasingly target Af-rican urban markets. As a result local sourcing is increasingly on the agenda of the processing industry. Proximity to the supply source “enables a company to monitor supply and enhance flex-ibility with regard to changing orders” (KIT e.a, Sustainable Local Sourcing flyer, 2012). This has a positive impact on the quality of supplied prod-ucts and it creates stronger relationships with suppliers. The latter, on its turn, has a positive impact on a widely experienced risk in the agri-cultural sector, namely side-selling (or the breach of contract). Local sourcing also puts down costs on imports, for instance currency exchange cost, freight cost and clearance cost.
On top of cost reductions and increased efficien-cy, companies face another driver for investing in local sourcing. Increasingly national govern-
ments have put local sourcing as a prerequisite to investing in African countries, for instance in Nigeria where 10 percent of the dairy products need to be sourced locally.
Next to commercial drivers, companies also have social drivers to sustainably invest backwards in their supply chain. This goes beyond just a hu-man responsibility. ‘Contributing to poverty re-duction helps companies improve their image among local farmers, agrifood suppliers and potential local consumers. This demonstration of corporate social responsibility also appeals to consumers in global markets, local policymakers and civil organizations’ (KIT e.a, Sustainable Local Sourcing flyer, 2012).
Already big companies such as Shoprite, Nestle and Coca-Cola are slowly penetrating African supplier markets (Boomsma and Mangnus, 2012). Yet, also, local companies are paving their way. The table below shows the 5 largest buyers in 5 selected countries.
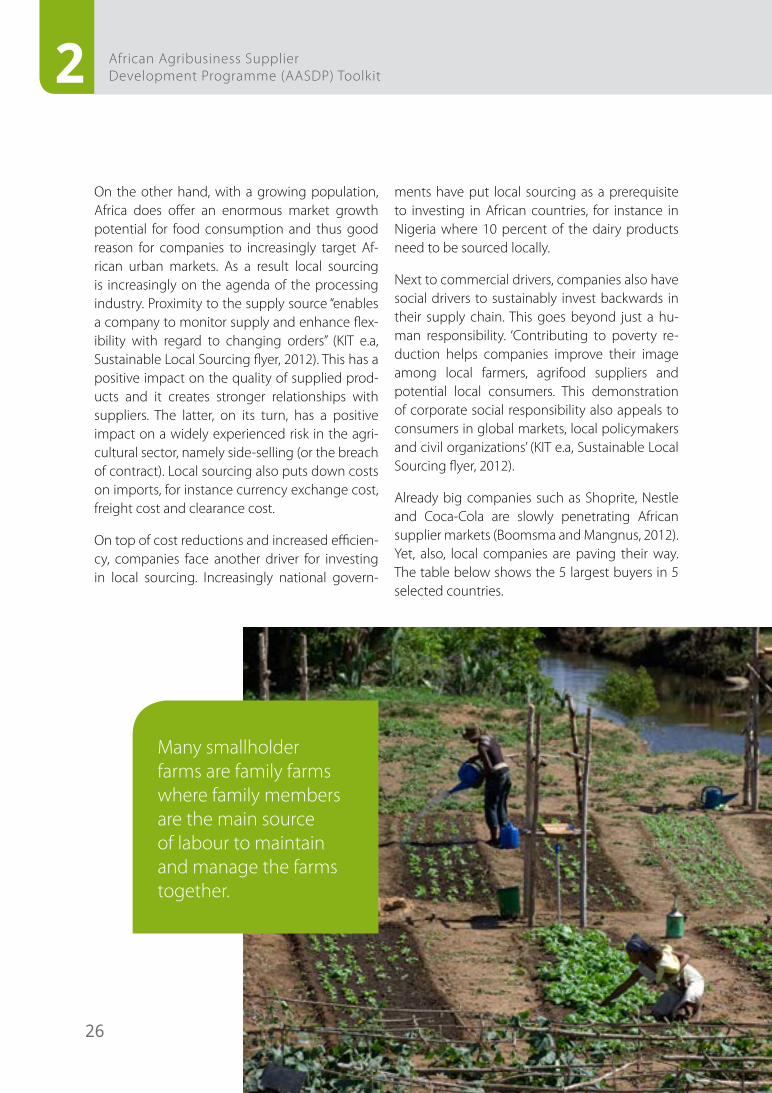
Many smallholder farms are family farms where family members are the main source of labour to maintain and manage the farms together.
27
Smallholders and agricultural development in Sub-Saharan Africa
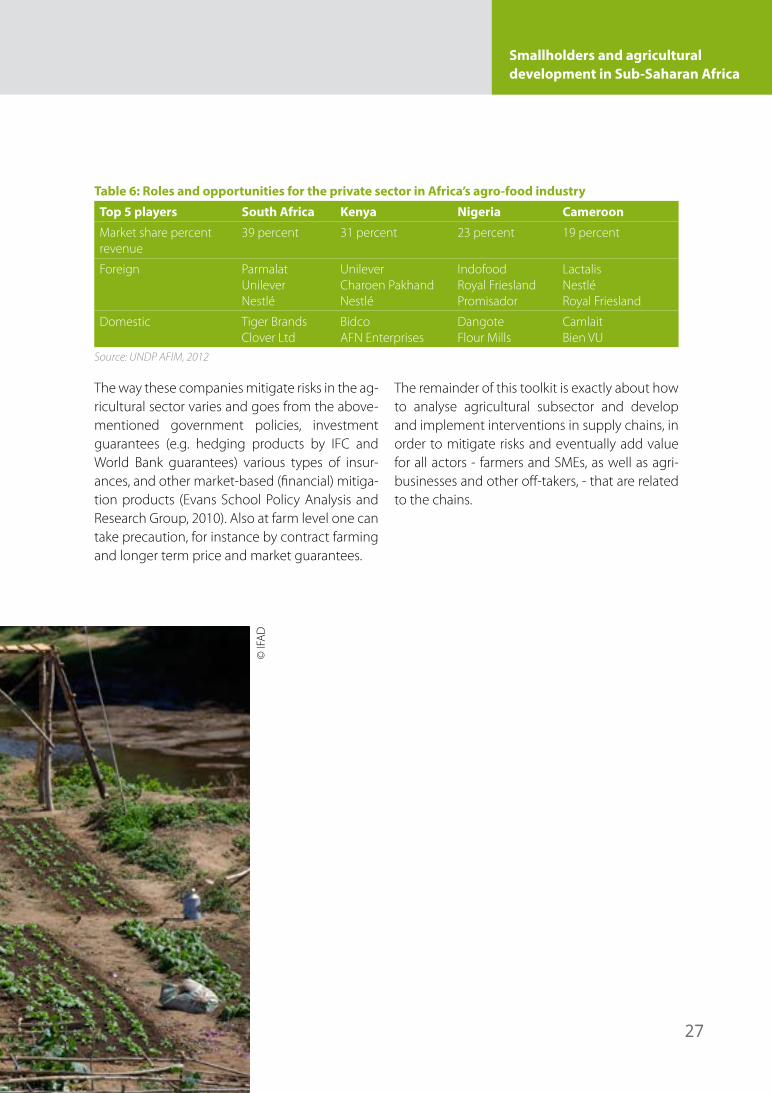
Table 6: Roles and opportunities for the private sector in Africa’s agro-food industry
Top 5 players South Africa Kenya Nigeria Cameroon
Market share percent revenue
39 percent 31 percent 23 percent 19 percent
Foreign ParmalatUnileverNestlé
UnileverCharoen PakhandNestlé
IndofoodRoyal FrieslandPromisador
LactalisNestléRoyal Friesland
Domestic Tiger BrandsClover Ltd
BidcoAFN Enterprises
DangoteFlour Mills
CamlaitBien VU
Source: UNDP AFIM, 2012
The way these companies mitigate risks in the ag-ricultural sector varies and goes from the above- mentioned government policies, investment guarantees (e.g. hedging products by IFC and World Bank guarantees) various types of insur-ances, and other market-based (financial) mitiga-tion products (Evans School Policy Analysis and Research Group, 2010). Also at farm level one can take precaution, for instance by contract farming and longer term price and market guarantees.
The remainder of this toolkit is exactly about how to analyse agricultural subsector and develop and implement interventions in supply chains, in order to mitigate risks and eventually add value for all actors - farmers and SMEs, as well as agri-businesses and other off-takers, - that are related to the chains.
© IF
AD
3. ASDP Roadmap
ASDP Roadmap
29
ASDP Roadmap
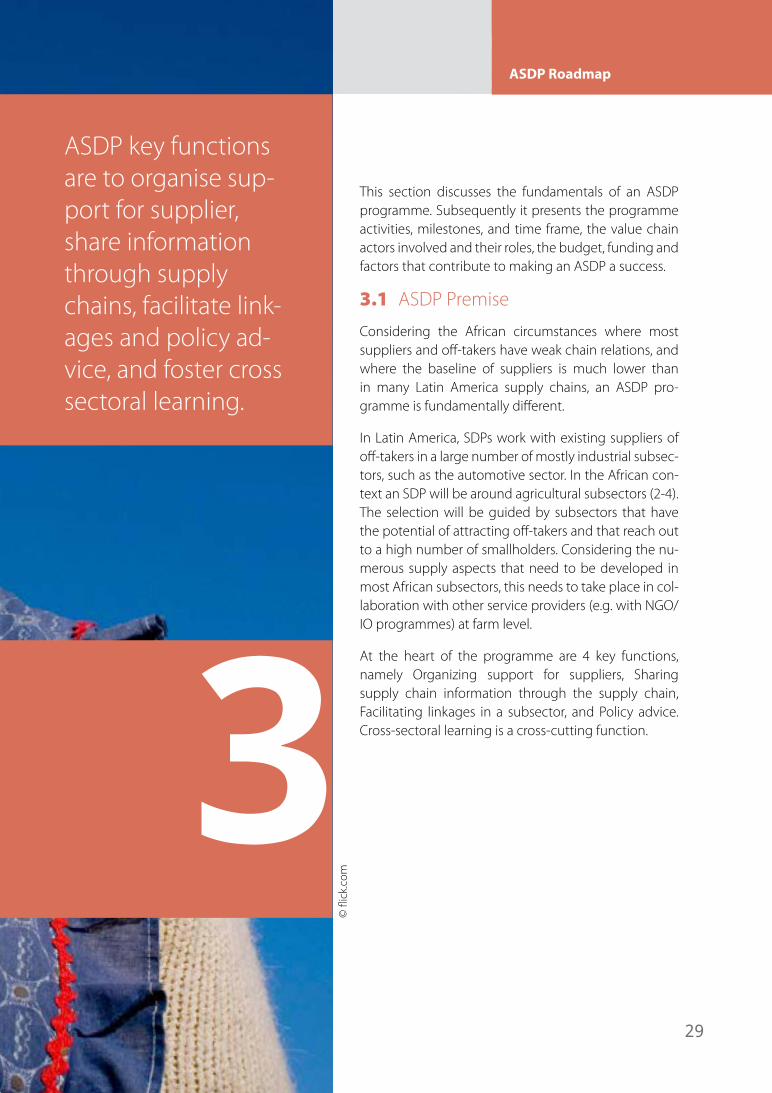
This section discusses the fundamentals of an ASDP programme. Subsequently it presents the programme activities, milestones, and time frame, the value chain actors involved and their roles, the budget, funding and factors that contribute to making an ASDP a success.
3.1 ASDP Premise
Considering the African circumstances where most suppliers and off-takers have weak chain relations, and where the baseline of suppliers is much lower than in many Latin America supply chains, an ASDP pro-gramme is fundamentally different.
In Latin America, SDPs work with existing suppliers of off-takers in a large number of mostly industrial subsec-tors, such as the automotive sector. In the African con-text an SDP will be around agricultural subsectors (2-4). The selection will be guided by subsectors that have the potential of attracting off-takers and that reach out to a high number of smallholders. Considering the nu-merous supply aspects that need to be developed in most African subsectors, this needs to take place in col-laboration with other service providers (e.g. with NGO/IO programmes) at farm level.
At the heart of the programme are 4 key functions, namely Organizing support for suppliers, Sharing supply chain information through the supply chain, Facilitating linkages in a subsector, and Policy advice. Cross-sectoral learning is a cross-cutting function.
ASDP Roadmap 3
© fl
ick.
com
ASDP key functions are to organise sup-port for supplier, share information through supply chains, facilitate link-ages and policy ad-vice, and foster cross sectoral learning.
30
3 African Agribusiness Supplier Development Programme (AASDP) Toolkit
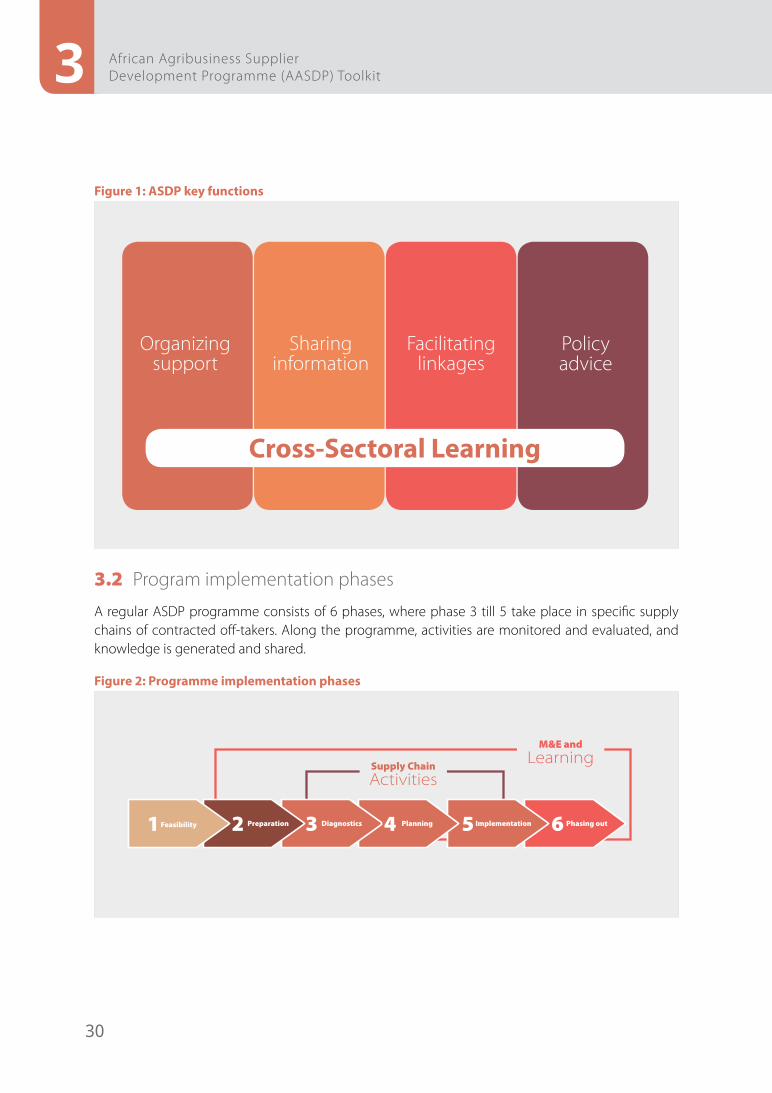
Figure 1: ASDP key functions
Organizing support
Sharing information
Facilitating linkages
Policy advice
Cross-Sectoral Learning
3.2 Program implementation phases
A regular ASDP programme consists of 6 phases, where phase 3 till 5 take place in specific supply chains of contracted off-takers. Along the programme, activities are monitored and evaluated, and knowledge is generated and shared.
Figure 2: Programme implementation phases
Supply ChainActivities
Feasibility1 Preparation2 Phasing out6Diagnostics3 Planning4 Implementation5
M&E andLearning
31
ASDP Roadmap
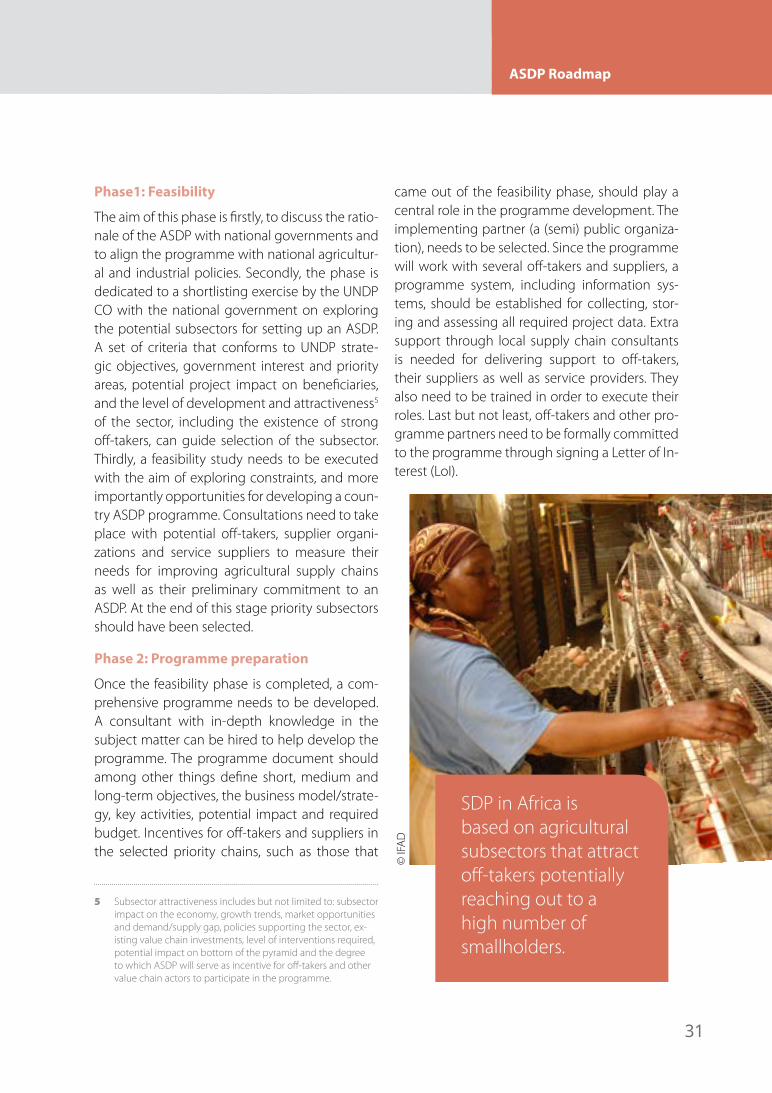
Phase1: Feasibility
The aim of this phase is firstly, to discuss the ratio-nale of the ASDP with national governments and to align the programme with national agricultur-al and industrial policies. Secondly, the phase is dedicated to a shortlisting exercise by the UNDP CO with the national government on exploring the potential subsectors for setting up an ASDP. A set of criteria that conforms to UNDP strate-gic objectives, government interest and priority areas, potential project impact on beneficiaries, and the level of development and attractiveness5 of the sector, including the existence of strong off-takers, can guide selection of the subsector. Thirdly, a feasibility study needs to be executed with the aim of exploring constraints, and more importantly opportunities for developing a coun-try ASDP programme. Consultations need to take place with potential off-takers, supplier organi-zations and service suppliers to measure their needs for improving agricultural supply chains as well as their preliminary commitment to an ASDP. At the end of this stage priority subsectors should have been selected.
Phase 2: Programme preparation
Once the feasibility phase is completed, a com-prehensive programme needs to be developed. A consultant with in-depth knowledge in the subject matter can be hired to help develop the programme. The programme document should among other things define short, medium and long-term objectives, the business model/strate-gy, key activities, potential impact and required budget. Incentives for off-takers and suppliers in the selected priority chains, such as those that
5 Subsector attractiveness includes but not limited to: subsector impact on the economy, growth trends, market opportunities and demand/supply gap, policies supporting the sector, ex-isting value chain investments, level of interventions required, potential impact on bottom of the pyramid and the degree to which ASDP will serve as incentive for off-takers and other value chain actors to participate in the programme.
came out of the feasibility phase, should play a central role in the programme development. The implementing partner (a (semi) public organiza-tion), needs to be selected. Since the programme will work with several off-takers and suppliers, a programme system, including information sys-tems, should be established for collecting, stor-ing and assessing all required project data. Extra support through local supply chain consultants is needed for delivering support to off-takers, their suppliers as well as service providers. They also need to be trained in order to execute their roles. Last but not least, off-takers and other pro-gramme partners need to be formally committed to the programme through signing a Letter of In-terest (LoI).
SDP in Africa is based on agricultural subsectors that attract off-takers potentially reaching out to a high number of smallholders.
© IF
AD
32
3 African Agribusiness Supplier Development Programme (AASDP) Toolkit
Phase 3: Supply chain diagnostics
The following 3 phases (phase 3, 4 and 5) take place in the selected subsectors and related supply chains. They are coordinated by the im-plementing partner and largely implemented by supply chain consultants (depending on the size of the project these are full-time or short-term staff ), that are especially trained and hired for this purpose. In Phase 3 (specialist) consultants will be in charge of analysing supply chains of participat-ing off-takers in the shortlisted subsectors. They assess technical, organizational, financial and pol-icy / institutional as well as livelihoods and envi-ronmental risks in supply chains. The outputs are clearly defined opportunities and baseline data for the programme’s data and M&E systems.
Phase 4: Supply chain development plan-ning
Based on the above analysis, the consultant will then develop and propose an implementation plan that needs to be validated in a multi-stake-holders’ workshop with participating off-takers, suppliers and involved service organizations, in-cluding NGOs, public and private service provid-ers and finance providers. Subsequently a chain partnership contract between the off-taker(s), suppliers and other involved service providers providing exact specifications on supplies as well as on improvements that are required for the supplier to become the preferred supplier of the off-taker(s) are defined and agreed upon (expec-tations and milestones).
Phase 5: Supply chain development implementation
During a period of preferably four production seasons the suppliers, together with their service suppliers (NGO programmes, public and private service providers, and finance providers, etc.), improve production and productivity, quality management, price, lead time and organizational
structures while the buyers invest in improving their technical and financial support towards suppliers, communication of specifications and regulations and timely payments. This goes hand in hand with additional investments in physical hardware and inputs supply by both suppliers and buyers.
After four seasons the chain partnerships are evaluated and the off-takers decide whether to continue the contract of the suppliers and vice versa.
Phase 6: Phasing out
A phasing out strategy is a systematic, planned set of activities that the implementing agency undertakes in order to assure the sustainability of the supply chain projects and eventually the programme. It should be incorporated in the Programme Document. Phasing out indicators should be clearly monitored during the course of the programme.
M&E, impact measurement and learning
This is not a phase but an ongoing activity during the full course of the programme. The objective is to inform those in charge of implementing the ASDP and those who are a stakeholder in the se-lected supply chain, on the implementation and achievements of the ASDP, and to share lessons learned. Indicators that will be used in measuring results at different levels of the supply chain are e.g. additional income, jobs and increase in scale of production. The M&E activities will also inform stakeholders on the progress towards phasing out of the ASDP. A knowledge programme should be designed for generating and disseminating knowledge with the aim of reaching a scale.
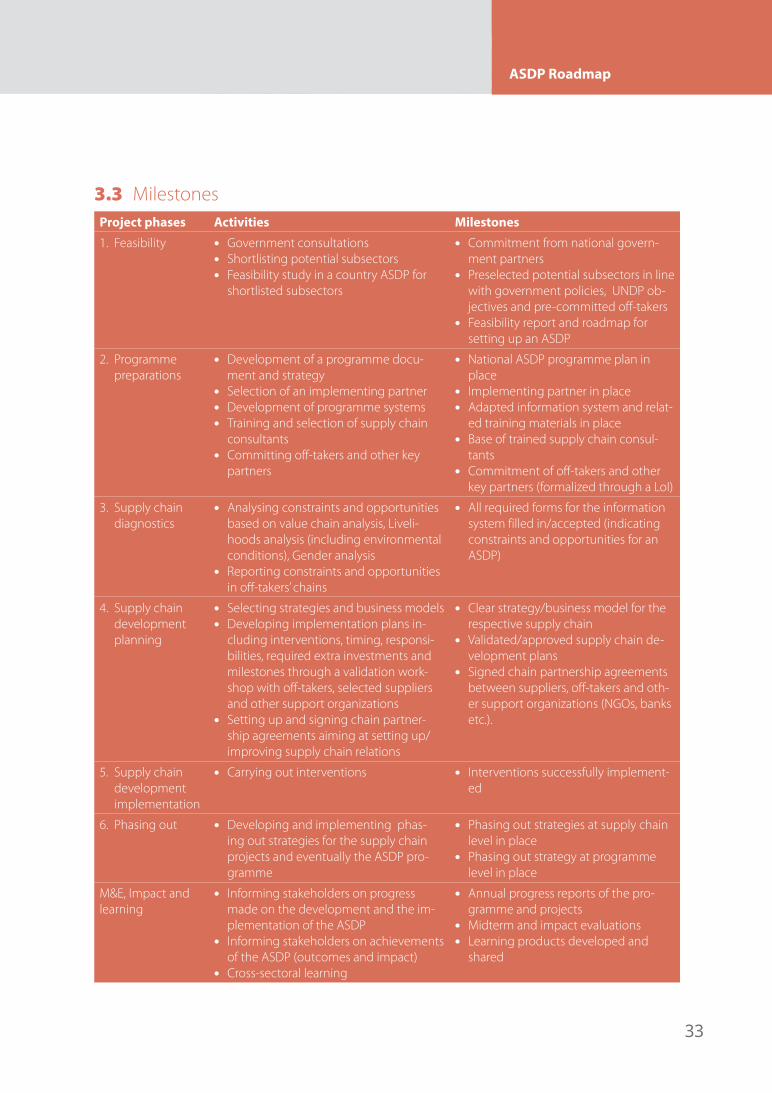
33
ASDP Roadmap
3.3 MilestonesProject phases Activities Milestones
1. Feasibility • Government consultations• Shortlisting potential subsectors• Feasibility study in a country ASDP for
shortlisted subsectors
• Commitment from national govern-ment partners
• Preselected potential subsectors in line with government policies, UNDP ob-jectives and pre-committed off-takers
• Feasibility report and roadmap for setting up an ASDP
2. Programme preparations
• Development of a programme docu-ment and strategy
• Selection of an implementing partner• Development of programme systems• Training and selection of supply chain
consultants• Committing off-takers and other key
partners
• National ASDP programme plan in place
• Implementing partner in place • Adapted information system and relat-
ed training materials in place• Base of trained supply chain consul-
tants• Commitment of off-takers and other
key partners (formalized through a LoI)
3. Supply chain diagnostics
• Analysing constraints and opportunities based on value chain analysis, Liveli-hoods analysis (including environmental conditions), Gender analysis
• Reporting constraints and opportunities in off-takers’ chains
• All required forms for the information system filled in/accepted (indicating constraints and opportunities for an ASDP)
4. Supply chain development planning
• Selecting strategies and business models• Developing implementation plans in-
cluding interventions, timing, responsi-bilities, required extra investments and milestones through a validation work-shop with off-takers, selected suppliers and other support organizations
• Setting up and signing chain partner-ship agreements aiming at setting up/improving supply chain relations
• Clear strategy/business model for the respective supply chain
• Validated/approved supply chain de-velopment plans
• Signed chain partnership agreements between suppliers, off-takers and oth-er support organizations (NGOs, banks etc.).
5. Supply chain development implementation
• Carrying out interventions • Interventions successfully implement-ed
6. Phasing out • Developing and implementing phas-ing out strategies for the supply chain projects and eventually the ASDP pro-gramme
• Phasing out strategies at supply chain level in place
• Phasing out strategy at programme level in place
M&E, Impact and learning
• Informing stakeholders on progress made on the development and the im-plementation of the ASDP
• Informing stakeholders on achievements of the ASDP (outcomes and impact)
• Cross-sectoral learning
• Annual progress reports of the pro-gramme and projects
• Midterm and impact evaluations• Learning products developed and
shared
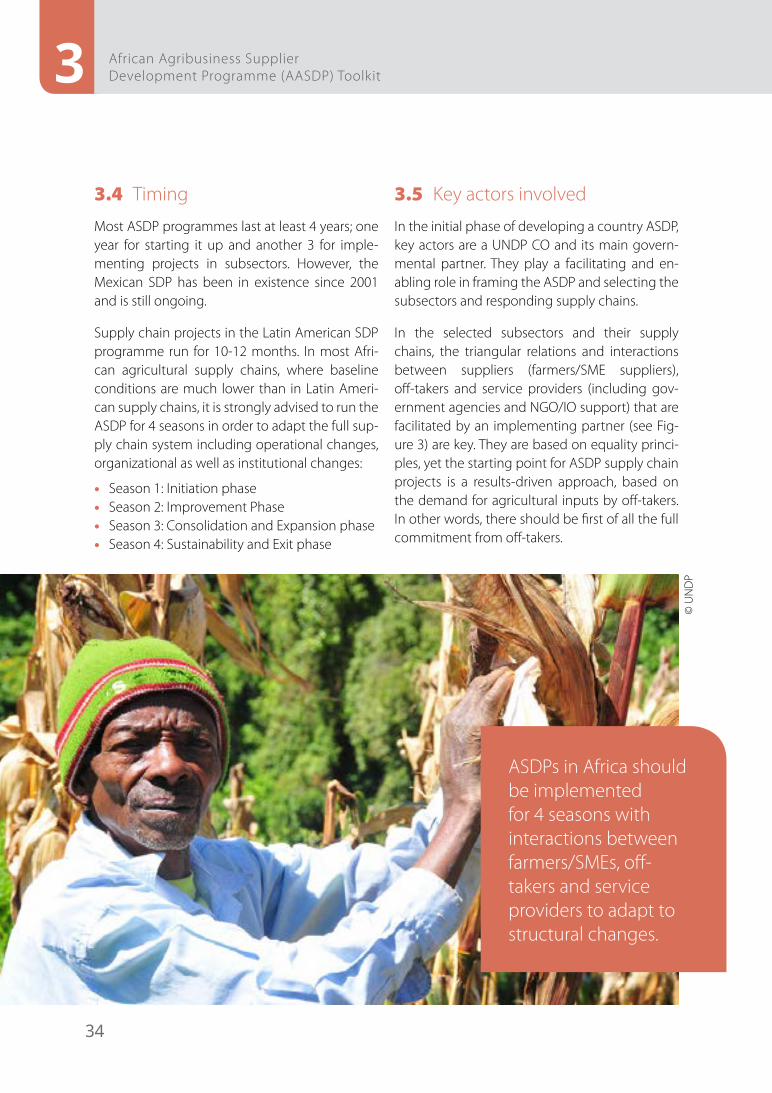
34
3 African Agribusiness Supplier Development Programme (AASDP) Toolkit
3.4 Timing
Most ASDP programmes last at least 4 years; one year for starting it up and another 3 for imple-menting projects in subsectors. However, the Mexican SDP has been in existence since 2001 and is still ongoing.
Supply chain projects in the Latin American SDP programme run for 10-12 months. In most Afri-can agricultural supply chains, where baseline conditions are much lower than in Latin Ameri-can supply chains, it is strongly advised to run the ASDP for 4 seasons in order to adapt the full sup-ply chain system including operational changes, organizational as well as institutional changes:
• Season 1: Initiation phase• Season 2: Improvement Phase• Season 3: Consolidation and Expansion phase• Season 4: Sustainability and Exit phase
3.5 Key actors involved
In the initial phase of developing a country ASDP, key actors are a UNDP CO and its main govern-mental partner. They play a facilitating and en-abling role in framing the ASDP and selecting the subsectors and responding supply chains.
In the selected subsectors and their supply chains, the triangular relations and interactions between suppliers (farmers/SME suppliers), off-takers and service providers (including gov-ernment agencies and NGO/IO support) that are facilitated by an implementing partner (see Fig-ure 3) are key. They are based on equality princi-ples, yet the starting point for ASDP supply chain projects is a results-driven approach, based on the demand for agricultural inputs by off-takers. In other words, there should be first of all the full commitment from off-takers.
ASDPs in Africa should be implemented for 4 seasons with interactions between farmers/SMEs, off-takers and service providers to adapt to structural changes.
© U
ND
P
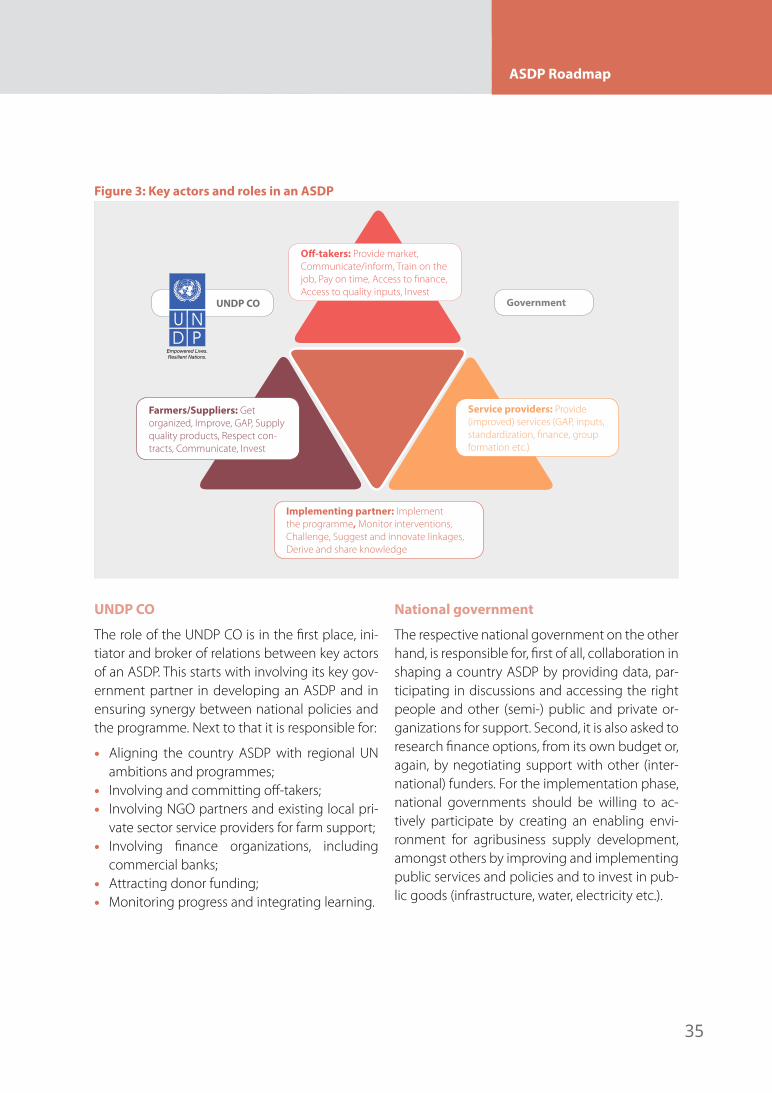
35
ASDP Roadmap
Figure 3: Key actors and roles in an ASDP
Service providers: Provide (improved) services (GAP, inputs, standardization, finance, group formation etc.)
Government UNDP CO
Off-takers: Provide market, Communicate/inform, Train on the job, Pay on time, Access to finance, Access to quality inputs, Invest
Farmers/Suppliers: Get organized, Improve, GAP, Supply quality products, Respect con-tracts, Communicate, Invest
Implementing partner: Implement the programme, Monitor interventions, Challenge, Suggest and innovate linkages, Derive and share knowledge
UNDP CO
The role of the UNDP CO is in the first place, ini-tiator and broker of relations between key actors of an ASDP. This starts with involving its key gov-ernment partner in developing an ASDP and in ensuring synergy between national policies and the programme. Next to that it is responsible for:
• Aligning the country ASDP with regional UN ambitions and programmes;
• Involving and committing off-takers;• Involving NGO partners and existing local pri-
vate sector service providers for farm support;• Involving finance organizations, including
commercial banks;• Attracting donor funding;• Monitoring progress and integrating learning.
National government
The respective national government on the other hand, is responsible for, first of all, collaboration in shaping a country ASDP by providing data, par-ticipating in discussions and accessing the right people and other (semi-) public and private or-ganizations for support. Second, it is also asked to research finance options, from its own budget or, again, by negotiating support with other (inter-national) funders. For the implementation phase, national governments should be willing to ac-tively participate by creating an enabling envi-ronment for agribusiness supply development, amongst others by improving and implementing public services and policies and to invest in pub-lic goods (infrastructure, water, electricity etc.).
Empowered Lives.Resilient Nations.
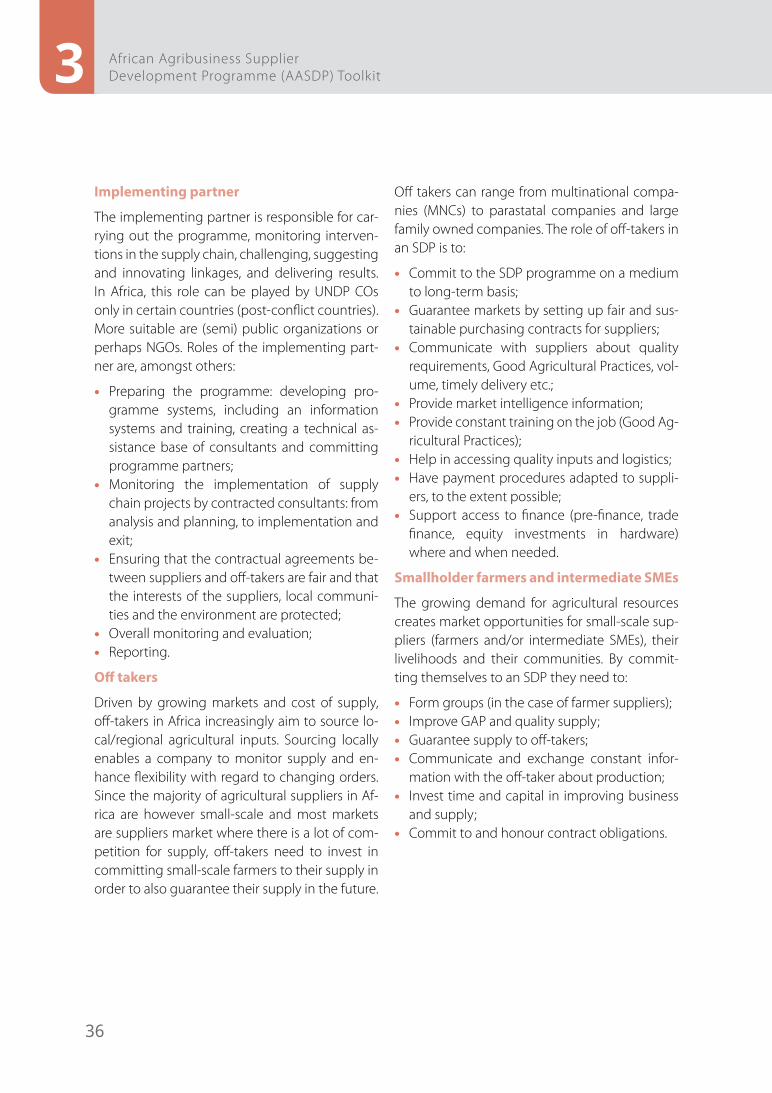
36
3 African Agribusiness Supplier Development Programme (AASDP) Toolkit
Implementing partner
The implementing partner is responsible for car-rying out the programme, monitoring interven-tions in the supply chain, challenging, suggesting and innovating linkages, and delivering results. In Africa, this role can be played by UNDP COs only in certain countries (post-conflict countries). More suitable are (semi) public organizations or perhaps NGOs. Roles of the implementing part-ner are, amongst others:
• Preparing the programme: developing pro-gramme systems, including an information systems and training, creating a technical as-sistance base of consultants and committing programme partners;
• Monitoring the implementation of supply chain projects by contracted consultants: from analysis and planning, to implementation and exit;
• Ensuring that the contractual agreements be-tween suppliers and off-takers are fair and that the interests of the suppliers, local communi-ties and the environment are protected;
• Overall monitoring and evaluation;• Reporting.
Off takers
Driven by growing markets and cost of supply, off-takers in Africa increasingly aim to source lo-cal/regional agricultural inputs. Sourcing locally enables a company to monitor supply and en-hance flexibility with regard to changing orders. Since the majority of agricultural suppliers in Af-rica are however small-scale and most markets are suppliers market where there is a lot of com-petition for supply, off-takers need to invest in committing small-scale farmers to their supply in order to also guarantee their supply in the future.
Off takers can range from multinational compa-nies (MNCs) to parastatal companies and large family owned companies. The role of off-takers in an SDP is to:
• Commit to the SDP programme on a medium to long-term basis;
• Guarantee markets by setting up fair and sus-tainable purchasing contracts for suppliers;
• Communicate with suppliers about quality requirements, Good Agricultural Practices, vol-ume, timely delivery etc.;
• Provide market intelligence information;• Provide constant training on the job (Good Ag-
ricultural Practices);• Help in accessing quality inputs and logistics;• Have payment procedures adapted to suppli-
ers, to the extent possible;• Support access to finance (pre-finance, trade
finance, equity investments in hardware) where and when needed.
Smallholder farmers and intermediate SMEs
The growing demand for agricultural resources creates market opportunities for small-scale sup-pliers (farmers and/or intermediate SMEs), their livelihoods and their communities. By commit-ting themselves to an SDP they need to:
• Form groups (in the case of farmer suppliers);• Improve GAP and quality supply;• Guarantee supply to off-takers;• Communicate and exchange constant infor-
mation with the off-taker about production;• Invest time and capital in improving business
and supply;• Commit to and honour contract obligations.
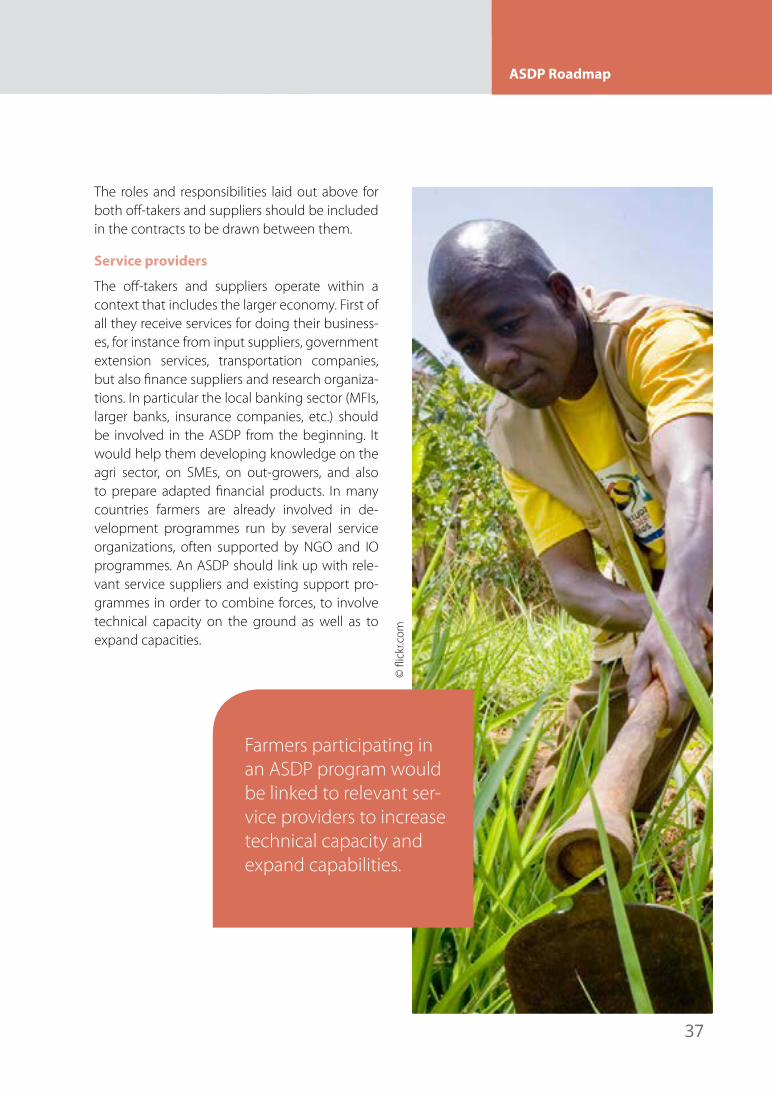
37
ASDP Roadmap
The roles and responsibilities laid out above for both off-takers and suppliers should be included in the contracts to be drawn between them.
Service providers
The off-takers and suppliers operate within a context that includes the larger economy. First of all they receive services for doing their business-es, for instance from input suppliers, government extension services, transportation companies, but also finance suppliers and research organiza-tions. In particular the local banking sector (MFIs, larger banks, insurance companies, etc.) should be involved in the ASDP from the beginning. It would help them developing knowledge on the agri sector, on SMEs, on out-growers, and also to prepare adapted financial products. In many countries farmers are already involved in de-velopment programmes run by several service organizations, often supported by NGO and IO programmes. An ASDP should link up with rele-vant service suppliers and existing support pro-grammes in order to combine forces, to involve technical capacity on the ground as well as to expand capacities.
Farmers participating in an ASDP program would be linked to relevant ser-vice providers to increase technical capacity and expand capabilities.
© fl
ickr
.com
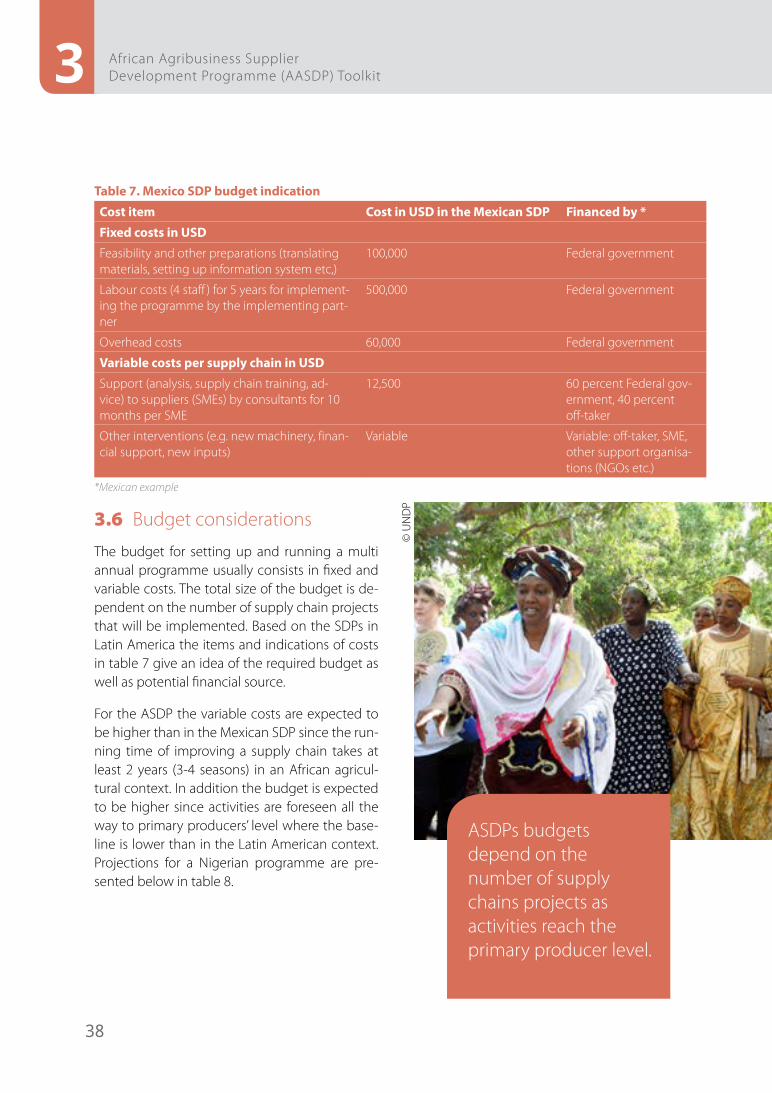
38
3 African Agribusiness Supplier Development Programme (AASDP) Toolkit
Table 7. Mexico SDP budget indication
Cost item Cost in USD in the Mexican SDP Financed by *
Fixed costs in USD
Feasibility and other preparations (translating materials, setting up information system etc,)
100,000 Federal government
Labour costs (4 staff ) for 5 years for implement-ing the programme by the implementing part-ner
500,000 Federal government
Overhead costs 60,000 Federal government
Variable costs per supply chain in USD
Support (analysis, supply chain training, ad-vice) to suppliers (SMEs) by consultants for 10 months per SME
12,500 60 percent Federal gov-ernment, 40 percent off-taker
Other interventions (e.g. new machinery, finan-cial support, new inputs)
Variable Variable: off-taker, SME, other support organisa-tions (NGOs etc.)
*Mexican example
3.6 Budget considerations
The budget for setting up and running a multi annual programme usually consists in fixed and variable costs. The total size of the budget is de-pendent on the number of supply chain projects that will be implemented. Based on the SDPs in Latin America the items and indications of costs in table 7 give an idea of the required budget as well as potential financial source.
For the ASDP the variable costs are expected to be higher than in the Mexican SDP since the run-ning time of improving a supply chain takes at least 2 years (3-4 seasons) in an African agricul-tural context. In addition the budget is expected to be higher since activities are foreseen all the way to primary producers’ level where the base-line is lower than in the Latin American context. Projections for a Nigerian programme are pre-sented below in table 8.
ASDPs budgets depend on the number of supply chains projects as activities reach the primary producer level.
© U
ND
P
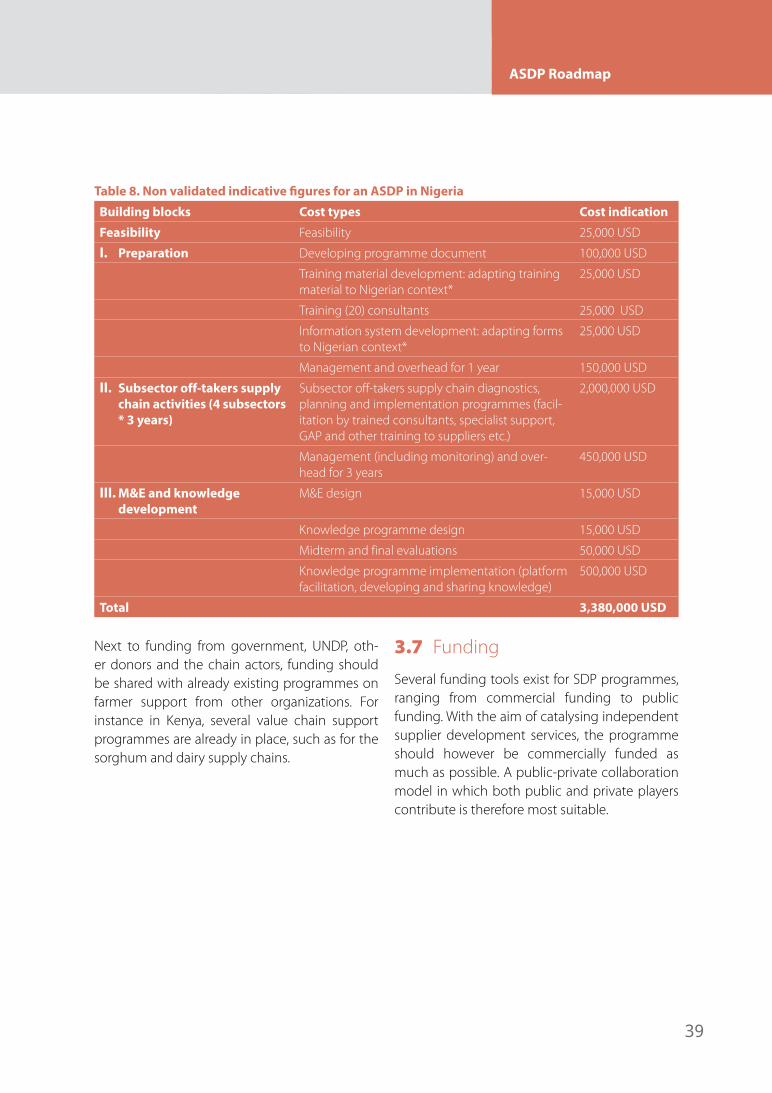
39
ASDP Roadmap
Table 8. Non validated indicative figures for an ASDP in Nigeria
Building blocks Cost types Cost indication
Feasibility Feasibility 25,000 USD
I. Preparation Developing programme document 100,000 USD
Training material development: adapting training material to Nigerian context*
25,000 USD
Training (20) consultants 25,000 USD
Information system development: adapting forms to Nigerian context*
25,000 USD
Management and overhead for 1 year 150,000 USD
II. Subsector off-takers supply chain activities (4 subsectors * 3 years)
Subsector off-takers supply chain diagnostics, planning and implementation programmes (facil-itation by trained consultants, specialist support, GAP and other training to suppliers etc.)
2,000,000 USD
Management (including monitoring) and over-head for 3 years
450,000 USD
III. M&E and knowledge development
M&E design 15,000 USD
Knowledge programme design 15,000 USD
Midterm and final evaluations 50,000 USD
Knowledge programme implementation (platform facilitation, developing and sharing knowledge)
500,000 USD
Total 3,380,000 USD
Next to funding from government, UNDP, oth-er donors and the chain actors, funding should be shared with already existing programmes on farmer support from other organizations. For instance in Kenya, several value chain support programmes are already in place, such as for the sorghum and dairy supply chains.
3.7 Funding
Several funding tools exist for SDP programmes, ranging from commercial funding to public funding. With the aim of catalysing independent supplier development services, the programme should however be commercially funded as much as possible. A public-private collaboration model in which both public and private players contribute is therefore most suitable.
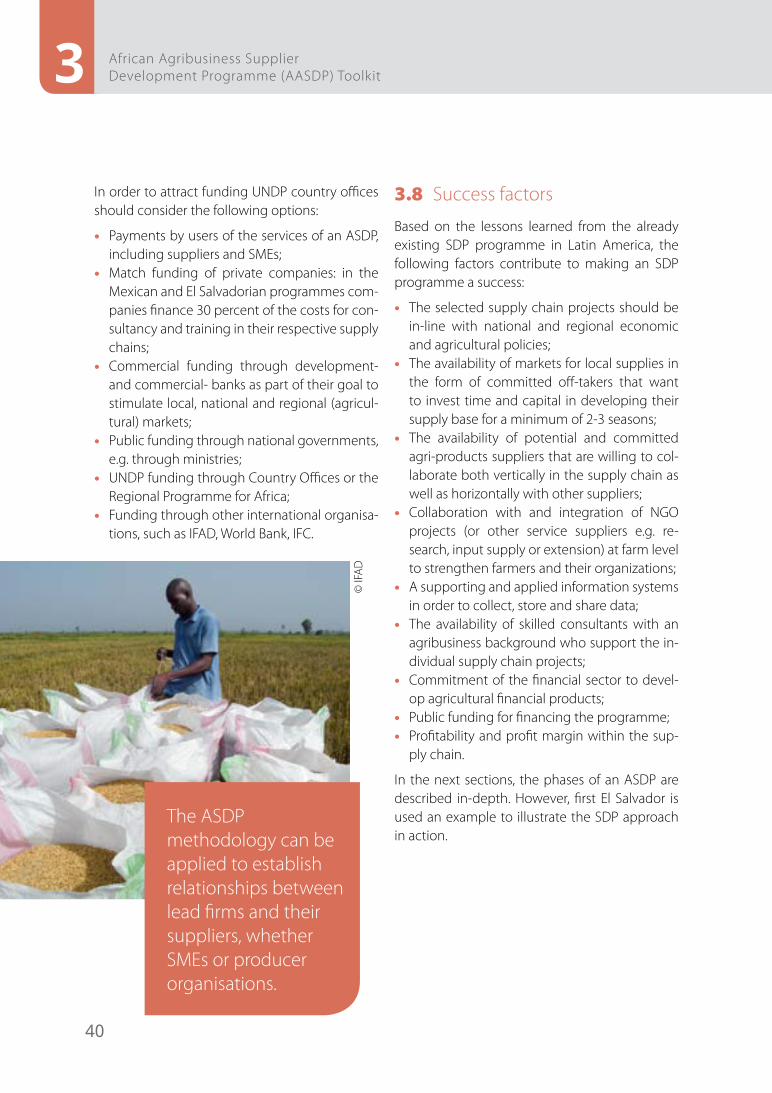
40
3 African Agribusiness Supplier Development Programme (AASDP) Toolkit
In order to attract funding UNDP country offices should consider the following options:
• Payments by users of the services of an ASDP, including suppliers and SMEs;
• Match funding of private companies: in the Mexican and El Salvadorian programmes com-panies finance 30 percent of the costs for con-sultancy and training in their respective supply chains;
• Commercial funding through development- and commercial- banks as part of their goal to stimulate local, national and regional (agricul-tural) markets;
• Public funding through national governments, e.g. through ministries;
• UNDP funding through Country Offices or the Regional Programme for Africa;
• Funding through other international organisa-tions, such as IFAD, World Bank, IFC.
3.8 Success factors
Based on the lessons learned from the already existing SDP programme in Latin America, the following factors contribute to making an SDP programme a success:
• The selected supply chain projects should be in-line with national and regional economic and agricultural policies;
• The availability of markets for local supplies in the form of committed off-takers that want to invest time and capital in developing their supply base for a minimum of 2-3 seasons;
• The availability of potential and committed agri-products suppliers that are willing to col-laborate both vertically in the supply chain as well as horizontally with other suppliers;
• Collaboration with and integration of NGO projects (or other service suppliers e.g. re-search, input supply or extension) at farm level to strengthen farmers and their organizations;
• A supporting and applied information systems in order to collect, store and share data;
• The availability of skilled consultants with an agribusiness background who support the in-dividual supply chain projects;
• Commitment of the financial sector to devel-op agricultural financial products;
• Public funding for financing the programme;• Profitability and profit margin within the sup-
ply chain.
In the next sections, the phases of an ASDP are described in-depth. However, first El Salvador is used an example to illustrate the SDP approach in action.
The ASDP methodology can be applied to establish relationships between lead firms and their suppliers, whether SMEs or producer organisations.
© IF
AD
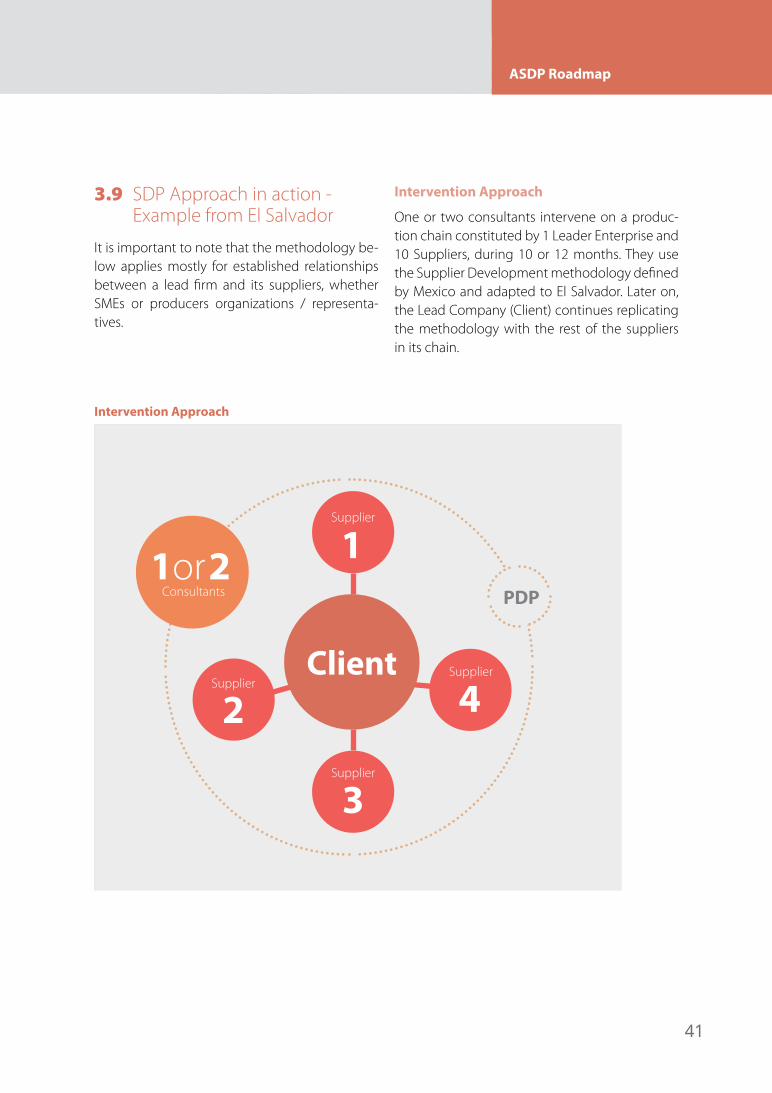
41
ASDP Roadmap
3.9 SDP Approach in action - Example from El Salvador
It is important to note that the methodology be-low applies mostly for established relationships between a lead firm and its suppliers, whether SMEs or producers organizations / representa-tives.
Intervention Approach
One or two consultants intervene on a produc-tion chain constituted by 1 Leader Enterprise and 10 Suppliers, during 10 or 12 months. They use the Supplier Development methodology defined by Mexico and adapted to El Salvador. Later on, the Lead Company (Client) continues replicating the methodology with the rest of the suppliers in its chain.
Intervention Approach
Supplier
Consultants
Supplier
Supplier
3
Supplier
PDP
Client2 4
1or 2 1
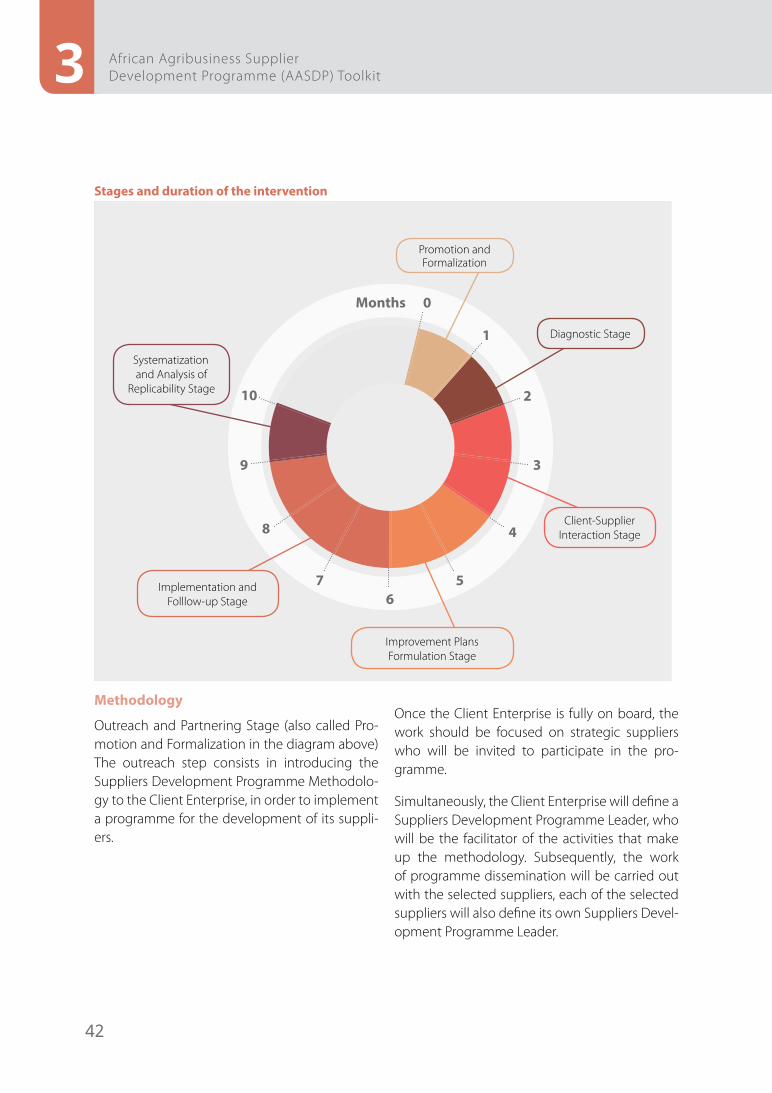
42
3 African Agribusiness Supplier Development Programme (AASDP) Toolkit
Stages and duration of the intervention
0
10
9
8
76
5
4
3
2
1
Promotion and Formalization
Diagnostic Stage
Client-Supplier Interaction Stage
Improvement Plans Formulation Stage
Implementation and Folllow-up Stage
Systematization and Analysis of
Replicability Stage
Months
Methodology
Outreach and Partnering Stage (also called Pro-motion and Formalization in the diagram above) The outreach step consists in introducing the Suppliers Development Programme Methodolo-gy to the Client Enterprise, in order to implement a programme for the development of its suppli-ers.
Once the Client Enterprise is fully on board, the work should be focused on strategic suppliers who will be invited to participate in the pro-gramme.
Simultaneously, the Client Enterprise will define a Suppliers Development Programme Leader, who will be the facilitator of the activities that make up the methodology. Subsequently, the work of programme dissemination will be carried out with the selected suppliers, each of the selected suppliers will also define its own Suppliers Devel-opment Programme Leader.
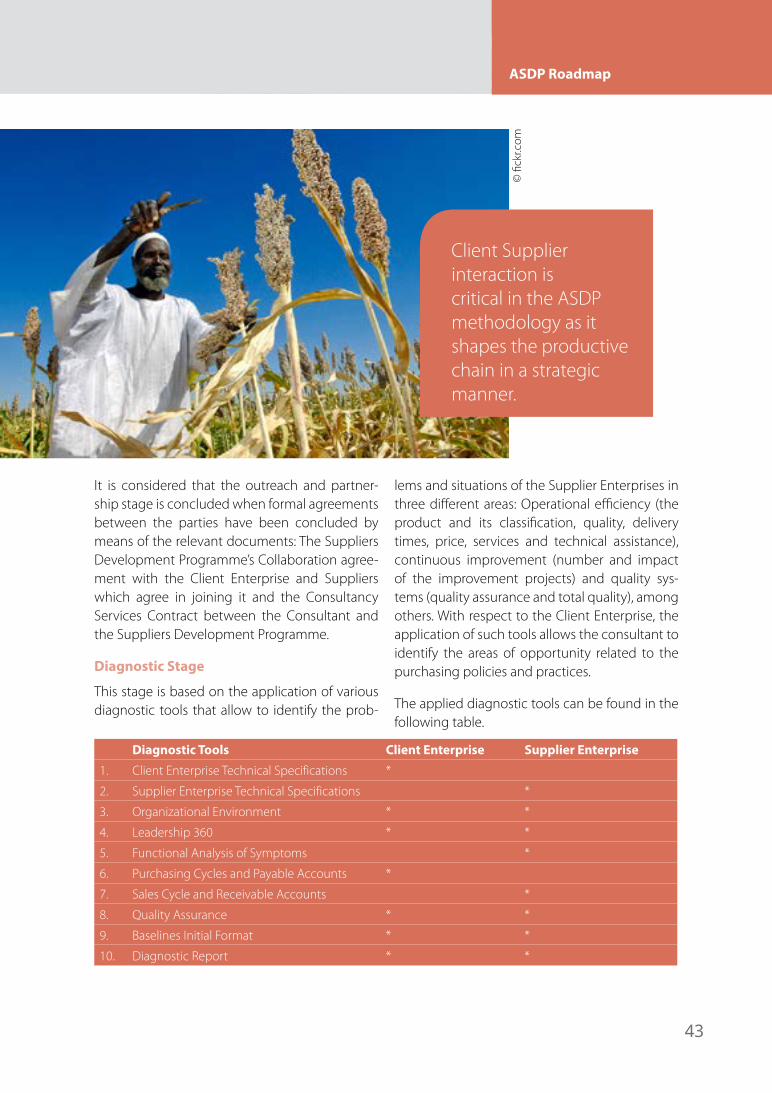
43
ASDP Roadmap
It is considered that the outreach and partner-ship stage is concluded when formal agreements between the parties have been concluded by means of the relevant documents: The Suppliers Development Programme’s Collaboration agree-ment with the Client Enterprise and Suppliers which agree in joining it and the Consultancy Services Contract between the Consultant and the Suppliers Development Programme.
Diagnostic Stage
This stage is based on the application of various diagnostic tools that allow to identify the prob-
lems and situations of the Supplier Enterprises in three different areas: Operational efficiency (the product and its classification, quality, delivery times, price, services and technical assistance), continuous improvement (number and impact of the improvement projects) and quality sys-tems (quality assurance and total quality), among others. With respect to the Client Enterprise, the application of such tools allows the consultant to identify the areas of opportunity related to the purchasing policies and practices.
The applied diagnostic tools can be found in the following table.
Diagnostic Tools Client Enterprise Supplier Enterprise
1. Client Enterprise Technical Specifications *
2. Supplier Enterprise Technical Specifications *
3. Organizational Environment * *
4. Leadership 360 * *
5. Functional Analysis of Symptoms *
6. Purchasing Cycles and Payable Accounts *
7. Sales Cycle and Receivable Accounts *
8. Quality Assurance * *
9. Baselines Initial Format * *
10. Diagnostic Report * *
Client Supplier interaction is critical in the ASDP methodology as it shapes the productive chain in a strategic manner.
© fi
ckr.c
om
44
3 African Agribusiness Supplier Development Programme (AASDP) Toolkit
Client-Supplier Interaction Stage
One of the most important stages in the whole Suppliers Development Programme methodolo-gy is the Client-Supplier Interaction. In this stage the bases are set for a new relationship between the parties that shape the productive chain in a strategic manner, based on assertive communi-cation and team work, seeking the solution to the existing problems and initiating a process of continuous improvement for both.
To achieve this, it is necessary to bring together the Client Enterprise with each of the Supplier Enterprises separately and follow a process di-rected by a trained facilitator (consultant). The process starts with the presentation of the partic-ipants, subsequently the objectives and the “rules of the game” for the meeting, and finally analyses the problems identified by both parties. For that the points below are discussed by the enterprises themselves, concluding with mutual agreements and commitments to improve.
Client Enterprise • Supplying problems preferably documented.• Initial qualification of each of the supplier en-
terprises by ESYSCe-SiECPro• Fulfilment of conditions for each of the prob-
lem areas• Effects that cause the existing problems• Stress of the assistants, generated by the exist-
ing problems
Supplier Enterprise
• Problems (preferably documented) with the Client Enterprise
• Exposition of the problems and feedback be-tween the Client Enterprise and the Supplier Enterprise
• Approach to the problem causes• Suggestions of solutions• Effects that cause the existing problems• At the end of the stage (Answers obtained
from the interactive meeting held by the Cli-ent Enterprise-Supplier Enterprise)
Client and Supplier Enterprise
• Targeted problems• Conclusions of the effects of the problems that
each enterprise causes to their counterparts• Shared causes• Explored or possible alternative solutions• Collaborative attitude between both parties• Identification of relevant actors involved in the
problem (concerning the work team)• Identification of possible improvement proj-
ects
Elaboration of the Improvement Plans Stage
The consultant will carry out the analysis and de-scription of the results obtained from the Diag-nostic as well as the Interaction stages.
The consultant will develop Improvement Plans for both the Client Enterprise and the Supplier Enterprise, which contain the prioritized prob-lems and their causes, strategies, tools, times and costs estimated by the consultant to resolve them, those responsible for carrying them out, the expected results and the estimated imple-mentation time. The Improvement Plans will be presented to the SDP leaders of each com-pany in order to get their feedback, rank the problems and determine the information that is unique to the respective company. The main improvement actions to be carried out by each
45
ASDP Roadmap
enterprise will be informed to the counterpart. After each enterprise has approved its Improve-ment Plan, they will proceed to signing them. Subsequently the consultant will look for cost and time purposes, the integration of common problems or recurring themes of various Supplier Enterprises, in order to handle them jointly.
Implementation and Follow-up Stage
It consists in executing the suggested, approved and hierarchical principal lines of action included in the Improvement Plans of each enterprise. It starts with the elaboration of a Master Work Plan which should include the factors, activities, risks, indicators and parameters in order to assure the success of the results. This Master Plan should be grounded with weekly work programmes. Sub-sequently there should be an effort to identify the Supplier Enterprises´ common problems in order to structure and organize a joint training and technical assistance programme. The former has the aim of reducing time and costs, which will allow the execution of a greater quantity of improvement plans.
In this stage meetings will be programmed with those Development Institutions that have supporting programmes that are useful for the SDP. The consultant will present briefly the ES-YSCe-SiECPro results, the approved interaction agreements and Improvement Plans, as well as the mechanic of the strategy contained in the Master Working Plan, the registered progress by this date in relation with the defined stages and needs of the enterprises related to training, tech-nical assistance and financing besides all those themes that do not fall in the previously men-tioned headings. Once these meetings are car-ried out, monitoring will be done on a monthly basis with the aim to register the progress of each enterprise, identify potential failures or delays and support the institutions that are intervening
in the enterprise, which may be the Client Enter-prise or the Supplier Enterprise.
With respect to the specific problems of each enterprise, at least three meetings of Interac-tion considered as part of the monitoring will be held. At the same time links are made with spe-cialized consultants or promotion and financial institutions, the participating personnel for the improvement action plans is selected, the Client is informed about the Improvement Plans to be realized and this is followed by the execution, su-pervision and follow up. This verification and fol-low-up task will be realized by the consultant in coordination with the project leaders of the par-ticipating enterprises and the personnel of the promoting institutions or specialized consultants. It is important to consider that from the second interaction meeting the duration of these meet-ings tends to diminish considerably, since a pre-viously established agenda is followed with these themes.
Documentation of the Intervention and Analysis of the Replicability Stage
In this stage, the baselines defined during the diagnosis with the indicators obtained at the end of the implementation and follow-up are compared. Subsequently analysis of the final re-sults is carried out, and with these, conclusions and suggestions for the replicability of the pro-cess are developed. A final report will be elabo-rated and delivered to each of the enterprises. Based on the obtained successful results of the SDP, the replicability proposal will be presented to the board of directors of the Client Enterprise.
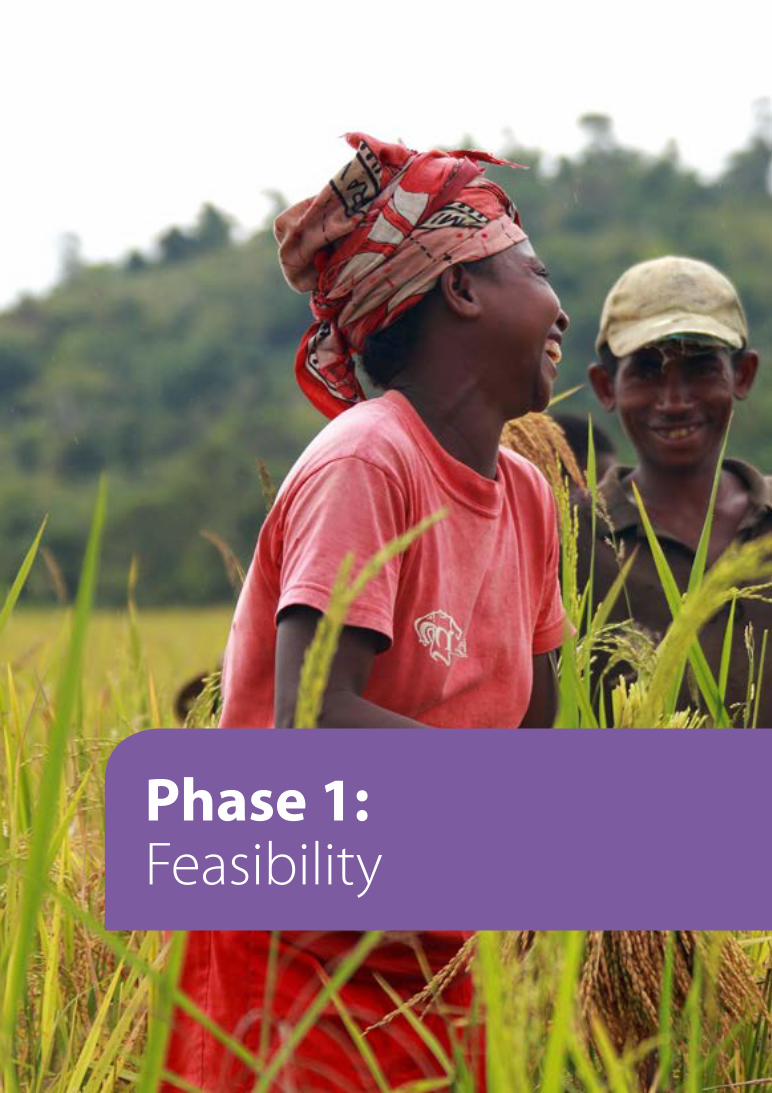
4. Phase 1: Feasibility
Phase 1: Feasibility
47
Phase 1: Feasibility
The objective of the Feasibility phase is to research the commitment and potential for setting up a country ASDP, and to start getting commitment from potential programme partners.
The Feasibility phase consists of three main activities:
1. Government consultations2. Identification and selection of commodity subsec-
tors3. Conducting a feasibility study for a country ASDP for
shortlisted subsectors
Milestones of the Feasibility phase are:
• Commitment from national government partners • Preselected potential subsectors in line with govern-
mental policies, UNDP objectives and pre-committed off-takers
• Roadmap for setting up a country ASDP
4.1 Government consultations
The aim of this activity is to discuss the objectives with government partners of UNDP and to align the pro-gramme with national policies for the agricultural as well as industrial sectors of the respective country.
As a major partner of UNDP, national governments should have ownership over and be committed to the ASDP Programme. This will provide the ASDP with the required legitimacy and institutional embedding of the programme.
Before engaging in the design of an ASDP, this commit-ment and legitimacy need to be ensured, this requires consultations with the relevant ministries and depart-ments, including those with a mandate to:
• Poverty alleviation and food security• Agricultural, livestock and rural development• Small and medium enterprise development• Private sector/ agribusiness development and invest-
ment• Trade
Phase 1: Feasibility 4
© IF
AD
The feasibility phase allows discussion on the rationale of an ASDP, fosters commitment from potential partners and explores the constraints and opportunities of developing the programme.
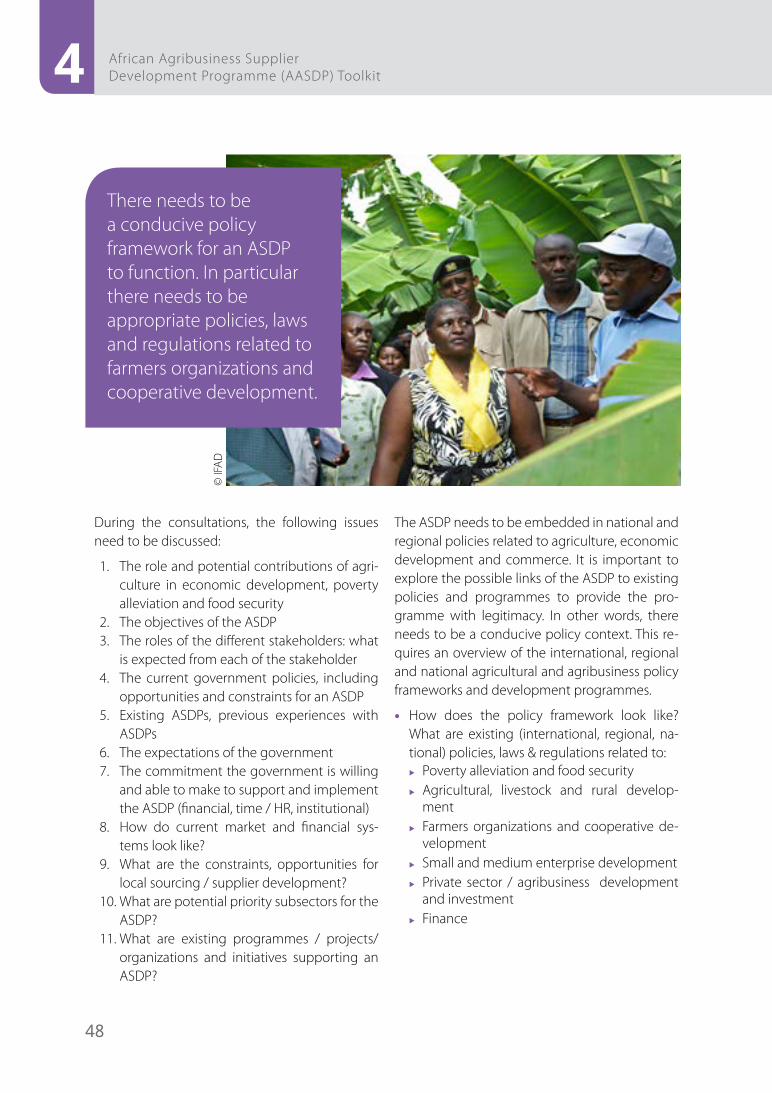
48
4 African Agribusiness Supplier Development Programme (AASDP) Toolkit
During the consultations, the following issues need to be discussed:
1. The role and potential contributions of agri-culture in economic development, poverty alleviation and food security
2. The objectives of the ASDP3. The roles of the different stakeholders: what
is expected from each of the stakeholder4. The current government policies, including
opportunities and constraints for an ASDP5. Existing ASDPs, previous experiences with
ASDPs6. The expectations of the government7. The commitment the government is willing
and able to make to support and implement the ASDP (financial, time / HR, institutional)
8. How do current market and financial sys-tems look like?
9. What are the constraints, opportunities for local sourcing / supplier development?
10. What are potential priority subsectors for the ASDP?
11. What are existing programmes / projects/ organizations and initiatives supporting an ASDP?
The ASDP needs to be embedded in national and regional policies related to agriculture, economic development and commerce. It is important to explore the possible links of the ASDP to existing policies and programmes to provide the pro-gramme with legitimacy. In other words, there needs to be a conducive policy context. This re-quires an overview of the international, regional and national agricultural and agribusiness policy frameworks and development programmes.
• How does the policy framework look like? What are existing (international, regional, na-tional) policies, laws & regulations related to:
u Poverty alleviation and food security u Agricultural, livestock and rural develop-
ment u Farmers organizations and cooperative de-
velopment u Small and medium enterprise development u Private sector / agribusiness development
and investment u Finance
There needs to be a conducive policy framework for an ASDP to function. In particular there needs to be appropriate policies, laws and regulations related to farmers organizations and cooperative development.
© IF
AD
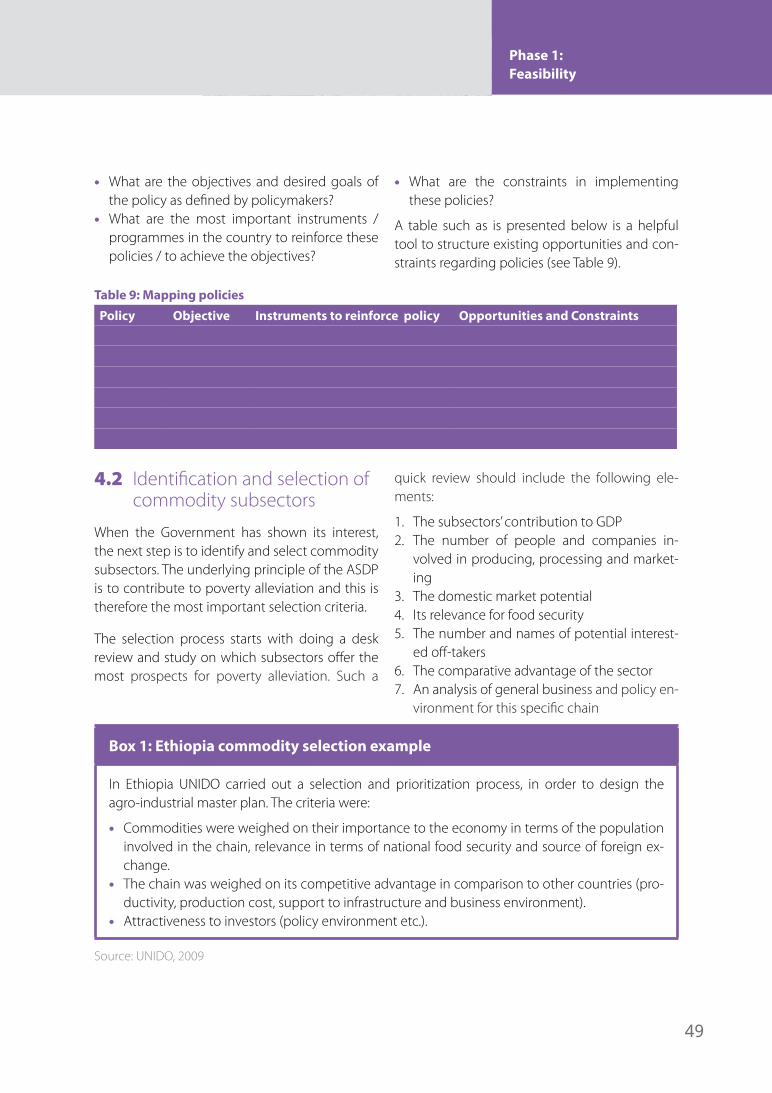
49
Phase 1: Feasibility
• What are the objectives and desired goals of the policy as defined by policymakers?
• What are the most important instruments / programmes in the country to reinforce these policies / to achieve the objectives?
• What are the constraints in implementing these policies?
A table such as is presented below is a helpful tool to structure existing opportunities and con-straints regarding policies (see Table 9).
Table 9: Mapping policies
Policy Objective Instruments to reinforce policy Opportunities and Constraints
4.2 Identification and selection of commodity subsectors
When the Government has shown its interest, the next step is to identify and select commodity subsectors. The underlying principle of the ASDP is to contribute to poverty alleviation and this is therefore the most important selection criteria.
The selection process starts with doing a desk review and study on which subsectors offer the most prospects for poverty alleviation. Such a
quick review should include the following ele-ments:
1. The subsectors’ contribution to GDP2. The number of people and companies in-
volved in producing, processing and market-ing
3. The domestic market potential4. Its relevance for food security5. The number and names of potential interest-
ed off-takers6. The comparative advantage of the sector7. An analysis of general business and policy en-
vironment for this specific chain
Box 1: Ethiopia commodity selection example
In Ethiopia UNIDO carried out a selection and prioritization process, in order to design the agro-industrial master plan. The criteria were:
• Commodities were weighed on their importance to the economy in terms of the population involved in the chain, relevance in terms of national food security and source of foreign ex-change.
• The chain was weighed on its competitive advantage in comparison to other countries (pro-ductivity, production cost, support to infrastructure and business environment).
• Attractiveness to investors (policy environment etc.).
Source: UNIDO, 2009
50
4 African Agribusiness Supplier Development Programme (AASDP) Toolkit
After this quick review the choice has to be re-fined. Criteria need to be identified that indicate poverty alleviation in the specific context. Three factors indicate the extent to which a market can be considered as important to the poor, these are:
1. Poverty reduction potential 2. Pro-poor access or growth potential 3. Leverage potential
The first two factors assess the number of poor that can be involved in a market. Can the sub-sector create employment opportunities? Or do products serve the needs of the poor? How does this chain contribute to poverty reduction? The third factor considers the role of this market in leveraging inclusive growth. Even if a subsector is not able to involve large numbers of poor, it might have an indirect impact on markets that do include many poor (UNDP, 2010A).
Examples of pro-poor assessment criteria are (UNIDO, 2009):
• How does the subsector fit within the Govern-ment’s overall strategy for poverty reduction?
• Is the incidence of poverty in the targeted geo-graphic area high (number of poor people)?
• What is the subsector potential for employ-ment generation, for example, through partic-ipation in product markets and / or labour-in-tensive manufacturing industries?
• What would be the required start-up costs – are subsectors requiring high investments and able to employ low-tech skills?
• What would be the impact of the subsector on the rural economy – diversification of incomes; jobs for women; local processing of raw mate-rials, etc.?
• What would be the risks and threats of pro-moting the selected subsector, including the replacement of unskilled workforce and the environmental sustainability aspect?
Other criteria that relate to economic growth and reflect a pragmatic approach to a sustained de-velopment of subsectors will include:
• What is the potential domestic and / or inter-national demand for a particular product?
• What are the production costs in comparison to those of competitors – benchmarking and competitiveness factors?
• What are the prospects for attracting public and / or private investments?
• Are the available resources in-line with the number of operators involved in the subsec-tor?
• What is the potential for local SMEs (including informal suppliers) to be integrated in regional / international markets?
• What is the situation with regards to existing infrastructure, financial and non-financial busi-ness services, availability and accessibility of raw materials and other inputs?
• What is the level of skills of the labour force and management in the sector?
• How may the selected chain affect / promote policy changes – creating an enabling envi-ronment for private sector development?
• Are there complementarities with other proj-ects in the region / country and is there poten-tial for scaling-up?
Finally, the list should include selection criteria that assess environmental sustainability such as for instance:• Positive / negative effects on the availability of
natural resources• Positive / negative effects on water quality and
quantity• Positive / negative effects on air quality• Positive / negative effects on biodiversity• Climate change
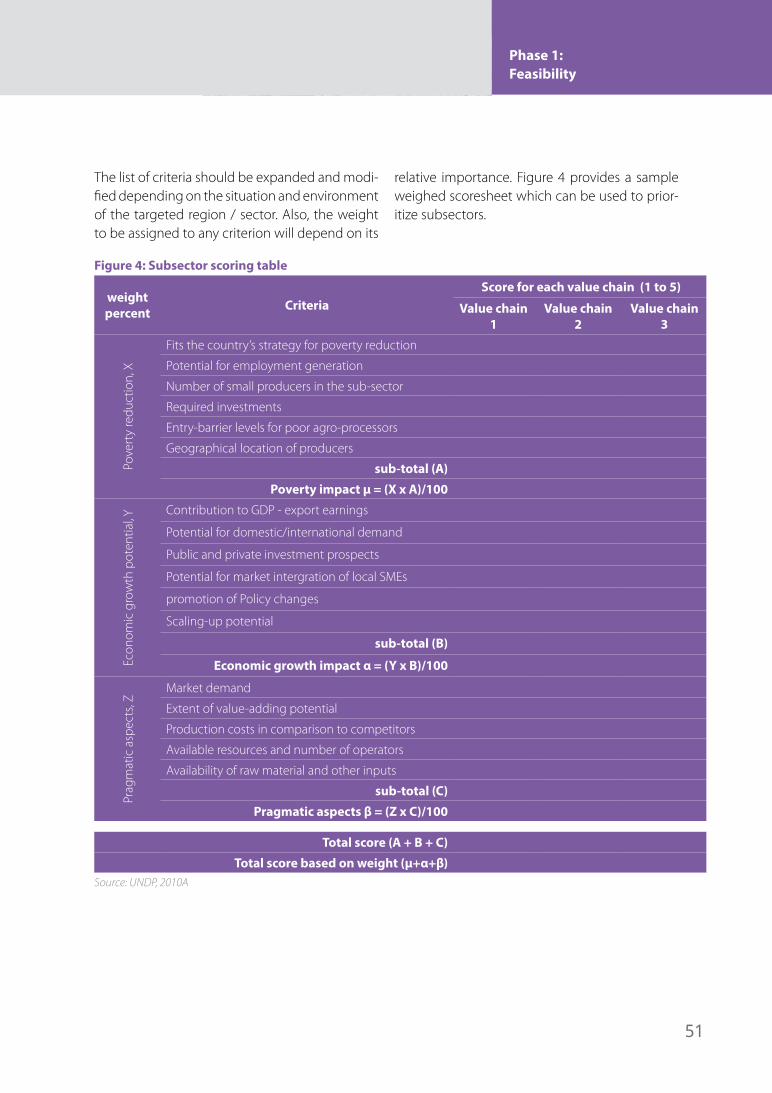
51
Phase 1: Feasibility
The list of criteria should be expanded and modi-fied depending on the situation and environment of the targeted region / sector. Also, the weight to be assigned to any criterion will depend on its
relative importance. Figure 4 provides a sample weighed scoresheet which can be used to prior-itize subsectors.
Figure 4: Subsector scoring table
weight percent Criteria
Score for each value chain (1 to 5)
Value chain 1
Value chain 2
Value chain 3
Pove
rty
redu
ctio
n, X
Fits the country’s strategy for poverty reduction
Potential for employment generation
Number of small producers in the sub-sector
Required investments
Entry-barrier levels for poor agro-processors
Geographical location of producers
sub-total (A)
Poverty impact μ = (X x A)/100
Econ
omic
gro
wth
pot
entia
l, Y
Contribution to GDP - export earnings
Potential for domestic/international demand
Public and private investment prospects
Potential for market intergration of local SMEs
promotion of Policy changes
Scaling-up potential
sub-total (B)
Economic growth impact α = (Y x B)/100
Prag
mat
ic a
spec
ts, Z
Market demand
Extent of value-adding potential
Production costs in comparison to competitors
Available resources and number of operators
Availability of raw material and other inputs
sub-total (C)
Pragmatic aspects β = (Z x C)/100
Total score (A + B + C)
Total score based on weight (μ+α+β)Source: UNDP, 2010A
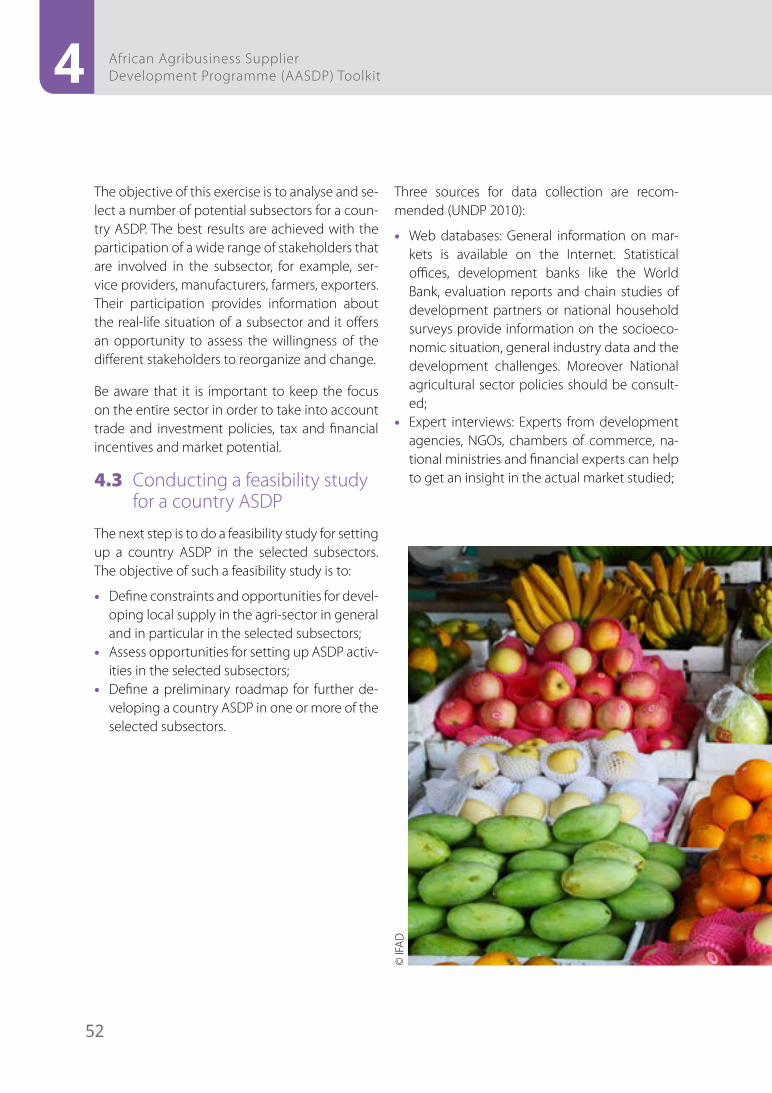
52
4 African Agribusiness Supplier Development Programme (AASDP) Toolkit
The objective of this exercise is to analyse and se-lect a number of potential subsectors for a coun-try ASDP. The best results are achieved with the participation of a wide range of stakeholders that are involved in the subsector, for example, ser-vice providers, manufacturers, farmers, exporters. Their participation provides information about the real-life situation of a subsector and it offers an opportunity to assess the willingness of the different stakeholders to reorganize and change.
Be aware that it is important to keep the focus on the entire sector in order to take into account trade and investment policies, tax and financial incentives and market potential.
4.3 Conducting a feasibility study for a country ASDP
The next step is to do a feasibility study for setting up a country ASDP in the selected subsectors. The objective of such a feasibility study is to:
• Define constraints and opportunities for devel-oping local supply in the agri-sector in general and in particular in the selected subsectors;
• Assess opportunities for setting up ASDP activ-ities in the selected subsectors;
• Define a preliminary roadmap for further de-veloping a country ASDP in one or more of the selected subsectors.
Three sources for data collection are recom-mended (UNDP 2010):
• Web databases: General information on mar-kets is available on the Internet. Statistical offices, development banks like the World Bank, evaluation reports and chain studies of development partners or national household surveys provide information on the socioeco-nomic situation, general industry data and the development challenges. Moreover National agricultural sector policies should be consult-ed;
• Expert interviews: Experts from development agencies, NGOs, chambers of commerce, na-tional ministries and financial experts can help to get an insight in the actual market studied;
© IF
AD
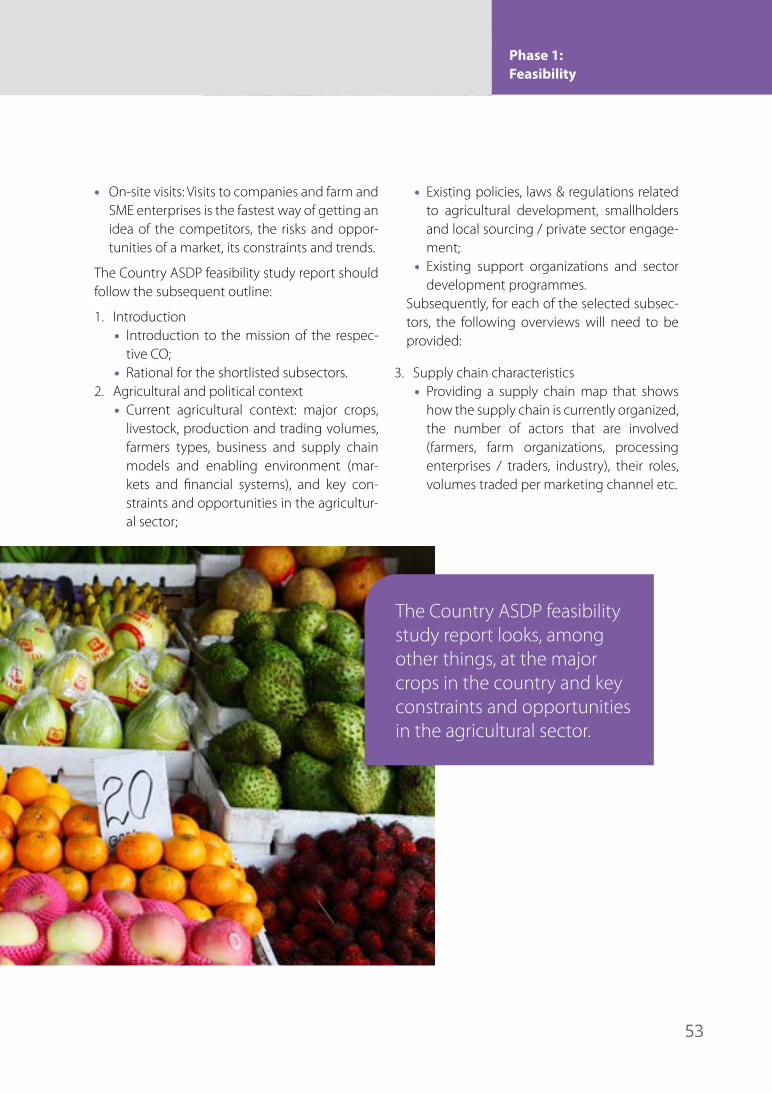
53
Phase 1: Feasibility
• On-site visits: Visits to companies and farm and SME enterprises is the fastest way of getting an idea of the competitors, the risks and oppor-tunities of a market, its constraints and trends.
The Country ASDP feasibility study report should follow the subsequent outline:
1. Introduction• Introduction to the mission of the respec-
tive CO; • Rational for the shortlisted subsectors.
2. Agricultural and political context• Current agricultural context: major crops,
livestock, production and trading volumes, farmers types, business and supply chain models and enabling environment (mar-kets and financial systems), and key con-straints and opportunities in the agricultur-al sector;
• Existing policies, laws & regulations related to agricultural development, smallholders and local sourcing / private sector engage-ment;
• Existing support organizations and sector development programmes.
Subsequently, for each of the selected subsec-tors, the following overviews will need to be provided:
3. Supply chain characteristics• Providing a supply chain map that shows
how the supply chain is currently organized, the number of actors that are involved (farmers, farm organizations, processing enterprises / traders, industry), their roles, volumes traded per marketing channel etc.
The Country ASDP feasibility study report looks, among other things, at the major crops in the country and key constraints and opportunities in the agricultural sector.
54
4 African Agribusiness Supplier Development Programme (AASDP) Toolkit
4. Supply chain demand amongst off-takers• What are potential ASDP candidate off-tak-
ers?• What are the off-taker’s current practices re-
lated to (local) sourcing? (Description of de-mand from off-taker in terms of commod-ities, volumes, quality, timely delivery etc.)
• What constraints and opportunities does the off-taker experience related to local sourcing from smallholders and SMEs? (meeting demand (quality, volumes, tim-ing) interaction with suppliers, contracting, financing, infrastructure, interaction with government, etc.)
• What support is already available for the off-taker to set up supply from smallholders and / or SMEs? E.g. from government agen-cies but also service providers, including NGO programmes and other multilateral organizations including UN?
• Opportunities for a UNDP ASDP.5. Suppliers constraints and opportunities
• Description of current suppliers: Who are the current or potential smallholder sup-pliers? What are their characteristics? (num-ber, organizational structures, production volumes, quality, income and livelihoods, gender, crops important for food security)
• What are the constraints and opportuni-ties for smallholder producers to engage in supplying to off-takers? (in terms of infra-structure, production practices, knowledge, organization and social networks, access to (financial) services, policies etc.)
• What support do smallholder producers al-ready receive in order to supply to off-tak-ers? E.g. from government agencies, but also service providers, including NGO pro-grammes and other multilateral organiza-tions including UN?
6. Preliminary roadmap for a country ASDP• What is the development potential for a
country ASDP?• What is the recommended framework: in-
cluding objectives, framework, activities, potential implementing partner and other stakeholders, budget and potential fund-ing.
7. Potential impact • What is the potential impact of the ASDP in
terms of: u Potential number of smallholders in-
volved in key commodities u Potential number of SMEs involved u Potential volumes to be traded (market
security) u Potential income growth for smallholders
and SMEs u Potential additional improvements of
livelihoods in terms of organization, knowledge, hardware, vulnerability etc.
u Potential job creation
The roadmap leads the UNDP CO towards the start of an ASDP (see next phase).
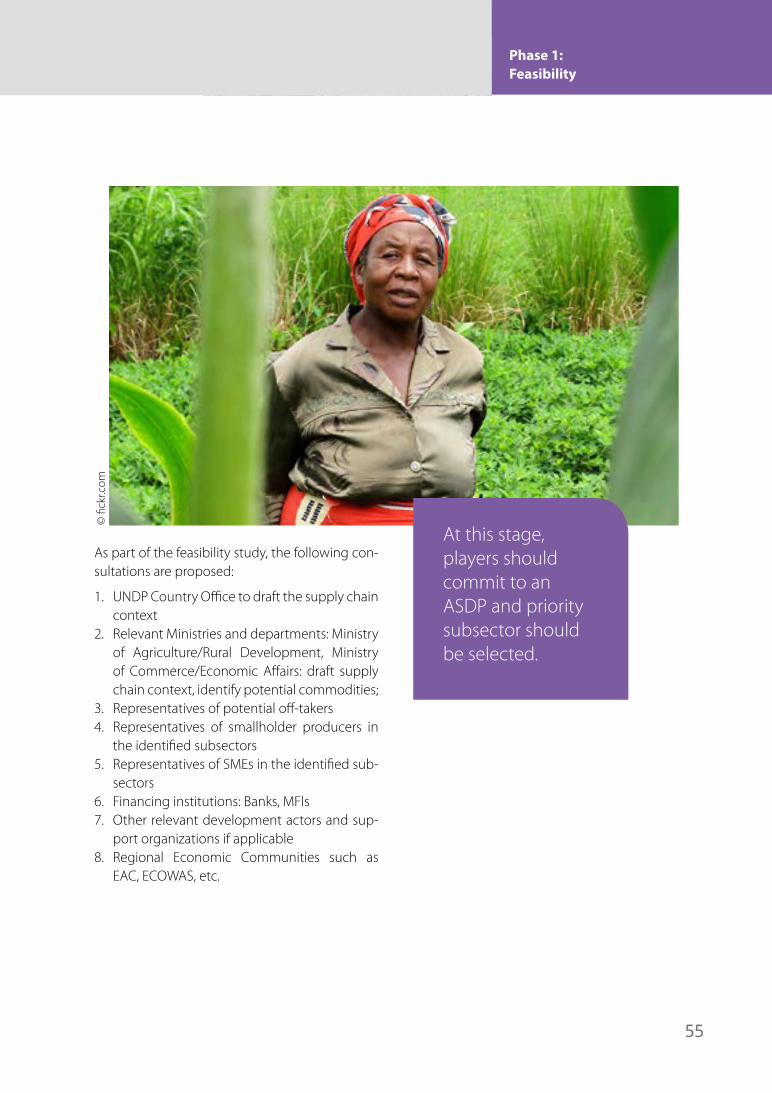
55
Phase 1: Feasibility
As part of the feasibility study, the following con-sultations are proposed:
1. UNDP Country Office to draft the supply chain context
2. Relevant Ministries and departments: Ministry of Agriculture/Rural Development, Ministry of Commerce/Economic Affairs: draft supply chain context, identify potential commodities;
3. Representatives of potential off-takers4. Representatives of smallholder producers in
the identified subsectors5. Representatives of SMEs in the identified sub-
sectors6. Financing institutions: Banks, MFIs7. Other relevant development actors and sup-
port organizations if applicable8. Regional Economic Communities such as
EAC, ECOWAS, etc.
At this stage, players should commit to an ASDP and priority subsector should be selected.
© fi
ckr.c
om
5. Phase 2: Program preparations
Phase 2: Program Preparations
57
Phase 2: Program preparations
Once the Feasibility phase is completed and the UNDP CO has decided to do an ASDP, a comprehensive pro-gramme needs to be prepared. The objective of the preparation phase is to ensure that all ingredients for starting the ASDP programme are in place and the pro-gramme is ready to start.
The preparation phase includes to:
• Develop a programme document and strategy• Select an implementing partner• Develop programme systems• Train and select supply chain consultants• Commit partners
Milestones of the preparation phase are:
• National ASDP programme plan in place• Implementing partner in place • Adapted information system and related training
materials in place• Base of trained supply chain consultants• Commitment of off-takers and other key partners
5.1 Develop a programme document and strategy
A consultant with in-depth knowledge in the subject matter can be hired to help develop the ASDP. The plan to be developed should among other things define short, medium and long-term objectives, the business model / strategy, key activities, organization, potential impact and required budget as well as the basis for an M&E and impact measurement system. Incentives for the off-takers and suppliers, such as those that came out of the Feasibility phase, should play a central role in the programme development.
The Logical Framework is the backbone of the pro-gramme and programme document. It should clearly align the programme objectives with the overarching UNDP goals of increasing income and reducing pover-ty of small-scale farmers. Suggestions for M&E indica-tors are presented in the M&E section.
The Logical Framework is the backbone of the programme and programme document. It should clearly align the programme objectives with the overarching UNDP goals of increasing income and reducing poverty of small-scale farmers.
Phase 2: Program Preparations 5
© IF
AD
58
5 African Agribusiness Supplier Development Programme (AASDP) Toolkit
5.2 Select an implementing partner
SDP programmes in Latin America are imple-mented by a variety of organizations. Some UNDP COs do the implementation themselves (UNDP Colombia), while others choose to work through government agencies e.g. the Chamber of Commerce, the Department of industry or the Department of agriculture. Unless in post-con-flict areas, in Africa it will be unlikely that COs will do the implementation of an ASDP. Before out-sourcing the implementation of the programme, however, it is important for the CO to ask what additional knowledge, expertise and above all capacity is needed for the programme imple-mentation to be successful.
Capacities of potential external implementing agencies should be assessed. The implementing partner should be able to carry out the following tasks along the 7 programme phases (Table 10):
Recommended skills for the implementing part-ner therefore include:
• Project management skills: including planning, M&E, logistics, reporting, budgeting, human resources
• Contents knowledge on supply chain devel-opment
The implementing ASDP team typically consists of 4 functions including:
• Programme director: being overall responsible for achieving promised outputs and outcomes within budgets
• Supply chain development expert: coordinat-ing and steering the implementation of the programme’s activities
• Accountant: managing financial flows• Programme Assistant (administration and lo-
gistics): organizing logistics, relation manage-ment etc.
Box 2: Outline of the Programme Document
• Programme Summary• Introduction and background of the programme
u Brief introduction to the programme u Background information on the country’s agricultural sector: constraints and opportunities
• Consistency with the development strategy and policies• Partners in the programme• Objectives and rationale• Potential impact• Implementation strategy• Exit strategy• Logical Framework and annual work plans• Costs and financing• Organization and management• M&E systems and learning• Risks
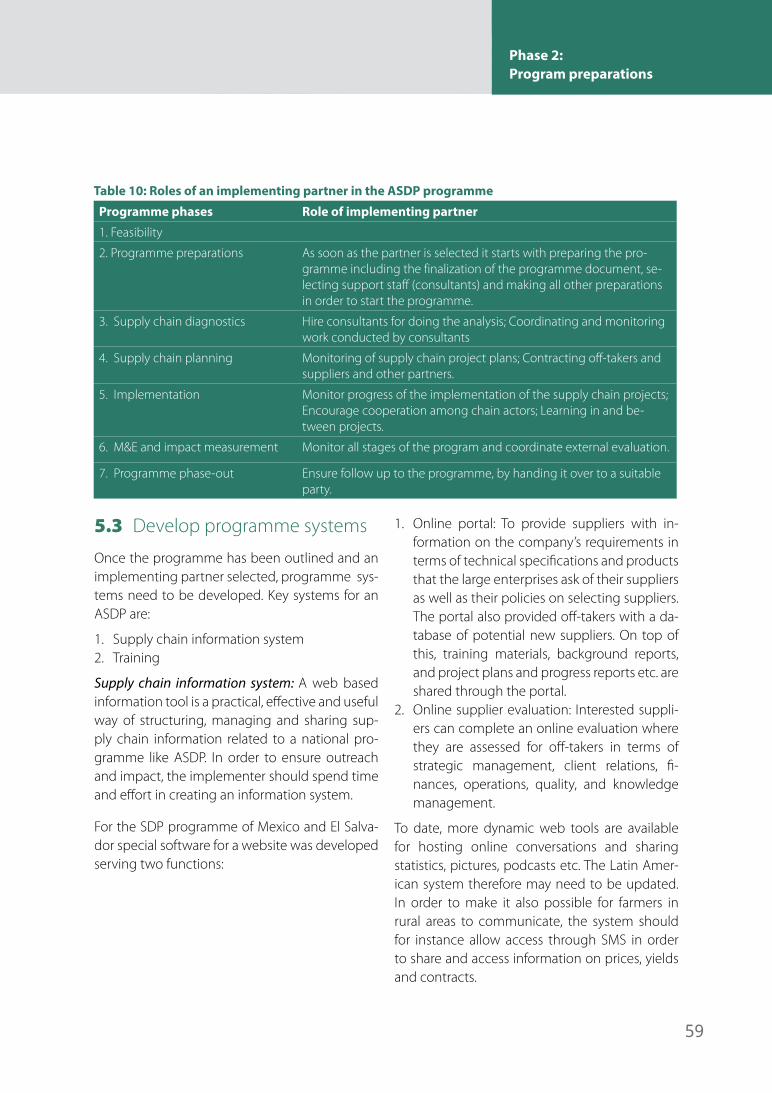
59
Phase 2: Program preparations
5.3 Develop programme systems
Once the programme has been outlined and an implementing partner selected, programme sys-tems need to be developed. Key systems for an ASDP are:
1. Supply chain information system2. Training
Supply chain information system: A web based information tool is a practical, effective and useful way of structuring, managing and sharing sup-ply chain information related to a national pro-gramme like ASDP. In order to ensure outreach and impact, the implementer should spend time and effort in creating an information system.
For the SDP programme of Mexico and El Salva-dor special software for a website was developed serving two functions:
1. Online portal: To provide suppliers with in-formation on the company’s requirements in terms of technical specifications and products that the large enterprises ask of their suppliers as well as their policies on selecting suppliers. The portal also provided off-takers with a da-tabase of potential new suppliers. On top of this, training materials, background reports, and project plans and progress reports etc. are shared through the portal.
2. Online supplier evaluation: Interested suppli-ers can complete an online evaluation where they are assessed for off-takers in terms of strategic management, client relations, fi-nances, operations, quality, and knowledge management.
To date, more dynamic web tools are available for hosting online conversations and sharing statistics, pictures, podcasts etc. The Latin Amer-ican system therefore may need to be updated. In order to make it also possible for farmers in rural areas to communicate, the system should for instance allow access through SMS in order to share and access information on prices, yields and contracts.
Table 10: Roles of an implementing partner in the ASDP programme
Programme phases Role of implementing partner
1. Feasibility
2. Programme preparations As soon as the partner is selected it starts with preparing the pro-gramme including the finalization of the programme document, se-lecting support staff (consultants) and making all other preparations in order to start the programme.
3. Supply chain diagnostics Hire consultants for doing the analysis; Coordinating and monitoring work conducted by consultants
4. Supply chain planning Monitoring of supply chain project plans; Contracting off-takers and suppliers and other partners.
5. Implementation Monitor progress of the implementation of the supply chain projects; Encourage cooperation among chain actors; Learning in and be-tween projects.
6. M&E and impact measurement Monitor all stages of the program and coordinate external evaluation.
7. Programme phase-out Ensure follow up to the programme, by handing it over to a suitable party.
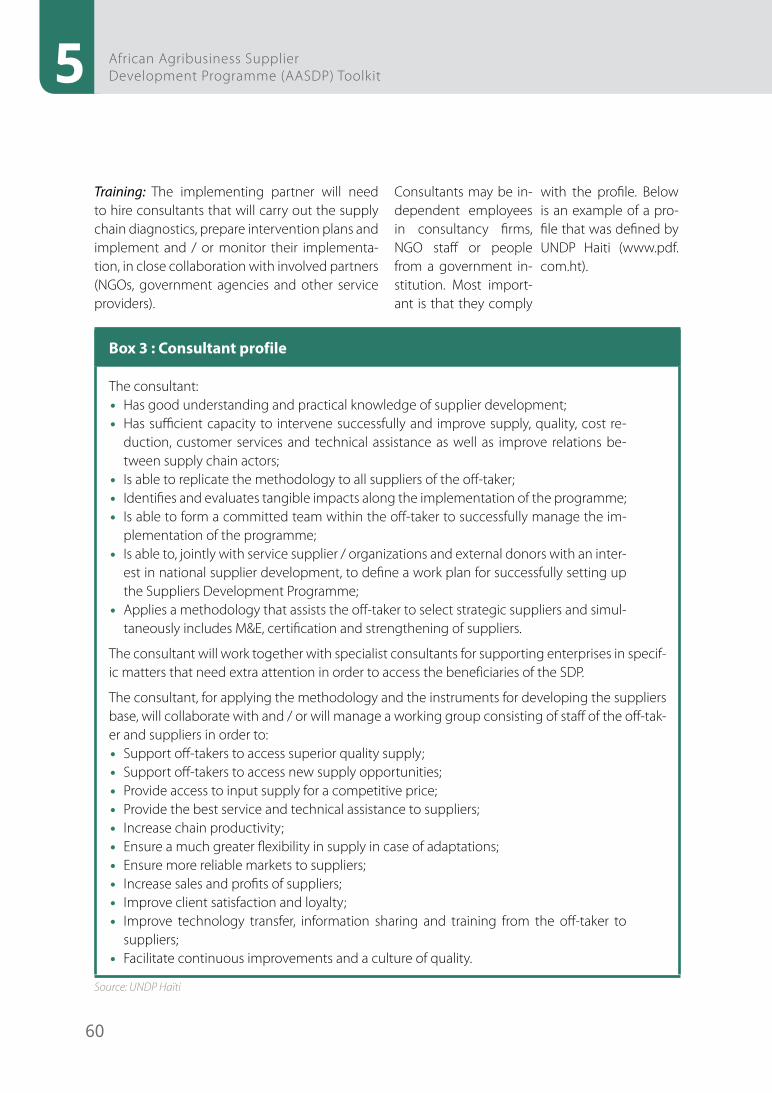
60
5 African Agribusiness Supplier Development Programme (AASDP) Toolkit
Training: The implementing partner will need to hire consultants that will carry out the supply chain diagnostics, prepare intervention plans and implement and / or monitor their implementa-tion, in close collaboration with involved partners (NGOs, government agencies and other service providers).
Consultants may be in-dependent employees in consultancy firms, NGO staff or people from a government in-stitution. Most import-ant is that they comply
with the profile. Below is an example of a pro-file that was defined by UNDP Haiti (www.pdf.com.ht).
Box 3 : Consultant profile
The consultant:• Has good understanding and practical knowledge of supplier development;• Has sufficient capacity to intervene successfully and improve supply, quality, cost re-
duction, customer services and technical assistance as well as improve relations be-tween supply chain actors;
• Is able to replicate the methodology to all suppliers of the off-taker;• Identifies and evaluates tangible impacts along the implementation of the programme;• Is able to form a committed team within the off-taker to successfully manage the im-
plementation of the programme;• Is able to, jointly with service supplier / organizations and external donors with an inter-
est in national supplier development, to define a work plan for successfully setting up the Suppliers Development Programme;
• Applies a methodology that assists the off-taker to select strategic suppliers and simul-taneously includes M&E, certification and strengthening of suppliers.
The consultant will work together with specialist consultants for supporting enterprises in specif-ic matters that need extra attention in order to access the beneficiaries of the SDP.
The consultant, for applying the methodology and the instruments for developing the suppliers base, will collaborate with and / or will manage a working group consisting of staff of the off-tak-er and suppliers in order to: • Support off-takers to access superior quality supply;• Support off-takers to access new supply opportunities;• Provide access to input supply for a competitive price;• Provide the best service and technical assistance to suppliers;• Increase chain productivity;• Ensure a much greater flexibility in supply in case of adaptations;• Ensure more reliable markets to suppliers;• Increase sales and profits of suppliers;• Improve client satisfaction and loyalty;• Improve technology transfer, information sharing and training from the off-taker to
suppliers;• Facilitate continuous improvements and a culture of quality.
Source: UNDP Haïti
61
Phase 2: Program preparations
The course that was used to train consultants for the SDP in El Salvador is a combination of live teachings and online-learning. During a time-line of approximately 4 months, the consultants are trained in the Methodology for Supplier De-velopment. Moreover they enhance their skills in planning, market intelligence, and quality as-sessments. During the classes they also receive presentations of organizations and national and international programmes that offer technical and financial assistance to suppliers (small pro-ducers and SMEs). The virtual support guarantees the continuation of learning in the classes by exercises and information exchange via a discus-sion forum and a chat portal. It provides a plat-form where teachers can give online classes to a group of students that access it at the same time. The website furthermore, offers links to interest-ing websites and a storage facility for useful tools and training material. Consultants need to pay a small fee for attending the training. Only the con-sultants that pass the training can be hired for coordinating SDP projects. For each upcoming SDP project, the most suitable consultants, with experience in the respective sector, would be se-lected.
In addition to the SDP project consultants, it is recommended to build up a network with spe-cialist consultants for providing applied advice depending on the constraints that need to be solved in SDP projects. This could be for instance people with a background in agricultural produc-tion, quality management, cooperative training, inputs supply or finance.
For the African ASDP programme the pool of consultants should include agribusiness and also extension experts. Also the training materi-al should be adapted to the required knowledge for dealing with agri supply chain constraints and opportunities.
5.4 Commit partners
The African ASDP is different from the Lat-in American SDP where outreach activities to off-takers are concerned. In the African ASDPs it is recommended to select lead firms based on the opportunities of the selected subsectors chains. Therefore, already, in the feasibility stage the potential off-takers need to be clear. Rather than doing a random outreach, in the prepara-tion phase, off-takers and related relevant part-ners should be formally approached in order to get their full commitments. This is most effective by means of preparing tailor-made presentations and workshops, based on the training material for this tool book.
Companies that want to join the ASDP should re-flect on whether they are up to participating in the programme. Participation requires a respon-sibility both towards the implementing party as well as to the suppliers involved in the pro-gramme. An off-taker can assess their own needs for local supply, through the self-assessment tool that was developed by IFC (IFC, 2011) (see Figure 5 below). It is a profound assessment of both the hard and software of a company, meaning that it helps to reflect on questions like: is there a local sourcing policy? How does the off-taker contract local companies? Do employees have discus-sions about local sourcing and is there one per-son responsible to support it? For the questions related to the tool, please see Annex 1.
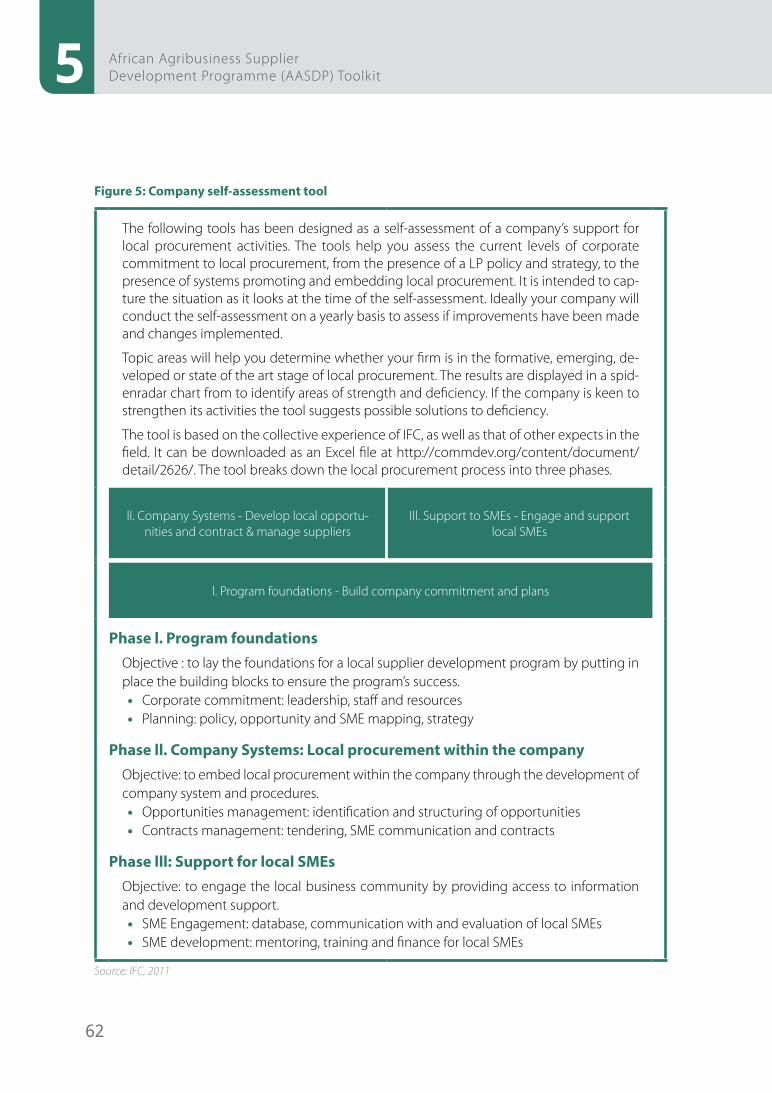
62
5 African Agribusiness Supplier Development Programme (AASDP) Toolkit
Figure 5: Company self-assessment tool
The following tools has been designed as a self-assessment of a company’s support for local procurement activities. The tools help you assess the current levels of corporate commitment to local procurement, from the presence of a LP policy and strategy, to the presence of systems promoting and embedding local procurement. It is intended to cap-ture the situation as it looks at the time of the self-assessment. Ideally your company will conduct the self-assessment on a yearly basis to assess if improvements have been made and changes implemented.
Topic areas will help you determine whether your firm is in the formative, emerging, de-veloped or state of the art stage of local procurement. The results are displayed in a spid-enradar chart from to identify areas of strength and deficiency. If the company is keen to strengthen its activities the tool suggests possible solutions to deficiency.
The tool is based on the collective experience of IFC, as well as that of other expects in the field. It can be downloaded as an Excel file at http://commdev.org/content/document/detail/2626/. The tool breaks down the local procurement process into three phases.
ll. Company Systems - Develop local opportu-nities and contract & manage suppliers
Ill. Support to SMEs - Engage and support local SMEs
l. Program foundations - Build company commitment and plans
Phase l. Program foundationsObjective : to lay the foundations for a local supplier development program by putting in place the building blocks to ensure the program’s success.• Corporate commitment: leadership, staff and resources• Planning: policy, opportunity and SME mapping, strategy
Phase ll. Company Systems: Local procurement within the company Objective: to embed local procurement within the company through the development of company system and procedures.• Opportunities management: identification and structuring of opportunities• Contracts management: tendering, SME communication and contracts
Phase lll: Support for local SMEsObjective: to engage the local business community by providing access to information and development support.• SME Engagement: database, communication with and evaluation of local SMEs• SME development: mentoring, training and finance for local SMEs
Source: IFC, 2011
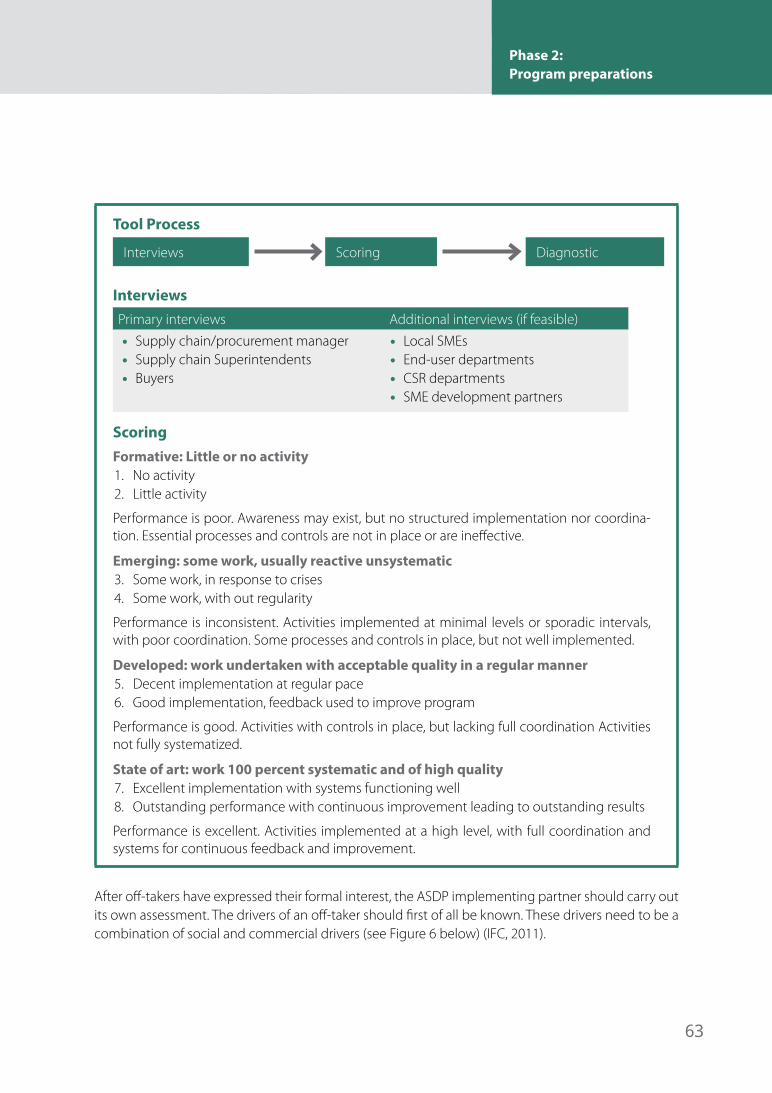
63
Phase 2: Program preparations
Tool Process
Interviews Scoring Diagnostic
InterviewsPrimary interviews Additional interviews (if feasible)• Supply chain/procurement manager• Supply chain Superintendents• Buyers
• Local SMEs• End-user departments• CSR departments• SME development partners
ScoringFormative: Little or no activity1. No activity2. Little activity
Performance is poor. Awareness may exist, but no structured implementation nor coordina-tion. Essential processes and controls are not in place or are ineffective.
Emerging: some work, usually reactive unsystematic3. Some work, in response to crises4. Some work, with out regularity
Performance is inconsistent. Activities implemented at minimal levels or sporadic intervals, with poor coordination. Some processes and controls in place, but not well implemented.
Developed: work undertaken with acceptable quality in a regular manner5. Decent implementation at regular pace6. Good implementation, feedback used to improve program
Performance is good. Activities with controls in place, but lacking full coordination Activities not fully systematized.
State of art: work 100 percent systematic and of high quality7. Excellent implementation with systems functioning well8. Outstanding performance with continuous improvement leading to outstanding results
Performance is excellent. Activities implemented at a high level, with full coordination and systems for continuous feedback and improvement.
After off-takers have expressed their formal interest, the ASDP implementing partner should carry out its own assessment. The drivers of an off-taker should first of all be known. These drivers need to be a combination of social and commercial drivers (see Figure 6 below) (IFC, 2011).
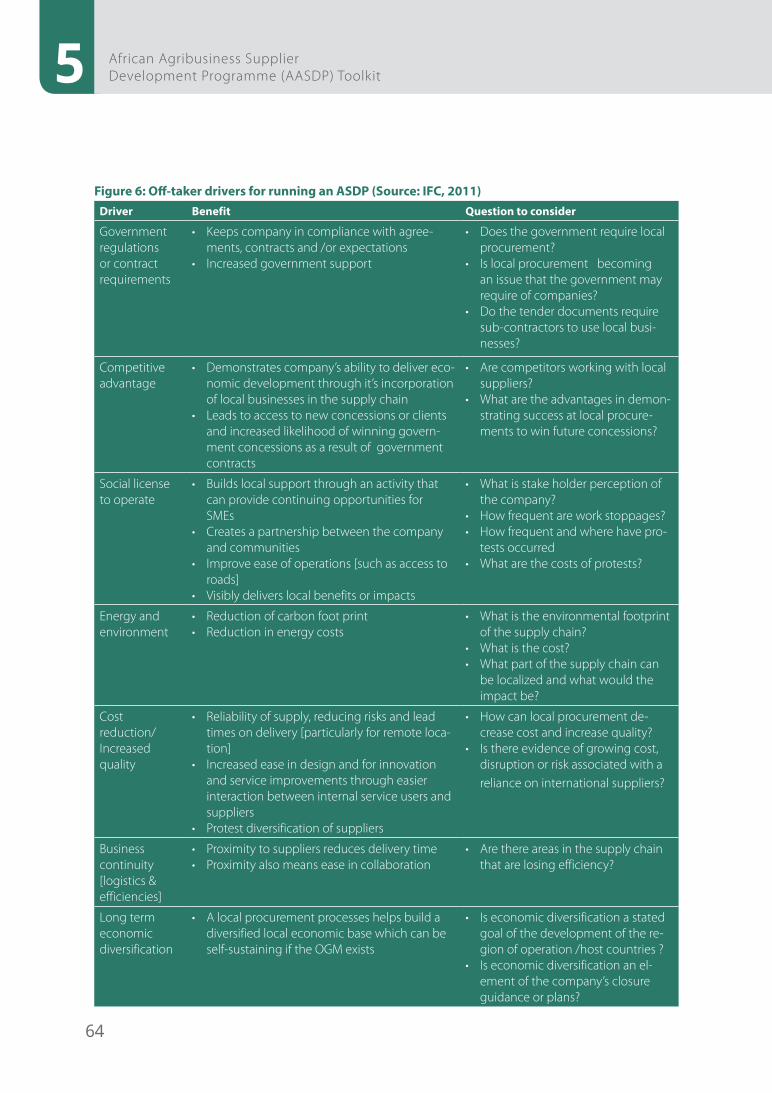
64
5 African Agribusiness Supplier Development Programme (AASDP) Toolkit
Figure 6: Off-taker drivers for running an ASDP (Source: IFC, 2011)Driver Benefit Question to consider
Government regulations or contract requirements
• Keeps company in compliance with agree-ments, contracts and /or expectations
• Increased government support
• Does the government require local procurement?
• Is local procurement becoming an issue that the government may require of companies?
• Do the tender documents require sub-contractors to use local busi-nesses?
Competitive advantage
• Demonstrates company’s ability to deliver eco-nomic development through it’s incorporation of local businesses in the supply chain
• Leads to access to new concessions or clients and increased likelihood of winning govern-ment concessions as a result of government contracts
• Are competitors working with local suppliers?
• What are the advantages in demon-strating success at local procure-ments to win future concessions?
Social license to operate
• Builds local support through an activity that can provide continuing opportunities for SMEs
• Creates a partnership between the company and communities
• Improve ease of operations [such as access to roads]
• Visibly delivers local benefits or impacts
• What is stake holder perception of the company?
• How frequent are work stoppages?• How frequent and where have pro-
tests occurred • What are the costs of protests?
Energy and environment
• Reduction of carbon foot print • Reduction in energy costs
• What is the environmental footprint of the supply chain?
• What is the cost?• What part of the supply chain can
be localized and what would the impact be?
Cost reduction/Increased quality
• Reliability of supply, reducing risks and lead times on delivery [particularly for remote loca-tion]
• Increased ease in design and for innovation and service improvements through easier interaction between internal service users and suppliers
• Protest diversification of suppliers
• How can local procurement de-crease cost and increase quality?
• Is there evidence of growing cost, disruption or risk associated with a reliance on international suppliers?
Business continuity [logistics & efficiencies]
• Proximity to suppliers reduces delivery time • Proximity also means ease in collaboration
• Are there areas in the supply chain that are losing efficiency?
Long term economic diversification
• A local procurement processes helps build a diversified local economic base which can be self-sustaining if the OGM exists
• Is economic diversification a stated goal of the development of the re-gion of operation /host countries ?
• Is economic diversification an el-ement of the company’s closure guidance or plans?
65
Phase 2: Program preparations
When the drivers and ambitions are clear, the company should be screened on success factors. There should be a clear market demand for the product, suitable ecological conditions for growing the product, a supporting policy environment, basic physical conditions and available capital, but also cultural knowledge and networks and public capital and foremost committed farmers (KIT e.a., ‘Sustainable Local Sourcing in Africa’ flyer, 2012). Semi-organized interviews should be held with the off-takers to check whether the circumstances are optimal. Important success factors for sustainable sourcing in Africa have been identified by KIT in a research trajectory conducted in 2012 (see Annex 2). The questions in Box 4 can be used as guiding questions in order to get a good insight in the general work of the company (UNDP, 2010b).
Note that it is important to talk to the right per-son in the company, including the director of the company and supply chain director.
Next to the off-taker, the implementing partner should also consult all other relevant partners in the off-takers’ supply chain in order to assess their intentions and discuss their commitment, including representatives of farmers’ suppliers, involved SMEs and services providers, including financial services providers and NGO support programmes.
Before the next phase can start, a Letter of Intents indicating full commitment to the ASDP needs to be signed by all key partners indicating roles, responsibilities and commitment. UNDP has its own rules and procedures when it comes to part-nering with the Private Sector. The full set of pro-cedures as well as relevant templates should be consulted on UNDP’s intranet at https://intranet.undp.org/global/popp/partnerships/Pages/pri-vate-sector.aspx.
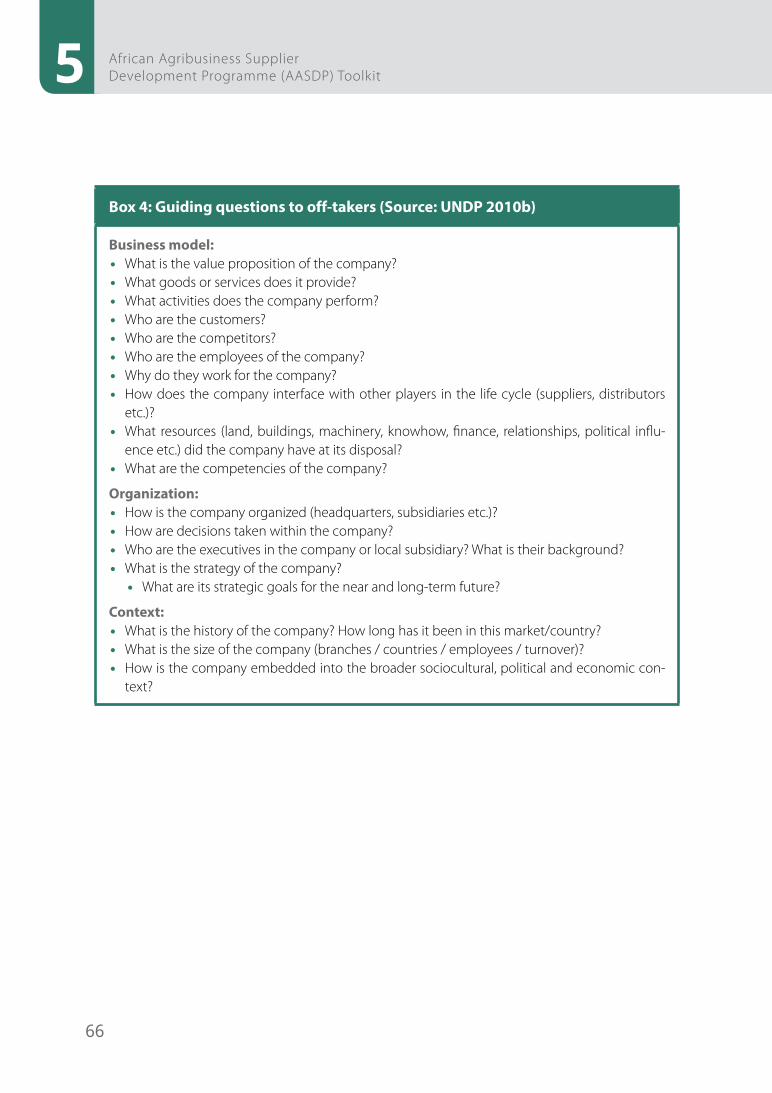
66
5 African Agribusiness Supplier Development Programme (AASDP) Toolkit
Box 4: Guiding questions to off-takers (Source: UNDP 2010b)
Business model:• What is the value proposition of the company? • What goods or services does it provide?• What activities does the company perform?• Who are the customers? • Who are the competitors?• Who are the employees of the company?• Why do they work for the company?• How does the company interface with other players in the life cycle (suppliers, distributors
etc.)?• What resources (land, buildings, machinery, knowhow, finance, relationships, political influ-
ence etc.) did the company have at its disposal?• What are the competencies of the company?
Organization:• How is the company organized (headquarters, subsidiaries etc.)?• How are decisions taken within the company?• Who are the executives in the company or local subsidiary? What is their background?• What is the strategy of the company?
• What are its strategic goals for the near and long-term future?
Context:• What is the history of the company? How long has it been in this market/country?• What is the size of the company (branches / countries / employees / turnover)?• How is the company embedded into the broader sociocultural, political and economic con-
text?
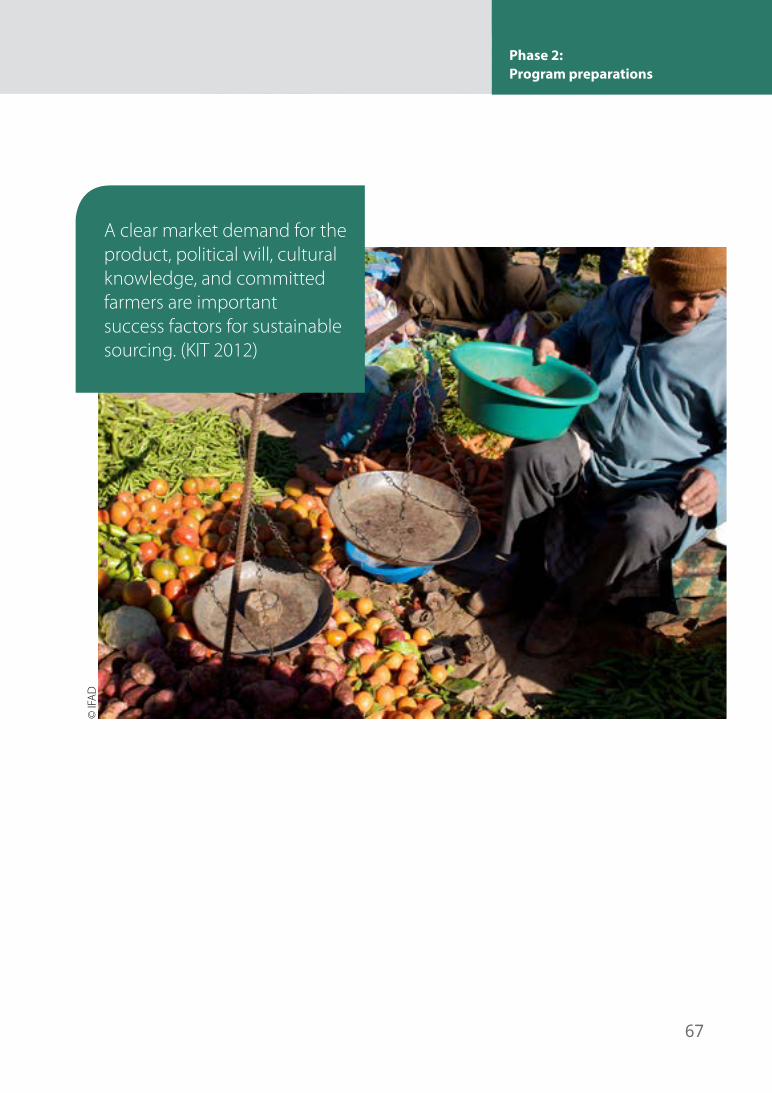
67
Phase 2: Program preparations
6. Phase 3: Supply chain diagnostics
A clear market demand for the product, political will, cultural knowledge, and committed farmers are important success factors for sustainable sourcing. (KIT 2012)
© IF
AD
Phase 3: Supply Chain Diagnostics
69
Phase 3: Supply chain diagnostics
The next step, and the first real step in a selected sup-ply chain, is to analyse constraints and opportunities in the development of local supply to an off-taker. The objective of this stage is to assess the supply chain of each identified focal commodity and look at the con-straints along that chain and what has created barri-ers for the smallholder farmers of the commodity and the SMEs, from engaging in commercial activities and supplying to the off-takers. Herein off-takers’ needs should be identified so as to identify the supply gap from both the demand and supply side.
The phase consists in the following activities:
• Analyse constraints and opportunities based on value chain analysis, livelihoods analysis including environmental conditions, and gender analysis
• Report constraints and opportunities in off-takers’ chains following standardized forms in the web-based data system
The Milestones of this phase are:
• Full overview of opportunities and needs for im-proving the ASDP supply chains
• All required forms for the information system filled in / accepted (indicating constraints and opportu-nities for an ASDP)
This phase is facilitated by the ASDP consultants hired and trained in the previous phase.
6.1 Analyse constraints and opportunities
In Latin American SDPs this phase is particularly fo-cussed on existing relationships. These relationships are assessed in three areas: operational efficiency (the product and its classification, quality, delivery times, price, services and technical assistance), continuous improvement (number and impact of the improve-ment projects) and quality systems (quality assurance and total quality). Figure 9 shows specific tools devel-oped for the Mexico SDP and adapted in other coun-tries.
The objective of this stage is to assess the supply chain of each identified focal com-modity and look at the constraints along these chains and in particular barriers for smallholders and SMEs to engage in com-mercial activities with off-takers.
Phase 3: Supply Chain Diagnostics 6
© IF
AD
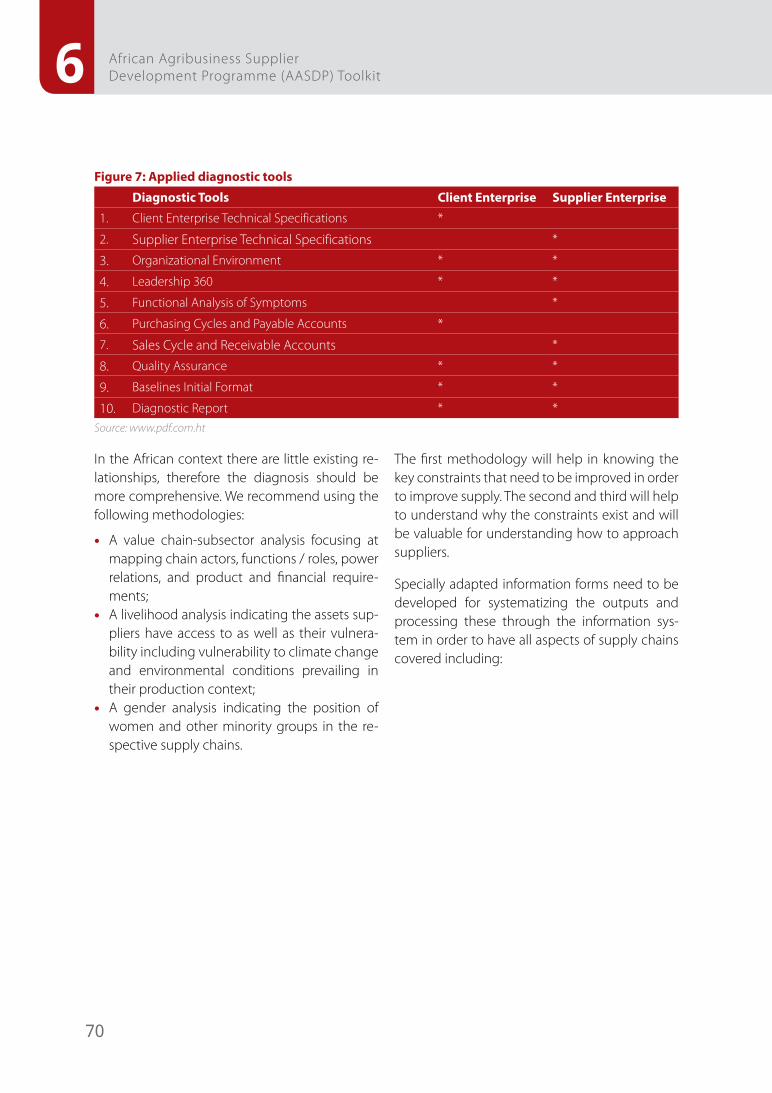
70
6 African Agribusiness Supplier Development Programme (AASDP) Toolkit
Figure 7: Applied diagnostic tools
Diagnostic Tools Client Enterprise Supplier Enterprise
1. Client Enterprise Technical Specifications *2. Supplier Enterprise Technical Specifications *
3. Organizational Environment * *
4. Leadership 360 * *
5. Functional Analysis of Symptoms *
6. Purchasing Cycles and Payable Accounts *7. Sales Cycle and Receivable Accounts *
8. Quality Assurance * *
9. Baselines Initial Format * *
10. Diagnostic Report * *Source: www.pdf.com.ht
In the African context there are little existing re-lationships, therefore the diagnosis should be more comprehensive. We recommend using the following methodologies:
• A value chain-subsector analysis focusing at mapping chain actors, functions / roles, power relations, and product and financial require-ments;
• A livelihood analysis indicating the assets sup-pliers have access to as well as their vulnera-bility including vulnerability to climate change and environmental conditions prevailing in their production context;
• A gender analysis indicating the position of women and other minority groups in the re-spective supply chains.
The first methodology will help in knowing the key constraints that need to be improved in order to improve supply. The second and third will help to understand why the constraints exist and will be valuable for understanding how to approach suppliers.
Specially adapted information forms need to be developed for systematizing the outputs and processing these through the information sys-tem in order to have all aspects of supply chains covered including:
71
Phase 3: Supply chain diagnostics
Data type Indicators
Technical and operational data Available land, productivity, volumes, inputs used, agricultural practices, quality, quality systems in place, technology, environmental constraints etc;
Supply chain and farm organi-zation data
Number of farmers, typology of farmers (including socioeconomic vulner-ability), organization of farmers, organization of the supply chain, involved intermediate SMEs;
Financial data Investments costs, operational costs, prices, turnover, profit margins, access to finance etc;
Enabling environment Access to (governmental) services, implementation of policies, available infrastructure etc.
To get an idea on some of the different forms that could be used, check out the buyers and suppli-ers audit forms as used in Latin American SDPs in Annex 3. Another valuable source for forms is the programme of UNIDO on Developing SME supplier networks on: http://www.unido.org/file-admin/user_media/Services/PSD/Clusters_and_Networks/publications/Supplier_Networks-EN.pdf.
For the ASDP it is first of all important to have an overview on what the subsector and supply chains within the subsector look like, how it is organized, what the technical requirements are for supplying off-takers and how the chains are financed.
The first step in getting the overview is to make a value chain map. A value chain map draws the entire system of production, processing and mar-keting of a particular product, from the stage of inception to the finished product, including sup-port services (KIT 2008). It consists of a series of chain actors, linked together by flows of prod-ucts, finance, information and services.
Visualizing a value chain helps to understand the linkages between the different actors and activi-ties in a chain. The map involves quantitative as well as qualitative information. A very important aspect of a value chain mapping is that it allows for identifying the bottlenecks and consequently potential interventions for improving/removing them.
The main components of a value chain map are (see Figure 8):
• Functions and operations: production, pro-cessing, transportation, storage, etc.
• Primary chain actors: producers, collectors, middlemen, wholesalers and retailers, carriers, etc.
• Support actors: secondary actors (services pro-viders, banks etc.) and tertiary actors (NGOs, government, etc.).
• Quantifiable dimensions: number of actors, employees, male/female percentage, volumes, prices, lead times etc.
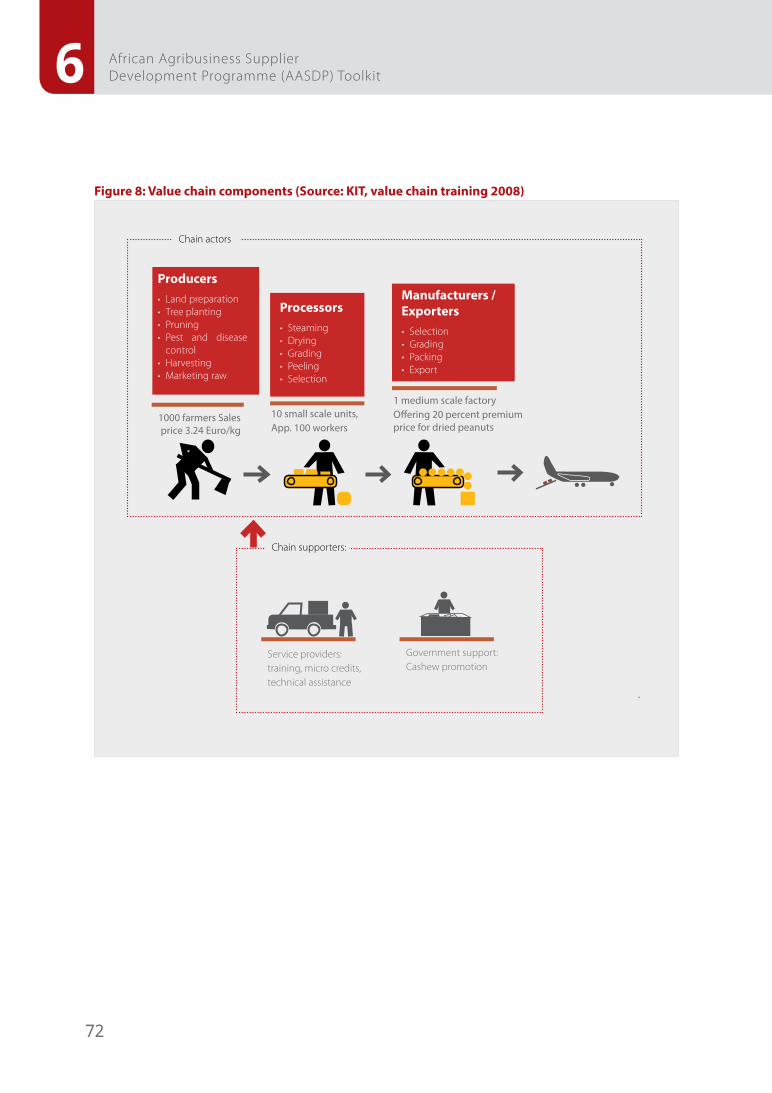
72
6 African Agribusiness Supplier Development Programme (AASDP) Toolkit
Figure 8: Value chain components (Source: KIT, value chain training 2008)
Producers• Land preparation• Tree planting• Pruning• Pest and disease
control• Harvesting• Marketing raw
Processors• Steaming• Drying• Grading• Peeling• Selection
Service providers:training, micro credits,technical assistance
Government support:Cashew promotion
Chain actors
Chain supporters:
1000 farmers Sales price 3.24 Euro/kg
10 small scale units, App. 100 workers
1 medium scale factoryOffering 20 percent premium price for dried peanuts
Manufacturers / Exporters• Selection• Grading• Packing• Export
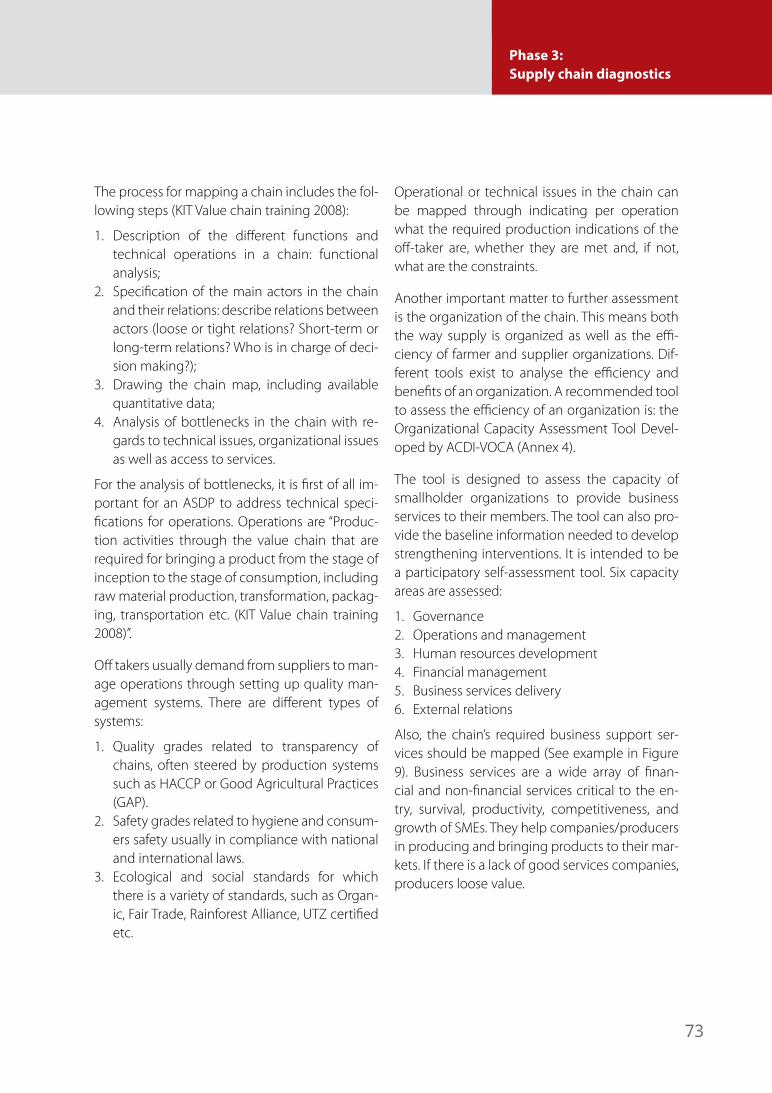
73
Phase 3: Supply chain diagnostics
The process for mapping a chain includes the fol-lowing steps (KIT Value chain training 2008):
1. Description of the different functions and technical operations in a chain: functional analysis;
2. Specification of the main actors in the chain and their relations: describe relations between actors (loose or tight relations? Short-term or long-term relations? Who is in charge of deci-sion making?);
3. Drawing the chain map, including available quantitative data;
4. Analysis of bottlenecks in the chain with re-gards to technical issues, organizational issues as well as access to services.
For the analysis of bottlenecks, it is first of all im-portant for an ASDP to address technical speci-fications for operations. Operations are “Produc-tion activities through the value chain that are required for bringing a product from the stage of inception to the stage of consumption, including raw material production, transformation, packag-ing, transportation etc. (KIT Value chain training 2008)”.
Off takers usually demand from suppliers to man-age operations through setting up quality man-agement systems. There are different types of systems:
1. Quality grades related to transparency of chains, often steered by production systems such as HACCP or Good Agricultural Practices (GAP).
2. Safety grades related to hygiene and consum-ers safety usually in compliance with national and international laws.
3. Ecological and social standards for which there is a variety of standards, such as Organ-ic, Fair Trade, Rainforest Alliance, UTZ certified etc.
Operational or technical issues in the chain can be mapped through indicating per operation what the required production indications of the off-taker are, whether they are met and, if not, what are the constraints.
Another important matter to further assessment is the organization of the chain. This means both the way supply is organized as well as the effi-ciency of farmer and supplier organizations. Dif-ferent tools exist to analyse the efficiency and benefits of an organization. A recommended tool to assess the efficiency of an organization is: the Organizational Capacity Assessment Tool Devel-oped by ACDI-VOCA (Annex 4).
The tool is designed to assess the capacity of smallholder organizations to provide business services to their members. The tool can also pro-vide the baseline information needed to develop strengthening interventions. It is intended to be a participatory self-assessment tool. Six capacity areas are assessed:
1. Governance2. Operations and management3. Human resources development4. Financial management5. Business services delivery6. External relations
Also, the chain’s required business support ser-vices should be mapped (See example in Figure 9). Business services are a wide array of finan-cial and non-financial services critical to the en-try, survival, productivity, competitiveness, and growth of SMEs. They help companies/producers in producing and bringing products to their mar-kets. If there is a lack of good services companies, producers loose value.
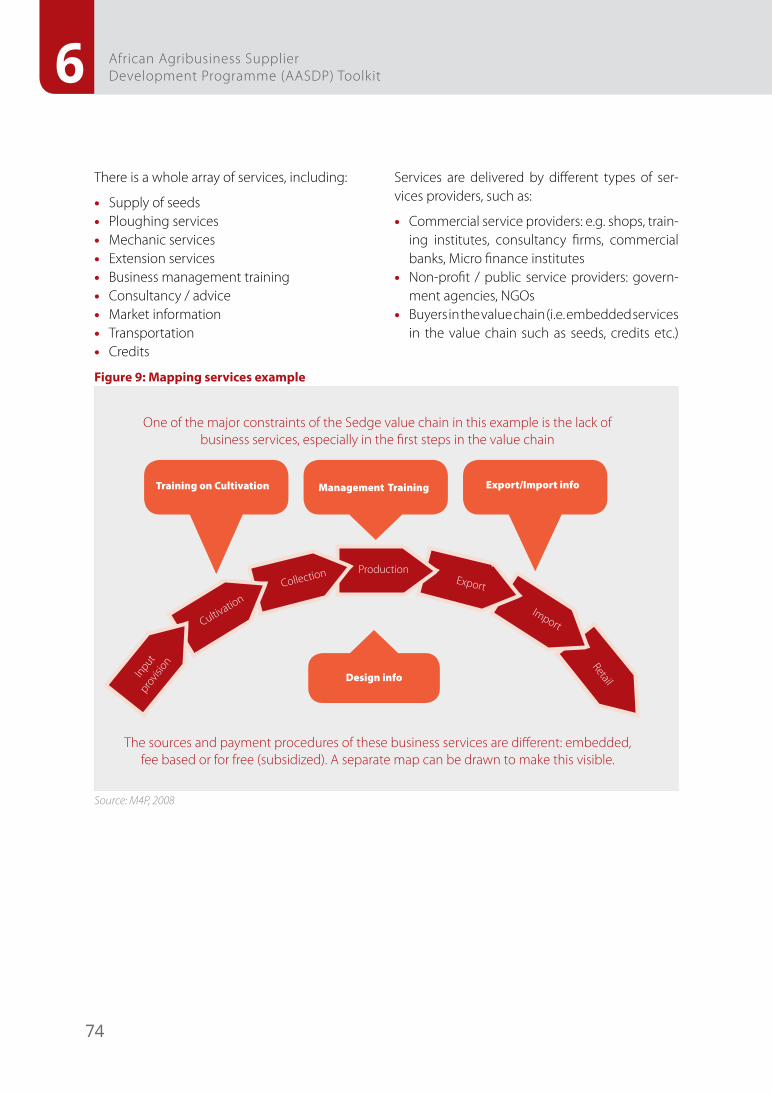
74
6 African Agribusiness Supplier Development Programme (AASDP) Toolkit
There is a whole array of services, including:
• Supply of seeds• Ploughing services• Mechanic services• Extension services• Business management training• Consultancy / advice• Market information• Transportation• Credits
Services are delivered by different types of ser-vices providers, such as:
• Commercial service providers: e.g. shops, train-ing institutes, consultancy firms, commercial banks, Micro finance institutes
• Non-profit / public service providers: govern-ment agencies, NGOs
• Buyers in the value chain (i.e. embedded services in the value chain such as seeds, credits etc.)
Figure 9: Mapping services example
One of the major constraints of the Sedge value chain in this example is the lack of business services, especially in the first steps in the value chain
Training on Cultivation Management Training Export/Import info
Design info
The sources and payment procedures of these business services are different: embedded, fee based or for free (subsidized). A separate map can be drawn to make this visible.
Input pro
vision
Cultivation
Collection ProductionExport
Import
Retail
Source: M4P, 2008
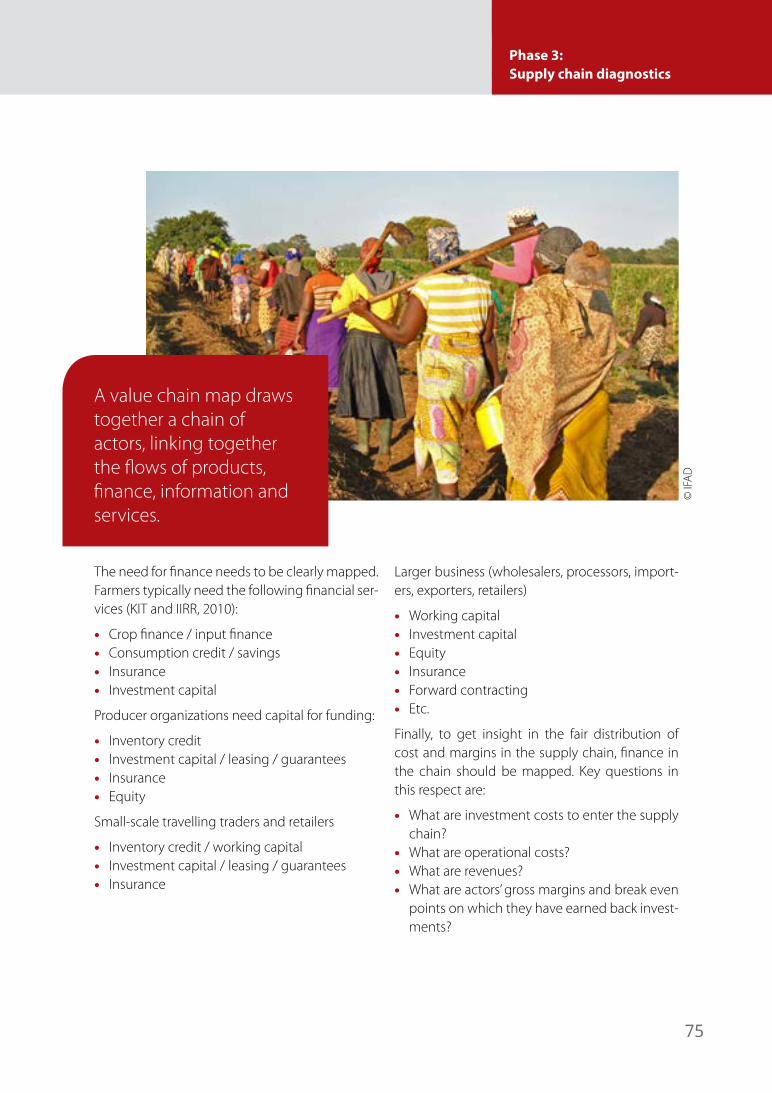
75
Phase 3: Supply chain diagnostics
The need for finance needs to be clearly mapped. Farmers typically need the following financial ser-vices (KIT and IIRR, 2010):
• Crop finance / input finance• Consumption credit / savings• Insurance• Investment capital
Producer organizations need capital for funding:
• Inventory credit• Investment capital / leasing / guarantees• Insurance• Equity
Small-scale travelling traders and retailers
• Inventory credit / working capital• Investment capital / leasing / guarantees• Insurance
Larger business (wholesalers, processors, import-ers, exporters, retailers)
• Working capital• Investment capital• Equity• Insurance• Forward contracting• Etc.
Finally, to get insight in the fair distribution of cost and margins in the supply chain, finance in the chain should be mapped. Key questions in this respect are:
• What are investment costs to enter the supply chain?
• What are operational costs?• What are revenues?• What are actors’ gross margins and break even
points on which they have earned back invest-ments?
A value chain map draws together a chain of actors, linking together the flows of products, finance, information and services.
© IF
AD
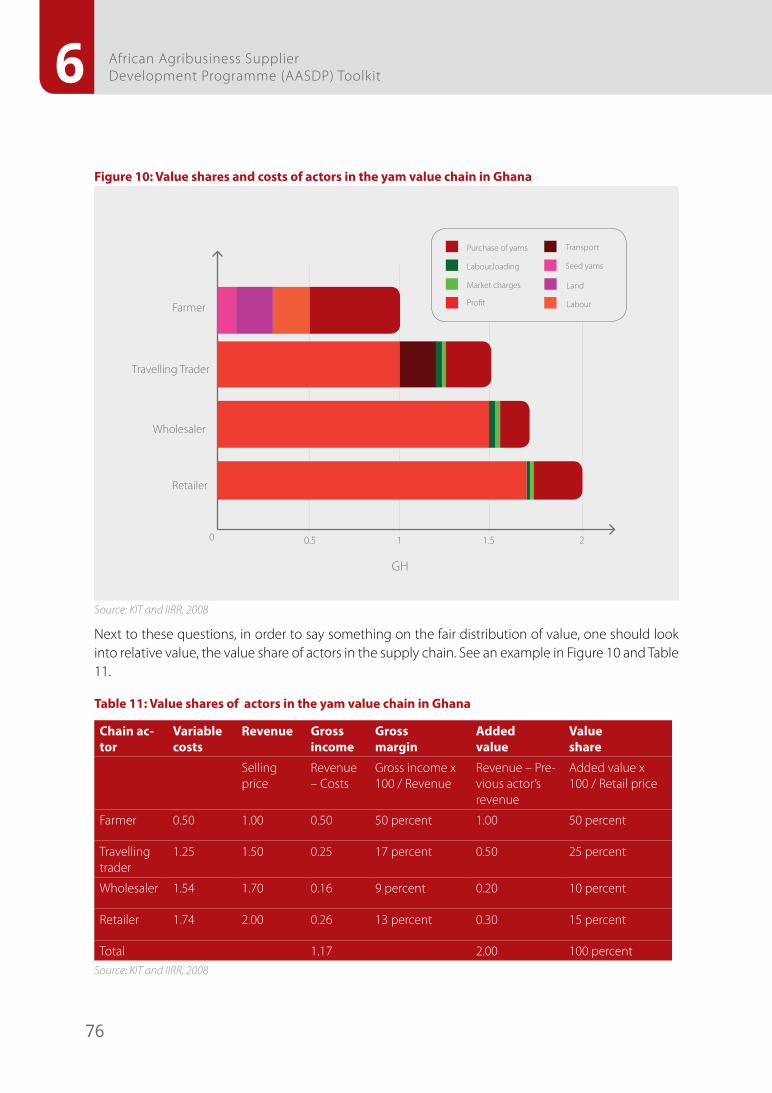
76
6 African Agribusiness Supplier Development Programme (AASDP) Toolkit
Figure 10: Value shares and costs of actors in the yam value chain in Ghana
0.50 1 1.5 2
GH
Farmer
Travelling Trader
Wholesaler
Retailer
Purchase of yams
Seed yams
Transport
Labour,loading
LandMarket charges
LabourProfit
Source: KIT and IIRR, 2008
Next to these questions, in order to say something on the fair distribution of value, one should look into relative value, the value share of actors in the supply chain. See an example in Figure 10 and Table 11.
Table 11: Value shares of actors in the yam value chain in Ghana
Chain ac-tor
Variable costs
Revenue Gross income
Gross margin
Added value
Value share
Selling price
Revenue – Costs
Gross income x 100 / Revenue
Revenue – Pre-vious actor’s revenue
Added value x 100 / Retail price
Farmer 0.50 1.00 0.50 50 percent 1.00 50 percent
Travelling trader
1.25 1.50 0.25 17 percent 0.50 25 percent
Wholesaler 1.54 1.70 0.16 9 percent 0.20 10 percent
Retailer 1.74 2.00 0.26 13 percent 0.30 15 percent
Total 1.17 2.00 100 percentSource: KIT and IIRR, 2008
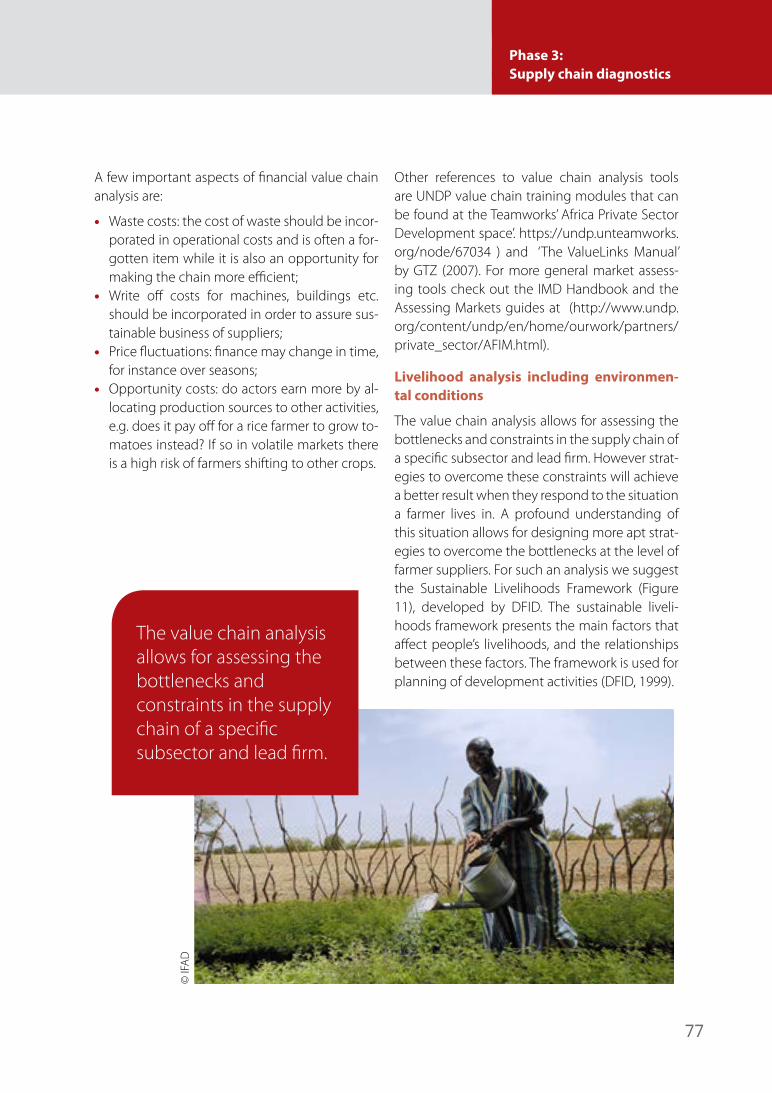
77
Phase 3: Supply chain diagnostics
A few important aspects of financial value chain analysis are:
• Waste costs: the cost of waste should be incor-porated in operational costs and is often a for-gotten item while it is also an opportunity for making the chain more efficient;
• Write off costs for machines, buildings etc. should be incorporated in order to assure sus-tainable business of suppliers;
• Price fluctuations: finance may change in time, for instance over seasons;
• Opportunity costs: do actors earn more by al-locating production sources to other activities, e.g. does it pay off for a rice farmer to grow to-matoes instead? If so in volatile markets there is a high risk of farmers shifting to other crops.
Other references to value chain analysis tools are UNDP value chain training modules that can be found at the Teamworks’ Africa Private Sector Development space’. https://undp.unteamworks.org/node/67034 ) and ‘The ValueLinks Manual’ by GTZ (2007). For more general market assess-ing tools check out the IMD Handbook and the Assessing Markets guides at (http://www.undp.org/content/undp/en/home/ourwork/partners/private_sector/AFIM.html).
Livelihood analysis including environmen-tal conditions
The value chain analysis allows for assessing the bottlenecks and constraints in the supply chain of a specific subsector and lead firm. However strat-egies to overcome these constraints will achieve a better result when they respond to the situation a farmer lives in. A profound understanding of this situation allows for designing more apt strat-egies to overcome the bottlenecks at the level of farmer suppliers. For such an analysis we suggest the Sustainable Livelihoods Framework (Figure 11), developed by DFID. The sustainable liveli-hoods framework presents the main factors that affect people’s livelihoods, and the relationships between these factors. The framework is used for planning of development activities (DFID, 1999).
The value chain analysis allows for assessing thebottlenecks and constraints in the supply chain of a specific subsector and lead firm.
© IF
AD
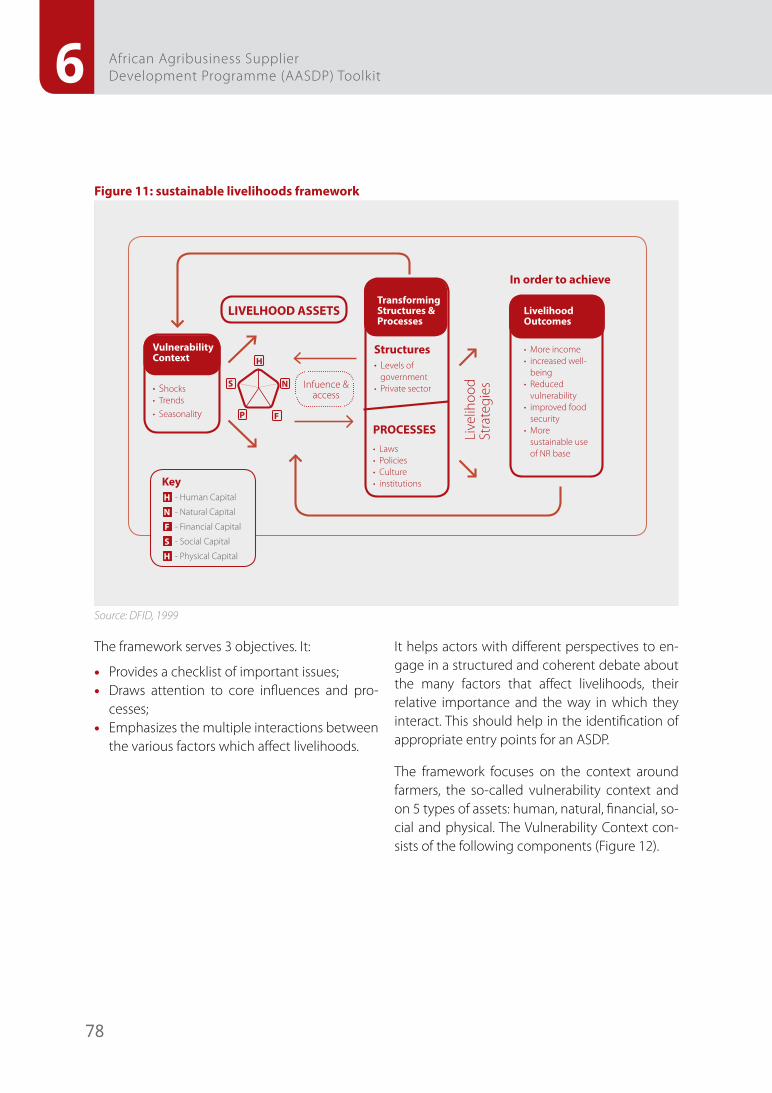
78
6 African Agribusiness Supplier Development Programme (AASDP) Toolkit
Figure 11: sustainable livelihoods framework
LIVELHOOD ASSETS
In order to achieve
PROCESSES
Vulnerability Context
Transforming Structures & Processes
Structures
Infuence & access
KeyH - Human Capital
N - Natural Capital
F - Financial Capital
S - Social Capital
H - Physical Capital
Live
lihoo
dSt
rate
gies
• Levels of government
• Private sector
• More income• increased well-
being• Reduced
vulnerability• improved food
security • More
sustainable use of NR base• Laws
• Policies• Culture• institutions
• Shocks• Trends• Seasonality
H
N
FP
S
LivelihoodOutcomes
Source: DFID, 1999
The framework serves 3 objectives. It:
• Provides a checklist of important issues; • Draws attention to core influences and pro-
cesses;• Emphasizes the multiple interactions between
the various factors which affect livelihoods.
It helps actors with different perspectives to en-gage in a structured and coherent debate about the many factors that affect livelihoods, their relative importance and the way in which they interact. This should help in the identification of appropriate entry points for an ASDP.
The framework focuses on the context around farmers, the so-called vulnerability context and on 5 types of assets: human, natural, financial, so-cial and physical. The Vulnerability Context con-sists of the following components (Figure 12).
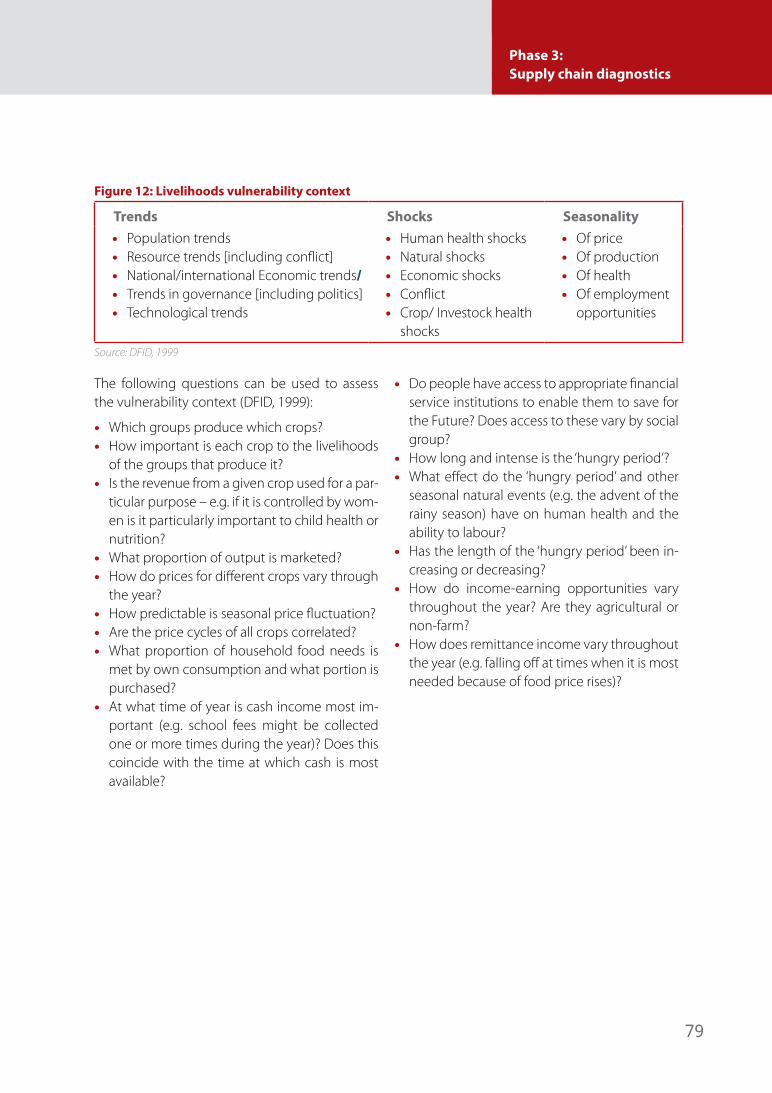
79
Phase 3: Supply chain diagnostics
Figure 12: Livelihoods vulnerability context
Trends Shocks Seasonality• Population trends• Resource trends [including conflict]• National/international Economic trends/• Trends in governance [including politics]• Technological trends
• Human health shocks• Natural shocks• Economic shocks• Conflict• Crop/ Investock health
shocks
• Of price• Of production• Of health• Of employment
opportunities
Source: DFID, 1999
The following questions can be used to assess the vulnerability context (DFID, 1999):
• Which groups produce which crops?• How important is each crop to the livelihoods
of the groups that produce it?• Is the revenue from a given crop used for a par-
ticular purpose – e.g. if it is controlled by wom-en is it particularly important to child health or nutrition?
• What proportion of output is marketed?• How do prices for different crops vary through
the year?• How predictable is seasonal price fluctuation?• Are the price cycles of all crops correlated?• What proportion of household food needs is
met by own consumption and what portion is purchased?
• At what time of year is cash income most im-portant (e.g. school fees might be collected one or more times during the year)? Does this coincide with the time at which cash is most available?
• Do people have access to appropriate financial service institutions to enable them to save for the Future? Does access to these vary by social group?
• How long and intense is the ‘hungry period’?• What effect do the ‘hungry period’ and other
seasonal natural events (e.g. the advent of the rainy season) have on human health and the ability to labour?
• Has the length of the ‘hungry period’ been in-creasing or decreasing?
• How do income-earning opportunities vary throughout the year? Are they agricultural or non-farm?
• How does remittance income vary throughout the year (e.g. falling off at times when it is most needed because of food price rises)?
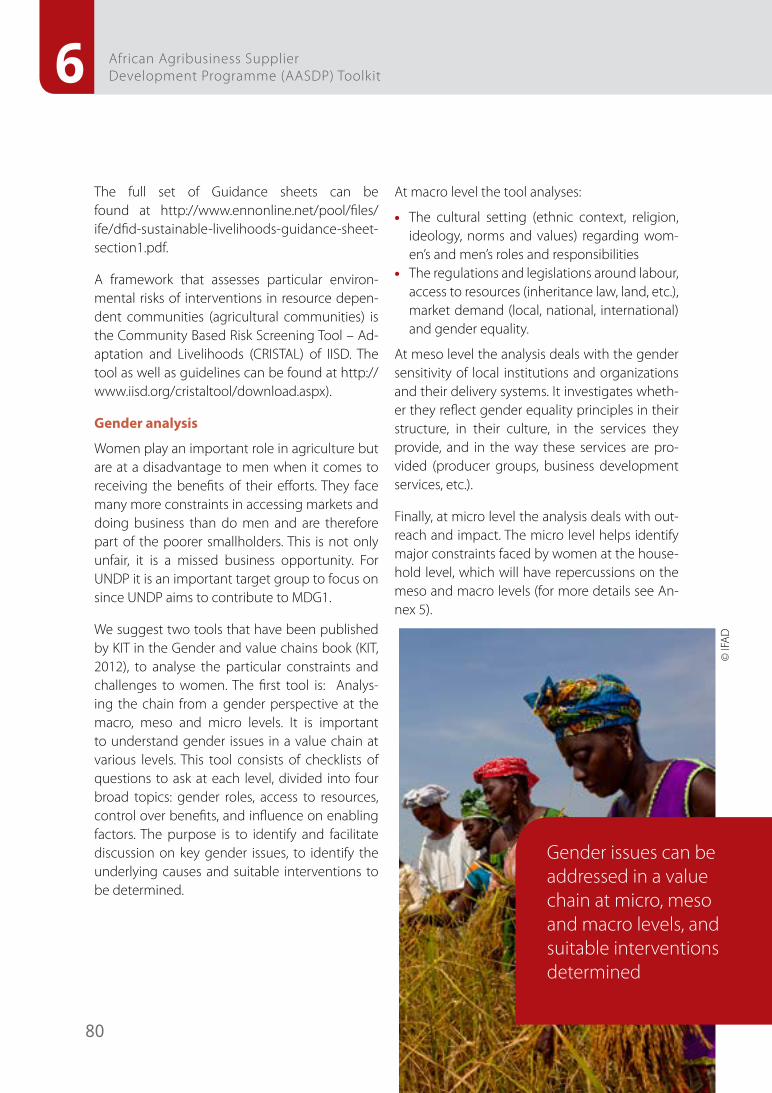
80
6 African Agribusiness Supplier Development Programme (AASDP) Toolkit
The full set of Guidance sheets can be found at http://www.ennonline.net/pool/files/ife/dfid-sustainable-livelihoods-guidance-sheet-section1.pdf.
A framework that assesses particular environ-mental risks of interventions in resource depen-dent communities (agricultural communities) is the Community Based Risk Screening Tool – Ad-aptation and Livelihoods (CRISTAL) of IISD. The tool as well as guidelines can be found at http://www.iisd.org/cristaltool/download.aspx).
Gender analysis
Women play an important role in agriculture but are at a disadvantage to men when it comes to receiving the benefits of their efforts. They face many more constraints in accessing markets and doing business than do men and are therefore part of the poorer smallholders. This is not only unfair, it is a missed business opportunity. For UNDP it is an important target group to focus on since UNDP aims to contribute to MDG1.
We suggest two tools that have been published by KIT in the Gender and value chains book (KIT, 2012), to analyse the particular constraints and challenges to women. The first tool is: Analys-ing the chain from a gender perspective at the macro, meso and micro levels. It is important to understand gender issues in a value chain at various levels. This tool consists of checklists of questions to ask at each level, divided into four broad topics: gender roles, access to resources, control over benefits, and influence on enabling factors. The purpose is to identify and facilitate discussion on key gender issues, to identify the underlying causes and suitable interventions to be determined.
At macro level the tool analyses:
• The cultural setting (ethnic context, religion, ideology, norms and values) regarding wom-en’s and men’s roles and responsibilities
• The regulations and legislations around labour, access to resources (inheritance law, land, etc.), market demand (local, national, international) and gender equality.
At meso level the analysis deals with the gender sensitivity of local institutions and organizations and their delivery systems. It investigates wheth-er they reflect gender equality principles in their structure, in their culture, in the services they provide, and in the way these services are pro-vided (producer groups, business development services, etc.).
Finally, at micro level the analysis deals with out-reach and impact. The micro level helps identify major constraints faced by women at the house-hold level, which will have repercussions on the meso and macro levels (for more details see An-nex 5).
Gender issues can be addressed in a value chain at micro, meso and macro levels, and suitable interventions determined
© IF
AD
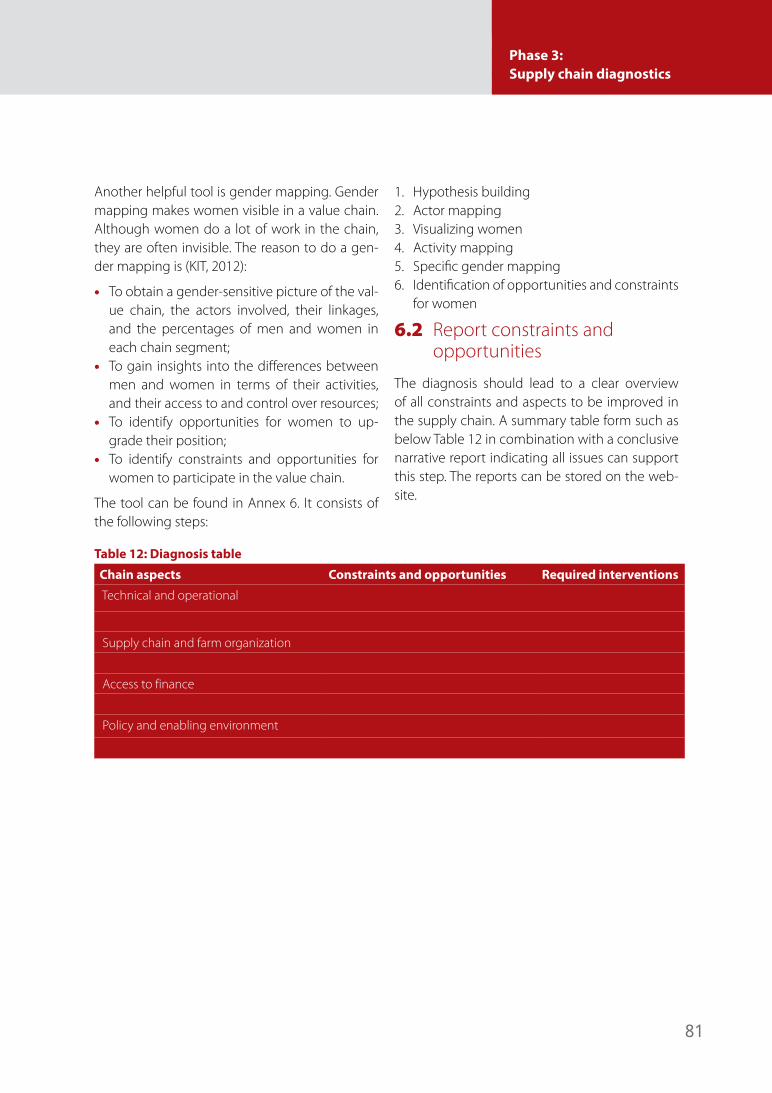
81
Phase 3: Supply chain diagnostics
Another helpful tool is gender mapping. Gender mapping makes women visible in a value chain. Although women do a lot of work in the chain, they are often invisible. The reason to do a gen-der mapping is (KIT, 2012):
• To obtain a gender-sensitive picture of the val-ue chain, the actors involved, their linkages, and the percentages of men and women in each chain segment;
• To gain insights into the differences between men and women in terms of their activities, and their access to and control over resources;
• To identify opportunities for women to up-grade their position;
• To identify constraints and opportunities for women to participate in the value chain.
The tool can be found in Annex 6. It consists of the following steps:
1. Hypothesis building 2. Actor mapping 3. Visualizing women4. Activity mapping 5. Specific gender mapping 6. Identification of opportunities and constraints
for women
6.2 Report constraints and opportunities
The diagnosis should lead to a clear overview of all constraints and aspects to be improved in the supply chain. A summary table form such as below Table 12 in combination with a conclusive narrative report indicating all issues can support this step. The reports can be stored on the web-site.
Table 12: Diagnosis table
Chain aspects Constraints and opportunities Required interventions
Technical and operational
Supply chain and farm organization
Access to finance
Policy and enabling environment
7. Phase 4: Supply chain development planning
Phase 4: Supply Chain Development Planning
83
Phase 4: Supply chain development planning
Next to the diagnosis in which all constraints have been clearly analysed, strategies need to be devel-oped and translated into practical supply chain im-plementation plans which, before starting implemen-tation, need to be agreed upon by all stakeholders and involved implementing partners through a part-nership agreement. So the objective of this phase is to develop and formally agree upon a supply chain development plan.
The supply chain planning phase consists the follow-ing activities:
• Selecting strategies and business models• Developing implementation plans including in-
terventions, timing, responsibilities, required extra investments and milestones through a validation workshop with off-takers, selected suppliers and other support organization
• Setting up and signing chain partnership agree-ments aiming at setting up/improving supply chain relations
Milestones of this phase are:
• Clear strategy/business model for the respective supply chain
• Validated/approved supply chain development plans
• Signed chain partnership agreements between suppliers, off-takers and other support organiza-tions (NGOs, banks etc.)
The ASDP consultants will be the ones to develop these implementation plans based on the diagnostic phase.
7.1 Select strategies and business models
It is up to the off-taker and the suppliers to discuss the most suitable chain of custody organization. It may be needed to change the already existing sup-ply chain model. The KIT Chain Empowerment book describes 4 different strategies for empowering small suppliers in a supply chain (Figure 13 KIT, Chain em-powerment, 2008):
The KIT Chain Em-powerment book describes 4 different strategies for empow-ering small suppliers in a supply chain (KIT, Chain Empowerment, 2008)
Phase 4: Supply Chain Development Planning 7
© fi
ckr.c
om
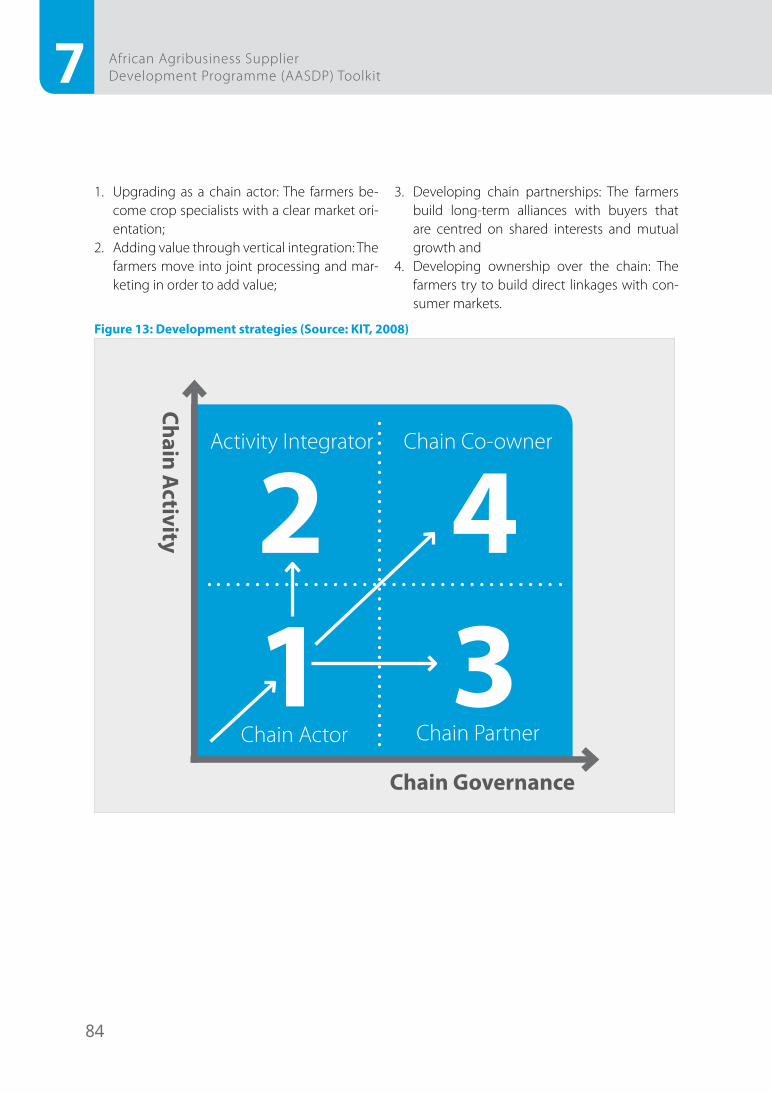
84
7 African Agribusiness Supplier Development Programme (AASDP) Toolkit
1. Upgrading as a chain actor: The farmers be-come crop specialists with a clear market ori-entation;
2. Adding value through vertical integration: The farmers move into joint processing and mar-keting in order to add value;
3. Developing chain partnerships: The farmers build long-term alliances with buyers that are centred on shared interests and mutual growth and
4. Developing ownership over the chain: The farmers try to build direct linkages with con-sumer markets.
Figure 13: Development strategies (Source: KIT, 2008)
Activity Integrator
Chain Activity
Chain Governance
2 431
Chain Actor
Chain Co-owner
Chain Partner
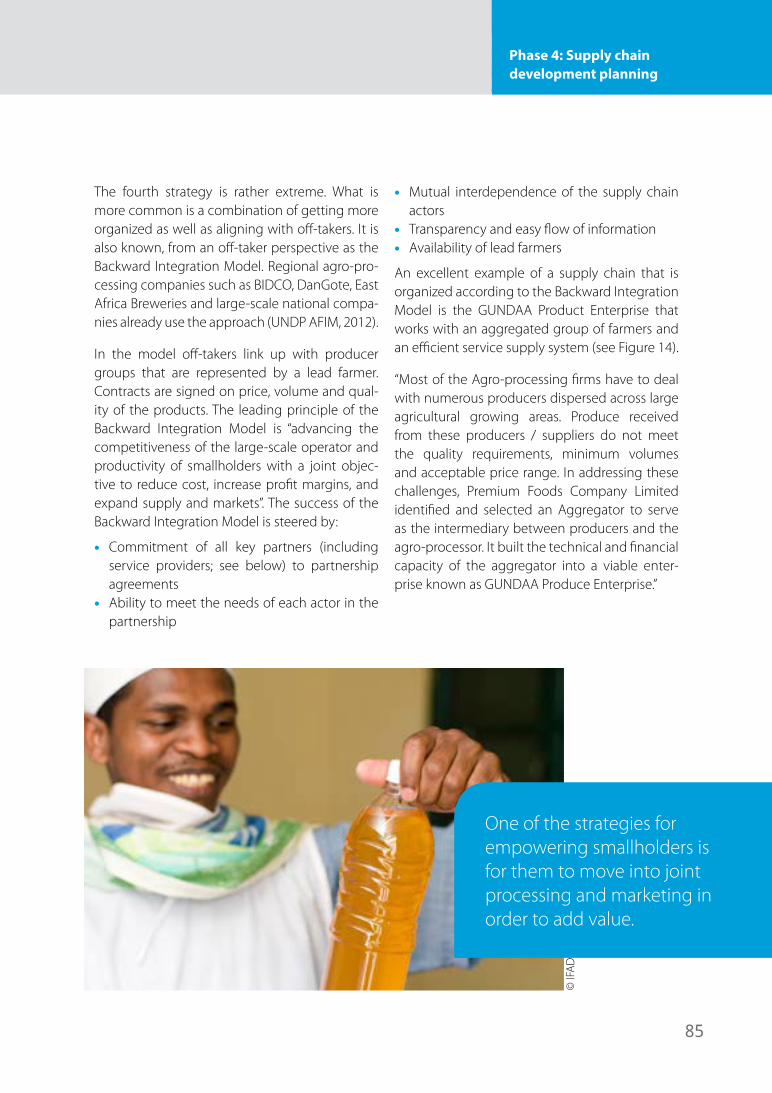
85
Phase 4: Supply chain development planning
The fourth strategy is rather extreme. What is more common is a combination of getting more organized as well as aligning with off-takers. It is also known, from an off-taker perspective as the Backward Integration Model. Regional agro-pro-cessing companies such as BIDCO, DanGote, East Africa Breweries and large-scale national compa-nies already use the approach (UNDP AFIM, 2012).
In the model off-takers link up with producer groups that are represented by a lead farmer. Contracts are signed on price, volume and qual-ity of the products. The leading principle of the Backward Integration Model is “advancing the competitiveness of the large-scale operator and productivity of smallholders with a joint objec-tive to reduce cost, increase profit margins, and expand supply and markets”. The success of the Backward Integration Model is steered by:
• Commitment of all key partners (including service providers; see below) to partnership agreements
• Ability to meet the needs of each actor in the partnership
• Mutual interdependence of the supply chain actors
• Transparency and easy flow of information• Availability of lead farmers
An excellent example of a supply chain that is organized according to the Backward Integration Model is the GUNDAA Product Enterprise that works with an aggregated group of farmers and an efficient service supply system (see Figure 14).
“Most of the Agro-processing firms have to deal with numerous producers dispersed across large agricultural growing areas. Produce received from these producers / suppliers do not meet the quality requirements, minimum volumes and acceptable price range. In addressing these challenges, Premium Foods Company Limited identified and selected an Aggregator to serve as the intermediary between producers and the agro-processor. It built the technical and financial capacity of the aggregator into a viable enter-prise known as GUNDAA Produce Enterprise.”
One of the strategies for empowering smallholders is for them to move into joint processing and marketing in order to add value.
© IF
AD
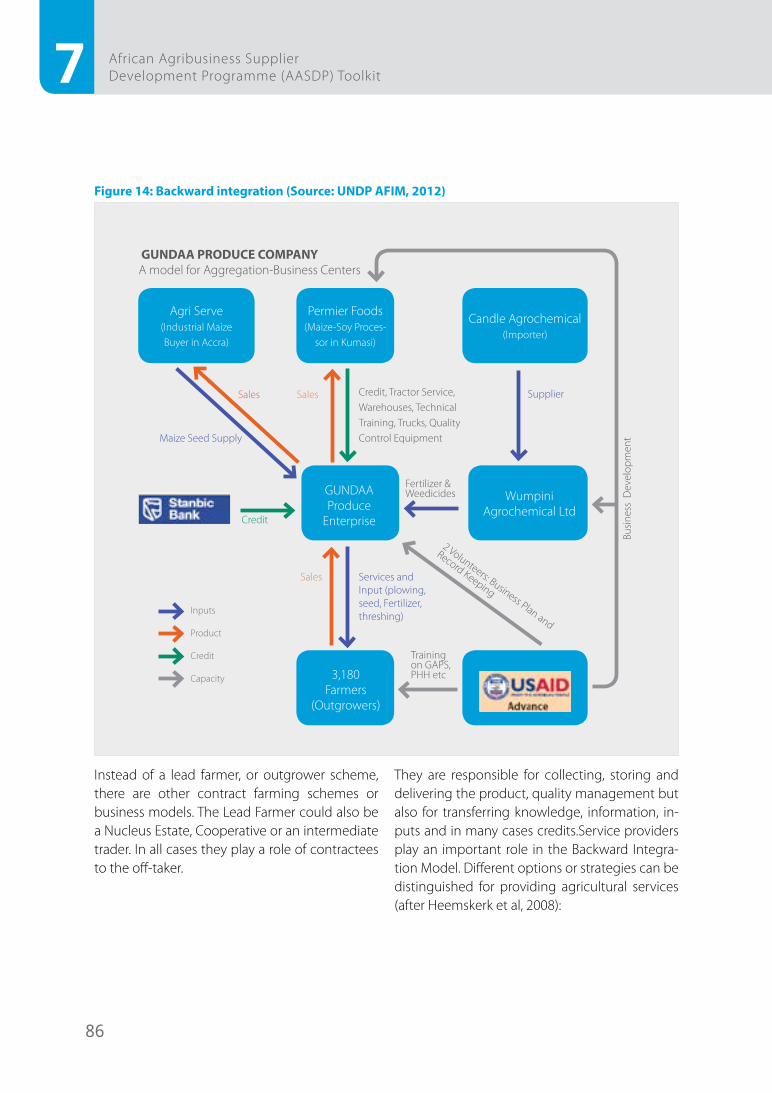
86
7 African Agribusiness Supplier Development Programme (AASDP) Toolkit
Figure 14: Backward integration (Source: UNDP AFIM, 2012)
GUNDAA PRODUCE COMPANYA model for Aggregation-Business Centers
Agri Serve(Industrial Maize Buyer in Accra)
Permier Foods(Maize-Soy Proces-
sor in Kumasi)
Credit, Tractor Service, Warehouses, Technical Training, Trucks, Quality Control Equipment
Services and Input (plowing, seed, Fertilizer, threshing)
Fertilizer & Weedicides
Credit
Inputs
Product
Credit
Capacity
Training on GAPS, PHH etc
2 Volunteers: Business Plan and
Record Keeping
3,180 Farmers
(Outgrowers)
Busin
ess
Dev
elop
men
tMaize Seed Supply
Sales
Sales
Sales Supplier
Candle Agrochemical (Importer)
Wumpini Agrochemical Ltd
GUNDAA Produce
Enterprise
Instead of a lead farmer, or outgrower scheme, there are other contract farming schemes or business models. The Lead Farmer could also be a Nucleus Estate, Cooperative or an intermediate trader. In all cases they play a role of contractees to the off-taker.
They are responsible for collecting, storing and delivering the product, quality management but also for transferring knowledge, information, in-puts and in many cases credits.Service providers play an important role in the Backward Integra-tion Model. Different options or strategies can be distinguished for providing agricultural services (after Heemskerk et al, 2008):
87
Phase 4: Supply chain development planning
• Public sector extension service: public financ-ing, public service provision, such as under the former national T&V (training and visit) exten-sion programmes
• Private sector extension service through out-sourcing using state funding: public financing, private provision
• Private sector extension service through direct ‘donor’ funding, such as international donors, NGOs and international private agencies, in-creasingly bypassing the public sector exten-sion by contracting services directly
• Private sector extension services based on di-rect private funding (e.g. ‘contract farming’, em-bedded services)
• Private service providers delivered services paid for by farmers, either directly or after har-vest
Different types of service providers therefore may be key partners in an ASDP programme (Figure 15):
• Public actors are the national agricultural ex-tension services under the Ministry of Agricul-ture. But other services also may play a role: public agricultural research systems, educa-tional systems (from primary schools to voca-tional training centres), state-owned media, etc. Progressive adjustments have tended to refocus government agencies on roles related to guidance, encouragement and supervision.
• Sub-sectoral bodies representing market-ori-ented small-scale emerging and commercial farmers such as a coffee board or a national commodity association. This often occurs in cash crop subsectors, for example, coffee in Colombia, cotton in Benin, cashew in Tanzania and tea in Kenya.
• Private actors in the agricultural sector - 4 categories are distinguished:
u Input suppliers (seeds, fertilizer, animal/crop health products, farm equipment, etc.) pro-viding advice and training as part of market-ing their products
u Off takers of agricultural products advice, train, and recommend techniques to ensure supplies of guaranteed quantity and quality
u Private trainer-advisor-outreach agencies and agriculture extension services providers emerging in response to the demand from farmers, public agencies and professional organizations
u Private media geared to agriculture (radio and television programmes, farming mag-azines)
• Farmer organizations (trade unions, associa-tions, cooperatives and other forms of group-ing) may offer a range of services, including inputs and product marketing, loan facilities, representation and training, information, facili-tation and extension services.
• Village or community extension workers often involved in input supply and lead farmers and local facilitators who are able to provide infor-mation and services.
• Non-governmental organizations act in a variety of ways, fulfilling a key role, not least through pilot projects and as mediators. They operate in spheres of activity and regions where neither the State, private operators, nor farmer organizations can deliver appropriate services. The independence and initiative of NGOs has benefits for other actors.
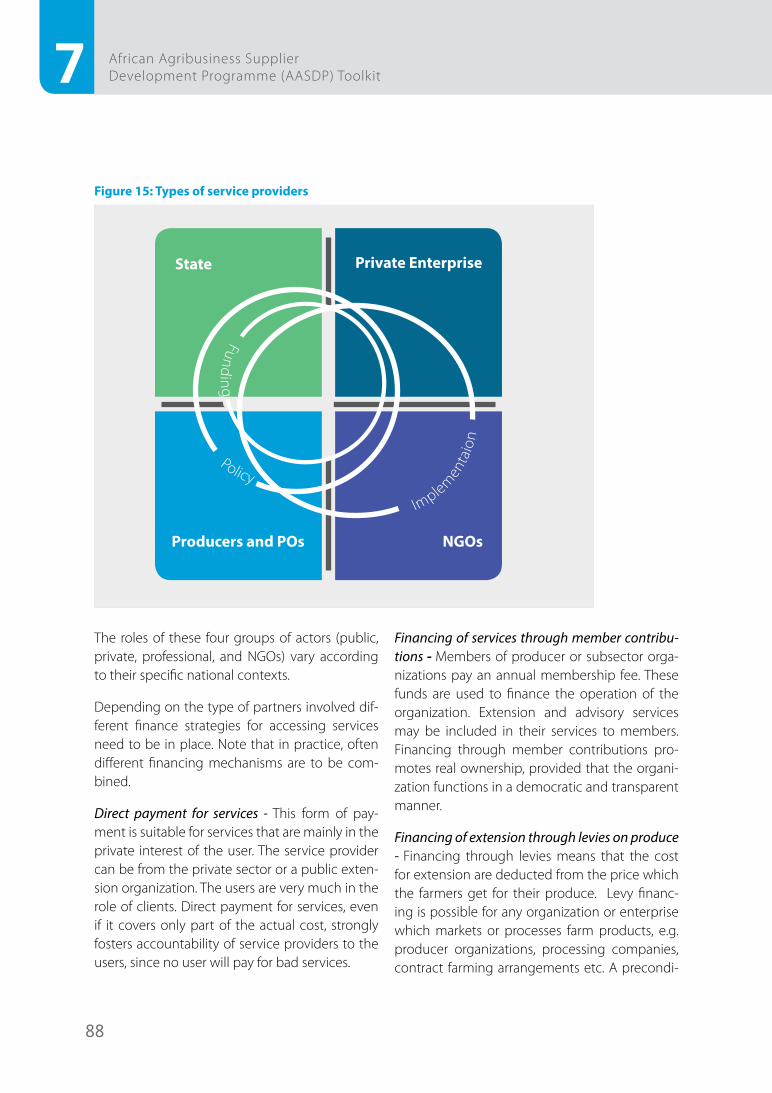
88
7 African Agribusiness Supplier Development Programme (AASDP) Toolkit
Figure 15: Types of service providers
Implemen
taio
nPolicy
State Private Enterprise
NGOsProducers and POsFunding
The roles of these four groups of actors (public, private, professional, and NGOs) vary according to their specific national contexts.
Depending on the type of partners involved dif-ferent finance strategies for accessing services need to be in place. Note that in practice, often different financing mechanisms are to be com-bined.
Direct payment for services - This form of pay-ment is suitable for services that are mainly in the private interest of the user. The service provider can be from the private sector or a public exten-sion organization. The users are very much in the role of clients. Direct payment for services, even if it covers only part of the actual cost, strongly fosters accountability of service providers to the users, since no user will pay for bad services.
Financing of services through member contribu-tions - Members of producer or subsector orga-nizations pay an annual membership fee. These funds are used to finance the operation of the organization. Extension and advisory services may be included in their services to members. Financing through member contributions pro-motes real ownership, provided that the organi-zation functions in a democratic and transparent manner.
Financing of extension through levies on produce - Financing through levies means that the cost for extension are deducted from the price which the farmers get for their produce. Levy financ-ing is possible for any organization or enterprise which markets or processes farm products, e.g. producer organizations, processing companies, contract farming arrangements etc. A precondi-
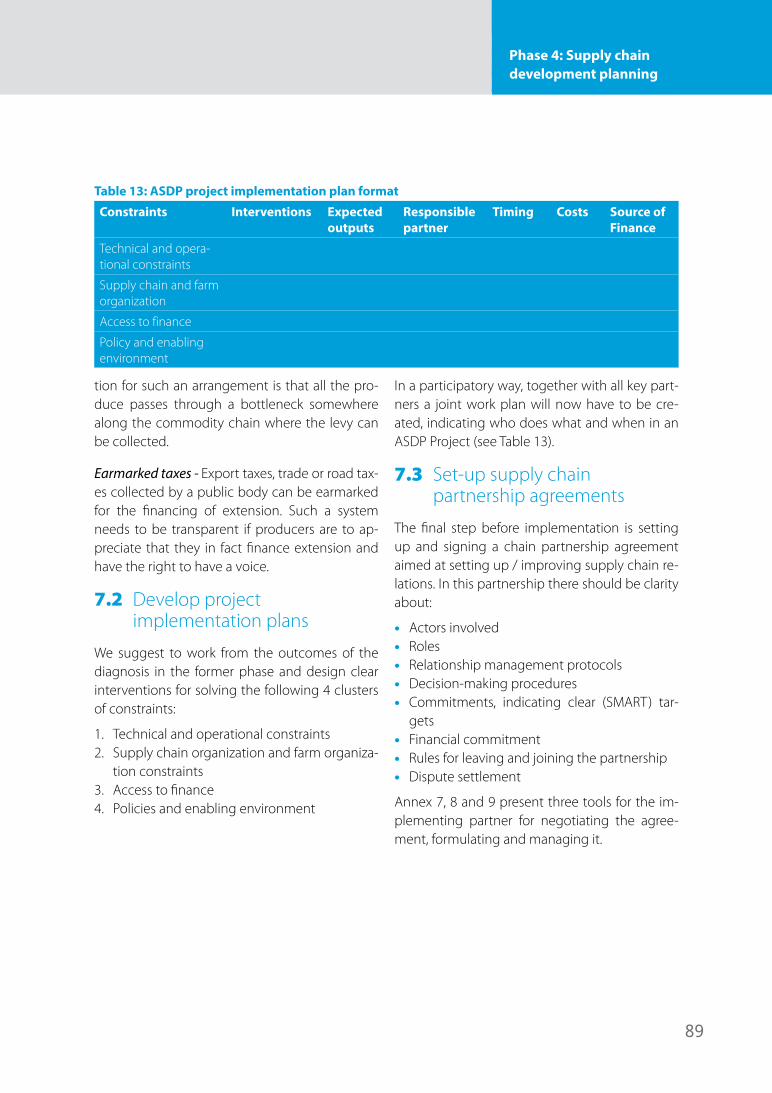
89
Phase 4: Supply chain development planning
tion for such an arrangement is that all the pro-duce passes through a bottleneck somewhere along the commodity chain where the levy can be collected.
Earmarked taxes - Export taxes, trade or road tax-es collected by a public body can be earmarked for the financing of extension. Such a system needs to be transparent if producers are to ap-preciate that they in fact finance extension and have the right to have a voice.
7.2 Develop project implementation plans
We suggest to work from the outcomes of the diagnosis in the former phase and design clear interventions for solving the following 4 clusters of constraints:
1. Technical and operational constraints2. Supply chain organization and farm organiza-
tion constraints3. Access to finance4. Policies and enabling environment
In a participatory way, together with all key part-ners a joint work plan will now have to be cre-ated, indicating who does what and when in an ASDP Project (see Table 13).
7.3 Set-up supply chain partnership agreements
The final step before implementation is setting up and signing a chain partnership agreement aimed at setting up / improving supply chain re-lations. In this partnership there should be clarity about:
• Actors involved• Roles • Relationship management protocols• Decision-making procedures• Commitments, indicating clear (SMART) tar-
gets• Financial commitment• Rules for leaving and joining the partnership• Dispute settlement
Annex 7, 8 and 9 present three tools for the im-plementing partner for negotiating the agree-ment, formulating and managing it.
Table 13: ASDP project implementation plan format
Constraints Interventions Expected outputs
Responsible partner
Timing Costs Source of Finance
Technical and opera-tional constraints
Supply chain and farm organization
Access to finance
Policy and enabling environment
8. Phase 5: Supply chain development implementation
Phase 5: Supply Chain Development Implementation
91
Phase 5: Supply chain development implementation
Now that the chain partnership has been signed, finally the implementation phase can start. The ob-jective of this phase is to successfully implement all identified interventions that are needed to improve supply in the respective supply chains.
During a period of approximately four production seasons the suppliers, together with key partners (NGO programmes, public and finance service pro-viders etc.), improve production and productivity, quality management, price, lead time and organiza-tional structures while off-takers invest in improving their technical and financial support towards suppli-ers, communication of specifications and regulations and on time payments. This should go hand in hand with additional investments in physical hardware and inputs supply, by both suppliers and buyers.
The target to monitor this phase is successfully imple-mented interventions.
This chapter provides potentially required interven-tions needed for enabling smallholders and SME sup-pliers to improve supply following the requirements of the off-takers.
This chapter provides potentially required interventions needed for enabling small-holders and SME suppliers to improve supply, following the requirements of the off-takers.
Phase 5: Supply Chain Development Implementation
8
© IF
AD
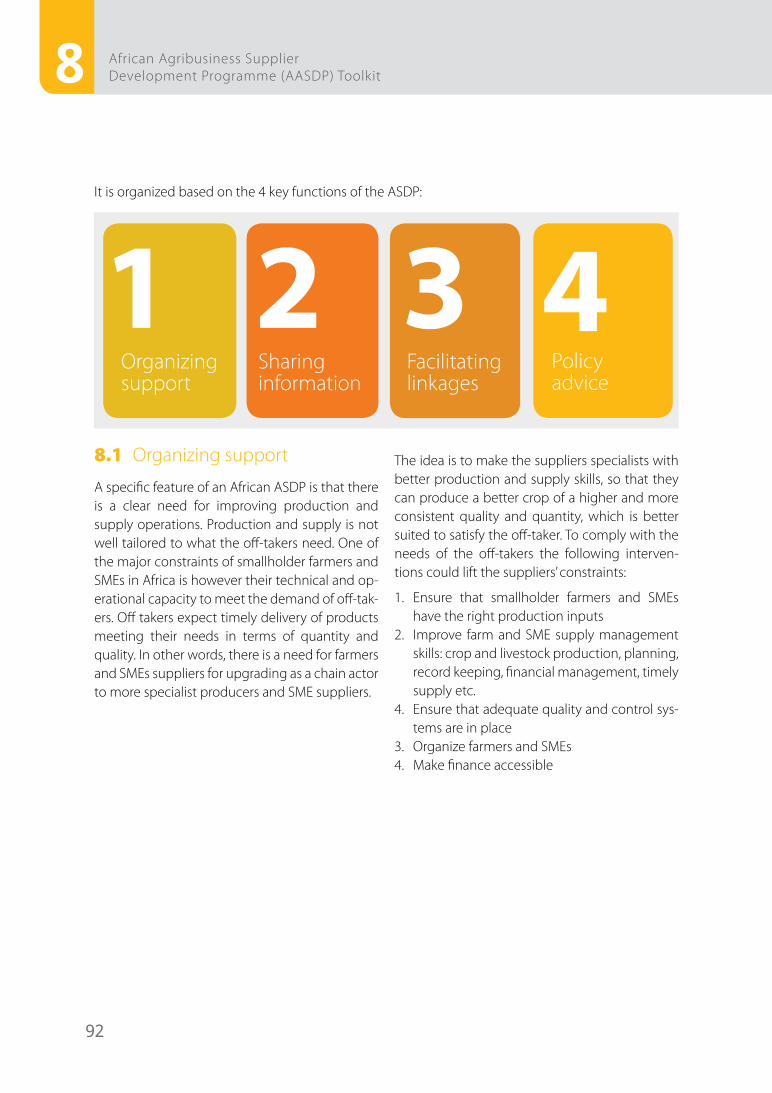
92
8 African Agribusiness Supplier Development Programme (AASDP) Toolkit
It is organized based on the 4 key functions of the ASDP:
Organizing support
1 2 3 4Sharing information
Facilitating linkages
Policy advice
8.1 Organizing support
A specific feature of an African ASDP is that there is a clear need for improving production and supply operations. Production and supply is not well tailored to what the off-takers need. One of the major constraints of smallholder farmers and SMEs in Africa is however their technical and op-erational capacity to meet the demand of off-tak-ers. Off takers expect timely delivery of products meeting their needs in terms of quantity and quality. In other words, there is a need for farmers and SMEs suppliers for upgrading as a chain actor to more specialist producers and SME suppliers.
The idea is to make the suppliers specialists with better production and supply skills, so that they can produce a better crop of a higher and more consistent quality and quantity, which is better suited to satisfy the off-taker. To comply with the needs of the off-takers the following interven-tions could lift the suppliers’ constraints:
1. Ensure that smallholder farmers and SMEs have the right production inputs
2. Improve farm and SME supply management skills: crop and livestock production, planning, record keeping, financial management, timely supply etc.
4. Ensure that adequate quality and control sys-tems are in place
3. Organize farmers and SMEs4. Make finance accessible
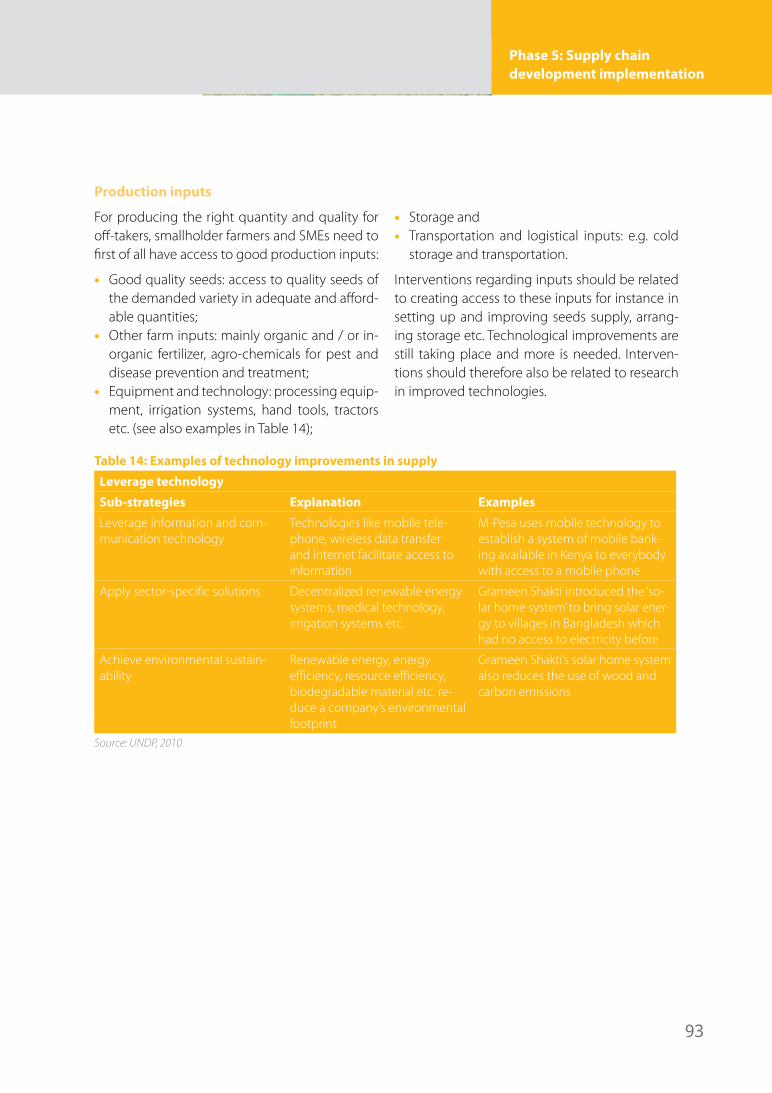
93
Phase 5: Supply chain development implementation
Production inputs
For producing the right quantity and quality for off-takers, smallholder farmers and SMEs need to first of all have access to good production inputs:
• Good quality seeds: access to quality seeds of the demanded variety in adequate and afford-able quantities;
• Other farm inputs: mainly organic and / or in-organic fertilizer, agro-chemicals for pest and disease prevention and treatment;
• Equipment and technology: processing equip-ment, irrigation systems, hand tools, tractors etc. (see also examples in Table 14);
• Storage and• Transportation and logistical inputs: e.g. cold
storage and transportation.
Interventions regarding inputs should be related to creating access to these inputs for instance in setting up and improving seeds supply, arrang-ing storage etc. Technological improvements are still taking place and more is needed. Interven-tions should therefore also be related to research in improved technologies.
Table 14: Examples of technology improvements in supply
Leverage technology
Sub-strategies Explanation Examples
Leverage information and com-munication technology
Technologies like mobile tele-phone, wireless data transfer and internet facilitate access to information
M-Pesa uses mobile technology to establish a system of mobile bank-ing available in Kenya to everybody with access to a mobile phone
Apply sector-specific solutions Decentralized renewable energy systems, medical technology, irrigation systems etc.
Grameen Shakti introduced the ‘so-lar home system’ to bring solar ener-gy to villages in Bangladesh which had no access to electricity before
Achieve environmental sustain-ability
Renewable energy, energy efficiency, resource efficiency, biodegradable material etc. re-duce a company’s environmental footprint
Grameen Shakti’s solar home system also reduces the use of wood and carbon emissions
Source: UNDP, 2010
94
8 African Agribusiness Supplier Development Programme (AASDP) Toolkit
Farm and SME supply management skills
Box 5: Supply Chain Logistics skills (timely delivery)
Timely delivery is a major requirement of customers in order to manage their production out-flow. It is also important in reducing costs, since machines that stand still cost money. By training suppliers on better time management just-in-time practices will help in:
• Shorter manufacturing cycle periods;• Smoother process flows;• Reduced stock in hand;• Hence lower costs;• Reduced reserve stocks;• Stock warranty extension removed;• Greater space availability;• Improved subcontracting relations; and• Optimization involves primarily: Rapid throughput (short storage periods).
Source: UNIDO, 2005
In order to enhance quantity and quality of pro-duction, there is a demand for direct technical advisory and training services to suppliers in or-der to make production processes and supply operations more efficient.
These services include:
• Technical agricultural extensions services for Good Agricultural Practices (GAP) - this should also include practices that take into account environmental aspects (see for instance the Framework for Agricultural Adaptation to cli-mate change impact in South Nigeria in Figure 16. The UNDP / GEF guideline for protecting biodiversity in production landscapes (2011) or the Community Based Risk Screening Tool – Adaptation and Livelihoods (CRISTAL) that screens environmental risks in resource de-pendent communities http://www.iisd.org/cristaltool/download.aspx);
• Economics, marketing and business manage-ment expertise (e.g. farm enterprise analysis, marketing information and business planning etc.);
• Post-production expertise aimed at creating value along the value chain through improved post-harvest handling, packaging, storage and distribution, while meeting food safety and quality requirements.
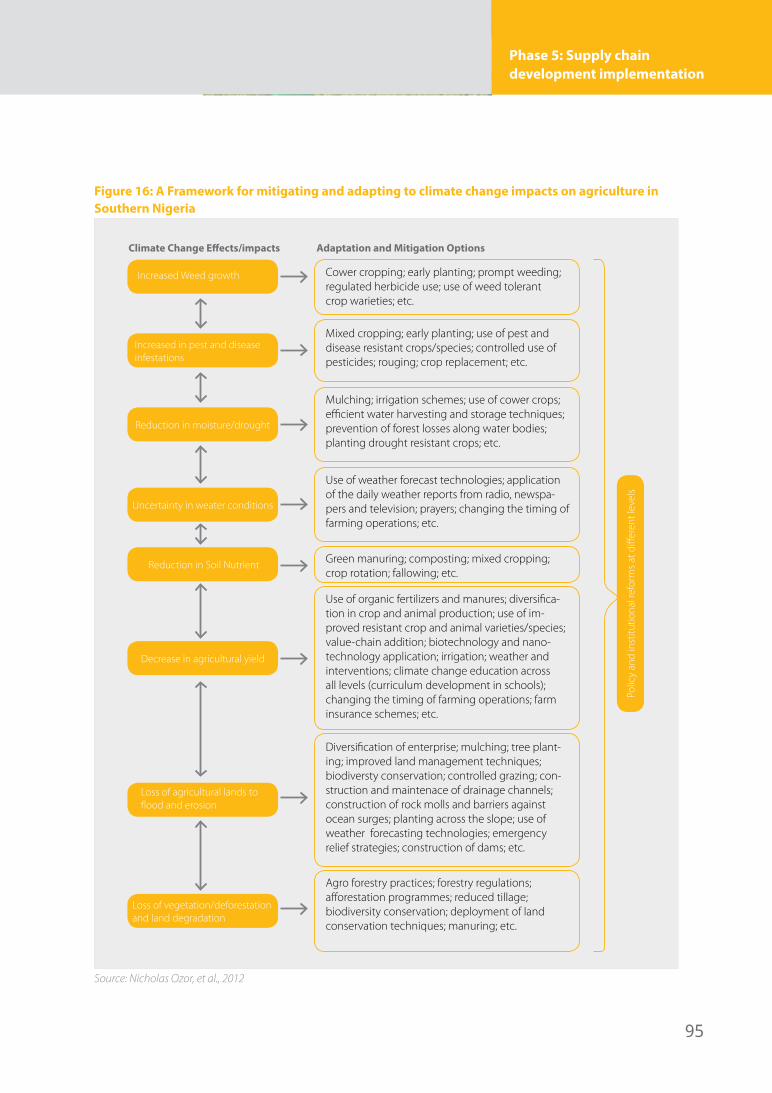
95
Phase 5: Supply chain development implementation
Figure 16: A Framework for mitigating and adapting to climate change impacts on agriculture in Southern Nigeria
Climate Change Effects/impacts
Increased Weed growth Cower cropping; early planting; prompt weeding; regulated herbicide use; use of weed tolerant crop warieties; etc.
Mixed cropping; early planting; use of pest and disease resistant crops/species; controlled use of pesticides; rouging; crop replacement; etc.
Mulching; irrigation schemes; use of cower crops; efficient water harvesting and storage techniques; prevention of forest losses along water bodies; planting drought resistant crops; etc.
Use of weather forecast technologies; application of the daily weather reports from radio, newspa-pers and television; prayers; changing the timing of farming operations; etc.
Green manuring; composting; mixed cropping; crop rotation; fallowing; etc.
Use of organic fertilizers and manures; diversifica-tion in crop and animal production; use of im-proved resistant crop and animal varieties/species; value-chain addition; biotechnology and nano-technology application; irrigation; weather and interventions; climate change education across all levels (curriculum development in schools); changing the timing of farming operations; farm insurance schemes; etc.
Diversification of enterprise; mulching; tree plant-ing; improved land management techniques; biodiversty conservation; controlled grazing; con-struction and maintenace of drainage channels; construction of rock molls and barriers against ocean surges; planting across the slope; use of weather forecasting technologies; emergency relief strategies; construction of dams; etc.
Agro forestry practices; forestry regulations; afforestation programmes; reduced tillage; biodiversity conservation; deployment of land conservation techniques; manuring; etc.
Increased in pest and disease infestations
Reduction in moisture/drought
Uncertainty in weater conditions
Reduction in Soil Nutrient
Decrease in agricultural yield
Loss of agricultural lands to flood and erosion
Loss of vegetation/deforestation and land degradation
Adaptation and Mitigation Options
Polic
y an
d in
stitu
tiona
l ref
orm
s at d
iffer
ent l
evel
s
Source: Nicholas Ozor, et al., 2012
96
8 African Agribusiness Supplier Development Programme (AASDP) Toolkit
Applied approaches have been developed for improving the productivity of SMEs.
A useful source for capacity building services is the SME toolkit developed by IFC. It offers free business management information and training for small businesses / small and medium enter-prises (SMEs) on accounting and finance, busi-ness planning, human resources (HR), marketing and sales, operations, and information technolo-gy (IT). It can be found at http://www.smetoolkit.org/smetoolkit/en.
UNDP’s strategy should be to leverage such pro-grammes by partnering with IFC in countries where the latter is active in SME development.
Quality and control systems
The quality of products for export markets and increasingly also for African markets is getting more important, with the increase number of more conscious consumers. Already, countries are further developing their regulations on food quality and safety. In order to manage quality right from the beginning of supply chains, again different systems exist. Which system is applied in which supply chain often depends on the re-quirement of the off-taker. For instance, some companies develop their own Internal Control Systems, while others work with external certi-fication systems. Therefore there is a difference between Quality Management and Quality certi-fication (see also phase 3 Analysis, in which qual-ity systems are being mapped), where Quality management can exist without external auditing, while for the latter external audits are required.
A whole range of sustainability certification sys-tems exist for different levels in the supply chain (farmer, SME etc.). Some of these systems are more focused on control environmental aspects of agricultural practices, for instance EKO and Rainforest Alliance, while others put more weight on social and equity aspects, such as fair wages and margins in a supply chain and labour condi-tions, for instance Fair Trade. A snapshot of certi-fication systems is given in the reading box (KIT, 2008b).
Africa’s more conscious consumers have created a demand for more quality products and many countries are developing their regulations on food quality and safety.
© IF
AD
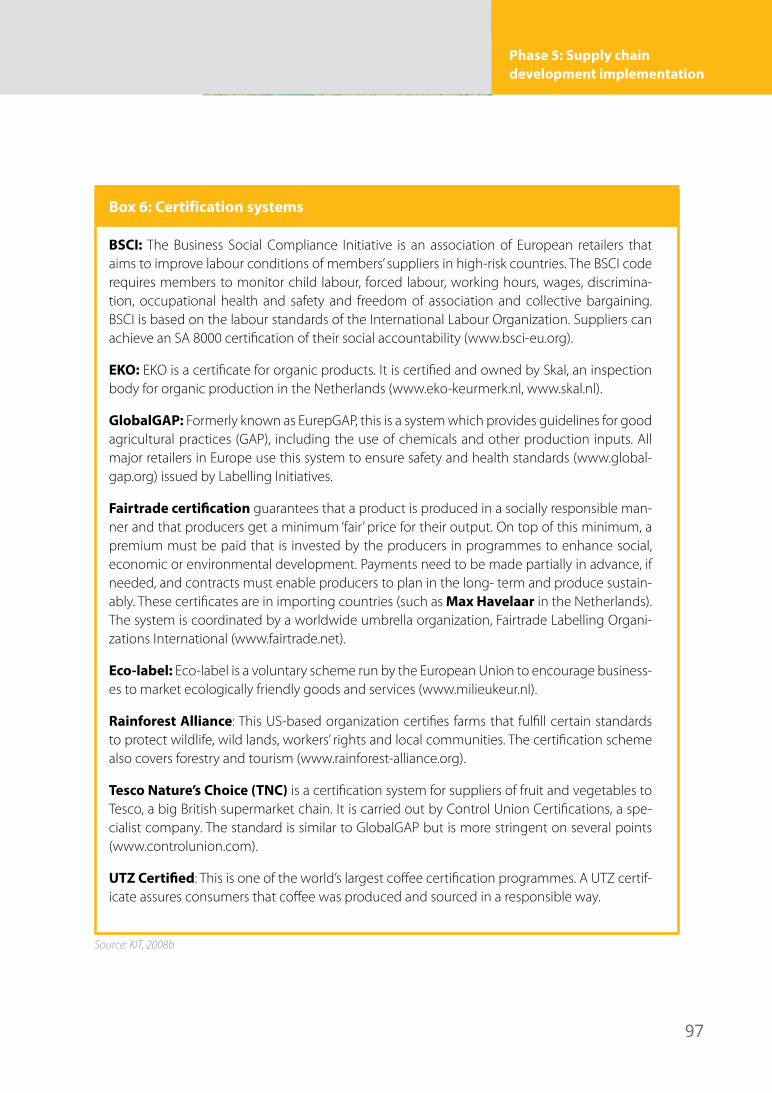
97
Phase 5: Supply chain development implementation
Box 6: Certification systems
BSCI: The Business Social Compliance Initiative is an association of European retailers that aims to improve labour conditions of members’ suppliers in high-risk countries. The BSCI code requires members to monitor child labour, forced labour, working hours, wages, discrimina-tion, occupational health and safety and freedom of association and collective bargaining. BSCI is based on the labour standards of the International Labour Organization. Suppliers can achieve an SA 8000 certification of their social accountability (www.bsci-eu.org).
EKO: EKO is a certificate for organic products. It is certified and owned by Skal, an inspection body for organic production in the Netherlands (www.eko-keurmerk.nl, www.skal.nl).
GlobalGAP: Formerly known as EurepGAP, this is a system which provides guidelines for good agricultural practices (GAP), including the use of chemicals and other production inputs. All major retailers in Europe use this system to ensure safety and health standards (www.global-gap.org) issued by Labelling Initiatives.
Fairtrade certification guarantees that a product is produced in a socially responsible man-ner and that producers get a minimum ‘fair’ price for their output. On top of this minimum, a premium must be paid that is invested by the producers in programmes to enhance social, economic or environmental development. Payments need to be made partially in advance, if needed, and contracts must enable producers to plan in the long- term and produce sustain-ably. These certificates are in importing countries (such as Max Havelaar in the Netherlands). The system is coordinated by a worldwide umbrella organization, Fairtrade Labelling Organi-zations International (www.fairtrade.net).
Eco-label: Eco-label is a voluntary scheme run by the European Union to encourage business-es to market ecologically friendly goods and services (www.milieukeur.nl).
Rainforest Alliance: This US-based organization certifies farms that fulfill certain standards to protect wildlife, wild lands, workers’ rights and local communities. The certification scheme also covers forestry and tourism (www.rainforest-alliance.org).
Tesco Nature’s Choice (TNC) is a certification system for suppliers of fruit and vegetables to Tesco, a big British supermarket chain. It is carried out by Control Union Certifications, a spe-cialist company. The standard is similar to GlobalGAP but is more stringent on several points (www.controlunion.com).
UTZ Certified: This is one of the world’s largest coffee certification programmes. A UTZ certif-icate assures consumers that coffee was produced and sourced in a responsible way.
Source: KIT, 2008b
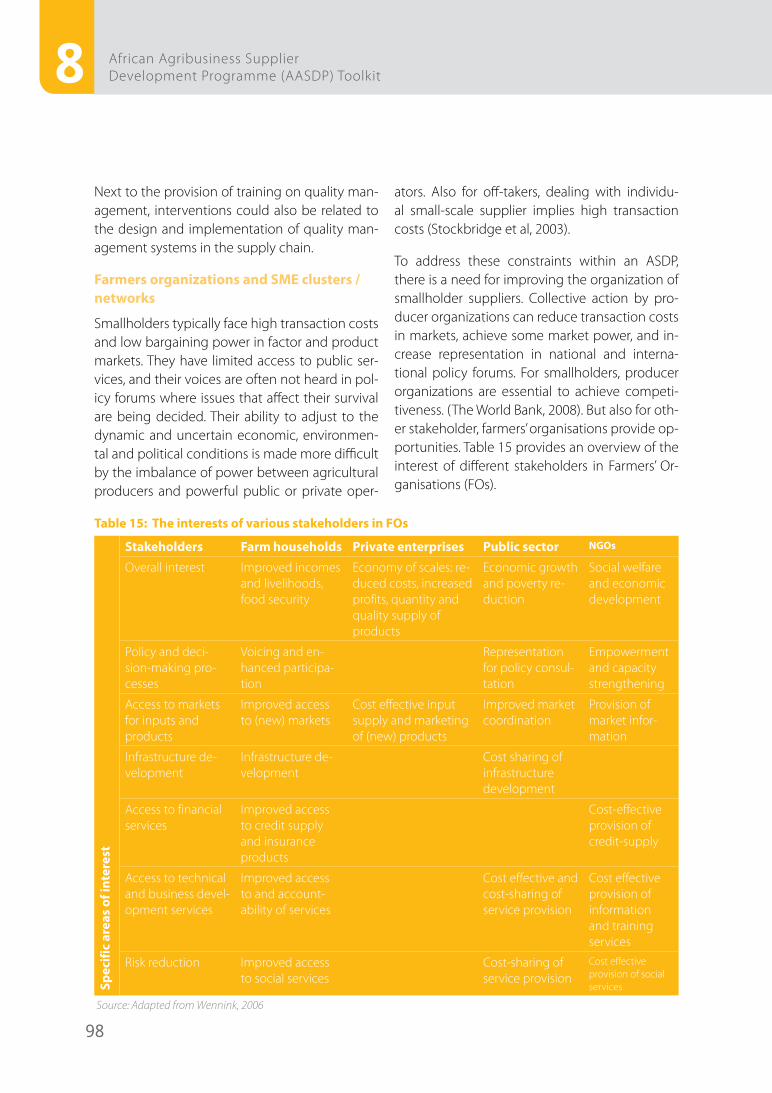
98
8 African Agribusiness Supplier Development Programme (AASDP) Toolkit
Next to the provision of training on quality man-agement, interventions could also be related to the design and implementation of quality man-agement systems in the supply chain.
Farmers organizations and SME clusters / networks
Smallholders typically face high transaction costs and low bargaining power in factor and product markets. They have limited access to public ser-vices, and their voices are often not heard in pol-icy forums where issues that affect their survival are being decided. Their ability to adjust to the dynamic and uncertain economic, environmen-tal and political conditions is made more difficult by the imbalance of power between agricultural producers and powerful public or private oper-
ators. Also for off-takers, dealing with individu-al small-scale supplier implies high transaction costs (Stockbridge et al, 2003).
To address these constraints within an ASDP, there is a need for improving the organization of smallholder suppliers. Collective action by pro-ducer organizations can reduce transaction costs in markets, achieve some market power, and in-crease representation in national and interna-tional policy forums. For smallholders, producer organizations are essential to achieve competi-tiveness. (The World Bank, 2008). But also for oth-er stakeholder, farmers’ organisations provide op-portunities. Table 15 provides an overview of the interest of different stakeholders in Farmers’ Or-ganisations (FOs).
Table 15: The interests of various stakeholders in FOs
Spec
ific
area
s of
inte
rest
Stakeholders Farm households Private enterprises Public sector NGOs
Overall interest Improved incomes and livelihoods, food security
Economy of scales: re-duced costs, increased profits, quantity and quality supply of products
Economic growth and poverty re-duction
Social welfare and economic development
Policy and deci-sion-making pro-cesses
Voicing and en-hanced participa-tion
Representation for policy consul-tation
Empowerment and capacity strengthening
Access to markets for inputs and products
Improved access to (new) markets
Cost effective input supply and marketing of (new) products
Improved market coordination
Provision of market infor-mation
Infrastructure de-velopment
Infrastructure de-velopment
Cost sharing of infrastructure development
Access to financial services
Improved access to credit supply and insurance products
Cost-effective provision of credit-supply
Access to technical and business devel-opment services
Improved access to and account-ability of services
Cost effective and cost-sharing of service provision
Cost effective provision of information and training services
Risk reduction Improved access to social services
Cost-sharing of service provision
Cost effective provision of social services
Source: Adapted from Wennink, 2006
99
Phase 5: Supply chain development implementation
Producer organizations are membership-based organizations or federations of organizations with elected leaders accountable to their con-stituents. They take on different forms, varying in both size and the services they provide, such as farmer groups, associations, cooperatives (primary, unions, etc.), societies, federations and chambers of agriculture. Their functions can be grouped in three categories:
• Commodity-specific organizations focusing on economic services and defending their members’ interests in a particular commodity, such as cocoa, coffee, or cotton
• Advocacy organizations to represent produc-ers’ interests, such as national producers’ unions
• Multipurpose organizations that respond to the diverse economic and social needs of their members, often in the absence of local gov-ernments or effective public services
For the ASDP, the first category is the most ap-propriate. Producers are organizing from local to national level, and increasingly at the regional and international levels. The latter organizations enable producers to participate in consultations with regional and international bodies (Stock-bridge et al, 2003).
In spite of many successes, producer organiza-tions’ effectiveness is frequently constrained by legal restrictions, low managerial capacity, elite capture, exclusion of the poor, and failure to be recognized as full partners by the state. They face five major challenges, both internal and external to the organization.
1. Dealing with duality - conflicts between ef-ficiency and equity: Producer organizations operate in rural communities where they are subject to norms and values of social inclu-sion and solidarity. This may clash with the re-quirements of professional, business-oriented organizations that must help members com-pete to survive in the market place.
2. Dealing with a heterogeneous membership: Producer organizations have to represent the interests of a diverse membership, creating a major challenge in achieving fair representa-tion across a widening spectrum of interests. Leaders tend to be older males, larger-scale farmers, and members of the rural elite. Yet, organizations have to ensure that the interests of smallholders, women, and young produc-ers are fairly represented and their needs ad-equately served. Important is to put in place more transparent decision-making mecha-nisms as well as information and communi-cation systems to empower the newer and weaker members, improve the governance of the organizations, and enforce leaders’ ac-countability toward their members.
100
8 African Agribusiness Supplier Development Programme (AASDP) Toolkit
3. Developing managerial capacity for value chains: Supply chains place new demands on the managers of producer organizations. Managers must deal with more sophisticated supply chains, with stringent and changing re-quirements. They must ensure that members’ supplies meet the demands of these chains, achieving scale and timely delivery, satisfy-ing sanitary and phytosanitary standards and meeting the specifications demanded by off-takers.
4. Participating in high-level negotiations: Pro-ducer organizations participating in high-lev-el technical discussions, such as global trade negotiations, need new technical and com-munication skills. In addition, experts that rep-resent the organizations must remain true to national and local members’ interests, a diffi-cult challenge for apex organizations covering a wide range of interests. This requires main-taining open channels of communication with their members at the local, regional, and national levels.
5. Dealing with a sometimes-unfavourable ex-ternal environment: However effective they are internally in meeting the above four chal-
lenges, producer organizations cannot suc-cessfully promote the interests of smallhold-ers without an enabling legal, regulatory, and policy environment that guarantees the orga-nizations’ autonomy. This requires changing the mindset of policymakers and staff in gov-ernment agencies about the role of the orga-nizations. Organizations must be recognized as full-fledged actors, not as instruments of policies designed and implemented without consulting them, nor as channels for imple-menting donors’ agendas. Public services must be client oriented to partner with the or-ganizations, and governments’ interference in cooperatives management must be removed.
For an ASDP to be successful it is important to work on these challenges and help FOs become effective Producer organisations. Thomspon et al (2009) have published what effective producer organisations are. They have developed critical elements based on “the seven habits of highly effective people” by Stephen R. Covey (see Table 16). Interventions related to strengthening farm organizations should be focussed on developing these elements.
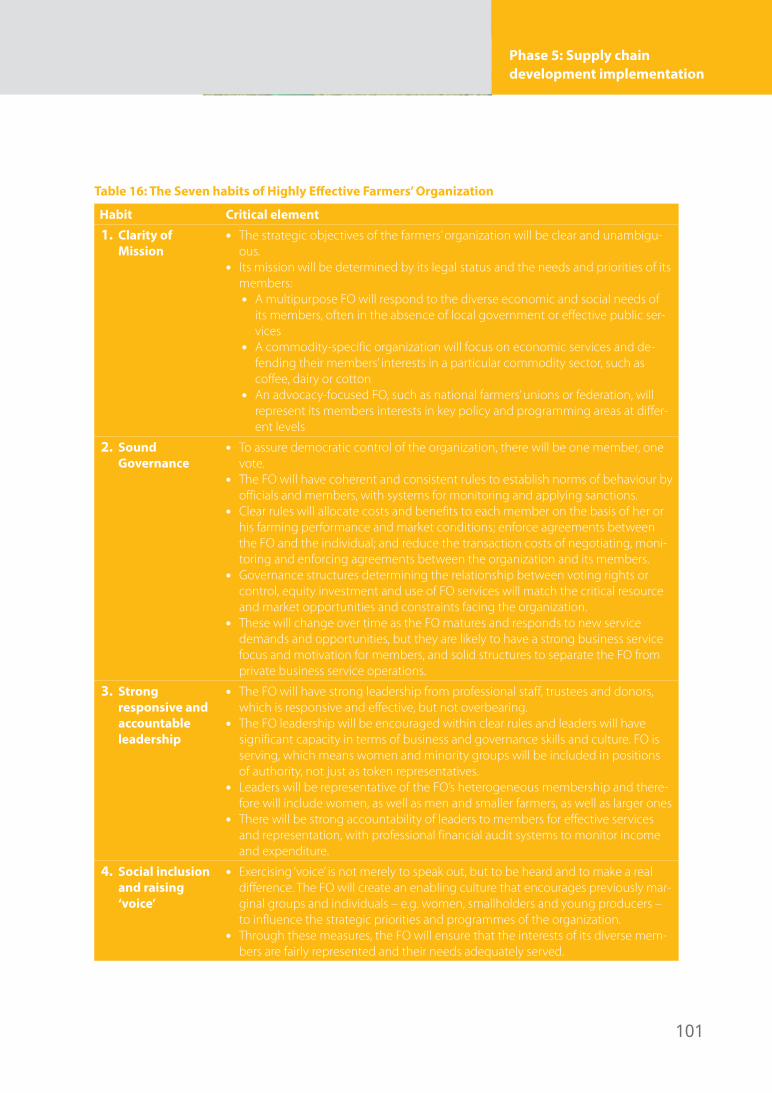
101
Phase 5: Supply chain development implementation
Table 16: The Seven habits of Highly Effective Farmers’ Organization
Habit Critical element
1. Clarity of Mission
• The strategic objectives of the farmers’ organization will be clear and unambigu-ous.
• Its mission will be determined by its legal status and the needs and priorities of its members:• A multipurpose FO will respond to the diverse economic and social needs of
its members, often in the absence of local government or effective public ser-vices
• A commodity-specific organization will focus on economic services and de-fending their members’ interests in a particular commodity sector, such as coffee, dairy or cotton
• An advocacy-focused FO, such as national farmers’ unions or federation, will represent its members interests in key policy and programming areas at differ-ent levels
2. Sound Governance
• To assure democratic control of the organization, there will be one member, one vote.
• The FO will have coherent and consistent rules to establish norms of behaviour by officials and members, with systems for monitoring and applying sanctions.
• Clear rules will allocate costs and benefits to each member on the basis of her or his farming performance and market conditions; enforce agreements between the FO and the individual; and reduce the transaction costs of negotiating, moni-toring and enforcing agreements between the organization and its members.
• Governance structures determining the relationship between voting rights or control, equity investment and use of FO services will match the critical resource and market opportunities and constraints facing the organization.
• These will change over time as the FO matures and responds to new service demands and opportunities, but they are likely to have a strong business service focus and motivation for members, and solid structures to separate the FO from private business service operations.
3. Strong responsive and accountable leadership
• The FO will have strong leadership from professional staff, trustees and donors, which is responsive and effective, but not overbearing.
• The FO leadership will be encouraged within clear rules and leaders will have significant capacity in terms of business and governance skills and culture. FO is serving, which means women and minority groups will be included in positions of authority, not just as token representatives.
• Leaders will be representative of the FO’s heterogeneous membership and there-fore will include women, as well as men and smaller farmers, as well as larger ones
• There will be strong accountability of leaders to members for effective services and representation, with professional financial audit systems to monitor income and expenditure.
4. Social inclusion and raising ‘voice’
• Exercising ‘voice’ is not merely to speak out, but to be heard and to make a real difference. The FO will create an enabling culture that encourages previously mar-ginal groups and individuals – e.g. women, smallholders and young producers – to influence the strategic priorities and programmes of the organization.
• Through these measures, the FO will ensure that the interests of its diverse mem-bers are fairly represented and their needs adequately served.
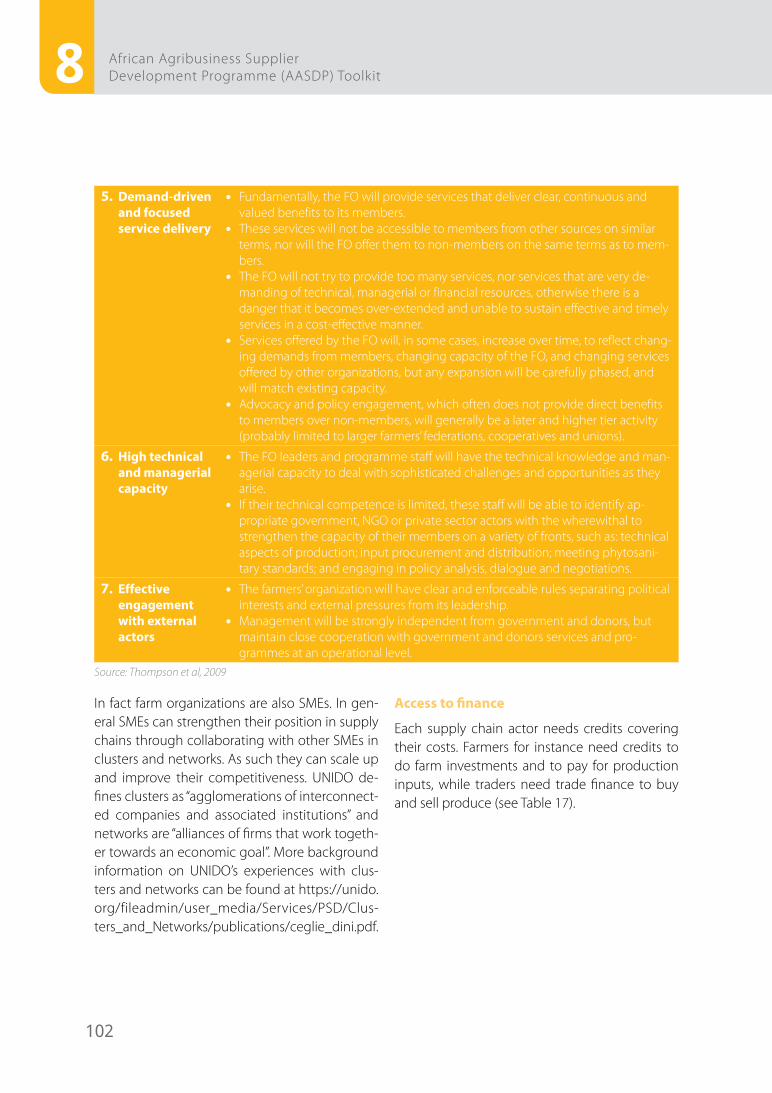
102
8 African Agribusiness Supplier Development Programme (AASDP) Toolkit
5. Demand-driven and focused service delivery
• Fundamentally, the FO will provide services that deliver clear, continuous and valued benefits to its members.
• These services will not be accessible to members from other sources on similar terms, nor will the FO offer them to non-members on the same terms as to mem-bers.
• The FO will not try to provide too many services, nor services that are very de-manding of technical, managerial or financial resources, otherwise there is a danger that it becomes over-extended and unable to sustain effective and timely services in a cost-effective manner.
• Services offered by the FO will, in some cases, increase over time, to reflect chang-ing demands from members, changing capacity of the FO, and changing services offered by other organizations, but any expansion will be carefully phased, and will match existing capacity.
• Advocacy and policy engagement, which often does not provide direct benefits to members over non-members, will generally be a later and higher tier activity (probably limited to larger farmers’ federations, cooperatives and unions).
6. High technical and managerial capacity
• The FO leaders and programme staff will have the technical knowledge and man-agerial capacity to deal with sophisticated challenges and opportunities as they arise.
• If their technical competence is limited, these staff will be able to identify ap-propriate government, NGO or private sector actors with the wherewithal to strengthen the capacity of their members on a variety of fronts, such as: technical aspects of production; input procurement and distribution; meeting phytosani-tary standards; and engaging in policy analysis, dialogue and negotiations.
7. Effective engagement with external actors
• The farmers’ organization will have clear and enforceable rules separating political interests and external pressures from its leadership.
• Management will be strongly independent from government and donors, but maintain close cooperation with government and donors services and pro-grammes at an operational level.
Source: Thompson et al, 2009
In fact farm organizations are also SMEs. In gen-eral SMEs can strengthen their position in supply chains through collaborating with other SMEs in clusters and networks. As such they can scale up and improve their competitiveness. UNIDO de-fines clusters as “agglomerations of interconnect-ed companies and associated institutions” and networks are “alliances of firms that work togeth-er towards an economic goal”. More background information on UNIDO’s experiences with clus-ters and networks can be found at https://unido.org/fileadmin/user_media/Services/PSD/Clus-ters_and_Networks/publications/ceglie_dini.pdf.
Access to finance
Each supply chain actor needs credits covering their costs. Farmers for instance need credits to do farm investments and to pay for production inputs, while traders need trade finance to buy and sell produce (see Table 17).
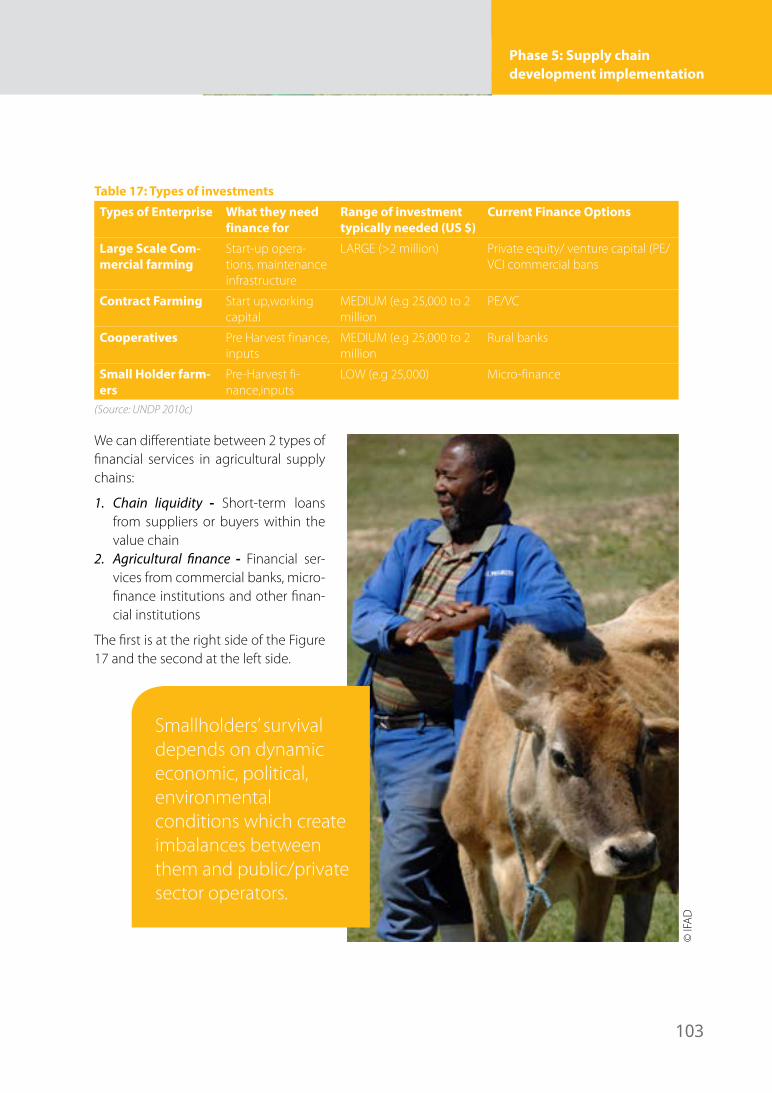
103
Phase 5: Supply chain development implementation
Table 17: Types of investments
Types of Enterprise What they need finance for
Range of investment typically needed (US $)
Current Finance Options
Large Scale Com-mercial farming
Start-up opera-tions, maintenance infrastructure
LARGE (>2 million) Private equity/ venture capital (PE/VCI commercial bans
Contract Farming Start up,working capital
MEDIUM (e.g 25,000 to 2 million
PE/VC
Cooperatives Pre Harvest finance, inputs
MEDIUM (e.g 25,000 to 2 million
Rural banks
Small Holder farm-ers
Pre-Harvest fi-nance,inputs
LOW (e.g 25,000) Micro-finance
(Source: UNDP 2010c)
We can differentiate between 2 types of financial services in agricultural supply chains:
1. Chain liquidity - Short-term loans from suppliers or buyers within the value chain
2. Agricultural finance - Financial ser-vices from commercial banks, micro-finance institutions and other finan-cial institutions
The first is at the right side of the Figure 17 and the second at the left side.
Smallholders’ survival depends on dynamic economic, political, environmental conditions which create imbalances between them and public/private sector operators.
© IF
AD
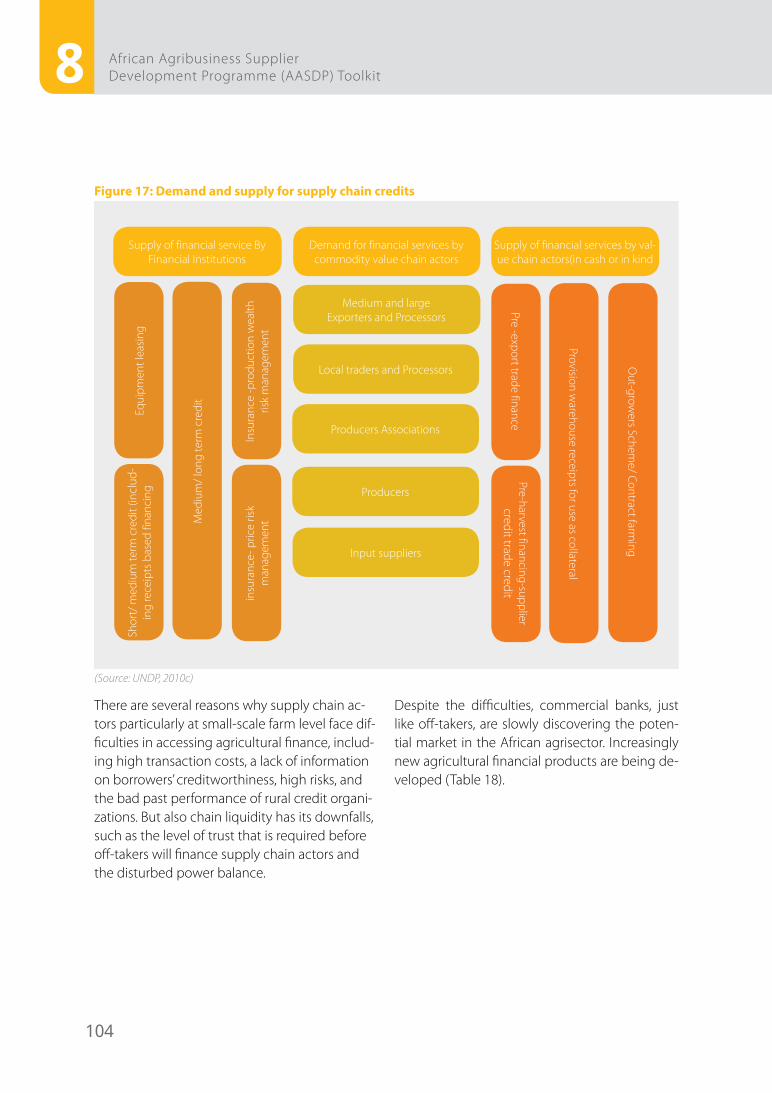
104
8 African Agribusiness Supplier Development Programme (AASDP) Toolkit
Figure 17: Demand and supply for supply chain credits
Equi
pmen
t lea
sing
Shor
t/ m
ediu
m te
rm c
redi
t (in
clud
-in
g re
ceip
ts b
ased
fina
ncin
g
Supply of financial service ByFinancial Institutions
Demand for financial services by commodity value chain actors
Medium and large Exporters and Processors
Insu
ranc
e -p
rodu
ctio
n w
ealth
ris
k m
anag
emen
tPre-harvest financing-supplier
credit trade credit
Out-grow
ers Scheme/ Contract farm
ing
insu
ranc
e- p
rice
risk
man
agem
ent
Pre -export trade finance
Med
ium
/ lon
g te
rm c
redi
t Provision w
arehouse receipts for use as collateral
Local traders and Processors
Producers Associations
Producers
Input suppliers
Supply of financial services by val-ue chain actors(in cash or in kind
(Source: UNDP, 2010c)
There are several reasons why supply chain ac-tors particularly at small-scale farm level face dif-ficulties in accessing agricultural finance, includ-ing high transaction costs, a lack of information on borrowers’ creditworthiness, high risks, and the bad past performance of rural credit organi-zations. But also chain liquidity has its downfalls, such as the level of trust that is required before off-takers will finance supply chain actors and the disturbed power balance.
Despite the difficulties, commercial banks, just like off-takers, are slowly discovering the poten-tial market in the African agrisector. Increasingly new agricultural financial products are being de-veloped (Table 18).
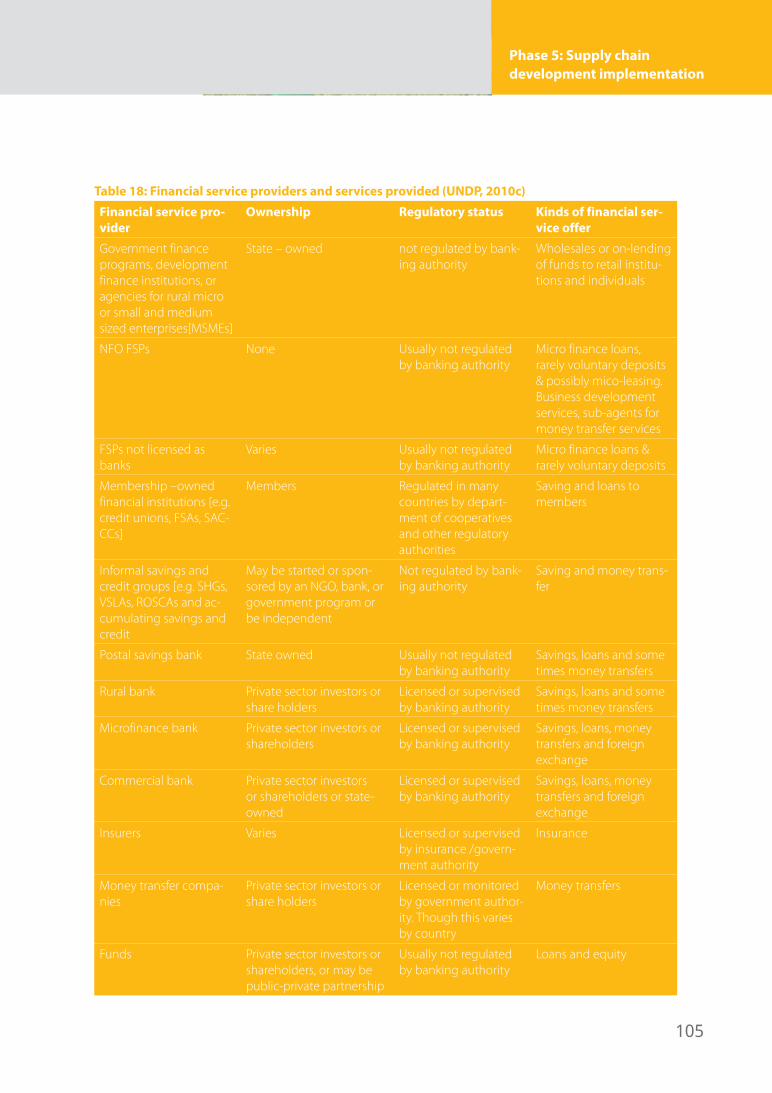
105
Phase 5: Supply chain development implementation
Table 18: Financial service providers and services provided (UNDP, 2010c)
Financial service pro-vider
Ownership Regulatory status Kinds of financial ser-vice offer
Government finance programs, development finance institutions, or agencies for rural micro or small and medium sized enterprises[MSMEs]
State – owned not regulated by bank-ing authority
Wholesales or on-lending of funds to retail institu-tions and individuals
NFO FSPs None Usually not regulated by banking authority
Micro finance loans, rarely voluntary deposits & possibly mico-leasing. Business development services, sub-agents for money transfer services
FSPs not licensed as banks
Varies Usually not regulated by banking authority
Micro finance loans & rarely voluntary deposits
Membership –owned financial institutions [e.g. credit unions, FSAs, SAC-CCs]
Members Regulated in many countries by depart-ment of cooperatives and other regulatory authorities
Saving and loans to members
Informal savings and credit groups [e.g. SHGs, VSLAs, ROSCAs and ac-cumulating savings and credit
May be started or spon-sored by an NGO, bank, or government program or be independent
Not regulated by bank-ing authority
Saving and money trans-fer
Postal savings bank State owned Usually not regulated by banking authority
Savings, loans and some times money transfers
Rural bank Private sector investors or share holders
Licensed or supervised by banking authority
Savings, loans and some times money transfers
Microfinance bank Private sector investors or shareholders
Licensed or supervised by banking authority
Savings, loans, money transfers and foreign exchange
Commercial bank Private sector investors or shareholders or state-owned
Licensed or supervised by banking authority
Savings, loans, money transfers and foreign exchange
Insurers Varies Licensed or supervised by insurance /govern-ment authority
Insurance
Money transfer compa-nies
Private sector investors or share holders
Licensed or monitored by government author-ity. Though this varies by country
Money transfers
Funds Private sector investors or shareholders, or may be public-private partnership
Usually not regulated by banking authority
Loans and equity
106
8 African Agribusiness Supplier Development Programme (AASDP) Toolkit
An example of a successful micro finance bank can be read in Box 7.
Box 7: Microfinance in Kenya
Juhundi kilimo micro-finance company in Kenya was initially established to provide finance for the production and marketing of agricultural produce. However, in order to expand the market for a smallholder farmers and to increase microfinance clientele, the company began financing restaurant operators, milk packers and transport operators to help expand their businesses so that the farmers could have expand markets. Juhundi also provides loans to individuals farmers through solidarity groups and the loan amounts range between Kshs. 40,000 to Kshs. 3,000,000 (US$450-$3,500) at an interest rate of 18 percent. Repayment periods are also segmented and in 12 months,18 months, and 24 months and the financed assets are insured throughout the loan period. The loans are secured by the assets that are financed. Though loans are given to individ-uals farmers, Juhundi, in collaboration with local leaders formed solidarity groups that serve as credit guarantee structures.The Solidarity Groups regularly hold meetings serve as forums to mobilize savings and collect repayments. They also provide juhundi with an opportunity to conduct technical and manage-ment session for the farmers/borrowers .Juhundi’s client base in 2011 was roughly 10,000 and its financial partners include: Grassroots Business Fund, The Acumen Fund, The Garmeen Founda-tion, Kiva Micro-Funds and extension services support and technical assistance has been provid-ed by the Kenyan government, Swiss Contract and TechnoServe.
Source: UNDP AFIM, 2012
Commercial agricultural financial services are still in an infant stage and the penetration is still limit-ed. For improving supply chains there is therefore an urgent need for interventions in accessing fi-nance.
An interesting approach of creating access to finance, is ‘Value chain finance’. In value chain finance, a triangular collaboration is set up be-tween a supplier, buyer and credit organization (Figure 18). Based on a contract between the supplier and buyer, the credit organization pro-vides credits to the supplier. The off-taker guar-antees the pay back of the credit to the credit organization.
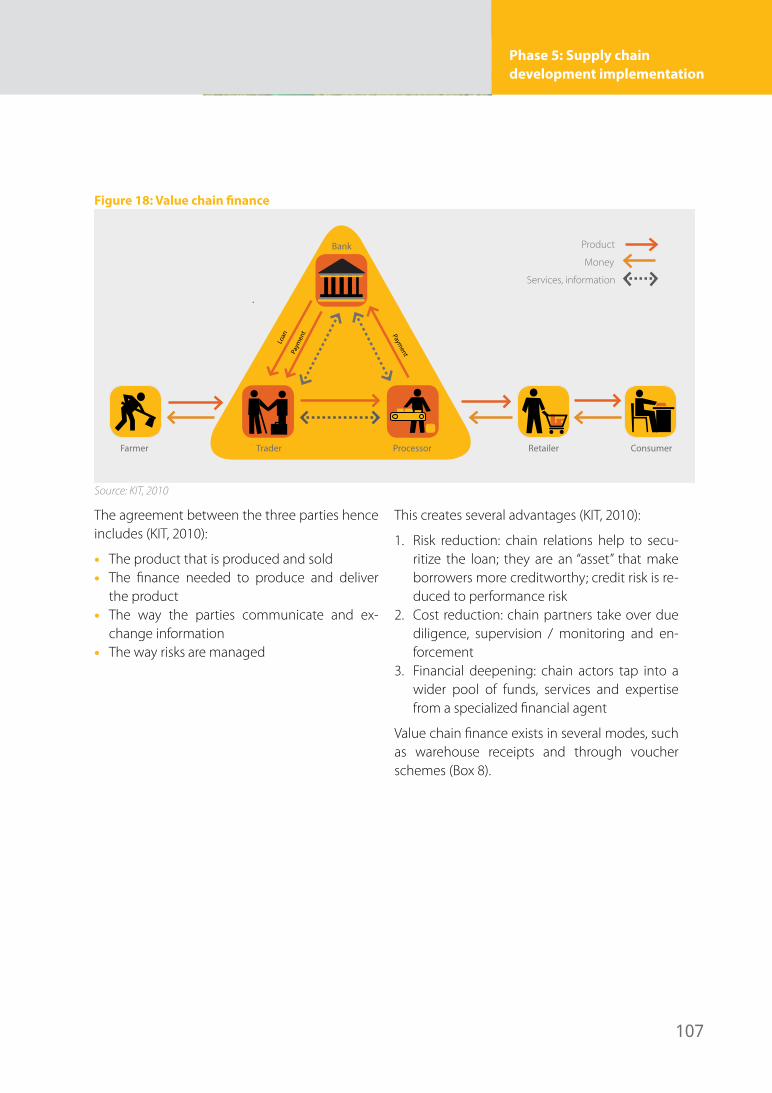
107
Phase 5: Supply chain development implementation
Figure 18: Value chain finance
Paym
ent Paym
ent
Farmer Trader Processor Retailer Consumer
Bank Product
Money
Services, informationLo
an
Source: KIT, 2010
The agreement between the three parties hence includes (KIT, 2010):
• The product that is produced and sold• The finance needed to produce and deliver
the product• The way the parties communicate and ex-
change information• The way risks are managed
This creates several advantages (KIT, 2010):
1. Risk reduction: chain relations help to secu-ritize the loan; they are an “asset” that make borrowers more creditworthy; credit risk is re-duced to performance risk
2. Cost reduction: chain partners take over due diligence, supervision / monitoring and en-forcement
3. Financial deepening: chain actors tap into a wider pool of funds, services and expertise from a specialized financial agent
Value chain finance exists in several modes, such as warehouse receipts and through voucher schemes (Box 8).
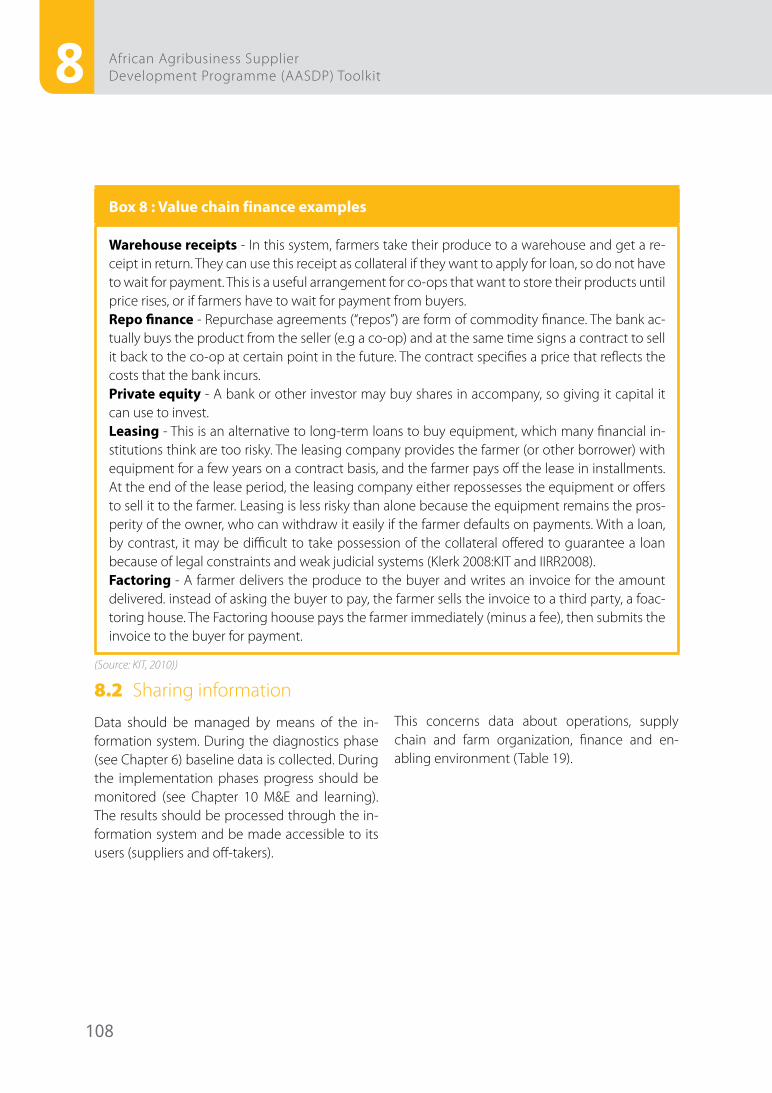
108
8 African Agribusiness Supplier Development Programme (AASDP) Toolkit
Box 8 : Value chain finance examples
Warehouse receipts - In this system, farmers take their produce to a warehouse and get a re-ceipt in return. They can use this receipt as collateral if they want to apply for loan, so do not have to wait for payment. This is a useful arrangement for co-ops that want to store their products until price rises, or if farmers have to wait for payment from buyers.Repo finance - Repurchase agreements (“repos”) are form of commodity finance. The bank ac-tually buys the product from the seller (e.g a co-op) and at the same time signs a contract to sell it back to the co-op at certain point in the future. The contract specifies a price that reflects the costs that the bank incurs.Private equity - A bank or other investor may buy shares in accompany, so giving it capital it can use to invest.Leasing - This is an alternative to long-term loans to buy equipment, which many financial in-stitutions think are too risky. The leasing company provides the farmer (or other borrower) with equipment for a few years on a contract basis, and the farmer pays off the lease in installments. At the end of the lease period, the leasing company either repossesses the equipment or offers to sell it to the farmer. Leasing is less risky than alone because the equipment remains the pros-perity of the owner, who can withdraw it easily if the farmer defaults on payments. With a loan, by contrast, it may be difficult to take possession of the collateral offered to guarantee a loan because of legal constraints and weak judicial systems (Klerk 2008:KIT and IIRR2008).Factoring - A farmer delivers the produce to the buyer and writes an invoice for the amount delivered. instead of asking the buyer to pay, the farmer sells the invoice to a third party, a foac-toring house. The Factoring hoouse pays the farmer immediately (minus a fee), then submits the invoice to the buyer for payment.
(Source: KIT, 2010))
8.2 Sharing information
Data should be managed by means of the in-formation system. During the diagnostics phase (see Chapter 6) baseline data is collected. During the implementation phases progress should be monitored (see Chapter 10 M&E and learning). The results should be processed through the in-formation system and be made accessible to its users (suppliers and off-takers).
This concerns data about operations, supply chain and farm organization, finance and en-abling environment (Table 19).
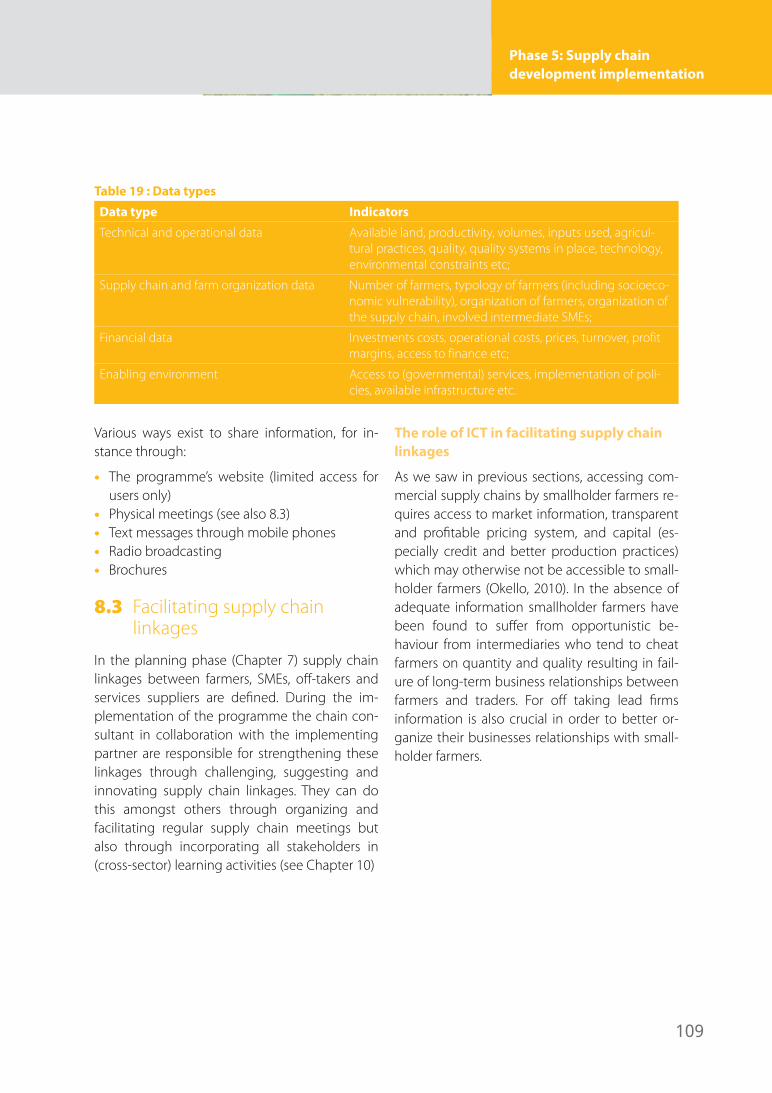
109
Phase 5: Supply chain development implementation
Table 19 : Data types
Data type Indicators
Technical and operational data Available land, productivity, volumes, inputs used, agricul-tural practices, quality, quality systems in place, technology, environmental constraints etc;
Supply chain and farm organization data Number of farmers, typology of farmers (including socioeco-nomic vulnerability), organization of farmers, organization of the supply chain, involved intermediate SMEs;
Financial data Investments costs, operational costs, prices, turnover, profit margins, access to finance etc;
Enabling environment Access to (governmental) services, implementation of poli-cies, available infrastructure etc.
Various ways exist to share information, for in-stance through:
• The programme’s website (limited access for users only)
• Physical meetings (see also 8.3)• Text messages through mobile phones• Radio broadcasting• Brochures
8.3 Facilitating supply chain linkages
In the planning phase (Chapter 7) supply chain linkages between farmers, SMEs, off-takers and services suppliers are defined. During the im-plementation of the programme the chain con-sultant in collaboration with the implementing partner are responsible for strengthening these linkages through challenging, suggesting and innovating supply chain linkages. They can do this amongst others through organizing and facilitating regular supply chain meetings but also through incorporating all stakeholders in (cross-sector) learning activities (see Chapter 10)
The role of ICT in facilitating supply chain linkages
As we saw in previous sections, accessing com-mercial supply chains by smallholder farmers re-quires access to market information, transparent and profitable pricing system, and capital (es-pecially credit and better production practices) which may otherwise not be accessible to small-holder farmers (Okello, 2010). In the absence of adequate information smallholder farmers have been found to suffer from opportunistic be-haviour from intermediaries who tend to cheat farmers on quantity and quality resulting in fail-ure of long-term business relationships between farmers and traders. For off taking lead firms information is also crucial in order to better or-ganize their businesses relationships with small-holder farmers.
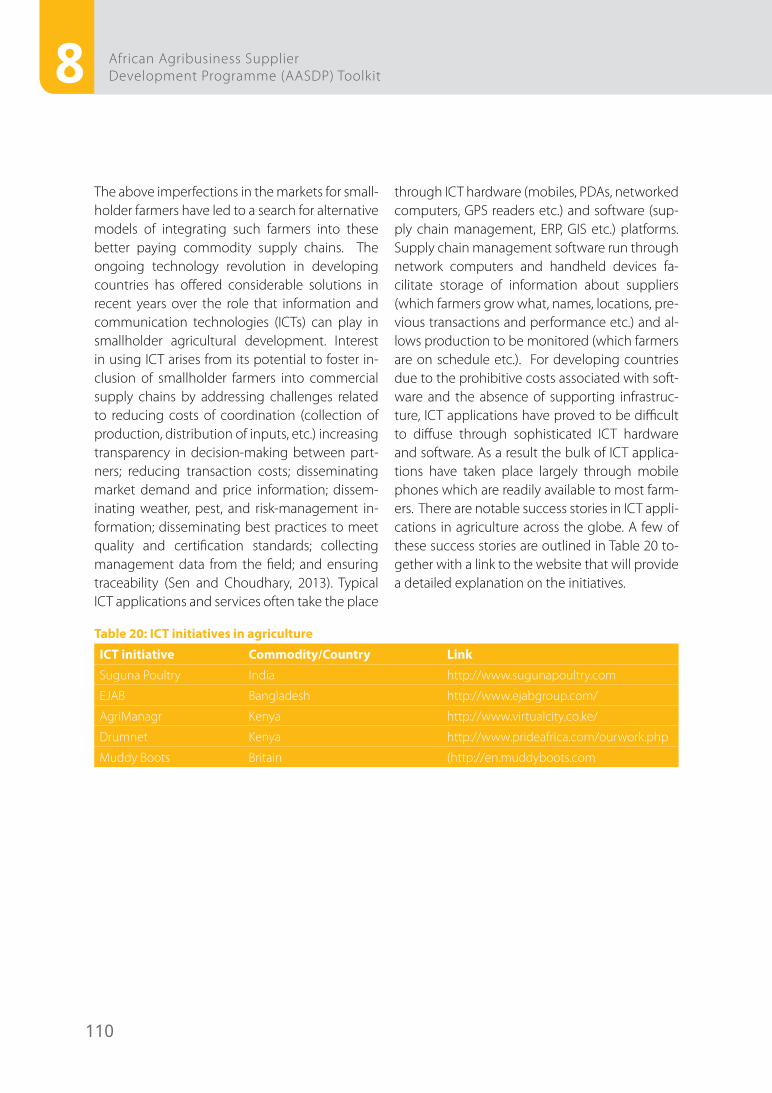
110
8 African Agribusiness Supplier Development Programme (AASDP) Toolkit
The above imperfections in the markets for small-holder farmers have led to a search for alternative models of integrating such farmers into these better paying commodity supply chains. The ongoing technology revolution in developing countries has offered considerable solutions in recent years over the role that information and communication technologies (ICTs) can play in smallholder agricultural development. Interest in using ICT arises from its potential to foster in-clusion of smallholder farmers into commercial supply chains by addressing challenges related to reducing costs of coordination (collection of production, distribution of inputs, etc.) increasing transparency in decision-making between part-ners; reducing transaction costs; disseminating market demand and price information; dissem-inating weather, pest, and risk-management in-formation; disseminating best practices to meet quality and certification standards; collecting management data from the field; and ensuring traceability (Sen and Choudhary, 2013). Typical ICT applications and services often take the place
through ICT hardware (mobiles, PDAs, networked computers, GPS readers etc.) and software (sup-ply chain management, ERP, GIS etc.) platforms. Supply chain management software run through network computers and handheld devices fa-cilitate storage of information about suppliers (which farmers grow what, names, locations, pre-vious transactions and performance etc.) and al-lows production to be monitored (which farmers are on schedule etc.). For developing countries due to the prohibitive costs associated with soft-ware and the absence of supporting infrastruc-ture, ICT applications have proved to be difficult to diffuse through sophisticated ICT hardware and software. As a result the bulk of ICT applica-tions have taken place largely through mobile phones which are readily available to most farm-ers. There are notable success stories in ICT appli-cations in agriculture across the globe. A few of these success stories are outlined in Table 20 to-gether with a link to the website that will provide a detailed explanation on the initiatives.
Table 20: ICT initiatives in agriculture
ICT initiative Commodity/Country Link
Suguna Poultry India http://www.sugunapoultry.com
EJAB Bangladesh http://www.ejabgroup.com/
AgriManagr Kenya http://www.virtualcity.co.ke/
Drumnet Kenya http://www.prideafrica.com/ourwork.php
Muddy Boots Britain (http://en.muddyboots.com
111
Phase 5: Supply chain development implementation
Public and private sector institutions have been at the centre of ICT interventions in agriculture each with a different motive influencing their participation. For the private sector, ICT inter-ventions serve as revenue-generating initiatives which offer institutions a competitive edge. These private sector driven ICT solutions often are limited to and exclusive to its business man-date and may not necessarily focus on smallhold-er farmers. For the public sector ICT interventions are more of a public good introduced with the broad objective of smallholder inclusion. Howev-er the greatest success of smallholder inclusion through ICT can best be realised through part-nerships between both public and private sector. Collaborative partnerships that integrate agri-business companies, mobile network operators, third-party service providers, and software firms as well as development institutions and research institutes can help ensure competitiveness of smallholder supply chain inclusion. According to Sen and Choudary (2013) public-private partner-ships are critical in the integration of smallhold-ers into commercial supply chains because the public sector on its own may lack the technical capacity to develop ICT interventions. The private sector on the other hand may lack the incentive to extend their outreach to smallholder farmers and technology companies may be reluctant to develop a product unless there is a guaranteed market for the product.
Although ICT may create opportunities to incor-porate smallholders effectively into commercial supply chains, successful deployment of the in-tervention is subject to some precondition en-ablers. For instance, basic ICT infrastructure such as telecommunications and electricity networks as well as the existence of complementary in-frastructure (roads, storage facilities, transport, financial infrastructure, etc.) is crucial in ensuring the success of ICT in agriculture. Enabling envi-ronments that encourage smallholder inclusion in supply chains through ICT are also quite im-portant. Human capacity in terms of technology literacy is also critical in ensuring scalable uptake of the practice amongst smallholder farmers.
In conclusion, ICT holds one of the greatest po-tential in the integration of smallholder farmers into commercial value chains.
FINICO Technologies’ Farmer Management System (FMS)
This is best illustrated with a brief of Finico Tech-nologies’ Farmer Management System. It inte-grates electronic payment and management sys-tems to create a hands on farmer management alternative for all types of farmer related business models. It is indeed an ICT solution designed to uphold what is in place while seeking improve-ments in agriculture; it has been rolled out and introduced in the grain, rice and dairy sectors.
It further links the producer to specific suppliers within a defined ecosystem and enables the pro-duction and trade transactions to be captured in the detail required by the actors.
112
8 African Agribusiness Supplier Development Programme (AASDP) Toolkit
The FMS is also a distinctive tool developed to support the different role players in a value chain with the benefits to all actors in the chain. It provides a secure technology platform to miti-gate risks of both the producer and supplier in which no over expenditure or misappropriation of funds can take place without a specific effort to override the system and leaving an audit trail.
The FMS is a flexible management platform through which the credit provided to the farmer is controlled and managed; and that can also mit-igate risk especially if structured in accordance with the farmers’ set-ups i.e. Farmer Organiza-tions (FO). In doing this, the farmer is given access to accredited input suppliers and the benefit of better prices due to economies of scale.
The system is a web based cloud solution ac-cess through Internet and fully supported by the technological partners. The FMS is ideal to man-age debtors with a vast range of audit reports. It is best implemented as a management solution and not an electronic payment solution among the FOs and agribusinesses. To achieve this Fin-ico is working in close collaboration with Zed Group (An entrepreneurial and consulting busi-ness in African agriculture with a special interest in smallholder value chain investments and the development of the missing middle in smallhold-er operations and finance). A brief overview of FMS is available on www.finico.za.com.
8.4 Policy advise
A fourth intervention area, and an area in which UNDP works closely with both national and local government, has a long track record, its policies are tied with local economic development. The business of farmers, SMEs and companies are strongly influenced by interaction with its wider environment including with the public sector.
The Local Economic Development (LED) ap-proach is a way to reflect on this. The purpose is “to build up the economic capacity of a local area to improve its economic future and the qual-ity of life for all. It is a process by which public, business and non-governmental sector partners work collectively to create better conditions for economic growth and employment generation” (Source: World Bank at http://go.worldbank.org/EA784ZB3F0).
World Bank proposes several ways to implement LED, including:
• Ensuring that the local investment climate is functional for local businesses;
• Supporting small and medium sized enterpris-es;
• Encouraging the creation of new enterprises;• Attracting external investment (nationally and
internationally);• Investing in physical (hard) infrastructure;• Investing in soft infrastructure (educational
and workforce development, institutional sup-port systems and regulatory issues);
• Supporting the growth of particular clusters of businesses;
• Targeting particular parts of the city for regen-eration or growth (area-based initiatives);
• Supporting informal and newly emerging businesses;
• Targeting certain disadvantaged groups.
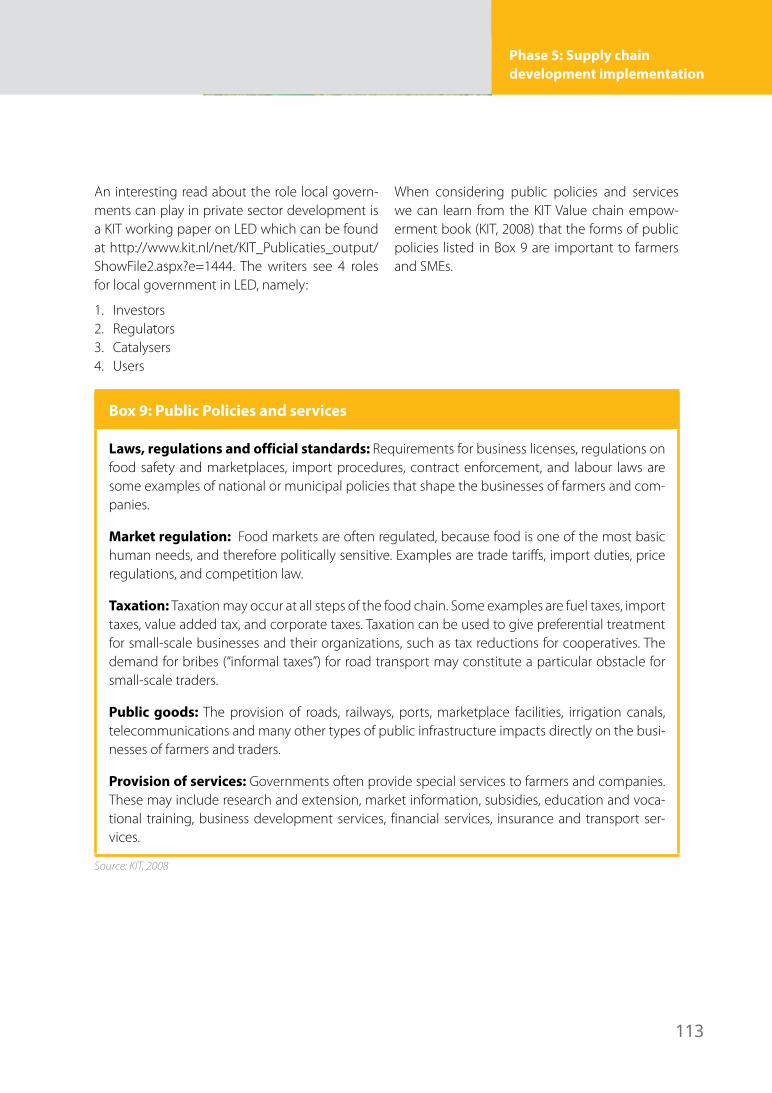
113
Phase 5: Supply chain development implementation
An interesting read about the role local govern-ments can play in private sector development is a KIT working paper on LED which can be found at http://www.kit.nl/net/KIT_Publicaties_output/ShowFile2.aspx?e=1444. The writers see 4 roles for local government in LED, namely:
1. Investors2. Regulators3. Catalysers4. Users
When considering public policies and services we can learn from the KIT Value chain empow-erment book (KIT, 2008) that the forms of public policies listed in Box 9 are important to farmers and SMEs.
Box 9: Public Policies and services
Laws, regulations and official standards: Requirements for business licenses, regulations on food safety and marketplaces, import procedures, contract enforcement, and labour laws are some examples of national or municipal policies that shape the businesses of farmers and com-panies.
Market regulation: Food markets are often regulated, because food is one of the most basic human needs, and therefore politically sensitive. Examples are trade tariffs, import duties, price regulations, and competition law.
Taxation: Taxation may occur at all steps of the food chain. Some examples are fuel taxes, import taxes, value added tax, and corporate taxes. Taxation can be used to give preferential treatment for small-scale businesses and their organizations, such as tax reductions for cooperatives. The demand for bribes (“informal taxes”) for road transport may constitute a particular obstacle for small-scale traders.
Public goods: The provision of roads, railways, ports, marketplace facilities, irrigation canals, telecommunications and many other types of public infrastructure impacts directly on the busi-nesses of farmers and traders.
Provision of services: Governments often provide special services to farmers and companies. These may include research and extension, market information, subsidies, education and voca-tional training, business development services, financial services, insurance and transport ser-vices.
Source: KIT, 2008
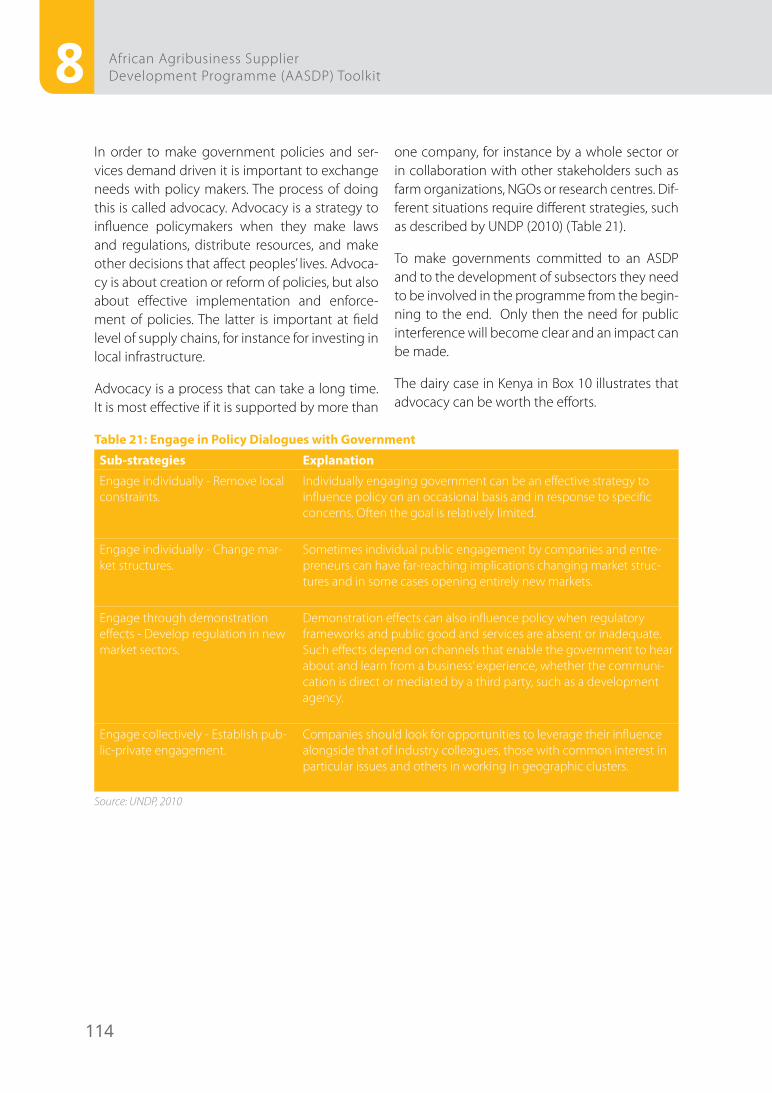
114
8 African Agribusiness Supplier Development Programme (AASDP) Toolkit
In order to make government policies and ser-vices demand driven it is important to exchange needs with policy makers. The process of doing this is called advocacy. Advocacy is a strategy to influence policymakers when they make laws and regulations, distribute resources, and make other decisions that affect peoples’ lives. Advoca-cy is about creation or reform of policies, but also about effective implementation and enforce-ment of policies. The latter is important at field level of supply chains, for instance for investing in local infrastructure.
Advocacy is a process that can take a long time. It is most effective if it is supported by more than
one company, for instance by a whole sector or in collaboration with other stakeholders such as farm organizations, NGOs or research centres. Dif-ferent situations require different strategies, such as described by UNDP (2010) (Table 21).
To make governments committed to an ASDP and to the development of subsectors they need to be involved in the programme from the begin-ning to the end. Only then the need for public interference will become clear and an impact can be made.
The dairy case in Kenya in Box 10 illustrates that advocacy can be worth the efforts.
Table 21: Engage in Policy Dialogues with Government
Sub-strategies Explanation
Engage individually - Remove local constraints.
Individually engaging government can be an effective strategy to influence policy on an occasional basis and in response to specific concerns. Often the goal is relatively limited.
Engage individually - Change mar-ket structures.
Sometimes individual public engagement by companies and entre-preneurs can have far-reaching implications changing market struc-tures and in some cases opening entirely new markets.
Engage through demonstration effects - Develop regulation in new market sectors.
Demonstration effects can also influence policy when regulatory frameworks and public good and services are absent or inadequate. Such effects depend on channels that enable the government to hear about and learn from a business’ experience, whether the communi-cation is direct or mediated by a third party, such as a development agency.
Engage collectively - Establish pub-lic-private engagement.
Companies should look for opportunities to leverage their influence alongside that of industry colleagues, those with common interest in particular issues and others in working in geographic clusters.
Source: UNDP, 2010
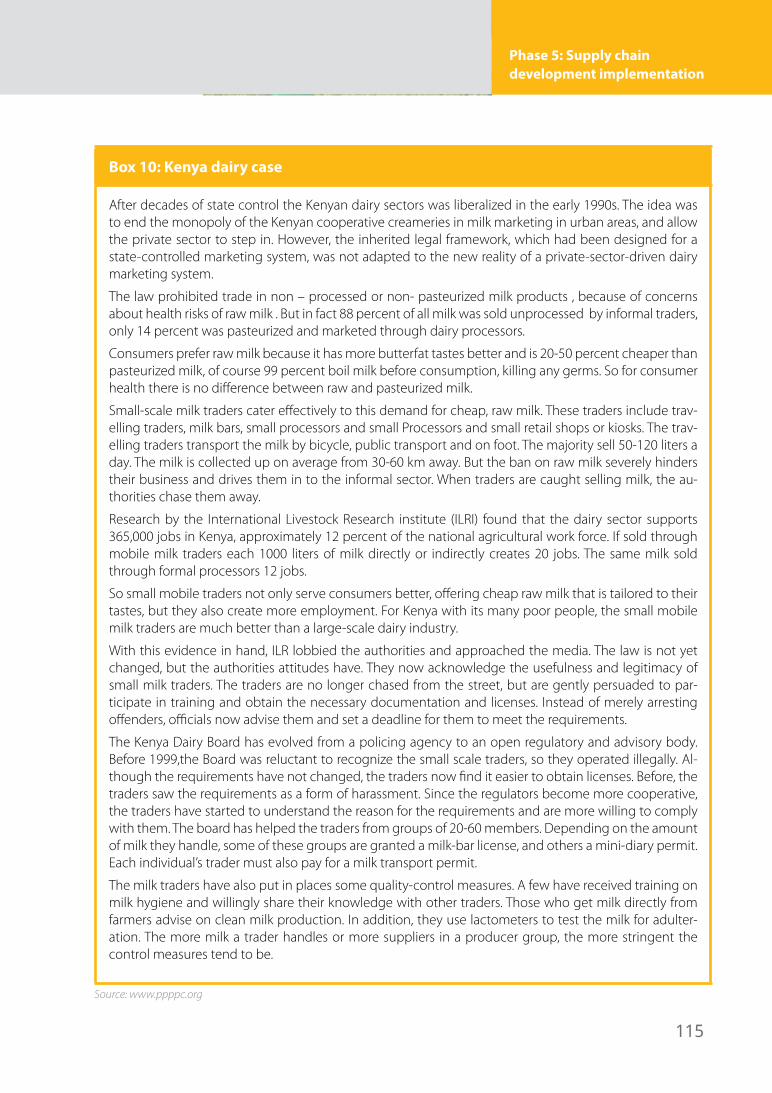
115
Phase 5: Supply chain development implementation
Box 10: Kenya dairy case
After decades of state control the Kenyan dairy sectors was liberalized in the early 1990s. The idea was to end the monopoly of the Kenyan cooperative creameries in milk marketing in urban areas, and allow the private sector to step in. However, the inherited legal framework, which had been designed for a state-controlled marketing system, was not adapted to the new reality of a private-sector-driven dairy marketing system.
The law prohibited trade in non – processed or non- pasteurized milk products , because of concerns about health risks of raw milk . But in fact 88 percent of all milk was sold unprocessed by informal traders, only 14 percent was pasteurized and marketed through dairy processors.
Consumers prefer raw milk because it has more butterfat tastes better and is 20-50 percent cheaper than pasteurized milk, of course 99 percent boil milk before consumption, killing any germs. So for consumer health there is no difference between raw and pasteurized milk.
Small-scale milk traders cater effectively to this demand for cheap, raw milk. These traders include trav-elling traders, milk bars, small processors and small Processors and small retail shops or kiosks. The trav-elling traders transport the milk by bicycle, public transport and on foot. The majority sell 50-120 liters a day. The milk is collected up on average from 30-60 km away. But the ban on raw milk severely hinders their business and drives them in to the informal sector. When traders are caught selling milk, the au-thorities chase them away.
Research by the International Livestock Research institute (ILRI) found that the dairy sector supports 365,000 jobs in Kenya, approximately 12 percent of the national agricultural work force. If sold through mobile milk traders each 1000 liters of milk directly or indirectly creates 20 jobs. The same milk sold through formal processors 12 jobs.
So small mobile traders not only serve consumers better, offering cheap raw milk that is tailored to their tastes, but they also create more employment. For Kenya with its many poor people, the small mobile milk traders are much better than a large-scale dairy industry.
With this evidence in hand, ILR lobbied the authorities and approached the media. The law is not yet changed, but the authorities attitudes have. They now acknowledge the usefulness and legitimacy of small milk traders. The traders are no longer chased from the street, but are gently persuaded to par-ticipate in training and obtain the necessary documentation and licenses. Instead of merely arresting offenders, officials now advise them and set a deadline for them to meet the requirements.
The Kenya Dairy Board has evolved from a policing agency to an open regulatory and advisory body. Before 1999,the Board was reluctant to recognize the small scale traders, so they operated illegally. Al-though the requirements have not changed, the traders now find it easier to obtain licenses. Before, the traders saw the requirements as a form of harassment. Since the regulators become more cooperative, the traders have started to understand the reason for the requirements and are more willing to comply with them. The board has helped the traders from groups of 20-60 members. Depending on the amount of milk they handle, some of these groups are granted a milk-bar license, and others a mini-diary permit. Each individual’s trader must also pay for a milk transport permit.
The milk traders have also put in places some quality-control measures. A few have received training on milk hygiene and willingly share their knowledge with other traders. Those who get milk directly from farmers advise on clean milk production. In addition, they use lactometers to test the milk for adulter-ation. The more milk a trader handles or more suppliers in a producer group, the more stringent the control measures tend to be.
Source: www.ppppc.org
9. Phase 6: Phasing out from supply chains and sustaining the ASDP
Phase 6: Phasing out from Supply Chains and Sustaining the ASDP
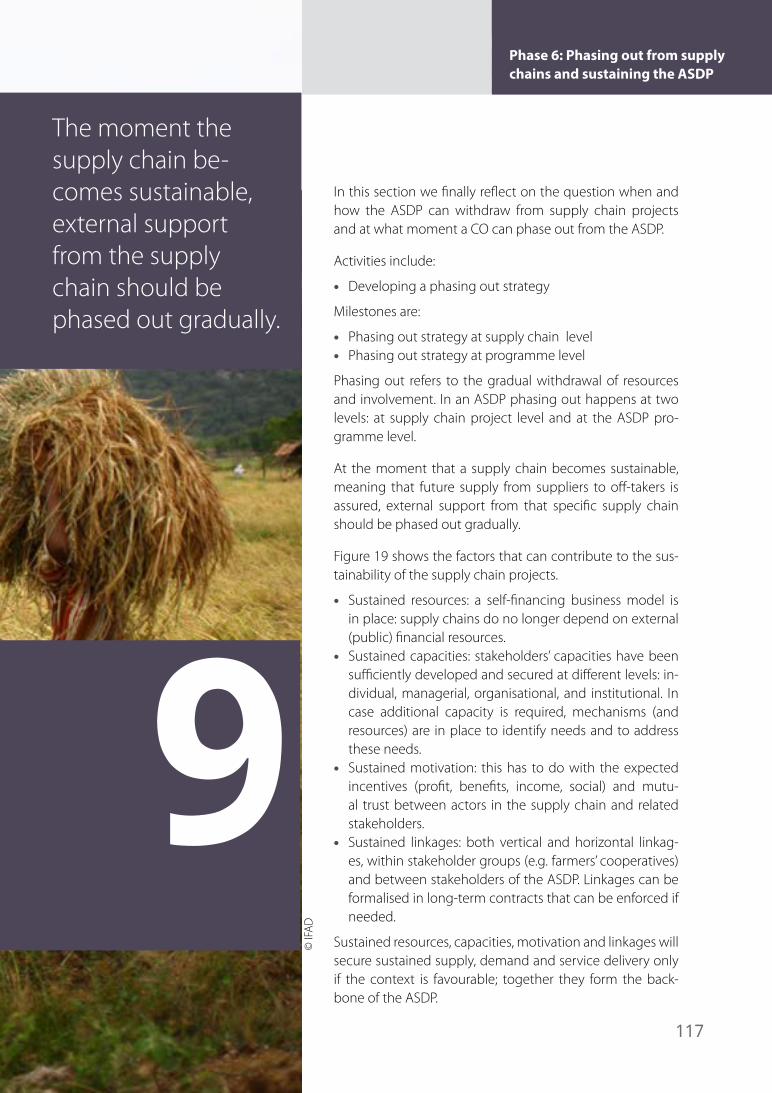
117
Phase 6: Phasing out from supply chains and sustaining the ASDP
In this section we finally reflect on the question when and how the ASDP can withdraw from supply chain projects and at what moment a CO can phase out from the ASDP.
Activities include:
• Developing a phasing out strategy
Milestones are:
• Phasing out strategy at supply chain level• Phasing out strategy at programme level
Phasing out refers to the gradual withdrawal of resources and involvement. In an ASDP phasing out happens at two levels: at supply chain project level and at the ASDP pro-gramme level.
At the moment that a supply chain becomes sustainable, meaning that future supply from suppliers to off-takers is assured, external support from that specific supply chain should be phased out gradually.
Figure 19 shows the factors that can contribute to the sus-tainability of the supply chain projects.
• Sustained resources: a self-financing business model is in place: supply chains do no longer depend on external (public) financial resources.
• Sustained capacities: stakeholders’ capacities have been sufficiently developed and secured at different levels: in-dividual, managerial, organisational, and institutional. In case additional capacity is required, mechanisms (and resources) are in place to identify needs and to address these needs.
• Sustained motivation: this has to do with the expected incentives (profit, benefits, income, social) and mutu-al trust between actors in the supply chain and related stakeholders.
• Sustained linkages: both vertical and horizontal linkag-es, within stakeholder groups (e.g. farmers’ cooperatives) and between stakeholders of the ASDP. Linkages can be formalised in long-term contracts that can be enforced if needed.
Sustained resources, capacities, motivation and linkages will secure sustained supply, demand and service delivery only if the context is favourable; together they form the back-bone of the ASDP.
Phase 6: Phasing out from Supply Chains and Sustaining the ASDP
9
© IF
AD
The moment the supply chain be-comes sustainable, external support from the supply chain should be phased out gradually.
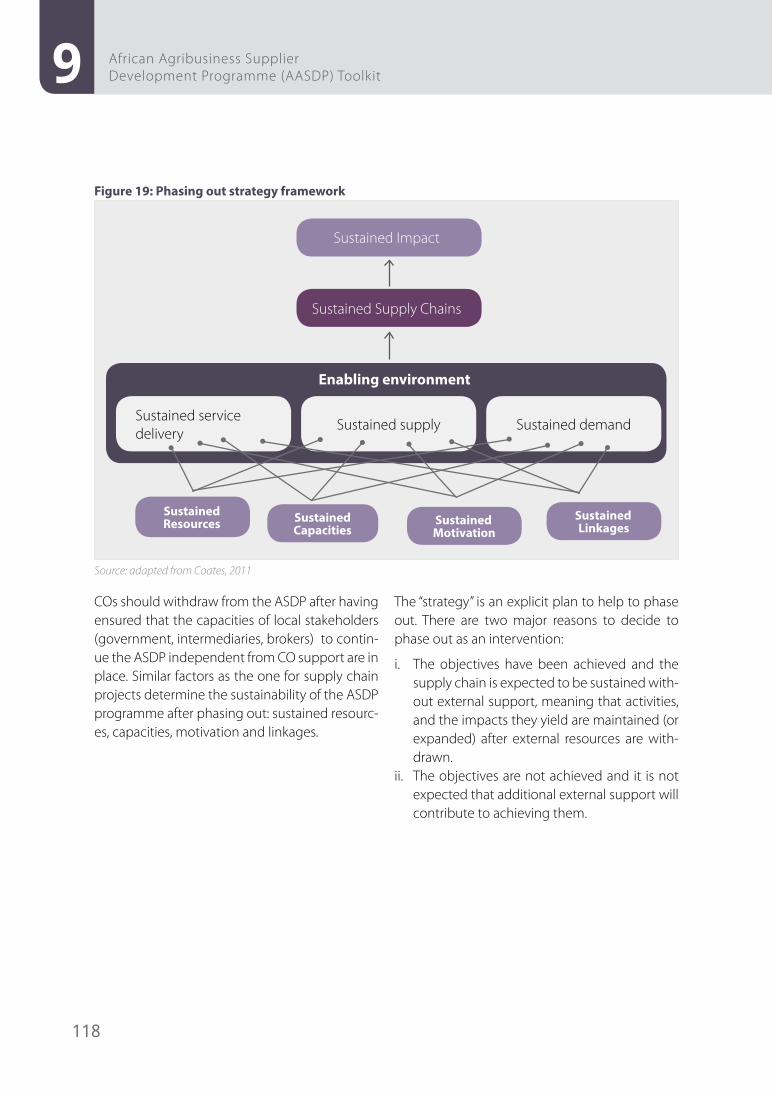
118
9 African Agribusiness Supplier Development Programme (AASDP) Toolkit
Figure 19: Phasing out strategy framework
Sustained Impact
Sustained Supply Chains
Enabling environment
Sustained service delivery
Sustained supply Sustained demand
Sustained Resources Sustained
CapacitiesSustained Motivation
Sustained Linkages
Source: adapted from Coates, 2011
COs should withdraw from the ASDP after having ensured that the capacities of local stakeholders (government, intermediaries, brokers) to contin-ue the ASDP independent from CO support are in place. Similar factors as the one for supply chain projects determine the sustainability of the ASDP programme after phasing out: sustained resourc-es, capacities, motivation and linkages.
The “strategy” is an explicit plan to help to phase out. There are two major reasons to decide to phase out as an intervention:
i. The objectives have been achieved and the supply chain is expected to be sustained with-out external support, meaning that activities, and the impacts they yield are maintained (or expanded) after external resources are with-drawn.
ii. The objectives are not achieved and it is not expected that additional external support will contribute to achieving them.
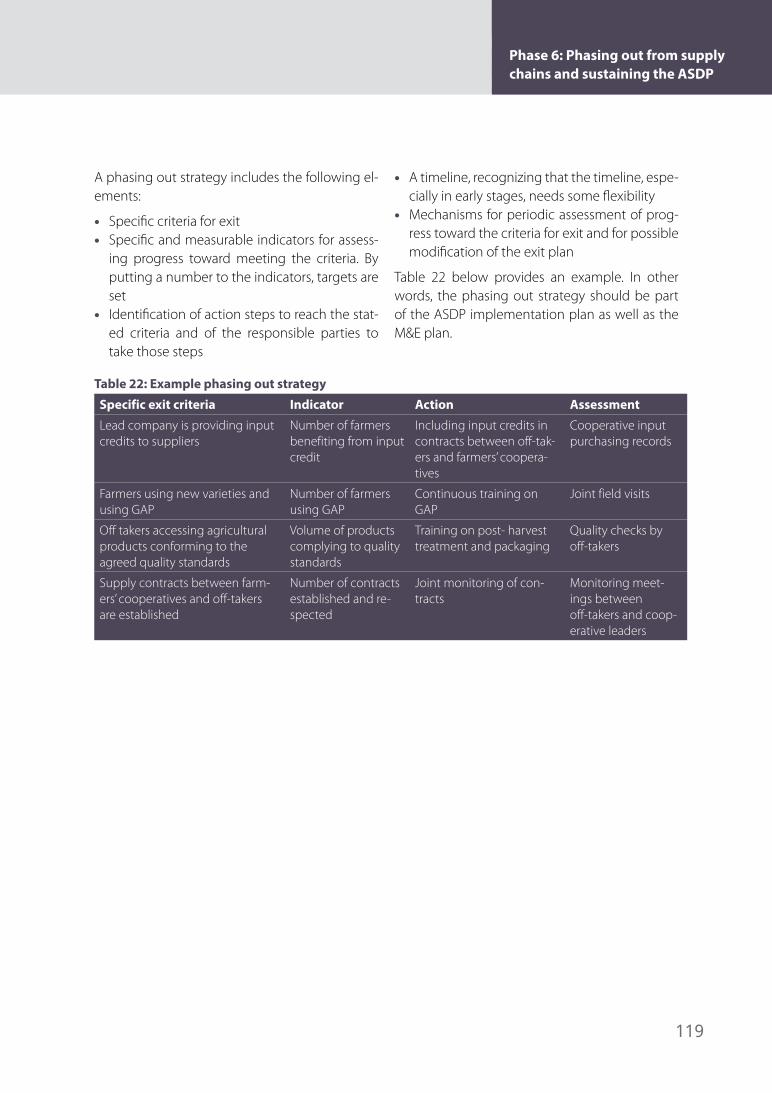
119
Phase 6: Phasing out from supply chains and sustaining the ASDP
A phasing out strategy includes the following el-ements:
• Specific criteria for exit• Specific and measurable indicators for assess-
ing progress toward meeting the criteria. By putting a number to the indicators, targets are set
• Identification of action steps to reach the stat-ed criteria and of the responsible parties to take those steps
• A timeline, recognizing that the timeline, espe-cially in early stages, needs some flexibility
• Mechanisms for periodic assessment of prog-ress toward the criteria for exit and for possible modification of the exit plan
Table 22 below provides an example. In other words, the phasing out strategy should be part of the ASDP implementation plan as well as the M&E plan.
Table 22: Example phasing out strategy
Specific exit criteria Indicator Action Assessment
Lead company is providing input credits to suppliers
Number of farmers benefiting from input credit
Including input credits in contracts between off-tak-ers and farmers’ coopera-tives
Cooperative input purchasing records
Farmers using new varieties and using GAP
Number of farmers using GAP
Continuous training on GAP
Joint field visits
Off takers accessing agricultural products conforming to the agreed quality standards
Volume of products complying to quality standards
Training on post- harvest treatment and packaging
Quality checks by off-takers
Supply contracts between farm-ers’ cooperatives and off-takers are established
Number of contracts established and re-spected
Joint monitoring of con-tracts
Monitoring meet-ings between off-takers and coop-erative leaders
10. M&E, Impact measurement & Learning
M&E, Impact Measurement & Learning
M&E, Impact measurement & Learning
121
M&E and Learning should take place during the full course of the implementation of the programme. Ob-jectives are to inform stakeholders on progress on the implementation of the ASDP and its respective Supply Chain Development Projects, as well as to inform stake-holders on achievements of the ASDP (outcomes and impact) and to share lessons learned so that best prac-tices can be replicated.
M&E and Learning activities include:
• Monitoring, evaluating and reporting on projects and programme results
• Measuring impact• Developing and implementing a cross-sectoral
learning programme
Milestones are annual M&E reports of the projects and programme, midterm/exit evaluation reports, a learn-ing programme established and knowledge products.
10.1 M&E and impact measurement
There are many reasons why different stakeholders would require M&E. The most common ones include (upward) accountability, and operational manage-ment. In M&E for accountability the objective is to jus-tify, often in retrospect, the use of resources. However, for ASDPs, strategic management and knowledge gen-eration would be equally important purposes. Learn-ing from experiences, for the benefit of improving the ASDP itself, but also for the benefit of future initiatives, is central to M&E.
Accountability, operational management, but equally strategic management and knowledge generation are the most important reasons for M&E in an ASDP.
M&E, Impact Measurement & Learning 10
© IF
AD
10
122
African Agribusiness Supplier Development Programme (AASDP) Toolkit
In ASDPs there are two levels of Monitoring and Evaluation:
1. The development of the ASDP2. The development of supply chains
The former reflects on the progress of setting up an ASDP in a country. Reference is made to the objectives and milestones suggested for the dif-ferent phases of setting up and implementing an ASDP, as described in this toolkit.
The second level refers to the concrete activities on improving a particular supply chain. The sup-ply chain development plans should include the progress and impact indicators.
The intended cause-effect relationships should indicate the following key elements as well as clarify how they are interlinked and what factors might influence these linkages:
• Activities: Are activities implemented as agreed upon?
• Outputs: What is the ASDP directly responsible for delivering (tangible services and projects, e.g. numbers of people trained, or types of study reports produced, contracts signed)?
• Outcomes: What changes / effects were ex-pected as a result of the outputs? This may in-clude concrete changes in the supply chains: new production practices, service delivery to producers, volumes sourced locally, etc. This highly depends on the commodity and the supply chains, but generic indicators can be defined (see Tables 23 and 24).
• Impact: Changes in socioeconomic conditions the ASDP sought to contribute towards.
• Assumptions / risks: external factors (i.e. events, conditions or decisions) that could affect the progress or success of the ASDP.
The impact, outcome and outputs statements should be measured against clear indicators and matching targets defined at the planning stage in the Logical Framework. A clear indicator in-cludes the following elements:
• Specified target group to which the indicator will be applied
• Specific unit(s) of measurement to be used for the indicator
• Specific time frame over which it will be mon-itored
• Reference to a baseline / benchmark for com-parison
• Defined qualities (if an adjective is needed see below)
• Specific location in which indicators will be ap-plied
Remember that UNDP M&E guidelines should be followed in setting up and implementing an M&E system for an ASDP programme and its related supply chain projects.
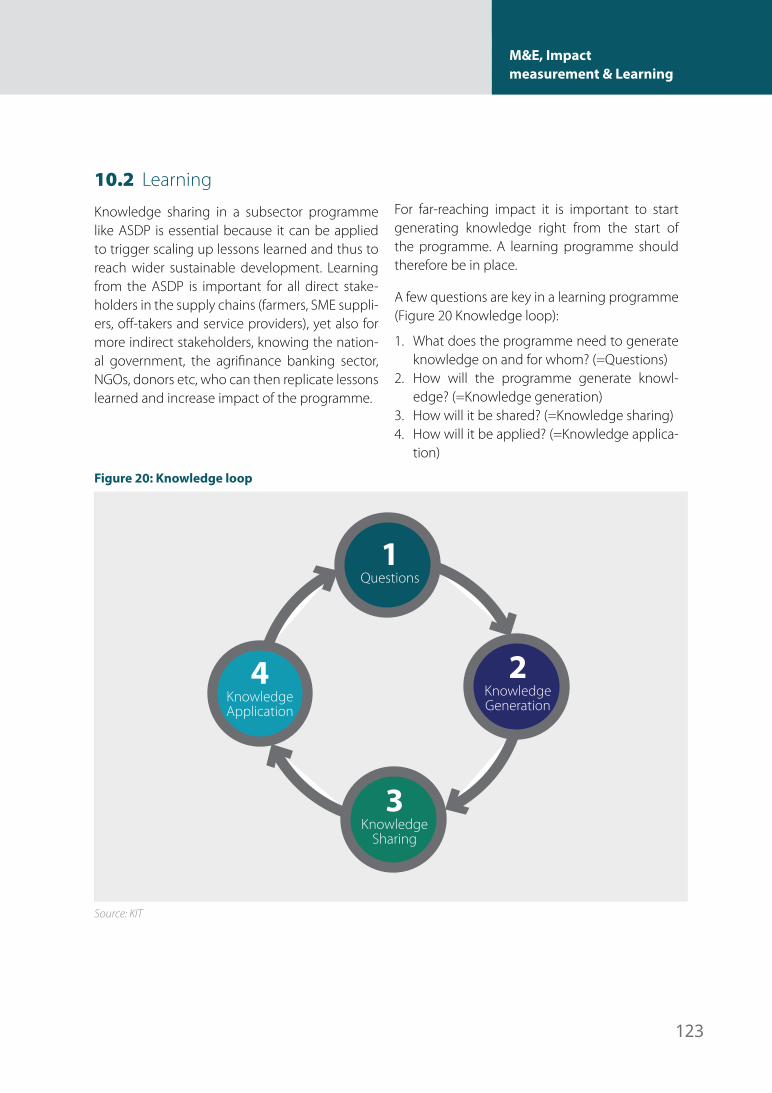
M&E, Impact measurement & Learning
123
10.2 Learning
Knowledge sharing in a subsector programme like ASDP is essential because it can be applied to trigger scaling up lessons learned and thus to reach wider sustainable development. Learning from the ASDP is important for all direct stake-holders in the supply chains (farmers, SME suppli-ers, off-takers and service providers), yet also for more indirect stakeholders, knowing the nation-al government, the agrifinance banking sector, NGOs, donors etc, who can then replicate lessons learned and increase impact of the programme.
For far-reaching impact it is important to start generating knowledge right from the start of the programme. A learning programme should therefore be in place.
A few questions are key in a learning programme (Figure 20 Knowledge loop):
1. What does the programme need to generate knowledge on and for whom? (=Questions)
2. How will the programme generate knowl-edge? (=Knowledge generation)
3. How will it be shared? (=Knowledge sharing)4. How will it be applied? (=Knowledge applica-
tion)
Figure 20: Knowledge loop
1 Questions
4 Knowledge Application
3 Knowledge
Sharing
2 Knowledge Generation
Source: KIT
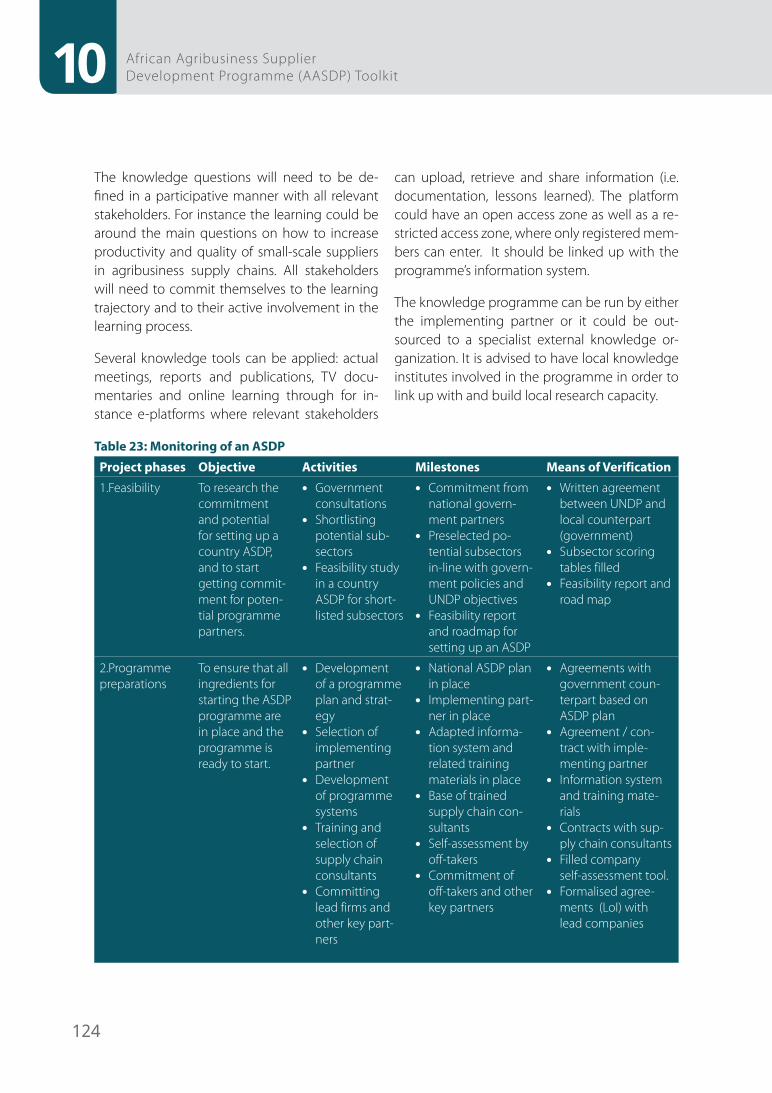
10
124
African Agribusiness Supplier Development Programme (AASDP) Toolkit
The knowledge questions will need to be de-fined in a participative manner with all relevant stakeholders. For instance the learning could be around the main questions on how to increase productivity and quality of small-scale suppliers in agribusiness supply chains. All stakeholders will need to commit themselves to the learning trajectory and to their active involvement in the learning process.
Several knowledge tools can be applied: actual meetings, reports and publications, TV docu-mentaries and online learning through for in-stance e-platforms where relevant stakeholders
can upload, retrieve and share information (i.e. documentation, lessons learned). The platform could have an open access zone as well as a re-stricted access zone, where only registered mem-bers can enter. It should be linked up with the programme’s information system.
The knowledge programme can be run by either the implementing partner or it could be out-sourced to a specialist external knowledge or-ganization. It is advised to have local knowledge institutes involved in the programme in order to link up with and build local research capacity.
Table 23: Monitoring of an ASDP
Project phases Objective Activities Milestones Means of Verification
1.Feasibility To research the commitment and potential for setting up a country ASDP, and to start getting commit-ment for poten-tial programme partners.
• Government consultations
• Shortlisting potential sub-sectors
• Feasibility study in a country ASDP for short-listed subsectors
• Commitment from national govern-ment partners
• Preselected po-tential subsectors in-line with govern-ment policies and UNDP objectives
• Feasibility report and roadmap for setting up an ASDP
• Written agreement between UNDP and local counterpart (government)
• Subsector scoring tables filled
• Feasibility report and road map
2.Programme preparations
To ensure that all ingredients for starting the ASDP programme are in place and the programme is ready to start.
• Development of a programme plan and strat-egy
• Selection of implementing partner
• Development of programme systems
• Training and selection of supply chain consultants
• Committing lead firms and other key part-ners
• National ASDP plan in place
• Implementing part-ner in place
• Adapted informa-tion system and related training materials in place
• Base of trained supply chain con-sultants
• Self-assessment by off-takers
• Commitment of off-takers and other key partners
• Agreements with government coun-terpart based on ASDP plan
• Agreement / con-tract with imple-menting partner
• Information system and training mate-rials
• Contracts with sup-ply chain consultants
• Filled company self-assessment tool.
• Formalised agree-ments (LoI) with lead companies
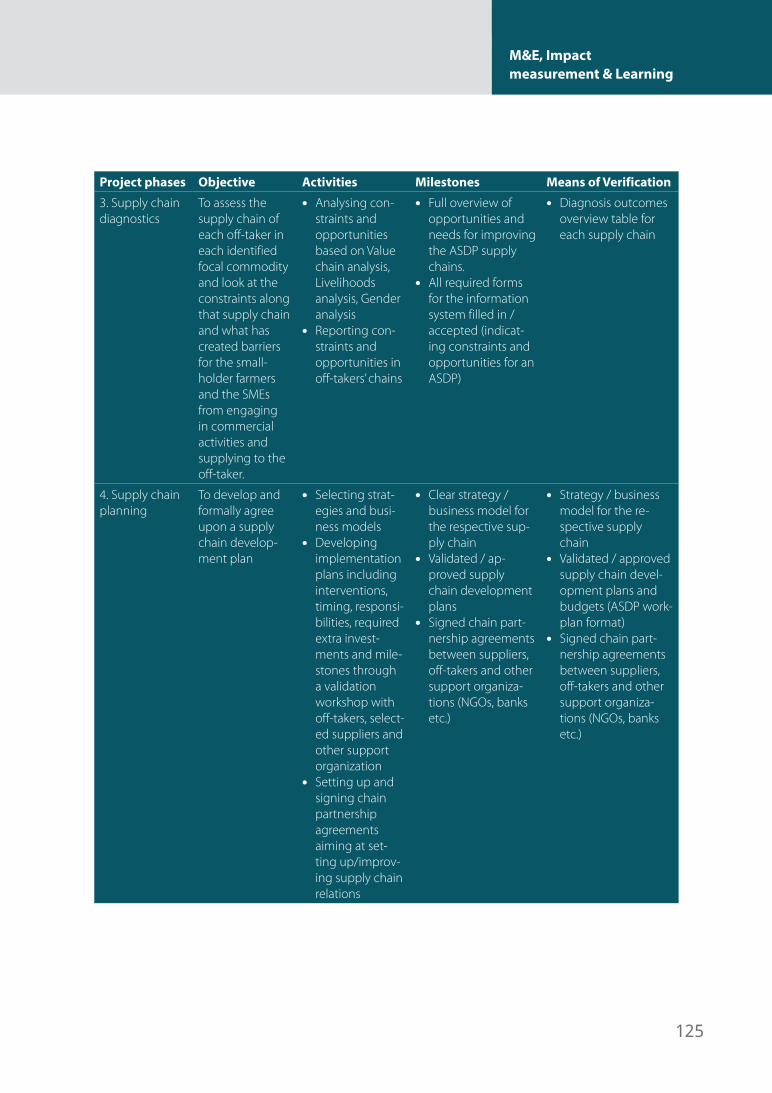
M&E, Impact measurement & Learning
125
Project phases Objective Activities Milestones Means of Verification
3. Supply chain diagnostics
To assess the supply chain of each off-taker in each identified focal commodity and look at the constraints along that supply chain and what has created barriers for the small-holder farmers and the SMEs from engaging in commercial activities and supplying to the off-taker.
• Analysing con-straints and opportunities based on Value chain analysis, Livelihoods analysis, Gender analysis
• Reporting con-straints and opportunities in off-takers’ chains
• Full overview of opportunities and needs for improving the ASDP supply chains.
• All required forms for the information system filled in / accepted (indicat-ing constraints and opportunities for an ASDP)
• Diagnosis outcomes overview table for each supply chain
4. Supply chain planning
To develop and formally agree upon a supply chain develop-ment plan
• Selecting strat-egies and busi-ness models
• Developing implementation plans including interventions, timing, responsi-bilities, required extra invest-ments and mile-stones through a validation workshop with off-takers, select-ed suppliers and other support organization
• Setting up and signing chain partnership agreements aiming at set-ting up/improv-ing supply chain relations
• Clear strategy / business model for the respective sup-ply chain
• Validated / ap-proved supply chain development plans
• Signed chain part-nership agreements between suppliers, off-takers and other support organiza-tions (NGOs, banks etc.)
• Strategy / business model for the re-spective supply chain
• Validated / approved supply chain devel-opment plans and budgets (ASDP work-plan format)
• Signed chain part-nership agreements between suppliers, off-takers and other support organiza-tions (NGOs, banks etc.)
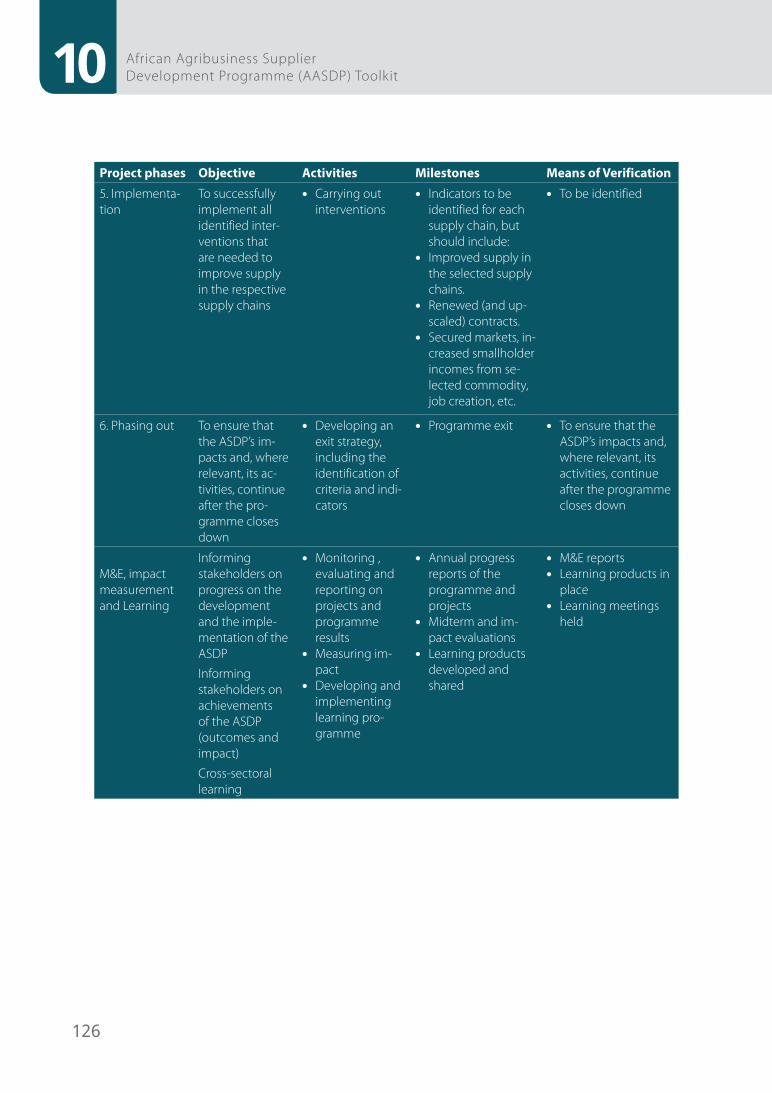
10
126
African Agribusiness Supplier Development Programme (AASDP) Toolkit
Project phases Objective Activities Milestones Means of Verification
5. Implementa-tion
To successfully implement all identified inter-ventions that are needed to improve supply in the respective supply chains
• Carrying out interventions
• Indicators to be identified for each supply chain, but should include:
• Improved supply in the selected supply chains.
• Renewed (and up-scaled) contracts.
• Secured markets, in-creased smallholder incomes from se-lected commodity, job creation, etc.
• To be identified
6. Phasing out To ensure that the ASDP’s im-pacts and, where relevant, its ac-tivities, continue after the pro-gramme closes down
• Developing an exit strategy, including the identification of criteria and indi-cators
• Programme exit • To ensure that the ASDP’s impacts and, where relevant, its activities, continue after the programme closes down
M&E, impact measurement and Learning
Informing stakeholders on progress on the development and the imple-mentation of the ASDP
Informing stakeholders on achievements of the ASDP (outcomes and impact)
Cross-sectoral learning
• Monitoring , evaluating and reporting on projects and programme results
• Measuring im-pact
• Developing and implementing learning pro-gramme
• Annual progress reports of the programme and projects
• Midterm and im-pact evaluations
• Learning products developed and shared
• M&E reports• Learning products in
place• Learning meetings
held
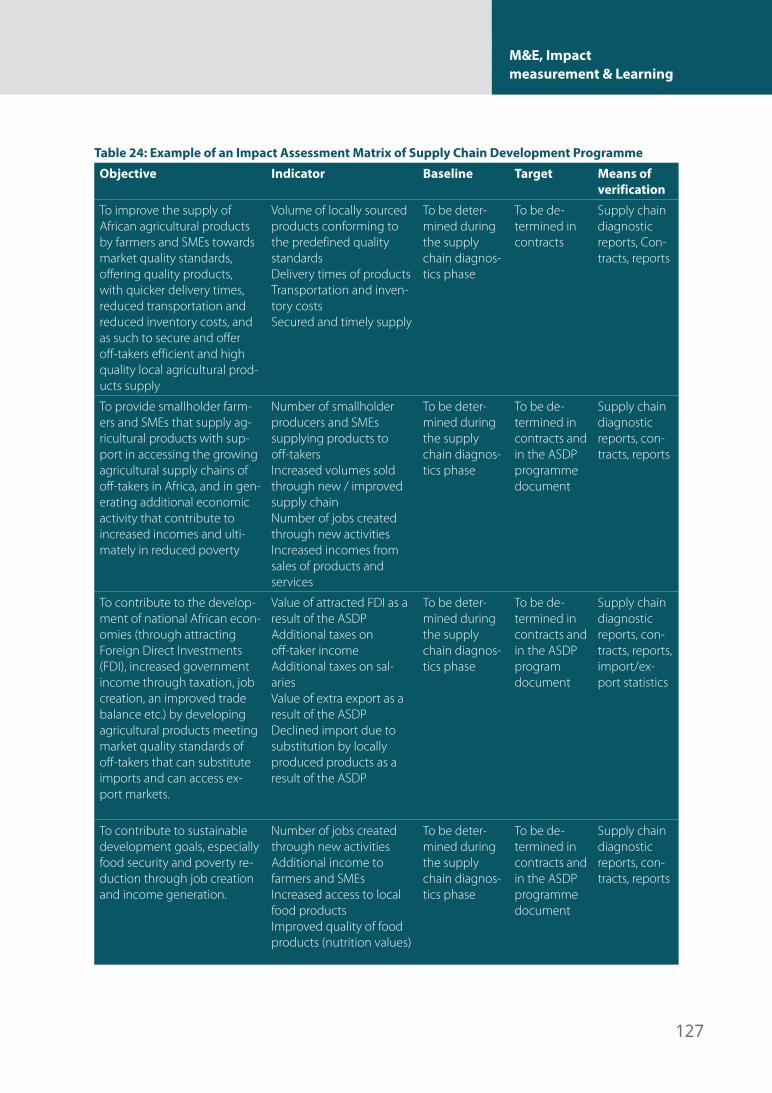
M&E, Impact measurement & Learning
127
Table 24: Example of an Impact Assessment Matrix of Supply Chain Development Programme
Objective Indicator Baseline Target Means of verification
To improve the supply of African agricultural products by farmers and SMEs towards market quality standards, offering quality products, with quicker delivery times, reduced transportation and reduced inventory costs, and as such to secure and offer off-takers efficient and high quality local agricultural prod-ucts supply
Volume of locally sourced products conforming to the predefined quality standardsDelivery times of productsTransportation and inven-tory costsSecured and timely supply
To be deter-mined during the supply chain diagnos-tics phase
To be de-termined in contracts
Supply chain diagnostic reports, Con-tracts, reports
To provide smallholder farm-ers and SMEs that supply ag-ricultural products with sup-port in accessing the growing agricultural supply chains of off-takers in Africa, and in gen-erating additional economic activity that contribute to increased incomes and ulti-mately in reduced poverty
Number of smallholder producers and SMEs supplying products to off-takersIncreased volumes sold through new / improved supply chainNumber of jobs created through new activitiesIncreased incomes from sales of products and services
To be deter-mined during the supply chain diagnos-tics phase
To be de-termined in contracts and in the ASDP programme document
Supply chain diagnostic reports, con-tracts, reports
To contribute to the develop-ment of national African econ-omies (through attracting Foreign Direct Investments (FDI), increased government income through taxation, job creation, an improved trade balance etc.) by developing agricultural products meeting market quality standards of off-takers that can substitute imports and can access ex-port markets.
Value of attracted FDI as a result of the ASDPAdditional taxes on off-taker incomeAdditional taxes on sal-aries Value of extra export as a result of the ASDPDeclined import due to substitution by locally produced products as a result of the ASDP
To be deter-mined during the supply chain diagnos-tics phase
To be de-termined in contracts and in the ASDP program document
Supply chain diagnostic reports, con-tracts, reports, import/ex-port statistics
To contribute to sustainable development goals, especially food security and poverty re-duction through job creation and income generation.
Number of jobs created through new activitiesAdditional income to farmers and SMEs Increased access to local food productsImproved quality of food products (nutrition values)
To be deter-mined during the supply chain diagnos-tics phase
To be de-termined in contracts and in the ASDP programme document
Supply chain diagnostic reports, con-tracts, reports
128
African Agribusiness Supplier Development Programme (AASDP) Toolkit
References
• ACDI-VOCA, Organizational Capacity Assessment Tool De-veloped.
• UNDP AFIM, 2012, the roles and opportunities for the private sector in Africa’s agrifood.
• Industry, UNDP African Facility for Inclusive Markets.
• African Development Bank, 2012, Policy brief on agricul-tural finance in Africa, Making Finance Work for Africa, African Development Bank.
• Berdegué, J.A., E. Biénabe, and L. Peppelenbos. 2008. Keys to inclusion of small-scale pro-ducers in dynamic markets: Innovative practice in connect-ing small-scale producers with dynamic markets. Regoverning Markets Innovative Practice Series. London: International Institute for Environment and Development.
• Binswanger-Mkhize, Hans P. and Alex F. McCalla, 2009, “The changing context and prospects for agricultural and rural development in Africa”, A working paper from the joint evaluation of AfDB and IFAD policies and operations in agri-culture and rural development in Africa.
• Boomsma M.J., 2008, Sustain-able procurement from devel-oping countries, Practices and challenges for businesses and support agencies, KIT publish-ers, Amsterdam, the Nether-lands.
• Boomsma M. and E. Mangnus (2012), Unravelling Local Sourc-ing in Africa, Positioning Paper on opportunities for doing sus-tainable business, KIT.
• Bosc Pierre-Marie, Didier Ey-chenne, Karim Hussein, Bruno Losch, Marie-Rose Mercoiret, Pierre Rondot, Sadie Macin-tosh-Walker, October 2001, Reaching the rural poor, The Role of Rural Producers Organ-isations (RPOs) in the World Bank Rural Development Strat-egy, Background study. World Bank, Washington DC.
• CAI, Leah Gatt, SMEs in Africa: Growth despite constraints, 17 September 2012, Available at http://www.consultancy-africa.com/index.php?op-tion=com_content&view=ar-ticle&id=1120:smes-in-af-rica-growth-despite-con-straints&catid=82:african-indus-try-a-business&Itemid=266
• CIA, The World Fact Book, https://www.cia.gov/library/publications/the-world-fact-book/, last consulted 14 No-vember 2012.
• Coates, Jennifer and Beatrice Rogers, 2011, Exit Strategies Study: Concepts and Methods, Tufts University.
• Diao, X and Hazell, P, (2004) Exploring Market Opportunities for African Smallholders 2020 Africa Conference Brief, IFPRI.
• DFID (1999) Sustainable liveli-hoods guidance sheets. Avail-able at http://www.ennonline.net/pool/files/ife/dfid-sus-tainable-livelihoods-guid-ance-sheet-section1.pdf
129
• Evans School Policy Analysis and Research Group, Julie Wro-blewski and Hendrik Wolff, Risks to Agribusiness Investment in Sub-Saharan Africa, 2010.
• FAO (2009a) The Special Chal-lenge for Sub-Saharan Africa. Rome: FAO. Available at http://www.fao.org/fileadmin/tem-plates/wsfs/docs/Issues_pa-pers/HLEF2050_Africa.pdf
• FAO/UNIDO (2010) 3ADI : Afri-can agribusiness and agro-in-dustries development initiative : a programme framework. Avail-able at http://www.fao.org/do-crep/012/i1587e/i1587e00.pdf
• FAO 2011a, Food, Agriculture and Cities, FAO Food for the Cities multidisciplinary initiative position paper. UN Food and Agriculture Organization, Rome.
• FAO, 2011b, The State Of Food And Agriculture, Women In Agriculture, Closing the gender gap for development, UN Food and Agriculture Organization, Rome.
• Fischer, R.A., D. Byerlee, and G.O. Edmeades. 2009. Can technol-ogy deliver on the yield chal-lenge to 2050? Paper presented at the FAO Expert Meeting: How to Feed the World in 2050, 24-26 June, Food and Agricul-ture Organization of the United Nations, Rome.
• GTZ, A. Springer-Heinze, Value chain links Manual. The meth-odology of value chain promo-tion, 2007. Available at http://www2.gtz.de/wbf/4tDx9kw-63gma/ValueLinks_Manual.pdf.
• Hilhorst, T., G. Baltissen and E. Lodenstein (2008) What can rural local governments con-tribute to private sector devel-opment? KIT Working Papers Series G2. Amsterdam: KIT http://www.kit.nl/net/KIT_Pub-licaties_output/ShowFile2.aspx?e=1444
• IFAD 2010, ‘Youth in Agriculture, Special session of the 2012 Farmers’ Forum, Conference proceedings.
• IFAD, 2011 , Rural poverty re-port, IFAD, http://www.ifad.org/rpr2011/report/e/rpr2011.pdf.
• IFC (2010), ‘Why support SMEs’ , paper prepared for the Sus-tainable Business Advisory Department as a contribution the International Entrepreneur Week 2010, http://www.bid-network.org/sites/default/files/why_support_smes_ifc.pdf.
• IFC (2011), A guide to getting started in local procurement- For companies seeking the benefits of linkages with local SMEs for ending hunger and poverty.
• IFC (2012), Interpretation Note on Small and Medium Enter-prises and Environmental and Social Risk Management,http://www1.ifc.org/wps/wcm/connect/de7d92804a29ffe-9ae04af8969adcc27/Interpre-tationNote_SME_2012.pdf?-MOD=AJPERES.
130
African Agribusiness Supplier Development Programme (AASDP) Toolkit
• KIT, Agri-ProFocus and IIRR. 2012. Challenging chains to change: Gender equity in agricultural value chain devel-opment. KIT Publishers, Royal Tropical Institute, Amsterdam.
• KIT, APF, SNV and NL Agency, ‘Sustainable Local Sourcing in Africa’ flyer, 2012.
• KIT, Boomsma M. (2011), ‘CFC spice development Madagascar proposal’, Amsterdavm, the Netherlands.
• KIT, Faida Mai and IIRR. 2008, Chain empowerment: Support-ing African farmers to develop markets. Royal Tropical Institute, Amsterdam; Faida Market Link, Arusha; and International Insti-tute of Rural Reconstruction, Nairobi.
• KIT and IIR, 2008, Trading up: Building cooperation between farmers and traders in Africa. Royal Tropical Institute in Am-sterdam and International Insti-tute of Rural Reconstruction in Nairobi.
• KIT and IIRR, 2010, Value chain finance: Beyond microfinance for rural entrepreneurs. Royal Tropical Institute, Amsterdam; and International Institute of Rural Reconstruction, Nairobi.
• KIT, ‘Value chain training’, 2008.
• Livingston, Geoffrey, Steven Schonberger and Sara Delaney (2011), Sub-Saharan Africa: The state of smallholders in agriculture, Paper presented at the IFAD Conference on New Directions for Smallholder Agri-culture, 24-25 January, 2011.
• M4P, Working group (2008), ‘Making value chain work bet-ter for the poor. A tool book for practitioners of value chain analysis’, page 49.
• Neuchatel Group, 1999, Com-mon Framework on Agricultural Extension.
• Nicholas Ozor, et al. (2012) A Framework for Agricultural Ad-aptation to Climate Change in Southern Nigeria. International Journal of Agriculture Scienc-es, ISSN: 0975-3710 & E-ISSN: 0975-9107, Volume 4, Issue 5, pp-243-252.
• Stockbridge, M., A. Dorward, J. Kydd, J. Morrison and N. Poole, 2003, Farmer Organizations for Market Access: an International Review, working paper.
• Smale, M., and T.S. Jayne. 2009. Breeding an “amazing” crop: Improved maize in Kenya, Ma-lawi, Zambia, and Zimbabwe. In Millions fed: Proven successes in agricultural development, eds. D.J. Spielman and R. Pan-dya-Lorch. Washington, D.C.: International Food Policy Re-search Institute.
131
• SUSTAINET EA 2010. Technical Manual for farmers and Field Extension Service Providers: Farmer Field School Approach. Sustainable Agriculture Infor-mation Initiative, Nairobi.
• Thompson, John, A. Teshome, D. Hughes. E. Chrirwa and J. Omiti, 2009, The Seven Habits of Highly Effective Farmers’ Or-ganisations, the Future Agricul-tures Consortium.
• UNDP (2011), Protecting bio-diversity in production land-scapes: A guide to work with agribusiness supply chains to-wards conserving biodiversity, Cape Town, South Africa.
• UNDP (2010), Guide to Partner-ship Building, New York, USA.
• UNDP (2010a), Assessing Mar-kets, New York, USA.
• UNDP (2010b), Brokering Inclu-sive Business Models, New York, USA.
• UNDP (2010 c) Inclusive financ-ing.
• UNIDO, by G. Ceglie and M. Dini (1999), SME cluster and network development in developing countries: the experience of UNIDO, Vienna.
• UNIDO (2005), Methodology Development of SME Supplier Networks, abridged Version.
• UNIDO (2009), Agro-value chain analysis and development. The Unido approach, a staff working paper.
• Wennink, Bertus And Willem Heemskerk (Eds.), 2006, Farmers’ Organizations And Agricultural Innovation, Case Studies From Benin, Rwanda And Tanzania, Bulletin 374, Royal Tropical Insti-tute (KIT) Development Policy and Practice, Amsterdam.
• World bank (2008). World development report 2008: Agriculture for development. Washington, D.C.: World Bank, http://siteresources.worldbank.org/INTWDR2008/Resources/WDR_00_book.pdf.
• UNECA, 2009, Economic Report on Africa 2009, Developing African Agriculture Through Regional Value Chains, United Nations Economic Commission for Africa, 2011, Addis Ababa, Ethiopia.
132
African Agribusiness Supplier Development Programme (AASDP) Toolkit
Consultations:
Angola pilot
UNDP Angola Samuel Harbor
Olaf Juergensen
Flora Neves
Roque Concalves
Novagro, Lda (Agr. Input Supplier) Samuel Paulino
SIRIUS, Lda (Agr. Input Supplier) Denis Dravet
Ministry of Agriculture Domingos Pedro Gabriel
AGROWAY Lda – (Input Supplier) CEO Mr Mário Castelbranco
CESACOOPA Coffee Cooperative President Mr Cesar Lisboa
INCA - National Coffee Institute, Director João Ferreira Da Costa
INCA, Deputy Director for Administration Jose Cassulo Mahinga
IDPAA Artisanal Fisheries Institute Nkosi Luyeye
IDPAA 4 staff
GESTERRA EP, Parastatal enterprise Eduardo Barros
Kixi Crédito- Micro Finance Institution Joaquim Catinda
African Development Bank, Senior Econ-omist
Felisberto Mateus
African Development Bank, Princi-pal Country Economist
Joel Daniel Muzima
133
Kenya pilot
Africa Harvest Doreen Marangu
Michael Njuguna
Florence Wambugu
BIDCO Mr. Venugopal
East Africa Breweries Ltd. Paul Muthangya
East Africa Dairy Development Project Moses Nyabila
Alice Makochieng
East Africa Development Bank David Odongo
EUCORD Paul Muthangya (Coordinator for East African Breweries)
Equity Bank Esther Muruiri
KENFAP John Mutunga (CEO)
NESTLE Ian Donald (CEO region)
Ministry of Agriculture Johnson Irungu Waithaka (Director Crops Management)
SNV Anton Jansen (Agribusiness Advisor)
UNDP Carolin Averbeck
Lynette Luvai
Boniface Kitili
UNIDO Andrew Edewa
134
African Agribusiness Supplier Development Programme (AASDP) Toolkit
Nigeria pilot
UNDP Ade Mamonyane Lekoetje (Country Director)
Victor Oboh (National Economist)
Moji
Consultant ATA Olusegun Steve Ogidan
AfdB Ntagwabira Evans (Senior Rural Infrastructure Engineer)
Dr. Abodunrin Charles Omoluabi (Resrouce economist)
Professor (Bank of Industry) Dr. Chukwumah Ezedinma
ATA infrastructure / investments Dr. Niyi Odunlanmi (Snr. Technical Advisor)
Dr. Tony B. Bello (Snr. Advisor)
ATA Tomato / horticulture consultant Okwudili Ene John (Development Horticulturist)
ATA Sorghum consultant Dr. Omo Ohiophekai (Processing, Products and Nutrition)
ATA Dairy consultant
ATA Aquaculture consultant Aderemi O. Abioye (Deputy Director Fisheries)
IFDC / 2Scale Raphael Vogelsperger (Regional Agribusiness Coordinator)
Zailani Mohammed (Dairy PPP Manager)
Thompson Ogunsanmi (National Cluster Advisor)
Milk processor Dr. M.A. Gana (Managing Director)
UNIDO (tomato) Dr. Chuma Ezedinma (NPO Agribusiness and Agro-industry)
ECOWAS Professor Nelson
IFAD Benjamin Odoemena (Country Programme Officer)
Nirsal / Central Bank of Nigeria Sa’ad Hamidu (Director)
Aliyu A. Hameed
Maryam Waisu Yaro (Public Relations)
Musa Buba (Market access)
Betram Nigeria Limited (seeds) J.R. Bondioli (MD)
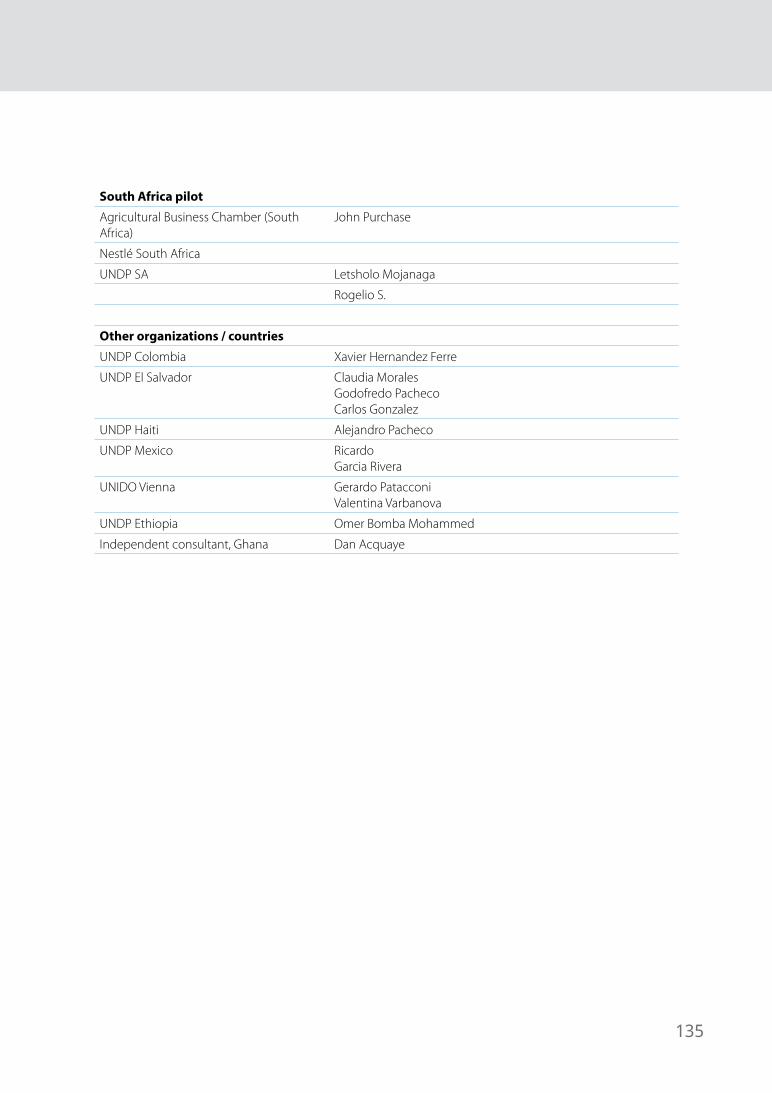
135
South Africa pilot
Agricultural Business Chamber (South Africa)
John Purchase
Nestlé South Africa
UNDP SA Letsholo Mojanaga
Rogelio S.
Other organizations / countries
UNDP Colombia Xavier Hernandez Ferre
UNDP El Salvador Claudia MoralesGodofredo Pacheco Carlos Gonzalez
UNDP Haiti Alejandro Pacheco
UNDP Mexico RicardoGarcia Rivera
UNIDO Vienna Gerardo PatacconiValentina Varbanova
UNDP Ethiopia Omer Bomba Mohammed
Independent consultant, Ghana Dan Acquaye

136
African Agribusiness Supplier Development Programme (AASDP) Toolkit
Annex
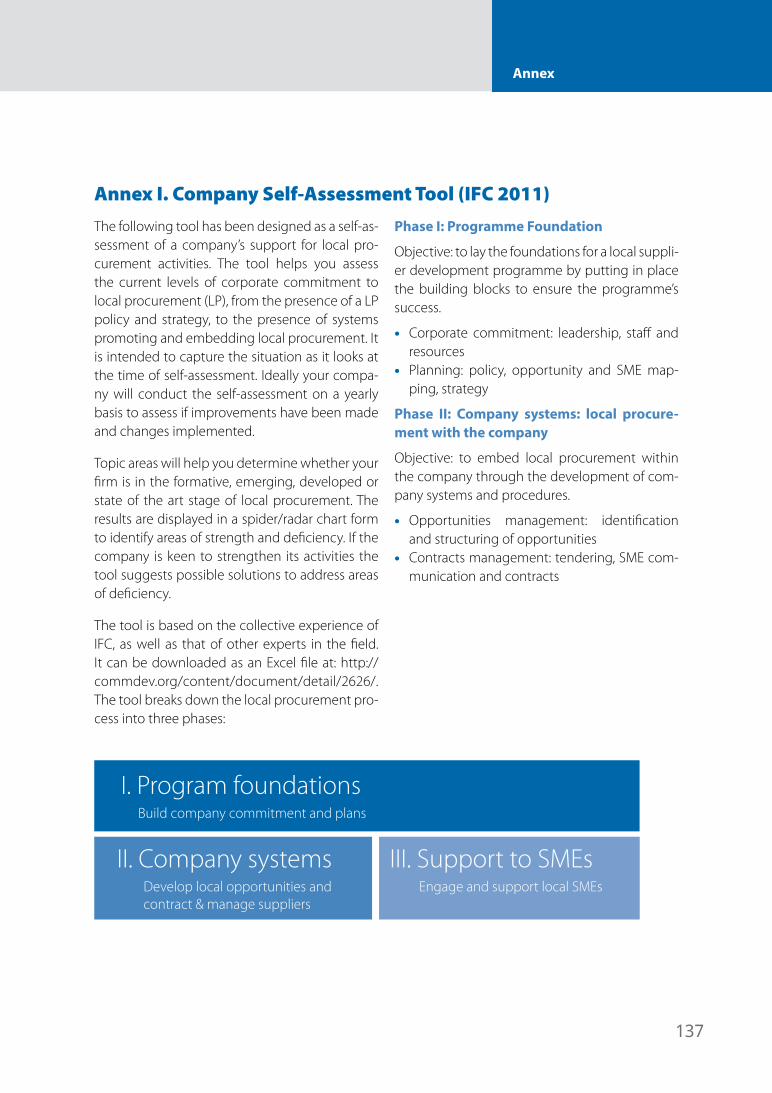
137
Annex
Annex I. Company Self-Assessment Tool (IFC 2011)The following tool has been designed as a self-as-sessment of a company’s support for local pro-curement activities. The tool helps you assess the current levels of corporate commitment to local procurement (LP), from the presence of a LP policy and strategy, to the presence of systems promoting and embedding local procurement. It is intended to capture the situation as it looks at the time of self-assessment. Ideally your compa-ny will conduct the self-assessment on a yearly basis to assess if improvements have been made and changes implemented.
Topic areas will help you determine whether your firm is in the formative, emerging, developed or state of the art stage of local procurement. The results are displayed in a spider/radar chart form to identify areas of strength and deficiency. If the company is keen to strengthen its activities the tool suggests possible solutions to address areas of deficiency.
The tool is based on the collective experience of IFC, as well as that of other experts in the field. It can be downloaded as an Excel file at: http://commdev.org/content/document/detail/2626/. The tool breaks down the local procurement pro-cess into three phases:
Phase I: Programme Foundation
Objective: to lay the foundations for a local suppli-er development programme by putting in place the building blocks to ensure the programme’s success.
• Corporate commitment: leadership, staff and resources
• Planning: policy, opportunity and SME map-ping, strategy
Phase II: Company systems: local procure-ment with the company
Objective: to embed local procurement within the company through the development of com-pany systems and procedures.
• Opportunities management: identification and structuring of opportunities
• Contracts management: tendering, SME com-munication and contracts
I. Program foundations Build company commitment and plans
II. Company systemsDevelop local opportunities and contract & manage suppliers
III. Support to SMEsEngage and support local SMEs
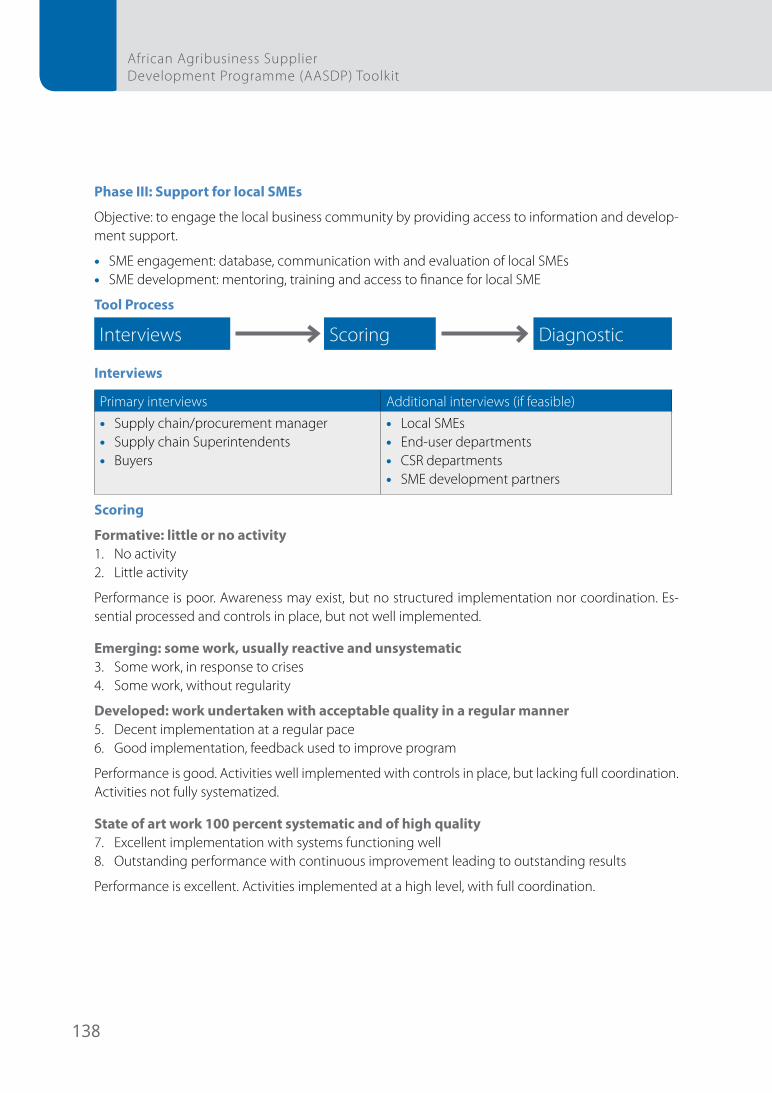
138
African Agribusiness Supplier Development Programme (AASDP) Toolkit
Phase III: Support for local SMEs
Objective: to engage the local business community by providing access to information and develop-ment support.
• SME engagement: database, communication with and evaluation of local SMEs• SME development: mentoring, training and access to finance for local SME
Tool Process
Interviews Scoring Diagnostic
Interviews
Primary interviews Additional interviews (if feasible)• Supply chain/procurement manager• Supply chain Superintendents• Buyers
• Local SMEs• End-user departments• CSR departments• SME development partners
Scoring
Formative: little or no activity1. No activity2. Little activity
Performance is poor. Awareness may exist, but no structured implementation nor coordination. Es-sential processed and controls in place, but not well implemented.
Emerging: some work, usually reactive and unsystematic3. Some work, in response to crises4. Some work, without regularity
Developed: work undertaken with acceptable quality in a regular manner5. Decent implementation at a regular pace6. Good implementation, feedback used to improve program
Performance is good. Activities well implemented with controls in place, but lacking full coordination. Activities not fully systematized.
State of art work 100 percent systematic and of high quality7. Excellent implementation with systems functioning well8. Outstanding performance with continuous improvement leading to outstanding results
Performance is excellent. Activities implemented at a high level, with full coordination.
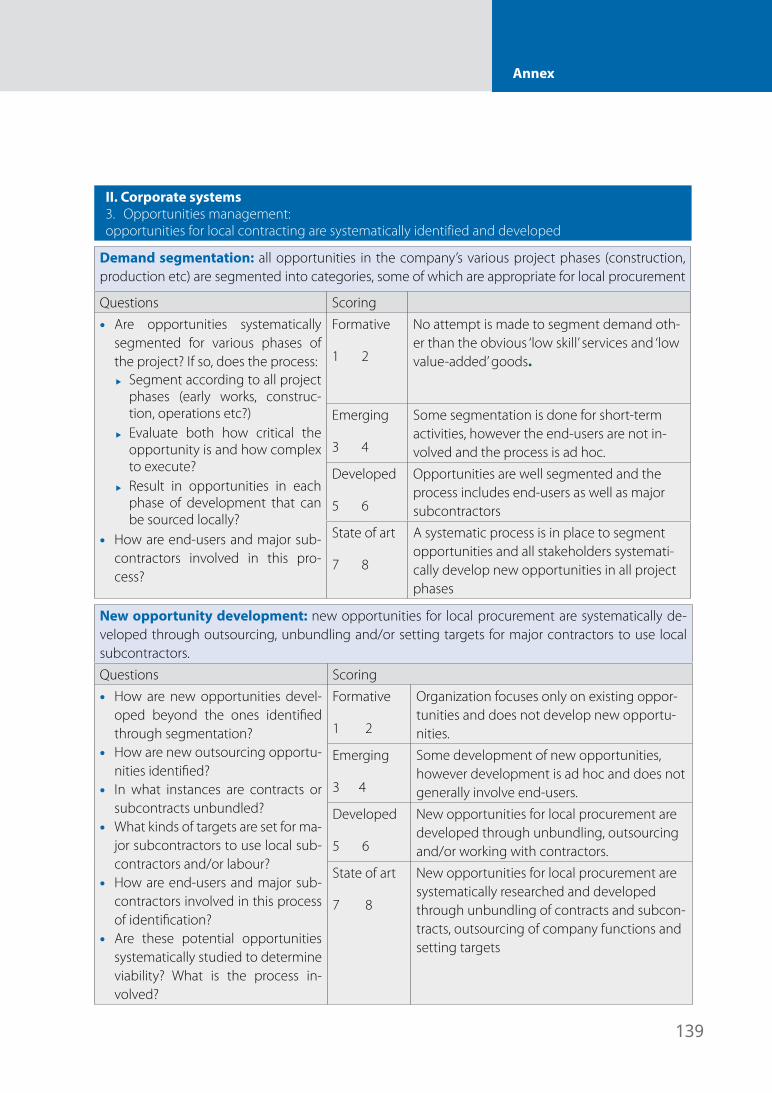
139
Annex
II. Corporate systems3. Opportunities management: opportunities for local contracting are systematically identified and developed
Demand segmentation: all opportunities in the company’s various project phases (construction, production etc) are segmented into categories, some of which are appropriate for local procurement
Questions Scoring• Are opportunities systematically
segmented for various phases of the project? If so, does the process:
u Segment according to all project phases (early works, construc-tion, operations etc?)
u Evaluate both how critical the opportunity is and how complex to execute?
u Result in opportunities in each phase of development that can be sourced locally?
• How are end-users and major sub-contractors involved in this pro-cess?
Formative
1 2
No attempt is made to segment demand oth-er than the obvious ‘low skill’ services and ‘low value-added’ goods.
Emerging
3 4
Some segmentation is done for short-term activities, however the end-users are not in-volved and the process is ad hoc.
Developed
5 6
Opportunities are well segmented and the process includes end-users as well as major subcontractors
State of art
7 8
A systematic process is in place to segment opportunities and all stakeholders systemati-cally develop new opportunities in all project phases
New opportunity development: new opportunities for local procurement are systematically de-veloped through outsourcing, unbundling and/or setting targets for major contractors to use local subcontractors.Questions Scoring• How are new opportunities devel-
oped beyond the ones identified through segmentation?
• How are new outsourcing opportu-nities identified?
• In what instances are contracts or subcontracts unbundled?
• What kinds of targets are set for ma-jor subcontractors to use local sub-contractors and/or labour?
• How are end-users and major sub-contractors involved in this process of identification?
• Are these potential opportunities systematically studied to determine viability? What is the process in-volved?
Formative
1 2
Organization focuses only on existing oppor-tunities and does not develop new opportu-nities.
Emerging
3 4
Some development of new opportunities, however development is ad hoc and does not generally involve end-users.
Developed
5 6
New opportunities for local procurement are developed through unbundling, outsourcing and/or working with contractors.
State of art
7 8
New opportunities for local procurement are systematically researched and developed through unbundling of contracts and subcon-tracts, outsourcing of company functions and setting targets
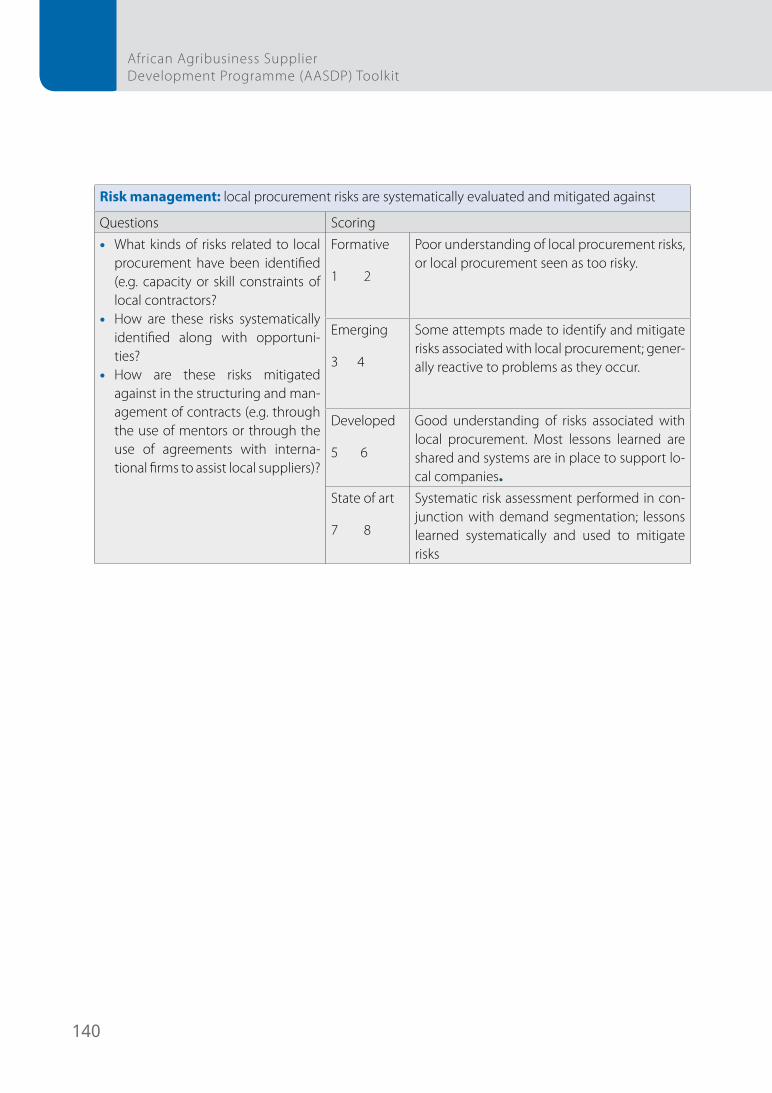
140
African Agribusiness Supplier Development Programme (AASDP) Toolkit
Risk management: local procurement risks are systematically evaluated and mitigated against
Questions Scoring• What kinds of risks related to local
procurement have been identified (e.g. capacity or skill constraints of local contractors?
• How are these risks systematically identified along with opportuni-ties?
• How are these risks mitigated against in the structuring and man-agement of contracts (e.g. through the use of mentors or through the use of agreements with interna-tional firms to assist local suppliers)?
Formative
1 2
Poor understanding of local procurement risks, or local procurement seen as too risky.
Emerging
3 4
Some attempts made to identify and mitigate risks associated with local procurement; gener-ally reactive to problems as they occur.
Developed
5 6
Good understanding of risks associated with local procurement. Most lessons learned are shared and systems are in place to support lo-cal companies.
State of art
7 8
Systematic risk assessment performed in con-junction with demand segmentation; lessons learned systematically and used to mitigate risks
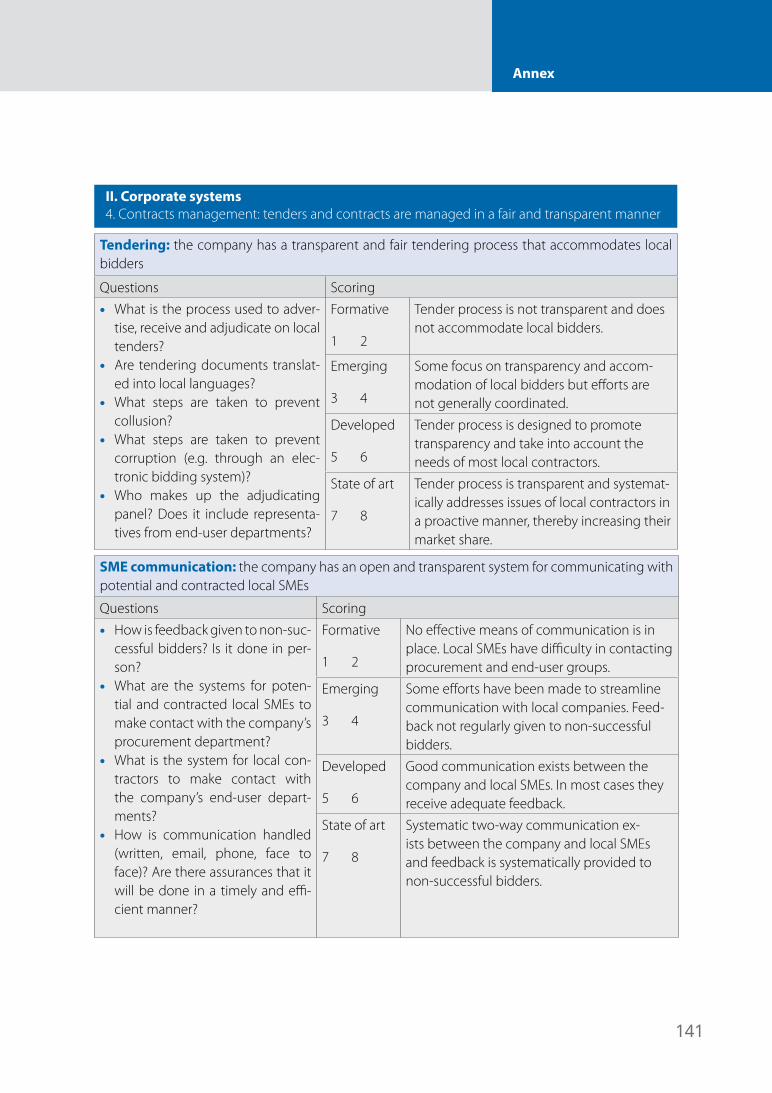
141
Annex
II. Corporate systems4. Contracts management: tenders and contracts are managed in a fair and transparent manner
Tendering: the company has a transparent and fair tendering process that accommodates local bidders
Questions Scoring• What is the process used to adver-
tise, receive and adjudicate on local tenders?
• Are tendering documents translat-ed into local languages?
• What steps are taken to prevent collusion?
• What steps are taken to prevent corruption (e.g. through an elec-tronic bidding system)?
• Who makes up the adjudicating panel? Does it include representa-tives from end-user departments?
Formative
1 2
Tender process is not transparent and does not accommodate local bidders.
Emerging
3 4
Some focus on transparency and accom-modation of local bidders but efforts are not generally coordinated.
Developed
5 6
Tender process is designed to promote transparency and take into account the needs of most local contractors.
State of art
7 8
Tender process is transparent and systemat-ically addresses issues of local contractors in a proactive manner, thereby increasing their market share.
SME communication: the company has an open and transparent system for communicating with potential and contracted local SMEs
Questions Scoring• How is feedback given to non-suc-
cessful bidders? Is it done in per-son?
• What are the systems for poten-tial and contracted local SMEs to make contact with the company’s procurement department?
• What is the system for local con-tractors to make contact with the company’s end-user depart-ments?
• How is communication handled (written, email, phone, face to face)? Are there assurances that it will be done in a timely and effi-cient manner?
Formative
1 2
No effective means of communication is in place. Local SMEs have difficulty in contacting procurement and end-user groups.
Emerging
3 4
Some efforts have been made to streamline communication with local companies. Feed-back not regularly given to non-successful bidders.
Developed
5 6
Good communication exists between the company and local SMEs. In most cases they receive adequate feedback.
State of art
7 8
Systematic two-way communication ex-ists between the company and local SMEs and feedback is systematically provided to non-successful bidders.
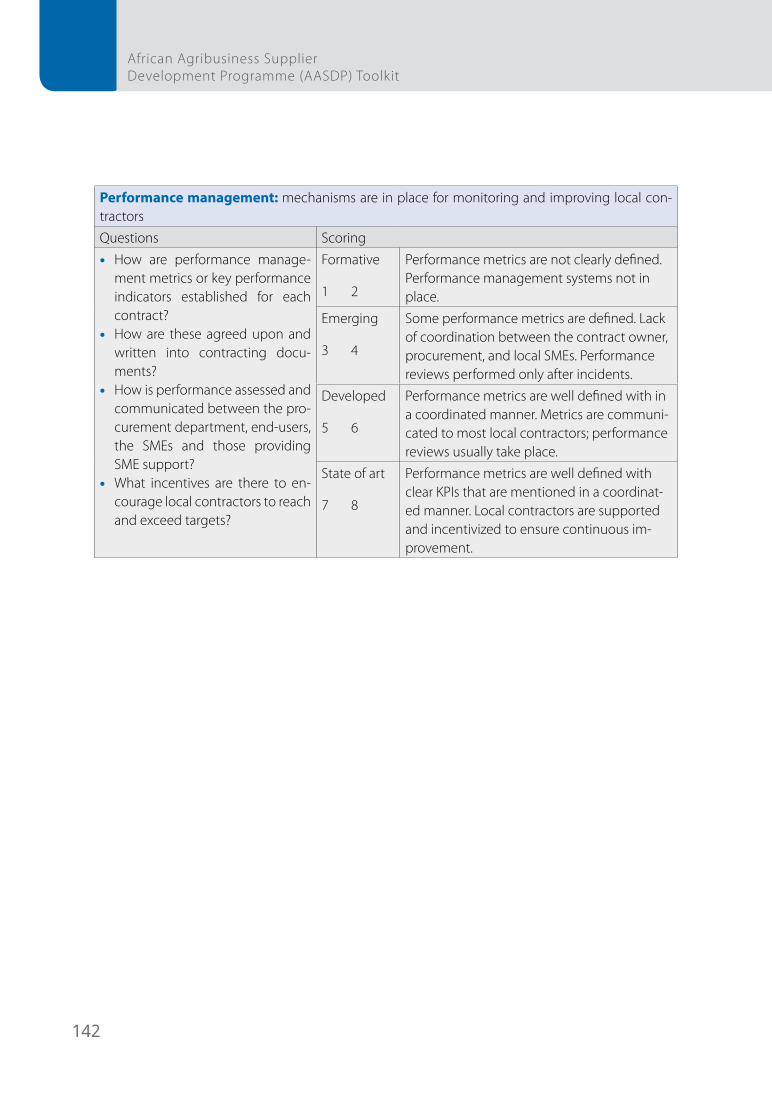
142
African Agribusiness Supplier Development Programme (AASDP) Toolkit
Performance management: mechanisms are in place for monitoring and improving local con-tractorsQuestions Scoring• How are performance manage-
ment metrics or key performance indicators established for each contract?
• How are these agreed upon and written into contracting docu-ments?
• How is performance assessed and communicated between the pro-curement department, end-users, the SMEs and those providing SME support?
• What incentives are there to en-courage local contractors to reach and exceed targets?
Formative
1 2
Performance metrics are not clearly defined. Performance management systems not in place.
Emerging
3 4
Some performance metrics are defined. Lack of coordination between the contract owner, procurement, and local SMEs. Performance reviews performed only after incidents.
Developed
5 6
Performance metrics are well defined with in a coordinated manner. Metrics are communi-cated to most local contractors; performance reviews usually take place.
State of art
7 8
Performance metrics are well defined with clear KPIs that are mentioned in a coordinat-ed manner. Local contractors are supported and incentivized to ensure continuous im-provement.
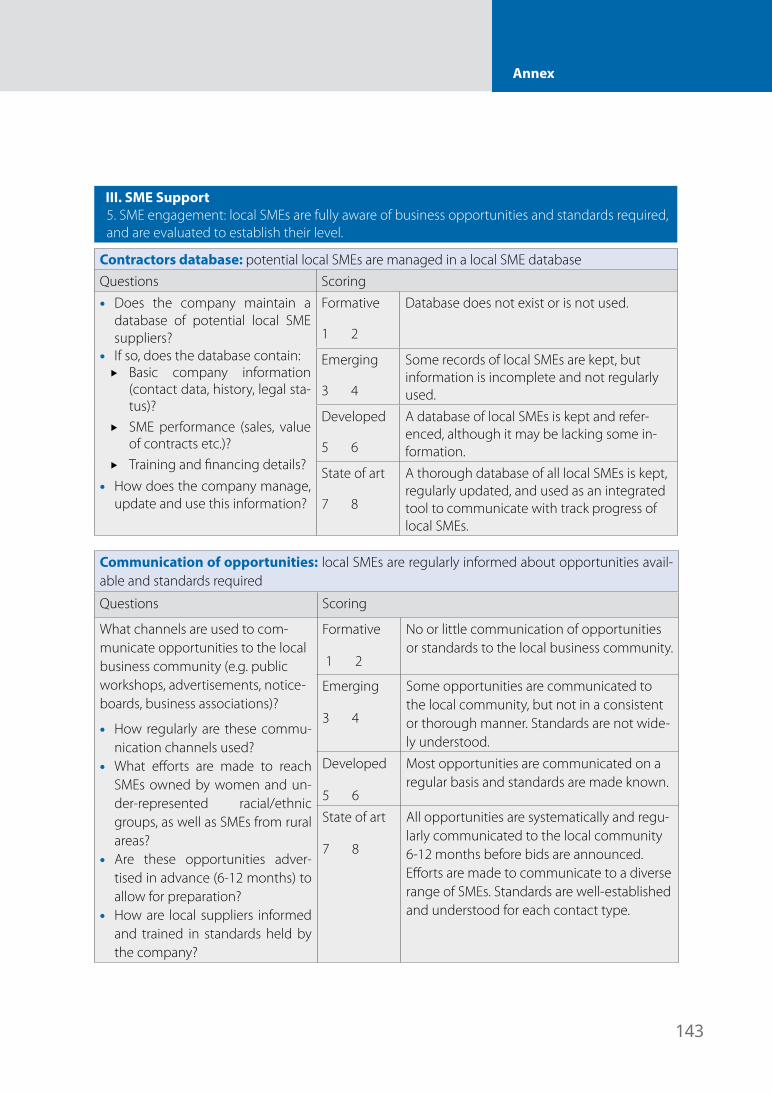
143
Annex
III. SME Support5. SME engagement: local SMEs are fully aware of business opportunities and standards required, and are evaluated to establish their level.
Contractors database: potential local SMEs are managed in a local SME databaseQuestions Scoring• Does the company maintain a
database of potential local SME suppliers?
• If so, does the database contain: � Basic company information
(contact data, history, legal sta-tus)?
� SME performance (sales, value of contracts etc.)?
� Training and financing details?• How does the company manage,
update and use this information?
Formative
1 2
Database does not exist or is not used.
Emerging
3 4
Some records of local SMEs are kept, but information is incomplete and not regularly used.
Developed
5 6
A database of local SMEs is kept and refer-enced, although it may be lacking some in-formation.
State of art
7 8
A thorough database of all local SMEs is kept, regularly updated, and used as an integrated tool to communicate with track progress of local SMEs.
Communication of opportunities: local SMEs are regularly informed about opportunities avail-able and standards required
Questions Scoring
What channels are used to com-municate opportunities to the local business community (e.g. public workshops, advertisements, notice-boards, business associations)?
• How regularly are these commu-nication channels used?
• What efforts are made to reach SMEs owned by women and un-der-represented racial/ethnic groups, as well as SMEs from rural areas?
• Are these opportunities adver-tised in advance (6-12 months) to allow for preparation?
• How are local suppliers informed and trained in standards held by the company?
Formative
1 2
No or little communication of opportunities or standards to the local business community.
Emerging
3 4
Some opportunities are communicated to the local community, but not in a consistent or thorough manner. Standards are not wide-ly understood.
Developed
5 6
Most opportunities are communicated on a regular basis and standards are made known.
State of art
7 8
All opportunities are systematically and regu-larly communicated to the local community 6-12 months before bids are announced. Efforts are made to communicate to a diverse range of SMEs. Standards are well-established and understood for each contact type.
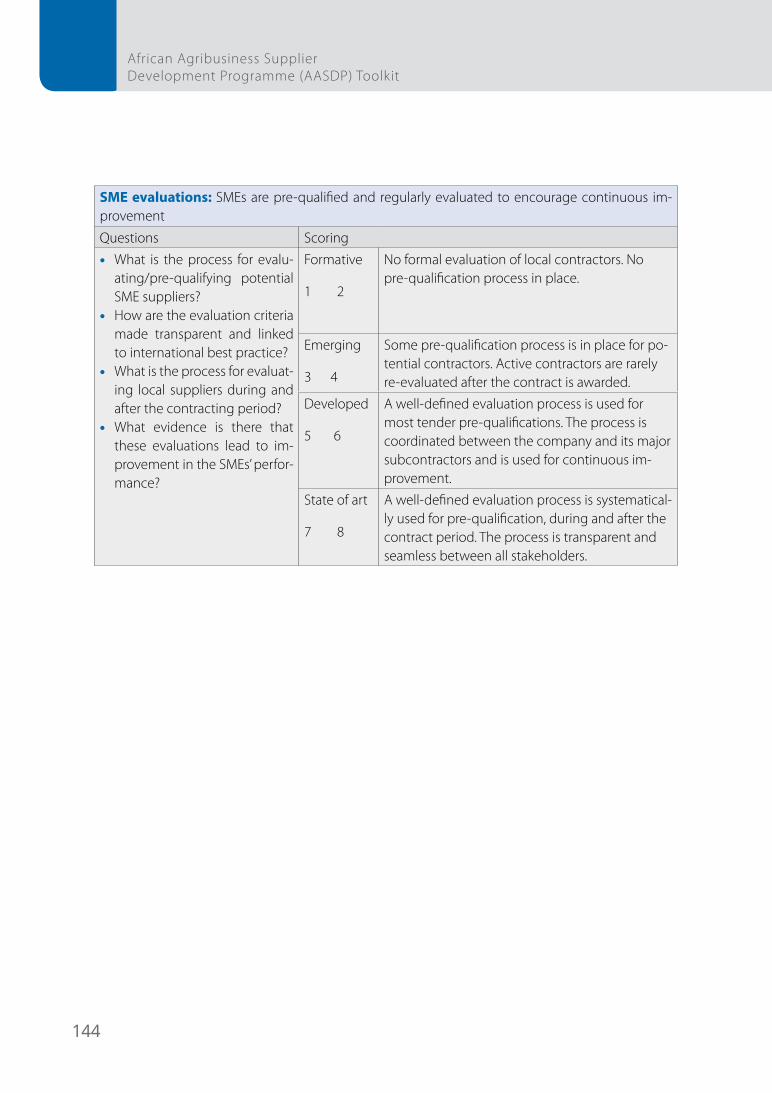
144
African Agribusiness Supplier Development Programme (AASDP) Toolkit
SME evaluations: SMEs are pre-qualified and regularly evaluated to encourage continuous im-provement
Questions Scoring• What is the process for evalu-
ating/pre-qualifying potential SME suppliers?
• How are the evaluation criteria made transparent and linked to international best practice?
• What is the process for evaluat-ing local suppliers during and after the contracting period?
• What evidence is there that these evaluations lead to im-provement in the SMEs’ perfor-mance?
Formative
1 2
No formal evaluation of local contractors. No pre-qualification process in place.
Emerging
3 4
Some pre-qualification process is in place for po-tential contractors. Active contractors are rarely re-evaluated after the contract is awarded.
Developed
5 6
A well-defined evaluation process is used for most tender pre-qualifications. The process is coordinated between the company and its major subcontractors and is used for continuous im-provement.
State of art
7 8
A well-defined evaluation process is systematical-ly used for pre-qualification, during and after the contract period. The process is transparent and seamless between all stakeholders.
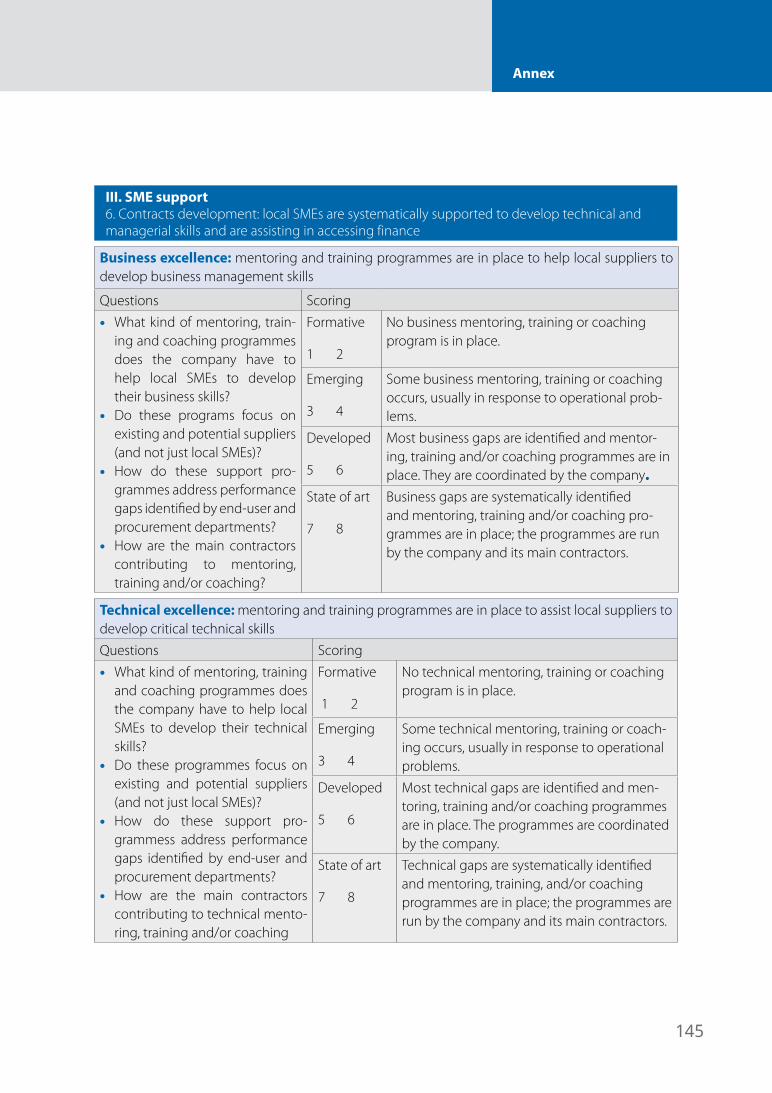
145
Annex
III. SME support6. Contracts development: local SMEs are systematically supported to develop technical and managerial skills and are assisting in accessing finance
Business excellence: mentoring and training programmes are in place to help local suppliers to develop business management skills
Questions Scoring• What kind of mentoring, train-
ing and coaching programmes does the company have to help local SMEs to develop their business skills?
• Do these programs focus on existing and potential suppliers (and not just local SMEs)?
• How do these support pro-grammes address performance gaps identified by end-user and procurement departments?
• How are the main contractors contributing to mentoring, training and/or coaching?
Formative
1 2
No business mentoring, training or coaching program is in place.
Emerging
3 4
Some business mentoring, training or coaching occurs, usually in response to operational prob-lems.
Developed
5 6
Most business gaps are identified and mentor-ing, training and/or coaching programmes are in place. They are coordinated by the company.
State of art
7 8
Business gaps are systematically identified and mentoring, training and/or coaching pro-grammes are in place; the programmes are run by the company and its main contractors.
Technical excellence: mentoring and training programmes are in place to assist local suppliers to develop critical technical skillsQuestions Scoring• What kind of mentoring, training
and coaching programmes does the company have to help local SMEs to develop their technical skills?
• Do these programmes focus on existing and potential suppliers (and not just local SMEs)?
• How do these support pro-grammess address performance gaps identified by end-user and procurement departments?
• How are the main contractors contributing to technical mento-ring, training and/or coaching
Formative
1 2
No technical mentoring, training or coaching program is in place.
Emerging
3 4
Some technical mentoring, training or coach-ing occurs, usually in response to operational problems.
Developed
5 6
Most technical gaps are identified and men-toring, training and/or coaching programmes are in place. The programmes are coordinated by the company.
State of art
7 8
Technical gaps are systematically identified and mentoring, training, and/or coaching programmes are in place; the programmes are run by the company and its main contractors.
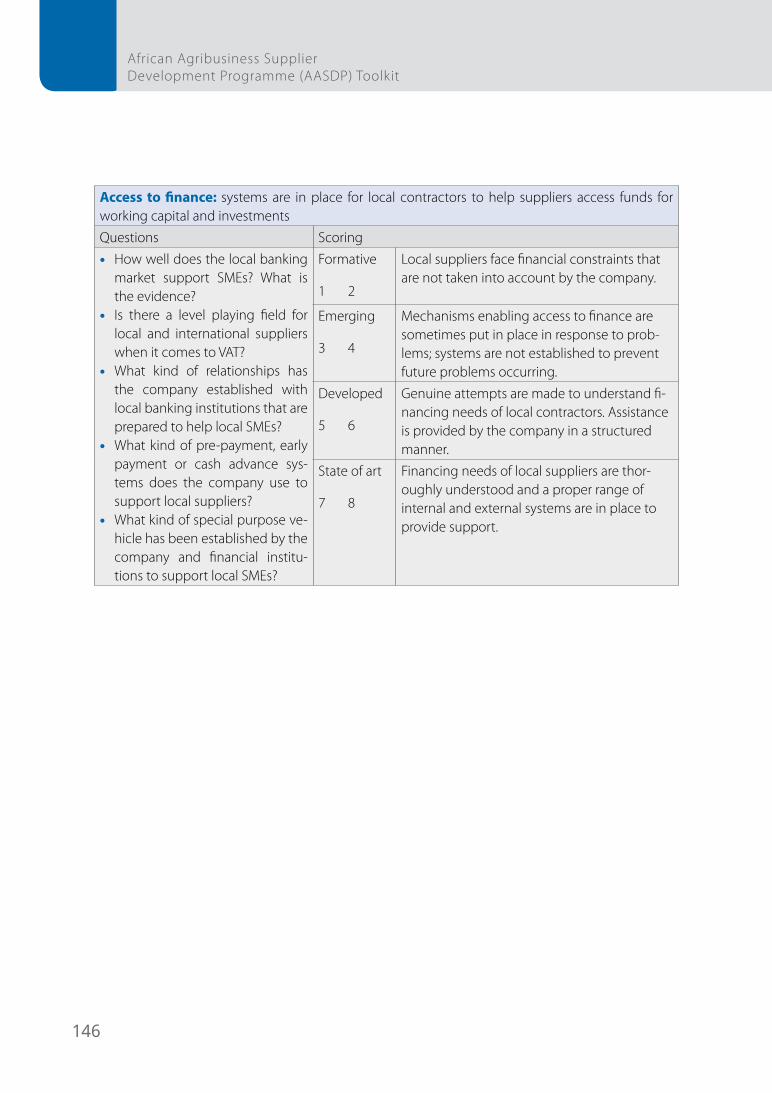
146
African Agribusiness Supplier Development Programme (AASDP) Toolkit
Access to finance: systems are in place for local contractors to help suppliers access funds for working capital and investmentsQuestions Scoring• How well does the local banking
market support SMEs? What is the evidence?
• Is there a level playing field for local and international suppliers when it comes to VAT?
• What kind of relationships has the company established with local banking institutions that are prepared to help local SMEs?
• What kind of pre-payment, early payment or cash advance sys-tems does the company use to support local suppliers?
• What kind of special purpose ve-hicle has been established by the company and financial institu-tions to support local SMEs?
Formative
1 2
Local suppliers face financial constraints that are not taken into account by the company.
Emerging
3 4
Mechanisms enabling access to finance are sometimes put in place in response to prob-lems; systems are not established to prevent future problems occurring.
Developed
5 6
Genuine attempts are made to understand fi-nancing needs of local contractors. Assistance is provided by the company in a structured manner.
State of art
7 8
Financing needs of local suppliers are thor-oughly understood and a proper range of internal and external systems are in place to provide support.
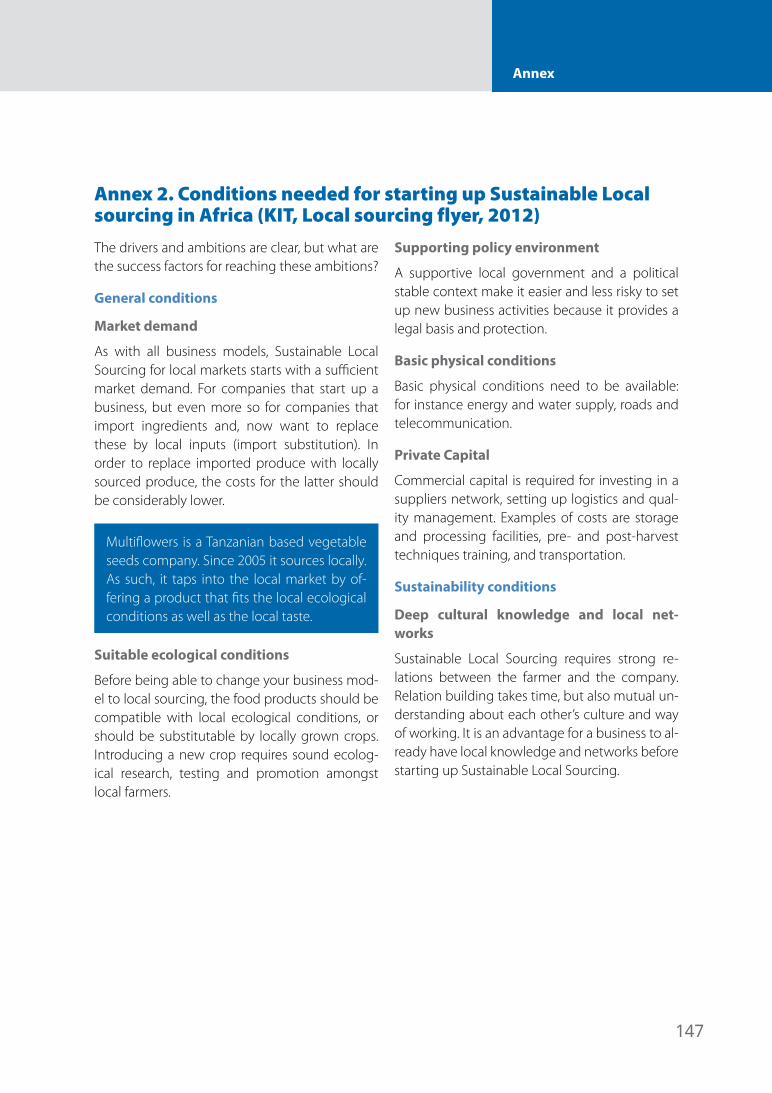
147
Annex
Annex 2. Conditions needed for starting up Sustainable Local sourcing in Africa (KIT, Local sourcing flyer, 2012)The drivers and ambitions are clear, but what are the success factors for reaching these ambitions?
General conditions
Market demand
As with all business models, Sustainable Local Sourcing for local markets starts with a sufficient market demand. For companies that start up a business, but even more so for companies that import ingredients and, now want to replace these by local inputs (import substitution). In order to replace imported produce with locally sourced produce, the costs for the latter should be considerably lower.
Multiflowers is a Tanzanian based vegetable seeds company. Since 2005 it sources locally. As such, it taps into the local market by of-fering a product that fits the local ecological conditions as well as the local taste.
Suitable ecological conditions
Before being able to change your business mod-el to local sourcing, the food products should be compatible with local ecological conditions, or should be substitutable by locally grown crops. Introducing a new crop requires sound ecolog-ical research, testing and promotion amongst local farmers.
Supporting policy environment
A supportive local government and a political stable context make it easier and less risky to set up new business activities because it provides a legal basis and protection.
Basic physical conditions
Basic physical conditions need to be available: for instance energy and water supply, roads and telecommunication.
Private Capital
Commercial capital is required for investing in a suppliers network, setting up logistics and qual-ity management. Examples of costs are storage and processing facilities, pre- and post-harvest techniques training, and transportation.
Sustainability conditions
Deep cultural knowledge and local net-works
Sustainable Local Sourcing requires strong re-lations between the farmer and the company. Relation building takes time, but also mutual un-derstanding about each other’s culture and way of working. It is an advantage for a business to al-ready have local knowledge and networks before starting up Sustainable Local Sourcing.
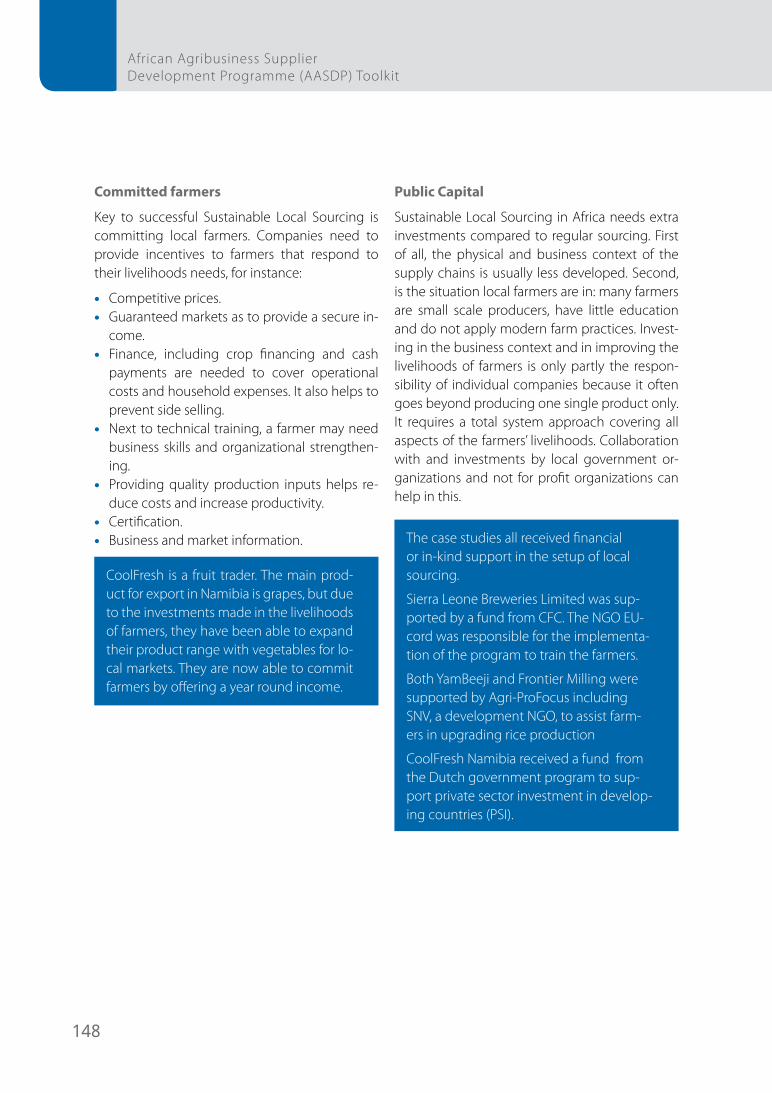
148
African Agribusiness Supplier Development Programme (AASDP) Toolkit
Committed farmers
Key to successful Sustainable Local Sourcing is committing local farmers. Companies need to provide incentives to farmers that respond to their livelihoods needs, for instance:
• Competitive prices.• Guaranteed markets as to provide a secure in-
come. • Finance, including crop financing and cash
payments are needed to cover operational costs and household expenses. It also helps to prevent side selling.
• Next to technical training, a farmer may need business skills and organizational strengthen-ing.
• Providing quality production inputs helps re-duce costs and increase productivity.
• Certification.• Business and market information.
CoolFresh is a fruit trader. The main prod-uct for export in Namibia is grapes, but due to the investments made in the livelihoods of farmers, they have been able to expand their product range with vegetables for lo-cal markets. They are now able to commit farmers by offering a year round income.
Public Capital
Sustainable Local Sourcing in Africa needs extra investments compared to regular sourcing. First of all, the physical and business context of the supply chains is usually less developed. Second, is the situation local farmers are in: many farmers are small scale producers, have little education and do not apply modern farm practices. Invest-ing in the business context and in improving the livelihoods of farmers is only partly the respon-sibility of individual companies because it often goes beyond producing one single product only. It requires a total system approach covering all aspects of the farmers’ livelihoods. Collaboration with and investments by local government or-ganizations and not for profit organizations can help in this.
The case studies all received financial or in-kind support in the setup of local sourcing.
Sierra Leone Breweries Limited was sup-ported by a fund from CFC. The NGO EU-cord was responsible for the implementa-tion of the program to train the farmers.
Both YamBeeji and Frontier Milling were supported by Agri-ProFocus including SNV, a development NGO, to assist farm-ers in upgrading rice production
CoolFresh Namibia received a fund from the Dutch government program to sup-port private sector investment in develop-ing countries (PSI).
149
Annex
Steps and Costs
In summary, the typical extra costs for setting up Sustainable Local Sourcing are for:
1. Research on ecological possibilities for local sourcing: developing, testing and introducing the food ingredient and production technolo-gies locally in pilot plots.
2. Awareness creation and promotion in order to commit farmers to your supply chain: field visits, meetings etc.
3. Training on pre- and post-harvesting, quali-ty management and (if needed) certification, but also training in business skills and orga-nizational training for cooperatives, associa-tions, marketing groups, community groups etc.
4. Developing a system for the collection of produce: installing collection points includ-ing hardware (storage, simple processing equipment) and training of collectors.
5. Financing schemes: timely payments and pre-finance. This requires a company to man-age cash flows differently or set up new finan-cial arrangements with local financial services providers.
6. Local transportation costs: Despite reducing international freight and import costs, local transportation costs from the farmers and their collection points need to be covered.
7. Training service suppliers: such as seeds sup-pliers, transporters and local banks in quality requirements, improved logistics and so on.
8. Personnel costs: extra staff to manage local procurement, for example to do field visits, or-ganize meetings and contract collectors and farmers.
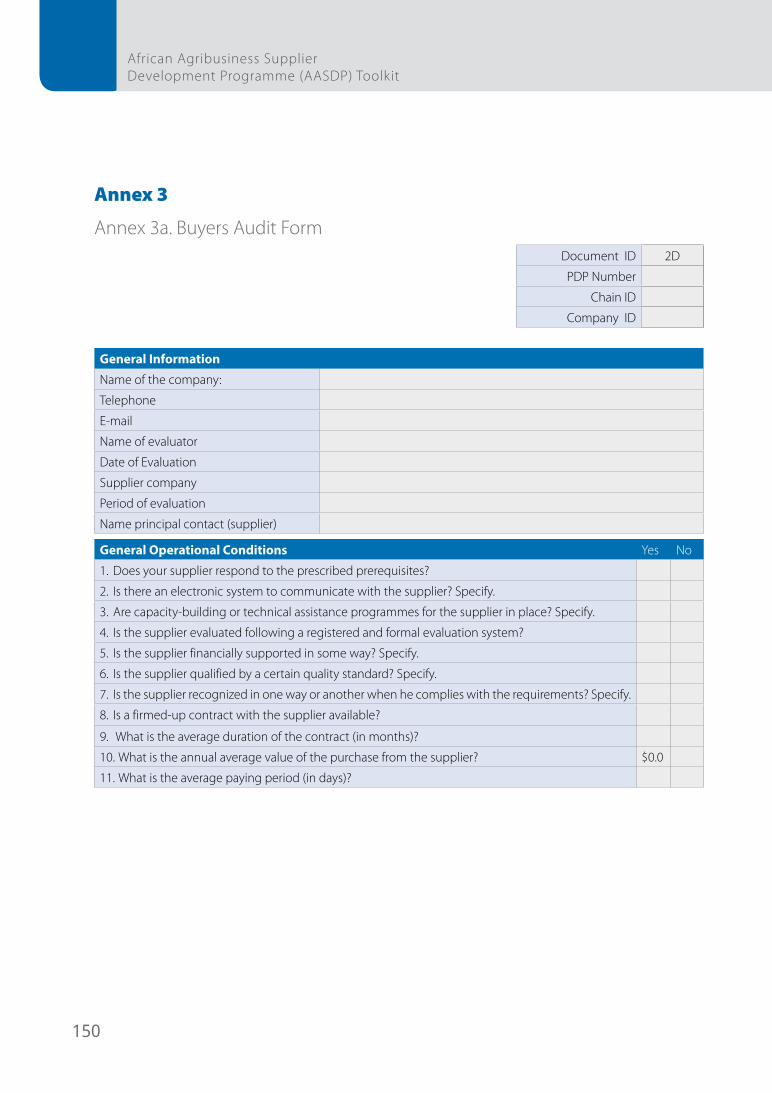
150
African Agribusiness Supplier Development Programme (AASDP) Toolkit
Annex 3
Annex 3a. Buyers Audit FormDocument ID 2D
PDP Number
Chain ID
Company ID
General Information
Name of the company:
Telephone
Name of evaluator
Date of Evaluation
Supplier company
Period of evaluation
Name principal contact (supplier)
General Operational Conditions Yes No
1. Does your supplier respond to the prescribed prerequisites?
2. Is there an electronic system to communicate with the supplier? Specify.
3. Are capacity-building or technical assistance programmes for the supplier in place? Specify.
4. Is the supplier evaluated following a registered and formal evaluation system?
5. Is the supplier financially supported in some way? Specify.
6. Is the supplier qualified by a certain quality standard? Specify.
7. Is the supplier recognized in one way or another when he complies with the requirements? Specify.
8. Is a firmed-up contract with the supplier available?
9. What is the average duration of the contract (in months)?
10. What is the annual average value of the purchase from the supplier? $0.0
11. What is the average paying period (in days)?
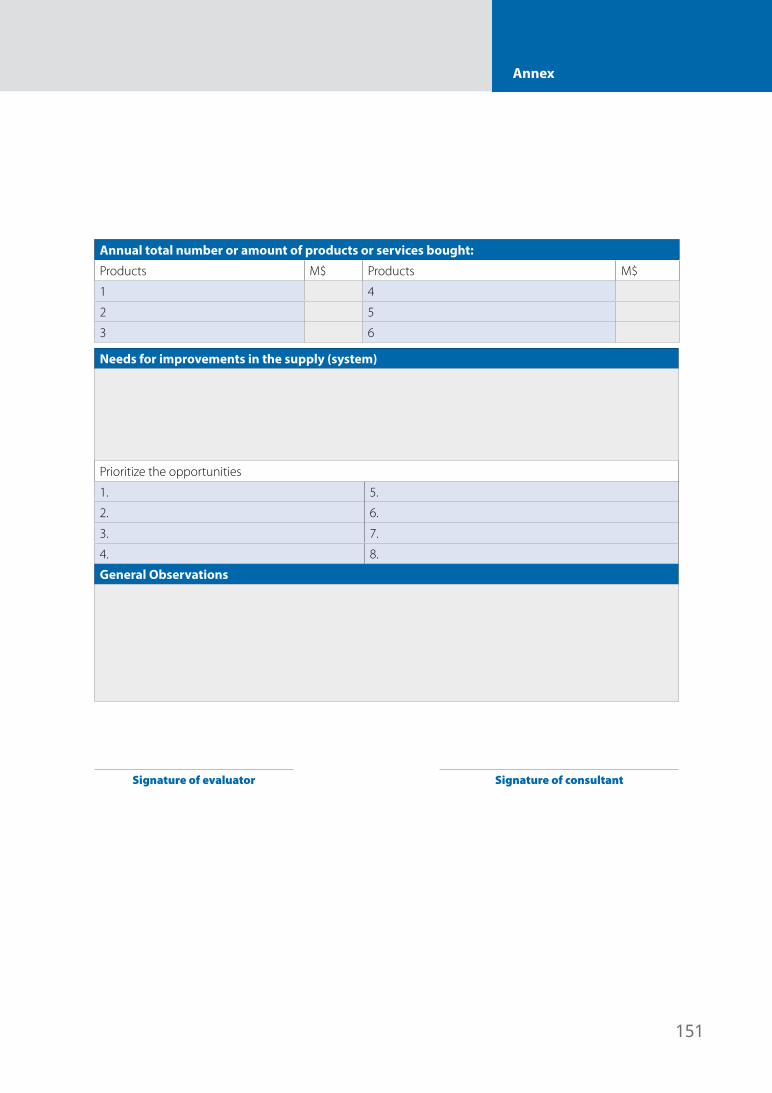
151
Annex
Annual total number or amount of products or services bought:
Products M$ Products M$
1 4
2 5
3 6
Needs for improvements in the supply (system)
Prioritize the opportunities
1. 5.
2. 6.
3. 7.
4. 8.
General Observations
Signature of evaluator Signature of consultant
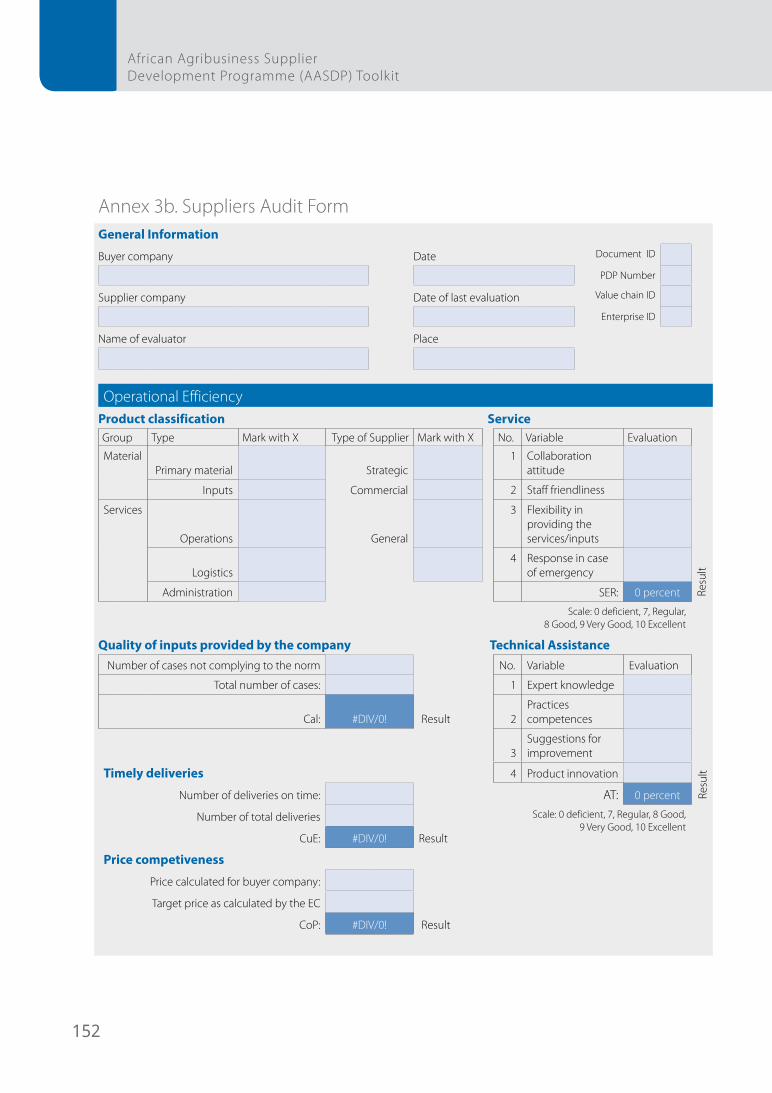
152
African Agribusiness Supplier Development Programme (AASDP) Toolkit
Annex 3b. Suppliers Audit Form General Information
Buyer company Date Document ID
PDP Number
Supplier company Date of last evaluation Value chain ID
Enterprise ID
Name of evaluator Place
Operational Efficiency
Product classification ServiceGroup Type Mark with X Type of Supplier Mark with X No. Variable Evaluation
MaterialPrimary material
Strategic
1 Collaboration attitude
Inputs Commercial 2 Staff friendliness
Services
Operations General
3 Flexibility in providing the services/inputs
Logistics 4 Response in case
of emergency
Resu
lt
Administration SER: 0 percent
Scale: 0 deficient, 7, Regular, 8 Good, 9 Very Good, 10 Excellent
Quality of inputs provided by the company Technical Assistance Number of cases not complying to the norm No. Variable Evaluation
Total number of cases: 1 Expert knowledge
Cal: #DIV/0! Result 2Practices competences
3Suggestions for improvement
Resu
lt Timely deliveries 4 Product innovation
Number of deliveries on time: AT: 0 percent
Number of total deliveries Scale: 0 deficient, 7, Regular, 8 Good, 9 Very Good, 10 Excellent
CuE: #DIV/0! Result
Price competiveness
Price calculated for buyer company:
Target price as calculated by the EC
CoP: #DIV/0! Result
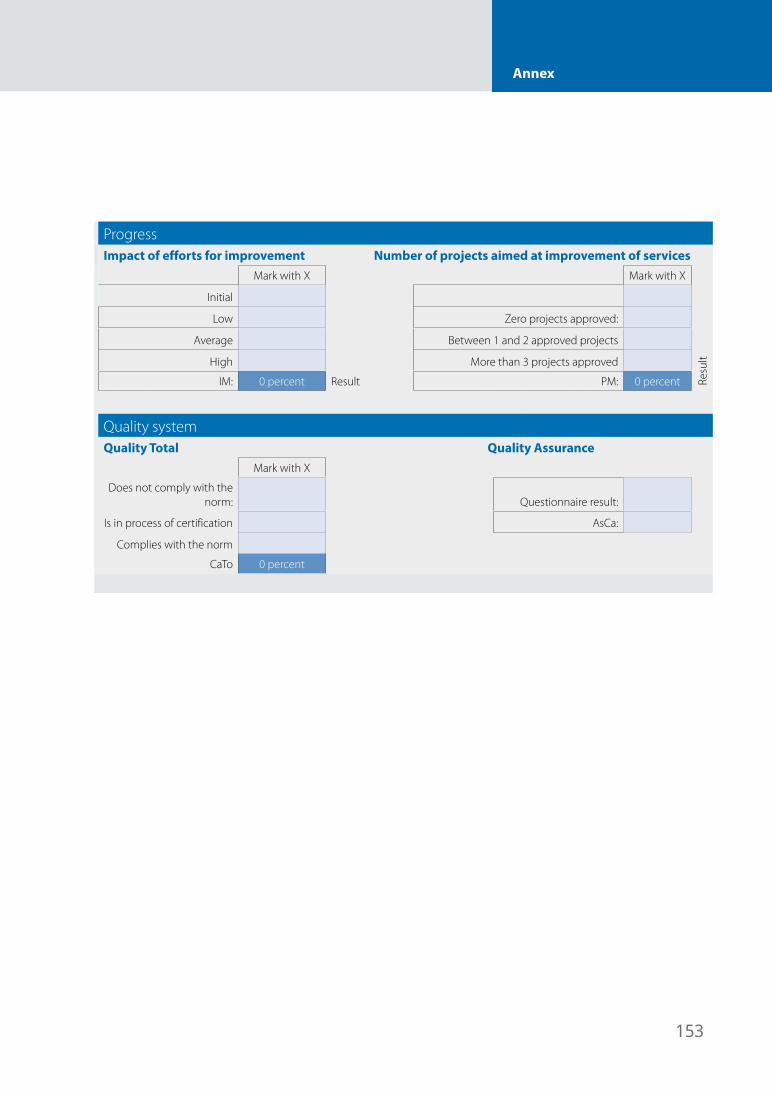
153
Annex
Progress Impact of efforts for improvement Number of projects aimed at improvement of services
Mark with X Mark with X
Initial
Low Zero projects approved:
Average Between 1 and 2 approved projects
Resu
lt High More than 3 projects approved
IM: 0 percent Result PM: 0 percent
Quality system Quality Total Quality Assurance
Mark with X
Does not comply with the norm: Questionnaire result:
Is in process of certification AsCa:
Complies with the norm
CaTo 0 percent
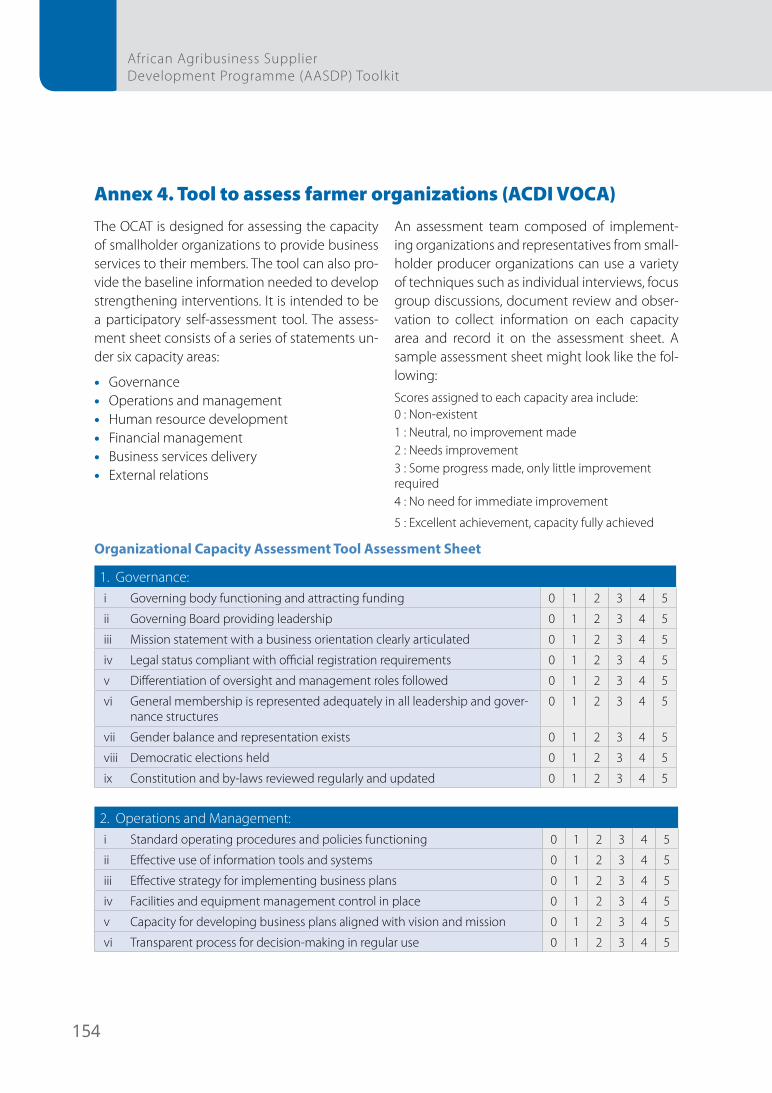
154
African Agribusiness Supplier Development Programme (AASDP) Toolkit
Annex 4. Tool to assess farmer organizations (ACDI VOCA)The OCAT is designed for assessing the capacity of smallholder organizations to provide business services to their members. The tool can also pro-vide the baseline information needed to develop strengthening interventions. It is intended to be a participatory self-assessment tool. The assess-ment sheet consists of a series of statements un-der six capacity areas:
• Governance• Operations and management• Human resource development• Financial management• Business services delivery • External relations
An assessment team composed of implement-ing organizations and representatives from small-holder producer organizations can use a variety of techniques such as individual interviews, focus group discussions, document review and obser-vation to collect information on each capacity area and record it on the assessment sheet. A sample assessment sheet might look like the fol-lowing:
Scores assigned to each capacity area include:0 : Non-existent1 : Neutral, no improvement made2 : Needs improvement3 : Some progress made, only little improvement required4 : No need for immediate improvement
5 : Excellent achievement, capacity fully achieved
Organizational Capacity Assessment Tool Assessment Sheet
1. Governance:i Governing body functioning and attracting funding 0 1 2 3 4 5
ii Governing Board providing leadership 0 1 2 3 4 5
iii Mission statement with a business orientation clearly articulated 0 1 2 3 4 5
iv Legal status compliant with official registration requirements 0 1 2 3 4 5
v Differentiation of oversight and management roles followed 0 1 2 3 4 5
vi General membership is represented adequately in all leadership and gover-nance structures
0 1 2 3 4 5
vii Gender balance and representation exists 0 1 2 3 4 5
viii Democratic elections held 0 1 2 3 4 5
ix Constitution and by-laws reviewed regularly and updated 0 1 2 3 4 5
2. Operations and Management:i Standard operating procedures and policies functioning 0 1 2 3 4 5
ii Effective use of information tools and systems 0 1 2 3 4 5
iii Effective strategy for implementing business plans 0 1 2 3 4 5
iv Facilities and equipment management control in place 0 1 2 3 4 5
v Capacity for developing business plans aligned with vision and mission 0 1 2 3 4 5
vi Transparent process for decision-making in regular use 0 1 2 3 4 5
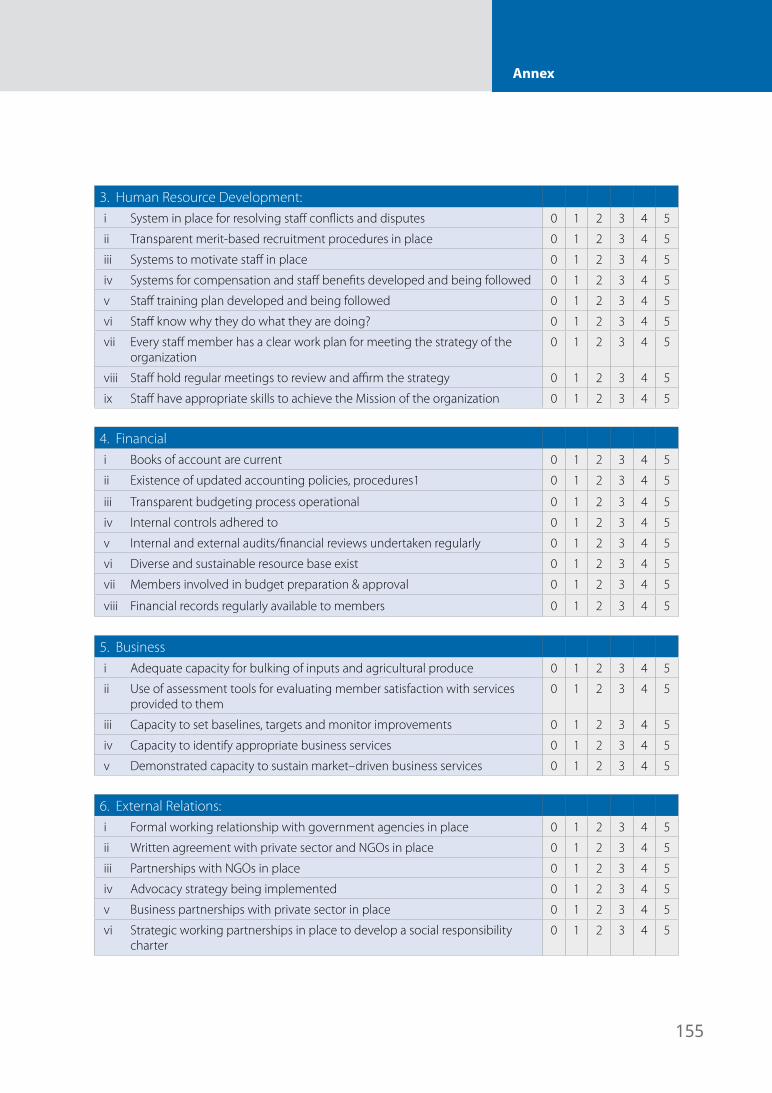
155
Annex
3. Human Resource Development:i System in place for resolving staff conflicts and disputes 0 1 2 3 4 5
ii Transparent merit-based recruitment procedures in place 0 1 2 3 4 5
iii Systems to motivate staff in place 0 1 2 3 4 5
iv Systems for compensation and staff benefits developed and being followed 0 1 2 3 4 5
v Staff training plan developed and being followed 0 1 2 3 4 5
vi Staff know why they do what they are doing? 0 1 2 3 4 5
vii Every staff member has a clear work plan for meeting the strategy of the organization
0 1 2 3 4 5
viii Staff hold regular meetings to review and affirm the strategy 0 1 2 3 4 5
ix Staff have appropriate skills to achieve the Mission of the organization 0 1 2 3 4 5
4. Financial Management:i Books of account are current 0 1 2 3 4 5
ii Existence of updated accounting policies, procedures1 0 1 2 3 4 5
iii Transparent budgeting process operational 0 1 2 3 4 5
iv Internal controls adhered to 0 1 2 3 4 5
v Internal and external audits/financial reviews undertaken regularly 0 1 2 3 4 5
vi Diverse and sustainable resource base exist 0 1 2 3 4 5
vii Members involved in budget preparation & approval 0 1 2 3 4 5
viii Financial records regularly available to members 0 1 2 3 4 5
5. Business Services Deliveryi Adequate capacity for bulking of inputs and agricultural produce 0 1 2 3 4 5
ii Use of assessment tools for evaluating member satisfaction with services provided to them
0 1 2 3 4 5
iii Capacity to set baselines, targets and monitor improvements 0 1 2 3 4 5
iv Capacity to identify appropriate business services 0 1 2 3 4 5
v Demonstrated capacity to sustain market–driven business services 0 1 2 3 4 5
6. External Relations:i Formal working relationship with government agencies in place 0 1 2 3 4 5
ii Written agreement with private sector and NGOs in place 0 1 2 3 4 5
iii Partnerships with NGOs in place 0 1 2 3 4 5
iv Advocacy strategy being implemented 0 1 2 3 4 5
v Business partnerships with private sector in place 0 1 2 3 4 5
vi Strategic working partnerships in place to develop a social responsibility charter
0 1 2 3 4 5
156
African Agribusiness Supplier Development Programme (AASDP) Toolkit
Annex 5. Gender Analysis (KIT 2012)Analysing the chain from a gender perspec-tive at the macro, meso and micro levels
It is important to understand gender issues in a value chain at various levels: macro, meso and micro. This tool consists of checklists of questions to ask at each level, divided into four broad top-ics: gender roles, access to resources, control over benefits, and influence on enabling factors.
The purpose is to identify and facilitate discus-sions on any gaps, discrimination and other key gender issues, so enabling the underlying causes to be identified and suitable interventions to be determined.
Objectives
To raise awareness of the different stakeholders that they act in a complex system with mutual influences that can be positive or negative.
Used by
Practitioners in desk studies, field work and focus group discussions.
Methods
Use the checklists in Tables 10.4 to 10.6 to identi-fy items to investigate at each level. Then collate and analyse the results in Table 10.7.
Macro level: The emphasis at this level (Table 10.4) is on two aspects:
• The cultural setting (ethnic context, religion, ideology, norms and values) regarding wom-en’s and men’s roles and responsibilities
• The regulations and legislations around labour, access to resources (inheritance law, land etc.), market demand (local, national, international) and gender equality
Meso level: This analysis deals with the gender sensitivity of local institutions and organizations and their delivery systems. It investigates wheth-er they reflect gender equality principles in their structure, in their culture, in the services they provide, and in the way these services are pro-vided (producer groups, business development services, etc.) (Table 10.5).
Micro level: This analysis deals with outreach and impacts. The micro level helps identify major con-straints faced by women at the household level, which will have repercussions on the meso and macro levels (Table 10.6).
Analysis: Feed the outcome of the analysis into Table 10.7. Use this to identify key gender-based issues (constraints and opportunities) and appro-priate actions.
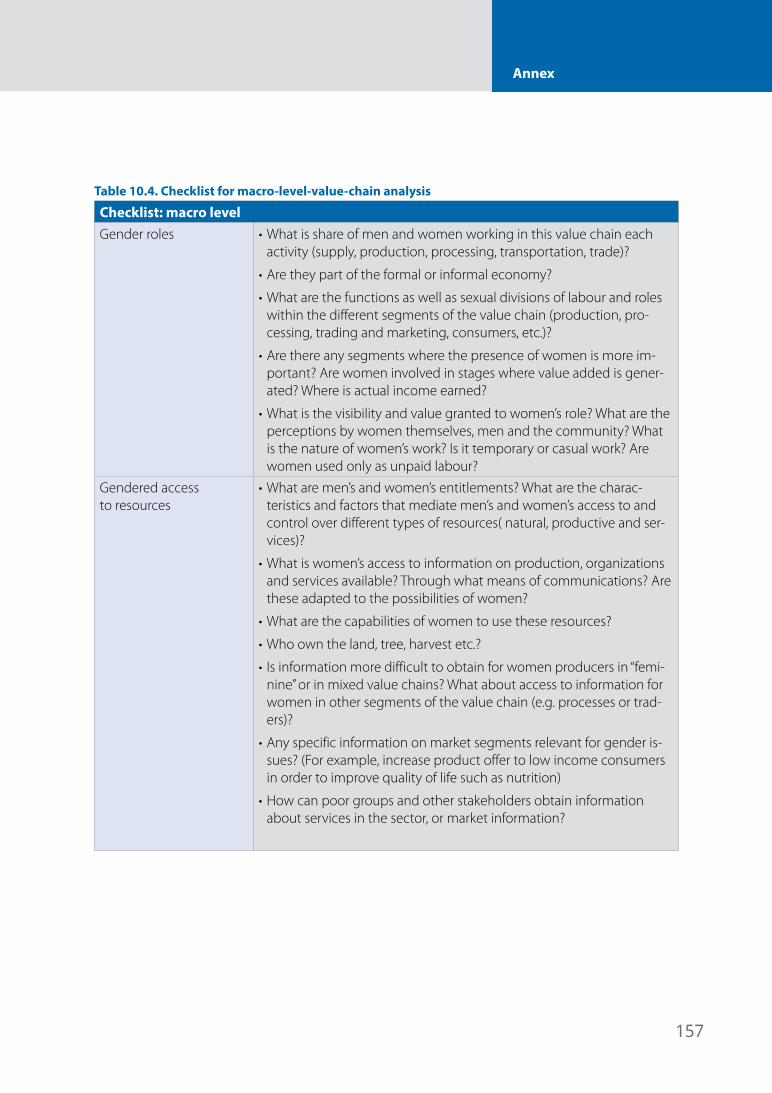
157
Annex
Table 10.4. Checklist for macro-level-value-chain analysis
Checklist: macro levelGender roles • What is share of men and women working in this value chain each
activity (supply, production, processing, transportation, trade)?
• Are they part of the formal or informal economy?
• What are the functions as well as sexual divisions of labour and roles within the different segments of the value chain (production, pro-cessing, trading and marketing, consumers, etc.)?
• Are there any segments where the presence of women is more im-portant? Are women involved in stages where value added is gener-ated? Where is actual income earned?
• What is the visibility and value granted to women’s role? What are the perceptions by women themselves, men and the community? What is the nature of women’s work? Is it temporary or casual work? Are women used only as unpaid labour?
Gendered access to resources
• What are men’s and women’s entitlements? What are the charac-teristics and factors that mediate men’s and women’s access to and control over different types of resources( natural, productive and ser-vices)?
• What is women’s access to information on production, organizations and services available? Through what means of communications? Are these adapted to the possibilities of women?
• What are the capabilities of women to use these resources?
• Who own the land, tree, harvest etc.?
• Is information more difficult to obtain for women producers in “femi-nine” or in mixed value chains? What about access to information for women in other segments of the value chain (e.g. processes or trad-ers)?
• Any specific information on market segments relevant for gender is-sues? (For example, increase product offer to low income consumers in order to improve quality of life such as nutrition)
• How can poor groups and other stakeholders obtain information about services in the sector, or market information?
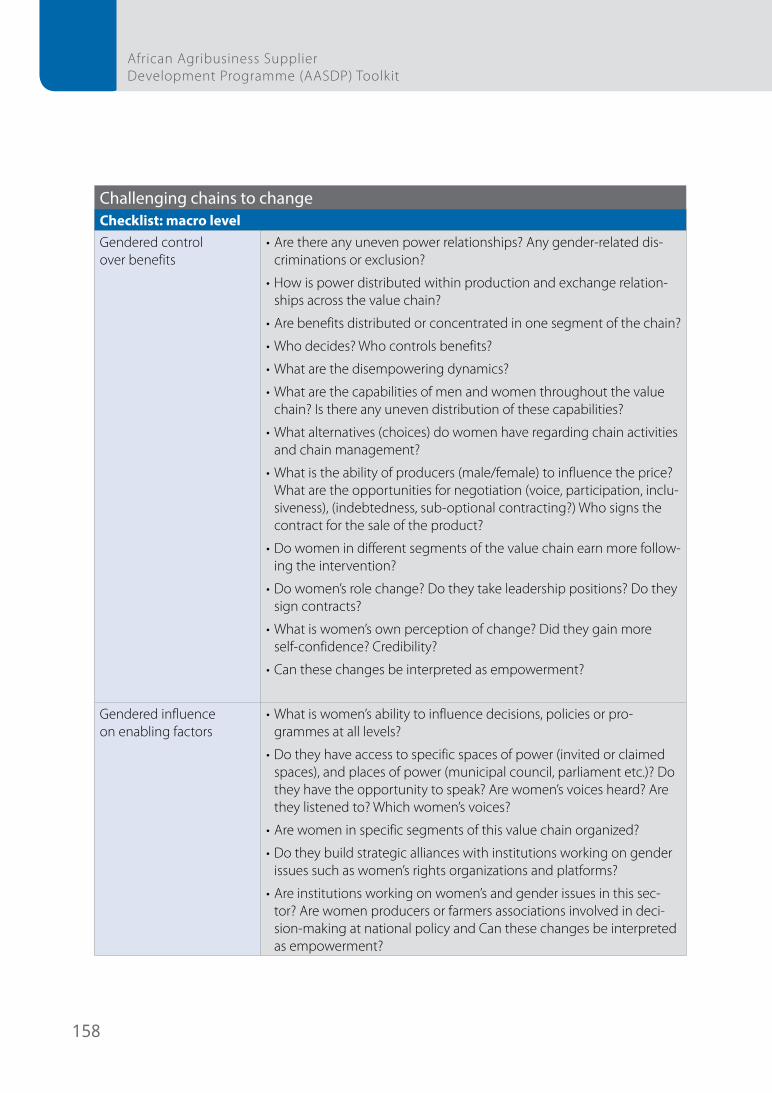
158
African Agribusiness Supplier Development Programme (AASDP) Toolkit
Challenging chains to change Checklist: macro levelGendered control over benefits
• Are there any uneven power relationships? Any gender-related dis-criminations or exclusion?
• How is power distributed within production and exchange relation-ships across the value chain?
• Are benefits distributed or concentrated in one segment of the chain?
• Who decides? Who controls benefits?
• What are the disempowering dynamics?
• What are the capabilities of men and women throughout the value chain? Is there any uneven distribution of these capabilities?
• What alternatives (choices) do women have regarding chain activities and chain management?
• What is the ability of producers (male/female) to influence the price? What are the opportunities for negotiation (voice, participation, inclu-siveness), (indebtedness, sub-optional contracting?) Who signs the contract for the sale of the product?
• Do women in different segments of the value chain earn more follow-ing the intervention?
• Do women’s role change? Do they take leadership positions? Do they sign contracts?
• What is women’s own perception of change? Did they gain more self-confidence? Credibility?
• Can these changes be interpreted as empowerment?
Gendered influence on enabling factors
• What is women’s ability to influence decisions, policies or pro-grammes at all levels?
• Do they have access to specific spaces of power (invited or claimed spaces), and places of power (municipal council, parliament etc.)? Do they have the opportunity to speak? Are women’s voices heard? Are they listened to? Which women’s voices?
• Are women in specific segments of this value chain organized?
• Do they build strategic alliances with institutions working on gender issues such as women’s rights organizations and platforms?
• Are institutions working on women’s and gender issues in this sec-tor? Are women producers or farmers associations involved in deci-sion-making at national policy and Can these changes be interpreted as empowerment?
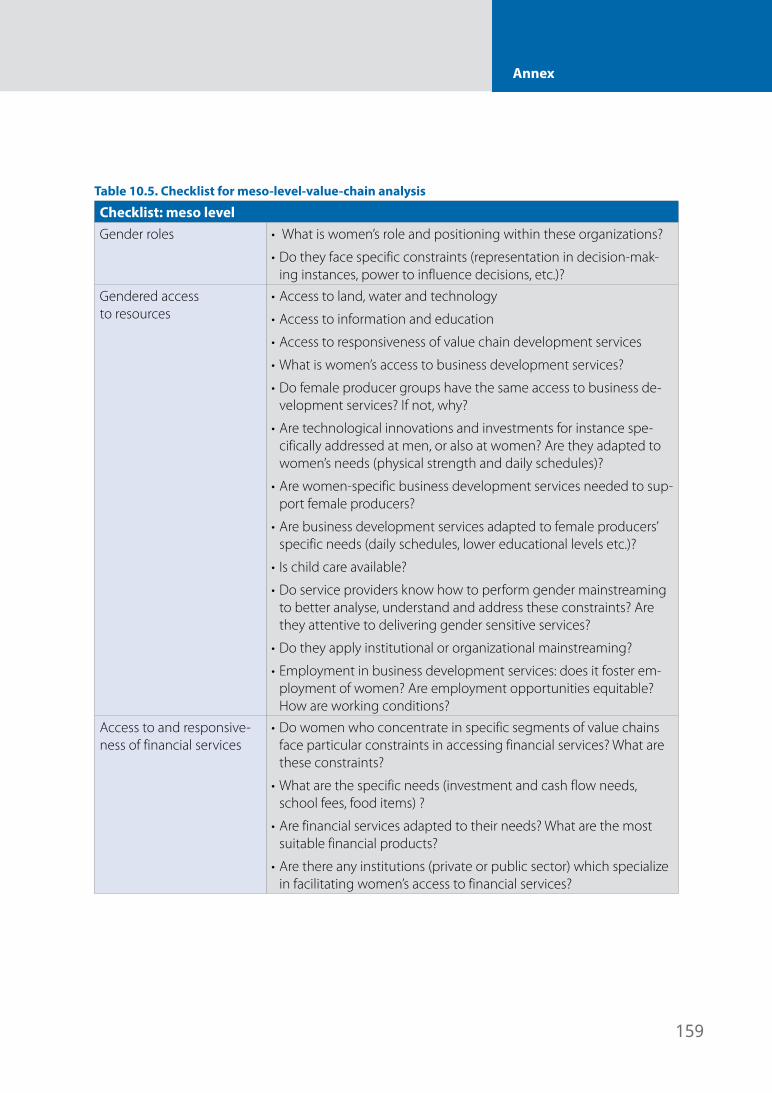
159
Annex
Table 10.5. Checklist for meso-level-value-chain analysis
Checklist: meso levelGender roles • What is women’s role and positioning within these organizations?
• Do they face specific constraints (representation in decision-mak-ing instances, power to influence decisions, etc.)?
Gendered access to resources
• Access to land, water and technology
• Access to information and education
• Access to responsiveness of value chain development services
• What is women’s access to business development services?
• Do female producer groups have the same access to business de-velopment services? If not, why?
• Are technological innovations and investments for instance spe-cifically addressed at men, or also at women? Are they adapted to women’s needs (physical strength and daily schedules)?
• Are women-specific business development services needed to sup-port female producers?
• Are business development services adapted to female producers’ specific needs (daily schedules, lower educational levels etc.)?
• Is child care available?
• Do service providers know how to perform gender mainstreaming to better analyse, understand and address these constraints? Are they attentive to delivering gender sensitive services?
• Do they apply institutional or organizational mainstreaming?
• Employment in business development services: does it foster em-ployment of women? Are employment opportunities equitable? How are working conditions?
Access to and responsive-ness of financial services
• Do women who concentrate in specific segments of value chains face particular constraints in accessing financial services? What are these constraints?
• What are the specific needs (investment and cash flow needs, school fees, food items) ?
• Are financial services adapted to their needs? What are the most suitable financial products?
• Are there any institutions (private or public sector) which specialize in facilitating women’s access to financial services?
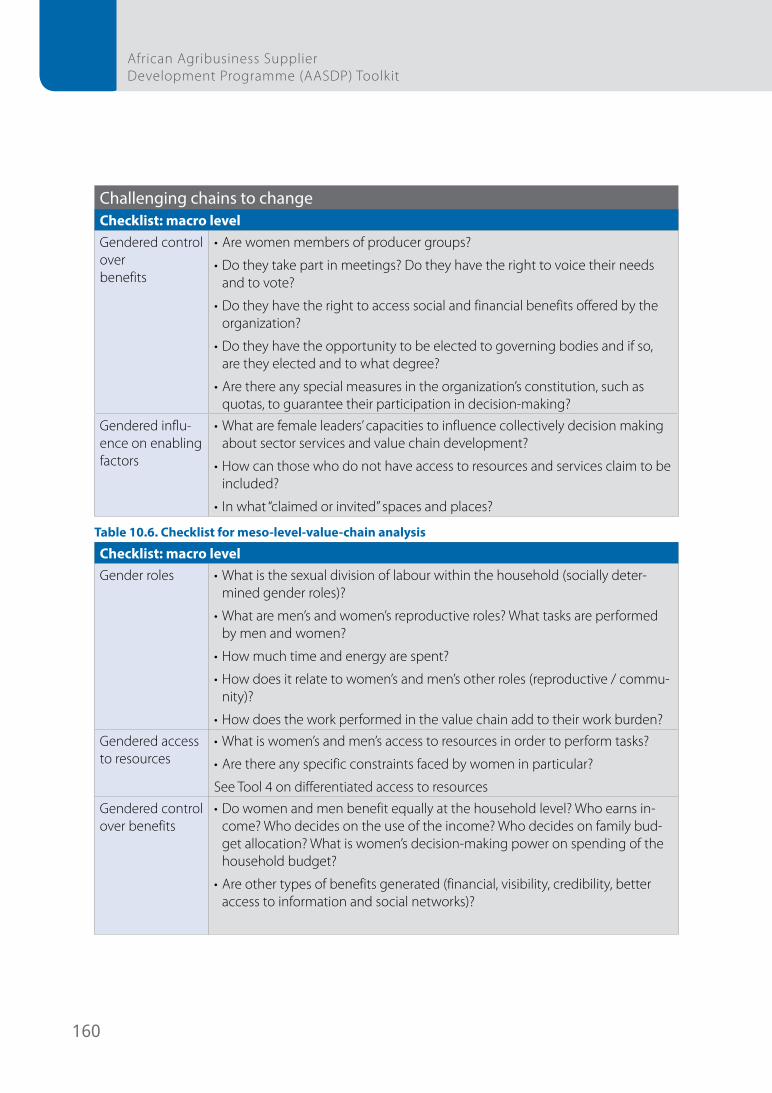
160
African Agribusiness Supplier Development Programme (AASDP) Toolkit
Challenging chains to change Checklist: macro levelGendered control overbenefits
• Are women members of producer groups?
• Do they take part in meetings? Do they have the right to voice their needs and to vote?
• Do they have the right to access social and financial benefits offered by the organization?
• Do they have the opportunity to be elected to governing bodies and if so, are they elected and to what degree?
• Are there any special measures in the organization’s constitution, such as quotas, to guarantee their participation in decision-making?
Gendered influ-ence on enabling factors
• What are female leaders’ capacities to influence collectively decision making about sector services and value chain development?
• How can those who do not have access to resources and services claim to be included?
• In what “claimed or invited” spaces and places?
Table 10.6. Checklist for meso-level-value-chain analysis
Checklist: macro levelGender roles • What is the sexual division of labour within the household (socially deter-
mined gender roles)?
• What are men’s and women’s reproductive roles? What tasks are performed by men and women?
• How much time and energy are spent?
• How does it relate to women’s and men’s other roles (reproductive / commu-nity)?
• How does the work performed in the value chain add to their work burden?Gendered access to resources
• What is women’s and men’s access to resources in order to perform tasks?
• Are there any specific constraints faced by women in particular?
See Tool 4 on differentiated access to resourcesGendered control over benefits
• Do women and men benefit equally at the household level? Who earns in-come? Who decides on the use of the income? Who decides on family bud-get allocation? What is women’s decision-making power on spending of the household budget?
• Are other types of benefits generated (financial, visibility, credibility, better access to information and social networks)?
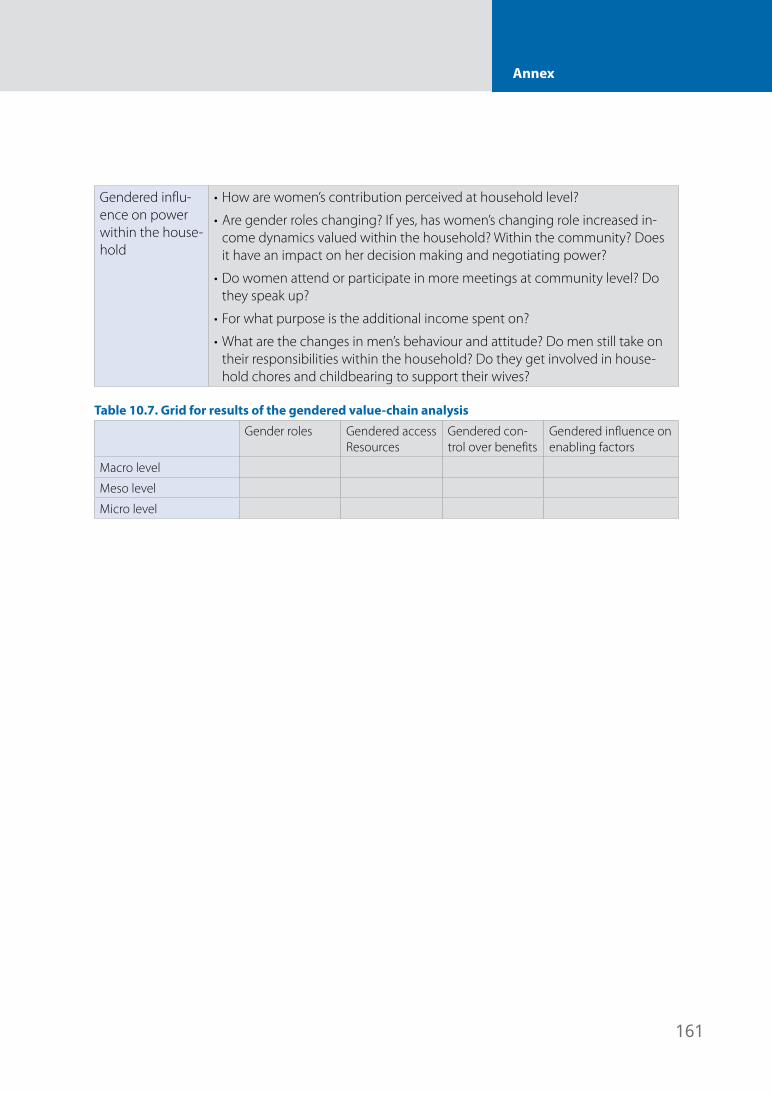
161
Annex
Gendered influ-ence on power within the house-hold
• How are women’s contribution perceived at household level?
• Are gender roles changing? If yes, has women’s changing role increased in-come dynamics valued within the household? Within the community? Does it have an impact on her decision making and negotiating power?
• Do women attend or participate in more meetings at community level? Do they speak up?
• For what purpose is the additional income spent on?
• What are the changes in men’s behaviour and attitude? Do men still take on their responsibilities within the household? Do they get involved in house-hold chores and childbearing to support their wives?
Table 10.7. Grid for results of the gendered value-chain analysis
Gender roles Gendered access Resources
Gendered con-trol over benefits
Gendered influence on enabling factors
Macro level
Meso level
Micro level
162
African Agribusiness Supplier Development Programme (AASDP) Toolkit
Annex 6. Tool for Gender Analysis (KIT 2012)Gender mapping
Gender mapping aims to make women visible when mapping a value chain. Although women participate in most agricultural value chains, they tend to be invisible. Men are assumed to be the producers, and women are seen as junior part-ners. Businesses owned by women are often con-sidered as domestic, small-scale, low-technology and informal. Such businesses are often viewed as uncompetitive and irrelevant for develop-ment, so are ignored.
Objectives• To obtain a gender-sensitive picture of the
value chain, the actors involved, their linkag-es, and the percentage of men and women in each chain segment
• To gain insight into the differences between men and women in terms of their activities, and their access to and control over resources
• To identify opportunities for women and up-grade their position
• To identify constraints and opportunities for women to participate in the value chain as well as analyse differences in power in the val-ue chain governance
Use by
Practitioners in participative workshops with male and female value chain actors.
Methods
Step 1. Build a hypothesis: Make a hypothesis on how women participate in the value chain and adjust your mapping route. Although the general perception might be that women do not participate in certain processes or value chain, the key to a good gender analysis is to go to the field with an open mind. The gender hypothesis should be based on the following questions:
• Where are the women in this value chain? What do they do?
• What and how do you need to map to con-vince stakeholders and decision-makers of the importance and opportunities of women in value chain upgrading?
This gender hypothesis will help you to design the mapping route, looking for the right tools to reveal the gender bias, identifying key stakehold-ers for interviews or workshop.
Step 2. Actor mapping. Make a visual presen-tation of the value chain, visualizing the main actors (men and women). Invite or interview women leaders and small-scale informal women businesses in order to make an unbiased picture of the value chain. Draw a diagram to reflect this (Figure 10.3).
Think about:
• What are the main processes involved in the chain?
• What are the main actors in the chain? Try to differentiate actors according to different ty-pologies.
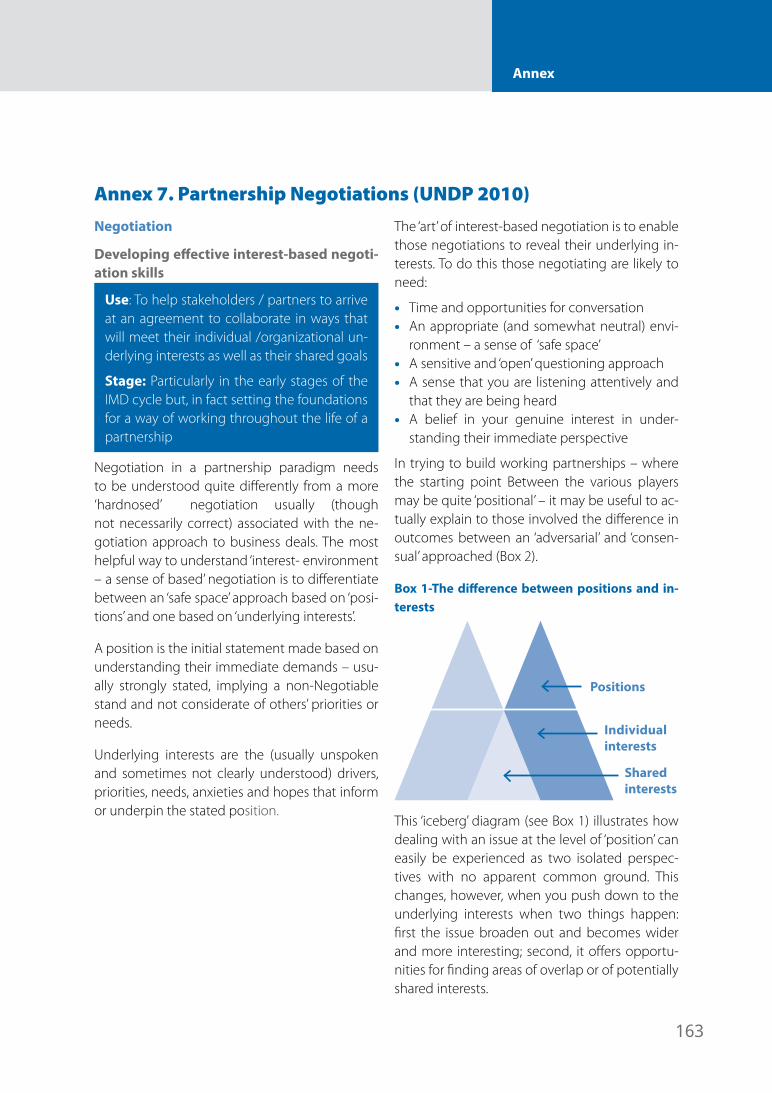
163
Annex
Annex 7. Partnership Negotiations (UNDP 2010)Negotiation
Developing effective interest-based negoti-ation skills
Use: To help stakeholders / partners to arrive at an agreement to collaborate in ways that will meet their individual /organizational un-derlying interests as well as their shared goals
Stage: Particularly in the early stages of the IMD cycle but, in fact setting the foundations for a way of working throughout the life of a partnership
Negotiation in a partnership paradigm needs to be understood quite differently from a more ‘hardnosed’ negotiation usually (though not necessarily correct) associated with the ne-gotiation approach to business deals. The most helpful way to understand ‘interest- environment – a sense of based’ negotiation is to differentiate between an ‘safe space’ approach based on ‘posi-tions’ and one based on ‘underlying interests’.
A position is the initial statement made based on understanding their immediate demands – usu-ally strongly stated, implying a non-Negotiable stand and not considerate of others’ priorities or needs.
Underlying interests are the (usually unspoken and sometimes not clearly understood) drivers, priorities, needs, anxieties and hopes that inform or underpin the stated position.
The ‘art’ of interest-based negotiation is to enable those negotiations to reveal their underlying in-terests. To do this those negotiating are likely to need:
• Time and opportunities for conversation• An appropriate (and somewhat neutral) envi-
ronment – a sense of ‘safe space’• A sensitive and ‘open’ questioning approach• A sense that you are listening attentively and
that they are being heard• A belief in your genuine interest in under-
standing their immediate perspective
In trying to build working partnerships – where the starting point Between the various players may be quite ‘positional’ – it may be useful to ac-tually explain to those involved the difference in outcomes between an ‘adversarial’ and ‘consen-sual’ approached (Box 2).
Box 1-The difference between positions and in-terests
Positions
Individual interests
Shared interests
This ‘iceberg’ diagram (see Box 1) illustrates how dealing with an issue at the level of ‘position’ can easily be experienced as two isolated perspec-tives with no apparent common ground. This changes, however, when you push down to the underlying interests when two things happen: first the issue broaden out and becomes wider and more interesting; second, it offers opportu-nities for finding areas of overlap or of potentially shared interests.
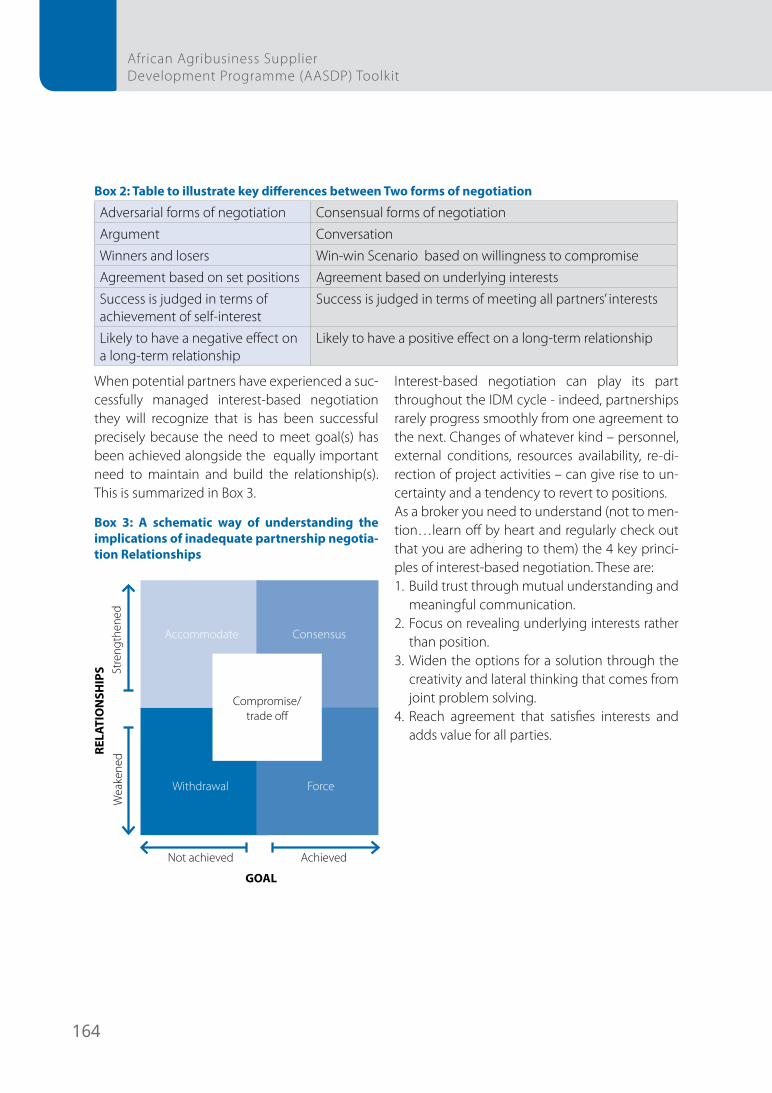
164
African Agribusiness Supplier Development Programme (AASDP) Toolkit
Box 2: Table to illustrate key differences between Two forms of negotiation
Adversarial forms of negotiation Consensual forms of negotiationArgument ConversationWinners and losers Win-win Scenario based on willingness to compromiseAgreement based on set positions Agreement based on underlying interestsSuccess is judged in terms of achievement of self-interest
Success is judged in terms of meeting all partners’ interests
Likely to have a negative effect on a long-term relationship
Likely to have a positive effect on a long-term relationship
When potential partners have experienced a suc-cessfully managed interest-based negotiation they will recognize that is has been successful precisely because the need to meet goal(s) has been achieved alongside the equally important need to maintain and build the relationship(s). This is summarized in Box 3.
Box 3: A schematic way of understanding the implications of inadequate partnership negotia-tion Relationships
Accommodate Consensus
Withdrawal Force
Compromise/trade off
Stre
ngth
ened
Wea
kene
d
Not achieved
GOAL
RELA
TIO
NSH
IPS
Achieved
Interest-based negotiation can play its part throughout the IDM cycle - indeed, partnerships rarely progress smoothly from one agreement to the next. Changes of whatever kind – personnel, external conditions, resources availability, re-di-rection of project activities – can give rise to un-certainty and a tendency to revert to positions.As a broker you need to understand (not to men-tion…learn off by heart and regularly check out that you are adhering to them) the 4 key princi-ples of interest-based negotiation. These are:1. Build trust through mutual understanding and
meaningful communication.2. Focus on revealing underlying interests rather
than position.3. Widen the options for a solution through the
creativity and lateral thinking that comes from joint problem solving.
4. Reach agreement that satisfies interests and adds value for all parties.
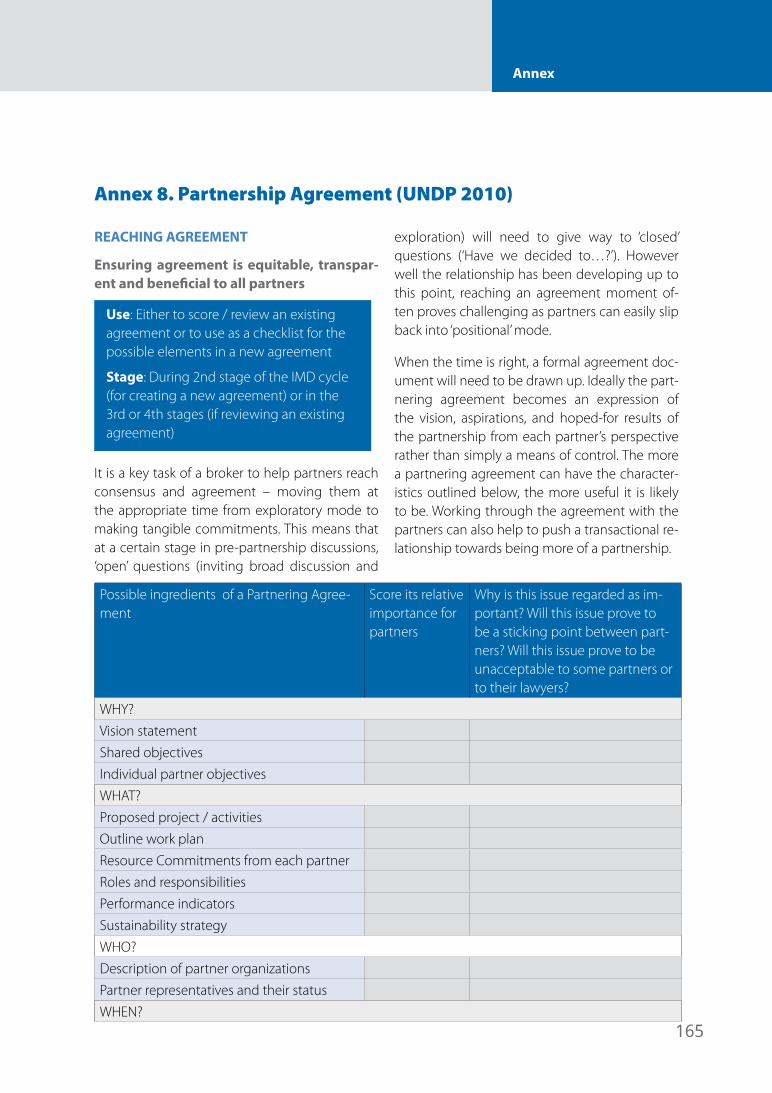
165
Annex
Annex 8. Partnership Agreement (UNDP 2010)
REACHING AGREEMENT
Ensuring agreement is equitable, transpar-ent and beneficial to all partners
Use: Either to score / review an existing agreement or to use as a checklist for the possible elements in a new agreement
Stage: During 2nd stage of the IMD cycle (for creating a new agreement) or in the 3rd or 4th stages (if reviewing an existing agreement)
It is a key task of a broker to help partners reach consensus and agreement – moving them at the appropriate time from exploratory mode to making tangible commitments. This means that at a certain stage in pre-partnership discussions, ‘open’ questions (inviting broad discussion and
exploration) will need to give way to ‘closed’ questions (‘Have we decided to…?’). However well the relationship has been developing up to this point, reaching an agreement moment of-ten proves challenging as partners can easily slip back into ‘positional’ mode.
When the time is right, a formal agreement doc-ument will need to be drawn up. Ideally the part-nering agreement becomes an expression of the vision, aspirations, and hoped-for results of the partnership from each partner’s perspective rather than simply a means of control. The more a partnering agreement can have the character-istics outlined below, the more useful it is likely to be. Working through the agreement with the partners can also help to push a transactional re-lationship towards being more of a partnership.
Possible ingredients of a Partnering Agree-ment
Score its relative importance for partners
Why is this issue regarded as im-portant? Will this issue prove to be a sticking point between part-ners? Will this issue prove to be unacceptable to some partners or to their lawyers?
WHY?Vision statementShared objectivesIndividual partner objectivesWHAT?Proposed project / activitiesOutline work planResource Commitments from each partnerRoles and responsibilitiesPerformance indicatorsSustainability strategyWHO?Description of partner organizationsPartner representatives and their statusWHEN?
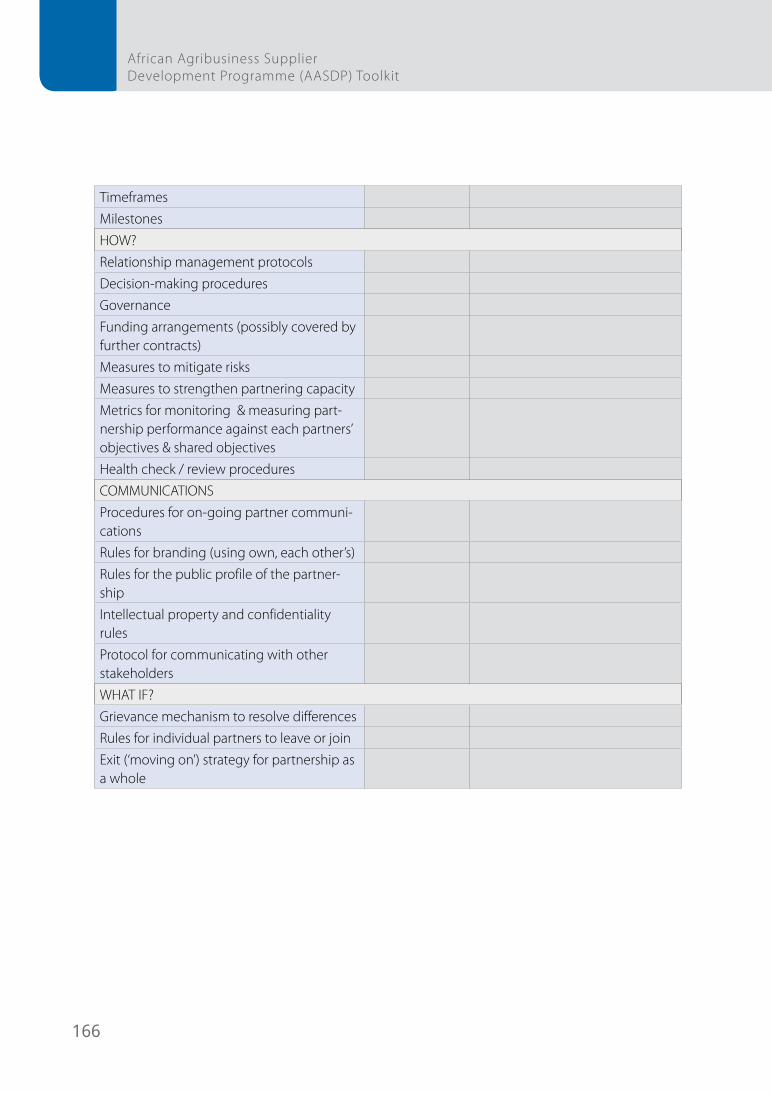
166
African Agribusiness Supplier Development Programme (AASDP) Toolkit
TimeframesMilestonesHOW?Relationship management protocolsDecision-making proceduresGovernanceFunding arrangements (possibly covered by further contracts)Measures to mitigate risksMeasures to strengthen partnering capacityMetrics for monitoring & measuring part-nership performance against each partners’ objectives & shared objectivesHealth check / review proceduresCOMMUNICATIONSProcedures for on-going partner communi-cationsRules for branding (using own, each other’s)Rules for the public profile of the partner-shipIntellectual property and confidentiality rulesProtocol for communicating with other stakeholdersWHAT IF?Grievance mechanism to resolve differencesRules for individual partners to leave or joinExit (‘moving on’) strategy for partnership as a whole
167
Annex
Annex 9. Partnership Management (UNDP 2010)PROCESS MANAGEMENT
Ensuring partnership runs smoothly
Use: To help brokers move into a relatively ‘hands off’ process management / supportPhase: Phases 2 and 3 in the IMD / GSB cy-cle
BACKGROUND
In phases 2 and 3 of the cycle, the broker’s role changes – moving more towards process facilita-tion and partner support and away from a more directive role.
It is really important that broker’s make this shift and work with partners to understand the changes in role where they – the partners – take increasing responsibility for managing the part-nering process either directly as a group or by agreed handover to a subgroup or one or other partner in the coordinating role.
Failure to do this successfully risks the partner-ship becoming increasingly dependent on the broker and possibly becoming dysfunctional de-spite early promise.
Brokers at this stage do not simply ‘opt out’ or withdraw, rather they work with partners to en-sure management arrangements are agreed, in place and working well. They work towards set-ting up and implementing systems that ensure smooth functioning without over-reliance on just one or two individuals.
POSSIBLE GROUND RULES / PROTOCOLS / PROCEDURES /ARRANGEMENTS18
An obvious starting point for creating workable systems is for the broker to help to create some ‘ground rules’ for the partnership – ensuring that these are developed and agreed with partners at an early stage of the IMD cycle in order to:
• Manage logistics efficiently• Interact constructively by promoting ‘good
partnering behaviour’• Communicate appropriately inside each of the
partner organizations, within the partnership as a whole and beyond the partnership
• Make decisions equitably• Problem-solve effectively• Resolve conflicts /grievances fairly• Navigate entrances and exits to / from the
partnership smoothly• Move on easily when the time is right
GOVERNANCE ARRANGEMENTS
Governance arrangements should be discussed, pre-agreed and written into the collaboration agreement (see Annex 8). Considerations should include:
• Who has authority for what?• Who ‘owns’ what (for example, products from
any project or intellectual property)?• What decisions can be taken by one person,
organization or subgroup on behalf of the partnership?
• What decisions can only be taken by represen-tation from the whole partnership group?
• Who is entitled to represent / speak for the partnership, and to whom?
• What systems are in place to cope with dis-agreement or conflict between the partners?
• What ‘grievance procedures’ are in place in the case of relationship breakdown?
In addition to these, there may also be other governance issues to do with specific partners or specific issues to do with this particular part-nership – anything, for example, which might involve actual or perceived conflicts of interest.
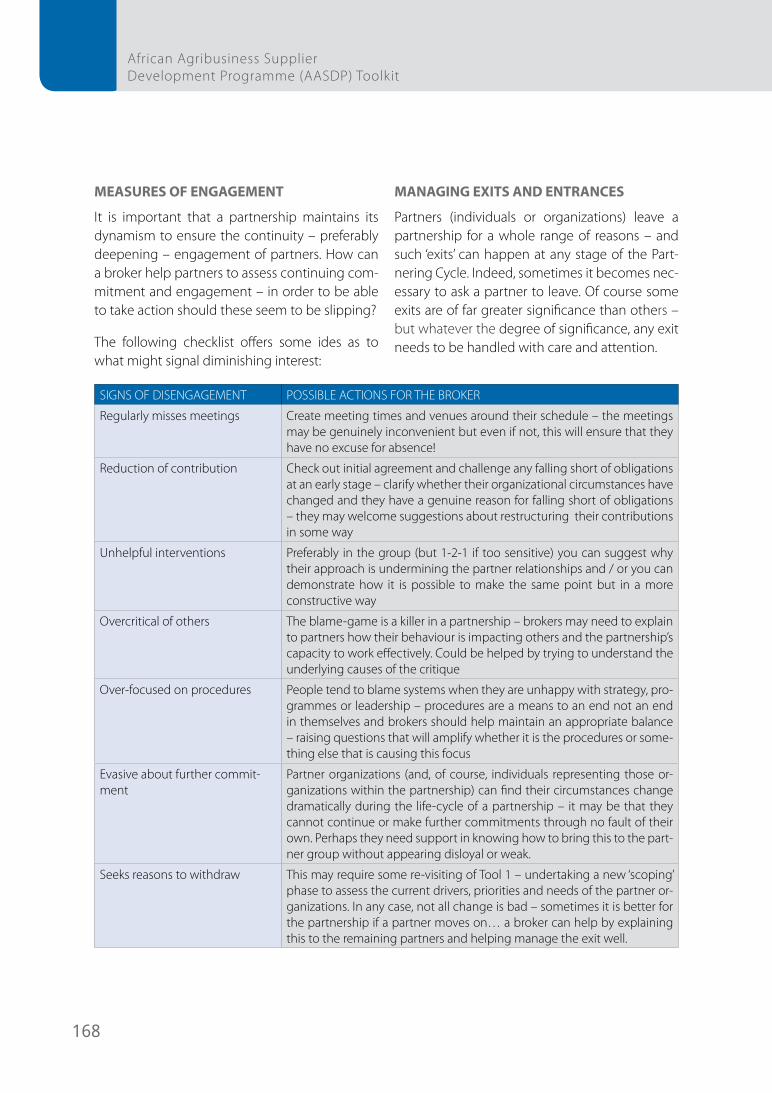
168
African Agribusiness Supplier Development Programme (AASDP) Toolkit
MEASURES OF ENGAGEMENT
It is important that a partnership maintains its dynamism to ensure the continuity – preferably deepening – engagement of partners. How can a broker help partners to assess continuing com-mitment and engagement – in order to be able to take action should these seem to be slipping?
The following checklist offers some ides as to what might signal diminishing interest:
SIGNS OF DISENGAGEMENT POSSIBLE ACTIONS FOR THE BROKER
Regularly misses meetings Create meeting times and venues around their schedule – the meetings may be genuinely inconvenient but even if not, this will ensure that they have no excuse for absence!
Reduction of contribution Check out initial agreement and challenge any falling short of obligations at an early stage – clarify whether their organizational circumstances have changed and they have a genuine reason for falling short of obligations – they may welcome suggestions about restructuring their contributions in some way
Unhelpful interventions Preferably in the group (but 1-2-1 if too sensitive) you can suggest why their approach is undermining the partner relationships and / or you can demonstrate how it is possible to make the same point but in a more constructive way
Overcritical of others The blame-game is a killer in a partnership – brokers may need to explain to partners how their behaviour is impacting others and the partnership’s capacity to work effectively. Could be helped by trying to understand the underlying causes of the critique
Over-focused on procedures People tend to blame systems when they are unhappy with strategy, pro-grammes or leadership – procedures are a means to an end not an end in themselves and brokers should help maintain an appropriate balance – raising questions that will amplify whether it is the procedures or some-thing else that is causing this focus
Evasive about further commit-ment
Partner organizations (and, of course, individuals representing those or-ganizations within the partnership) can find their circumstances change dramatically during the life-cycle of a partnership – it may be that they cannot continue or make further commitments through no fault of their own. Perhaps they need support in knowing how to bring this to the part-ner group without appearing disloyal or weak.
Seeks reasons to withdraw This may require some re-visiting of Tool 1 – undertaking a new ‘scoping’ phase to assess the current drivers, priorities and needs of the partner or-ganizations. In any case, not all change is bad – sometimes it is better for the partnership if a partner moves on… a broker can help by explaining this to the remaining partners and helping manage the exit well.
MANAGING EXITS AND ENTRANCES
Partners (individuals or organizations) leave a partnership for a whole range of reasons – and such ‘exits’ can happen at any stage of the Part-nering Cycle. Indeed, sometimes it becomes nec-essary to ask a partner to leave. Of course some exits are of far greater significance than others – but whatever the degree of significance, any exit needs to be handled with care and attention.
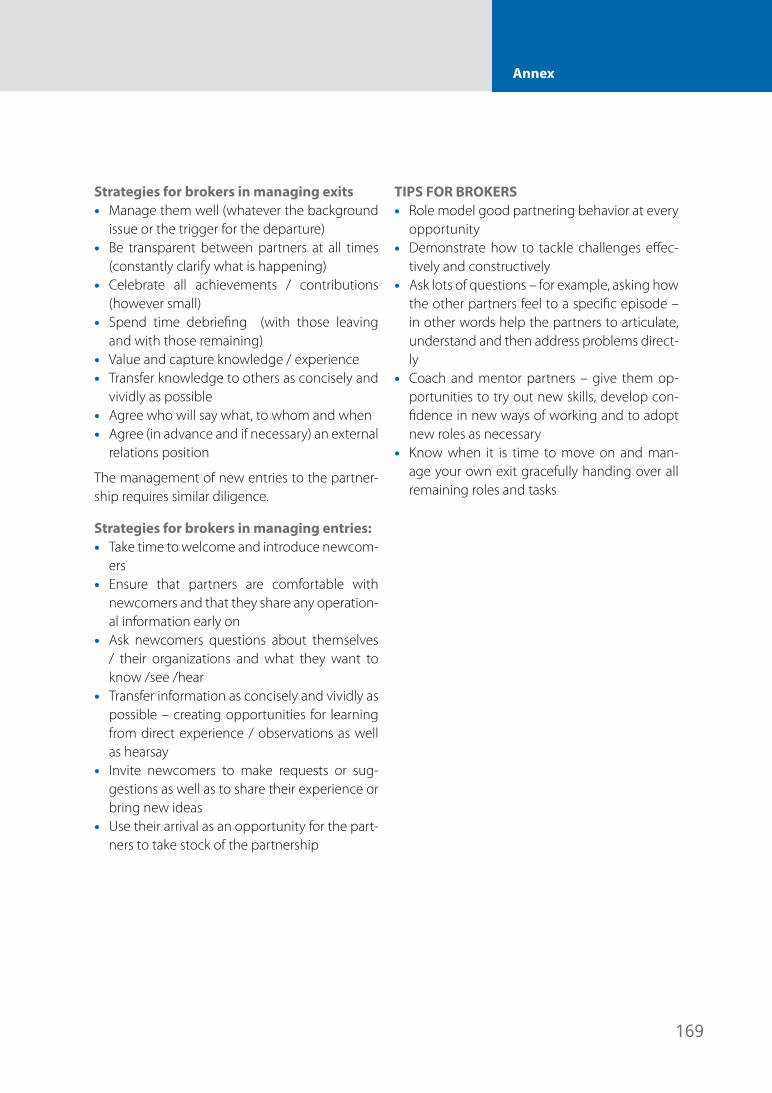
169
Annex
Strategies for brokers in managing exits• Manage them well (whatever the background
issue or the trigger for the departure)• Be transparent between partners at all times
(constantly clarify what is happening)• Celebrate all achievements / contributions
(however small)• Spend time debriefing (with those leaving
and with those remaining)• Value and capture knowledge / experience• Transfer knowledge to others as concisely and
vividly as possible• Agree who will say what, to whom and when• Agree (in advance and if necessary) an external
relations position
The management of new entries to the partner-ship requires similar diligence.
Strategies for brokers in managing entries:• Take time to welcome and introduce newcom-
ers• Ensure that partners are comfortable with
newcomers and that they share any operation-al information early on
• Ask newcomers questions about themselves / their organizations and what they want to know /see /hear
• Transfer information as concisely and vividly as possible – creating opportunities for learning from direct experience / observations as well as hearsay
• Invite newcomers to make requests or sug-gestions as well as to share their experience or bring new ideas
• Use their arrival as an opportunity for the part-ners to take stock of the partnership
TIPS FOR BROKERS• Role model good partnering behavior at every
opportunity• Demonstrate how to tackle challenges effec-
tively and constructively• Ask lots of questions – for example, asking how
the other partners feel to a specific episode – in other words help the partners to articulate, understand and then address problems direct-ly
• Coach and mentor partners – give them op-portunities to try out new skills, develop con-fidence in new ways of working and to adopt new roles as necessary
• Know when it is time to move on and man-age your own exit gracefully handing over all remaining roles and tasks
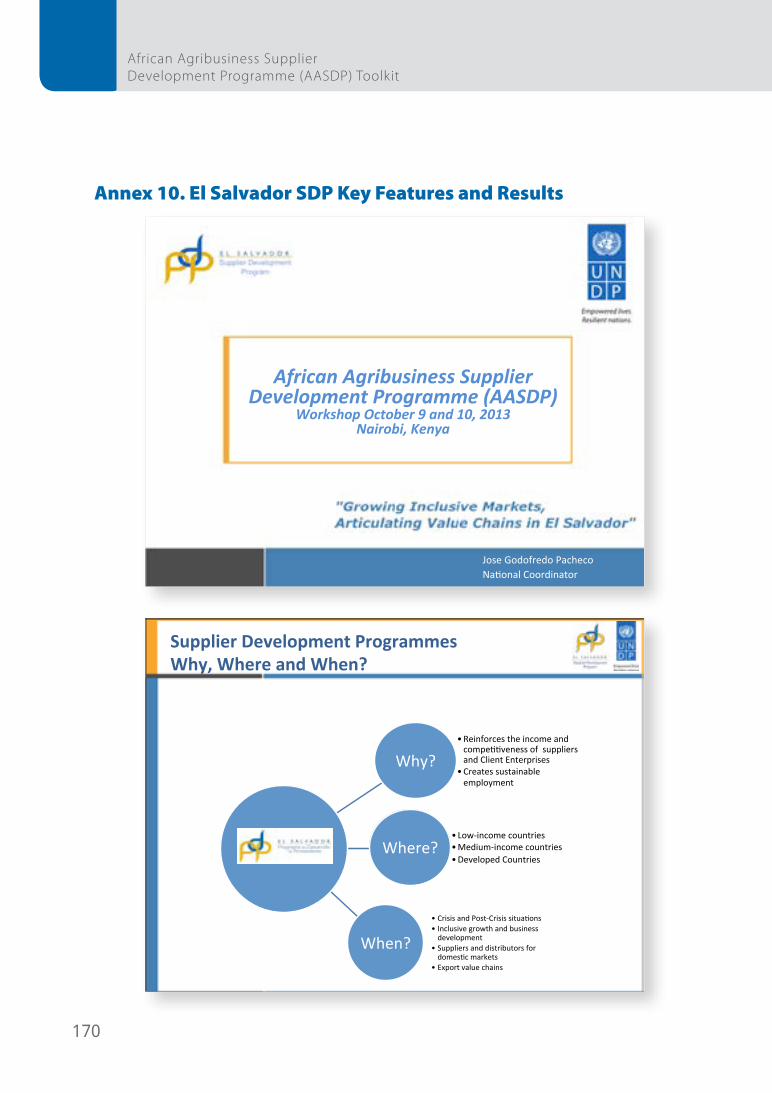
170
African Agribusiness Supplier Development Programme (AASDP) Toolkit
Annex 10. El Salvador SDP Key Features and Results
Jose Godofredo Pacheco Na/onal Coordinator
African Agribusiness Supplier Development Programme (AASDP)
Workshop October 9 and 10, 2013 Nairobi, Kenya
Why? • Reinforces the income and compe//veness of suppliers and Client Enterprises
• Creates sustainable employment
Where? • Low-‐income countries • Medium-‐income countries • Developed Countries
When?
• Crisis and Post-‐Crisis situa/ons • Inclusive growth and business development
• Suppliers and distributors for domes/c markets
• Export value chains
Supplier Development Programmes Why, Where and When?
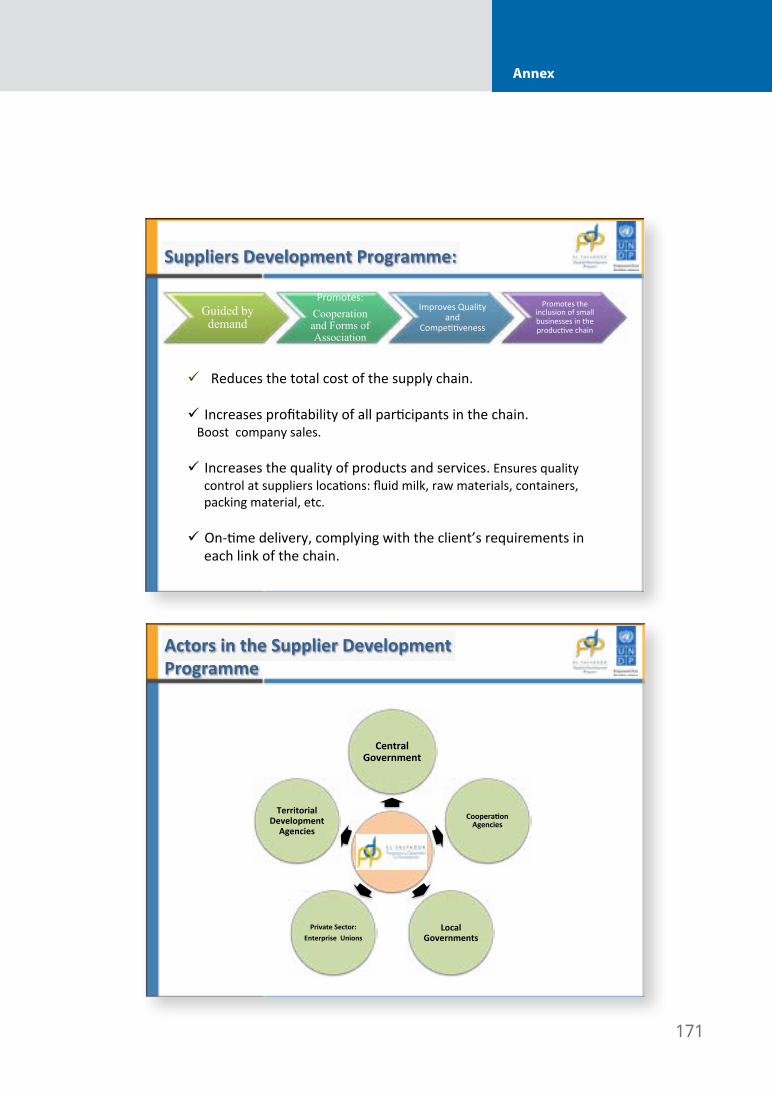
171
Annex
Guided by demand
Promotes: Cooperation and Forms of Association
Improves Quality and
Compe//veness
Promotes the inclusion of small businesses in the produc/ve chain
Suppliers Development Programme:
ü Reduces the total cost of the supply chain. ü Increases profitability of all par/cipants in the chain. Boost company sales. ü Increases the quality of products and services. Ensures quality
control at suppliers loca/ons: fluid milk, raw materials, containers, packing material, etc.
ü On-‐/me delivery, complying with the client’s requirements in
each link of the chain.
Actors in the Supplier Development Programme
Central Government
Coopera>on Agencies
Local Governments
Private Sector: Enterprise Unions
Territorial Development
Agencies
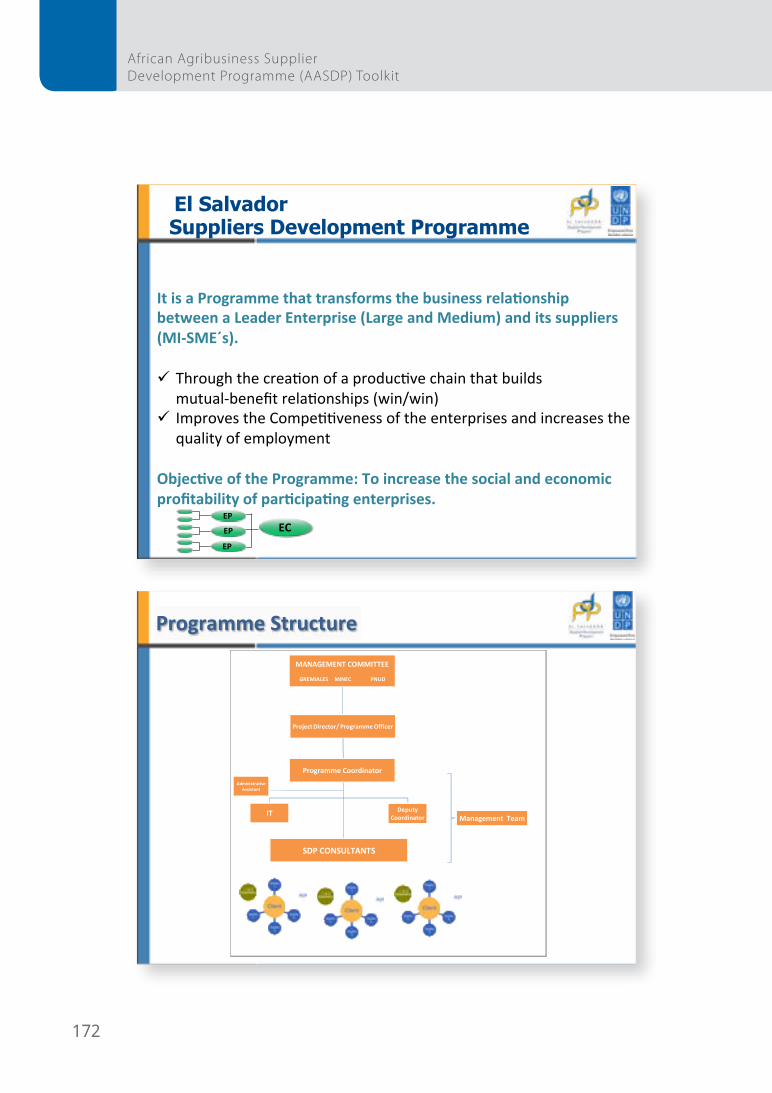
172
African Agribusiness Supplier Development Programme (AASDP) Toolkit
El Salvador Suppliers Development Programme
It is a Programme that transforms the business rela>onship between a Leader Enterprise (Large and Medium) and its suppliers (MI-‐SME´s). ü Through the crea/on of a produc/ve chain that builds
mutual-‐benefit rela/onships (win/win) ü Improves the Compe//veness of the enterprises and increases the
quality of employment
Objec>ve of the Programme: To increase the social and economic profitability of par>cipa>ng enterprises.
EP
EP
EP EC
Programme Structure
MANAGEMENT COMMITTEE
GREMIALES MINEC PNUD
ProjectDirector/ Programme Officer
Programme Coordinator
IT DeputyCoordinator
SDP CONSULTANTS
AdministrativeAssistant
Management Team
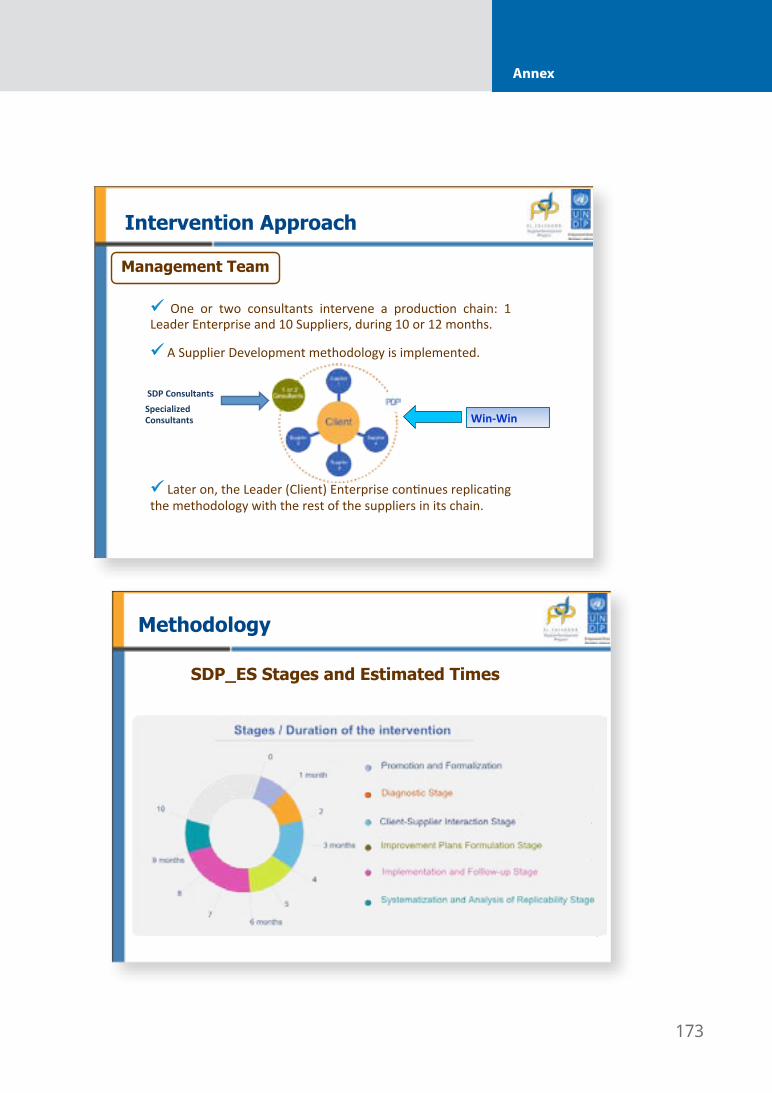
173
Annex
ü One or two consultants intervene a produc/on chain: 1 Leader Enterprise and 10 Suppliers, during 10 or 12 months.
ü A Supplier Development methodology is implemented.
ü Later on, the Leader (Client) Enterprise con/nues replica/ng the methodology with the rest of the suppliers in its chain.
Intervention Approach
Win-‐Win
SDP Consultants Specialized Consultants
Management Team
SDP_ES Stages and Estimated Times
.
Methodology
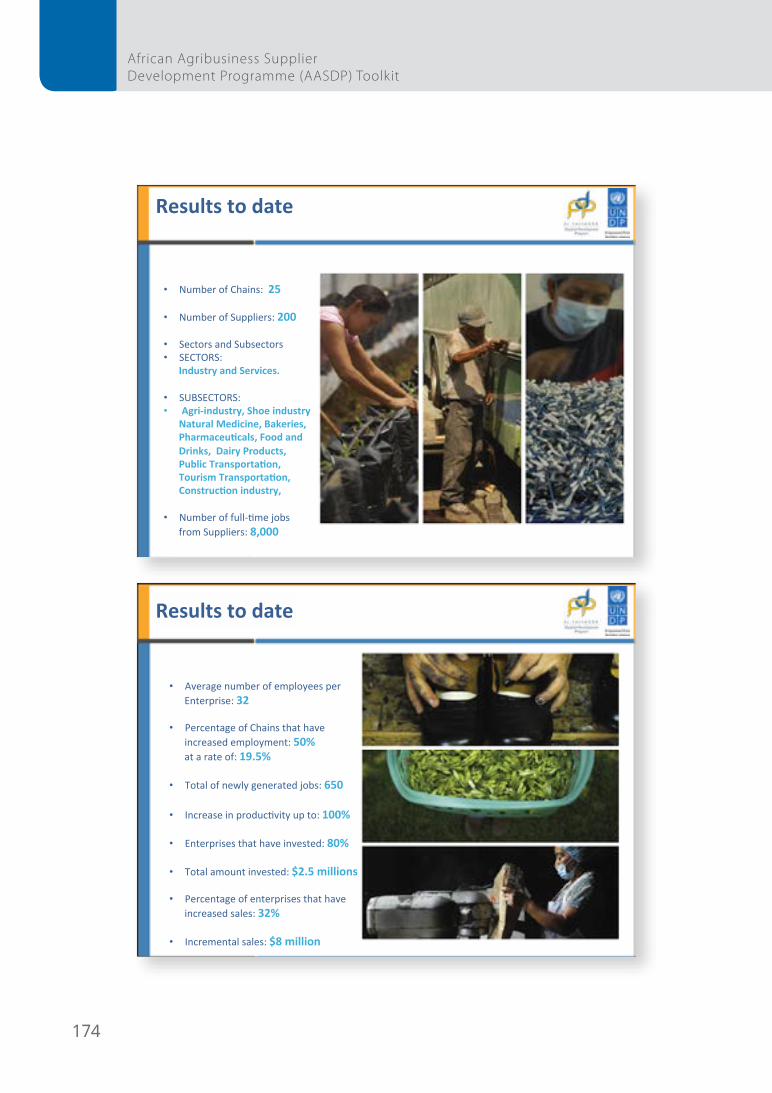
174
African Agribusiness Supplier Development Programme (AASDP) Toolkit
Results to date
• Number of Chains: 25
• Number of Suppliers: 200
• Sectors and Subsectors • SECTORS:
Industry and Services.
• SUBSECTORS: • Agri-‐industry, Shoe industry
Natural Medicine, Bakeries, Pharmaceu>cals, Food and Drinks, Dairy Products, Public Transporta>on, Tourism Transporta>on, Construc>on industry,
• Number of full-‐/me jobs from Suppliers: 8,000
Results to date
• Average number of employees per Enterprise: 32
• Percentage of Chains that have increased employment: 50% at a rate of: 19.5%
• Total of newly generated jobs: 650 • Increase in produc/vity up to: 100%
• Enterprises that have invested: 80%
• Total amount invested: $2.5 millions
• Percentage of enterprises that have increased sales: 32%
• Incremental sales: $8 million
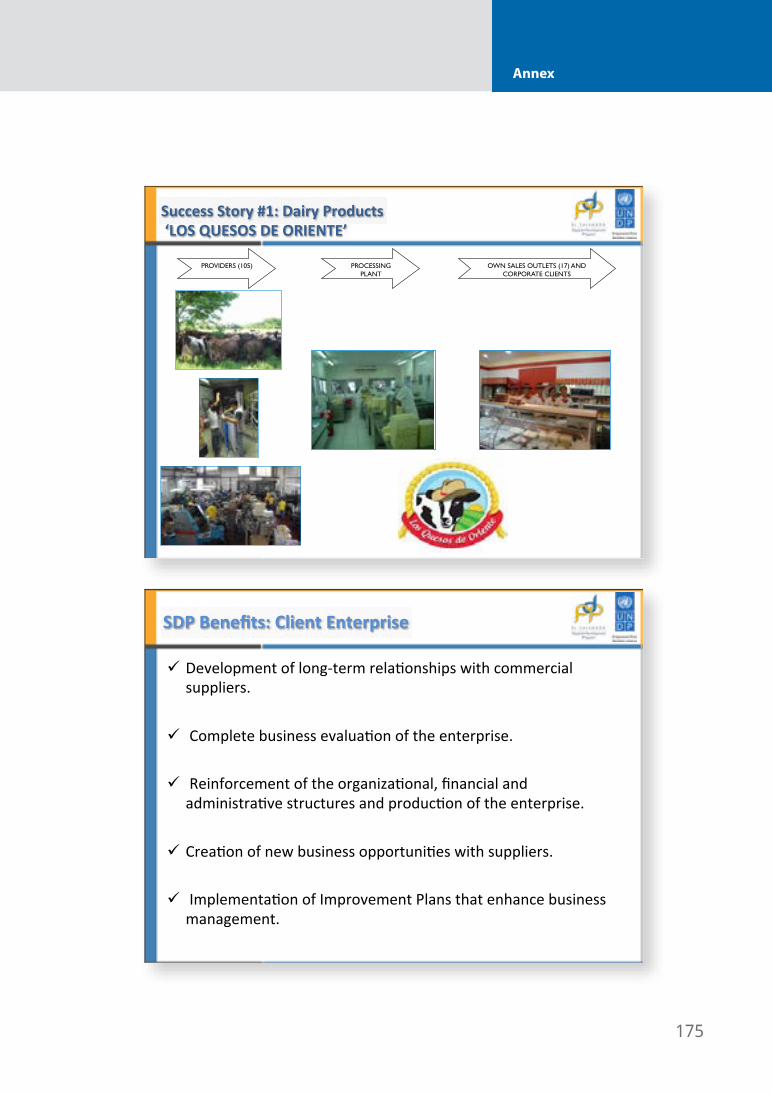
175
Annex
Success Story #1: Dairy Products ‘LOS QUESOS DE ORIENTE’
PROVIDERS (105) PROCESSING PLANT
OWN SALES OUTLETS (17) AND CORPORATE CLIENTS
SDP Benefits: Client Enterprise
ü Development of long-‐term rela/onships with commercial suppliers.
ü Complete business evalua/on of the enterprise. ü Reinforcement of the organiza/onal, financial and
administra/ve structures and produc/on of the enterprise.
ü Crea/on of new business opportuni/es with suppliers.
ü Implementa/on of Improvement Plans that enhance business management.
176
African Agribusiness Supplier Development Programme (AASDP) Toolkit
ü Implementa/on of Industrial Safety and Occupa/onal Hygiene regula/ons.
ü Study of Times and Movements.
ü Improvement of Human Rela/ons: Enhances the Organiza/onal Environment and Leadership.
ü Direct connec/ons with support ins/tu/ons.
ü Implementa/on of GMP-‐HACCP at processing plant.
SDP Benefits: Leader Enterprise
ü Crea/on of new business opportuni/es and reinforcement of
the commercial rela/onship with the Leader Enterprise.
ü Marke/ng plans, corporate image development, crea/on of a
sales force.
ü Implementa/on of Industrial Safety and Occupa/onal Hygiene regula/ons.
ü Strategic vision, reinforcement of the organiza/onal and
administra/ve structures, cost reduc/on.
SDP Benefits : Suppliers
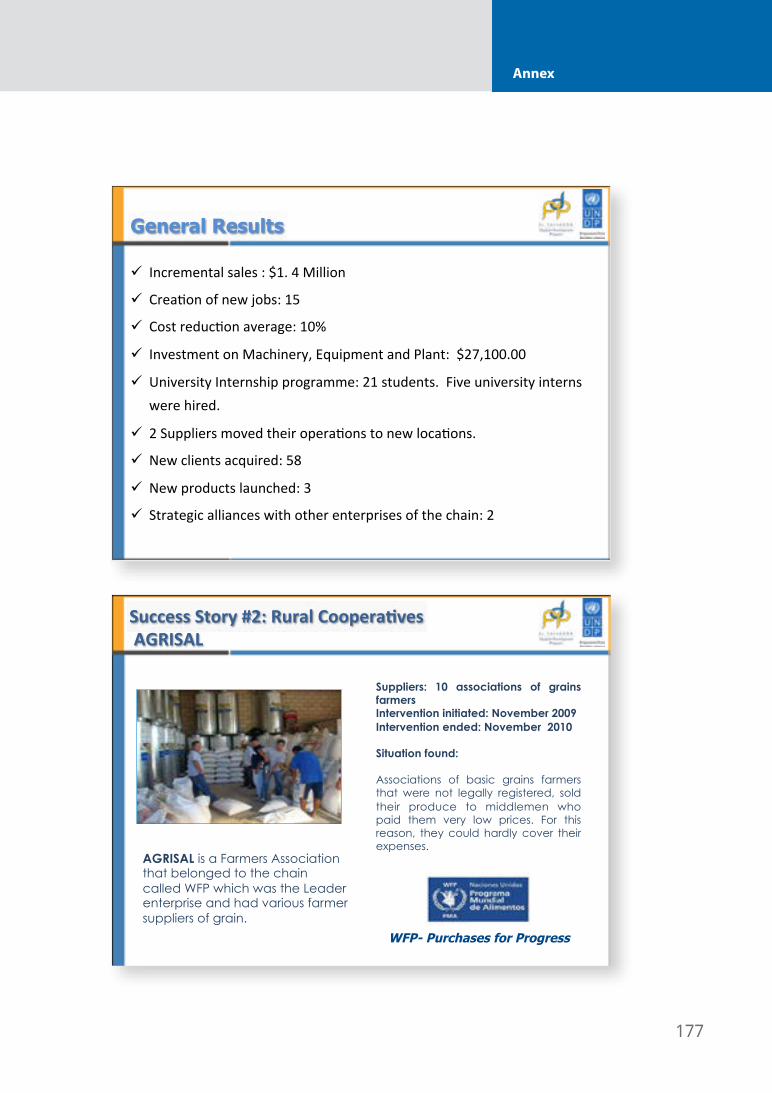
177
Annex
ü Incremental sales : $1. 4 Million
ü Crea/on of new jobs: 15 ü Cost reduc/on average: 10% ü Investment on Machinery, Equipment and Plant: $27,100.00
ü University Internship programme: 21 students. Five university interns were hired.
ü 2 Suppliers moved their opera/ons to new loca/ons.
ü New clients acquired: 58 ü New products launched: 3 ü Strategic alliances with other enterprises of the chain: 2
General Results
WFP- Purchases for Progress
Suppliers: 10 associations of grains farmers Intervention initiated: November 2009 Intervention ended: November 2010 Situation found: Associations of basic grains farmers that were not legally registered, sold their produce to middlemen who paid them very low prices. For this reason, they could hardly cover their expenses.
AGRISAL is a Farmers Association that belonged to the chain called WFP which was the Leader enterprise and had various farmer suppliers of grain.
Success Story #2: Rural Coopera>ves AGRISAL
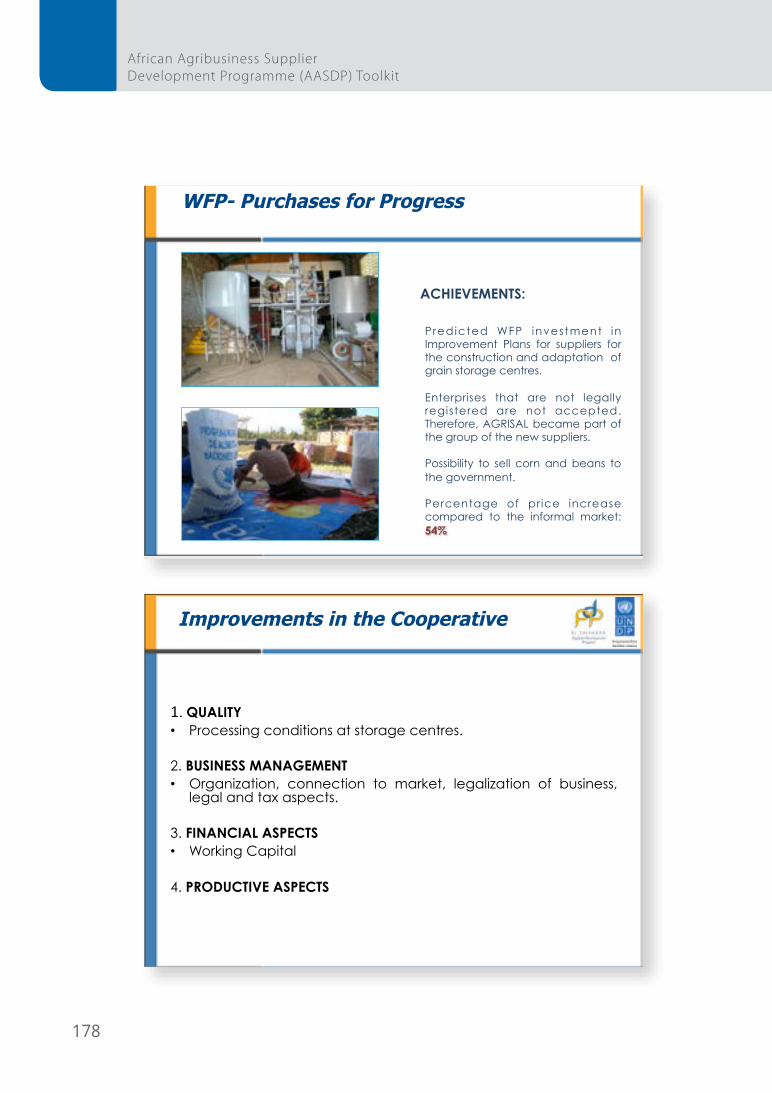
178
African Agribusiness Supplier Development Programme (AASDP) Toolkit
WFP- Purchases for Progress
ACHIEVEMENTS:
Predicted WFP investment in Improvement Plans for suppliers for the construction and adaptation of grain storage centres. Enterprises that are not legally registered are not accepted. Therefore, AGRISAL became part of the group of the new suppliers. Possibility to sell corn and beans to the government. Percentage of price increase compared to the informal market: 54%
1. QUALITY • Processing conditions at storage centres.
2. BUSINESS MANAGEMENT • Organization, connection to market, legalization of business,
legal and tax aspects.
3. FINANCIAL ASPECTS • Working Capital
4. PRODUCTIVE ASPECTS
Improvements in the Cooperative
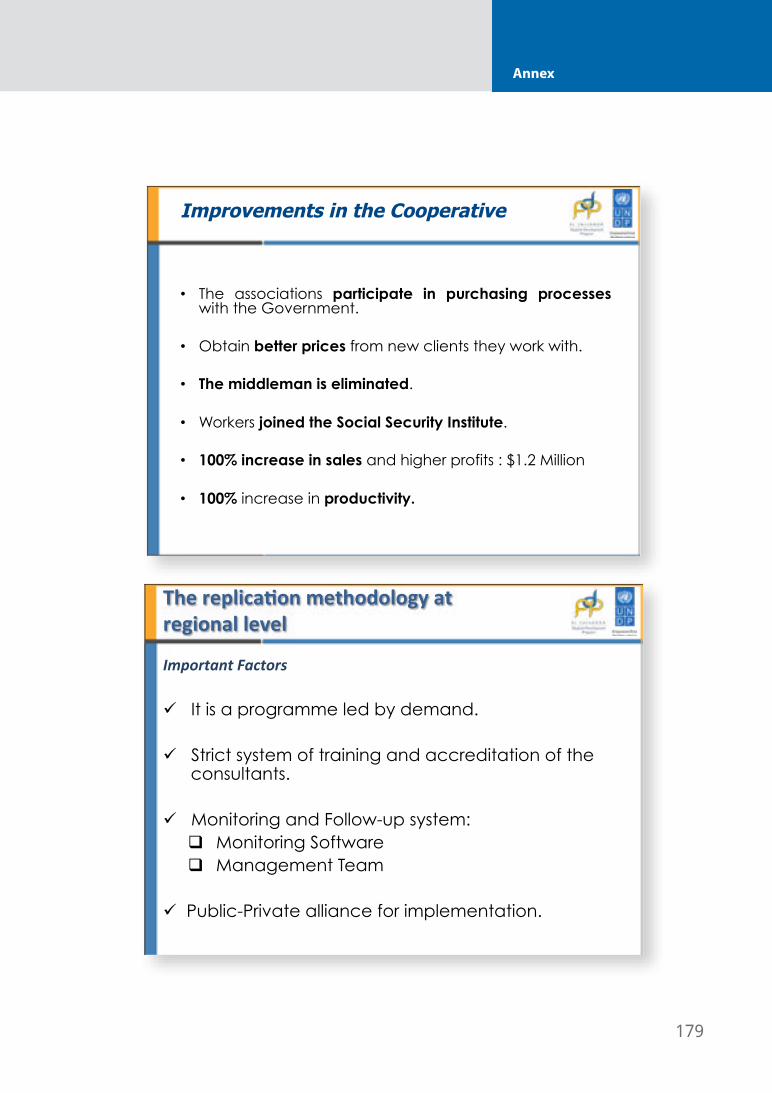
179
Annex
• The associations participate in purchasing processes with the Government.
• Obtain better prices from new clients they work with.
• The middleman is eliminated.
• Workers joined the Social Security Institute.
• 100% increase in sales and higher profits : $1.2 Million
• 100% increase in productivity.
Improvements in the Cooperative
Factores
Important Factors ü It is a programme led by demand.
ü Strict system of training and accreditation of the consultants.
ü Monitoring and Follow-up system: q Monitoring Software q Management Team
ü Public-Private alliance for implementation.
The replica>on methodology at regional level
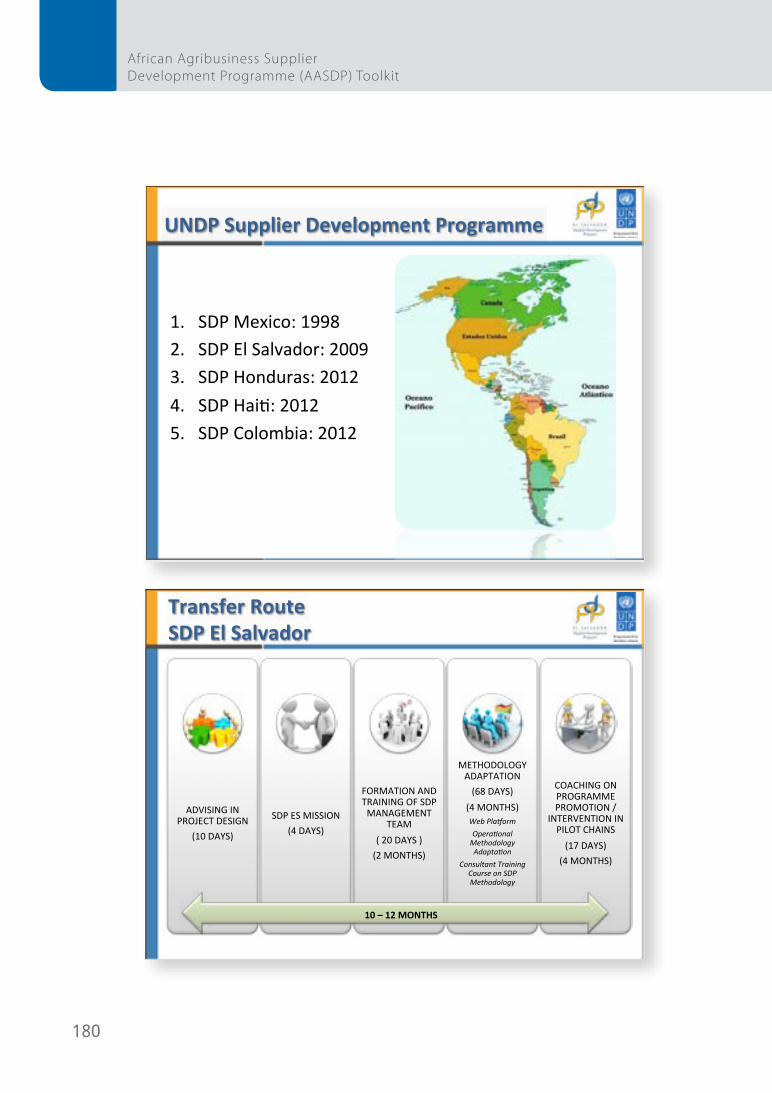
180
African Agribusiness Supplier Development Programme (AASDP) Toolkit
UNDP Supplier Development Programme
1. SDP Mexico: 1998 2. SDP El Salvador: 2009 3. SDP Honduras: 2012 4. SDP Hai/: 2012 5. SDP Colombia: 2012
Transfer Route SDP El Salvador
ADVISING IN PROJECT DESIGN
(10 DAYS)
SDP ES MISSION (4 DAYS)
FORMATION AND TRAINING OF SDP MANAGEMENT
TEAM ( 20 DAYS ) (2 MONTHS)
METHODOLOGY ADAPTATION (68 DAYS)
(4 MONTHS) Web Pla(orm Opera.onal Methodology Adapta.on
Consultant Training Course on SDP Methodology
COACHING ON PROGRAMME PROMOTION /
INTERVENTION IN PILOT CHAINS (17 DAYS)
(4 MONTHS)
10 – 12 MONTHS
181
Annex
Thank you!

Copyright © 2013/2014
United Nations Development Programme Africa Regional Service Centre
Addis Ababa, Ethiopia
All rights reserved. No part of this publication may be reproduced, stored in a retrieval system or trans-
mitted, in any form by any means, electronic, me-chanical, photocopying or otherwise, without prior
permission of UNDP.
The views and recommendations expressed in this report do not necessarily represent those of the
UN, UNDP or their Member States. The boundaries and names shown and the designations used on
the maps do not imply official endorsement or acceptance by the United Nations.
For more information see: www.undp.org/africa/privatesector
Empowered Lives.Resilient Nations.