Embed Size (px)
Citation preview
MBA
A World of Talent
Employment Statistics 2016
Financial Times
#1 Global MBA programme
Contents
Introduction 02
A World of Talent 04
Profile of 2016 INSEAD MBA Graduates 07
Employment and CompensationTrends 08
• Job Locations 10
• Career Changes 12
• Compensation Trends by Region and Country 14
• Management Consulting 16
• Financial Services 19
• Technology, Media & Telecommunications (TMT) 22
• Corporate Sectors (excluding TMT) 26
• Entrepreneurship 31
Summer Internships and Compensation Trends 32
• Monthly Base Salaries 33
Employers of 2016 INSEAD MBA graduates 35
• Top Employers 35
• The Corporate Associate Programme 35
• Prominent INSEAD Alumni 36
Working with The Career Development Centre 37
List of Recruiting Organisations 41
List of Countries Per Region 50
Introduction
89% of our 2016 graduates reported employment 3 months after graduation
89% of our December 2015 and July 2016 graduates had secured employment within 3 months of graduation, a remarkable achievement given the intensive nature of our 10-month global MBA programme and the macro-economic uncertainty in some of our traditional sectors and geographies.
This year, our students chose exciting roles with more than 300 different employers in 68 countries, which represents by far the most global and diverse reach of any top MBA programme. This is made possible thanks to strong employer relations with nearly 600 companies and an alumni network of more than 52,000 in more than 170 countries. In terms of career change, nearly 80% of the class changed one dimension of sector, function or country, with 27% of the class making simultaneous changes in all 3 dimensions.
46% of the class joined the management consulting sector, up from 43% last year. Among those joining management consultancy, 34% of them were returning to their former employers. Corporate sector hiring has stabilised at 21% of the class, with increases in the healthcare, manufacturing and retail / consumer / luxury sectors, a welcome growth to cushion the downward trend in hiring within the energy
2016 was a very good year for the INSEAD MBA, starting with the programme taking the #1 slot in the Financial Times global MBA ranking. This accolade added to our #1 position in the Forbes ranking as the programme with the highest return on investment anywhere in the world and to the success of our students and alumni in securing the #1 global employment rates with the world’s most attractive MBA recruiters.
2
sector. INSEAD’s MBA graduates continue to be attracted to the technology / media / telecommunications (“TMT”) and financial services sectors, which accounted for 19% and 14% of the class. Similar to previous years, 6% of our MBA graduates became entrepreneurs post-graduation.
Looking at remuneration, the average base salary was US$103,700 which was a US$2,000 (1.9%) decrease over last year. This was driven purely by changes in exchange rates, which saw local currencies depreciate by 3.6% against the US$ in 2016. Removing currency effects, average base salaries actually increased by 1.7%. Median sign-on and performance bonuses remained in line with previous years’, at US$22,800 and US$22,300 respectively. At the highest level of leadership, INSEAD alumni continue to perform very highly, as reaffirmed by the Financial Times, which ranked us #2 in terms of the number of CEOs amongst FT500 companies, with 8 INSEAD MBA alumni in these roles.
2016 was a significant year for the INSEAD careers team, which is made up of 40 professionals on 3 continents. For the first time, we have offered a personal career coach to every MBA student. This initiative has
been a great success, with a take-up rate of 97% and very positive feedback from students. Building even more global relationships with MBA recruiters, the team now has an active recruiting relationship with 560 companies, resulting in over 6,200 job opportunities for our 1,000 MBA students.
All these achievements would not have been possible without the support of our global network of recruiters and alumni, who continue to advise and hire our MBA talent. I would like to take this opportunity to thank them for their support and confidence. Together, we will continue to build INSEAD’s reputation as the Business School for the World.
Graham Hastie (INSEAD MBA‘95J)Interim Global Director, Career Development CentreAssociate Dean, Degree Programmes
3
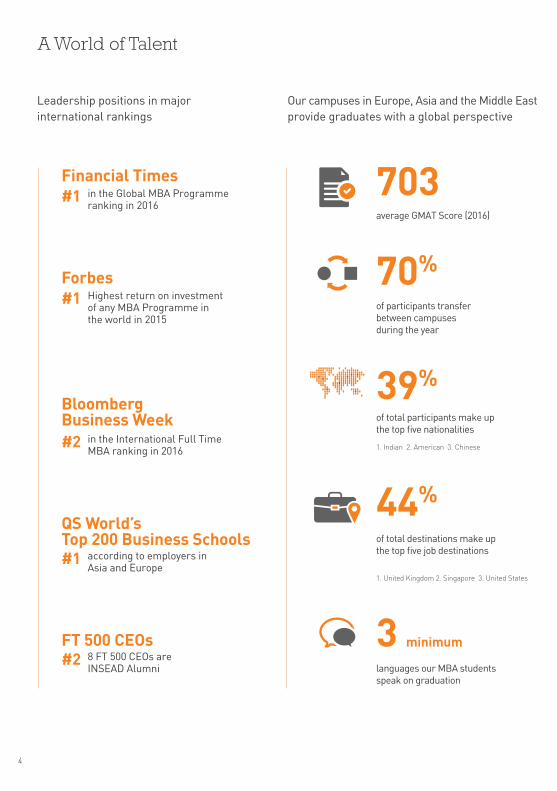
A World of Talent
Our campuses in Europe, Asia and the Middle East provide graduates with a global perspective
Leadership positions in major international rankings
#1Financial Times
in the Global MBA Programme ranking in 2016
#1Forbes
Highest return on investment of any MBA Programme in the world in 2015
#1
QS World’s Top 200 Business Schools
according to employers in Asia and Europe
#2FT 500 CEOs
8 FT 500 CEOs are INSEAD Alumni
#2
Bloomberg Business Week
in the International Full Time MBA ranking in 2016
70%
of participants transfer between campuses during the year
3 minimum
languages our MBA studentsspeak on graduation
703average GMAT Score (2016)
4
39%of total participants make upthe top five nationalities
1. Indian 2. American 3. Chinese
44%
of total destinations make up the top five job destinations
1. United Kingdom 2. Singapore 3. United States

Carolyn FairbairnMBA’88J
Director-General, Confederation of British Industry

Arthur SadounMBA’98D
CEO, Publicis Worldwide
7
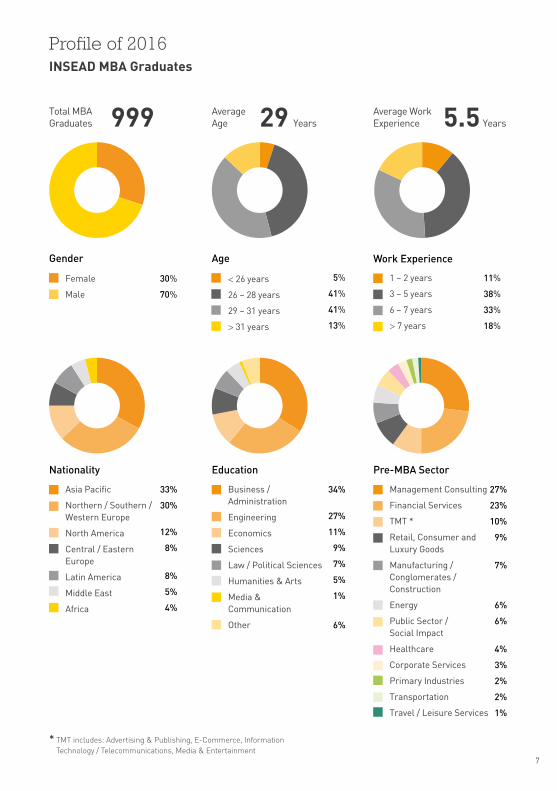
Profile of 2016INSEAD MBA Graduates
Total MBA Graduates 999
Gender
Female
Male
30%
70%
AverageAge 29 Years
Age
< 26 years
26 – 28 years
29 – 31 years
> 31 years
5%
41%
41%
13%
5+41+41+13+x30+70+x 11+38+33+18+xAverage Work Experience 5.5 Years
Work Experience
1 – 2 years
3 – 5 years
6 – 7 years
> 7 years
11%
38%
33%
18%
Pre-MBA Sector
Management Consulting
Financial Services
TMT *
Retail, Consumer and Luxury Goods
Manufacturing / Conglomerates / Construction
Energy
Public Sector / Social Impact
Healthcare
Corporate Services
Primary Industries
Transportation
Travel / Leisure Services
27%
23%
10%
9%
7%
6%
6%
4%
3%
2%
2%
1%
27+23+10+9+7+6+6+4+3+2+2+1+xEducation
Business /Administration
Engineering
Economics
Sciences
Law / Political Sciences
Humanities & Arts
Media & Communication
Other
34%
27%
11%
9%
7%
5%
1%
6%
34+27+11+9+7+5+1+6+xNationality
Asia Pacific
Northern / Southern /Western Europe
North America
Central / Eastern Europe
Latin America
Middle East
Africa
33%
30%
12%
8%
8%
5%
4%
33+30+12+8+8+5+4+x
* TMT includes: Advertising & Publishing, E-Commerce, Information Technology / Telecommunications, Media & Entertainment
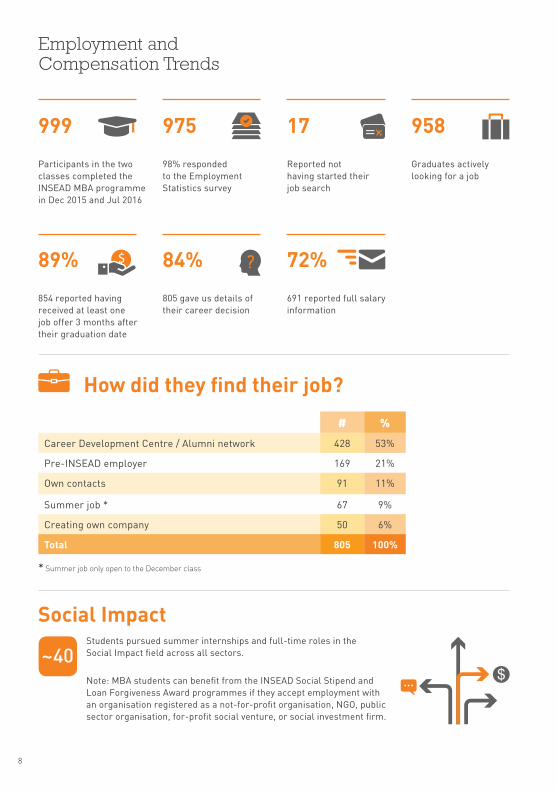
Employment and Compensation Trends
999
Participants in the two classes completed the INSEAD MBA programme in Dec 2015 and Jul 2016
975
98% responded to the Employment Statistics survey
17
Reported not having started their job search
958
Graduates actively looking for a job
89%
854 reported having received at least one job offer 3 months after their graduation date
84%
805 gave us details of their career decision
691 reported full salary information
72%
How did they find their job?
# %
Career Development Centre / Alumni network 428 53%
Pre-INSEAD employer 169 21%
Own contacts 91 11%
Summer job * 67 9%
Creating own company 50 6%
Total 805 100%
* Summer job only open to the December class
Students pursued summer internships and full-time roles in the Social Impact field across all sectors.
Social Impact
Note: MBA students can benefit from the INSEAD Social Stipend and Loan Forgiveness Award programmes if they accept employment with an organisation registered as a not-for-profit organisation, NGO, public sector organisation, for-profit social venture, or social investment firm.
~40
8
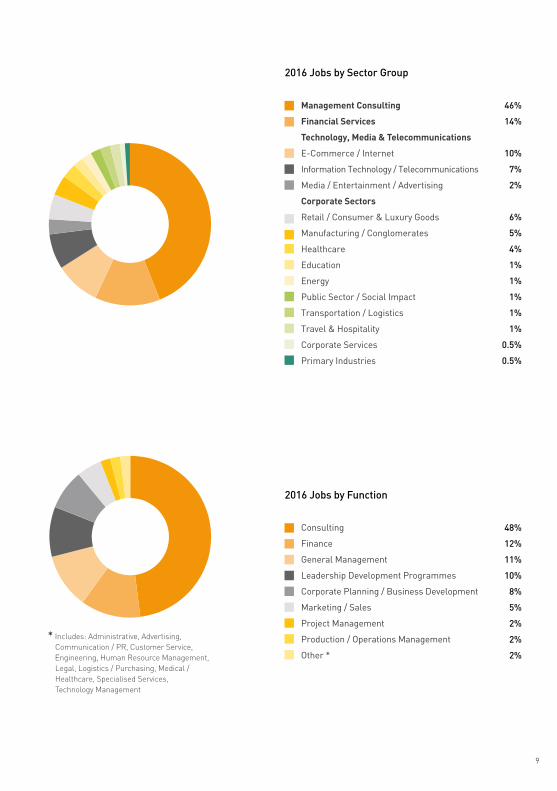
2016 Jobs by Sector Group
Management Consulting
Financial Services
Technology, Media & Telecommunications
E-Commerce / Internet
Information Technology / Telecommunications
Media / Entertainment / Advertising
Corporate Sectors
Retail / Consumer & Luxury Goods
Manufacturing / Conglomerates
Healthcare
Education
Energy
Public Sector / Social Impact
Transportation / Logistics
Travel & Hospitality
Corporate Services
Primary Industries
46%
14%
10%
7%
2%
6%
5%
4%
1%
1%
1%
1%
1%
0.5%
0.5%
44+13+9+7+3+5+4+3+2+2+2+2+2+1+1+x2016 Jobs by Function
Consulting
Finance
General Management
Leadership Development Programmes
Corporate Planning / Business Development
Marketing / Sales
Project Management
Production / Operations Management
Other *
48%
12%
11%
10%
8%
5%
2%
2%
2%
* Includes: Administrative, Advertising, Communication / PR, Customer Service, Engineering, Human Resource Management, Legal, Logistics / Purchasing, Medical / Healthcare, Specialised Services, Technology Management
48+12+11+10+8+5+2+2+2+x9
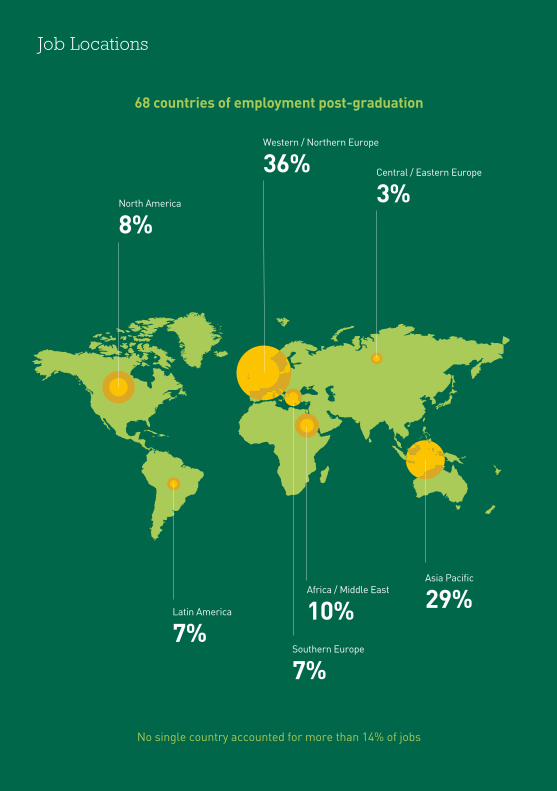
Job Locations
68 countries of employment post-graduation
No single country accounted for more than 14% of jobs
Western / Northern Europe
36%North America
8%
Central / Eastern Europe
3%
Latin America
7%Southern Europe
7%
Asia Pacific
29%Africa / Middle East
10%

Lucy QuistMBA’05J
Managing Director (CEO), Airtel Ghana
38+40+16+6+x35+12+46+7+x34+14+19+33+x67+12+12+9+x
12
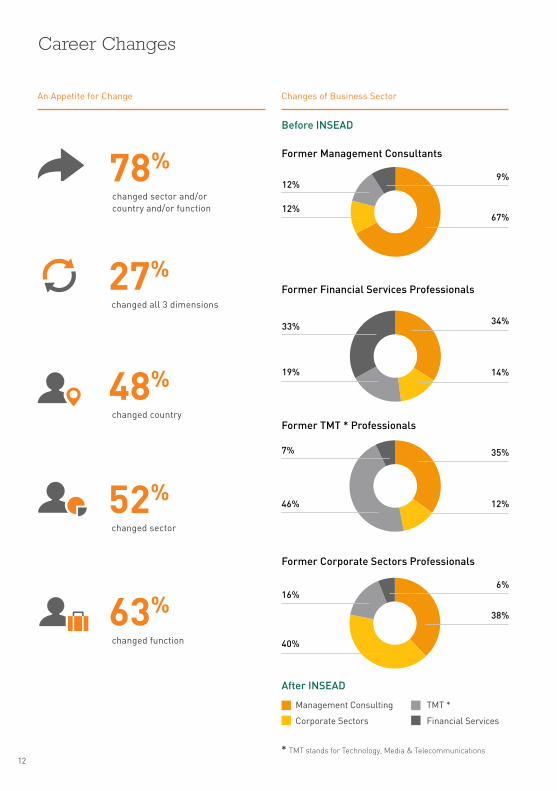
Career Changes
78%changed sector and/or country and/or function
27%changed all 3 dimensions
48%changed country
52%changed sector
63%changed function
An Appetite for Change Changes of Business Sector
Management Consulting
Corporate Sectors
TMT *
Financial Services
Former Management Consultants
Before INSEAD
12%
12%
9%
67%
Former Financial Services Professionals
33%
19%
34%
14%
Former TMT * Professionals
7%
46%
35%
12%
Former Corporate Sectors Professionals
6%16%
38%
40%
After INSEAD
* TMT stands for Technology, Media & Telecommunications
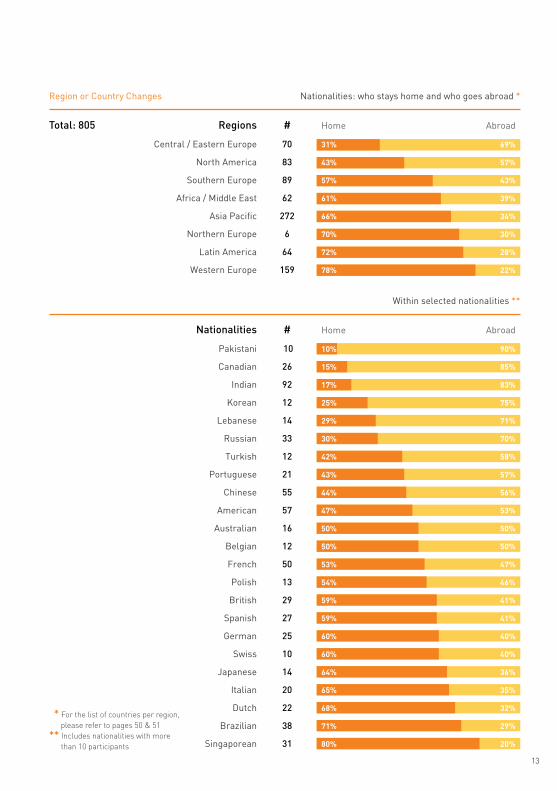
Region or Country Changes Nationalities: who stays home and who goes abroad *
Total: 805 Regions
Central / Eastern Europe
North America
Southern Europe
Africa / Middle East
Asia Pacific
Northern Europe
Latin America
Western Europe
#
70
83
89
62
272
6
64
159
Home
31%
43%
57%
61%
66%
70%
72%
78%
Abroad
69%
57%
43%
39%
34%
30%
28%
22%
Within selected nationalities **
Nationalities
Pakistani
Canadian
Indian
Korean
Lebanese
Russian
Turkish
Portuguese
Chinese
American
Australian
Belgian
French
Polish
British
Spanish
German
Swiss
Japanese
Italian
Dutch
Brazilian
Singaporean
#
10
26
92
12
14
33
12
21
55
57
16
12
50
13
29
27
25
10
14
20
22
38
31
Home
10%
15%
17%
25%
29%
30%
42%
43%
44%
47%
50%
50%
53%
54%
59%
59%
60%
60%
64%
65%
68%
71%
80%
Abroad
90%
85%
83%
75%
71%
70%
58%
57%
56%
53%
50%
50%
47%
46%
41%
41%
40%
40%
36%
35%
32%
29%
20%
* For the list of countries per region, please refer to pages 50 & 51 ** Includes nationalities with more than 10 participants
13
14
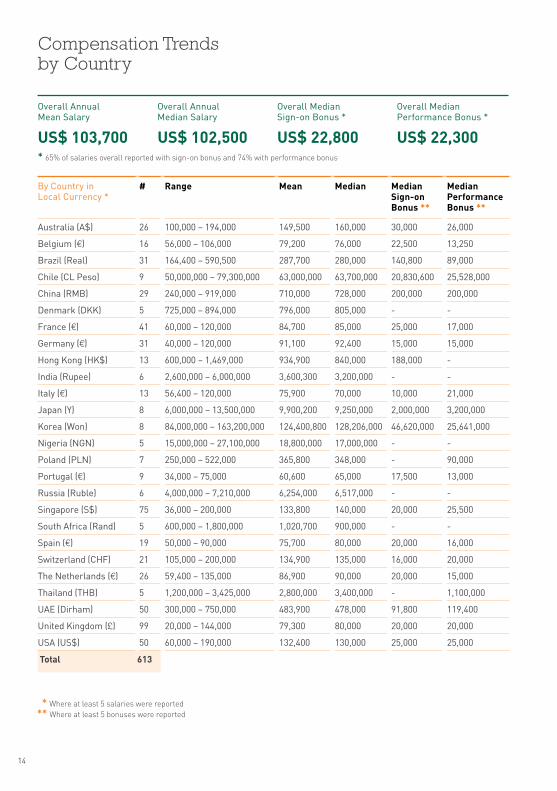
Compensation Trends by Country
Overall Annual Mean Salary
US$ 103,700
Overall Annual Median Salary
US$ 102,500
Overall Median Sign-on Bonus *
US$ 22,800
Overall Median Performance Bonus *
US$ 22,300* 65% of salaries overall reported with sign-on bonus and 74% with performance bonus
* Where at least 5 salaries were reported ** Where at least 5 bonuses were reported
By Country in Local Currency *
# Range Mean Median Median Sign-on Bonus **
Median Performance Bonus **
Australia (A$) 26 100,000 – 194,000 149,500 160,000 30,000 26,000
Belgium (€) 16 56,000 – 106,000 79,200 76,000 22,500 13,250
Brazil (Real) 31 164,400 – 590,500 287,700 280,000 140,800 89,000
Chile (CL Peso) 9 50,000,000 – 79,300,000 63,000,000 63,700,000 20,830,600 25,528,000
China (RMB) 29 240,000 – 919,000 710,000 728,000 200,000 200,000
Denmark (DKK) 5 725,000 – 894,000 796,000 805,000 - -
France (€) 41 60,000 – 120,000 84,700 85,000 25,000 17,000
Germany (€) 31 40,000 – 120,000 91,100 92,400 15,000 15,000
Hong Kong (HK$) 13 600,000 – 1,469,000 934,900 840,000 188,000 -
India (Rupee) 6 2,600,000 – 6,000,000 3,600,300 3,200,000 - -
Italy (€) 13 56,400 – 120,000 75,900 70,000 10,000 21,000
Japan (Y) 8 6,000,000 – 13,500,000 9,900,200 9,250,000 2,000,000 3,200,000
Korea (Won) 8 84,000,000 – 163,200,000 124,400,800 128,206,000 46,620,000 25,641,000
Nigeria (NGN) 5 15,000,000 – 27,100,000 18,800,000 17,000,000 - -
Poland (PLN) 7 250,000 – 522,000 365,800 348,000 - 90,000
Portugal (€) 9 34,000 – 75,000 60,600 65,000 17,500 13,000
Russia (Ruble) 6 4,000,000 – 7,210,000 6,254,000 6,517,000 - -
Singapore (S$) 75 36,000 – 200,000 133,800 140,000 20,000 25,500
South Africa (Rand) 5 600,000 – 1,800,000 1,020,700 900,000 - -
Spain (€) 19 50,000 – 90,000 75,700 80,000 20,000 16,000
Switzerland (CHF) 21 105,000 – 200,000 134,900 135,000 16,000 20,000
The Netherlands (€) 26 59,400 – 135,000 86,900 90,000 20,000 15,000
Thailand (THB) 5 1,200,000 – 3,425,000 2,800,000 3,400,000 - 1,100,000
UAE (Dirham) 50 300,000 – 750,000 483,900 478,000 91,800 119,400
United Kingdom (£) 99 20,000 – 144,000 79,300 80,000 20,000 20,000
USA (US$) 50 60,000 – 190,000 132,400 130,000 25,000 25,000
Total 613
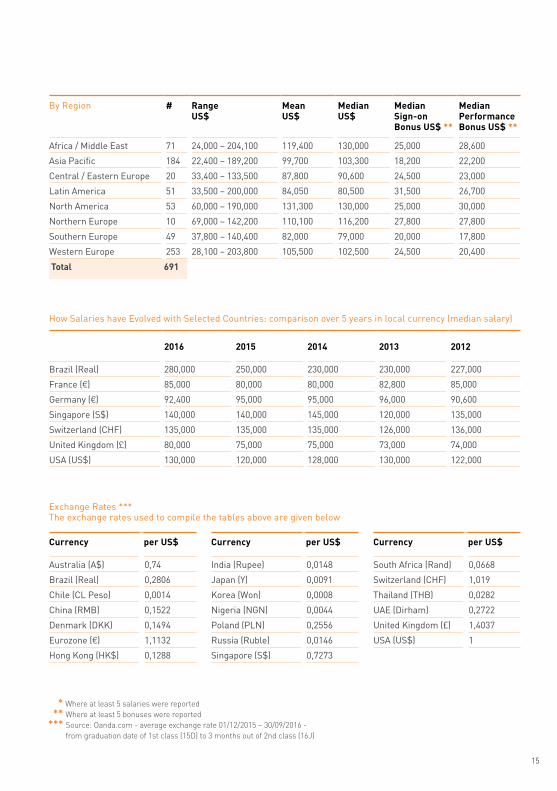
How Salaries have Evolved with Selected Countries: comparison over 5 years in local currency (median salary)
2016 2015 2014 2013 2012
Brazil (Real) 280,000 250,000 230,000 230,000 227,000
France (€) 85,000 80,000 80,000 82,800 85,000
Germany (€) 92,400 95,000 95,000 96,000 90,600
Singapore (S$) 140,000 140,000 145,000 120,000 135,000
Switzerland (CHF) 135,000 135,000 135,000 126,000 136,000
United Kingdom (£) 80,000 75,000 75,000 73,000 74,000
USA (US$) 130,000 120,000 128,000 130,000 122,000
* Where at least 5 salaries were reported ** Where at least 5 bonuses were reported*** Source: Oanda.com - average exchange rate 01/12/2015 – 30/09/2016 - from graduation date of 1st class (15D) to 3 months out of 2nd class (16J)
Currency per US$
Australia (A$) 0,74
Brazil (Real) 0,2806
Chile (CL Peso) 0,0014
China (RMB) 0,1522
Denmark (DKK) 0,1494
Eurozone (€) 1,1132
Hong Kong (HK$) 0,1288
Exchange Rates ***The exchange rates used to compile the tables above are given below
Currency per US$
India (Rupee) 0,0148
Japan (Y) 0,0091
Korea (Won) 0,0008
Nigeria (NGN) 0,0044
Poland (PLN) 0,2556
Russia (Ruble) 0,0146
Singapore (S$) 0,7273
Currency per US$
South Africa (Rand) 0,0668
Switzerland (CHF) 1,019
Thailand (THB) 0,0282
UAE (Dirham) 0,2722
United Kingdom (£) 1,4037
USA (US$) 1
By Region # RangeUS$
MeanUS$
MedianUS$
Median Sign-on Bonus US$ **
Median Performance Bonus US$ **
Africa / Middle East 71 24,000 – 204,100 119,400 130,000 25,000 28,600
Asia Pacific 184 22,400 – 189,200 99,700 103,300 18,200 22,200
Central / Eastern Europe 20 33,400 – 133,500 87,800 90,600 24,500 23,000
Latin America 51 33,500 – 200,000 84,050 80,500 31,500 26,700
North America 53 60,000 – 190,000 131,300 130,000 25,000 30,000
Northern Europe 10 69,000 – 142,200 110,100 116,200 27,800 27,800
Southern Europe 49 37,800 – 140,400 82,000 79,000 20,000 17,800
Western Europe 253 28,100 – 203,800 105,500 102,500 24,500 20,400
Total 691
15
16
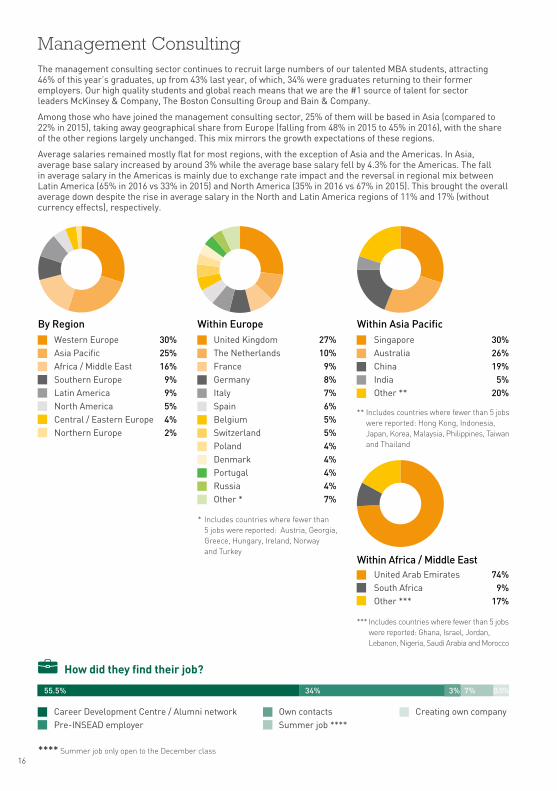
Management Consulting
By RegionWestern EuropeAsia PacificAfrica / Middle EastSouthern EuropeLatin AmericaNorth AmericaCentral / Eastern EuropeNorthern Europe
30%25%16%
9%9%5%4%2%
30+25+16+9+9+5+4+2+xWithin Europe
United KingdomThe NetherlandsFranceGermanyItalySpainBelgiumSwitzerlandPolandDenmarkPortugal RussiaOther *
27%10%
9%8%7%6%5%5%4%4%4%4%7%
27+10+9+8+7+6+5+5+4+4+4+4+7+x
* Includes countries where fewer than 5 jobs were reported: Austria, Georgia, Greece, Hungary, Ireland, Norway and Turkey
30+26+19+5+20+xWithin Asia Pacific
SingaporeAustraliaChinaIndiaOther **
30%26%19%
5%20%
** Includes countries where fewer than 5 jobs were reported: Hong Kong, Indonesia, Japan, Korea, Malaysia, Philippines, Taiwan and Thailand
Within Africa / Middle EastUnited Arab EmiratesSouth AfricaOther ***
74%9%
17%
74+9+17+x*** Includes countries where fewer than 5 jobs were reported: Ghana, Israel, Jordan, Lebanon, Nigeria, Saudi Arabia and Morocco
The management consulting sector continues to recruit large numbers of our talented MBA students, attracting 46% of this year’s graduates, up from 43% last year, of which, 34% were graduates returning to their former employers. Our high quality students and global reach means that we are the #1 source of talent for sector leaders McKinsey & Company, The Boston Consulting Group and Bain & Company.
Among those who have joined the management consulting sector, 25% of them will be based in Asia (compared to 22% in 2015), taking away geographical share from Europe (falling from 48% in 2015 to 45% in 2016), with the share of the other regions largely unchanged. This mix mirrors the growth expectations of these regions.
Average salaries remained mostly flat for most regions, with the exception of Asia and the Americas. In Asia, average base salary increased by around 3% while the average base salary fell by 4.3% for the Americas. The fall in average salary in the Americas is mainly due to exchange rate impact and the reversal in regional mix between Latin America (65% in 2016 vs 33% in 2015) and North America (35% in 2016 vs 67% in 2015). This brought the overall average down despite the rise in average salary in the North and Latin America regions of 11% and 17% (without currency effects), respectively.
**** Summer job only open to the December class
Career Development Centre / Alumni networkPre-INSEAD employer
Own contactsSummer job ****
Creating own company
How did they find their job?
55.5% 34% 7% 0.5%3%
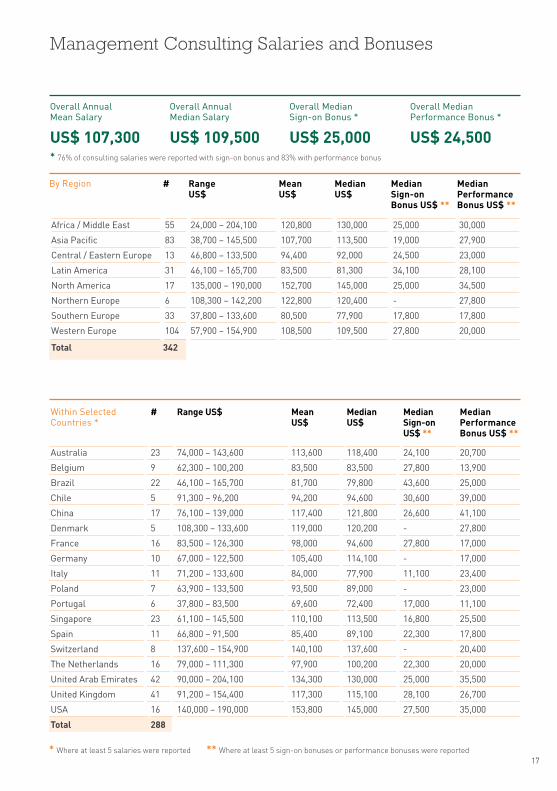
Management Consulting Salaries and Bonuses
Overall Annual Mean Salary
US$ 107,300
Overall Annual Median Salary
US$ 109,500
Overall Median Sign-on Bonus *
US$ 25,000
Overall Median Performance Bonus *
US$ 24,500* 76% of consulting salaries were reported with sign-on bonus and 83% with performance bonus
* Where at least 5 salaries were reported ** Where at least 5 sign-on bonuses or performance bonuses were reported
By Region # RangeUS$
MeanUS$
MedianUS$
Median Sign-on Bonus US$ **
Median Performance Bonus US$ **
Africa / Middle East 55 24,000 – 204,100 120,800 130,000 25,000 30,000
Asia Pacific 83 38,700 – 145,500 107,700 113,500 19,000 27,900
Central / Eastern Europe 13 46,800 – 133,500 94,400 92,000 24,500 23,000
Latin America 31 46,100 – 165,700 83,500 81,300 34,100 28,100
North America 17 135,000 – 190,000 152,700 145,000 25,000 34,500
Northern Europe 6 108,300 – 142,200 122,800 120,400 - 27,800
Southern Europe 33 37,800 – 133,600 80,500 77,900 17,800 17,800
Western Europe 104 57,900 – 154,900 108,500 109,500 27,800 20,000
Total 342
Within Selected Countries *
# Range US$ Mean US$
Median US$
Median Sign-on US$ **
Median Performance Bonus US$ **
Australia 23 74,000 – 143,600 113,600 118,400 24,100 20,700
Belgium 9 62,300 – 100,200 83,500 83,500 27,800 13,900
Brazil 22 46,100 – 165,700 81,700 79,800 43,600 25,000
Chile 5 91,300 – 96,200 94,200 94,600 30,600 39,000
China 17 76,100 – 139,000 117,400 121,800 26,600 41,100
Denmark 5 108,300 – 133,600 119,000 120,200 - 27,800
France 16 83,500 – 126,300 98,000 94,600 27,800 17,000
Germany 10 67,000 – 122,500 105,400 114,100 - 17,000
Italy 11 71,200 – 133,600 84,000 77,900 11,100 23,400
Poland 7 63,900 – 133,500 93,500 89,000 - 23,000
Portugal 6 37,800 – 83,500 69,600 72,400 17,000 11,100
Singapore 23 61,100 – 145,500 110,100 113,500 16,800 25,500
Spain 11 66,800 – 91,500 85,400 89,100 22,300 17,800
Switzerland 8 137,600 – 154,900 140,100 137,600 - 20,400
The Netherlands 16 79,000 – 111,300 97,900 100,200 22,300 20,000
United Arab Emirates 42 90,000 – 204,100 134,300 130,000 25,000 35,500
United Kingdom 41 91,200 – 154,400 117,300 115,100 28,100 26,700
USA 16 140,000 – 190,000 153,800 145,000 27,500 35,000
Total 288
17

Karien van GennipMBA’95D
CEO, ING France
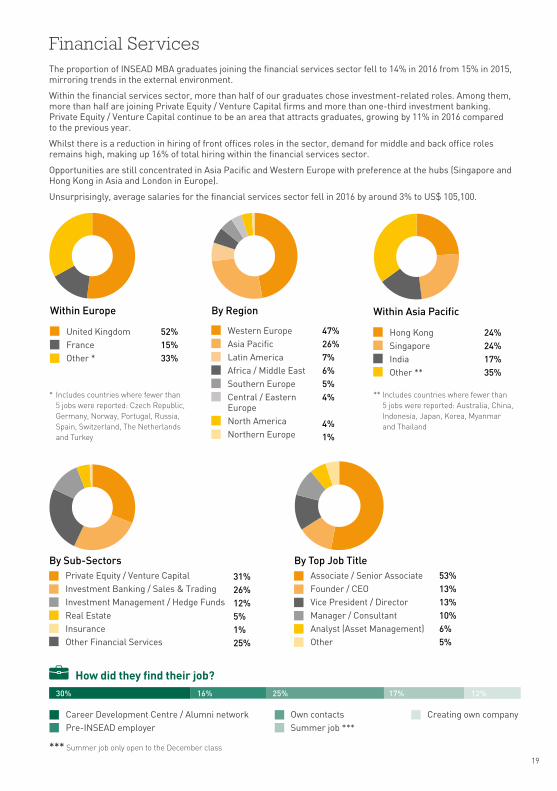
Financial Services
47+26+7+6+5+4+4+1+xBy Region
Western EuropeAsia PacificLatin AmericaAfrica / Middle EastSouthern EuropeCentral / Eastern EuropeNorth AmericaNorthern Europe
47%26%7%6%5%4%
4%1%
52+15+33+xWithin Europe
United KingdomFranceOther *
52%15%33%
* Includes countries where fewer than 5 jobs were reported: Czech Republic, Germany, Norway, Portugal, Russia, Spain, Switzerland, The Netherlands and Turkey
** Includes countries where fewer than 5 jobs were reported: Australia, China, Indonesia, Japan, Korea, Myanmar and Thailand
24+24+17+35+xWithin Asia Pacific
Hong KongSingaporeIndiaOther **
24%24%17%35%
31+26+25+12+5+1+xBy Sub-Sectors
Private Equity / Venture CapitalInvestment Banking / Sales & TradingInvestment Management / Hedge FundsReal EstateInsuranceOther Financial Services
31%26%12%5%1%25%
53+13+13+10+6+5+xBy Top Job Title
Associate / Senior AssociateFounder / CEOVice President / DirectorManager / ConsultantAnalyst (Asset Management)Other
53%13%13%10%6%5%
The proportion of INSEAD MBA graduates joining the financial services sector fell to 14% in 2016 from 15% in 2015, mirroring trends in the external environment.
Within the financial services sector, more than half of our graduates chose investment-related roles. Among them, more than half are joining Private Equity / Venture Capital firms and more than one-third investment banking. Private Equity / Venture Capital continue to be an area that attracts graduates, growing by 11% in 2016 compared to the previous year.
Whilst there is a reduction in hiring of front offices roles in the sector, demand for middle and back office roles remains high, making up 16% of total hiring within the financial services sector.
Opportunities are still concentrated in Asia Pacific and Western Europe with preference at the hubs (Singapore and Hong Kong in Asia and London in Europe).
Unsurprisingly, average salaries for the financial services sector fell in 2016 by around 3% to US$ 105,100.
*** Summer job only open to the December class
How did they find their job?
Career Development Centre / Alumni networkPre-INSEAD employer
Own contactsSummer job ***
Creating own company
30% 16% 25% 17% 12%
19
20
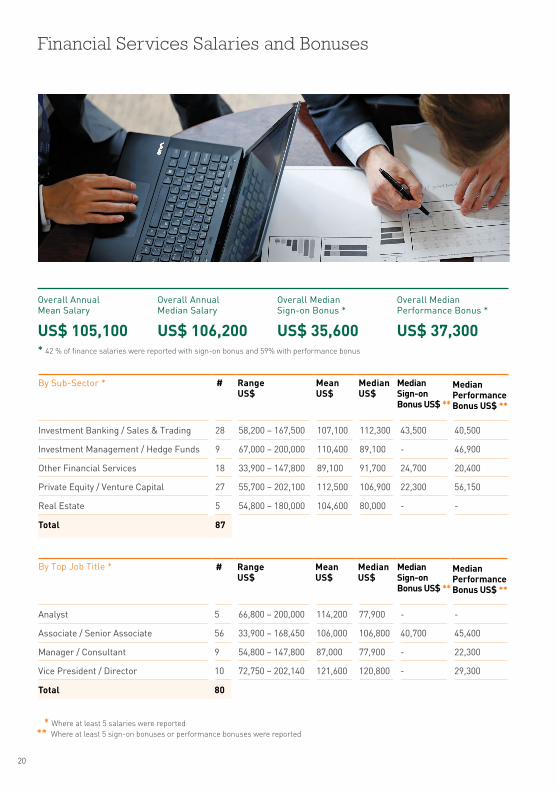
Financial Services Salaries and Bonuses
* Where at least 5 salaries were reported ** Where at least 5 sign-on bonuses or performance bonuses were reported
Overall Annual Mean Salary
US$ 105,100
Overall Annual Median Salary
US$ 106,200
Overall Median Sign-on Bonus *
US$ 35,600
Overall Median Performance Bonus *
US$ 37,300* 42 % of finance salaries were reported with sign-on bonus and 59% with performance bonus
By Sub-Sector * # Range US$
Mean US$
Median US$
Median Sign-on Bonus US$ **
Median Performance Bonus US$ **
Investment Banking / Sales & Trading 28 58,200 – 167,500 107,100 112,300 43,500 40,500
Investment Management / Hedge Funds 9 67,000 – 200,000 110,400 89,100 - 46,900
Other Financial Services 18 33,900 – 147,800 89,100 91,700 24,700 20,400
Private Equity / Venture Capital 27 55,700 – 202,100 112,500 106,900 22,300 56,150
Real Estate 5 54,800 – 180,000 104,600 80,000 - -
Total 87
By Top Job Title * # Range US$
Mean US$
Median US$
Median Sign-on Bonus US$ **
Median Performance Bonus US$ **
Analyst 5 66,800 – 200,000 114,200 77,900 - -
Associate / Senior Associate 56 33,900 – 168,450 106,000 106,800 40,700 45,400
Manager / Consultant 9 54,800 – 147,800 87,000 77,900 - 22,300
Vice President / Director 10 72,750 – 202,140 121,600 120,800 - 29,300
Total 80
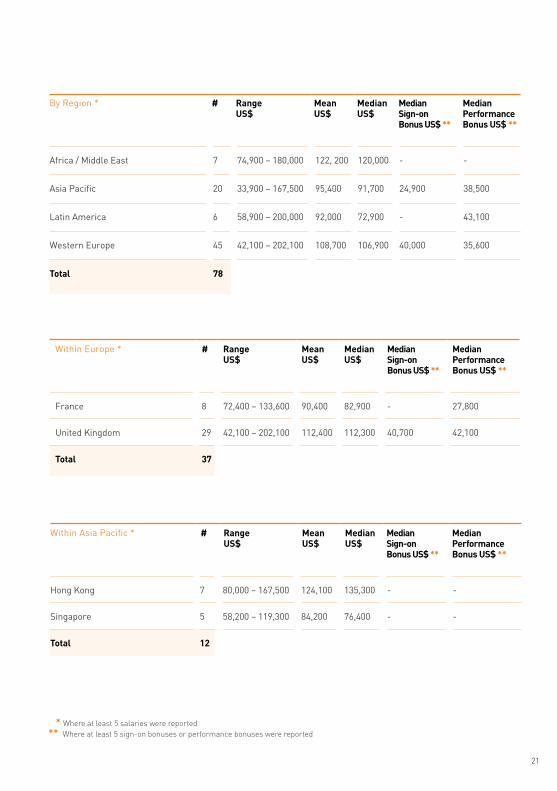
* Where at least 5 salaries were reported ** Where at least 5 sign-on bonuses or performance bonuses were reported
By Region * # Range US$
Mean US$
Median US$
Median Sign-on Bonus US$ **
Median Performance Bonus US$ **
Africa / Middle East 7 74,900 – 180,000 122, 200 120,000 - -
Asia Pacific 20 33,900 – 167,500 95,400 91,700 24,900 38,500
Latin America 6 58,900 – 200,000 92,000 72,900 - 43,100
Western Europe 45 42,100 – 202,100 108,700 106,900 40,000 35,600
Total 78
Within Europe * # Range US$
Mean US$
Median US$
Median Sign-on Bonus US$ **
Median Performance Bonus US$ **
France 8 72,400 – 133,600 90,400 82,900 - 27,800
United Kingdom 29 42,100 – 202,100 112,400 112,300 40,700 42,100
Total 37
Within Asia Pacific * # Range US$
Mean US$
Median US$
Median Sign-on Bonus US$ **
Median Performance Bonus US$ **
Hong Kong 7 80,000 – 167,500 124,100 135,300 - -
Singapore 5 58,200 – 119,300 84,200 76,400 - -
Total 12
21
22
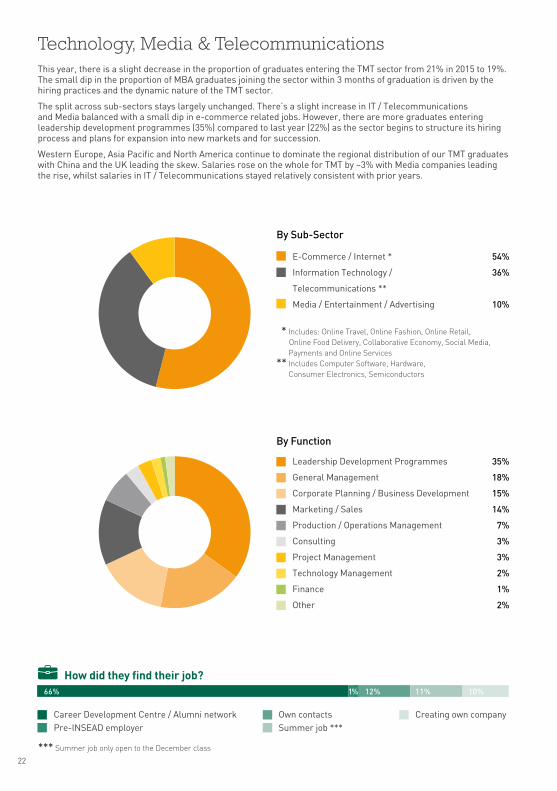
This year, there is a slight decrease in the proportion of graduates entering the TMT sector from 21% in 2015 to 19%. The small dip in the proportion of MBA graduates joining the sector within 3 months of graduation is driven by the hiring practices and the dynamic nature of the TMT sector.
The split across sub-sectors stays largely unchanged. There’s a slight increase in IT / Telecommunications and Media balanced with a small dip in e-commerce related jobs. However, there are more graduates entering leadership development programmes (35%) compared to last year (22%) as the sector begins to structure its hiring process and plans for expansion into new markets and for succession.
Western Europe, Asia Pacific and North America continue to dominate the regional distribution of our TMT graduates with China and the UK leading the skew. Salaries rose on the whole for TMT by ~3% with Media companies leading the rise, whilst salaries in IT / Telecommunications stayed relatively consistent with prior years.
Technology, Media & Telecommunications
35+18+15+14+7+3+3+2+1+2+xBy Function
Leadership Development Programmes
General Management
Corporate Planning / Business Development
Marketing / Sales
Production / Operations Management
Consulting
Project Management
Technology Management
Finance
Other
35%
18%
15%
14%
7%
3%
3%
2%
1%
2%
54+36+10+x * Includes: Online Travel, Online Fashion, Online Retail, Online Food Delivery, Collaborative Economy, Social Media, Payments and Online Services** Includes Computer Software, Hardware, Consumer Electronics, Semiconductors
E-Commerce / Internet *
Information Technology /
Telecommunications **
Media / Entertainment / Advertising
54%
36%
10%
By Sub-Sector
*** Summer job only open to the December class
How did they find their job?
Career Development Centre / Alumni networkPre-INSEAD employer
Own contactsSummer job ***
Creating own company
66% 12% 11% 10%1%
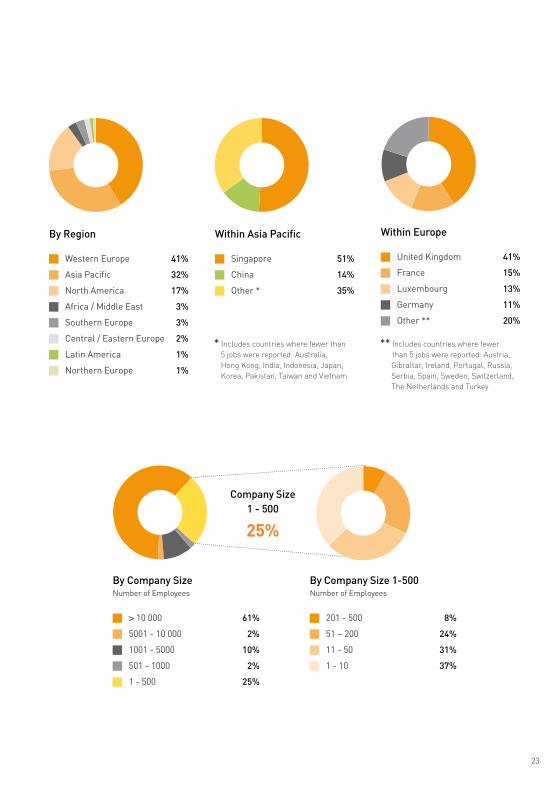
41+15+13+11+20+x51+14+35+xBy Region
Western Europe
Asia Pacific
North America
Africa / Middle East
Southern Europe
Central / Eastern Europe
Latin America
Northern Europe
41%
32%
17%
3%
3%
2%
1%
1%
41+32+17+3+3+2+1+1+xWithin Asia Pacific
Singapore
China
Other *
51%
14%
35%
Within Europe
United Kingdom
France
Luxembourg
Germany
Other **
41%
15%
13%
11%
20%
* Includes countries where fewer than 5 jobs were reported: Australia, Hong Kong, India, Indonesia, Japan, Korea, Pakistan, Taiwan and Vietnam
** Includes countries where fewer than 5 jobs were reported: Austria, Gibraltar, Ireland, Portugal, Russia, Serbia, Spain, Sweden, Switzerland, The Netherlands and Turkey
61+2+10+2+25+xBy Company Size Number of Employees
> 10 000
5001 - 10 000
1001 - 5000
501 - 1000
1 - 500
61%
2%
10%
2%
25%
By Company Size 1-500 Number of Employees
201 - 500
51 – 200
11 - 50
1 - 10
8%
24%
31%
37%
Company Size 1 - 500
25% 8+24+31+37+x
23
24
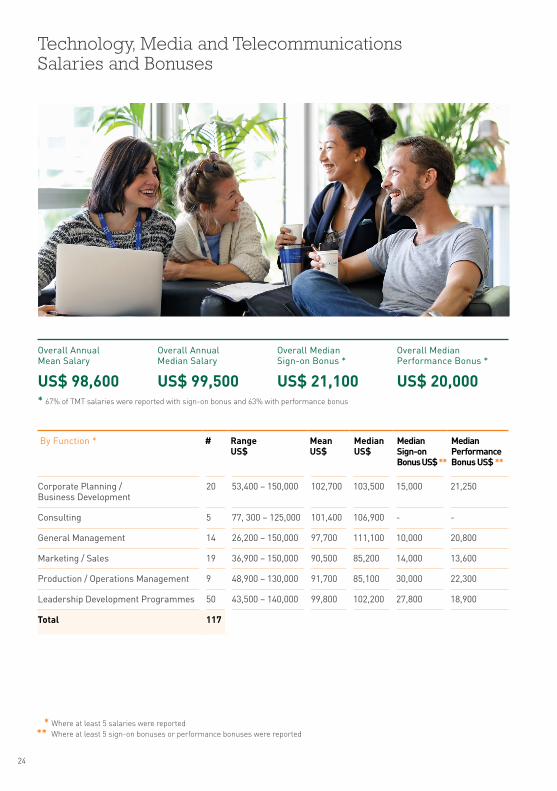
Technology, Media and Telecommunications Salaries and Bonuses
* Where at least 5 salaries were reported ** Where at least 5 sign-on bonuses or performance bonuses were reported
Overall Annual Mean Salary
US$ 98,600
Overall Annual Median Salary
US$ 99,500
Overall Median Sign-on Bonus *
US$ 21,100
Overall Median Performance Bonus *
US$ 20,000* 67% of TMT salaries were reported with sign-on bonus and 63% with performance bonus
By Function * # Range US$
Mean US$
Median US$
Median Sign-on Bonus US$ **
Median Performance Bonus US$ **
Corporate Planning / Business Development
20 53,400 – 150,000 102,700 103,500 15,000 21,250
Consulting 5 77, 300 – 125,000 101,400 106,900 - -
General Management 14 26,200 – 150,000 97,700 111,100 10,000 20,800
Marketing / Sales 19 36,900 – 150,000 90,500 85,200 14,000 13,600
Production / Operations Management 9 48,900 – 130,000 91,700 85,100 30,000 22,300
Leadership Development Programmes 50 43,500 – 140,000 99,800 102,200 27,800 18,900
Total 117
* Where at least 5 salaries were reported ** Where at least 5 sign-on bonuses or performance bonuses were reported
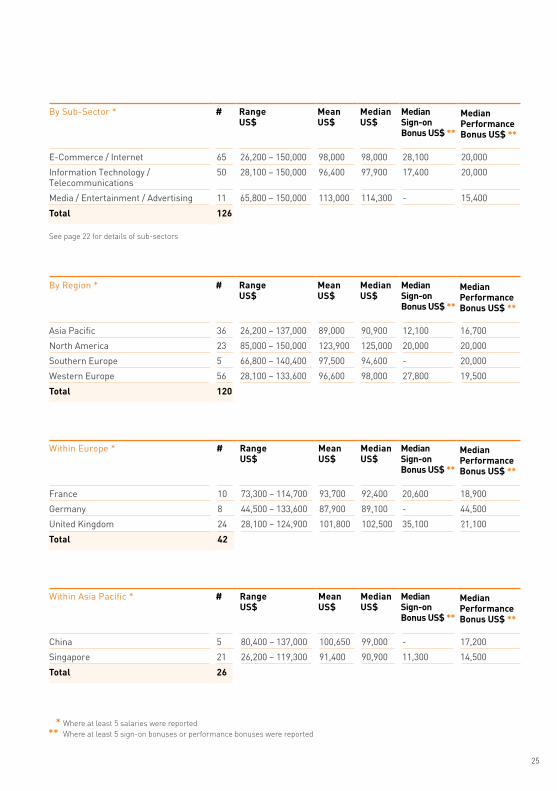
By Region * # Range US$
Mean US$
Median US$
Median Sign-on Bonus US$ **
Median Performance Bonus US$ **
Asia Pacific 36 26,200 – 137,000 89,000 90,900 12,100 16,700
North America 23 85,000 – 150,000 123,900 125,000 20,000 20,000
Southern Europe 5 66,800 – 140,400 97,500 94,600 - 20,000
Western Europe 56 28,100 – 133,600 96,600 98,000 27,800 19,500
Total 120
Within Europe * # Range US$
Mean US$
Median US$
Median Sign-on Bonus US$ **
Median Performance Bonus US$ **
France 10 73,300 – 114,700 93,700 92,400 20,600 18,900
Germany 8 44,500 – 133,600 87,900 89,100 - 44,500
United Kingdom 24 28,100 – 124,900 101,800 102,500 35,100 21,100
Total 42
Within Asia Pacific * # Range US$
Mean US$
Median US$
Median Sign-on Bonus US$ **
Median Performance Bonus US$ **
China 5 80,400 – 137,000 100,650 99,000 - 17,200
Singapore 21 26,200 – 119,300 91,400 90,900 11,300 14,500
Total 26
By Sub-Sector * # Range US$
Mean US$
Median US$
Median Sign-on Bonus US$ **
Median Performance Bonus US$ **
E-Commerce / Internet 65 26,200 – 150,000 98,000 98,000 28,100 20,000
Information Technology / Telecommunications
50 28,100 – 150,000 96,400 97,900 17,400 20,000
Media / Entertainment / Advertising 11 65,800 – 150,000 113,000 114,300 - 15,400
Total 126
See page 22 for details of sub-sectors
25
26
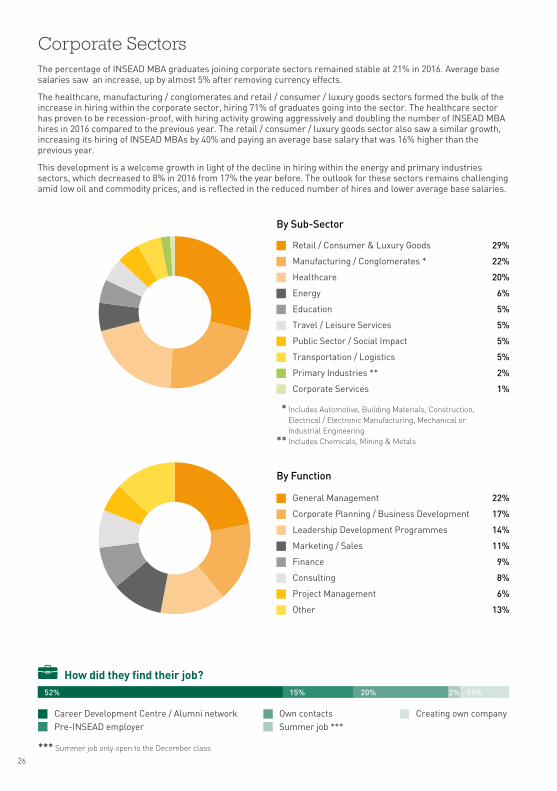
29+22+20+6+5+5+5+5+2+1+x
Corporate Sectors
Retail / Consumer & Luxury Goods
Manufacturing / Conglomerates *
Healthcare
Energy
Education
Travel / Leisure Services
Public Sector / Social Impact
Transportation / Logistics
Primary Industries **
Corporate Services
29%
22%
20%
6%
5%
5%
5%
5%
2%
1%
* Includes Automotive, Building Materials, Construction, Electrical / Electronic Manufacturing, Mechanical or Industrial Engineering** Includes Chemicals, Mining & Metals
By Sub-Sector
22+17+14+11+9+8+6+13+x General Management
Corporate Planning / Business Development
Leadership Development Programmes
Marketing / Sales
Finance
Consulting
Project Management
Other
22%
17%
14%
11%
9%
8%
6%
13%
By Function
The percentage of INSEAD MBA graduates joining corporate sectors remained stable at 21% in 2016. Average base salaries saw an increase, up by almost 5% after removing currency effects.
The healthcare, manufacturing / conglomerates and retail / consumer / luxury goods sectors formed the bulk of the increase in hiring within the corporate sector, hiring 71% of graduates going into the sector. The healthcare sector has proven to be recession-proof, with hiring activity growing aggressively and doubling the number of INSEAD MBA hires in 2016 compared to the previous year. The retail / consumer / luxury goods sector also saw a similar growth, increasing its hiring of INSEAD MBAs by 40% and paying an average base salary that was 16% higher than the previous year.
This development is a welcome growth in light of the decline in hiring within the energy and primary industries sectors, which decreased to 8% in 2016 from 17% the year before. The outlook for these sectors remains challenging amid low oil and commodity prices, and is reflected in the reduced number of hires and lower average base salaries.
*** Summer job only open to the December class
How did they find their job?
Career Development Centre / Alumni networkPre-INSEAD employer
Own contactsSummer job ***
Creating own company
52% 15% 20% 2% 11%
58+6+5+2+29+x16+14+12+10+10+10+7+21+x45+12+11+10+22+x7+36+2+8+7+2+6+32+x
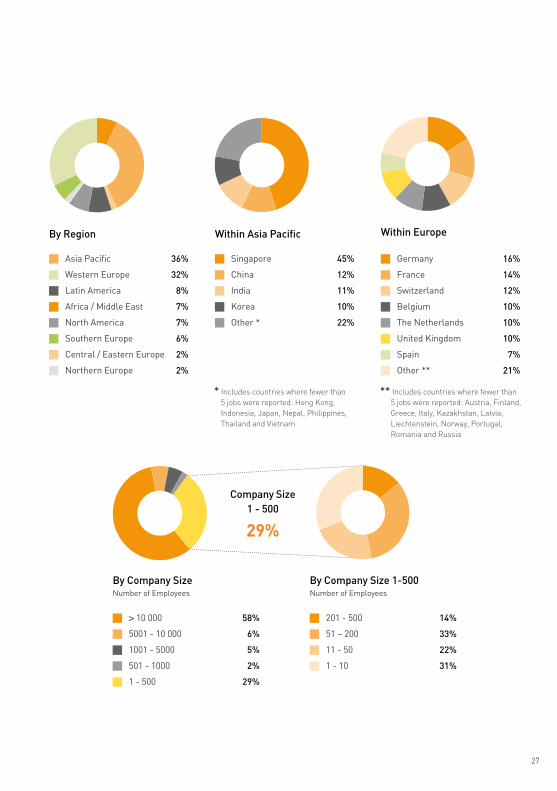
By Region
Asia Pacific
Western Europe
Latin America
Africa / Middle East
North America
Southern Europe
Central / Eastern Europe
Northern Europe
36%
32%
8%
7%
7%
6%
2%
2%
Within Asia Pacific
Singapore
China
India
Korea
Other *
45%
12%
11%
10%
22%
Within Europe
Germany
France
Switzerland
Belgium
The Netherlands
United Kingdom
Spain
Other **
16%
14%
12%
10%
10%
10%
7%
21%
* Includes countries where fewer than 5 jobs were reported: Hong Kong, Indonesia, Japan, Nepal, Philippines, Thailand and Vietnam
** Includes countries where fewer than 5 jobs were reported: Austria, Finland, Greece, Italy, Kazakhstan, Latvia, Liechtenstein, Norway, Portugal, Romania and Russia
By Company Size Number of Employees
> 10 000
5001 - 10 000
1001 - 5000
501 - 1000
1 - 500
58%
6%
5%
2%
29%
By Company Size 1-500 Number of Employees
201 - 500
51 – 200
11 - 50
1 - 10
14%
33%
22%
31%
Company Size 1 - 500
29% 14+33+22+31+x
27
28
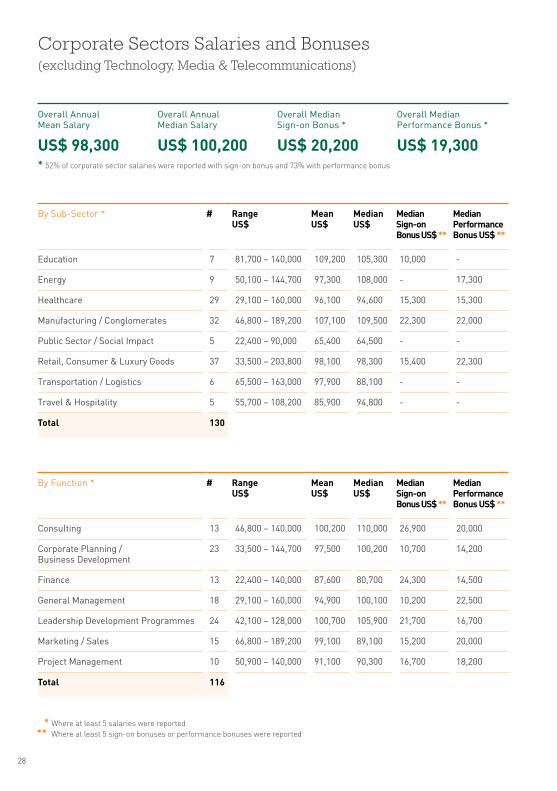
Corporate Sectors Salaries and Bonuses (excluding Technology, Media & Telecommunications)
* Where at least 5 salaries were reported ** Where at least 5 sign-on bonuses or performance bonuses were reported
Overall Annual Mean Salary
US$ 98,300
Overall Annual Median Salary
US$ 100,200
Overall Median Sign-on Bonus *
US$ 20,200
Overall Median Performance Bonus *
US$ 19,300* 52% of corporate sector salaries were reported with sign-on bonus and 73% with performance bonus
By Sub-Sector * # Range US$
Mean US$
Median US$
Median Sign-on Bonus US$ **
Median Performance Bonus US$ **
Education 7 81,700 – 140,000 109,200 105,300 10,000 -
Energy 9 50,100 – 144,700 97,300 108,000 - 17,300
Healthcare 29 29,100 – 160,000 96,100 94,600 15,300 15,300
Manufacturing / Conglomerates 32 46,800 – 189,200 107,100 109,500 22,300 22,000
Public Sector / Social Impact 5 22,400 – 90,000 65,400 64,500 - -
Retail, Consumer & Luxury Goods 37 33,500 – 203,800 98,100 98,300 15,400 22,300
Transportation / Logistics 6 65,500 – 163,000 97,900 88,100 - -
Travel & Hospitality 5 55,700 – 108,200 85,900 94,800 - -
Total 130
By Function * # Range US$
Mean US$
Median US$
Median Sign-on Bonus US$ **
Median Performance Bonus US$ **
Consulting 13 46,800 – 140,000 100,200 110,000 26,900 20,000
Corporate Planning / Business Development
23 33,500 – 144,700 97,500 100,200 10,700 14,200
Finance 13 22,400 – 140,000 87,600 80,700 24,300 14,500
General Management 18 29,100 – 160,000 94,900 100,100 10,200 22,500
Leadership Development Programmes 24 42,100 – 128,000 100,700 105,900 21,700 16,700
Marketing / Sales 15 66,800 – 189,200 99,100 89,100 15,200 20,000
Project Management 10 50,900 – 140,000 91,100 90,300 16,700 18,200
Total 116
* Where at least 5 salaries were reported ** Where at least 5 sign-on bonuses or performance bonuses were reported
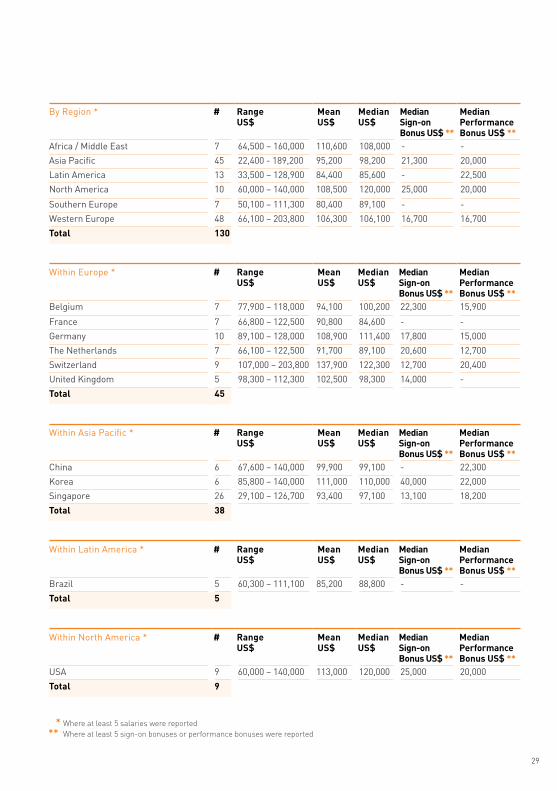
By Region * # Range US$
Mean US$
Median US$
Median Sign-on Bonus US$ **
Median Performance Bonus US$ **
Africa / Middle East 7 64,500 – 160,000 110,600 108,000 - -
Asia Pacific 45 22,400 - 189,200 95,200 98,200 21,300 20,000
Latin America 13 33,500 – 128,900 84,400 85,600 - 22,500
North America 10 60,000 – 140,000 108,500 120,000 25,000 20,000
Southern Europe 7 50,100 – 111,300 80,400 89,100 - -
Western Europe 48 66,100 – 203,800 106,300 106,100 16,700 16,700
Total 130
Within Europe * # Range US$
Mean US$
Median US$
Median Sign-on Bonus US$ **
Median Performance Bonus US$ **
Belgium 7 77,900 – 118,000 94,100 100,200 22,300 15,900
France 7 66,800 – 122,500 90,800 84,600 - -
Germany 10 89,100 – 128,000 108,900 111,400 17,800 15,000
The Netherlands 7 66,100 – 122,500 91,700 89,100 20,600 12,700
Switzerland 9 107,000 – 203,800 137,900 122,300 12,700 20,400
United Kingdom 5 98,300 – 112,300 102,500 98,300 14,000 -
Total 45
Within Asia Pacific * # Range US$
Mean US$
Median US$
Median Sign-on Bonus US$ **
Median Performance Bonus US$ **
China 6 67,600 – 140,000 99,900 99,100 - 22,300
Korea 6 85,800 – 140,000 111,000 110,000 40,000 22,000
Singapore 26 29,100 – 126,700 93,400 97,100 13,100 18,200
Total 38
Within Latin America * # Range US$
Mean US$
Median US$
Median Sign-on Bonus US$ **
Median Performance Bonus US$ **
Brazil 5 60,300 – 111,100 85,200 88,800 - -
Total 5
Within North America * # Range US$
Mean US$
Median US$
Median Sign-on Bonus US$ **
Median Performance Bonus US$ **
USA 9 60,000 – 140,000 113,000 120,000 25,000 20,000
Total 9
29

Roger Egan IIIMBA’10D
Co-Founder & CEO, RedMart
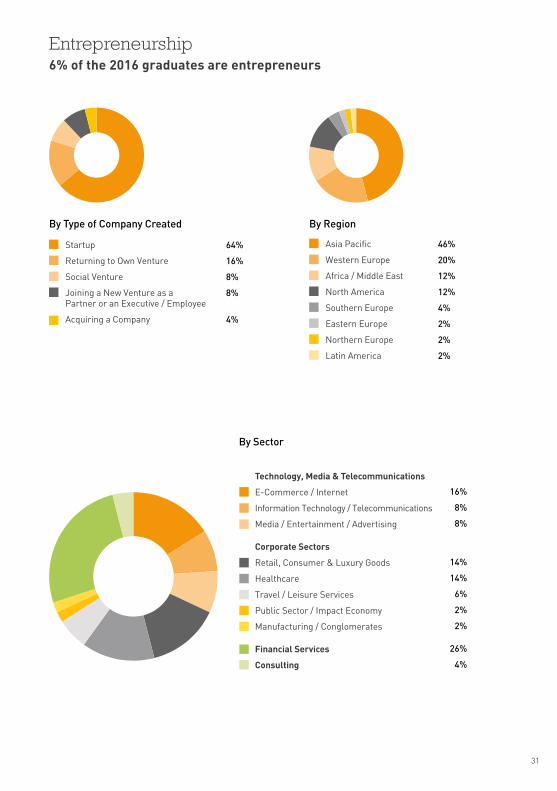
64+16+8+8+4+xEntrepreneurship6% of the 2016 graduates are entrepreneurs
By Type of Company Created
Startup
Returning to Own Venture
Social Venture
Joining a New Venture as a Partner or an Executive / Employee
Acquiring a Company
64%
16%
8%
8%
4%
Technology, Media & Telecommunications
E-Commerce / Internet
Information Technology / Telecommunications
Media / Entertainment / Advertising
Corporate Sectors
Retail, Consumer & Luxury Goods
Healthcare
Travel / Leisure Services
Public Sector / Impact Economy
Manufacturing / Conglomerates
Financial Services
Consulting
16%
8%
8%
14%
14%
6%
2%
2%
26%
4%
By Sector
By Region
Asia Pacific
Western Europe
Africa / Middle East
North America
Southern Europe
Eastern Europe
Northern Europe
Latin America
46%
20%
12%
12%
4%
2%
2%
2%
46+20+12+12+4+2+2+2+x
16+8+8+14+14+6+2+2+26+4+x31
32
54+17+10+5+5+9+x48+14+7+6+6+4+3+12+x41+32+9+6+5+4+2+1+x
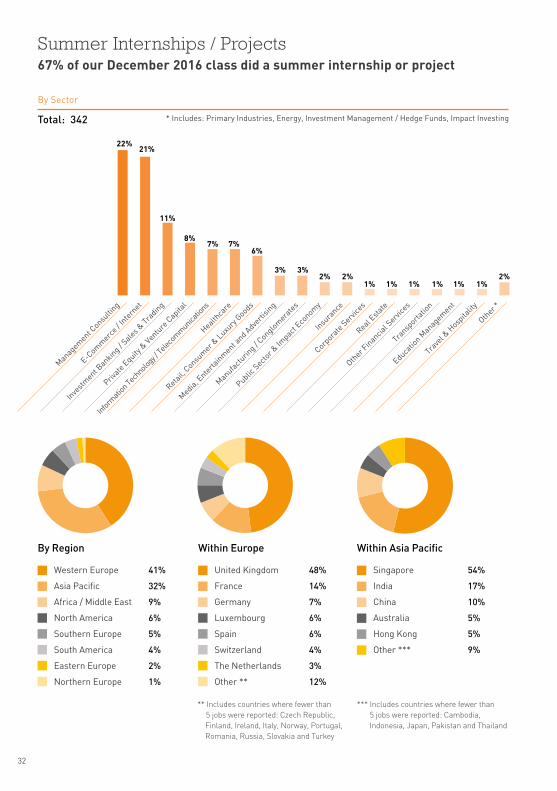
Summer Internships / Projects 67% of our December 2016 class did a summer internship or project
By Sector
Total: 342 * Includes: Primary Industries, Energy, Investment Management / Hedge Funds, Impact Investing
22%21%
11%
8%7% 7%
6%
3% 3%2% 2%
1% 1% 1% 1% 1% 1%2%
Manag
ement C
onsulti
ng
E-Com
merc
e / Inte
rnet
Investm
ent Ban
king / Sale
s & Tra
ding
Privat
e Equity &
Venture
Cap
ital
Informati
on Te
chnolo
gy / T
eleco
mmunicatio
ns
Healthca
re
Retail,
Consum
er & Luxu
ry G
oods
Media, Ente
rtainm
ent and A
dverti
sing
Manufac
turin
g / Conglom
erate
s
Public Secto
r & Im
pact E
conom
y
Insura
nce
Corpora
te Serv
ices
Real Esta
te
Other F
inancia
l Serv
ices
Transp
ortatio
n
Educatio
n Man
agem
ent
Trave
l & H
ospita
lity
Other *
By Region
Western Europe
Asia Pacific
Africa / Middle East
North America
Southern Europe
South America
Eastern Europe
Northern Europe
41%
32%
9%
6%
5%
4%
2%
1%
Within Europe
** Includes countries where fewer than 5 jobs were reported: Czech Republic, Finland, Ireland, Italy, Norway, Portugal, Romania, Russia, Slovakia and Turkey
Within Asia Pacific
United Kingdom
France
Germany
Luxembourg
Spain
Switzerland
The Netherlands
Other **
48%
14%
7%
6%
6%
4%
3%
12%
Singapore
India
China
Australia
Hong Kong
Other ***
54%
17%
10%
5%
5%
9%
*** Includes countries where fewer than 5 jobs were reported: Cambodia, Indonesia, Japan, Pakistan and Thailand
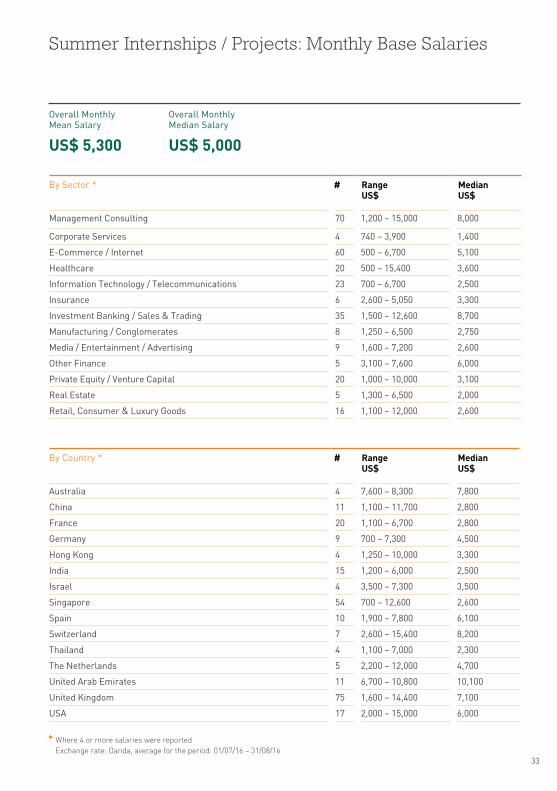
Summer Internships / Projects: Monthly Base Salaries
* Where 4 or more salaries were reported Exchange rate: Oanda, average for the period: 01/07/16 – 31/08/16
Overall Monthly Mean Salary
US$ 5,300
Overall Monthly Median Salary
US$ 5,000
By Sector * # Range US$
Median US$
Management Consulting 70 1,200 – 15,000 8,000
Corporate Services 4 740 – 3,900 1,400
E-Commerce / Internet 60 500 – 6,700 5,100
Healthcare 20 500 – 15,400 3,600
Information Technology / Telecommunications 23 700 – 6,700 2,500
Insurance 6 2,600 – 5,050 3,300
Investment Banking / Sales & Trading 35 1,500 – 12,600 8,700
Manufacturing / Conglomerates 8 1,250 – 6,500 2,750
Media / Entertainment / Advertising 9 1,600 – 7,200 2,600
Other Finance 5 3,100 – 7,600 6,000
Private Equity / Venture Capital 20 1,000 – 10,000 3,100
Real Estate 5 1,300 – 6,500 2,000
Retail, Consumer & Luxury Goods 16 1,100 – 12,000 2,600
By Country * # Range US$
Median US$
Australia 4 7,600 – 8,300 7,800
China 11 1,100 – 11,700 2,800
France 20 1,100 – 6,700 2,800
Germany 9 700 – 7,300 4,500
Hong Kong 4 1,250 – 10,000 3,300
India 15 1,200 – 6,000 2,500
Israel 4 3,500 – 7,300 3,500
Singapore 54 700 – 12,600 2,600
Spain 10 1,900 – 7,800 6,100
Switzerland 7 2,600 – 15,400 8,200
Thailand 4 1,100 – 7,000 2,300
The Netherlands 5 2,200 – 12,000 4,700
United Arab Emirates 11 6,700 – 10,800 10,100
United Kingdom 75 1,600 – 14,400 7,100
USA 17 2,000 – 15,000 6,000
33
Vikram RupaniMBA’10D
Co-Founder & President, RedMart
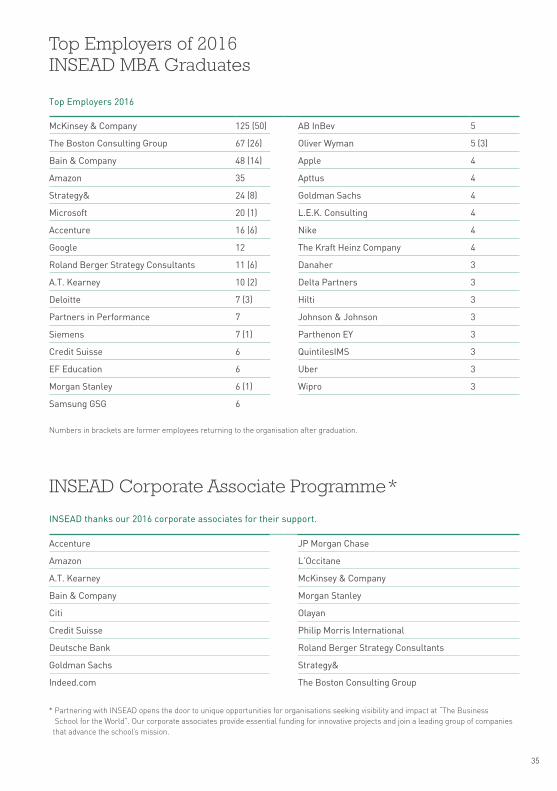
Top Employers of 2016 INSEAD MBA Graduates
Numbers in brackets are former employees returning to the organisation after graduation.
Top Employers 2016
McKinsey & Company 125 (50) AB InBev 5
The Boston Consulting Group 67 (26) Oliver Wyman 5 (3)
Bain & Company 48 (14) Apple 4
Amazon 35 Apttus 4
Strategy& 24 (8) Goldman Sachs 4
Microsoft 20 (1) L.E.K. Consulting 4
Accenture 16 (6) Nike 4
Google 12 The Kraft Heinz Company 4
Roland Berger Strategy Consultants 11 (6) Danaher 3
A.T. Kearney 10 (2) Delta Partners 3
Deloitte 7 (3) Hilti 3
Partners in Performance 7 Johnson & Johnson 3
Siemens 7 (1) Parthenon EY 3
Credit Suisse 6 QuintilesIMS 3
EF Education 6 Uber 3
Morgan Stanley 6 (1) Wipro 3
Samsung GSG 6
INSEAD Corporate Associate Programme*
INSEAD thanks our 2016 corporate associates for their support.
Accenture JP Morgan Chase
Amazon L’Occitane
A.T. Kearney McKinsey & Company
Bain & Company Morgan Stanley
Citi Olayan
Credit Suisse Philip Morris International
Deutsche Bank Roland Berger Strategy Consultants
Goldman Sachs Strategy&
Indeed.com The Boston Consulting Group
* Partnering with INSEAD opens the door to unique opportunities for organisations seeking visibility and impact at “The Business School for the World”. Our corporate associates provide essential funding for innovative projects and join a leading group of companies that advance the school’s mission.
35
36
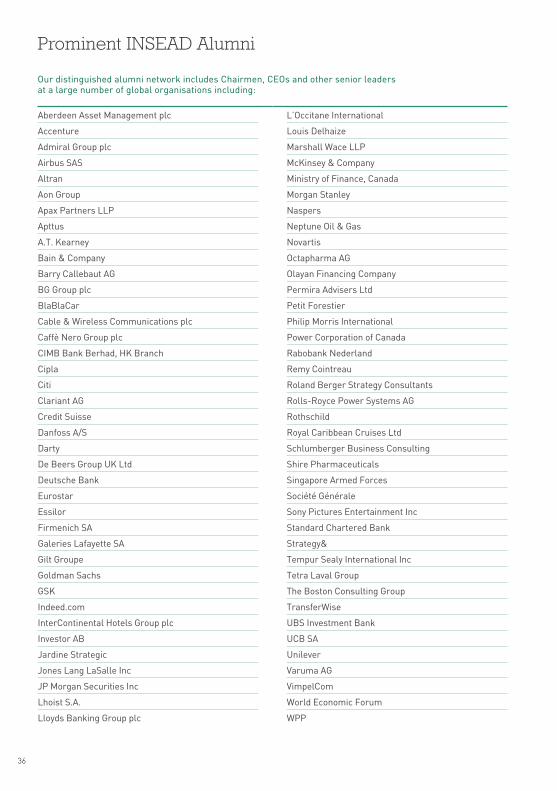
Prominent INSEAD Alumni
Our distinguished alumni network includes Chairmen, CEOs and other senior leadersat a large number of global organisations including:
Aberdeen Asset Management plc L’Occitane International
Accenture Louis Delhaize
Admiral Group plc Marshall Wace LLP
Airbus SAS McKinsey & Company
Altran Ministry of Finance, Canada
Aon Group Morgan Stanley
Apax Partners LLP Naspers
Apttus Neptune Oil & Gas
A.T. Kearney Novartis
Bain & Company Octapharma AG
Barry Callebaut AG Olayan Financing Company
BG Group plc Permira Advisers Ltd
BlaBlaCar Petit Forestier
Cable & Wireless Communications plc Philip Morris International
Caffè Nero Group plc Power Corporation of Canada
CIMB Bank Berhad, HK Branch Rabobank Nederland
Cipla Remy Cointreau
Citi Roland Berger Strategy Consultants
Clariant AG Rolls-Royce Power Systems AG
Credit Suisse Rothschild
Danfoss A/S Royal Caribbean Cruises Ltd
Darty Schlumberger Business Consulting
De Beers Group UK Ltd Shire Pharmaceuticals
Deutsche Bank Singapore Armed Forces
Eurostar Société Générale
Essilor Sony Pictures Entertainment Inc
Firmenich SA Standard Chartered Bank
Galeries Lafayette SA Strategy&
Gilt Groupe Tempur Sealy International Inc
Goldman Sachs Tetra Laval Group
GSK The Boston Consulting Group
Indeed.com TransferWise
InterContinental Hotels Group plc UBS Investment Bank
Investor AB UCB SA
Jardine Strategic Unilever
Jones Lang LaSalle Inc Varuma AG
JP Morgan Securities Inc VimpelCom
Lhoist S.A. World Economic Forum
Lloyds Banking Group plc WPP
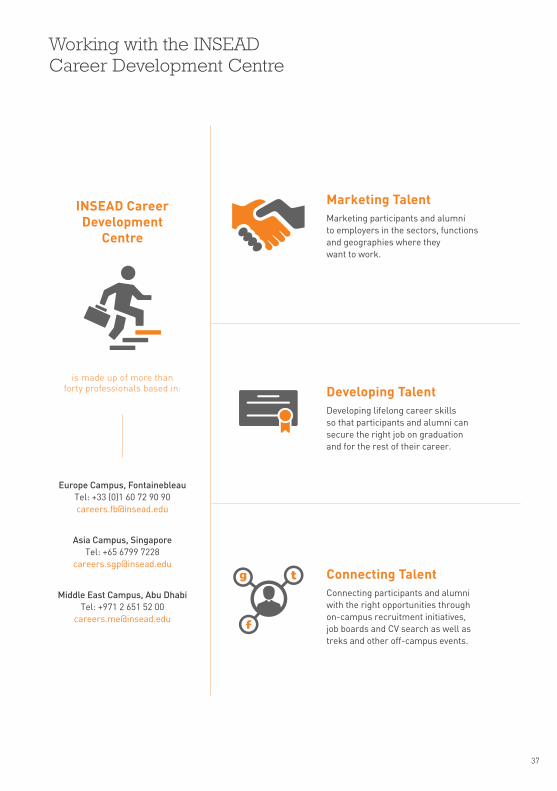
Working with the INSEAD Career Development Centre
INSEAD CareerDevelopment
Centre
is made up of more than forty professionals based in:
Asia Campus, SingaporeTel: +65 6799 7228
Europe Campus, Fontainebleau Tel: +33 (0)1 60 72 90 90 [email protected]
Middle East Campus, Abu Dhabi Tel: +971 2 651 52 00
Marketing TalentMarketing participants and alumni to employers in the sectors, functions and geographies where they want to work.
Developing TalentDeveloping lifelong career skills so that participants and alumni can secure the right job on graduation and for the rest of their career.
Connecting TalentConnecting participants and alumni with the right opportunities through on-campus recruitment initiatives, job boards and CV search as well as treks and other off-campus events.
37
38
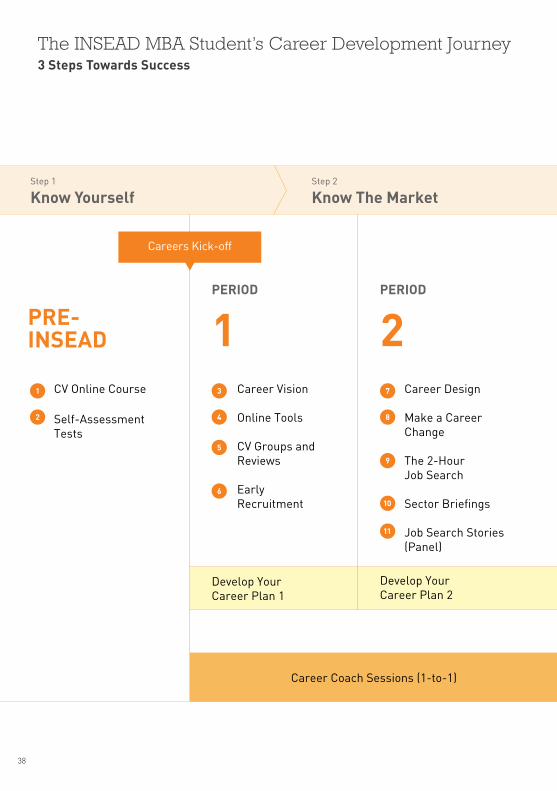
The INSEAD MBA Student’s Career Development Journey3 Steps Towards Success
Step 1
Know Yourself
Careers Kick-off
PRE-INSEAD
1 3 7
4 8
5
9
6
10
11
2
PERIOD
1PERIOD
2Career Vision
Online Tools
CV Groups and Reviews
Early Recruitment
Career Design
Make a Career Change
The 2-Hour Job Search
Sector Briefings
Job Search Stories (Panel)
Develop Your Career Plan 1
Develop Your Career Plan 2
Career Coach Sessions (1-to-1)
Step 2
Know The Market
CV Online Course Self-Assessment Tests
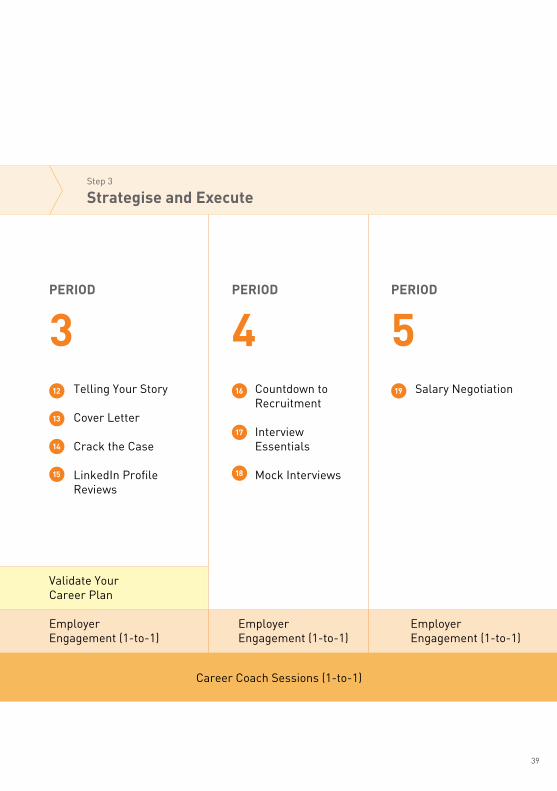
PERIOD
3PERIOD
4PERIOD
5Telling Your Story
Cover Letter
Crack the Case
LinkedIn Profile Reviews
Countdown to Recruitment
Interview Essentials
Mock Interviews
Salary Negotiation
Validate Your Career Plan
Career Coach Sessions (1-to-1)
Step 3
Strategise and Execute
Employer Engagement (1-to-1)
Employer Engagement (1-to-1)
Employer Engagement (1-to-1)
12 16 19
14
18
17
13
15
39

Sarah WillersdorfMBA’05D
CMO, Diane Von Furstenberg
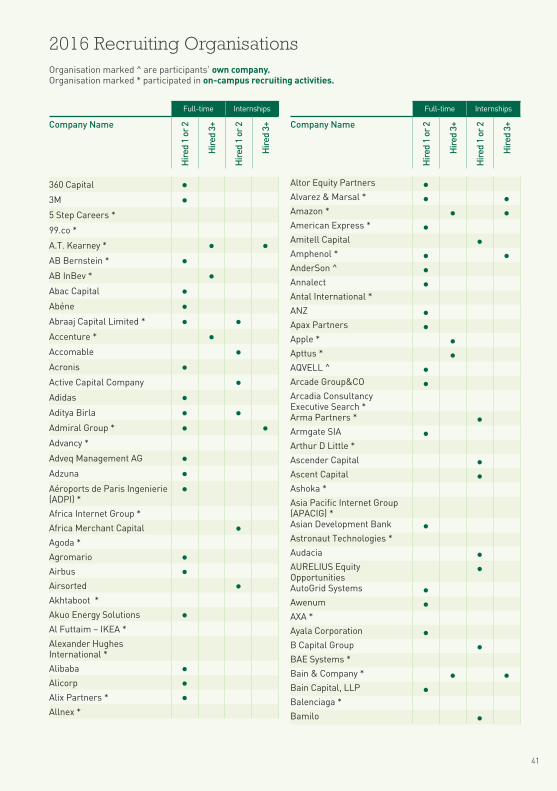
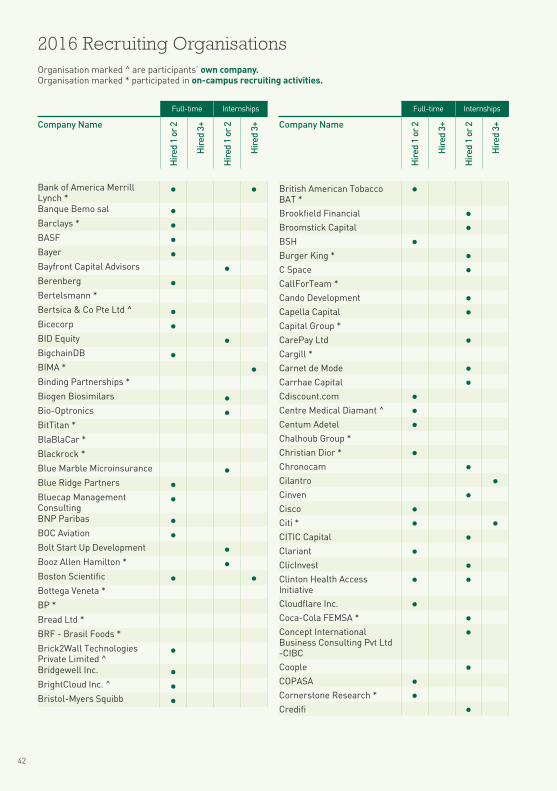
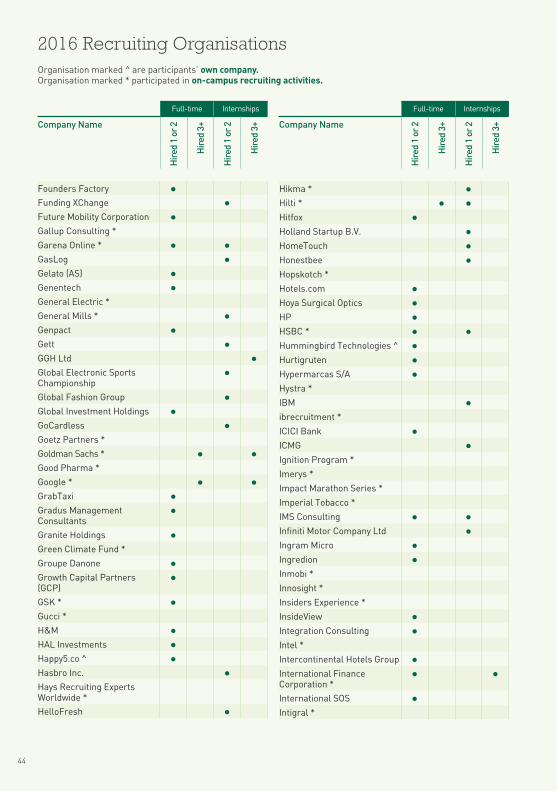
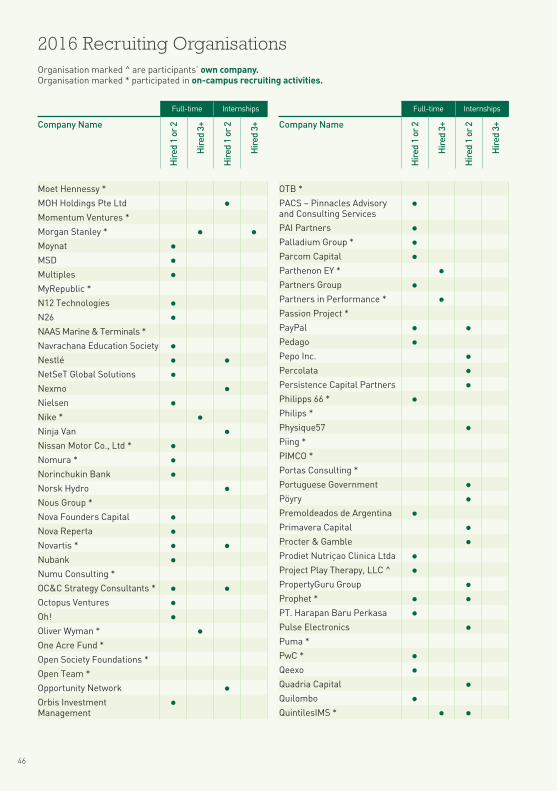
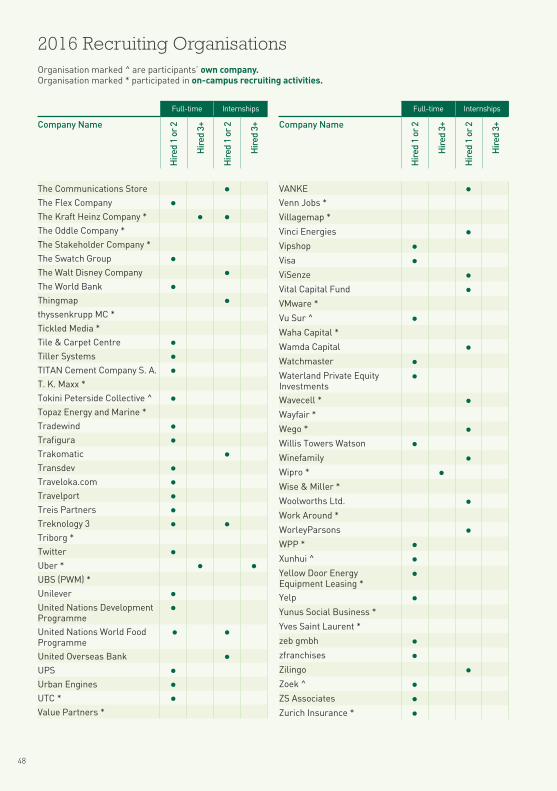
2016 Recruiting OrganisationsOrganisation marked ^ are participants’ own company.Organisation marked * participated in on-campus recruiting activities.
Full-time Internships
Company Name
Hire
d 1
or 2
Hire
d 3+
Hire
d 1
or 2
Hire
d 3+
360 Capital • 3M • 5 Step Careers * 99.co * A.T. Kearney * • •AB Bernstein * • AB InBev * • Abac Capital • Abéne • Abraaj Capital Limited * • • Accenture * • Accomable • Acronis • Active Capital Company • Adidas • Aditya Birla • • Admiral Group * • •Advancy * Adveq Management AG • Adzuna • Aéroports de Paris Ingenierie (ADPI) *
•
Africa Internet Group * Africa Merchant Capital • Agoda * Agromario • Airbus • Airsorted • Akhtaboot * Akuo Energy Solutions • Al Futtaim – IKEA *
Alexander Hughes International *
Alibaba • Alicorp • Alix Partners * • Allnex *
Altor Equity Partners •Alvarez & Marsal * • •Amazon * • •American Express * • Amitell Capital • Amphenol * • •AnderSon ^ • Annalect • Antal International * ANZ • Apax Partners • Apple * • Apttus * • AQVELL ^ • Arcade Group&CO • Arcadia Consultancy Executive Search *
Arma Partners * • Armgate SIA • Arthur D Little * Ascender Capital • Ascent Capital • Ashoka * Asia Pacific Internet Group (APACIG) *
Asian Development Bank • Astronaut Technologies * Audacia • AURELIUS Equity Opportunities
• AutoGrid Systems • Awenum • AXA * Ayala Corporation • B Capital Group • BAE Systems * Bain & Company * • •Bain Capital, LLP • Balenciaga * Bamilo •
Full-time Internships
Company Name
Hire
d 1
or 2
Hire
d 3+
Hire
d 1
or 2
Hire
d 3+
41
42
Organisation marked ^ are participants’ own company.Organisation marked * participated in on-campus recruiting activities.
2016 Recruiting Organisations
Bank of America Merrill Lynch *
• •Banque Bemo sal • Barclays * • BASF • Bayer •Bayfront Capital Advisors • Berenberg • Bertelsmann * Bertsica & Co Pte Ltd ^ • Bicecorp • BID Equity • BigchainDB • BIMA * •Binding Partnerships * Biogen Biosimilars • Bio-Optronics • BitTitan * BlaBlaCar * Blackrock * Blue Marble Microinsurance • Blue Ridge Partners • Bluecap Management Consulting
• BNP Paribas • BOC Aviation • Bolt Start Up Development • Booz Allen Hamilton * • Boston Scientific • •Bottega Veneta * BP * Bread Ltd * BRF - Brasil Foods * Brick2Wall Technologies Private Limited ^
• Bridgewell Inc. • BrightCloud Inc. ^ • Bristol-Myers Squibb •
British American Tobacco BAT *
•
Brookfield Financial • Broomstick Capital • BSH • Burger King * • C Space • CallForTeam * Cando Development • Capella Capital • Capital Group *CarePay Ltd • Cargill * Carnet de Mode • Carrhae Capital • Cdiscount.com • Centre Medical Diamant ^ • Centum Adetel • Chalhoub Group * Christian Dior * • Chronocam • Cilantro •Cinven • Cisco • Citi * • •CITIC Capital • Clariant • ClicInvest • Clinton Health Access Initiative
• •
Cloudflare Inc. • Coca-Cola FEMSA * • Concept International Business Consulting Pvt Ltd -CIBC
•
Coople • COPASA • Cornerstone Research * • Credifi •
Full-time Internships
Company Name
Hire
d 1
or 2
Hire
d 3+
Hire
d 1
or 2
Hire
d 3+
Full-time Internships
Company Name
Hire
d 1
or 2
Hire
d 3+
Hire
d 1
or 2
Hire
d 3+
Credit Suisse * • •Credo Ventures • Cresco Data * CRH • Cultavo ^ • Cummins • Custora • Dabur International * Dalberg * • Danaher * • Dasym • Data1000 • DaVita * • DayBreak Hotel * Deliveroo • Delivery Club •Deloitte * • •Delta Partners * • • Desigual * Detur • Deutsche Bank * • Deutsche Börse AG • DFS • DHL Consulting * • Discovery Networks Asia Pacific *
• Diwanee Media Group • Docomo Digital * Doctena • DogHero •Double Effect * Double Helix * DPI Partners • Drootoo • Edcon • EDP • Edwards Lifesciences * • EF Education * • eFront *
Egremont International • Eisler Capital • Eli Lilly * • •Emerson * Emirates Group * Emsil Techtrans • Endeavor • Enovos • ENYSI • EQT • ERAMET • Ericsson Management Consulting *
•
Ernst & Young * • Escenomatica SRL • Essence Digital * Essilor • Essmart • Estée Lauder Companies * • Etam Group * Evaneos * Everstone Capital • Every Second Counts • Expedia • • Externado University • Facebook • Falconi • Farallon • Fastned * Fidelity International * •Finalta • Finexkap • Finquest • First Crayon • First Reserve * FMC Technologies • Force Majeure LLC ^ • Forensic Risk Alliance • Fosun Eurasia Capital •
Full-time Internships
Company Name
Hire
d 1
or 2
Hire
d 3+
Hire
d 1
or 2
Hire
d 3+
Full-time Internships
Company Name
Hire
d 1
or 2
Hire
d 3+
Hire
d 1
or 2
Hire
d 3+
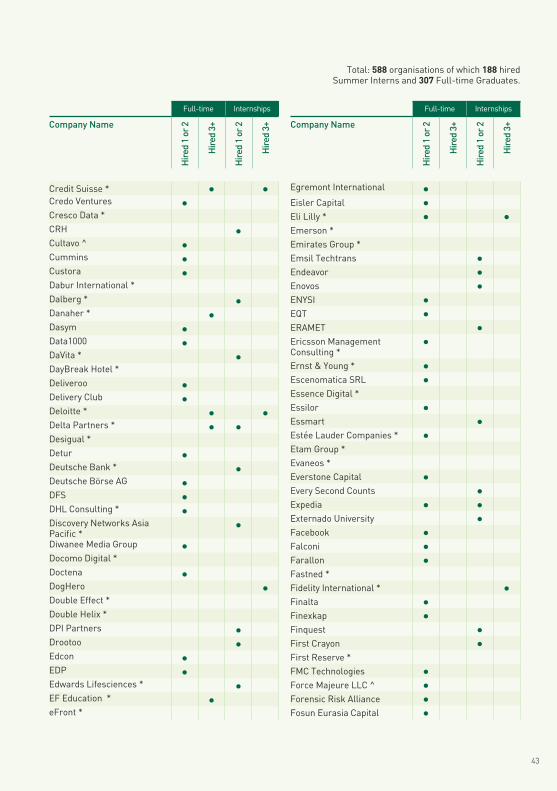
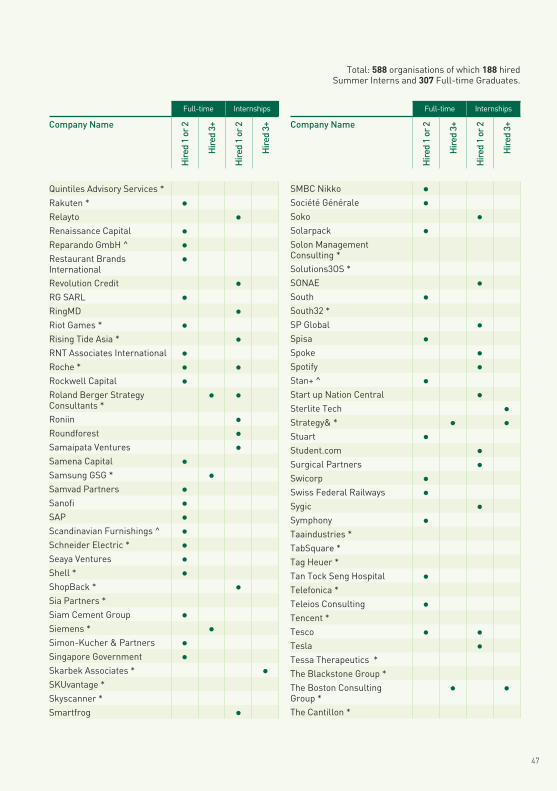
Total: 588 organisations of which 188 hired Summer Interns and 307 Full-time Graduates.
43
44
Organisation marked ^ are participants’ own company.Organisation marked * participated in on-campus recruiting activities.
2016 Recruiting Organisations
Founders Factory • Funding XChange • Future Mobility Corporation • Gallup Consulting * Garena Online * • • GasLog • Gelato (AS) • Genentech • General Electric * General Mills * • Genpact • Gett • GGH Ltd •Global Electronic Sports Championship
•
Global Fashion Group • Global Investment Holdings • GoCardless • Goetz Partners * Goldman Sachs * • •Good Pharma * Google * • •GrabTaxi •Gradus Management Consultants
•
Granite Holdings • Green Climate Fund * Groupe Danone • Growth Capital Partners (GCP)
•
GSK * • Gucci * H&M • HAL Investments • Happy5.co ^ • Hasbro Inc. • Hays Recruiting Experts Worldwide *
HelloFresh •
Hikma * • Hilti * • • Hitfox • Holland Startup B.V. • HomeTouch • Honestbee • Hopskotch * Hotels.com • Hoya Surgical Optics • HP • HSBC * • • Hummingbird Technologies ^ • Hurtigruten • Hypermarcas S/A • Hystra * IBM • ibrecruitment * ICICI Bank • ICMG • Ignition Program * Imerys * Impact Marathon Series * Imperial Tobacco * IMS Consulting • • Infiniti Motor Company Ltd • Ingram Micro • Ingredion • Inmobi *
Innosight * Insiders Experience * InsideView • Integration Consulting • Intel * Intercontinental Hotels Group • International Finance Corporation *
• •
International SOS • Intigral *
Full-time Internships
Company Name
Hire
d 1
or 2
Hire
d 3+
Hire
d 1
or 2
Hire
d 3+
Full-time Internships
Company Name
Hire
d 1
or 2
Hire
d 3+
Hire
d 1
or 2
Hire
d 3+
Investec Asset Management • InvOrOut.com * Itau Unibanco • Jawwy • JD Group * • Johnson & Johnson * • •JP Morgan • • Jumeirah Group * Jungle Ventures • Kaligo • Kantar Health * Karhoo •Kashmi * Kasikorn Bank (PCL) • KE Tech • KEEN Footwear • Kering * Kilpatrick Executive Search * Kimberly Clark * • King * • •Klaxoon * Kois Invest * Konica Minolta * Korvac * KPMG * • Ky Pao School * L.E.K. Consulting * • • La Despensa Natural • Labatec * LaLamove * LAN Airlines •Lazada * •Le Chemiseur * LEGO Group • Lendable • Lider Aviacao S.A. • LIM Advisors • LinkedIn •
Litmus Group * LIV Capital • LM Wind Power • Lokeit ^ • Longlead Capital Partners • L’Oréal * • Loro Piana * Lottoland • Louis Vuitton * • Luxola * Luxottica * LVMH * Maersk Consulting * MagiLink • Magpie Polymers * • Maha Awba • Mango • Mansouri Living • MarketFinance ^ • • Mars & Co • Massena Capital Partners • Mastercard * Mattel • MBA & Company * • McArthur Murray * McKinsey & Company * • •Medallia * MediaMath * Melco Crown Entertainment Limited
•
Mercedes Benz Energy • Mercy Corps * Michel Dyens & Co * Microsoft * • • MidStage Ventures • Millward Brown Vermeer * •Mira Farmaceutici ^ • Mitsubishi Estate Co., Ltd. •
Full-time Internships
Company Name
Hire
d 1
or 2
Hire
d 3+
Hire
d 1
or 2
Hire
d 3+
Full-time Internships
Company Name
Hire
d 1
or 2
Hire
d 3+
Hire
d 1
or 2
Hire
d 3+
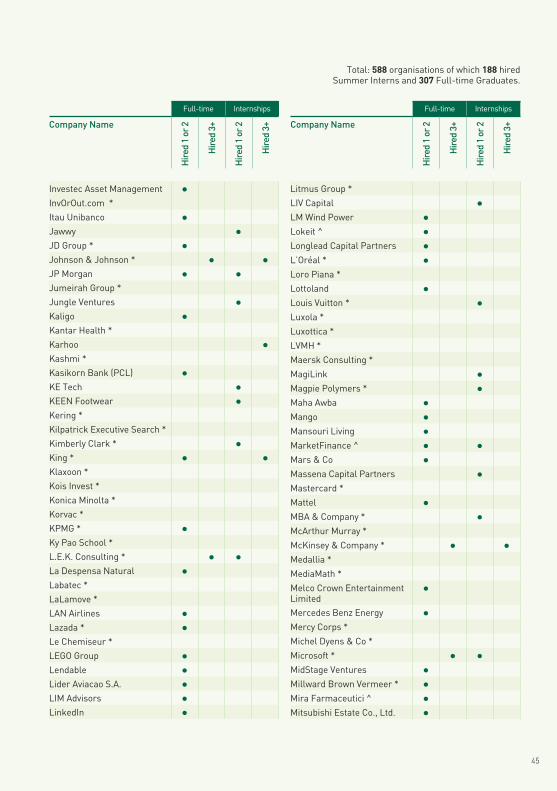
Total: 588 organisations of which 188 hired Summer Interns and 307 Full-time Graduates.
45
46
Organisation marked ^ are participants’ own company.Organisation marked * participated in on-campus recruiting activities.
2016 Recruiting Organisations
Moet Hennessy * MOH Holdings Pte Ltd • Momentum Ventures * Morgan Stanley * • •Moynat • MSD • Multiples • MyRepublic * N12 Technologies • N26 • NAAS Marine & Terminals * Navrachana Education Society • Nestlé • • NetSeT Global Solutions • Nexmo • Nielsen • Nike * • Ninja Van • Nissan Motor Co., Ltd * • Nomura * • Norinchukin Bank • Norsk Hydro • Nous Group * Nova Founders Capital • Nova Reperta • Novartis * • • Nubank • Numu Consulting * OC&C Strategy Consultants * • • Octopus Ventures • Oh! • Oliver Wyman * • One Acre Fund * Open Society Foundations * Open Team * Opportunity Network • Orbis Investment Management
•
OTB * PACS – Pinnacles Advisory and Consulting Services
•
PAI Partners • Palladium Group * • Parcom Capital • Parthenon EY * • Partners Group • Partners in Performance * • Passion Project * PayPal • • Pedago • Pepo Inc. • Percolata • Persistence Capital Partners • Philipps 66 * • Philips * Physique57 • Piing * PIMCO * Portas Consulting * Portuguese Government • Pöyry • Premoldeados de Argentina • Primavera Capital • Procter & Gamble • Prodiet Nutriçao Clinica Ltda • Project Play Therapy, LLC ^ • PropertyGuru Group • Prophet * • • PT. Harapan Baru Perkasa • Pulse Electronics • Puma * PwC * • Qeexo • Quadria Capital • Quilombo • QuintilesIMS * • •
Full-time Internships
Company Name
Hire
d 1
or 2
Hire
d 3+
Hire
d 1
or 2
Hire
d 3+
Full-time Internships
Company Name
Hire
d 1
or 2
Hire
d 3+
Hire
d 1
or 2
Hire
d 3+
Quintiles Advisory Services * Rakuten * • Relayto • Renaissance Capital • Reparando GmbH ^ • Restaurant Brands International
•
Revolution Credit • RG SARL • RingMD • Riot Games * • Rising Tide Asia * • RNT Associates International • Roche * • • Rockwell Capital • Roland Berger Strategy Consultants *
• •
Roniin • Roundforest • Samaipata Ventures • Samena Capital • Samsung GSG * • Samvad Partners • Sanofi • SAP • Scandinavian Furnishings ^ • Schneider Electric * • Seaya Ventures • Shell * • ShopBack * • Sia Partners * Siam Cement Group • Siemens * • Simon-Kucher & Partners • Singapore Government • Skarbek Associates * •SKUvantage * Skyscanner * Smartfrog •
SMBC Nikko • Société Générale • Soko • Solarpack • Solon Management Consulting *
Solutions3OS * SONAE • South • South32 * SP Global •Spisa • Spoke • Spotify • Stan+ ^ • Start up Nation Central • Sterlite Tech •Strategy& * • •Stuart • Student.com • Surgical Partners • Swicorp • Swiss Federal Railways • Sygic • Symphony • Taaindustries * TabSquare * Tag Heuer * Tan Tock Seng Hospital • Telefonica * Teleios Consulting • Tencent * Tesco • • Tesla • Tessa Therapeutics * The Blackstone Group * The Boston Consulting Group *
• •
The Cantillon *
Full-time Internships
Company Name
Hire
d 1
or 2
Hire
d 3+
Hire
d 1
or 2
Hire
d 3+
Full-time Internships
Company Name
Hire
d 1
or 2
Hire
d 3+
Hire
d 1
or 2
Hire
d 3+
Total: 588 organisations of which 188 hired Summer Interns and 307 Full-time Graduates.
47
48
Organisation marked ^ are participants’ own company.Organisation marked * participated in on-campus recruiting activities.
2016 Recruiting Organisations
The Communications Store • The Flex Company • The Kraft Heinz Company * • • The Oddle Company * The Stakeholder Company * The Swatch Group • The Walt Disney Company • The World Bank • Thingmap • thyssenkrupp MC * Tickled Media * Tile & Carpet Centre • Tiller Systems • TITAN Cement Company S. A. •T. K. Maxx * Tokini Peterside Collective ^ • Topaz Energy and Marine * Tradewind • Trafigura • Trakomatic • Transdev • Traveloka.com • Travelport • Treis Partners • Treknology 3 • • Triborg * Twitter • Uber * • •UBS (PWM) * Unilever • United Nations Development Programme
•
United Nations World Food Programme
• •
United Overseas Bank • UPS • Urban Engines • UTC * • Value Partners *
VANKE • Venn Jobs * Villagemap * Vinci Energies • Vipshop • Visa • ViSenze • Vital Capital Fund • VMware * Vu Sur ^ • Waha Capital * Wamda Capital • Watchmaster • Waterland Private Equity Investments
•
Wavecell * • Wayfair * Wego * • Willis Towers Watson •Winefamily • Wipro * • Wise & Miller * Woolworths Ltd. • Work Around * WorleyParsons • WPP * • Xunhui ^ • Yellow Door Energy Equipment Leasing *
•
Yelp • Yunus Social Business * Yves Saint Laurent * zeb gmbh • zfranchises • Zilingo • Zoek ^ • ZS Associates • Zurich Insurance * •
Full-time Internships
Company Name
Hire
d 1
or 2
Hire
d 3+
Hire
d 1
or 2
Hire
d 3+
Full-time Internships
Company Name
Hire
d 1
or 2
Hire
d 3+
Hire
d 1
or 2
Hire
d 3+

Martin TschoppMBA’99D
CEO, Kiva.org
50
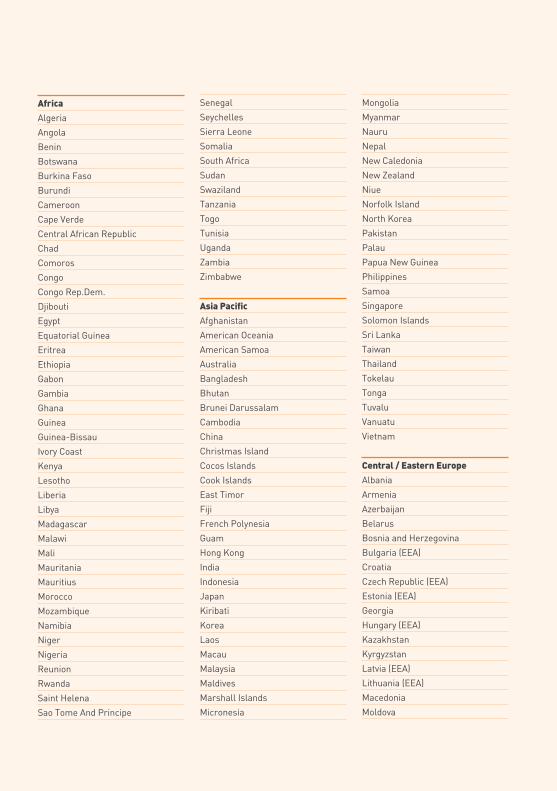
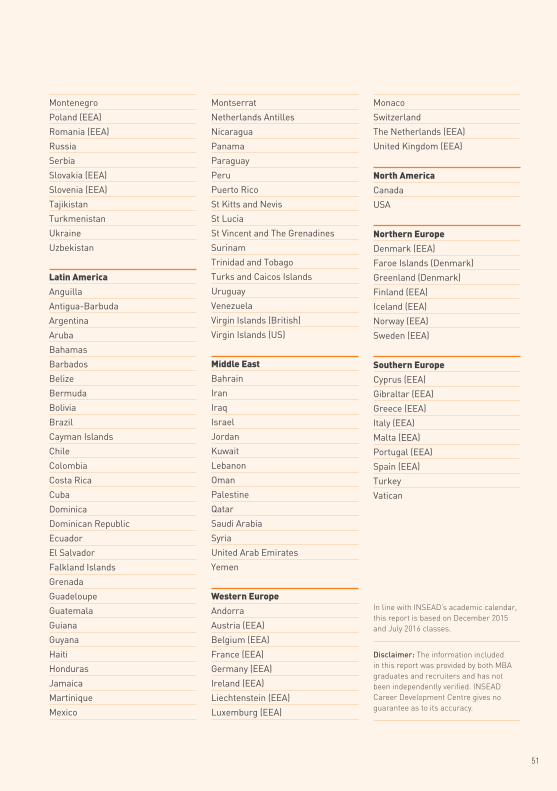
List of countries per region
Africa
Algeria
Angola
Benin
Botswana
Burkina Faso
Burundi
Cameroon
Cape Verde
Central African Republic
Chad
Comoros
Congo
Congo Rep.Dem.
Djibouti
Egypt
Equatorial Guinea
Eritrea
Ethiopia
Gabon
Gambia
Ghana
Guinea
Guinea-Bissau
Ivory Coast
Kenya
Lesotho
Liberia
Libya
Madagascar
Malawi
Mali
Mauritania
Mauritius
Morocco
Mozambique
Namibia
Niger
Nigeria
Reunion
Rwanda
Saint Helena
Sao Tome And Principe
Senegal
Seychelles
Sierra Leone
Somalia
South Africa
Sudan
Swaziland
Tanzania
Togo
Tunisia
Uganda
Zambia
Zimbabwe
Asia Pacific
Afghanistan
American Oceania
American Samoa
Australia
Bangladesh
Bhutan
Brunei Darussalam
Cambodia
China
Christmas Island
Cocos Islands
Cook Islands
East Timor
Fiji
French Polynesia
Guam
Hong Kong
India
Indonesia
Japan
Kiribati
Korea
Laos
Macau
Malaysia
Maldives
Marshall Islands
Micronesia
Mongolia
Myanmar
Nauru
Nepal
New Caledonia
New Zealand
Niue
Norfolk Island
North Korea
Pakistan
Palau
Papua New Guinea
Philippines
Samoa
Singapore
Solomon Islands
Sri Lanka
Taiwan
Thailand
Tokelau
Tonga
Tuvalu
Vanuatu
Vietnam
Central / Eastern Europe
Albania
Armenia
Azerbaijan
Belarus
Bosnia and Herzegovina
Bulgaria (EEA)
Croatia
Czech Republic (EEA)
Estonia (EEA)
Georgia
Hungary (EEA)
Kazakhstan
Kyrgyzstan
Latvia (EEA)
Lithuania (EEA)
Macedonia
Moldova
Montenegro
Poland (EEA)
Romania (EEA)
Russia
Serbia
Slovakia (EEA)
Slovenia (EEA)
Tajikistan
Turkmenistan
Ukraine
Uzbekistan
Latin America
Anguilla
Antigua-Barbuda
Argentina
Aruba
Bahamas
Barbados
Belize
Bermuda
Bolivia
Brazil
Cayman Islands
Chile
Colombia
Costa Rica
Cuba
Dominica
Dominican Republic
Ecuador
El Salvador
Falkland Islands
Grenada
Guadeloupe
Guatemala
Guiana
Guyana
Haiti
Honduras
Jamaica
Martinique
Mexico
Montserrat
Netherlands Antilles
Nicaragua
Panama
Paraguay
Peru
Puerto Rico
St Kitts and Nevis
St Lucia
St Vincent and The Grenadines
Surinam
Trinidad and Tobago
Turks and Caicos Islands
Uruguay
Venezuela
Virgin Islands (British)
Virgin Islands (US)
Middle East
Bahrain
Iran
Iraq
Israel
Jordan
Kuwait
Lebanon
Oman
Palestine
Qatar
Saudi Arabia
Syria
United Arab Emirates
Yemen
Western Europe
Andorra
Austria (EEA)
Belgium (EEA)
France (EEA)
Germany (EEA)
Ireland (EEA)
Liechtenstein (EEA)
Luxemburg (EEA)
Monaco
Switzerland
The Netherlands (EEA)
United Kingdom (EEA)
North America
Canada
USA
Northern Europe
Denmark (EEA)
Faroe Islands (Denmark)
Greenland (Denmark)
Finland (EEA)
Iceland (EEA)
Norway (EEA)
Sweden (EEA)
Southern Europe
Cyprus (EEA)
Gibraltar (EEA)
Greece (EEA)
Italy (EEA)
Malta (EEA)
Portugal (EEA)
Spain (EEA)
Turkey
Vatican
In line with INSEAD’s academic calendar, this report is based on December 2015 and July 2016 classes.
Disclaimer: The information included in this report was provided by both MBA graduates and recruiters and has not been independently verified. INSEAD Career Development Centre gives no guarantee as to its accuracy.
51
INSEAD Europe CampusBoulevard de Constance77305 Fontainebleau, FranceTel: +33 (0)1 60 72 41 90
INSEAD Asia Campus1 Ayer Rajah AvenueSingapore 138676Tel: +65 6799 5190
INSEAD Middle East Campus4th Street - Muroor RoadP.O. Box 48049Abu Dhabi, United Arab EmiratesTel: +971 2 651 5200
www.insead.edu © IN
SEA
D 2
016
- 20
17