Embed Size (px)
Citation preview
Employmentand Labour Market Policies Branch
EmploymEnt Working Paper No. 185
Employment policy Department
2015
Bishwanath Goldar Amit Sadhukhan
Employment and wages in Indian manufacturing: Post-reform performance
Empl
oym
Ent
Employment Policy Department EMPLOYMENT Working Paper No. 185
2015
Employment and wages in Indian manufacturing: Post-reform performance
Bishwanath Goldar and Amit Sadhukhan
Employment and Labour Market Policies Branch
Copyright © International Labour Organization 2015
First published 2015
Publications of the International Labour Office enjoy copyright under Protocol 2 of the Universal Copyright Convention. Nevertheless, short
excerpts from them may be reproduced without authorization, on condition that the source is indicated. For rights of reproduction or translation, application should be made to ILO Publications (Rights and Permissions), International Labour Office, CH-1211 Geneva 22,
Switzerland, or by email: [email protected]. The International Labour Office welcomes such applications.
Libraries, institutions and other users registered with reproduction rights organizations may make copies in accordance with the licences issued to them for this purpose. Visit http://www.ifrro.org to find the reproduction rights organization in your country.
ILO Cataloguing in Publication Data Goldar, Bishwanath; Sadhukhan, Amit
Employment and wages in Indian manufacturing : post-reform performance / Bishwanath Goldar and Amit Sadhukhan ; International Labour
Office, Employment Policy Department, Employment and Labour Market Policies Branch. - Geneva: ILO, 2015 (Employment working paper ; No. 185)
ISSN 1999-2939 (print); ISSN 1999-2947 (web pdf)
International Labour Office Employment Policy Dept.
labour market analysis / employment / wages / manufacturing / economic reform / labour productivity / wage differential / trend / India
13.01.1
The designations employed in ILO publications, which are in conformity with United Nations practice, and the presentation of material therein do not imply the expression of any opinion whatsoever on the part of the International Labour Office concerning the legal status of
any country, area or territory or of its authorities, or concerning the delimitation of its frontiers.
The responsibility for opinions expressed in signed articles, studies and other contributions rests solely with their authors, and publication does not constitute an endorsement by the International Labour Office of the opinions expressed in them.
Reference to names of firms and commercial products and processes does not imply their endorsement by the International Labour Office,
and any failure to mention a particular firm, commercial product or process is not a sign of disapproval.
ILO publications and electronic products can be obtained through major booksellers or ILO local offices in many countries, or direct from
ILO Publications, International Labour Office, CH-1211 Geneva 22, Switzerland. Catalogues or lists of new publications are available free
of charge from the above address, or by email: [email protected]
Visit our website: http://www.ilo.org/publns
Printed by the ILO, Geneva, Switzerland
iii
Preface
The primary goal of the ILO is to work with member States towards achieving full and
productive employment and decent work for all. This goal is elaborated in the ILO
Declaration 2008 on Social Justice for a Fair Globalization,1 which has been widely
adopted by the international community. Comprehensive and integrated perspectives to
achieve this goal are embedded in the Employment Policy Convention of 1964 (No. 122),
the Global Employment Agenda (2003) and – in response to the 2008 global economic
crisis – the Global Jobs Pact (2009) and the conclusions of the Recurrent Discussion
Reports on Employment (2010 and 2014).
The Employment Policy Department (EMPLOYMENT) is engaged in global
advocacy and in supporting member States in placing more and better jobs at the center of
economic and social policies and growth and development strategies. Policy research and
knowledge generation and dissemination are essential components of the Employment
Policy Department’s activities. The resulting publications include books, country policy
reviews, policy and research briefs, and working papers. 2
The Employment Policy Working Paper series is designed to disseminate the main
findings of research on a broad range of topics undertaken by the branches of the
Department. The working papers are intended to encourage the exchange of ideas and to
stimulate debate. The views expressed within them are the responsibility of the authors and
do not necessarily represent those of the ILO.
Azita Berar Awad
Director
Employment Policy Department

v
Foreword
This work is a contribution to the Employment Policy Department’s focus on
employment and growth in G20 developing economies. Much discussion on employment
and growth in developing economies analyses what happens to the manufacturing sector.
Using primary data from India, the authors show that unless we make a distinction between
the organised and unorganised parts of the manufacturing sector, we are unlikely to form
an adequate economy-wide picture of what is happening to employment in the lead
developmental sector. While Indian data permit these calculations, the inability to do
similar assessments for other developing countries puts a serious question mark on the
validity of sectoral growth and employment analysis that cannot make these distinctions.
The notable feature of this paper is that it produces estimates of unorganised and organised
employment in manufacturing at the all India level.
While the organized part of manufacturing has grown at a reasonable pace, it remains
a minority segment of total employment in Indian manufacturing. The unorganised part of
Indian manufacturing constitutes nearly 80 per cent of the country’s manufacturing
employment, and it is in this part of the manufacturing sector that employment growth is
sluggish. It is because of this composition in manufacturing that even a high growth rate of
organised jobs within manufacturing cannot be revealed in total manufacturing sector
employment growth. This is a critical feature of Indian manufacturing.
Nevertheless, there are signs of improvements in the unorganised parts of Indian
manufacturing. The paper shows that while employment growth in unorganised
manufacturing has been quite slow, real wages in this part of Indian manufacturing have
been rising. In other words, structural transformation is taking place within the unorganised
part of Indian manufacturing. This is confirmed by corresponding productivity analysis as
well as shifts in the distribution of workers away from self-employment. Despite the fact
that real wages are rising in both organised and unorganised manufacturing, there is a
decline in wage shares in value added in India.
The authors discuss the role of infrastructural and educational impediments as well as
institutional arrangements in the labour market that constrain manufacturing output.
Further improvements in the employment situation in manufacturing will clearly be
contingent on removing obstacles to output growth in manufacturing.
Iyanatul Islam
Chief
Employment and Labour Market Policies Branch
Employment Policy Department
Acknowledgements
The authors gratefully acknowledge the financial support received from the ILO for
conducting this study. They are sincerely thankful to Prof. Ajit Ghose, Visiting Professor,
Institute for Human Development, New Delhi and Dr Nomaan Majid, ILO for the guidance
and intellectual inputs they received for the study. The paper has benefited greatly from the
comments and suggestions of Dr Ghose and Dr Majid.
B N Goldar
Institute of Economic Growth, New Delhi
Amit Sadhukhan
Institute of Development Studies, Kolkata
vii
Contents
Page
Preface ...................................................................................................................................................... iii
Foreword ................................................................................................................................................... v
Introduction ............................................................................................................................................... 1
1. Data Sources ................................................................................................................................... 2
2. Trends at aggregate level ................................................................................................................ 3
3. Changes in employment and labour productivity: Disaggregated analysis .................................... 7
3.1 Pattern of employment in organized manufacturing ............................................................. 7
3.2 Pattern of employment in aggregate manufacturing ........................................................... 10
3.3. Comparison of organized and unorganized manufacturing ................................................ 14
4. Trends in wages and wage inequalities: Disaggregated analysis .................................................. 19
4.1. Wages and wage inequalities in organized manufacturing ................................................. 20
4.2. Wages and wage inequalities in aggregate manufacturing ................................................. 22
5. Explaining the trends: Employment .............................................................................................. 26
6. Explaining the trends: Wages and wage inequality ...................................................................... 27
7. Conclusion .................................................................................................................................... 29
References ............................................................................................................................................... 31
Annex 1: Product description of 3-digit manufacturing groups according to NIC 1987,
NIC 1998, and NIC 2008 .................................................................................................... 33
Annex 2: Composition of different manufacturing industry clusters and corresponding NICs ......... 39
viii
List of Figures
Figure 1. Employment in manufacturing (‘000s) ..................................................................................... 4
Figure 2. Wage share in gross value added .............................................................................................. 5
List of Tables
Table 1. Growth rates in real GDP, employment and labour productivity,
Indian manufacturing (per cent per annum) .............................................................................. 3
Table 2. Growth rates in real product wage and labour productivity,
Indian manufacturing (per cent per annum) .............................................................................. 6
Table 3. Employment in organized manufacturing (’000s) .................................................................... 8
Table 4. Share of employment in each manufacturing group in aggregate employment
in organized manufacturing (as percentage) ............................................................................. 8
Table 5. Share of contract workers in aggregate workers within each manufacturing group (per cent)10
Table 6. Growth rate in contractual employment (% p.a.) .................................................................... 10
Table 7. Employment in aggregate manufacturing (’000s) .................................................................. 11
Table 8. Share of rural employment in manufacturing industry groups (per cent) .............................. 12
Table 9. Share of women employed by manufacturing industry group (per cent) ................................ 12
Table 10. Distribution of labour by employment status in different manufacturing industry
groups (%) .............................................................................................................................. 13
Table 11. Distribution of labour by educational level in different manufacturing industry
groups (%) ............................................................................................................................... 14
Table 12. Distribution of employment in organized manufacturing, by industry ................................... 15
Table 13. Distribution of unorganized sector employment by major industry group ............................. 16
Table 14. Trend growth rate in employment, by industry and sub-periods ............................................ 17
Table 15. Growth rates in unregistered manufacturing employment, by industry and
sub-periods (% per annum) ..................................................................................................... 18
Table 16. Growth rate in labour productivity in organized and unorganized manufacturing
(% per annum) ........................................................................................................................ 19
Table 17. Real wage rate in organized manufacturing (in INR, at 2001 prices), by industry group ...... 21
Table 18. Ratio of overall (skilled and unskilled) wage rates by industry group to that of
aggregate organized manufacturing ........................................................................................ 22
Table 19. Skilled-unskilled wage ratio by industry group ...................................................................... 22
Table 20. Average real weekly wage in aggregate manufacturing (in INR, at 2001 prices), by
industry group ......................................................................................................................... 23
Table 21. Disparity between rural and urban wage in various manufacturing industry groups
(rural wage as a percentage of urban wage) ............................................................................ 24
Table 22. Gender wage disparity (female wage as percentage of male wage) by manufacturing
industry group ......................................................................................................................... 24
Table 23. Casual wage as a proportion of regular wage in various manufacturing industry groups as
percentage) .............................................................................................................................. 24
Table 24. Weekly real wage for labour with different educational levels in various manufacturing
industry groups ....................................................................................................................... 25
1
Introduction
The initiation of economic reforms in 1991 was a major watershed in India’s industrial
development. The steps taken in 1991 and the next few years led to the dismantling of most
domestic industrial controls and substantial liberalization of trade. This process of trade
liberalization continued over time and eventually, by around the mid-2000s, almost all
products were freely importable and tariff rates, except for some agricultural products and
certain manufactured items, had been brought down to a low level . How Indian
manufacturing has fared in terms of employment generation and wages in the post-reform
period, i.e., the period after 1991, is the main topic addressed in this study.
At the time the economic reforms began in India, there was an expectation that they
would boost the rate of India’s industrial growth and encourage a more labour-intensive
industrial development, by furthering exports of labour-intensive products. This would
enhance employment generation in manufacturing and give a significant upward push to the
wages of industrial workers, the less educated and less skilled. It was also hoped that with
rapid growth in industrial employment, a significant part of the workers engaged in
agriculture would shift to manufacturing, which would improve their productivity and
income levels. Whether the developments that took place in the post-reform period actually
lived up to expectations, is an interesting question.
Drawing on secondary data, the study focuses primarily on an analysis of trends in
employment and wages in Indian manufacturing, in the post-reform period, followed by an
attempt is then made to explain them. The first section outlines the data sources used for
the study. Section 2 analyses trends in employment, labour productivity and wages in
aggregate, broken down between organized and unorganized manufacturing1 and aggregate
manufacturing. Section 3 provides a detailed breakdown of trends in employment and
labour productivity, while Section 4 carries out a similar analysis of wages and wage
inequality. Sections 5 and 6 attempt to explain the observed trends. The main findings and
conclusions are summarized in Section 7.
1 The ‘organized’ segment of the Indian manufacturing sector comprises all manufacturing units which employ
10 or more workers using electricity, and units which employ 20 or more workers without electricity. The rest
of manufacturing after removing the organised segment from the aggregate manufacturing industry is known as
‘unorganized’ manufacturing. This is a key dichotomy within the Indian manufacturing sector and it is
therefore important to study the two components separately. Based on the definition of organized and
unorganized manufacturing above, there should be no overlap. Despite this, analysis of unorganized
manufacturing survey data in practice does reveal some overlap. Data on unorganized organized manufacturing
obtained from the surveys undertaken by the National Sample Survey Office (NSSO ) includes manufacturing
units that employ 10 or more workers and use power. Chatterjee and Kanbur (2013) have examined this issue
and come to the conclusion that a majority of the units eligible to be covered under organized manufacturing,
are not, in fact, covered by the organized manufacturing survey, but are included under unorganized
manufacturing. Despite this overlap, a typical manufacturing unit in the organized sector is much bigger than a
typical manufacturing unit in the unorganized sector in terms of output, capital stock and employment, and for
this reason the dichotomy still remains important for the purposes of this study.
2
1. Data Sources
This study mainly uses two sources of data. The first is the Annual Survey of
Industries (ASI) published by the Central Statistical Office (CSO), Government of India,
which provides industrial data on an annual basis (Indian fiscal year, i.e. April to March)
for the “organized segment” of the aggregate manufacturing sector.2 The other data source
is the Employment and Unemployment Survey (EUS)3 in the National Sample Survey
(NSS) published by the Indian National Sample Survey Office (NSSO. In addition, data
have been drawn from (a) the National Accounts Statistics published by the Central
Statistical Office and (b) NSS reports of surveys of unorganized manufacturing enterprises
published by the NSSO.
The focus of the study is on the two decades following the economic reforms initiated
in 1991. The analysis presented in the various sections, however, covers slightly different
periods depending on data availability. Some parts of the analysis, which are based on ASI
data, consider the period from 1989 to 2010 to cover the two decades of India’s economic
liberalization. This analysis relates to organized manufacturing, since the ASI covers only
the organized component of manufacturing. Other parts of the analysis consider the entire
manufacturing sector, covering the periods 1993-94 to 2004-05 and 2004-05 to 2011-12.
For this analysis, three major rounds of the EUS have been used: the 50th Round (1993-
94), 61st Round (2004-05), and most recent, the 68th Round (2011-12). In some places, the
results of the 55th round (1999-2000) are used.
The 3-digit level of National Industrial Classifications (NIC): NIC-1987 for the 50th
Round, NIC-1998 for the 61st Round, and NIC-2008 for the 68th Round) is the unit of
product disaggregation used here. The details of these 3-digit products groups for the
manufacturing sector in each round are given in Annex A. These 3-digit product groups
have been further classified into three broad groups that correspond to the level of capital
intensity in the Indian manufacturing sector in 1960: traditionally labour-intensive,
traditionally low capital-intensive and traditionally high capital-intensive. The allocation
into these three groups used cluster analysis applied to the capital-labour ratio of different
three-digit industries in 1960.4 The mean and standard deviation of the capital-labour ratio
in the traditionally labour-intensive manufacturing group (in 1960) were 1.7 and 0.63
respectively; 4.02 and 1.27 for the traditionally low capital-intensive group; and 20.5 and
24.9 for the traditionally high capital-intensive group. The detailed lists of these groups are
given in Annex 2.
The National Accounts Statistics data are mainly used for the computation of labour
productivity and wage share of value added when the organized and unorganized
components of manufacturing are considered together. However, the analysis of labour
productivity and wage share for organized manufacturing alone uses ASI data, while the
analysis of unorganized manufacturing uses unorganized manufacturing survey results.
The rationale for using the various employment and wage indicators and how they
have been constructed from the data sources is discussed in more detail in the respective
sections below.
2 As mentioned earlier, the organized sector units employ 10 or more workers with electrical power or 20 or
more workers without power. These units are registered as “factories” under the Indian Factories Act, 1948, and
thus are subject to various regulations under the Act. 3 The EUS covers both organized and unorganized segments. 4 The data for an early year in India’s development, i.e. 1960 was considered for the purpose of cluster analysis
since the aim was to identify the traditionally labour-intensive and traditionally capital-intensive industries.
3
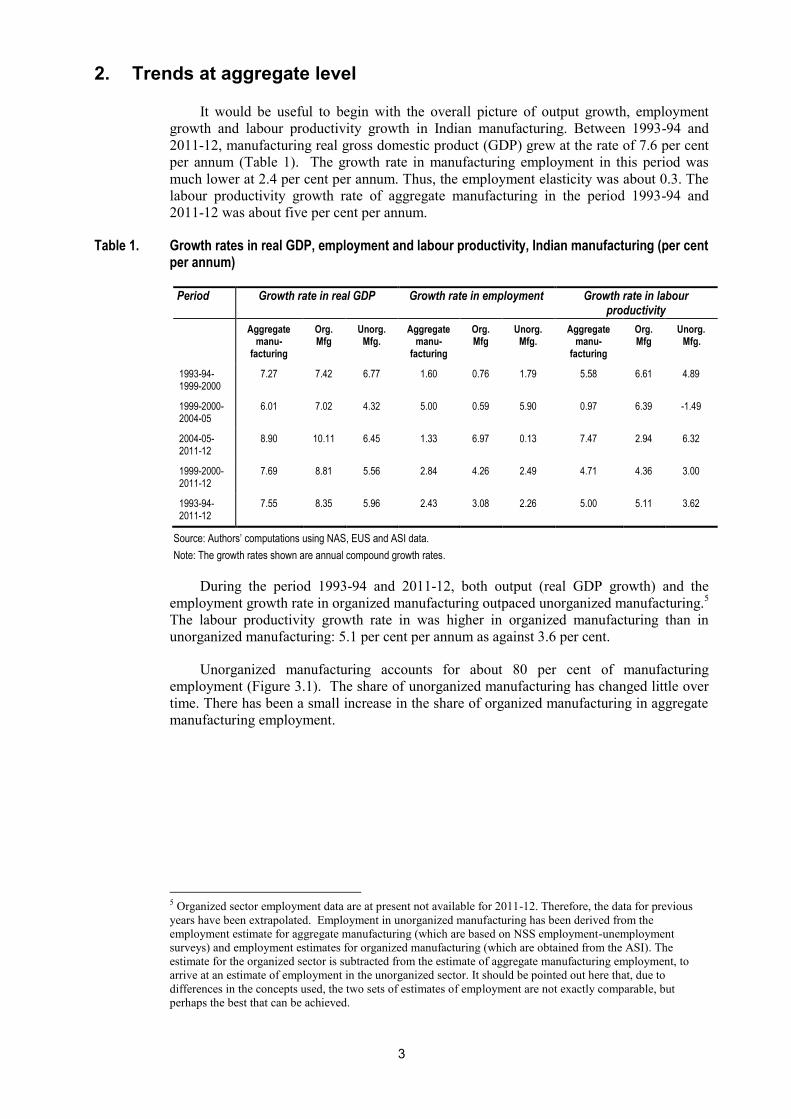
2. Trends at aggregate level
It would be useful to begin with the overall picture of output growth, employment
growth and labour productivity growth in Indian manufacturing. Between 1993-94 and
2011-12, manufacturing real gross domestic product (GDP) grew at the rate of 7.6 per cent
per annum (Table 1). The growth rate in manufacturing employment in this period was
much lower at 2.4 per cent per annum. Thus, the employment elasticity was about 0.3. The
labour productivity growth rate of aggregate manufacturing in the period 1993-94 and
2011-12 was about five per cent per annum.
Table 1. Growth rates in real GDP, employment and labour productivity, Indian manufacturing (per cent per annum)
Period Growth rate in real GDP Growth rate in employment Growth rate in labour productivity
Aggregate manu-
facturing
Org. Mfg
Unorg. Mfg.
Aggregate manu-
facturing
Org. Mfg
Unorg. Mfg.
Aggregate manu-
facturing
Org. Mfg
Unorg. Mfg.
1993-94- 1999-2000
7.27 7.42 6.77 1.60 0.76 1.79 5.58 6.61 4.89
1999-2000- 2004-05
6.01 7.02 4.32 5.00 0.59 5.90 0.97 6.39 -1.49
2004-05- 2011-12
8.90 10.11 6.45 1.33 6.97 0.13 7.47 2.94 6.32
1999-2000- 2011-12
7.69 8.81 5.56 2.84 4.26 2.49 4.71 4.36 3.00
1993-94- 2011-12
7.55 8.35 5.96 2.43 3.08 2.26 5.00 5.11 3.62
Source: Authors’ computations using NAS, EUS and ASI data.
Note: The growth rates shown are annual compound growth rates.
During the period 1993-94 and 2011-12, both output (real GDP growth) and the
employment growth rate in organized manufacturing outpaced unorganized manufacturing.5
The labour productivity growth rate in was higher in organized manufacturing than in
unorganized manufacturing: 5.1 per cent per annum as against 3.6 per cent.
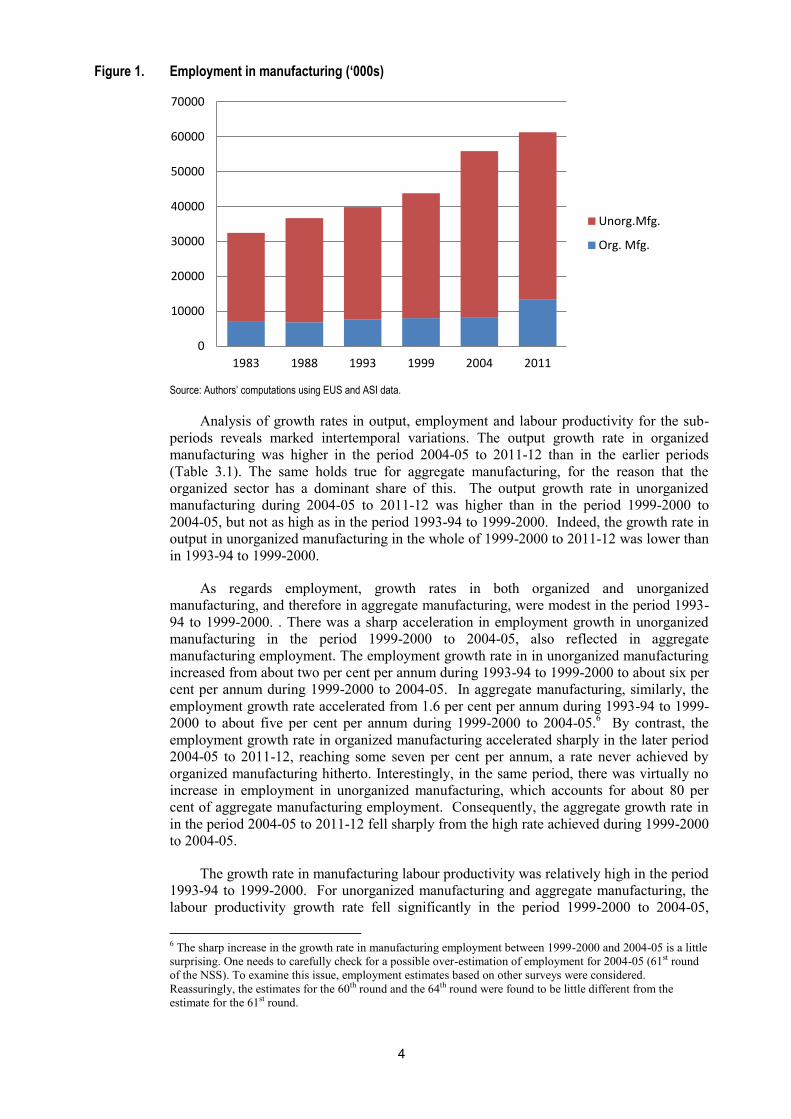
Unorganized manufacturing accounts for about 80 per cent of manufacturing
employment (Figure 3.1). The share of unorganized manufacturing has changed little over
time. There has been a small increase in the share of organized manufacturing in aggregate
manufacturing employment.
5 Organized sector employment data are at present not available for 2011-12. Therefore, the data for previous
years have been extrapolated. Employment in unorganized manufacturing has been derived from the
employment estimate for aggregate manufacturing (which are based on NSS employment-unemployment
surveys) and employment estimates for organized manufacturing (which are obtained from the ASI). The
estimate for the organized sector is subtracted from the estimate of aggregate manufacturing employment, to
arrive at an estimate of employment in the unorganized sector. It should be pointed out here that, due to
differences in the concepts used, the two sets of estimates of employment are not exactly comparable, but
perhaps the best that can be achieved.
4
Figure 1. Employment in manufacturing (‘000s)
Source: Authors’ computations using EUS and ASI data.
Analysis of growth rates in output, employment and labour productivity for the sub-
periods reveals marked intertemporal variations. The output growth rate in organized
manufacturing was higher in the period 2004-05 to 2011-12 than in the earlier periods
(Table 3.1). The same holds true for aggregate manufacturing, for the reason that the
organized sector has a dominant share of this. The output growth rate in unorganized
manufacturing during 2004-05 to 2011-12 was higher than in the period 1999-2000 to
2004-05, but not as high as in the period 1993-94 to 1999-2000. Indeed, the growth rate in
output in unorganized manufacturing in the whole of 1999-2000 to 2011-12 was lower than
in 1993-94 to 1999-2000.
As regards employment, growth rates in both organized and unorganized
manufacturing, and therefore in aggregate manufacturing, were modest in the period 1993-
94 to 1999-2000. . There was a sharp acceleration in employment growth in unorganized
manufacturing in the period 1999-2000 to 2004-05, also reflected in aggregate
manufacturing employment. The employment growth rate in in unorganized manufacturing
increased from about two per cent per annum during 1993-94 to 1999-2000 to about six per
cent per annum during 1999-2000 to 2004-05. In aggregate manufacturing, similarly, the
employment growth rate accelerated from 1.6 per cent per annum during 1993-94 to 1999-
2000 to about five per cent per annum during 1999-2000 to 2004-05.6 By contrast, the
employment growth rate in organized manufacturing accelerated sharply in the later period
2004-05 to 2011-12, reaching some seven per cent per annum, a rate never achieved by
organized manufacturing hitherto. Interestingly, in the same period, there was virtually no
increase in employment in unorganized manufacturing, which accounts for about 80 per
cent of aggregate manufacturing employment. Consequently, the aggregate growth rate in
in the period 2004-05 to 2011-12 fell sharply from the high rate achieved during 1999-2000
to 2004-05.
The growth rate in manufacturing labour productivity was relatively high in the period
1993-94 to 1999-2000. For unorganized manufacturing and aggregate manufacturing, the
labour productivity growth rate fell significantly in the period 1999-2000 to 2004-05,
6 The sharp increase in the growth rate in manufacturing employment between 1999-2000 and 2004-05 is a little
surprising. One needs to carefully check for a possible over-estimation of employment for 2004-05 (61st round
of the NSS). To examine this issue, employment estimates based on other surveys were considered.
Reassuringly, the estimates for the 60th round and the 64th round were found to be little different from the
estimate for the 61st round.
0
10000
20000
30000
40000
50000
60000
70000
1983 1988 1993 1999 2004 2011
Unorg.Mfg.
Org. Mfg.
5
before recovering in the following period, 2004-05 to 2011-12. By contrast, organized
manufacturing achieved a high labour productivity growth during both 1993-94 to 1999-
2000 and 1999-2000 to 2004-05. It was only in the period after 2004-05 that it came down
as the employment growth rate rose to a high level.
The analysis of trends in Table 3.1 above raises two questions. Firstly, why did
employment growth in organized manufacturing accelerate to about seven per cent per
annum in the period after 2004-05 causing labour productivity growth to decelerate
significantly? Secondly, why did employment in unorganized manufacturing accelerate in
the period between 1999 and 2004 when the growth rate in output suffered a slowdown? 7
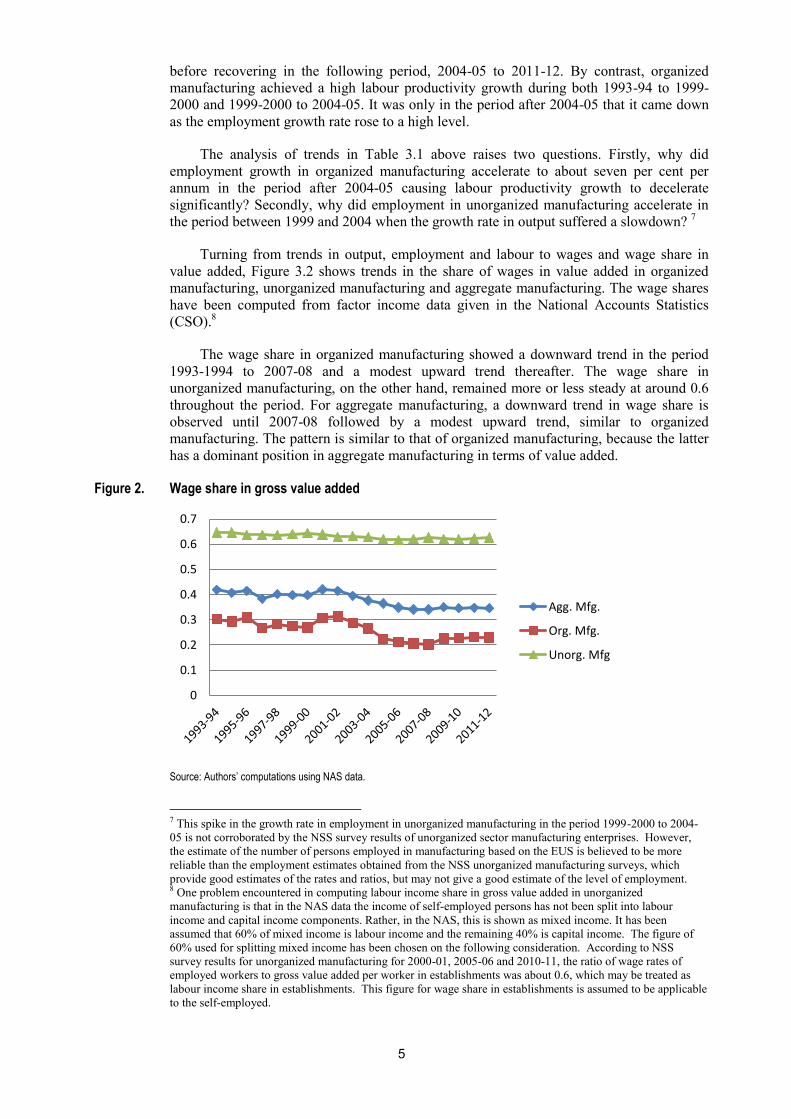
Turning from trends in output, employment and labour to wages and wage share in
value added, Figure 3.2 shows trends in the share of wages in value added in organized
manufacturing, unorganized manufacturing and aggregate manufacturing. The wage shares
have been computed from factor income data given in the National Accounts Statistics
(CSO).8
The wage share in organized manufacturing showed a downward trend in the period
1993-1994 to 2007-08 and a modest upward trend thereafter. The wage share in
unorganized manufacturing, on the other hand, remained more or less steady at around 0.6
throughout the period. For aggregate manufacturing, a downward trend in wage share is
observed until 2007-08 followed by a modest upward trend, similar to organized
manufacturing. The pattern is similar to that of organized manufacturing, because the latter
has a dominant position in aggregate manufacturing in terms of value added.
Figure 2. Wage share in gross value added
Source: Authors’ computations using NAS data.
7 This spike in the growth rate in employment in unorganized manufacturing in the period 1999-2000 to 2004-
05 is not corroborated by the NSS survey results of unorganized sector manufacturing enterprises. However,
the estimate of the number of persons employed in manufacturing based on the EUS is believed to be more
reliable than the employment estimates obtained from the NSS unorganized manufacturing surveys, which
provide good estimates of the rates and ratios, but may not give a good estimate of the level of employment. 8 One problem encountered in computing labour income share in gross value added in unorganized
manufacturing is that in the NAS data the income of self-employed persons has not been split into labour
income and capital income components. Rather, in the NAS, this is shown as mixed income. It has been
assumed that 60% of mixed income is labour income and the remaining 40% is capital income. The figure of
60% used for splitting mixed income has been chosen on the following consideration. According to NSS
survey results for unorganized manufacturing for 2000-01, 2005-06 and 2010-11, the ratio of wage rates of
employed workers to gross value added per worker in establishments was about 0.6, which may be treated as
labour income share in establishments. This figure for wage share in establishments is assumed to be applicable
to the self-employed.
0
0.1
0.2
0.3
0.4
0.5
0.6
0.7
Agg. Mfg.
Org. Mfg.
Unorg. Mfg
6
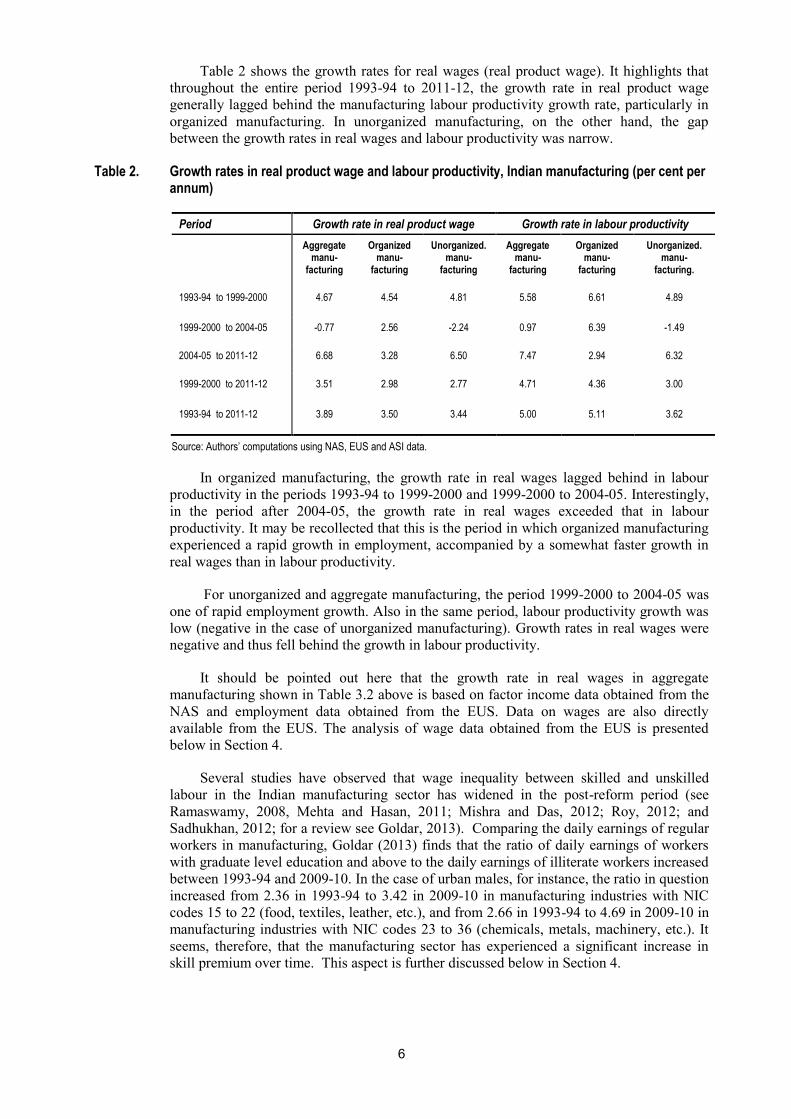
Table 2 shows the growth rates for real wages (real product wage). It highlights that
throughout the entire period 1993-94 to 2011-12, the growth rate in real product wage
generally lagged behind the manufacturing labour productivity growth rate, particularly in
organized manufacturing. In unorganized manufacturing, on the other hand, the gap
between the growth rates in real wages and labour productivity was narrow.
Table 2. Growth rates in real product wage and labour productivity, Indian manufacturing (per cent per annum)
Period Growth rate in real product wage Growth rate in labour productivity
Aggregate manu-
facturing
Organized manu-
facturing
Unorganized. manu-
facturing
Aggregate manu-
facturing
Organized manu-
facturing
Unorganized. manu-
facturing.
1993-94 to 1999-2000 4.67 4.54 4.81 5.58 6.61 4.89
1999-2000 to 2004-05 -0.77 2.56 -2.24 0.97 6.39 -1.49
2004-05 to 2011-12 6.68 3.28 6.50 7.47 2.94 6.32
1999-2000 to 2011-12 3.51 2.98 2.77 4.71 4.36 3.00
1993-94 to 2011-12 3.89 3.50 3.44 5.00 5.11 3.62
Source: Authors’ computations using NAS, EUS and ASI data.
In organized manufacturing, the growth rate in real wages lagged behind in labour
productivity in the periods 1993-94 to 1999-2000 and 1999-2000 to 2004-05. Interestingly,
in the period after 2004-05, the growth rate in real wages exceeded that in labour
productivity. It may be recollected that this is the period in which organized manufacturing
experienced a rapid growth in employment, accompanied by a somewhat faster growth in
real wages than in labour productivity.
For unorganized and aggregate manufacturing, the period 1999-2000 to 2004-05 was
one of rapid employment growth. Also in the same period, labour productivity growth was
low (negative in the case of unorganized manufacturing). Growth rates in real wages were
negative and thus fell behind the growth in labour productivity.
It should be pointed out here that the growth rate in real wages in aggregate
manufacturing shown in Table 3.2 above is based on factor income data obtained from the
NAS and employment data obtained from the EUS. Data on wages are also directly
available from the EUS. The analysis of wage data obtained from the EUS is presented
below in Section 4.
Several studies have observed that wage inequality between skilled and unskilled
labour in the Indian manufacturing sector has widened in the post-reform period (see
Ramaswamy, 2008, Mehta and Hasan, 2011; Mishra and Das, 2012; Roy, 2012; and
Sadhukhan, 2012; for a review see Goldar, 2013). Comparing the daily earnings of regular
workers in manufacturing, Goldar (2013) finds that the ratio of daily earnings of workers
with graduate level education and above to the daily earnings of illiterate workers increased
between 1993-94 and 2009-10. In the case of urban males, for instance, the ratio in question
increased from 2.36 in 1993-94 to 3.42 in 2009-10 in manufacturing industries with NIC
codes 15 to 22 (food, textiles, leather, etc.), and from 2.66 in 1993-94 to 4.69 in 2009-10 in
manufacturing industries with NIC codes 23 to 36 (chemicals, metals, machinery, etc.). It
seems, therefore, that the manufacturing sector has experienced a significant increase in
skill premium over time. This aspect is further discussed below in Section 4.
7
3. Changes in employment and labour productivity: Disaggregated
analysis
This section discusses the various economic aspects of employment in Indian
manufacturing for the two decades since India’s major economic reforms in the early
1990s. The experience of this period can be useful in understanding the quantity and quality
of employment created in the Indian manufacturing sector and, therefore, may also be
helpful in addressing its future challenges, especially creating decent jobs and achieving
robust employment growth. An analysis of the Indian manufacturing industry needs to
mark the duality within this sector, which, as mentioned above, consists of two broad
segments: an organized segment and an unorganized segment. Comparable data show that
the share of the organized segment in aggregate manufacturing employment was around 19
per cent in 1993, and that it increased to around 22 per cent by 2011, i.e. an increase of only
about 3 percentage points over one and half decades. Since the organized segment is
regarded as the better job provider, usually through higher formal wages and a range of
non-wage benefits, than its unorganized counterpart, such a slow increase in the absorption
rate of employment in organized manufacturing indicates that the overall quality of
manufacturing employment has not improved significantly.9 Given the importance of the
organized segment in providing higher wage and non-wage benefits – possibly because of
higher productivity compared with the unorganized segment – it is imperative to examine
this sector in detail, along with the aggregate manufacturing sector.
As this study uses two different databases for Indian manufacturing industry, the
Annual Survey of Industries (ASI) for the organized segment and the NSS Employment
and Unemployment Survey (EUS) for aggregate manufacturing, the following subsections
discuss these two categories separately. The section concludes with a comparative analysis
of the unorganized sector using the NSS survey results.
3.1 Pattern of employment in organized manufacturing
Total employment in the organized manufacturing sector is the aggregate of the
“number of employees” across various 3-digit manufacturing groups. The number of
employees is divided into two broad categories: “workers” and “other than workers”.
Within the workers category, workers “employed through contractors” comprise a subset.
Table 3 shows the levels and changes of employment in organized manufacturing for
various years and periods respectively. By considering a number of years and periods over
the last two decades, it becomes possible to get an understanding of the exact time when
significant changes took place. Moreover, the cluster-based manufacturing groups, ranked
by their capital intensity, help us to identify the specific groups which have made
significant contributions to changes in employment. In this regard, it is important to
mention that the skill intensity10
in the traditionally labour-intensive group is lower than
that in the other two groups; the traditionally low capital-intensive group is less skill-
intensive than the traditionally high capital-intensive group. Moreover, the level of skill
intensity has remained almost unchanged over the last two decades. Skill intensity in the
traditionally labour-intensive group was around 16 per cent; skill intensity in traditionally
low capital-intensive and traditionally high capital-intensive groups is around 26 per cent
and 29 per cent respectively.
It is evident from Table 3 that the traditionally labour-intensive group contributed
around 50 per cent of aggregate organized manufacturing employment in 1989, while the
9 The differences in the wages of organized and aggregate manufacturing are discussed in Section 5 below. 10 Skill intensity is measured by the share of skilled labour in total labour within each manufacturing group.
8
traditionally low capital-intensive and traditionally high-capital-intensive groups,
contributed 29 per cent and 21 per cent respectively. In the most recent period, the last
decade, the traditionally low capital-intensive group has increased its share in aggregate
organised manufacturing to 36 per cent in 2010, whereas the traditionally labour-intensive
group has experienced a small decline to 47 per cent. Nonetheless, the fact to be noted is
that the traditionally labour-intensive group still accounts for nearly half of aggregate
employment in organized manufacturing. The details of the share of employment in
aggregate organized manufacturing for each of the three manufacturing groups for selected
years are shown in Table 4 below.
Table 3. Employment in organized manufacturing (’000s)
Year Traditionally labour-intensive
Traditionally low capital-intensive
Traditionally high capital-intensive
Aggregate organized manufacturing
1989 3361.5 1934.1 1351.3 6646.9
1993 3513.7 2135.0 1510.3 7158.9
2000 3770.1 2011.5 1582.2 7363.8
2004 3977.6 2193.1 1592.4 7763.1
2007 4708.0 2896.6 2028.0 9632.6
2010 5630.0 4323.0 2124.9 12077.9
Growth rate in employment in organized manufacturing (% p.a.)
Period Traditionally labour-intensive
Traditionally low capital-intensive
Traditionally high capital-intensive
Aggregate organized manufacturing
1989-93 1.11 2.50 2.82 1.87
1994-2000 0.39 -1.63 0.33 -0.20
2001-07 4.26 6.75 4.99 5.12
2008-10 3.34 8.45 7.54 5.83
1990-2000 1.32 -0.01 1.32 0.94
2000-10 4.09 7.95 2.99 5.07
1989-2010 2.49 3.90 2.18 2.88
Table 4. Share of employment in each manufacturing group in aggregate employment in organized manufacturing (as percentage)
Year Traditionally labour-intensive
Traditionally low capital-intensive
Traditionally high capital-intensive
1989 50.6 29.1 20.3
1993 49.1 29.8 21.1
2000 51.2 27.3 21.5
2004 51.2 28.3 20.5
2007 48.9 30.1 21.1
2010 46.6 35.8 17.6
Aggregate employment in organized manufacturing increased from 6.6 million to 12.1
million, about 1.8 times, in the period from 1989 to 2010. However, the growth rate varied
across the different industry groups. Employment in the traditionally labour-intensive group
increased 1.7 times; the corresponding figures for the traditionally low capital-intensive and
9
traditionally high capital-intensive groups were 2.2 and 1.6 times respectively. Therefore,
the traditionally low capital-intensive group contributed more to generating employment
than the other two groups. This phenomenon is also reflected in the growth estimates of
employment in this group compared with the other two groups. The annual compound
growth of employment in the traditionally low capital-intensive group was 3.9 per cent per
annum over the period 1989-2010, but less in the other two groups, the same rate.
A further breakdown of employment growth shows that in the latter decade, the 2000s,
employment increased much faster than in the 1990s. Employment growth in the period
1990-2000 was 0.9 per cent per annum, compared with 5.1 per cent per annum in 2000-10.
Moreover, this high growth rate in aggregate employment in the 2000s came from higher
growth across all three manufacturing groups in the period 2000-10 than in 1990-2000.
Within the low-growth period, the 1990s, the period 1994-2000 even saw negative growth,
about 0.2 per cent in aggregate employment , due to the corresponding negative
employment growth (-1.6 per cent) in the traditionally low capital-intensive group.
A similar breakdown for the 2000s does not show any significant variations in the
growth of aggregate employment between the pre-crisis period of 2001-07 and the post-
crisis period 2008-10). However, the post-crisis growth of employment in the traditionally
labour-intensive group was lower than its pre-crisis level, while in the other two groups, it
increased relative to its pre-crisis level.
Having discussed the quantitative aspects of organized manufacturing employment, it
is important to discuss some of its qualitative aspects. One major qualitative indicator of
manufacturing employment is the scope and changes in contractualization of labour.
Contract workers are generally paid less than their regular counterparts. Moreover, they are
not generally entitled to non-wage benefits which are otherwise available to regular labour.
The ratio of contractual workers to aggregate workers can be calculated from the available
ASI data.
From Tables 5 and 6, it is clear that the share of contract workers in aggregate
organized manufacturing workers increased from 14 per cent to 34 per cent in the period
between 1989 and 2010. Within the traditionally labour-intensive manufacturing group,
there was a two-fold increase in the share of contract workers in aggregate workers over the
same period. For the traditionally low capital-intensive and traditionally high capital-
intensive groups, the increase in the share of contractual workers was 3.6 and 2.6 times
respectively. Although contractualization has increased steadily over the last two decades,
its rise has been more significant in the latter, i.e. the 2000s. Table 6 shows this more
clearly. The annual growth rate of contract employment increased to 10 per cent per annum
over the period 2000-10, substantially higher than the 4.8 per cent per annum observed in
the previous period, 1989-2000. Moreover, the growth of contract labour was more
prominent in the traditionally low capital-intensive group compared to the other two groups
for all periods except 1989-1994. This growing contract employment among organized
manufacturing workers is reflected in the deteriorating quality of employment in the Indian
organized manufacturing sector.
10
Table 5. Share of contract workers in aggregate workers within each manufacturing group (per cent)
Year Traditionally labour-intensive
Traditionally low capital-intensive
Traditionally high capital-intensive
Aggregate organized
manufacturing
1989 15.6 10.3 15.7 14.2
1994 16.1 11.0 21.1 15.6
2000 21.4 20.8 24.2 21.8
2004 24.7 28.7 29.1 26.5
2007 27.8 34.0 35.7 31.1
2010 29.7 37.1 40.2 33.9
Table 6. Growth rate in contractual employment (% p.a.)
Period Traditionally labour-intensive
Traditionally low capital-intensive
Traditionally high capital-intensive
Aggregate organized
manufacturing
1989-94 2.36 3.54 8.72 4.02
1994-2000 5.10 9.52 2.50 5.43
2001-07 8.49 14.02 11.41 10.69
2008-10 4.55 17.04 8.17 9.51
1989-2000 3.85 6.76 5.28 4.79
2000-10 7.54 14.82 8.53 9.93
3.2 Pattern of employment in aggregate manufacturing
Having discussed various aspects of employment in the organized segment of the
Indian manufacturing sector in the previous section, this section presents the employment
structure of the aggregate manufacturing sector in more detail. Since the ASI data cover
only the organized manufacturing segment, the estimates for the aggregate manufacturing
sector from the NSS Employment and Unemployment Survey (EUS) data, i.e. the
organized and unorganized manufacturing sector combined, gives the complete picture of
Indian manufacturing sector. Moreover, the EUS allows us to compute the employment
structure by region (e.g. rural and urban), status (e.g., regular, casual, and self-employed),
gender, education, etc...
Manufacturing sector workers are defined for the purposes of this study as persons
whose principal economic activity or subsidiary economic activity or both during the last
one year have been in that sector. The EUS allows an estimate of the number of workers in
each manufacturing group at the 5-digit NIC level, and accordingly, the number of workers
engaged in each manufacturing cluster-based group has been computed and are presented
below.
As noted above, employment in the organized manufacturing segment increased by
1.7 times from 7.2 million to 12.1 million over the period 1993-2010. The comparable
statistics for the aggregate manufacturing sector presented in Table 7 below show that
aggregate manufacturing employment increased by 1.6 times over the period 1993 to 2011,
from 32.6 million to 51.2 million. In other words, the orders of increase in employment in
11
organized and aggregate manufacturing are not dissimilar, but with one important
difference. In the case of organized manufacturing, the traditionally low capital-intensive
sector achieved a bigger increase in employment than the other two groups. By contrast, in
aggregate manufacturing, it is the traditionally labour-intensive sector which had the largest
increase. Employment in this industry group in 2011-12 was 1.8 times that of 1993-94,
higher than the other two groups. Thus, although the organized manufacturing segment
experienced an almost proportionate increase in employment compared with the aggregate
manufacturing sector, it is the traditionally labour-intensive manufacturing group that
generated more employment. This phenomenon reflects the fact that the increase in
employment in this group has been concentrated in unorganized manufacturing. This
indicates a negative trend as far as the formalization of the manufacturing sector is
concerned, underlining the point made earlier that the Indian manufacturing sector has not
moved significantly towards an organized production structure.
Table 7. Employment in aggregate manufacturing (’000s)
Year Traditionally labour-intensive
Traditionally low capital-intensive
Traditionally high capital-
intensive
Aggregate manufacturing
1993-94 (50th Round) 20660.0 9883.9 2032.8 32576.7
1999-2000 (55th Round) 25709.5 9956.0 3422.4 39088.3
2004-05 (61st Round) 34211.4 9918.9 3580.3 47710.6
2011-12 (68th Round) 37416.7 10632.9 3169.4 51219.0
Growth rate in employment in aggregate manufacturing (% p.a.)
Period Traditionally labour-intensive
Traditionally low capital-intensive
Traditionally high capital-
intensive
Aggregate manufacturing
1993-94 to 1999-2000 3.71 0.12 9.07 3.08
1999-2000 to 2004-05 5.88 -0.07 0.91 4.07
1993-94 to 2004-05 4.69 0.03 5.28 3.53
2004-05 to 2011-12 1.29 1.00 -1.73 1.02
1993-94 to 2011-12 3.35 0.41 2.50 2.55
Note: Employment estimates shown in the table use the multipliers within the dataset on NSS unit records. Hence these are based on population estimates within the NSS data. They differ from the estimates discussed in Section 3 where the work participation rates are taken from the NSS and employment estimates are derived with the help of population estimates derived from the Census population figures. As a result the absolute figures on employment as well as growth rates in this table will not tally with the employment estimates presented in Section 3 above.
In addition to the absolute figures on estimated employment in each manufacturing
group, the employment growth figures for three periods, 1993-1994 to 1999-2000, 1999-
2000 to 2004-2005 and 2004-2005 to 2011-2012 (Table 7) deserve particular consideration.
They provide some indication of the time when the structural changes took place in the
aggregate manufacturing sector. A comparison of Table 3 and Table 7 shows that annual
employment growth in organized manufacturing was lower (at 0.94 per cent) in the period
1990-2000 than in the aggregate manufacturing sector (3.5 per cent) in the period 1993-
1994 to 2004-2005, However, this trend reversed in favour of the organized segment (with
growth of 5.1 per cent) in the last decade from 2000, whereas the aggregate manufacturing
sector experienced growth of around one per cent in the period 2004-2005 to 2011-2012.
Higher employment growth in the traditionally labour-intensive manufacturing group than
in the other two groups, over the last two decades in general and the last decade in
particular, indicates that, despite a shift towards more capital-intensive industries in
organized manufacturing, Indian manufacturing employment in general does not reflect this
trend.
12
The various dimensions of employment in Indian manufacturing are shown in the
following tables. Firstly, Table 8 presents the level of concentration of manufacturing
employment, and therefore, manufacturing activities in rural versus urban areas. It is clear
from this table that around 50 per cent of manufacturing employment is concentrated in
rural areas, more on the traditionally labour-intensive manufacturing group than the other
two groups. Traditionally high capital-intensive manufacturing is mostly urban-centric
relative to the traditionally low labour-intensive group. Moreover, a trend towards
urbanized manufacturing activity has been observed in the traditionally low capital-
intensive groups, whereas traditionally high-capital intensive manufacturing activity has
shifted towards rural areas over last two decades.
Table 8. Share of rural employment in manufacturing industry groups (per cent)
Year Traditionally labour-intensive
Traditionally low capital-intensive
Traditionally high capital-
intensive
Aggregate manufacturing
1993-94 (50th Round) 58.6 49.3 30.4 54.0
1999-00 (55th Round) 61.5 43.0 32.7 54.3
2004-05 (61st Round) 58.4 43.5 37.5 53.7
2011-12 (68th Round) 54.1 42.4 36.8 50.6
Gender is another important dimension of the analysis of manufacturing employment.
Table 9 shows that female participation in aggregate manufacturing employment is around
30 per cent. However, it is not uniform across manufacturing groups, being substantially
higher in the traditionally labour-intensive group than in the other two groups. In the
traditionally low capital-intensive group female participation declined by around 10
percentage points over the period 1993-1994 to 2011-2012, while in the traditionally high
capital-intensive group it was only slightly lower (10.6 per cent in 2011-2012 down from
12.7 per cent in 1993-1994) . Overall, therefore, female participation in capital-intensive
manufacturing activities has worsened significantly over the last two decades.
Table 9. Share of women employed by manufacturing industry group (per cent)
Year Traditionally
labour-intensive Traditionally Low Capital-intensive
Traditionally High Capital-intensive
Aggregate manufacturing
1993-94 (50th Round) 37.8 18.7 12.7 30.4
1999-00 (55th Round) 36.9 11.1 22.5 29.1
2004-05 (61st Round) 39.1 9.7 24.4 31.9
2011-12 (68th Round) 38.0 8.2 10.6 30.1
Almost half of Indian manufacturing sector employment consists of self-employed
individuals (Table 10), and it is most prominent in the traditionally labour-intensive group.
It is interesting to observe that the share of self-employed employment has decreased in
traditionally low capital-intensive and traditionally high capital-intensive groups especially
since 2004-05, whereas, it has remained almost unchanged in the traditionally labour-
intensive manufacturing group.
The growing level of contractualization/casualization in Indian manufacturing is a
major concern, as reflected in the previous section (the issue is discussed in the existing
literature, see, for instance, Sen et al., 2010).
13
Although contractualization has increased in the organized manufacturing segment,
this phenomenon is not equally reflected in the employment structure of the aggregate
manufacturing sector.11
Rather, it is interesting to observe that the proportion of regular
workers in traditionally capital-intensive industries has gone up. The lack of a rise in
casualization in aggregate manufacturing may be explained by the high level of self-
employment present in the remainder of the sector, the unorganized segment.
Table 10. Distribution of labour by employment status in different manufacturing industry groups (%)
Manufacturing Group Period Regular Casual Self-employed
Traditionally labour-intensive 1993-94 20.2 24.3 55.4
1999-00 20.1 19.2 60.5
2004-05 21.3 18.1 60.6
2011-12 24.3 18.4 57.2
Traditionally low capital-intensive 1993-94 42.4 20 37.6
1999-00 44.9 15.5 39.5
2004-05 46 14.9 39.1
2011-12 56.2 13.7 30.1
Traditionally high capital-intensive 1993-94 65.5 13.7 20.8
1999-00 63.5 13.1 23.4
2004-05 61.9 15.4 22.7
2011-12 80.1 8.6 11.3
Aggregate manufacturing 1993-94 29.8 22.3 47.9
1999-00 30.3 17.7 51.9
2004-05 29.5 17.2 53.3
2011-12 34.4 16.9 48.7
The educational distribution of manufacturing labour shows an increasing
concentration of secondary and higher secondary level education in the Indian
manufacturing sector over the last two decades (Table 11). The majority of manufacturing
workers (89 per cent) do not have a college degree (in 2011-12). Indeed, about 35 per cent
have only primary education or lower, suggesting that manufacturing has the capacity to
absorb workers with little education.
The share of primary and below primary level educated labour has fallen since 1993-
94 across all manufacturing groups. Moreover, the share of graduates and diploma holders
has increased from around one per cent in 1993-94 to some 9 per cent in 2011-12. This
increase is more prominent in the traditionally low capital-intensive and traditionally high
capital-intensive manufacturing groups than in the traditionally labour-intensive group.
Therefore, overall, the increasing share of secondary and higher secondary level educated
labour and graduate and diploma holders has contributed to the better educated labour force
in the Indian manufacturing sector. However, the declining shares of post-graduate degree
holders in aggregate manufacturing and across the three manufacturing groups suggests that
the sector does not have much need of employees with post-graduate degrees.
11 Goldar and Aggarwal (2012b) have presented estimates of casual employment in organized manufacturing.
They make use of the EUS and distinguish between the workers in organized and unorganized sector firms.
According to their estimates the proportion of casual workers in organized manufacturing was 22.4 per cent in
1999-2000 and 22.8 per cent in 2009-10. Thus, there was very little change. See, in this context, Goldar and
Aggarwal (2012a).
14
Table 11. Distribution of labour by educational level in different manufacturing industry groups (%)
Traditionally labour-intensive
Traditionally low capital-intensive
Traditionally high capital-intensive
Aggregate manufacturing
Educational Levels 93-94 04-05 11-12 93-94 04-05 11-12 93-94 04-05 11-12 93-94 04-05 11-12
Primary or lower level including Illiterate
58.9 43.9 39.6 42.9 25.3 18.0 29.5 23.2 18.7 52.5 38.5 33.8
Secondary or higher secondary
39.2 52.0 55.0 48.7 59.2 59.9 49.3 51.7 50.5 42.6 53.5 55.7
Graduate or Diploma 0.1 3.8 4.8 1.4 14.1 18.5 4.4 21.3 23.3 0.7 7.2 8.8
Post-Graduate 1.7 0.4 0.6 7.0 1.4 3.6 16.7 3.9 7.5 4.2 0.8 1.6
3.3 Comparison of organized and unorganized manufacturing
The industrial composition of the organized and manufacturing sector in terms of
employment and how that composition has changed over time are presented in Tables 12
and 13. In the organized sector, the relative share of textiles in employment fell between
1989-90 and 2010-11 whereas the share of wearing apparel increased. Taken together, the
share of these two industries in employment has not changed much. The share of food
products, beverages and tobacco products fell while that of chemicals, rubber, plastics and
motor vehicles increased. Turning to unorganized manufacturing, the share of food
products, beverages and tobacco products in employment fell (as in the case of organized
manufacturing) while the relative shares of textiles and wearing apparel increased
significantly. Other industry groups whose relative share in employment increased between
1989-90 and 2010-11 include rubber and plastic products and metal products.
Considering the organized and unorganized sectors as a whole, the textiles and
wearing apparel industry group and the chemicals, rubber and plastics group both increased
their share in employment.
15
Table 12. Distribution of employment in organized manufacturing, by industry
Industry Code
(2-digit)
Description of industry Composition of employment
1989-90 1993-94 1999-2000 2010-11
15 Manufacture of food products and beverages
0.162 0.165 0.170 0.136
16 Manufacture of tobacco products 0.067 0.061 0.060 0.034
17 Manufacture of textiles 0.186 0.171 0.162 0.119
18 Manufacture of wearing apparel; dressing and dyeing of fur
0.015 0.028 0.038 0.072
19 Tanning and dressing of leather; manufacture of luggage, handbags, saddlery, harness and footwear
0.016 0.015 0.015 0.024
20 Manufacture of wood and products of wood and cork, except furniture; manufacture of articles of straw and plating materials
0.010 0.009 0.006 0.007
21 Manufacture of paper and paper products
0.019 0.021 0.022 0.020
22 Publishing, printing and reproduction of recorded media
0.020 0.020 0.014 0.014
23 Manufacture of coke, refined petroleum products and nuclear fuel
0.008 0.009 0.009 0.009
24 Manufacture of chemicals and chemical products
0.085 0.090 0.103 0.090
25 Manufacture of rubber and plastics products
0.024 0.028 0.034 0.042
26 Manufacture of other non-metallic mineral products
0.064 0.060 0.057 0.076
27 Manufacture of basic metals 0.085 0.084 0.080 0.083
28 Manufacture of fabricated metal products, except machinery and equipment
0.034 0.032 0.035 0.055
29 Manufacture of machinery and equipment n.e.c.
0.064 0.062 0.059 0.056
31 Manufacture of electrical machinery and apparatus n.e.c.
0.033 0.034 0.031 0.042
30+32+33 Manufacture of office, accounting and computing machinery; Manufacture of radio, television and communication equipment and apparatus; Manufacture of medical, precision and optical instruments, etc.
0.028 0.026 0.025 0.019
34 Manufacture of motor vehicles, trailers and semi-trailers
0.028 0.029 0.037 0.059
35 Manufacture of other transport equipment
0.044 0.047 0.023 0.021
36 Manufacture of furniture; manufacturing n.e.c.
0.008 0.011 0.016 0.023
All 1.000 1.000 1.000 1.000
n.e.c.: not elsewhere classified
16
Table 13. Distribution of unorganized sector employment by major industry group
Sl. No
NIC 98 Industry group 1989-90
(45th round)
1994-95 (51st
round)
2000-01 (56th
round)
2005-06 (62nd round)
2010-11 (67th
round)
1 15+16 Food products, beverages and tobacco
0.283 0.276 0.277 0.289 0.226
2 17+18 Textiles and wearing apparel
0.228 0.221 0.290 0.309 0.356
3 19 Leather and related products
0.017 0.017 0.011 0.013 0.009
4 21+22 Paper, paper products, printing and publishing
0.019 0.018 0.020 0.021 0.024
5 24 Chemicals and chemical products
0.017 0.012 0.015 0.024 0.014
6 23+25 Rubber, plastic and petroleum products
0.008 0.011 0.010 0.008 0.016
7 26 Non-metallic mineral products
0.086 0.086 0.082 0.064 0.082
8 27 Basic metals 0.003 0.004 0.004 0.003 0.004
9 28 Metal products 0.035 0.043 0.043 0.046 0.052
10 29+30+31+ 32+33
Machinery and equipment 0.035 0.039 0.022 0.025 0.031
11 34+35 Transport equipment 0.004 0.004 0.005 0.006 0.004
12 20+36+37 Other manufacturing including wood
0.265 0.271 0.223 0.192 0.183
13 All 1.000 1.000 1.000 1.000 1.000
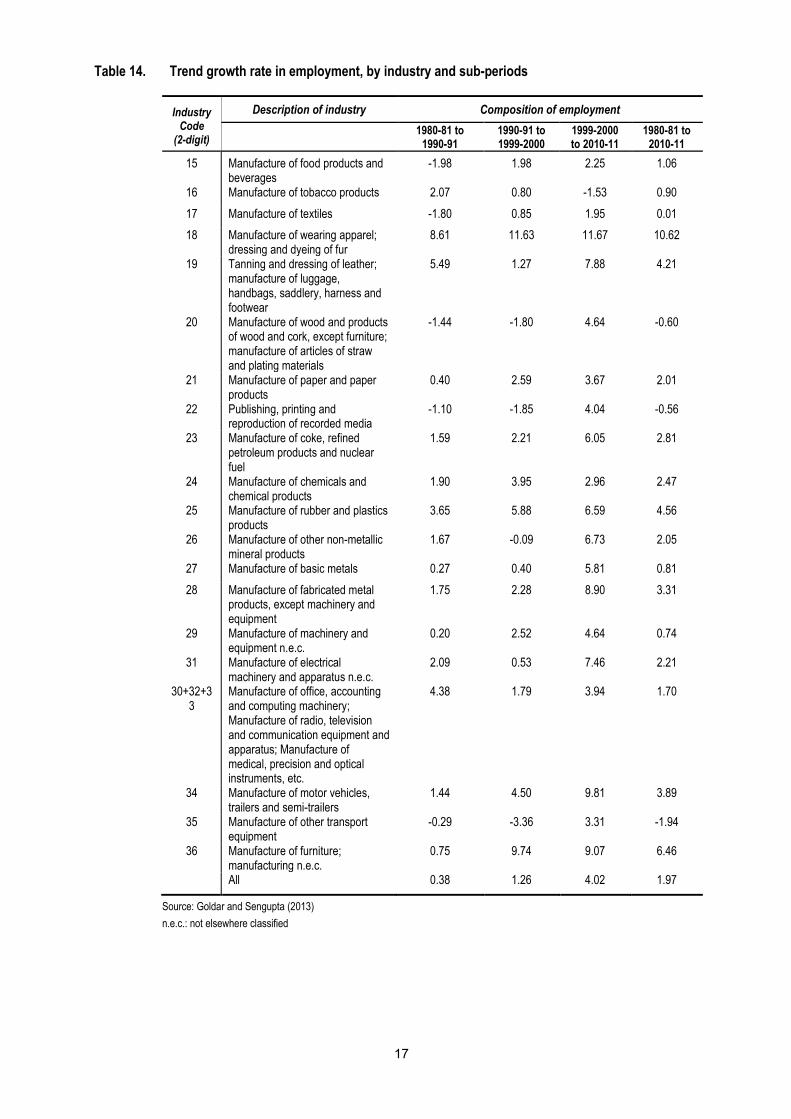
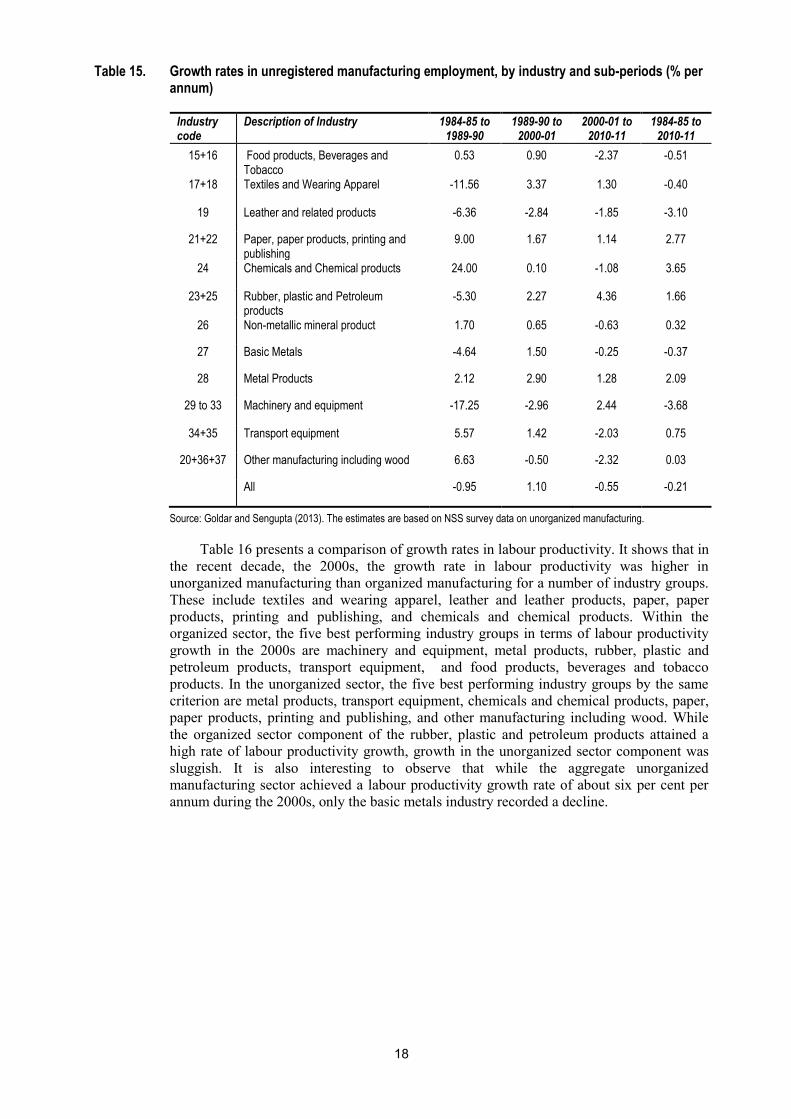
As noted above, the organized manufacturing sector achieved a high rate of
employment growth in the 2000s while in the unorganized sector it was sluggish. Tables 14
and 15 show the employment growth rate in organized and unorganized manufacturing at a
disaggregated level. The tables highlight that the accelerated employment growth in
organized manufacturing has been broad-based rather than confined to a few industry
groups. The decline in the employment growth rate in in unorganized manufacturing was
similarly spread across a number of industry groups.
A detailed examination of employment data for unorganized manufacturing using NSS
62nd and 67th round survey results reveals that in the latter period a fall in employment has
occurred in self-employed enterprises but not in establishments.12 Between 2005-06 and
2010-11, employment in establishments grew at the rate of 1.9 per cent per annum, while
employment in self-employed enterprises fell by an annual 2.5 per cent. The implication is
that a major restructuring is occurring within unorganized manufacturing away from self-
employed enterprises and towards establishments.
12 Self-employed enterprises are relatively small in size, often consisting of family members. They do not have
any hired workers. Establishments are defined as businesses which employ workers.
17
Table 14. Trend growth rate in employment, by industry and sub-periods
Industry Code
(2-digit)
Description of industry Composition of employment
1980-81 to
1990-91 1990-91 to 1999-2000
1999-2000 to 2010-11
1980-81 to 2010-11
15 Manufacture of food products and beverages
-1.98 1.98 2.25 1.06
16 Manufacture of tobacco products 2.07 0.80 -1.53 0.90
17 Manufacture of textiles -1.80 0.85 1.95 0.01
18 Manufacture of wearing apparel; dressing and dyeing of fur
8.61 11.63 11.67 10.62
19 Tanning and dressing of leather; manufacture of luggage, handbags, saddlery, harness and footwear
5.49 1.27 7.88 4.21
20 Manufacture of wood and products of wood and cork, except furniture; manufacture of articles of straw and plating materials
-1.44 -1.80 4.64 -0.60
21 Manufacture of paper and paper products
0.40 2.59 3.67 2.01
22 Publishing, printing and reproduction of recorded media
-1.10 -1.85 4.04 -0.56
23 Manufacture of coke, refined petroleum products and nuclear fuel
1.59 2.21 6.05 2.81
24 Manufacture of chemicals and chemical products
1.90 3.95 2.96 2.47
25 Manufacture of rubber and plastics products
3.65 5.88 6.59 4.56
26 Manufacture of other non-metallic mineral products
1.67 -0.09 6.73 2.05
27 Manufacture of basic metals 0.27 0.40 5.81 0.81
28 Manufacture of fabricated metal products, except machinery and equipment
1.75 2.28 8.90 3.31
29 Manufacture of machinery and equipment n.e.c.
0.20 2.52 4.64 0.74
31 Manufacture of electrical machinery and apparatus n.e.c.
2.09 0.53 7.46 2.21
30+32+33
Manufacture of office, accounting and computing machinery; Manufacture of radio, television and communication equipment and apparatus; Manufacture of medical, precision and optical instruments, etc.
4.38 1.79 3.94 1.70
34 Manufacture of motor vehicles, trailers and semi-trailers
1.44 4.50 9.81 3.89
35 Manufacture of other transport equipment
-0.29 -3.36 3.31 -1.94
36 Manufacture of furniture; manufacturing n.e.c.
0.75 9.74 9.07 6.46
All 0.38 1.26 4.02 1.97
Source: Goldar and Sengupta (2013)
n.e.c.: not elsewhere classified
18
Table 15. Growth rates in unregistered manufacturing employment, by industry and sub-periods (% per annum)
Industry code
Description of Industry 1984-85 to 1989-90
1989-90 to 2000-01
2000-01 to 2010-11
1984-85 to 2010-11
15+16 Food products, Beverages and Tobacco
0.53 0.90 -2.37 -0.51
17+18 Textiles and Wearing Apparel -11.56 3.37 1.30 -0.40
19 Leather and related products -6.36 -2.84 -1.85 -3.10
21+22 Paper, paper products, printing and publishing
9.00 1.67 1.14 2.77
24 Chemicals and Chemical products 24.00 0.10 -1.08 3.65
23+25 Rubber, plastic and Petroleum products
-5.30 2.27 4.36 1.66
26 Non-metallic mineral product 1.70 0.65 -0.63 0.32
27 Basic Metals -4.64 1.50 -0.25 -0.37
28 Metal Products 2.12 2.90 1.28 2.09
29 to 33 Machinery and equipment -17.25 -2.96 2.44 -3.68
34+35 Transport equipment 5.57 1.42 -2.03 0.75
20+36+37 Other manufacturing including wood 6.63 -0.50 -2.32 0.03
All -0.95 1.10 -0.55 -0.21
Source: Goldar and Sengupta (2013). The estimates are based on NSS survey data on unorganized manufacturing.
Table 16 presents a comparison of growth rates in labour productivity. It shows that in
the recent decade, the 2000s, the growth rate in labour productivity was higher in
unorganized manufacturing than organized manufacturing for a number of industry groups.
These include textiles and wearing apparel, leather and leather products, paper, paper
products, printing and publishing, and chemicals and chemical products. Within the
organized sector, the five best performing industry groups in terms of labour productivity
growth in the 2000s are machinery and equipment, metal products, rubber, plastic and
petroleum products, transport equipment, and food products, beverages and tobacco
products. In the unorganized sector, the five best performing industry groups by the same
criterion are metal products, transport equipment, chemicals and chemical products, paper,
paper products, printing and publishing, and other manufacturing including wood. While
the organized sector component of the rubber, plastic and petroleum products attained a
high rate of labour productivity growth, growth in the unorganized sector component was
sluggish. It is also interesting to observe that while the aggregate unorganized
manufacturing sector achieved a labour productivity growth rate of about six per cent per
annum during the 2000s, only the basic metals industry recorded a decline.
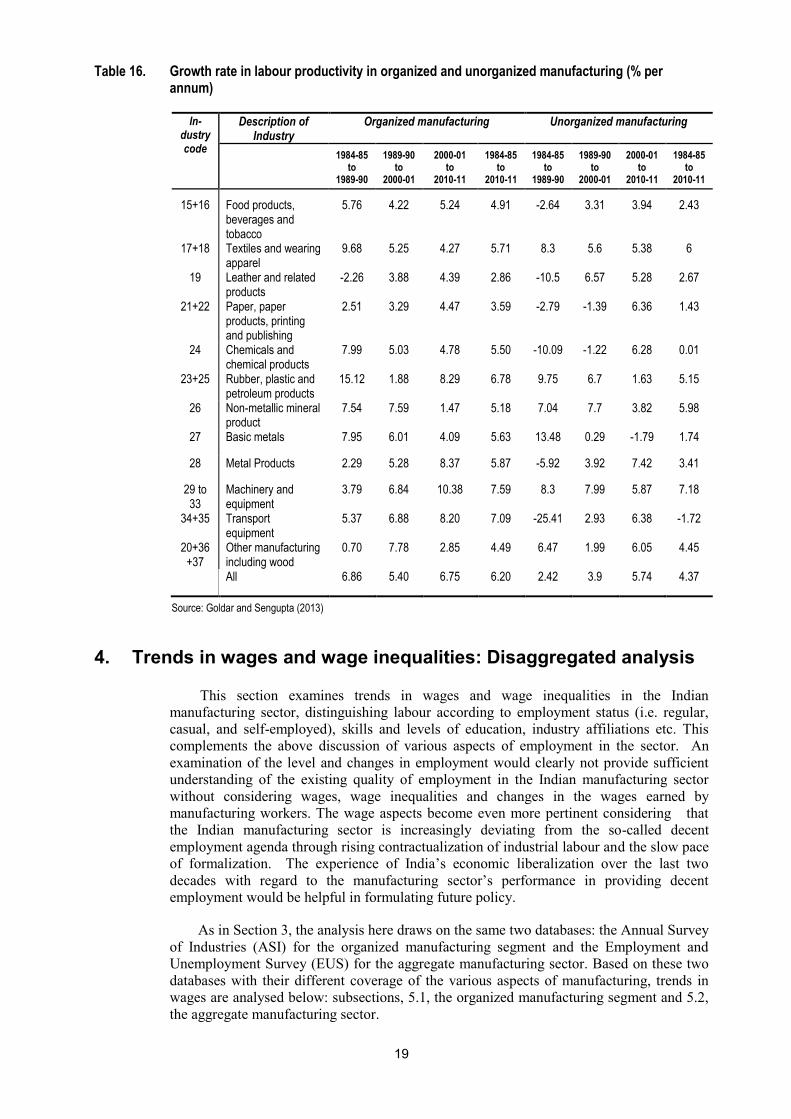
19
Table 16. Growth rate in labour productivity in organized and unorganized manufacturing (% per annum)
In-dustry code
Description of Industry
Organized manufacturing Unorganized manufacturing
1984-85 to
1989-90
1989-90 to
2000-01
2000-01 to
2010-11
1984-85 to
2010-11
1984-85 to
1989-90
1989-90 to
2000-01
2000-01 to
2010-11
1984-85 to
2010-11
15+16 Food products, beverages and tobacco
5.76 4.22 5.24 4.91 -2.64 3.31 3.94 2.43
17+18 Textiles and wearing apparel
9.68 5.25 4.27 5.71 8.3 5.6 5.38 6
19 Leather and related products
-2.26 3.88 4.39 2.86 -10.5 6.57 5.28 2.67
21+22 Paper, paper products, printing and publishing
2.51 3.29 4.47 3.59 -2.79 -1.39 6.36 1.43
24 Chemicals and chemical products
7.99 5.03 4.78 5.50 -10.09 -1.22 6.28 0.01
23+25 Rubber, plastic and petroleum products
15.12 1.88 8.29 6.78 9.75 6.7 1.63 5.15
26 Non-metallic mineral product
7.54 7.59 1.47 5.18 7.04 7.7 3.82 5.98
27 Basic metals 7.95 6.01 4.09 5.63 13.48 0.29 -1.79 1.74
28 Metal Products 2.29 5.28 8.37 5.87 -5.92 3.92 7.42 3.41
29 to 33
Machinery and equipment
3.79 6.84 10.38 7.59 8.3 7.99 5.87 7.18
34+35 Transport equipment
5.37 6.88 8.20 7.09 -25.41 2.93 6.38 -1.72
20+36+37
Other manufacturing including wood
0.70 7.78 2.85 4.49 6.47 1.99 6.05 4.45
All 6.86 5.40 6.75 6.20 2.42 3.9 5.74 4.37
Source: Goldar and Sengupta (2013)
4. Trends in wages and wage inequalities: Disaggregated analysis
This section examines trends in wages and wage inequalities in the Indian
manufacturing sector, distinguishing labour according to employment status (i.e. regular,
casual, and self-employed), skills and levels of education, industry affiliations etc. This
complements the above discussion of various aspects of employment in the sector. An
examination of the level and changes in employment would clearly not provide sufficient
understanding of the existing quality of employment in the Indian manufacturing sector
without considering wages, wage inequalities and changes in the wages earned by
manufacturing workers. The wage aspects become even more pertinent considering that
the Indian manufacturing sector is increasingly deviating from the so-called decent
employment agenda through rising contractualization of industrial labour and the slow pace
of formalization. The experience of India’s economic liberalization over the last two
decades with regard to the manufacturing sector’s performance in providing decent
employment would be helpful in formulating future policy.
As in Section 3, the analysis here draws on the same two databases: the Annual Survey
of Industries (ASI) for the organized manufacturing segment and the Employment and
Unemployment Survey (EUS) for the aggregate manufacturing sector. Based on these two
databases with their different coverage of the various aspects of manufacturing, trends in
wages are analysed below: subsections, 5.1, the organized manufacturing segment and 5.2,
the aggregate manufacturing sector.
20
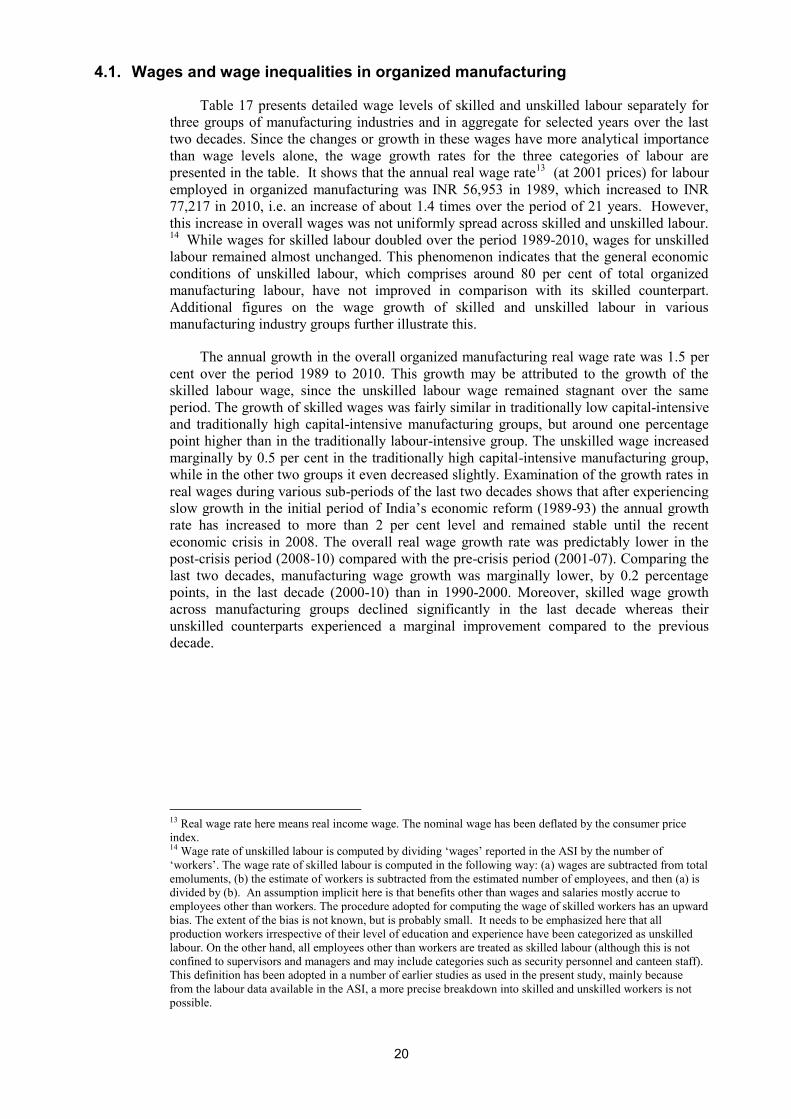
4.1. Wages and wage inequalities in organized manufacturing
Table 17 presents detailed wage levels of skilled and unskilled labour separately for
three groups of manufacturing industries and in aggregate for selected years over the last
two decades. Since the changes or growth in these wages have more analytical importance
than wage levels alone, the wage growth rates for the three categories of labour are
presented in the table. It shows that the annual real wage rate13
(at 2001 prices) for labour
employed in organized manufacturing was INR 56,953 in 1989, which increased to INR
77,217 in 2010, i.e. an increase of about 1.4 times over the period of 21 years. However,
this increase in overall wages was not uniformly spread across skilled and unskilled labour. 14
While wages for skilled labour doubled over the period 1989-2010, wages for unskilled
labour remained almost unchanged. This phenomenon indicates that the general economic
conditions of unskilled labour, which comprises around 80 per cent of total organized
manufacturing labour, have not improved in comparison with its skilled counterpart.
Additional figures on the wage growth of skilled and unskilled labour in various
manufacturing industry groups further illustrate this.
The annual growth in the overall organized manufacturing real wage rate was 1.5 per
cent over the period 1989 to 2010. This growth may be attributed to the growth of the
skilled labour wage, since the unskilled labour wage remained stagnant over the same
period. The growth of skilled wages was fairly similar in traditionally low capital-intensive
and traditionally high capital-intensive manufacturing groups, but around one percentage
point higher than in the traditionally labour-intensive group. The unskilled wage increased
marginally by 0.5 per cent in the traditionally high capital-intensive manufacturing group,
while in the other two groups it even decreased slightly. Examination of the growth rates in
real wages during various sub-periods of the last two decades shows that after experiencing
slow growth in the initial period of India’s economic reform (1989-93) the annual growth
rate has increased to more than 2 per cent level and remained stable until the recent
economic crisis in 2008. The overall real wage growth rate was predictably lower in the
post-crisis period (2008-10) compared with the pre-crisis period (2001-07). Comparing the
last two decades, manufacturing wage growth was marginally lower, by 0.2 percentage
points, in the last decade (2000-10) than in 1990-2000. Moreover, skilled wage growth
across manufacturing groups declined significantly in the last decade whereas their
unskilled counterparts experienced a marginal improvement compared to the previous
decade.
13 Real wage rate here means real income wage. The nominal wage has been deflated by the consumer price
index. 14 Wage rate of unskilled labour is computed by dividing ‘wages’ reported in the ASI by the number of
‘workers’. The wage rate of skilled labour is computed in the following way: (a) wages are subtracted from total
emoluments, (b) the estimate of workers is subtracted from the estimated number of employees, and then (a) is
divided by (b). An assumption implicit here is that benefits other than wages and salaries mostly accrue to
employees other than workers. The procedure adopted for computing the wage of skilled workers has an upward
bias. The extent of the bias is not known, but is probably small. It needs to be emphasized here that all
production workers irrespective of their level of education and experience have been categorized as unskilled
labour. On the other hand, all employees other than workers are treated as skilled labour (although this is not
confined to supervisors and managers and may include categories such as security personnel and canteen staff).
This definition has been adopted in a number of earlier studies as used in the present study, mainly because
from the labour data available in the ASI, a more precise breakdown into skilled and unskilled workers is not
possible.
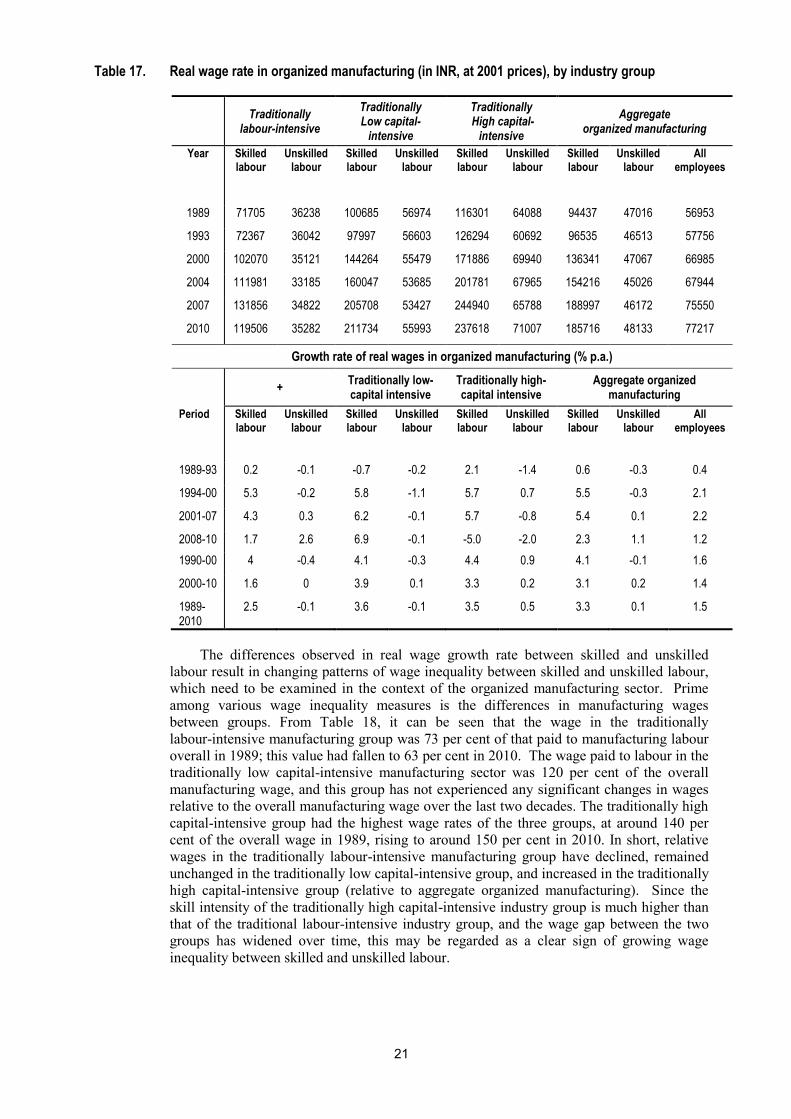
21
Table 17. Real wage rate in organized manufacturing (in INR, at 2001 prices), by industry group
Traditionally
labour-intensive
Traditionally Low capital-
intensive
Traditionally High capital-
intensive
Aggregate organized manufacturing
Year Skilled labour
Unskilled labour
Skilled labour
Unskilled labour
Skilled labour
Unskilled labour
Skilled labour
Unskilled labour
All employees
1989 71705 36238 100685 56974 116301 64088 94437 47016 56953
1993 72367 36042 97997 56603 126294 60692 96535 46513 57756
2000 102070 35121 144264 55479 171886 69940 136341 47067 66985
2004 111981 33185 160047 53685 201781 67965 154216 45026 67944
2007 131856 34822 205708 53427 244940 65788 188997 46172 75550
2010 119506 35282 211734 55993 237618 71007 185716 48133 77217
Growth rate of real wages in organized manufacturing (% p.a.)
+
Traditionally low-capital intensive
Traditionally high-capital intensive
Aggregate organized manufacturing
Period Skilled labour
Unskilled labour
Skilled labour
Unskilled labour
Skilled labour
Unskilled labour
Skilled labour
Unskilled labour
All employees
1989-93 0.2 -0.1 -0.7 -0.2 2.1 -1.4 0.6 -0.3 0.4
1994-00 5.3 -0.2 5.8 -1.1 5.7 0.7 5.5 -0.3 2.1
2001-07 4.3 0.3 6.2 -0.1 5.7 -0.8 5.4 0.1 2.2
2008-10 1.7 2.6 6.9 -0.1 -5.0 -2.0 2.3 1.1 1.2
1990-00 4 -0.4 4.1 -0.3 4.4 0.9 4.1 -0.1 1.6
2000-10 1.6 0 3.9 0.1 3.3 0.2 3.1 0.2 1.4
1989-2010
2.5 -0.1 3.6 -0.1 3.5 0.5 3.3 0.1 1.5
The differences observed in real wage growth rate between skilled and unskilled
labour result in changing patterns of wage inequality between skilled and unskilled labour,
which need to be examined in the context of the organized manufacturing sector. Prime
among various wage inequality measures is the differences in manufacturing wages
between groups. From Table 18, it can be seen that the wage in the traditionally
labour-intensive manufacturing group was 73 per cent of that paid to manufacturing labour
overall in 1989; this value had fallen to 63 per cent in 2010. The wage paid to labour in the
traditionally low capital-intensive manufacturing sector was 120 per cent of the overall
manufacturing wage, and this group has not experienced any significant changes in wages
relative to the overall manufacturing wage over the last two decades. The traditionally high
capital-intensive group had the highest wage rates of the three groups, at around 140 per
cent of the overall wage in 1989, rising to around 150 per cent in 2010. In short, relative
wages in the traditionally labour-intensive manufacturing group have declined, remained
unchanged in the traditionally low capital-intensive group, and increased in the traditionally
high capital-intensive group (relative to aggregate organized manufacturing). Since the
skill intensity of the traditionally high capital-intensive industry group is much higher than
that of the traditional labour-intensive industry group, and the wage gap between the two
groups has widened over time, this may be regarded as a clear sign of growing wage
inequality between skilled and unskilled labour.
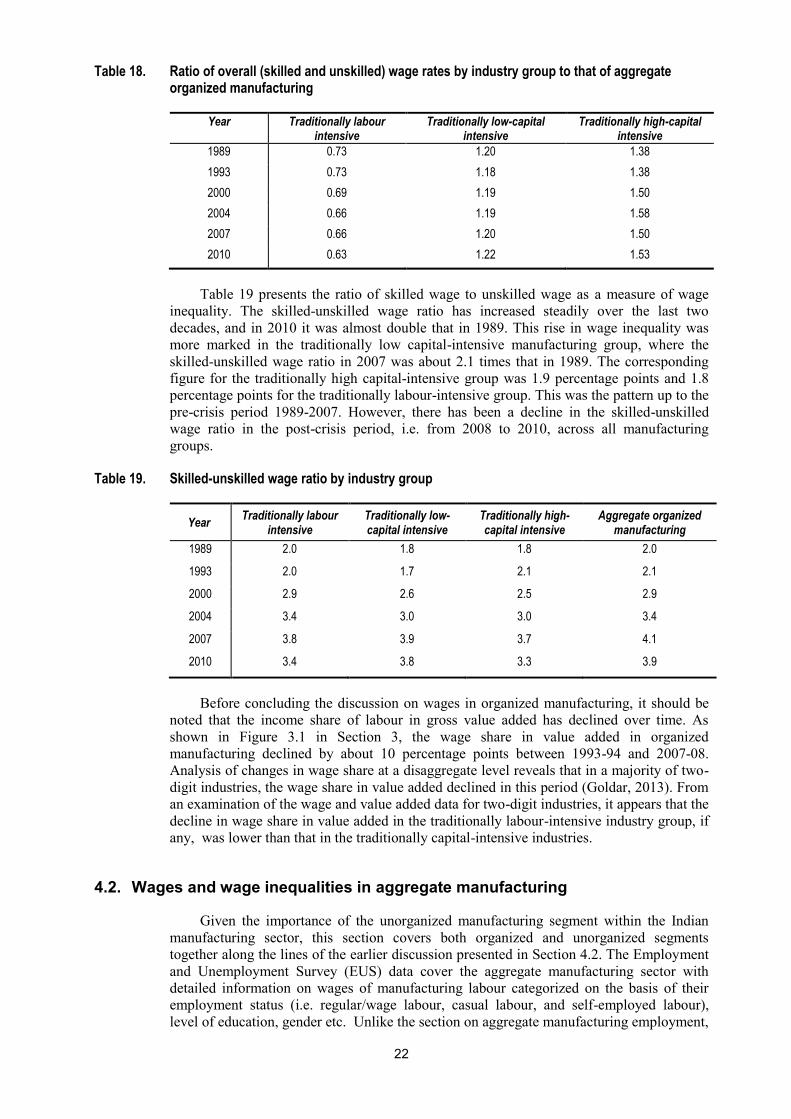
22
Table 18. Ratio of overall (skilled and unskilled) wage rates by industry group to that of aggregate organized manufacturing
Year Traditionally labour intensive
Traditionally low-capital intensive
Traditionally high-capital intensive
1989 0.73 1.20 1.38
1993 0.73 1.18 1.38
2000 0.69 1.19 1.50
2004 0.66 1.19 1.58
2007 0.66 1.20 1.50
2010 0.63 1.22 1.53
Table 19 presents the ratio of skilled wage to unskilled wage as a measure of wage
inequality. The skilled-unskilled wage ratio has increased steadily over the last two
decades, and in 2010 it was almost double that in 1989. This rise in wage inequality was
more marked in the traditionally low capital-intensive manufacturing group, where the
skilled-unskilled wage ratio in 2007 was about 2.1 times that in 1989. The corresponding
figure for the traditionally high capital-intensive group was 1.9 percentage points and 1.8
percentage points for the traditionally labour-intensive group. This was the pattern up to the
pre-crisis period 1989-2007. However, there has been a decline in the skilled-unskilled
wage ratio in the post-crisis period, i.e. from 2008 to 2010, across all manufacturing
groups.
Table 19. Skilled-unskilled wage ratio by industry group
Year Traditionally labour
intensive Traditionally low-capital intensive
Traditionally high-capital intensive
Aggregate organized manufacturing
1989 2.0 1.8 1.8 2.0
1993 2.0 1.7 2.1 2.1
2000 2.9 2.6 2.5 2.9
2004 3.4 3.0 3.0 3.4
2007 3.8 3.9 3.7 4.1
2010 3.4 3.8 3.3 3.9
Before concluding the discussion on wages in organized manufacturing, it should be
noted that the income share of labour in gross value added has declined over time. As
shown in Figure 3.1 in Section 3, the wage share in value added in organized
manufacturing declined by about 10 percentage points between 1993-94 and 2007-08.
Analysis of changes in wage share at a disaggregate level reveals that in a majority of two-
digit industries, the wage share in value added declined in this period (Goldar, 2013). From
an examination of the wage and value added data for two-digit industries, it appears that the
decline in wage share in value added in the traditionally labour-intensive industry group, if
any, was lower than that in the traditionally capital-intensive industries.
4.2. Wages and wage inequalities in aggregate manufacturing
Given the importance of the unorganized manufacturing segment within the Indian
manufacturing sector, this section covers both organized and unorganized segments
together along the lines of the earlier discussion presented in Section 4.2. The Employment
and Unemployment Survey (EUS) data cover the aggregate manufacturing sector with
detailed information on wages of manufacturing labour categorized on the basis of their
employment status (i.e. regular/wage labour, casual labour, and self-employed labour),
level of education, gender etc. Unlike the section on aggregate manufacturing employment,
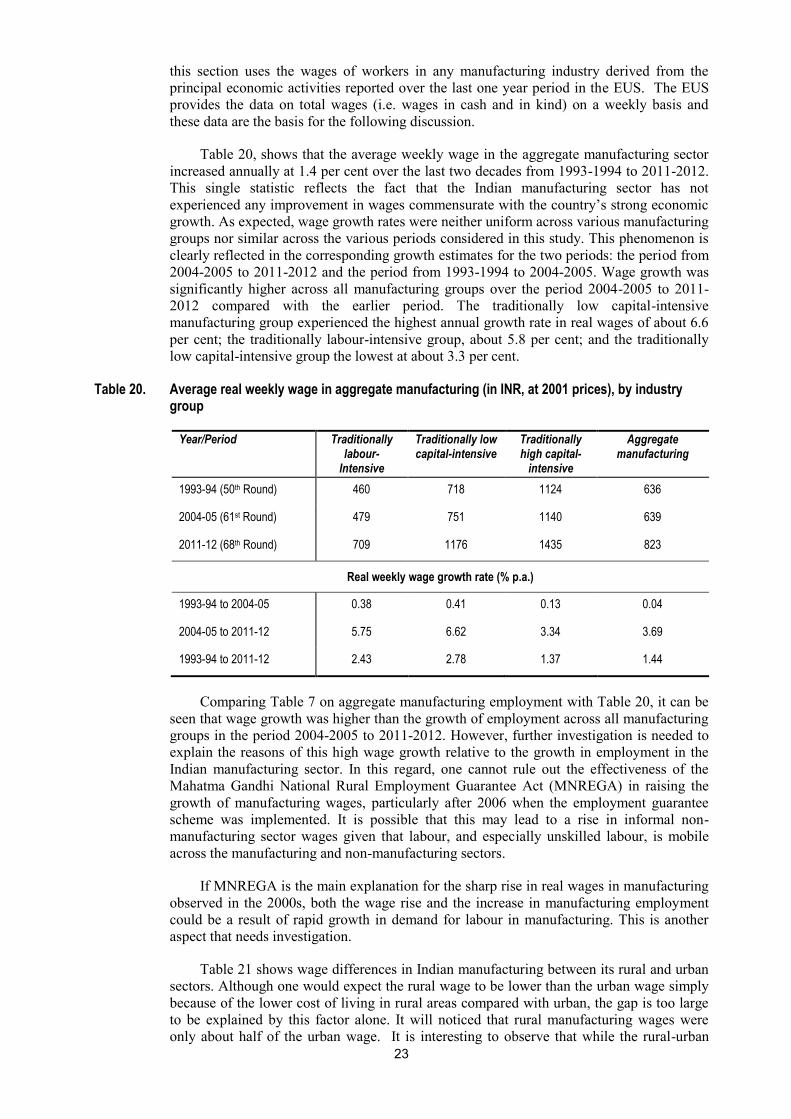
23
this section uses the wages of workers in any manufacturing industry derived from the
principal economic activities reported over the last one year period in the EUS. The EUS
provides the data on total wages (i.e. wages in cash and in kind) on a weekly basis and
these data are the basis for the following discussion.
Table 20, shows that the average weekly wage in the aggregate manufacturing sector
increased annually at 1.4 per cent over the last two decades from 1993-1994 to 2011-2012.
This single statistic reflects the fact that the Indian manufacturing sector has not
experienced any improvement in wages commensurate with the country’s strong economic
growth. As expected, wage growth rates were neither uniform across various manufacturing
groups nor similar across the various periods considered in this study. This phenomenon is
clearly reflected in the corresponding growth estimates for the two periods: the period from
2004-2005 to 2011-2012 and the period from 1993-1994 to 2004-2005. Wage growth was
significantly higher across all manufacturing groups over the period 2004-2005 to 2011-
2012 compared with the earlier period. The traditionally low capital-intensive
manufacturing group experienced the highest annual growth rate in real wages of about 6.6
per cent; the traditionally labour-intensive group, about 5.8 per cent; and the traditionally
low capital-intensive group the lowest at about 3.3 per cent.
Table 20. Average real weekly wage in aggregate manufacturing (in INR, at 2001 prices), by industry group
Year/Period Traditionally labour-
Intensive
Traditionally low capital-intensive
Traditionally high capital-
intensive
Aggregate manufacturing
1993-94 (50th Round) 460 718 1124 636
2004-05 (61st Round) 479 751 1140 639
2011-12 (68th Round) 709 1176 1435 823
Real weekly wage growth rate (% p.a.)
1993-94 to 2004-05 0.38 0.41 0.13 0.04
2004-05 to 2011-12 5.75 6.62 3.34 3.69
1993-94 to 2011-12 2.43 2.78 1.37 1.44
Comparing Table 7 on aggregate manufacturing employment with Table 20, it can be
seen that wage growth was higher than the growth of employment across all manufacturing
groups in the period 2004-2005 to 2011-2012. However, further investigation is needed to
explain the reasons of this high wage growth relative to the growth in employment in the
Indian manufacturing sector. In this regard, one cannot rule out the effectiveness of the
Mahatma Gandhi National Rural Employment Guarantee Act (MNREGA) in raising the
growth of manufacturing wages, particularly after 2006 when the employment guarantee
scheme was implemented. It is possible that this may lead to a rise in informal non-
manufacturing sector wages given that labour, and especially unskilled labour, is mobile
across the manufacturing and non-manufacturing sectors.
If MNREGA is the main explanation for the sharp rise in real wages in manufacturing
observed in the 2000s, both the wage rise and the increase in manufacturing employment
could be a result of rapid growth in demand for labour in manufacturing. This is another
aspect that needs investigation.
Table 21 shows wage differences in Indian manufacturing between its rural and urban
sectors. Although one would expect the rural wage to be lower than the urban wage simply
because of the lower cost of living in rural areas compared with urban, the gap is too large
to be explained by this factor alone. It will noticed that rural manufacturing wages were
only about half of the urban wage. It is interesting to observe that while the rural-urban
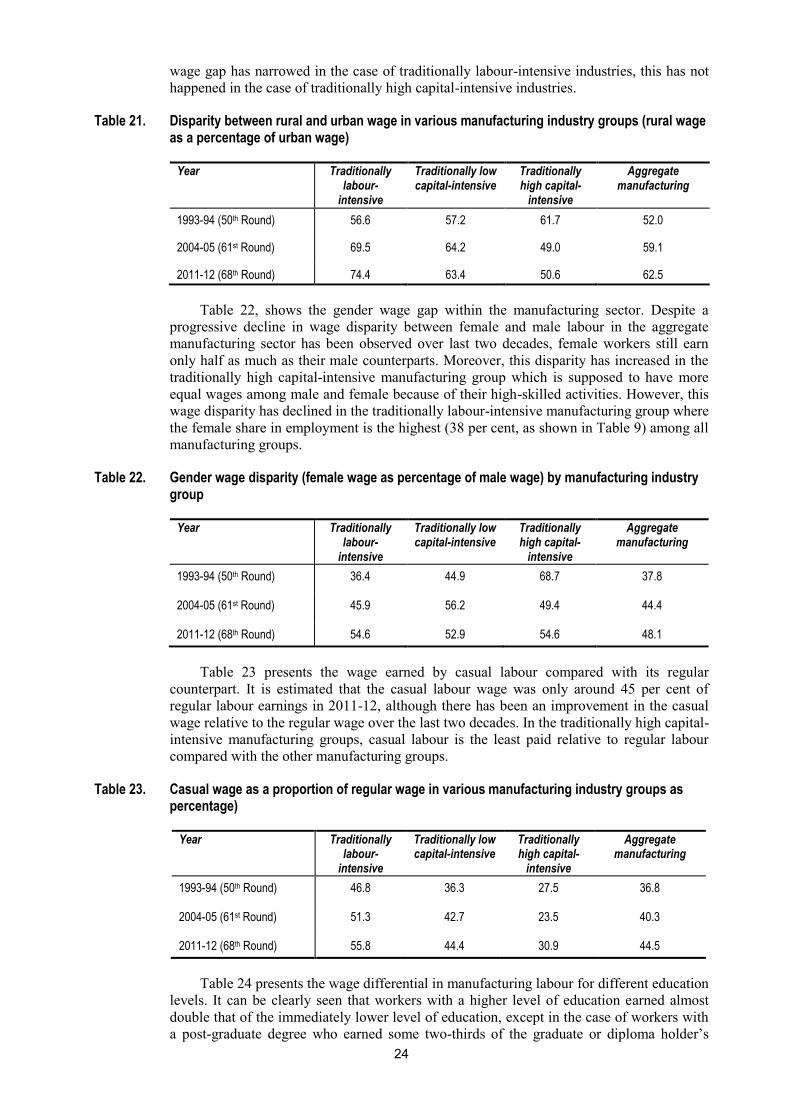
24
wage gap has narrowed in the case of traditionally labour-intensive industries, this has not
happened in the case of traditionally high capital-intensive industries.
Table 21. Disparity between rural and urban wage in various manufacturing industry groups (rural wage as a percentage of urban wage)
Year Traditionally labour-
intensive
Traditionally low capital-intensive
Traditionally high capital-
intensive
Aggregate manufacturing
1993-94 (50th Round) 56.6 57.2 61.7 52.0
2004-05 (61st Round) 69.5 64.2 49.0 59.1
2011-12 (68th Round) 74.4 63.4 50.6 62.5
Table 22, shows the gender wage gap within the manufacturing sector. Despite a
progressive decline in wage disparity between female and male labour in the aggregate
manufacturing sector has been observed over last two decades, female workers still earn
only half as much as their male counterparts. Moreover, this disparity has increased in the
traditionally high capital-intensive manufacturing group which is supposed to have more
equal wages among male and female because of their high-skilled activities. However, this
wage disparity has declined in the traditionally labour-intensive manufacturing group where
the female share in employment is the highest (38 per cent, as shown in Table 9) among all
manufacturing groups.
Table 22. Gender wage disparity (female wage as percentage of male wage) by manufacturing industry group
Year Traditionally labour-
intensive
Traditionally low capital-intensive
Traditionally high capital-
intensive
Aggregate manufacturing
1993-94 (50th Round) 36.4 44.9 68.7 37.8
2004-05 (61st Round) 45.9 56.2 49.4 44.4
2011-12 (68th Round) 54.6 52.9 54.6 48.1
Table 23 presents the wage earned by casual labour compared with its regular
counterpart. It is estimated that the casual labour wage was only around 45 per cent of
regular labour earnings in 2011-12, although there has been an improvement in the casual
wage relative to the regular wage over the last two decades. In the traditionally high capital-
intensive manufacturing groups, casual labour is the least paid relative to regular labour
compared with the other manufacturing groups.
Table 23. Casual wage as a proportion of regular wage in various manufacturing industry groups as percentage)
Year Traditionally labour-
intensive
Traditionally low capital-intensive
Traditionally high capital-
intensive
Aggregate manufacturing
1993-94 (50th Round) 46.8 36.3 27.5 36.8
2004-05 (61st Round) 51.3 42.7 23.5 40.3
2011-12 (68th Round) 55.8 44.4 30.9 44.5
Table 24 presents the wage differential in manufacturing labour for different education
levels. It can be clearly seen that workers with a higher level of education earned almost
double that of the immediately lower level of education, except in the case of workers with
a post-graduate degree who earned some two-thirds of the graduate or diploma holder’s
25
income in 1993-94. Thus, apart from 1993-94, it is fair to say that the educational premium
exists in the Indian manufacturing sector.
As noted above, the growth of real wages in aggregate manufacturing was much
higher in the period 2004-05 to 2011-12 than in the earlier period 1993-94 to 2004-05, at
3.7 per cent per annum and 0.04 per cent per annum respectively (Table 5.4). The high
growth rate of real wages in the period 2004-05 to 2011-12 compared with the earlier
decade is found for all educational levels, except for workers at post-graduate level. One
possibility is that the estimated wage of post-graduate workers in manufacturing for 1993-
94 substantially understates their true average wage. Since the sample size is small, this
cannot be ruled out.
Primary or below primary educated labour gained more than their secondary or
higher-secondary counterparts in last decade. On the other hand, the wages of workers at
graduate or diploma level have grown faster than those of workers with secondary or higher
secondary education. Thus, there were two opposing forces at work: one raising the wage
of the lowest educational category and reducing wage inequality; the other, raising the
wages of graduates and diploma holders, tending to enhance wage inequality.
Table 24. Weekly real wage for labour with different educational levels in various manufacturing industry groups
Traditionally labour-intensive
Traditionally low capital-intensive
Traditionally high capital-intensive
Total manufacturing
Educational Level 1993-94
2004-05
2011-12
1993-94
2004-05
2011-12
1993-94
2004-05
2011-12
1993-94
2004-05
2011-12
Primary or below primary + 380 558 452 469 674 677 536 714 454 416 596
Secondary or higher secondary
684 635 811 869 902 987 993 1163 1125 817 803 920
Graduate or diploma 1790 1310 1626 2244 1452 2159 2377 1925 2366 2221 1548 2047
Post-graduate 1438 2077 2940 1400 2439 3548 1673 3095 3021 1503 2584 3324
Wage ratio of labour with different levels of education
Primary and below primary to secondary or higher secondary
0.5 0.6 0.7 0.5 0.5 0.7 0.7 0.5 0.6 0.6 0.5 0.6
Secondary or higher secondary to Graduate or diploma
0.4 0.5 0.5 0.4 0.6 0.5 0.4 0.6 0.5 0.4 0.5 0.4
Graduate or diploma to post-graduate
1.2 0.6 0.6 1.6 0.6 0.6 1.4 0.6 0.8 1.5 0.6 0.6
Growth of weekly real wage for labour with different educational levels, by manufacturing industry group
Primary and below primary
0.21 5.64 0.34 5.31 -2.09 4.18 -0.80 5.27
Secondary or higher secondary
-0.67 3.55 0.34 1.29 1.45 -0.48 -0.15 1.95
Graduate or diploma -2.80 3.13 -3.88 5.83 -1.90 2.99 -3.23 4.07
Post-graduate 3.40 5.09 5.17 5.50 5.75 -0.35 5.05 3.66
26
5. Explaining the trends: Employment
Employment growth in Indian manufacturing in the post-reform period has been
slower than was hoped at the time the reforms were initiated and also slower than required
to transform the Indian economy into an industrial economy. Part of the blame for the
weak employment growth performance of Indian manufacturing must fall on the less than
satisfactory growth in output. The share of manufacturing in GDP has remained static while
the share of services has increased.15
Another part of the blame should fall on the fact that
the structure of Indian manufacturing has not shifted in favour of labour-intensive
industries though there are theoretical reasons to expect such a shift in the structure of
exports and hence in the structure of production in the manufacturing sector because of
liberalization of trade. In addition, there has been a strong tendency on the part of
entrepreneurs to go for more and more capital-intensive production methods. Indeed, even
the labour-intensive industries have increased their capital intensity over time (ICEIER,
2008).
One important reason why the manufacturing sector has not been able to grow fast
enough to increase its share in national GDP is that Indian manufacturing faces a number of
serious constraints on its growth. One of the foremost of these is inadequate
infrastructure.16
A related issue is the availability of land for setting up industrial units.
Both of these are commonly regarded as major problems faced by the Indian manufacturing
sector. In comparison with manufacturing, services are less constrained by inadequate
infrastructure or difficulties in land acquisition. This factor has favoured services sector
growth rather than manufacturing sector growth.
Another major obstacle to manufacturing sector growth is rigidities in the labour
market. There is a widely held view that labour regulations have constrained manufacturing
sector growth as well as employment generation in this sector. Various studies have
provided evidence of the adverse effect of labour market rigidities on manufacturing
productivity (e.g. Veeramani and Goldar, 2005; and Mitra and Ural, 2008). By implication,
these labour market rigidities will tend to lower manufacturing sector growth. Another set
of studies has linked labour market rigidities to the phenomenon of the “missing middle” in
Indian manufacturing. Again, this problem adversely affects industrial efficiency and thus
constrains growth.17
Goldar (2011) has examined the surge in the growth rate in employment in organized
manufacturing after 2003 and has presented empirical evidence that suggests that one of the
contributing factors to rapid employment growth in recent years has been the labour market
reforms undertaken by the states. This lends support to the argument that labour market
rigidities are one of the main factors responsible for slow employment growth in organized
manufacturing.
Besides affecting the quantity of employment generation, labour regulations have
adversely affected the quality of industrial jobs created. A number of studies have
presented econometric evidence indicating that labour regulations have been responsible for
the growing use of contract workers in organized industry (Sen et al. 2010; Saha, et al.
15 The new National Manufacturing Policy aims at boosting the growth rate of output in manufacturing so as to
increase the share of manufacturing in GDP from about 15 per cent at present to about 25 per cent in the next
ten years. Crucially, whether it will actually be possible to raise the share of manufacturing in GDP rests on the
successful implementation of the new policy. 16 There have been several econometric studies linking infrastructure to industrial performance. Goel (2002),
Mitra et al. (2002) and Mitra et al. (2012), among others, have presented evidence of the positive effects of
infrastructure availability on Indian manufacturing productivity. 17 Majurdar and Sarkar (2008) discuss how the “missing middle” pulls down manufacturing growth. According
to them, the phenomenon of the “missing middle” is attributable to the policy of protecting small-scale
industries, education policy biased towards promotion of tertiary education, and labour laws in the formal
manufacturing sector.
27
2013; Ramaswamy, 2013). Other studies have shown that labour reform will lead to an
increase in regular industrial jobs in place of casual jobs (Goldar and Aggarwal, 2012a,
2012b). Some of these studies have shown that import competition has induced the
casualization or contractualization of industrial labour and this tendency can be curbed by
labour market reforms.
Labour regulations together with an education policy subsidizing tertiary education
has made poorly educated labour costlier and well educated workers cheaper than otherwise
would have been the case. Capital is also subsidized in various ways, such as cheap credit.
The outcome of these policies is that capital and skills have become relatively cheap while
unskilled labour has become more costly to entrepreneurs. This has created a bias in favour
of services and against manufacturing (Ghosh, 2013). Moreover, within manufacturing,
this causes a bias in favour of capital-intensive, skill-intensive industries.
Other policies have favoured services at the expense of manufacturing. Services have
been subject to lighter taxation than manufacturing. Trade and foreign direct investment
policies have been more favourable to services than manufacturing (Ghosh, 2013). It is also
interesting to observe that liberalization of imports of manufactured products has helped the
services sector to improve productivity and thus attain a faster growth. This is an argument
made by Dehejia and Panagariya (2010), supported by empirical evidence.
6. Explaining the trends: Wages and wage inequality
Section 4 above discusses the trends in wage and wage inequality in India’s organized
manufacturing and aggregate manufacturing separately. The analysis showed that the level
of wages and the rate of change in wages were significantly different between organized
and aggregate manufacturing. The level of average wages in organized manufacturing
exceeded that in aggregate manufacturing, implying thereby that wages in unorganized
manufacturing are lower than that in organized manufacturing. The growth of real wages in
the organized manufacturing segment was nearly one percentage point higher than that of
aggregate manufacturing in the 1990s, thus indicating higher growth of real wages than in
its unorganized counterpart. However, it is interesting to note that the growth rate in real
wages in the organized manufacturing has declined during the last decade. the period 2000
to 2010, in comparison with the previous decade. By contrast, comparable data for
aggregate manufacturing show an improvement in the growth rate of real wages in the
period 2004-05 to 2011-12 compared with the earlier period, 1993-94 to 2004-05. This
suggests an increase in wage growth in the unorganized segment of the Indian
manufacturing sector in the period 2004-05 to 2011-12 compared with the previous period
1993-1994 to 2004-2005. The relatively slow growth of average real wages in organized
manufacturing in the 2000s was accompanied by near stagnation in unskilled labour wages,
and a rise in skilled labour wages, signifying a sharp rise in wage inequality between skilled
and unskilled labour.
The average growth rate in real wages in organized manufacturing in the two decades
following the economic reforms was only about 1.5 per cent per annum. This is not
impressive when a comparison is made with the growth in real value added in organized
manufacturing or with the growth rate in real per capita income in India.18
Also, there was
a downward trend in the share of wages in value added in organized manufacturing. The
fact that the growth in real wages in organized manufacturing has been slow and the share
of wages in value added has declined over time means that the performance of the
organized manufacturing sector in the matter of compensation paid to workers has not been
satisfactory.
18 Between 1993-94 and 2009-10, net national product (NNP) per capita at constant prices grew at the rate of
5.1 per cent per annum (Goldar, 2013).
28
How can the slow growth in real wages and downward trend in wage share in
organized manufacturing be explained? Three factors stand out. First, several studies have
found that trade liberalization tends to eliminate rents associated with restrictive trade
regimes and this causes a downward pressure on wages. Some studies undertaken for India
have shown that such forces were also at work in Indian manufacturing (Goldar, 2004;
Vasudeva-Dutta, 2007). Secondly, the wages of contract workers are substantially lower
than those of directly employed workers and the proportion of contract workers in the
overall total of total workers employed has increased over time (Goldar 2013, Sood et al.
2013), thus reducing the average wages of workers overall. Moreover, the real wages of
directly employed workers fell at the rate of 0.12 per cent per annum during the 2000s, and
although the real wages of contract workers grew by 3.25 per cent per annum (Sood, et al.
2013), the average real wages of workers overall, directly employed and contract workers
together, fell by an annual 0.19 per cent . Thirdly, workers have not been able to obtain
wage rises much above the growth in the cost of living because the bargaining power of
industrial workers constantly diminished in the post-reform period (Goldar, 2004; Goldar
and Agarwal, 2005; Sood et al., 2013). Two other factors may also partly explain the
downward trend in wage share in value added in India’s organized manufacturing: labour
saving technical change and the increasing export orientation of Indian industries. The
effect of labour saving technical change in the downward share in wage share in organized
manufacturing is suggested by the econometric results of the study undertaken by Virmani
and Hashim (2009). As regards the effect of rising export intensity, Onaran (2007) finds
that increasing export intensity led to a decline in the wage share in manufacturing in
Turkey and Mexico (although no significant effect was found in the case of Korea). For
India’s organized manufacturing sector, a similar effect of export intensity on labour share
in value added is indicated by the econometric analysis of wage share presented in Goldar
(2013).
The analysis of wage trends for the aggregate manufacturing sector presented in
Section 4 above shows that in the two decades of the post-reform period there has been
some reduction in the rural-urban wage divide, the gender wage gap, and the wage gap
between casual and regular labour. However, the average rate of growth in real wages in
Indian manufacturing in the period 1993-1994 to 2011-12 was rather low, at about 1.4 per
cent per annum. The explanation for this lies in the fact that the changes in the production
structure that took place in India during the post-reform period have not given a boost to
aggregate labour demand and have thus failed to create an upward pressure on wages
(Goldar, 2013). While the services sector has grown rapidly, it has not created sufficient
employment opportunities to attract labour from the primary sector on a large scale.
Similarly, the growth of manufacturing has not been particularly successful in creating
employment opportunities in labour-intensive industries because the structure of
manufactured exports has not moved in favour of unskilled labour-intensive products. The
implication of these developments is that the demand for unskilled labour has not risen fast
enough to create upward pressure on the wages of unskilled workers.
One observation on real wages in manufacturing that calls for an explanation is the
sharp rise in the rate of growth in real wages (3.7 per cent annually) in aggregate
manufacturing in the period 2004-05 to 2011-12 as against a marginal growth of 0.04 per
cent per annum the previous period, 1993-94 to 2004-05. The answer may lie partly in the
wage premium for education. In the period 1993-94 to 2004-05, the growth rate in real
wages for workers with secondary or higher secondary education was negative, but turned
significantly positive in the later period 2004-05 to 2011-12. This may have something to
do with the nature of the technical change that took place in Indian manufacturing.
Another possible reason for the relatively high wage growth in the aggregate
manufacturing sector in general, and the unorganized sector in particular, in the period
2004-05 to 2011-12 is the rising wages in agriculture and the rural sector since 2006, the
year when the Mahatma Gandhi National Rural Employment Guarantee Act (MNREGA)
was introduced. An increased agricultural wage and access to MNREGA schemes may
have some positive impact on the unorganized manufacturing sector wage (especially for
29
casual and unskilled labour) because of the shortage of potential unskilled labour or
increased wage-bargaining power due to the low opportunity cost of not working in that
sector. In addition, the MNREGA may have discouraged migration of rural workers to
cities to work in manufacturing units unless they are paid well. This phenomenon has also
been experienced in China over the last few years when migration from rural to urban areas
has declined due to the increase in job opportunities in rural areas, and this has led to an
increase in urban wages (Li et al. 2012).
The evidence on wages presented in Section 4 showed that higher levels of education
have contributed to higher earnings of industrial workers, and therefore, there exists an
educational premium in the Indian manufacturing sector. The analysis also indicated an
increase in the educational premium over time leading to growing wage inequality.
The observed rise in wage inequality in the Indian manufacturing sector in general and
its organized segment in particular has received a good deal of attention (see Goldar, 2013),
and a number of explanations have been suggested. The increasing use of skill-biased
technological change and the growing use of contractual labour are considered to be two of
the major factors (Sen, 2008; Sadhukhan, 2012; Goldar, 2013). India’s growth-oriented
economic reform in general and trade liberalization in particular have also contributed to
this growing wage inequality over the last two decades. Increasing competition with
developing countries, through increasing trade with the South, is another possible reason
(Sadhukhan, 2012).19
7. Conclusion
The organized and unorganized manufacturing sectors have shown different inter-
temporal growth trends. Employment in the organized sector has been growing fast in
recent years, but employment in unorganized manufacturing, which accounts for about 80
per cent of manufacturing employment, has been sluggish. Even if the rapid growth in
employment in organized manufacturing continues for some time, the employment growth
rate in in manufacturing overall will continue to be low.
The real wages of workers in unorganized manufacturing have grown relatively fast in
the recent period, 2004-2005 to 2011-2012. This appears to be attributable to rapid growth
in labour productivity. There is evidence to indicate that the unorganized manufacturing
sector is undergoing a structural transformation, moving away from self-employed
enterprises to establishments, and this has helped in attaining more rapid labour
productivity and wage growth. The employment guarantee scheme in the country’s rural
areas may also have contributed to increases in real wages in unorganized manufacturing.
In the organized manufacturing sector, real wages grew at a rapid rate in the 1990s,
but, more recently, the growth in real wages has slowed. A more disturbing phenomenon is
the downward trend in wage share in value added. This is probably attributable to the
weakening bargaining power of labour, increasing capital intensity of production and
labour saving technical change.
The wage gap between skilled and unskilled labour in manufacturing has widened
over time when trade liberalization should have had an opposite effect. There has been
extensive research on this question. The findings of these studies indicate that skill-biased
technological change and increased use of contractual labour in many industries are two
19 Mehta and Hasan (2011) have carefully examined the causes of growing wage inequality in Indian
manufacturing. Based on their analysis, they conclude that the portion of the increase in wage inequality which
can be traced to trade liberalization is only about 13 per cent. Also, the effect of services liberalization in
causing wage inequality is greater than the effect of trade liberalization.
30
very important explanatory factors. In addition, India’s growth-oriented economic reform
in general and trade liberalization in particular have contributed to this growing wage
inequality in Indian manufacturing over last two decades.
A key reason for the unsatisfactory growth performance of Indian manufacturing in
terms of employment is that output growth has not been high enough. There are several
constraints on manufacturing sector growth including lack of infrastructure and inadequate
policies. Labour market rigidities and an education policy directed at subsidized tertiary
education have worked to the detriment of employment generation in manufacturing.
Unless these problems are addressed, it will be difficult to achieve high growth in
manufacturing, sustained over a long period, and unless that is done, the performance of the
manufacturing sector in terms of employment generation, both quantity and quality, will
fall far short of satisfactory.
31
References
Chatterjee, U. and Kanbur, R. 2013. Regulation and non-compliance: Magnitudes and
Patterns for India’s Factories Act, Paper presented at the 55th Annual Conference of
the Indian Society of Labour Economics, Jawaharlal Nehru University, December 16-
18.
Dehejia, R. and Panagariya, A. 2010. Services growth in India: A look inside the black box,
Working Paper No. 2010-4, Columbia Program on Indian Economic Policies
Goel, D. 2002. Impact of infrastructure on productivity: Case of Indian registered
manufacturing”, Working paper no. 106, Center for Development Economics, Delhi
School of Economics, Delhi.
Goldar, B. 2004. “Trade Liberalisation and real wages in organised manufacturing industries
in India”, in Karnik A. and Burange L.G. (eds.), Economic policies and the emerging
scenario: Challenges to government and industry, Himalaya, Mumbai.
---. 2011. Growth in organized manufacturing employment in recent years, Economic and
Political Weekly, February 12, 2011.
---. 2013. Wages and wage share in India during the post-reform period, Indian Journal of
Labour Economics, 56(1): 75-94.
Goldar, B. and Aggarwal S.C. 2005. Trade liberalisation and price–cost margin in Indian
industries, Developing Economies, Vol. 43, No. 3, pp. 346-73.
---. 2012a. Informalization of industrial labour in India: Effect of labour market rigidities and
import competition, Developing Economies, June, pp. 141-69.
---. 2012b. “Employment of casual workers in organized manufacturing in India: Analysis of
trends and the impact of labour reforms” paper presented at the National Seminar on
Globalisation, labour markets and employment relations in India organized by the
Institute for Human Development and the Indian Society of Labour Economics, 9‐10
July, 2012 at J.P. Nayak Bhavan, ICSSR Western Regional Centre, Mumbai.
Ghosh, A. K. 2013. The end of road for services-led growth, Business Standard, October 26,
2013.
Goldar, B. and Sreerupa S. 2013. “Post-reform trends in growth and productivity in Indian
manufacturing,” Paper presented at the Conference on Trade and industry: Patterns,
trends and policies held at IGIDR, Mumbai on 22-24 October 2013.
ICRIER. 2008. A study on labour intensity and employment potential of Indian
manufacturing, Report submitted to the National Manufacturing Competitiveness
Council, Indian Council for Research on International Economic Relations, New Delhi.
Majumdar, D. and Sarkar S. 2008. The employment problem in India and the phenomenon of
missing middle, Paper presented at the Canadian Economic Conference, Vancouver,
June 6-8, 2008.
Mehta, A. and Hasan, R. 2011. Effects of trade and services liberalization on wage inequality
in India, ADB Economics Working Paper Series No. 268, Asian Development Bank,
Manila.
Mishra, P. and Kusum Das, D. 2012. Trade liberalization and wage inequality in India: A
mandated wage equation approach,” Indian Growth and Development Review,
forthcoming.
32
Mitra, A.; Varoudakis, A. and Veganzones-Varoudakis, M-A. 2002. Productivity and
technical efficiency in Indian States’ manufacturing: The role of infrastructure,
Economic Development and Cultural Change, 50(2): 395-426.
Mitra, A.; Sharma, C. and Veganzones-Varoudakis, M-A. 2012. Estimating impact of
infrastructure on productivity and efficiency of Indian manufacturing, Applied
Economic Letters, 19: 779-83.
Mitra, D. and Ural, B.P. 2008. Indian manufacturing: A slow sector in a rapidly growing
economy, Journal of International Trade and Economic Development, 17(4): 525-559.
Onaran, Ö. 2007. Wage share, globalisation, and crisis: The case of the manufacturing
industry in Korea, Mexico, and Turkey, Working Paper No. 132, Political Economy
Research Institute, University of Massachusetts, Amherst.
Ramaswamy, K.V. 2008. Wage inequality in Indian manufacturing: Is it trade, technology or
labour regulations? Working Paper no. 2008-021, Indira Gandhi Institute of
Development Research, Mumbai.
---. 2013. Size dependent labour regulation and threshold effects: The case of contract-
worker intensity in Indian manufacturing,” Paper presented at the Conference on
Labour and Employment, September 5-6, 2013, Indira Gandhi Institute of Development
Research, Mumbai.
Roy, S. 2012. Regional disparities in growth and human development in India, ISID Working
Paper no.2012/03, Institute for Studies in Industrial Development, New Delhi.
Sadhukhan, A. 2012. Trade, technology, and institution: How do they affect wage inequality?
Evidence from Indian manufacturing, Paper presented at Asian Meet of the
Econometric Society, December 19-22, Delhi School of Economics, Delhi.
Saha, B.; Sen, K. and Maiti, D. 2013. Trade openness, labour institutions and flexibilisation:
Theory and evidence from India, Paper presented at the Conference on Labour and
Employment, September 5-6, 2013, Indira Gandhi Institute of Development Research,
Mumbai.
Sen, K.; Saha, B. and Maiti, D. 2010. Trade openness, labour institutions and flexibility:
Theory and evidence from India, BWPI Working Paper No. 123, Brooks World Poverty
Institute, University of Manchester.
Sood, A.; Nath, P. and Ghosh, S. 2013. Deregulating capital, regulating labour: The
dynamics of capital and labour in the manufacturing sector in India, Paper presented at
the 55th Annual Conference of the Indian Society of Labour Economics, Jawaharlal
Nehru University, December 16-18, 2013.
Vasudeva-Dutta, P. 2007. Trade protection and inter-industry wages in India, Industrial and
Labour Relations Review, Cornell University, ILR School, Vol. 60, No. 2, January, pp.
268-86.
Veeramani, C. and Goldar, B. 2005. Manufacturing productivity in Indian States: Does
investment climate matter? Economic and Political Weekly, June 11, 40(24): 2413-20.
Virmani, A. and Danish A. H. 2009. Factor employment, sources and sustainability of output
growth: Analysis of Indian manufacturing, Working Paper No. 3/2009, DEA, Ministry
of Finance, Government of India, New Delhi.
33
Annex 1: Product description of 3-digit manufacturing groups according to NIC 1987, NIC 1998, and NIC 2008
Product Description
NIC 1987 200 Slaughtering, preparation and preservation of meat 201 Manufacture of dairy products 202 Canning and preservation of fruits and vegetables 203 Processing, canning, and preservation of fish, crustaceans and similar foods 204 Grain milling 205 Manufacture of Bakery Products 206 Manufacture and refining of sugar (vacuum pan sugar factories) 207 Production of indigenous sugar, boora, khandsari, gur, etc. from sugar-cane, palm juice , etc. 208 Production of common salt 209 Manufacture of cocoa products and sugar confectionery (including sweetmeats) 210 Manufacture of hydrogenated oils and vanaspati ghee etc. 211 Manufacture of vegetable oils and fats (other than hydrogenated) 212 Manufacture of animal oils and fats , manufacture of fish oil 213 Processing and blending of tea including manufacture of instant tea 214 Coffee curing, roasting, grinding and blending etc. including manufacture of instant coffee 215 Processing of edible nuts 216 Manufacture of ice 217 Manufacture of prepared animal and bird feed 218 Manufacture of food products not elsewhere classified 220 Distilling, rectifying and blending of spirits, ethyl alcohol production from fermented materials 221 Manufacture of wines 222 Manufacture of malt liquors and malt 223 Production of country liquor9arrack and toddy etc.) 224 Manufacture of soft drinks and syrups 225 Tobacco stemming, re-drying and all other operations connected with preparing raw leaf tobacco 226 manufacture of bidi 227 Manufacture of cigars, cigarettes, cheroots and cigarette tobacco 228 Manufacture of snuff, zarda, chewing tobacco and other tobacco products n.e.c. (except pan masala containing
tobacco) 229 Manufacture of pan-masala, catechu (kattha) and chewing lime 230 Cotton ginning, cleaning and baling 231 Cotton spinning other than in mills (charkha) 232 Weaving and finishing of cotton khadi 233 Weaving and finishing of cotton textiles on handlooms 234 Weaving and finishing of cotton textiles on power looms 235 Cotton spinning, weaving and processing in mills 236 Bleaching, dyeing and printing of cotton textiles (This group includes bleaching, dyeing and printing of not self-
produced cotton textiles. No distinction is to be between these activities carried out on a fee or contract basis or by purchasing the materials and selling the finished products. Bleaching, dyeing and printing of self-produced textiles in composite mills is classified in class 235.4)
240 Preparation of raw wool, silk and artificial/synthetic textile fibres for spinning 241 Wool spinning, weaving and finishing other than in mills 242 Wool spinning, weaving and processing in mills 243 Bleaching and dyeing of woollen textiles 244 Spinning, weaving and finishing of silk textiles other than in mills 245 Spinning, weaving and processing of silk textiles in mills 246 Bleaching, dyeing and printing of silk textiles 247 Spinning, weaving and processing of man-made textile fibres 248 Bleaching, dyeing and printing of artificial/synthetic textile fabrics 250 Jute and mesta pressing and baling 251 Preparatory operations (including carding and combing) on jute and mesta fibres 252 Preparatory operations (including carding and combing) on coir fibres 253 Preparatory operations (including carding and combing) on sann hemp and other vegetable fibres n.e.c. 254 Spinning, weaving and finishing of jute and mesta textiles 255 Spinning, weaving and finishing of coir textiles 256 Spinning, weaving and finishing of sann hemp and other vegetable fibre textiles n.e.c. 257 Bleaching, dyeing and printing of jute and mesta textiles 258 Bleaching, dyeing and printing of coir textiles 259 Bleaching, dyeing and printing of other vegetable fibre textiles n.e.c.
34
260 Manufacture of knitted or crocheted textile products 261 Manufacture of all types of threads, cordage, ropes, twines and nets, etc. 262 Embroidery work, zari work and making of ornamental trimmings 263 Manufacture of blankets, shawls, carpets, rugs, and other similar textile products 264 Manufacture of floor coverings of jute, mesta sann-hemp and other kindled fibres and of coir 265 Manufacture of all types of textile garments and clothing accessories n.e.c. (except by purely tailoring establishments)
from not self-produced material(Note: in principle, the raw material is cut and sewn together in the establishments covered in this group)
266 Manufacture of rain coats, hats, caps and school bags etc. from waterproof textile fabrics or plastic sheeting 267 Manufacture of made-up textile articles; except apparel 268 Manufacture of waterproof textile fabrics 269 Manufacture of textiles/textile products not elsewhere classified like linoleum, padding wadding, upholstering and
filling, etc. 270 Sawing and planing of wood (other than plywood) 271 Manufacture of veneer sheets, plywood and their products 272 Manufacture of structural wooden goods (including treated timber) such as beams, posts, doors and
windows(excluding hewing and rough shaping of poles, bolts and other wood material which is classified under logging)
273 Manufacture of wooden and cane boxes, crates, drums, barrels and other containers, baskets and other wares made entirely or mainly of cane, rattan, reed, bamboo, willow, fibres, leaves and grass
274 Manufacture of wooden industrial goods n.e.c. 275 Manufacture of cork and cork products 276 Manufacture of wooden furniture and fixtures 277 Manufacture of bamboo and cane furniture and fixture 279 Manufacture of products of wood, bamboo, cane reed and grass (including articles made from coconut shells etc.)
n.e.c. 280 Manufacture of pulp, paper and paper board including manufacture of newsprint 281 Manufacture of containers and boxes of paper or paper board 282 Manufacture of paper and paper board articles and pulp products not elsewhere classified 283 Manufacture of special purpose paper whether or not printed n.e.c. 284 Printing and publishing of newspapers 285 Printing and publishing of periodicals books, journals, directories, atlases, maps, sheet music, schedules & Pamphlets
etc. 286 Printing of bank notes, currency notes, postage stamps, security passes, stamp papers and other similar products 287 Engraving, etching, and block-making etc. 288 Book binding on account of others 289 Printing and allied activities not elsewhere classified 290 Tanning, curing,, finishing, embossing and japanning of leather 291 Manufacture of footwear excluding repair) except of vulcanized or moulded rubber or plastic 292 Manufacture of wearing apparel of leather and substitutes of leather 293 Manufacture of consumer goods of leather and substitutes of leather; other than apparel and footwear(Note:
Manufacture of school bags and traveling accessories from water-proof textile fabrics is included in group 266) 294 Scrapping, currying, tanning, bleaching and dyeing of fur and other pelts for the trade 295 Manufacture of wearing apparel of fur and pelts 296 Manufacture of fur and skin rugs and other similar articles 299 Manufacture of leather and fur products n.e.c. 301 Manufacture of fertilizers and pesticides 302 Manufacture of plastics in primary forms; manufacture of synthetic rubber 303 Manufacture of paints, varnishes, and related products; artists' colours and ink 304 Manufacture of drugs, medicines and allied products 305 Manufacture of perfumes, cosmetics, lotions, hair dressings, toothpastes, soap in any form, detergents, shampoos,
shaving products, washing and cleaning preparations and other toilet preparations. 306 Manufacture of man-made fibres 307 Manufacture of matches. 308 Manufacture of explosives, ammunition and fire works 309 Manufacture of chemical products not elsewhere classified. 310 Tyre and tube industries. 311 Manufacture of footwear made primarily of vulcanised or moulded rubber and plastics. 312 Manufacture of rubber products not elsewhere classified 313 Manufacture of plastic products not elsewhere classified. 314 Manufacture of refined petroleum products (this group includes production of liquids of gaseous fuels, illuminating oils,
lubricating oils or greases or other products obtained from crude petroleum or their fractionation productions, Liquefaction of natural gas is classified in group 111 and bottling of natural gas or liquefied petroleum gas is classified in group 315)
315 Bottling of natural gas or liquefied petroleum gas. 316 Manufacture of refined petroleum products not elsewhere classified (this group includes Manufacture of variety of
35
products extracted/obtained from the products or residues of petroleum refining). 317 Processing of nuclear fuels (this group includes extraction of uranium metals from pitch blende or other uranium
bearing ores; Manufacture of alloys or dispersions or mixtures of natural uranium or its compounds, Manufacture of enriched uranium and its compounds; plutonium and its compounds; uranium depleted in U 235 and its compounds; thorium and its compounds; other radioactive elements, isotopes or compounds and non-irradiated fuel elements for use in nuclear reactors. Production of heavy water is classified in group 309.)
318 Manufacture of coke oven products (this group includes operation of coke ovens chiefly for the production of coke or semi-coke from hard-coal and lignite, retort carbon and residual products such as coal tar or pitch agglomeration of coke is included. Distillation of coal tar is classified in group 319 below)
319 Manufacture of other coal and coal tar products not elsewhere classified. 320 Manufacture of refractory products and structural clay products. 321 Manufacture of glass and glass products. 322 Manufacture of earthen and plaster products. 323 Manufacture of non-structural ceramic ware 324 Manufacture of cement, lime and plaster 325 Manufacture of mica products 326 Stone dressing and crushing, Manufacture of structural stone goods and stone ware. 327 Manufacture of asbestos cement and other cement products. 329 Manufacture of miscellaneous non-metallic mineral products not elsewhere classified. 330 Manufacture of iron and steel in primary/semi-finished forms. 340 Manufacture of fabricated structural metal products. 341 Manufacture of fabricated metal products not elsewhere classified. 342 Manufacture of furniture and fixtures primarily of metal 343 Manufacture of hand tools, weights and measures and general hardware. 344 Forging, pressing, stamping and roll-forming of metal; power metallurgy. (This group includes production of a wide
variety of finished or semi-finished metal products, by means of the above activities which, individually, would be characteristically produced in other activity categories)
345 Treatment or coating of metals; general mechanical engineering on a sub-contract basis. (This group includes plating, polishing, anodizing, engraving, printing, hardening, buffing, deburring, sand blasting, welding or other specialised operations on metals on a fee or contract basis. The units classified here, generally, do not take ownership of the goods nor do they sell them to third parties).
346 Manufacture of metal cutlery, utensils and kitchenware 349 Manufacture of metal products (except machinery and equipment) not elsewhere classified 350 Manufacture of agricultural machinery and equipment and parts thereof 351 Manufacture of machinery and equipment used by construction and mining industries 352 Manufacture of prime movers, boilers, steam generating plants and nuclear reactors 353 Manufacture of industrial machinery for food and textile industries (including bottling and filling machinery) 354 Manufacture of industrial machinery for other than food and textile industries 355 Manufacture of refrigerators, air conditioners and firefighting equipment and their parts and accessories. 356 Manufacture of general purpose non-electrical machinery/equipment, their components and accessories, n.e.c. 357 Manufacture of machine tools, their parts and accessories 358 Manufacture of office, computing and accounting machinery and parts, (Note: Manufacture of computers and
computer based systems including word processors is classified in group 367) 359 Manufacture of special purpose machinery/equipment, their components and accessories n.e.c. 360 Manufacture of electrical industrial machinery, apparatus and parts thereof 361 Manufacture of insulated wires and cables, including manufacture of optical fibre cables 362 Manufacture of accumulators, primary cells and primary batteries 363 Manufacture of electric lamps 364 Manufacture of electric fans and electric/electro-thermic domestic appliances and parts thereof 365 Manufacture of apparatus for radio broadcasting, television transmission, radar apparatus and radio-remote control
apparatus and apparatus for radio/line telephony and line telegraphy 366 Manufacture of television receivers; reception apparatus for radio broadcasting, radio telephony/telegraphy, video
recording or reproducing apparatus, turn-tables, record-players, cassette-players and other sound reproducing apparatus, sound recording reproducing apparatus, microphones, loudspeakers, amplifiers and sound amplifiers and pre-recorded audio/video records/tapes.
367 Manufacture of computers and computer based systems 368 Manufacture of electronic valves and tubes and other electronic components n.e.c. 369 Manufacture of radiographic X-ray apparatus X-ray tubes and parts and manufacture of electrical equipment n.e.c. 370 Ship and boat building 371 Manufacture of locomotives and parts 372 Manufacture of railway/tramway wagons and coaches and other railroad equipment n.e.c. 373 Manufacture of heavy motor vehicles; coach work 374 Manufacture of motor cars and other motor vehicles principally designed for the transport of less than 10 persons
(includes manufacture of racing cars and golf-cars etc.) 375 Manufacture of motor-cycles and scooters and parts (including three-wheelers) 376 Manufacture of bicycles, cycle-rickshaws
36
377 Manufacture of aircraft, spacecraft and their parts 378 Manufacture of bullock-carts, push-carts and hand-carts etc. 379 Manufacture of transport equipment and parts not elsewhere classified 380 Manufacture of medical, surgical, scientific and measuring equipment except optical equipment 381 Manufacture of photographic, cinematographic and optical goods and equipment (excluding photochemicals,
sensitised paper and film) 382 Manufacture of watches and clocks 383 Manufacture of jewellery and related articles 384 Minting of currency coins 385 Manufacture of sports and athletic gooks 386 Manufacture of musical instruments (Note: Manufacture of toy musical instruments is classified in group 389) 387 Manufacture of stationery articles n.e.c. 388 Manufacture of items based on solar energy like solar cells, cookers, air and water heating systems and other related
items 389 Manufacture of miscellaneous products not elsewhere classified
NIC 1998 151 Production, processing and preservation of meat, fish, fruit vegetables, oils and fats 152 Manufacture of dairy products 153 Manufacture of grain mill products, starches and starch products, and prepared animal feeds 154 Manufacture of other food products 155 Manufacture of beverages 160 Manufacture of tobacco products 171 Spinning, weaving and finishing of textiles 172 Manufacture of other textiles 173 Manufacture of knitted and crocheted fabrics and articles 181 Manufacture of wearing apparel, except fur apparel 182 Dressing and dyeing of fur; manufacture of articles of fur 191 Tanning and dressing of leather, manufacture of luggage, handbags, saddlery and harness 192 Manufacture of footwear 201 Saw milling and planing of wood 202 Manufacture of products of wood, cork, straw and plaiting materials 210 Manufacture of paper and paper product 221 Publishing 222 Printing and service activities related to printing 223 Reproduction of recorded media 231 Manufacture of coke oven products 232 Manufacture of refined petroleum products 233 Processing of nuclear fuels 241 Manufacture of basic chemicals 242 Manufacture of other chemical products 243 Manufacture of man-made fibres 251 Manufacture of rubber products 252 Manufacture of plastic products 261 Manufacture of glass and glass products 269 Manufacture of non-metallic mineral products n.e.c. 271 Manufacture of Basic Iron & Steel 272 Manufacture of basic precious and non-ferrous metals 273 Casting of metals 281 Manufacture of structural metal products, tanks, reservoirs and steam generators 289 Manufacture of other fabricated metal products; metal working service activities 291 Manufacture of general purpose machinery 292 Manufacture of special purpose machinery 293 Manufacture of domestic appliances, n.e.c. 300 Manufacture of office, accounting and computing machinery 311 Manufacture of electric motors, generators and transformers 312 Manufacture of electricity distribution and control apparatus 313 Manufacture of insulated wire and cable 314 Manufacture of accumulators, primary cells and primary batteries 315 Manufacture of electric lamps and lighting equipment 319 Manufacture of other electrical equipment n.e.c. 321 Manufacture of electronic valves and tubes and other electronic components 322 Manufacture of television and radio transmitters and apparatus for line telephony and line telegraphy 323 Manufacture of television and radio receivers, sound or video recording or reproducing apparatus, and associated
goods 331 Manufacture of medical appliances and instruments and appliances for measuring, checking, testing, navigating and
other purposes except optical instruments
37
332 Manufacture of optical instruments and photographic equipment 333 Manufacture of watches and clocks 341 Manufacture of motor vehicles 342 Manufacture of bodies (coach work) for motor vehicles; manufacture of trailers and semi-trailers 343 Manufacture of parts and accessories for motor vehicles and their engines 351 Building and repair of ships & boats 352 Manufacture of railway and tramway locomotives and rolling stock 353 Manufacture of aircraft and spacecraft 359 Manufacture of transport equipment n.e.c. 361 Manufacture of furniture 369 Manufacturing n.e.c.
NIC 2008 101 Processing and preserving of meat 102 Processing and preserving of fish, crustaceans and molluscs 103 Processing and preserving of fruit and vegetables 104 Manufacture of vegetable and animal oils and fats 105 Manufacture of dairy products 106 Manufacture of grain mill products, starches and starch products 107 Manufacture of other food products 108 Manufacture of prepared animal feeds 110 Manufacture of beverages 120 Manufacture of tobacco products 131 Spinning, weaving and finishing of textiles 139 Manufacture of other textiles 141 Manufacture of wearing apparel, except fur apparel 142 Manufacture of articles of fur 143 Manufacture of knitted and crocheted apparel 151 Tanning and dressing of leather; manufacture of luggage, handbags, saddlery 152 Manufacture of footwear 161 Sawmilling and planing of wood 162 Manufacture of products of wood, cork, straw and plaiting materials 170 Manufacture of paper and paper products 181 Printing and service activities related to printing 182 Reproduction of recorded media 191 Manufacture of coke oven products 192 Manufacture of refined petroleum products 201 Manufacture of basic chemicals, fertilizer and nitrogen compounds, plastics 202 Manufacture of other chemical products 203 Manufacture of man-made fibres 210 Manufacture of pharmaceuticals, medicinal chemical and botanical products 221 Manufacture of rubber products 222 Manufacture of plastics products 231 Manufacture of glass and glass products 239 Manufacture of non-metallic mineral products n.e.c. 241 Manufacture of basic iron and steel 242 Manufacture of basic precious and other non-ferrous metals 243 Casting of metals 251 Manufacture of structural metal products, tanks, reservoirs and steam 252 Manufacture of weapons and ammunition 259 Manufacture of other fabricated metal products; metalworking service 261 Manufacture of electronic components 262 Manufacture of computers and peripheral equipment 263 Manufacture of communication equipment 264 Manufacture of consumer electronics 265 Manufacture of measuring, testing, navigating and control equipment; 266 Manufacture of irradiation, electromedical and electrotherapeutic 267 Manufacture of optical instruments and equipment 268 Manufacture of magnetic and optical media 271 Manufacture of electric motors, generators, transformers and electricity 272 Manufacture of batteries and accumulators 273 Manufacture of wiring and wiring devices 274 Manufacture of electric lighting equipment 275 Manufacture of domestic appliances 279 Manufacture of other electrical equipment 281 Manufacture of general purpose machinery 282 Manufacture of special-purpose machinery

38
291 Manufacture of motor vehicles 292 Manufacture of bodies (coachwork) for motor vehicles; manufacture of 293 Manufacture of parts and accessories for motor vehicles 301 Building of ships and boats 302 Manufacture of railway locomotives and rolling stock 303 Manufacture of air and spacecraft and related machinery 304 Manufacture of military fighting vehicles 309 Manufacture of transport equipment n.e.c. 310 Manufacture of furniture 321 Manufacture of jewellery, bijouterie and related articles 322 Manufacture of musical instruments 323 Manufacture of sports goods 324 Manufacture of games and toys 325 Manufacture of medical and dental instruments and supplies 329 Other manufacturing n.e.c.
n.e.c: not elsewhere classified
39
Annex 2: Composition of different manufacturing industry clusters and corresponding NICs
Traditionally labour-intensive
Industry Code based on 1960 ASI
Product Description NIC 1987
NIC 1998
NIC 2008
203 Canning and preserving of fruits and vegetables 202 151 103
204 Canning and preserving of fish and other sea foods 203 102
205 Manufacture of grain mill products 204 106
208 Manufacture of cocoa, chocolate and sugar confectionery 209
212 Wine industries 221 155 110
220 Tobacco manufactures 225 160 120
Tobacco manufactures 226
Tobacco manufactures 227
Tobacco manufactures 228
Tobacco manufactures 229
231 Spinning, weaving and finishing of textiles 230 171 131
Spinning, weaving and finishing of textiles 231 172
Spinning, weaving and finishing of textiles 232
Spinning, weaving and finishing of textiles 233
Spinning, weaving and finishing of textiles 234
Spinning, weaving and finishing of textiles 235
Spinning, weaving and finishing of textiles 236
Spinning, weaving and finishing of textiles 240
Spinning, weaving and finishing of textiles 241
Spinning, weaving and finishing of textiles 242
Spinning, weaving and finishing of textiles 243
Spinning, weaving and finishing of textiles 244
Spinning, weaving and finishing of textiles 245
Spinning, weaving and finishing of textiles 246
Spinning, weaving and finishing of textiles 247
Spinning, weaving and finishing of textiles 248
Spinning, weaving and finishing of textiles 251
Spinning, weaving and finishing of textiles 252
Spinning, weaving and finishing of textiles 253
Spinning, weaving and finishing of textiles 254
Spinning, weaving and finishing of textiles 255
Spinning, weaving and finishing of textiles 256
Spinning, weaving and finishing of textiles 257
Spinning, weaving and finishing of textiles 258
Spinning, weaving and finishing of textiles 259
232 Hosiery and knitted goods 260 173 143
Hosiery and knitted goods 262
Hosiery and knitted goods 263
Hosiery and knitted goods 264
Hosiery and knitted goods 265
Hosiery and knitted goods 266
Hosiery and knitted goods 267
Hosiery and knitted goods 268
Hosiery and knitted goods 269
233 Cordage, rope and twine industries 261
239 Manufacture of textiles classified , pressing 250 171 139
241 Manufacture of footwear 291 192 152
243 Manufacture of wearing apparel 292 181 141
Manufacture of wearing apparel 295 182
252 Wooden and cane containers and cane small ware 271 161
Wooden and cane containers and cane small ware 272
Wooden and cane containers and cane small ware 273
Wooden and cane containers and cane small ware 274
40
259 Manufacture of cork and wood products n.e.c. 275 202 162
Manufacture of cork and wood products n.e.c 277
Manufacture of cork and wood products n.e.c 279
291 Tanneries and leather finishing plants 290 191 151
Tanneries and leather finishing plants 293
Tanneries and leather finishing plants 294
Tanneries and leather finishing plants 296
Tanneries and leather finishing plants 299
329 Manufacture of miscellaneous products of petroleum and coal. 317
Manufacture of miscellaneous products of petroleum and coal. 318
Manufacture of miscellaneous products of petroleum and coal. 319
331 Manufacture of structural clay products 320
332 Manufacture of glass and glass products 321 261 231
339 Manufacture of non-metallic mineral products n.e.c. 329 269 239
381 Shipbuilding and repairing 370 351 301
393 manufacture of watches 382 333
395 manufacture of musical instruments 386 322
399 manufacturing industries n.e.c. 389 369 321
manufacturing industries n.e.c. 383 329
Slaughtering, preparation and preservation of meat 200
Manufacture of other food products 154 107
Traditionally low capital-intensive
Industry Code based on 1960 ASI
Product Description NIC 1987
NIC 1998
NIC 2008
206 Manufacture of bakery products 205
207 Sugar factories and refineries 206
209 Manufacture of miscellaneous food preparations 218
211 Distilling, rectifying and blending of' spirits (alcohol) 220
251 Saw mills, planing and other wood mills 270 201
260 Manufacture of furniture and fixtures 276 361 310
Manufacture of furniture and fixtures 342
280 Printing, publishing and allied industries 284 221 181
Printing, publishing and allied industries 285 222 182
Printing, publishing and allied industries 286 223
Printing, publishing and allied industries 287
Printing, publishing and allied industries 288
Printing, publishing and allied industries 289
300 Manufacture of rubber products 311 251 221
Manufacture of rubber products 312
312 Vegetable and animal oils and fats (except edible oils) 210 104
Vegetable and animal oils and fats (except edible oils) 211
Vegetable and animal oils and fats (except edible oils) 212
313 Manufacture of paints, varnishes and lacquers 303
319 Manufacture of miscellaneous chemical products 309 202
333 Manufacture of pottery, china and earthen-ware 322
350 Manufacture of metal products except machinery and transport equipment 340 273 243
Manufacture of metal products except machinery and transport equipment 341 281 251
Manufacture of metal products except machinery and transport equipment 346 289 259
Manufacture of metal products except machinery and transport equipment 349
360 Machinery, except electrical machinery 343 291 281
Machinery, except electrical machinery 350 292 282
Machinery, except electrical machinery 351
Machinery, except electrical machinery 353
Machinery, except electrical machinery 354
Machinery, except electrical machinery 356
Machinery, except electrical machinery 357
Machinery, except electrical machinery 359
370 Manufacture of electrical machinery, apparatus, appliances and supplies 352 293 264
41
Manufacture of electrical machinery, apparatus, appliances and supplies 355 311 271
Manufacture of electrical machinery, apparatus, appliances and supplies 358 312 273
Manufacture of electrical machinery, apparatus, appliances and supplies 360 313 274
Manufacture of electrical machinery, apparatus, appliances and supplies 363 314 279
Manufacture of electrical machinery, apparatus, appliances and supplies 364 315
Manufacture of electrical machinery, apparatus, appliances and supplies 319
382 Manufacture of rail-road equipment 371 352 302
Manufacture of rail-road equipment 372
383 Manufacture of motor vehicles 373 341 291
Manufacture of motor vehicles 374 342 292
Manufacture of motor vehicles 343 293
385 Manufacture of motor cycles and bicycles 375
Manufacture of motor cycles and bicycles 376
386 Manufacture of aircraft 377 353 303
391 Manufacture of professional and scientific measuring and controlling
instruments
380 265
Manufacture of professional and scientific measuring and controlling
instruments
266
Manufacture of professional and scientific measuring and controlling
instruments
325
394 Jewellery
Production of common salt 208
Processing and blending of tea including manufacture of instant tea 213
Coffee curing, roasting, grinding and blending etc. including manufacture of
instant coffee
214
Processing of edible nuts 215
Manufacture of ice 216
Manufacture of prepared animal and bird feed 217 153 108
Production of country liquor9arrack and toddy etc.) 213
Manufacture of plastics in primary forms; manufacture of synthetic rubber 302 252 222
Manufacture of perfumes, cosmetics, lotions, hair dressings, toothpastes,
soap in any form, detergents, shampoos, shaving products, washing and
cleaning preparations and other toilet preparations.
305
Manufacture of man-made fibres 306 243 203
Manufacture of matches. 307
Manufacture of explosives, ammunition and fire works 308
Tyre and tube industries. 310
Manufacture of plastic products not elsewhere classified. 313
Bottling of natural gas or liquefied petroleum gas. 315
Manufacture of non-structural ceramic ware 323
Manufacture of cement, lime and plaster 325
Manufacture of mica products 326
Forging, pressing, stamping and roll-forming of metal; power metallurgy.
(This group includes production of a wide variety of finished or semi-finished
metal products, by means of the above activities which, individually, would
be characteristically produced in other activity categories)
344
Treatment or coating of metals; general mechanical engineering on a sub-
contract basis. (This group includes plating, polishing, anodizing, engraving,
printing, hardening, buffing, deburring, sand blasting, welding or other
specialised operations on metals on a fee or contract basis. The units
classified here, generally, do not take ownership of the goods nor do they
sell them to third parties).
345
Manufacture of insulated wires and cables, including manufacture of optical
fibre cables
361
Manufacture of accumulators, primary cells and primary batteries 362 314 272
Manufacture of bullock-carts, push-carts and hand-carts etc. 378
Manufacture of transport equipment and parts not elsewhere classified 379 359 309
Minting of currency coins 384
Manufacture of sports and athletic goods 385 323
Manufacture of sports and athletic goods 324
Manufacture of stationery articles n.e.c. 387
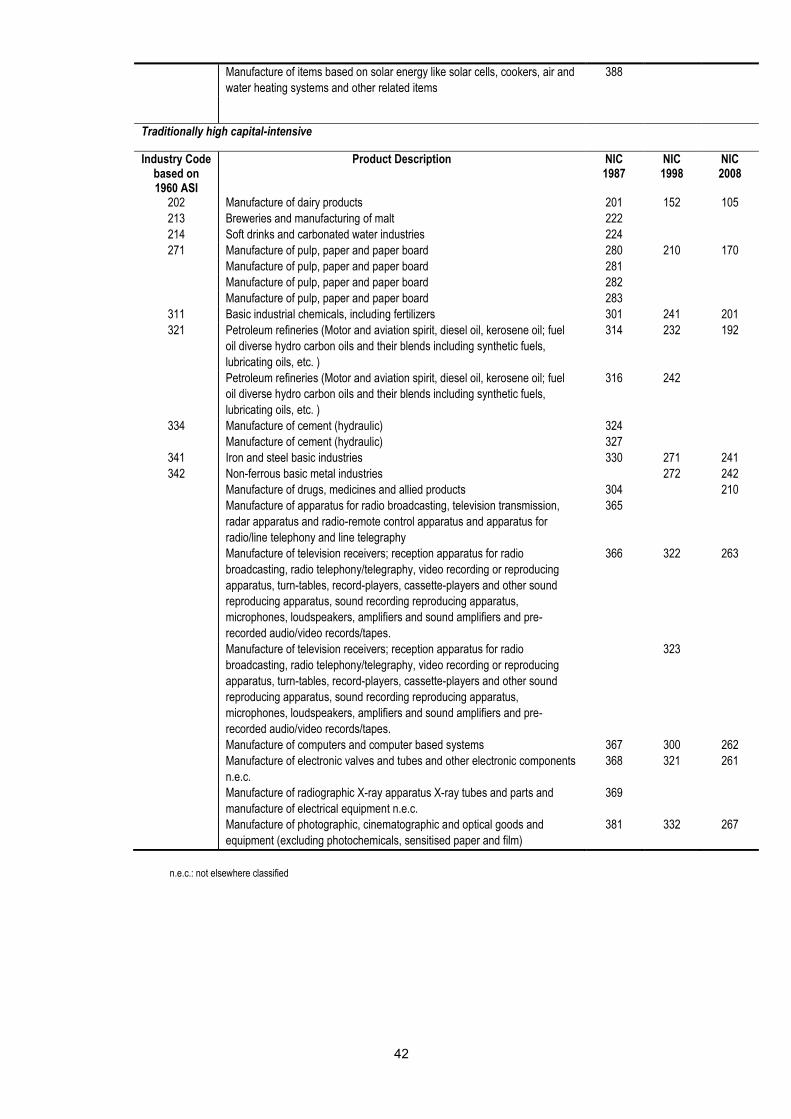
42
Manufacture of items based on solar energy like solar cells, cookers, air and
water heating systems and other related items
388
Traditionally high capital-intensive
Industry Code based on 1960 ASI
Product Description NIC 1987
NIC 1998
NIC 2008
202 Manufacture of dairy products 201 152 105
213 Breweries and manufacturing of malt 222
214 Soft drinks and carbonated water industries 224
271 Manufacture of pulp, paper and paper board 280 210 170
Manufacture of pulp, paper and paper board 281
Manufacture of pulp, paper and paper board 282
Manufacture of pulp, paper and paper board 283
311 Basic industrial chemicals, including fertilizers 301 241 201
321 Petroleum refineries (Motor and aviation spirit, diesel oil, kerosene oil; fuel
oil diverse hydro carbon oils and their blends including synthetic fuels,
lubricating oils, etc. )
314 232 192
Petroleum refineries (Motor and aviation spirit, diesel oil, kerosene oil; fuel
oil diverse hydro carbon oils and their blends including synthetic fuels,
lubricating oils, etc. )
316 242
334 Manufacture of cement (hydraulic) 324
Manufacture of cement (hydraulic) 327
341 Iron and steel basic industries 330 271 241
342 Non-ferrous basic metal industries 272 242
Manufacture of drugs, medicines and allied products 304 210
Manufacture of apparatus for radio broadcasting, television transmission,
radar apparatus and radio-remote control apparatus and apparatus for
radio/line telephony and line telegraphy
365
Manufacture of television receivers; reception apparatus for radio
broadcasting, radio telephony/telegraphy, video recording or reproducing
apparatus, turn-tables, record-players, cassette-players and other sound
reproducing apparatus, sound recording reproducing apparatus,
microphones, loudspeakers, amplifiers and sound amplifiers and pre-
recorded audio/video records/tapes.
366 322 263
Manufacture of television receivers; reception apparatus for radio
broadcasting, radio telephony/telegraphy, video recording or reproducing
apparatus, turn-tables, record-players, cassette-players and other sound
reproducing apparatus, sound recording reproducing apparatus,
microphones, loudspeakers, amplifiers and sound amplifiers and pre-
recorded audio/video records/tapes.
323
Manufacture of computers and computer based systems 367 300 262
Manufacture of electronic valves and tubes and other electronic components
n.e.c.
368 321 261
Manufacture of radiographic X-ray apparatus X-ray tubes and parts and
manufacture of electrical equipment n.e.c.
369
Manufacture of photographic, cinematographic and optical goods and
equipment (excluding photochemicals, sensitised paper and film)
381 332 267
n.e.c.: not elsewhere classified

Employment Working Papers The Working Papers from 2008 to 2015 are available in
www.ilo.org/employment/Whatwedo/Publications/working-papers
Employment Policy Department
For more information visit our site: http://www.ilo.org/employment
International Labour Office Employment Policy Department 4, route des Morillons CH-1211 Geneva 22 Email: [email protected]
Please scan the code

ISSN 1999-2939
For more information, visit our website http://www.ilo.org/employment
International Labour Office Employment Policy DepartmentRoute des Morillons 4 CH-1211 Geneva 22
Email: [email protected]
Employment Policy Department
Empl
oym
Ent