Embed Size (px)
Citation preview

84 Monthly Labor Review • January 2012
Occupational Employment
Occupational employment projectionsto 2020Overall employment is projected to increase about 14 percent during the 2010–2020 decade with more than half a million new jobs expected for each of four occupations—registered nurses, retail salespersons, home health aides, and personal care aides; occupations that typically need postsecondary education for entry are projected to grow faster than average, but occupations that typically need a high school diploma or less will continue to represent more than half of all jobs
C. Brett LockardandMichael Wolf
C. Brett Lockard and Michael Wolf are economists in the Divi-sion of Occupational Outlook, Office of Occupational Statistics and Employment Projections at the Bureau of Labor Statistics. Email: [email protected] or [email protected].
From 2010 to 2020, the U.S. econ-omy is projected to add 20.5 mil-lion new jobs as total employment
grows from nearly 143.1 million to more than 163.5 million. This 14.3-percent growth reflects the assumption of a full-employment economy in 2020. Out of 749 detailed occupations, 657 are projected to grow, while 92 are projected to decline. The fastest growth is expected among healthcare, personal care, and community and social service occupations.
The Bureau of Labor Statistics (BLS) produces these long-term projections of occupational employment to supply those who seek or provide career guidance with information on how the labor market is changing. In addition, policymakers and educational authorities use BLS employ-ment projections for long-term policy planning. Finally, BLS projections are used by states in preparing state and area pro-jections.
Detailed descriptions of more than 500 occupations, including reasons they are projected to grow or decline, are in-cluded in the Occupational Outlook Hand-book, a BLS career guidance publication.1
This article focuses on broad results of the projections and is designed for those seeking a comprehensive overview of the projections data. Those seeking career guidance informa-tion and information on specific occupations will likely find the Handbook more suitable.
The first section of this article describes the factors that provide context for generating the occupational projections, including projections and assumptions for growth in the population, labor force, and gross domestic product (GDP). The next section describes the methods used to produce the occupational projections, as well as the concepts and terminology that will be used throughout the rest of the article. The third sec-tion looks at projections for major occupational groups and describes trends across groups. The fourth section presents projections for select detailed occupations: those that are growing the fastest, adding the most new jobs, declining most rapidly, or losing the most jobs. The fifth section discusses the concept of replacement needs—that is, the job openings that arise when workers leave an occupation permanently rather than those that arise from occupational growth. Finally, the last section describes the projections within the context of the new BLS education and training classification system.
Employment outlook: 2010–2020
Monthly Labor Review • January 2012 85
Overview of BLS projections
The occupational projections presented in this article are the last step in the employment projections process. The process begins with projecting the population and labor force. From there, changes in the aggregate economy—GDP and its components—are projected. Next, projec-tions are derived for consumers’ final demand of products and services from each industry. Then the interplay of goods and services among industries, including interme-diate demand, is used to project output by industry. Once industry output is projected, industry employment is calculated by projecting productivity and hours. Finally, projected staffing patterns are developed to distribute the projected industry employment to occupations. The as-sumptions and results of projections for the population, labor force, GDP, and industry output and employment are covered in more detail in other articles in this issue of the Monthly Labor Review.
The demographics of the U.S. population will have a prime role in shaping the future of the workforce. Be-tween 2010 and 2020, the civilian noninstitutional population ages 16 and older is projected to grow by 25.2 million, or about 1.0 percent per year. However, as the baby-boom generation ages, the population will also shift to older age groups, with those ages 55 and older pro-jected to increase their share of the population from 31.4 percent to 36.6 percent through the projections period. Because older people are less likely to be part of the labor force, the labor force will increase by only 10.5 million, or 0.7 percent per year, over the same decade.2 Demographic changes are important for determining not just the size of the workforce but also the demand for goods and services. Because older people are more likely to purchase certain types of goods and services, notably health care, their growing share of the population affects the projections for industries and occupations that provide those goods or services.3
The aggregate economy is expected to grow, with GDP growth averaging 3.0 percent annually from 2010 to 2020.4 This growth is faster than the growth in the labor force because labor productivity, as measured by output per hour, is projected to grow by 2.0 percent annually. GDP is projected to grow somewhat faster than in recent his-tory as the economy recovers from the effects of the De-cember 2007–June 2009 recession. BLS projections focus on long-term trends and do not project business cycle fluctuations. However, because many economic variables were at lower than normal levels in 2010, many growth rates, like that for the GDP, are projected to be faster than
historical trends. In addition, as industries and occupa-tions that experienced large declines during the recession rebound, they may have higher growth rates relative to industries and occupations that were less affected by the recession.5
Another variable affected by the recession is the un-employment rate, which averaged 9.6 percent in 2010. Among the assumptions used in projecting the overall economy is that there will be a full-employment economy in 2020. The unemployment rate associated with a full-employment economy in 2020 is 5.2 percent. The increase in the labor force combined with this decrease in the un-employment rate together leads to the projected growth in employment.
Employment growth will not occur evenly across all industries and classes of employment. Nonagricultural wage and salary employment accounts for about 9 out of 10 jobs; within this group, service-providing industries are projected to grow by 1.5 percent per year during the 2010–2020 decade, while goods-producing industries are projected to grow by 1.0 percent per year.6 Agricultural jobs are projected to decline by 0.6 percent per year, while jobs for nonagricultural self-employed and unpaid family workers are projected to grow by 0.8 percent per year.
How BLS derives occupational projections
As noted above, occupational projections are made by ap-plying projected staffing patterns to industry employment projections in order to distribute industry employment to occupations. To derive projected-year (2020) staffing patterns, BLS economists use qualitative and quantitative analyses to project how base-year (2010) staffing patterns are likely to change. They examine historical staffing pat-tern data and conduct research on factors that may affect the utilization of occupations within given industries dur-ing the projection decade. Some examples of factors are:
• Automation: technology or machinery replaces work-ers by performing some of their tasks. This will lower the need for those workers as the technology is implemented.
• Productivity-enhancing technology: similar to au-tomation but makes workers more efficient at the task, making it possible for workers to accomplish the same amount of work that previously required more workers. This will drive down the utilization of workers.

Occupational Employment
86 Monthly Labor Review • January 2012
• Domestic or offshore outsourcing: companies contract with another firm to perform specific tasks instead of hiring their own workers. This will drive down use of those workers in the companies that outsource the work but may increase utilization in another in-dustry if the work is being outsourced domestically.
• Changes in product mix: shifts in what an industry is producing to reflect, for example, increased demand for a specific product or service. This will increase demand for some workers while decreasing the uti-lization of others whose job duties are not essential to production of the new products.
• Organizational or work restructuring: any type of change in duties to produce the same output. This may increase the utilization of some workers and decrease the utilization of others.
For each industry, projected wage and salary employment is distributed to occupations on the basis of the project-ed staffing pattern. Occupational employment data for self-employed and unpaid family workers are projected separately. Total projected occupational employment is the sum of the projected employment for each wage and salary industry, the self-employed, and unpaid family workers.
Drivers of growth and decline
From an occupational point of view, there are two main factors that impact employment growth or decline: 1) the growth of industries that employ the occupation, and 2) changes in the way those industries use the occupation. Looking at the latter, if occupations A and B are both employed in one industry but the demand for occupation A is increasing because of one of the factors previously discussed, we would expect occupation A to grow faster than B. Without such a change to the staffing pattern, occupations A and B would both grow at the same rate as the industry in which they are employed. On the other hand, if occupation C is employed in a different industry that is growing faster, then occupation C will grow faster than either occupation A or B. Even when changes to occupational utilization are factored in, industry growth still has a major impact on occupational growth rates. Oc-cupations concentrated in fast-growing industries such as health care tend to grow faster than occupations in slower growing or declining industries such as mining.
To illustrate the impact of industry growth, consider
two occupations that are concentrated in different indus-tries: 98 percent of shoe machine operators and tenders work in leather and allied product manufacturing, while 95 percent of subway and streetcar operators are in lo-cal government. These industries are behaving differently: leather and allied product manufacturing is projected to decline, while local government is projected to grow. Neither of these occupations is projected to be utilized differently within these industries, so their projected growth rates reflect the growth of the industries they are concentrated in: shoe machine operators and tenders are projected to decline by 53.4 percent between 2010 and 2020, while subway and streetcar operators are projected to grow by 9.8 percent.
To illustrate the impact of changes in occupational uti-lization, consider two occupations that are concentrated in the postal service industry: postal service mail carriers and postal service mail sorters, processors, and process-ing machine operators. These occupations have differ-ent growth rates because the way they are being used is changing, leading to a projected staffing pattern differ-ent from the current staffing pattern. Postal service mail sorters, processors, and processing machine operators are expected to represent a smaller portion of the industry in the future, as technological improvements to automated sorting and processing equipment will increase produc-tivity and reduce the need for these workers. Meanwhile, postal service mail carriers are projected to increase their share of the industry because carriers will continue to be needed to deliver mail even as overall employment in the postal service industry declines. Postal service industry employment is projected to decline by 27.7 percent, but because of the expected changes in occupational utiliza-tion, jobs for postal service mail carriers are only projected to decline by 12.0 percent, while jobs for postal service mail sorters, processors, and processing machine operators are projected to decline by 48.5 percent.
Numeric versus percent change
There are two ways to measure occupational growth or decline: numeric change (projected-year employment mi-nus base-year employment) and percent change (numeric change divided by base-year employment). Both of these measures of growth or decline are important for differ-ent reasons, and when viewed together, they give a more complete view of the projected changes to the occupation and the workforce.
Percent change is especially useful when comparing the outlook for different occupations. Looking at percent
Monthly Labor Review • January 2012 87
change controls for the occupation’s size in the base year and focuses on how the occupation is changing. For ex-ample, general and operations managers are projected to add 81,600 new jobs while interpreters and translators are projected to add 24,600. However, the general and operations managers occupation is much larger. When looking at growth rates, we see that general and opera-tions managers are projected to grow by only 4.6 percent while interpreters and translators are projected to grow by 42.2 percent. The percent change provides a clearer comparison between these occupations. Employment of interpreters and translators will grow rapidly as compa-nies increasingly need these workers to assist in conduct-ing multinational business. Meanwhile, the employment of general and operations managers is projected to grow more slowly than average as these managers oversee larg-er areas of operations, leaving lower level management to other managerial specialties.
While percent change is useful for comparing what is happening in different occupations, it does not by it-self give an idea of how many jobs are being added. For example, employment of industrial-organizational psy-chologists is projected to grow by 34.9 percent, while
cashiers’ jobs are only projected to grow by 7.4 percent. This gives the impression that industrial-organizational psychologists have a much better job outlook, but they are a relatively small occupation and are projected to add only 800 new jobs. Meanwhile, cashiers is a very large occupation and, despite relatively slow growth, is pro-jected to add 250,200 new jobs. Numeric employment change shows that many jobs can be created even if an occupation is not growing fast and gives a better under-standing of how growth of the economy will be distrib-uted among occupations. Numeric employment change is also useful when combined with occupational replace-ment needs to give a more complete view of the extent of opportunities to enter an occupation. ( Job openings created by replacement needs will be discussed later in this article.)
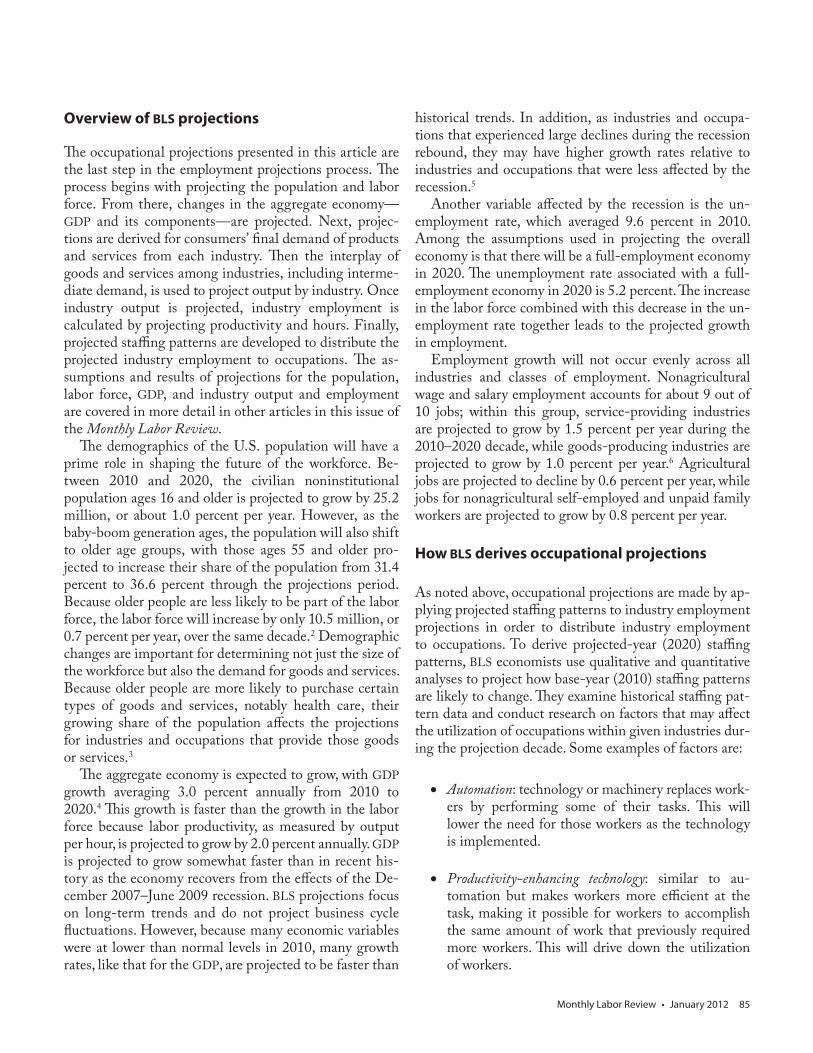
As these examples show, the size of an occupation and the occupation’s growth rate are both important in de-termining the number of new jobs that will be created. This is further illustrated in chart 1. Brickmasons and blockmasons are expected to add about 36,000 new jobs, as are dishwashers. However, brickmasons and blockma-sons are growing almost 6 times as fast as dishwashers,
50
40
30
20
10
0
Chart 1. Size and projected 2010–2020 growth of selected occupations
NOTE: Bubble size shows projected growth in the number of jobs.SOURCE: U.S. Bureau of Labor Statistics.
Occupational employment, 2010 (thousands)
Projected growth rate(percent)
Projected growth rate(percent)
0 100 200 300 400 500 600
Medical secretariesBrickmasons and blockmasons
DishwashersReal estate brokers
50
40
30
20
10
0
Occupational Employment
88 Monthly Labor Review • January 2012
but because dishwashers make up a much larger occupa-tion, the slower growth rate results in the same number of new jobs. If an occupation were growing at the same fast rate as brickmasons and blockmasons and were as large as dishwashers, it would add many more jobs; we see this with medical secretaries, an occupation which is expected to add 210,200 new jobs. In contrast, occupations that are both small and growing slowly, such as real estate brokers, add very few jobs. Visually, the closer an occupation is to the top right corner of chart 1, the larger its projected number of new jobs.
Occupational groups
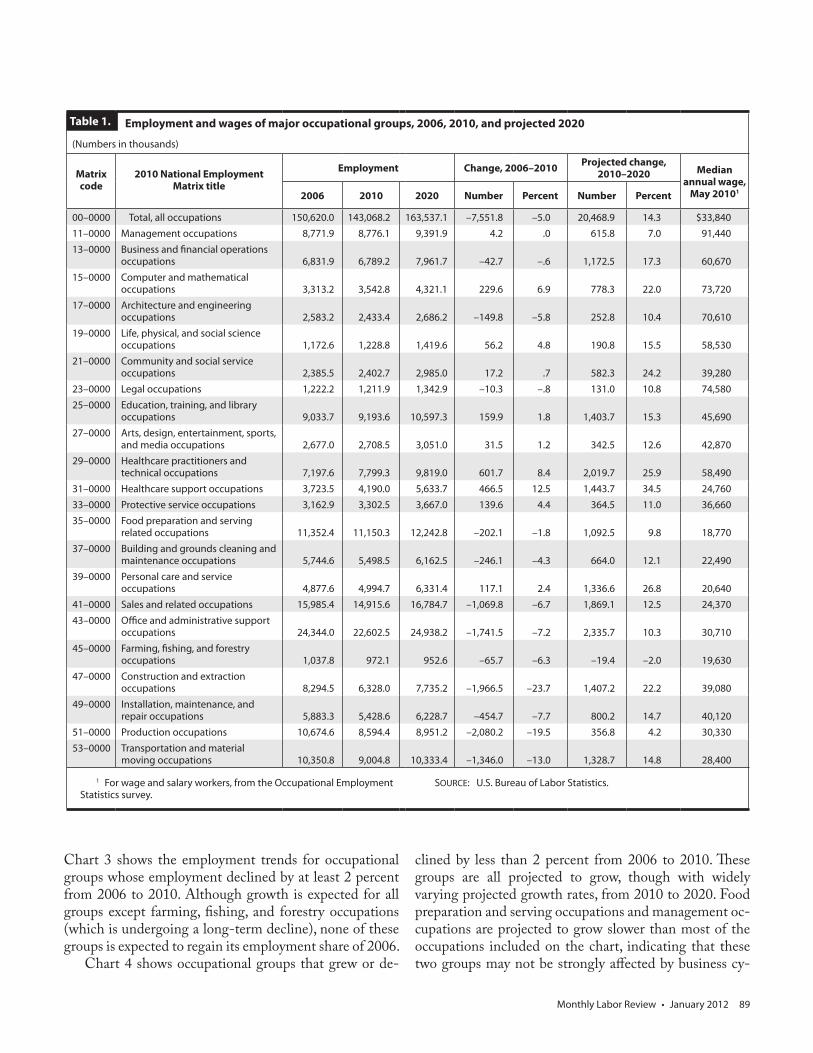
To see some of the key changes affecting the economy over the projection period, it is easiest to examine the growth of the 22 major occupational groups. (See box on this page.) Changes in the employment levels of these groups also can serve to underline the effects of the recent reces-sion on the projections. Table 1 presents the projections for the 22 major groups but also includes comparable data for 2006, a prerecession year.7 Between 2006 and 2010, according to these data, the economy lost 7.6 million jobs, but the losses were not spread evenly across occupational groups. These recessionary employment declines can have a large impact on interpreting the projections through 2020. For example, the computer and mathematical occu-
pations group and the construction and extraction occu-pations group are projected to grow at similar rates, 22.0 percent and 22.2 percent, respectively. However, computer and mathematical occupations grew between 2006 and 2010, so their 2020 employment level will be 1.0 million higher than the level in 2006. On the other hand, con-struction and extraction employment fell rapidly after the burst of the housing bubble, so despite rapid growth from 2010 to 2020, the projected 2020 employment level is still below the 2006 level. (See chart 2.)
Like the projections for the construction and extrac-tion group, projected employment levels for production occupations and transportation and material moving oc-cupations are also below the levels of 2006, despite pro-jected growth from 2010 to 2020. This is largely because the recession hit these three groups the hardest; they were the only groups where employment dropped by more than 10 percent from 2006 to 2010.
It also should be noted that rapid projected growth for some other occupational groups mostly represents recovering jobs lost between 2006 and 2010. Office and administrative support occupations is the group projected to add the most new jobs, 2.3 million, from 2010 to 2020. However, the group lost 1.7 million jobs from 2006 to 2010. Similarly, sales occupations are projected to add 1.9 million new jobs through 2020, but most of that is just the recovery of the 1.1 million jobs lost from 2006 to 2010.
BLS produces employment projections for 749 occu-pations; these occupations match the structure that the Occupational Employment Statistics (OES) program used to publish 2010 data, the primary source for base-year staffing patterns.1 OES occupations are classified on the basis of the Standard Occupational Classifica-tion (SOC) system. However, OES data do not exactly match the updates made to the SOC in 2010. OES is transitioning to the 2010 SOC, but the change will not be fully implemented until the 2012 reference year.2
The coding structure has four levels of aggregation
(listed from most detailed to least): detailed occupa-tions, broad occupations, minor groups, and major groups. Nearly all the 749 occupations are detailed oc-cupations, and projections for all of these occupations are included on the Bureau of Labor Statistics website at http://www.bls.gov/emp/ep_table_102.htm. This article mostly discusses projections at the detailed oc-cupation and major group level. However, the discus-sions of projections for particular major groups some-times include references to the minor groups within that major group.
Notes
1 Of the 749 occupations, 746 match OES directly. The re-maining three—25–1000 postsecondary teachers, 29–1060 physicians and surgeons, and 45-2090 miscellaneous agricul-tural workers—are summary occupations that contain multiple
published OES occupations.2 For more information on differences between the 2010
SOC and the 2010 OES data, see http://www.bls.gov/oes/oes_ques.htm#Ques41.
How occupations are classified
Monthly Labor Review • January 2012 89
Chart 3 shows the employment trends for occupational groups whose employment declined by at least 2 percent from 2006 to 2010. Although growth is expected for all groups except farming, fishing, and forestry occupations (which is undergoing a long-term decline), none of these groups is expected to regain its employment share of 2006.
Chart 4 shows occupational groups that grew or de-
clined by less than 2 percent from 2006 to 2010. These groups are all projected to grow, though with widely varying projected growth rates, from 2010 to 2020. Food preparation and serving occupations and management oc-cupations are projected to grow slower than most of the occupations included on the chart, indicating that these two groups may not be strongly affected by business cy-
(Numbers in thousands)
Matrix code
2010 National Employment Matrix title
Employment Change, 2006–2010 Projected change, 2010–2020 Median
annual wage, May 201012006 2010 2020 Number Percent Number Percent
00–0000 Total, all occupations 150,620.0 143,068.2 163,537.1 –7,551.8 –5.0 20,468.9 14.3 $33,84011–0000 Management occupations 8,771.9 8,776.1 9,391.9 4.2 .0 615.8 7.0 91,44013–0000 Business and financial operations
occupations 6,831.9 6,789.2 7,961.7 –42.7 –.6 1,172.5 17.3 60,67015–0000 Computer and mathematical
occupations 3,313.2 3,542.8 4,321.1 229.6 6.9 778.3 22.0 73,72017–0000 Architecture and engineering
occupations 2,583.2 2,433.4 2,686.2 –149.8 –5.8 252.8 10.4 70,61019–0000 Life, physical, and social science
occupations 1,172.6 1,228.8 1,419.6 56.2 4.8 190.8 15.5 58,53021–0000 Community and social service
occupations 2,385.5 2,402.7 2,985.0 17.2 .7 582.3 24.2 39,28023–0000 Legal occupations 1,222.2 1,211.9 1,342.9 –10.3 –.8 131.0 10.8 74,58025–0000 Education, training, and library
occupations 9,033.7 9,193.6 10,597.3 159.9 1.8 1,403.7 15.3 45,69027–0000 Arts, design, entertainment, sports,
and media occupations 2,677.0 2,708.5 3,051.0 31.5 1.2 342.5 12.6 42,87029–0000 Healthcare practitioners and
technical occupations 7,197.6 7,799.3 9,819.0 601.7 8.4 2,019.7 25.9 58,49031–0000 Healthcare support occupations 3,723.5 4,190.0 5,633.7 466.5 12.5 1,443.7 34.5 24,76033–0000 Protective service occupations 3,162.9 3,302.5 3,667.0 139.6 4.4 364.5 11.0 36,66035–0000 Food preparation and serving
related occupations 11,352.4 11,150.3 12,242.8 –202.1 –1.8 1,092.5 9.8 18,77037–0000 Building and grounds cleaning and
maintenance occupations 5,744.6 5,498.5 6,162.5 –246.1 –4.3 664.0 12.1 22,49039–0000 Personal care and service
occupations 4,877.6 4,994.7 6,331.4 117.1 2.4 1,336.6 26.8 20,64041–0000 Sales and related occupations 15,985.4 14,915.6 16,784.7 –1,069.8 –6.7 1,869.1 12.5 24,37043–0000 Office and administrative support
occupations 24,344.0 22,602.5 24,938.2 –1,741.5 –7.2 2,335.7 10.3 30,71045–0000 Farming, fishing, and forestry
occupations 1,037.8 972.1 952.6 –65.7 –6.3 –19.4 –2.0 19,63047–0000 Construction and extraction
occupations 8,294.5 6,328.0 7,735.2 –1,966.5 –23.7 1,407.2 22.2 39,08049–0000 Installation, maintenance, and
repair occupations 5,883.3 5,428.6 6,228.7 –454.7 –7.7 800.2 14.7 40,12051–0000 Production occupations 10,674.6 8,594.4 8,951.2 –2,080.2 –19.5 356.8 4.2 30,33053–0000 Transportation and material
moving occupations 10,350.8 9,004.8 10,333.4 –1,346.0 –13.0 1,328.7 14.8 28,400
1 For wage and salary workers, from the Occupational Employment Statistics survey.
SOURCE: U.S. Bureau of Labor Statistics.
Table 1. Employment and wages of major occupational groups, 2006, 2010, and projected 2020

Occupational Employment
90 Monthly Labor Review • January 2012
Employment for selected occupational groups, 2006 to 2010 and projected 2010 to 2020 Chart 2.
NOTE: BLS does not project specific data for each of the years between 2010 and 2020. Interim years to the 2020 projection point are expressed by a dashed straight line only. SOURCE: U.S. Bureau of Labor Statistics.
Percent of 2006employment
Percent of 2006employment
140
130
120
110
100
90
80
70
60
140
130
120
110
100
90
80
70
60
Computer and mathematical occupations
Construction and extraction occupations
2006 2010 2020, projected
cles. Business and financial occupations are projected to grow more rapidly than several other occupations, indi-cating that the lack of growth from 2006 to 2010 may have resulted from the recession, with the fast projected growth including some recovery of lost potential growth.
Chart 5 shows occupational groups that grew by at least 2 percent from 2006 to 2010; all of these groups are projected to see continued growth through 2020. The two groups with the fastest growth from 2006 to 2010 were healthcare support occupations and healthcare practi-tioners and technical occupations. These two groups are projected to continue to see strong growth, adding a com-bined 3.5 million jobs from 2010 to 2020 after gaining 1.1 million from 2006 to 2010.
What follow are brief highlights about each of the major groups, discussed in the order the groups appear in the Standard Occupational Classification (SOC) system. The text table within each section shows, for that occu-pational group, the occupation that is projected to have the largest growth in number of jobs, the fastest growing and fastest declining (or slowest growing) occupations, and the occupation with the highest median annual wage in May 2010.
Management occupations.Most new jobs:Construction managers +86,600Fastest growing (in percent):Social and community service managers +26.7Fastest declining (in percent):Postmasters and mail superintendents –27.8Highest paying:Chief executives $165,080
Management occupations are projected to add 615,800 new jobs between 2010 and 2020. This represents 7.0 percent growth from their 2010 employment level of 8.8 million. Management occupations are projected to be the third-slowest-growing occupational group but, because they have relatively high employment, will be near the middle of the pack (14th out of 22) in projected employment growth from 2010 to 2020. Although projected to be slow growing, this relatively stable occupational group did not experience any decline in employment from 2006 to 2010.
Farmers, ranchers, and other agricultural managers, part of the management occupations group, are projected to ex-perience an employment decline of 96,100 between 2010

Monthly Labor Review • January 2012 91
Employment, 2006 to 2010 and projected 2010 to 2020, for occupational groups with little employment change 2006–2010
Chart 4.
NOTE: BLS does not project specific data for each of the years between 2010 and 2020. Interim years to the 2020 projection point are expressed by a dashed straight line only. SOURCE: U.S. Bureau of Labor Statistics.
Percent of 2006employment
Percent of 2006employment
130
125
120
115
110
105
100
95
130
125
120
115
110
105
100
952006 2010 2020,
projected
Arts, design, entertainment, sports, and media
Business and �nancial operations
Community and social service
Education, training, and library
Food preparation and serving related
Legal
Management
Employment, 2006 to 2010 and projected 2010 to 2020, for occupational groups whose employment declined 2006–2010
Chart 3.
NOTE: BLS does not project specific data for each of the years between 2010 and 2020. Interim years to the 2020 projection point are expressed by a dashed straight line only. SOURCE: U.S. Bureau of Labor Statistics.
Percent of 2006employment
Percent of 2006employment
115
110
105
100
95
90
85
80
75
115
110
105
100
95
90
85
80
75
Total, all occupations
Architecture and engineering
Building and grounds cleaning and maintenance
Construction and extraction
Farming, �shing, and forestry Installation, maintenance, and repair
O�ce and administrative support
Production
Transportation and material moving
Sales and related
2006 2010 2020, projected

Occupational Employment
92 Monthly Labor Review • January 2012
and 2020. The job decline for farmers, ranchers, and other agricultural managers by itself slows the overall projected growth for this group by more than 1 percentage point. In addition, general and operations managers, who composed 20 percent of jobs in this group in 2010, are projected to grow by only 4.6 percent as these workers are oversee-ing increasingly larger areas of operation, causing their employment to grow slower than the industries in which they work.
Management occupations are found throughout all in-dustries in the economy and tend to be high paying: their median annual wage of $91,440 was higher than for any other occupational group.8 The high pay reflects, in part, the combination of formal postsecondary education and work experience that most of these occupations typically need.
Business and financial operations occupations.Most new jobs:Accountants and auditors +190,700Fastest growing (in percent):Meeting, convention, and event planners +43.7Fastest declining (in percent):Insurance appraisers, auto damage –7.5
Highest paying:Management analysts $78,160
Business and financial operations occupations are pro-jected to add 1.2 million new jobs as they grow by 17.3 percent between 2010 and 2020. This group includes busi-ness operations specialists—such as management analysts, human resources workers, and buyers and purchasing agents—and financial specialists—such as accountants and auditors, loan officers, and financial analysts. The business operations specialists group is larger (4.2 mil-lion vs. 2.6 million jobs for financial specialists in 2010), is projected to grow slightly faster (18.1 percent growth vs. 16.0 percent), and is projected to add more new jobs (751,400 vs. 421,100 new jobs) than financial operations occupations.
Business and financial operations workers are found in industries throughout the economy, but the largest num-bers are found in government, professional and business services, and the finance and insurance industries. In these industries, business and financial operations occupations are projected to account for a larger share of industry em-ployment in 2020 than in 2010, meaning the occupational
Employment, 2006 to 2010 and projected 2010 to 2020, for occupational groups whose employment increased 2006–2010
Chart 5.
NOTE: BLS does not project specific data for each of the years between 2010 and 2020. Interim years to the 2020 projection point are expressed by a dashed straight line only.SOURCE: U.S. Bureau of Labor Statistics.
Percent of 2006employment
Percent of 2006employment
160
150
140
130
120
110
100
160
150
140
130
120
110
1002006 2010 2020,
projected
Computer and mathematical
Healthcare practitioners and technical
Healthcare support
Life, physical, and social science
Personal care and service
Protective service
Monthly Labor Review • January 2012 93
group is expected to grow faster than the industry. Meet-ing, convention, and event planners, as well as market re-search analysts and marketing specialists, in particular, are expected to increase their share over that decade.
Computer and mathematical occupations.Most new jobs:Software developers, applications +143,800Fastest growing (in percent):Software developers, systems software +32.4Slowest growing (in percent):Mathematical technicians +6.2Highest paying:Computer and information research scientists $100,600
Computer and mathematical occupations are projected to add 778,300 new jobs between 2010 and 2020, after hav-ing added 229,600 new jobs from 2006 to 2010. This rep-resents 22.0 percent growth from 2010 to 2020, making the computer and mathematical occupational group the sixth-fastest-growing major occupational group. How-ever, because it is a relatively small group, it ranks only twelfth (out of 22 groups) in the projected number of new jobs between 2010 and 2020.
Computer occupations are much larger than math-ematical occupations, accounting for 3.4 million of the total 3.5 million jobs in computer and mathematical oc-cupations in 2010. Employment in computer occupations also is projected to grow faster than mathematical occupa-tions, with growth rates of 22.1 percent and 16.7 percent, respectively. Although computer occupations are found throughout the economy, fast growth in the computer systems design and related services industry is driving the growth in this group; this industry accounted for just over 20 percent of all jobs in computer occupations in 2010, but will generate more than half of all new computer jobs from 2010 to 2020.
Architecture and engineering occupations.Most new jobs:Civil engineers +51,100Fastest growing (in percent):Biomedical engineers +61.7Fastest declining (in percent):Aerospace engineering and operations technicians –1.6Highest paying:Petroleum engineers $114,080
Architecture and engineering occupations are projected
to add 252,800 new jobs between 2010 and 2020 as they grow by 10.4 percent. This follows a decline of 149,800 jobs from 2006 to 2010. Engineers are the largest com-ponent of this major occupational group and will add the most new jobs, 160,400, but architects, surveyors, and cartographers are projected to grow faster, at 23.7 percent.
Nearly 30 percent of jobs for architecture and engineer-ing occupations are found in manufacturing industries. The projected employment decline in many manufactur-ing industries is one of the main reasons this occupational group is projected to grow more slowly than other groups. Architecture and engineering jobs account for more than 20 percent of all jobs in the computer and electronic prod-uct manufacturing industry, so declines in this industry are expected to cause the loss of 33,900 jobs for occupa-tions in this group.
Growth will come primarily from the architectural, engineering, and related services industry group. This in-dustry group accounted for 26.4 percent of jobs for ar-chitecture and engineering occupations in 2010 but will contribute 173,700 new jobs for these occupations from 2010 to 2020, a growth rate of 27.0 percent.
Life, physical, and social science occupations.
Most new jobs:Medical scientists, except epidemiologists +36,400Fastest growing (in percent):Medical scientists, except epidemiologists +36.4Fastest declining (in percent):Forest and conservation technicians –1.0Highest paying:Political scientists $107,420
Life, physical, and social science occupations are projected to add 190,800 new jobs between 2010 and 2020 as they grow by 15.5 percent. Jobs for life scientists are projected to increase by 20.4 percent, making it the fastest grow-ing of these three occupation groups. The employment of social scientists and related workers is projected to grow slightly slower, at 18.4 percent, while jobs for physical sci-entists are projected to grow by 12.7 percent.
Because workers in life, physical, and social science oc-cupations do research, many of them are employed in sci-entific research and development services and in colleges, universities, and professional schools. These industries combine to employ more than a quarter of workers in life, physical, and social science occupations and are projected to account for almost one-third of all new jobs for this occupational group between 2010 and 2020.
Occupational Employment
94 Monthly Labor Review • January 2012
Community and social service occupations.Most new jobs:Social and human service assistants +106,000Fastest growing (in percent):Marriage and family therapists +41.2Slowest growing (in percent):Directors, religious activities and education +16.8Highest paying:Educational, guidance, school, and vocational counselors $53,380
Community and social service occupations include work-ers such as counselors, social workers, and religious work-ers. This occupational group is projected to add 582,300 new jobs between 2010 and 2020. This represents a 24.2-percent increase, making community and social service occupations the fourth-fastest-growing major oc-cupational group. This group is unique in how uniform and fast the growth will be—each one of the 17 detailed occupations in this group is expected to grow faster than the 14.3-percent average growth rate for all occupations.
The individual and family services industry, despite em-ploying only 11.9 percent of community and social service occupations, is projected to account for 26.5 percent of new jobs for this occupational group. The industry is pro-jected to grow by more than 70 percent, giving many new opportunities to the community and social service occu-pations employed there, including social and human ser-vice assistants and child, family, and school social workers.
Legal occupations.Most new jobs:Lawyers +73,600Fastest growing (in percent):Paralegals and legal assistants +18.3Fastest declining (in percent):Title examiners, abstractors, and searchers –1.4Highest paying:Judges, magistrates judges, and magistrates $119,270
Legal occupations are projected to add 131,000 new jobs between 2010 and 2020. This represents 10.8 percent growth from the occupational group’s 2010 employment level of roughly 1.2 million. Legal occupations form the second-smallest major occupational group; it is expect-ed to add the second-fewest new jobs. They tend to be high-paying jobs, though, with a median annual wage of $74,580 in May 2010.
Lawyers account for more than half of the jobs in this group, with employment of 728,200 in 2010. Because
their employment is growing at about the same rate as the group as a whole, the 73,600 new jobs projected for lawyers will also account for the majority of new jobs in the group.
Jobs for legal support workers are projected to grow 12.9 percent, which is somewhat faster than the group. However, they will only add 50,600 new jobs.
Education, training, and library occupations.Most new jobs:Postsecondary teachers +113,600Fastest growing (in percent):Preschool teachers, except special education +24.9Slowest growing (in percent):Career/technical education teachers, secondary school +1.1Highest paying:Postsecondary teachers $62,050
The education, training, and library occupations group is projected to add 1.4 million new jobs, the sixth most of any major occupational group, with projected growth of 15.3 percent between 2010 and 2020. Of these new jobs, 655,000 will be for preschool, primary, secondary, and special education teachers, as this group is expected to grow by 15.0 percent, while another 305,700 jobs will be for postsecondary teachers, whose jobs are projected to increase 17.4 percent. Growth in education, training, and library occupations is influenced strongly by a rise in school enrollments. Enrollment in elementary and sec-ondary schools tends to follow general population growth for children, while enrollment in postsecondary institu-tions is increasing faster than population growth as more high school graduates attend college and as members of the workforce seek additional education.
While the majority of education, training, and library jobs are located in public education, growth will be faster for these occupations in private elementary and secondary schools and private colleges, universities, and professional schools.
Arts, design, entertainment, sports, and media occupations.
Most new jobs:Coaches and scouts +71,400Fastest growing (in percent):Interpreters and translators +42.2Fastest declining (in percent):Floral designers –9.3Highest paying:Art directors $80,630

Monthly Labor Review • January 2012 95
This diverse occupational group is projected to add 342,500 new jobs between 2010 and 2020, a growth rate of 12.6 percent. The group includes a variety of occupations:
• Art and design workers, such as graphic designers, merchandise displayers and window trimmers, and art directors.
• Entertainers and performers, sports and related workers, such as coaches and scouts, musicians and singers, producers and directors, music directors and com-posers, and actors.
• Media and communication workers, such as public relations specialists, writers and authors, editors, interpreters and translators, and reporters and cor-respondents.
• Media and communication equipment workers, such as photographers, audio and visual equipment techni-cians, broadcast technicians, and film and video editors.
The entertainers and performers, sports and related workers group is projected to grow the fastest, at 16.0 percent, and is also projected to add the most new jobs, 128,900. Jobs for media and communication workers are expected to grow by 106,100, while jobs for art and design workers will increase by 76,100.
Self-employed workers accounted for more than 30 per-cent of jobs in the arts, design, entertainment, sports, and media group in 2010. Jobs for the self-employed are pro-jected to grow somewhat slower than wage and salary jobs, and are only projected to account for less than 20 percent of the new jobs for this occupational group.
Healthcare practitioners and technical occupations.Most new jobs:Registered nurses +711,900Fastest growing (in percent):Veterinary technologists and technicians +52.0Slowest growing (in percent):Respiratory therapy technicians +4.1Highest paying:Physicians and surgeons ≥$166,400
Healthcare practitioners and technical occupations are projected to add 2.0 million new jobs from 2010 to 2020, the second most of any major group. This follows an in-crease of 601,700 jobs from 2006 to 2010, more growth than any other occupational group. The healthcare prac-titioners and technical occupations growth rate of 25.9 percent from 2010 to 2020 is also the third fastest. This
group consists mainly of health diagnosing and treating practitioners—such as registered nurses, physicians and surgeons, and physical therapists—whose employment is projected to grow by 1.3 million, and health technologists and technicians—such as pharmacy technicians, emer-gency medical technicians and paramedics, and radiologic technologists and technicians—whose employment is projected to grow by 720,300.
The fast growth for the healthcare practitioners and technical occupational group is driven by increased spend-ing on healthcare services, particularly by an aging popu-lation. Older individuals spend more on healthcare than those who are younger, so as the share of the population ages 65 and older grows, healthcare spending is expected to increase. The recently passed healthcare reform legisla-tion could also have a large impact on the growth rate for healthcare practitioners, but its full effects remain unknown.
Healthcare support occupations.Most new jobs:Home health aides +706,300Fastest growing (in percent):Home health aides +69.4Slowest growing (in percent):Medical transcriptionists +5.9Highest paying:Occupational therapy assistants $51,010
After having gained 466,500 new jobs from 2006 to 2010, the healthcare support occupations group is projected to be the fastest growing occupational group from 2010 to 2020, growing by 34.5 percent and creating 1.4 million more new jobs. About half, or 706,300, of these new jobs will be in a single occupation, home health aides, which is projected to grow by 69.4 percent. Home health aides accounted for 24 percent of this occupational group in 2010, but their proportion is projected to rise to 31 per-cent in 2020.
Much as it affects healthcare practitioners and techni-cal occupations, an aging population that spends more on healthcare is a major factor behind the fast growth rate for healthcare support occupations. The recently passed healthcare reform legislation will also affect jobs within this occupation group, although the eventual impact is not known.
As with the more highly skilled healthcare practitioners and technical occupations, healthcare support occupations are concentrated within the health care industry—almost 80 percent of these jobs were in this industry in 2010. To-gether, the two groups account for more than 60 percent

Occupational Employment
96 Monthly Labor Review • January 2012
of jobs in this industry. Healthcare support occupations are more highly concentrated in ambulatory health care services, while healthcare practitioners and technical oc-cupations are more highly concentrated in hospitals. Am-bulatory health care services are projected to grow faster than hospitals, contributing to the projected faster growth for healthcare support occupations.
Protective service occupations.Most new jobs:Security guards +195,000Fastest growing (in percent):Private detectives and investigators +20.5Slowest growing (in percent):Crossing guards +1.1Highest paying: First-line supervisors of police and detectives $78,260
Protective service occupations are expected to add 364,500 new jobs—a growth rate of 11.0 percent. The majority of this occupational group consists of law enforcement workers, who predominantly work for governments, and security guards, who mostly work for private companies. About a third of the new jobs created will be in govern-ment, while another 40 percent will be in the investigation and security services industry.
Food preparation and serving related occupations.Most new jobs:Combined food preparation and serving workers, including fast food +398,000Fastest growing (in percent):Food servers, nonrestaurant +18.0Fastest declining (in percent):Cooks, fast food –3.6Highest paying:Chefs and head cooks $40,630
About 1.1 million new jobs will arise in the food prepa-ration and serving related occupational group. Although this group was the third-largest major occupational group in 2010, it is growing at a slower-than-average rate of 9.8 percent and ranks only 10th in number of new jobs. More than half of the new jobs will be for food and beverage serving workers, such as waiters and waitresses. Employ-ment of these workers is growing slightly faster (11.5 percent) than that of cooks and food preparation workers (8.6 percent), who account for most of the other jobs in this group.
Not surprisingly, the food preparation and serving relat-ed occupational group is highly concentrated in the food services and drinking places industry, where about three-quarters of these jobs are found, and the group accounts for 90 percent of all jobs in this industry. Faster growth for these jobs is found in the health care and social assistance industry, which accounted for 5 percent of jobs in 2010 but 11 percent of new jobs over the 2010-to-2020 period.
Building and grounds cleaning and maintenance occupations.Most new jobs:Janitors and cleaners, except maids and housekeeping cleaners +246,400Fastest growing (in percent):Pest control workers +26.1Slowest growing (in percent):First-line supervisors of housekeeping and janitorial workers +0.8Highest paying:First-line supervisors of landscaping, lawn service, and groundskeeping workers $41,860
This occupational group is projected to add 664,000 new jobs while growing at a slightly below-average rate (12.1 percent). This group includes, for example, janitors and landscaping workers. Jobs in almost all the occupations in this group typically need little to no education or training. As a result, they tend to be low-paying jobs, with a me-dian annual wage of $22,490. About 14 percent of these workers were self-employed in 2010.
Jobs for grounds maintenance workers are projected to grow about twice as fast as jobs for building cleaning workers, but building cleaning workers are a larger oc-cupational group and are projected to add more jobs—104,400 over the 10-year period.
Personal care and service occupations.Most new jobs:Personal care aides +607,000Fastest growing (in percent):Personal care aides +70.5Fastest declining (in percent):Motion picture projectionist –11.1Highest paying:Funeral service managers, directors, morticians, and undertakers $54,330
Personal care and service occupations are expected to grow by 26.8 percent, second fastest of all groups, as they add 1.3 million new jobs from 2010 to 2020. This group includes
Monthly Labor Review • January 2012 97
a wide variety of occupations, from child care workers to funeral attendants, manicurists to fitness trainers and aerobics instructors, and animal trainers to gaming deal-ers. Driving the overall growth in this group is personal care aides, the fastest growing occupation overall, which is projected to grow by 70.5 percent and add 607,000 new jobs. The fast growth in the number of elderly and their increasing desire to live in their own homes are the primary causes of the rapid expansion of this occupation. Personal care and service occupations tend to be low paid, with a median annual wage of $20,640 in May 2010.
Although just 24.2 percent of jobs in this occupational group were in the health care and social assistance indus-try in 2010, more than half of the new jobs through 2020 for this group will be in that industry. In contrast, the self-employed will account for only 12.8 percent of the group’s new jobs, despite 22.0 percent of these workers being self-employed in 2010.
Sales and related occupations.Most new jobs:Retail salespersons +706,800Fastest growing (in percent):Insurance sales agents +21.9Fastest declining (in percent):Gaming change persons and booth cashiers –12.1Highest paying:Sales engineers $87,390
Sales and related occupations are projected to add 1.9 million new jobs from 2010 to 2020 as this large occupa-tional group grows at a slightly below-average 12.5-per-cent rate. This follows the loss of 1.1 million jobs from 2006 to 2010. More than half of the new jobs projected between 2010 and 2020 will be for retail sales workers, such as cashiers, whose employment is growing at about the same rate as the group as a whole. Faster growth, 17.8 percent, is expected for sales representatives, services, a group which is expected to add 272,100 new jobs.
In 2010, about 10 percent of jobs in sales and related occupations were for the self-employed, but jobs for self-employed sales and related workers are expected to decline over the projection period. Most new jobs will be found in the retail sales industry, where the majority of jobs in this group are currently found.
Office and administrative support occupations.Most new jobs:Office clerks, general +489,500
Fastest growing (in percent):Medical secretaries +41.3Fastest declining (in percent):Postal service mail sorters, processors, and processing machine operators –48.5Highest paying:Postal Service mail carriers $53,860
The largest occupational group, office and administrative support occupations comprised 22.6 million jobs in 2010 and are projected to add the most new jobs, 2.3 million through 2020, as the group grows by 10.3 percent. The ma-jority of this job growth, however, represents a recovery of jobs lost during the recession; from 2006–2010, the em-ployment of office and administrative support workers fell by 1.7 million. Office and administrative support occupa-tions include information and records clerks, such as cus-tomer support representatives; secretaries and administra-tive assistants; financial clerks, such as billing and posting clerks; and material recording, scheduling, dispatching, and distributing workers, such as stock clerks and order fillers.
Occupations within this group have particularly var-ied growth rates. A number of occupations are declining because of automation, such as switchboard operators in-cluding answering service (–23.3 percent); file clerks (–4.8 percent); postal service mail sorters, processors, and pro-cessing machine operators (–48.5 percent); and data entry keyers (–6.8 percent). Others are growing rapidly, such as medical secretaries (41.3 percent), cargo and freight agents (29.3 percent), and receptionists and information clerks (23.7 percent).
The occupations within this group are found through-out the economy, and the number of new jobs varies greatly by industry. More than one-third of the new jobs will arise in the health care and social assistance industry, even though this industry accounted for only 12.2 per-cent of office and administrative support jobs in 2010. On the other hand, in government there will be a decline of 128,000 jobs for occupations in this group through 2020.
Farming, fishing, and forestry occupations.Most new jobs:Logging equipment operators +1,300Fastest growing (in percent):Log graders and scalers +13.3Fastest declining (in percent):Animal breeders –7.5Highest paying:First-line supervisors of farming, fishing, and forestry workers $41,800
Occupational Employment
98 Monthly Labor Review • January 2012
The smallest major occupational group in 2010 was farm-ing, fishing, and forestry occupations, which had only 972,100 jobs. It is also the only declining group, projected to lose 19,400 jobs, or 2.0 percent, through 2020. Agri-cultural workers, who accounted for 85 percent of all jobs in this group in 2010, are projected to lose 19,100 jobs. Fishing and hunting workers are expected to lose 2,000 jobs, while forest, conservation, and logging workers will gain 2,400 jobs. Three-quarters of farming, fishing, and forestry occupation jobs are located in the declining agri-culture, forestry, fishing, and hunting industry sector; jobs for occupations in this group account for over half of all jobs in this industry.
Construction and extraction occupations.Most new jobs:Construction laborers +212,400Fastest growing (in percent):Helpers—brickmasons, blockmasons, stonemasons, and tile and marble setters +60.1Slowest growing (in percent):Explosive workers, ordnance handling experts, and blasters +0.2Highest paying:Elevator installers and repairers $70,910
Construction and extraction occupations are projected to add about 1.4 million new jobs over the 2010–2020 period as their employment grows by 22.2 percent. This fast growth rate will not result in a full recovery from the recent recession, however, which caused the loss of 2.0 million jobs from 2006 to 2010 for this group. Construc-tion trades workers, such as carpenters and electricians, will account for 1.1 million of the new jobs. Jobs for ex-traction workers, who work in the mining and oil and gas industries, are expected to grow much slower (6.9 percent) than construction trades and will increase by only 15,500. Most workers in construction and extraction occupations typically need little formal education for their jobs, but they tend to receive significant on-the-job training. The median annual wage of $39,080 for construction and ex-traction occupations in May 2010 is higher than the aver-age for all occupations.
The majority of construction and extraction occupa-tion jobs were in the fast-growing construction industry, which is expected to account for 1.2 million of the new jobs in this group. A fifth of jobs were for self-employed workers in 2010, but jobs for the self-employed are pro-jected to grow by only 5.8 percent, resulting in 75,400 new jobs.
Installation, maintenance, and repair occupations.Most new jobs:Maintenance and repair workers, general +142,000Fastest growing (in percent):Bicycle repairers +37.6Fastest declining (in percent):Fabric menders, except garment –6.3Highest paying:Electrical and electronics repairers, powerhouse, substation, and relay $65,230
About 800,200 new jobs are projected in installation, maintenance, and repair occupations between 2010 and 2020, a growth rate of 14.7 percent. This group lost about 454,700 jobs from 2006 to 2010, so a little more than half of the projected increase is making up for job losses during the period that included the recession. Vehicle and mo-bile equipment mechanics, installers, and repairers–such as automotive service technicians and mechanics–will ac-count for 267,300 new jobs, while electrical and electronic equipment mechanics, installers, and repairers–such as se-curity and fire alarm systems installers–will account for 71,800 new jobs.
Almost one-quarter of the new jobs are expected to be in the construction industry, where jobs for installation, maintenance, and repair occupations are projected to grow by 40.6 percent. In contrast, employment of installation, maintenance, and repair occupations in the manufactur-ing industry is projected to grow by only 4.0 percent over the decade.
Production occupations.Most new jobs:Team assemblers +52,300Fastest growing (in percent):Sawing machine setters, operators, and tenders, wood +24.7Fastest declining (in percent):Shoe machine operators and tenders –53.4Highest paying:Nuclear power reactor operators $75,650
Production occupations are projected to add 356,800 new jobs, resulting from a slower-than-average 4.2-per-cent growth rate. This growth is dwarfed by the 2.1 mil-lion jobs that were lost in this group from 2006 to 2010 as the manufacturing sector was hard hit by the reces-sion. Although production workers are heavily concen-trated in the manufacturing industry, only 48,800 new jobs for these occupations are expected for this industry.
Monthly Labor Review • January 2012 99
In contrast, 127,800 new jobs are expected in the employ-ment services industry, as manufacturers increasingly use workers from temporary help services.
Most minor groups within production occupations, such as assemblers and fabricators or metal workers and plastic workers, are growing at single-digit rates, compa-rable to the group as a whole. However, jobs for textile, apparel, and furnishings workers are projected to decline by 9.6 percent, resulting in the loss of 65,500 jobs. In con-trast, jobs for woodworkers are projected to grow by 17.1 percent, adding 40,200 jobs.
Transportation and material moving occupations.Most new jobs:Heavy and tractor-trailer truck drivers +330,100Fastest growing (in percent):Ambulance drivers and attendants, except emergency medical technicians +32.1Fastest declining (in percent):Gas compressor and gas pumping station operators –10.1Highest paying:Air traffic controllers $108,040
Transportation and material moving occupations are pro-jected to add 1.3 million new jobs, reflecting 14.8-percent growth from 2010 to 2020. This growth matches the 1.3 million jobs that were lost from 2006 to 2010. Nearly all the projected new jobs from 2010 to 2020 will be for mo-tor vehicle operators (such as truck drivers), who will add 641,100 jobs, and for material moving workers (such as packers and packagers, hand), who will add 552,600 jobs.
Almost half of the new jobs for this group will be found in the transportation and warehousing industry, even though this industry accounted for only 28.8 per-cent of the group in 2010. This is because jobs for material moving occupations are growing quickly, at 22.1 percent, in this industry. The retail trade and wholesale trade in-dustries will also contribute 131,100 and 164,600 new transportation and material moving jobs, respectively.
Detailed occupations
Table 2 lists the 30 occupations with the largest projected percentage employment increases from 2010 to 2020. The increase in healthcare employment is reflected here as 10 of the 30 occupations shown are in either the health-care practitioner and technical occupations group or the healthcare support occupations group. Construction and extraction occupations, which are projected to grow as the
construction industry begins to recover from the recent recession, account for 8 of the 30 occupations. The 30 occupations are relatively evenly distributed in terms of typical education needed for entry. (The education clas-sification system is described in more detail in the last section of this article). A bachelor’s or graduate degree is needed for 12 of the occupations, while 5 need an associ-ate’s degree, and 13 need a high school diploma or less. However, four of the construction occupations typically need, in addition to a high school diploma, formal ap-prenticeship training; these are reinforcing iron and re-bar workers, glaziers, brickmasons and blockmasons, and stonemasons.
The two fastest growing occupations, personal care aides and home health aides, will be affected by demo-graphic changes. Workers in both occupations assist the elderly, persons with disabilities, and convalescents in the person’s home or in a care facility. Home health aides pro-vide health services, such as administering medications, while personal care aides provide general services, such as cooking meals. The growing elderly population will require some care and assistance in their own homes or health care facilities, which should lead to increased de-mand for these occupations.
Table 3 lists the 30 occupations with the largest pro-jected numeric job increases from 2010 to 2020. These are generally larger occupations that will account for many new jobs even though some of these occupations are pro-jected to grow at average rates. The expected growth in healthcare will drive the demand for the six the occupa-tions on this list in either the healthcare practitioner and technical occupations or healthcare support occupations groups, including registered nurses, which are projected to add the most new jobs. Six office and administrative support occupations appear on this list as well, primar-ily because they are large occupations that are employed across many industries. Five of these six had more than a million jobs in 2010, while the sixth occupation, medi-cal secretaries, is expected to grow rapidly because of its concentration in the fast-growing health care industry. In contrast with the fastest growing occupations, the occu-pations with the largest numeric increases tend to have lower education needs. A high school diploma or less is sufficient to enter 23 of the occupations, while a bachelor’s or higher degree is the typical level needed to enter only 4 of the occupations on this list.
Tables 4 and 5 show the 10 occupations with the larg-est percentage declines and the largest numeric declines in employment, respectively. Four occupations appear on both lists, making for 16 unique occupations. Five of these
Occupational Employment
100 Monthly Labor Review • January 2012
Employment and wages of occupations with the largest percentage growth in jobs, 2010 and projected 2020
(Numbers in thousands)
Matrix code
2010 National EmploymentMatrix title
Employment Projected change, 2010–2020
Median annual wage,
May 20101
Typical education needed for entry
2010 2020 Number Percent
00–0000 Total, all occupations 143,068.1 163,537.1 20,468.9 14.3 $33,840 —39–9021 Personal care aides 861.0 1,468.0 607.0 70.5 19,640 Less than high school31–1011 Home health aides 1,017.7 1,723.9 706.3 69.4 20,560 Less than high school17–2031 Biomedical engineers 15.7 25.4 9.7 61.7 81,540 Bachelor's degree47–3011 Helpers—brickmasons, blockmasons,
stonemasons, and tile and marble setters 29.4 47.0 17.6 60.1 27,780 Less than high school47–3012 Helpers—carpenters 46.5 72.4 25.9 55.7 25,760 Less than high school29–2056 Veterinary technologists and technicians 80.2 121.9 41.7 52.0 29,710 Associate's degree47–2171 Reinforcing iron and rebar workers 19.1 28.4 9.3 48.6 38,430 High school diploma or equivalent31–2021 Physical therapist assistants 67.4 98.2 30.8 45.7 49,690 Associate's degree47–3015 Helpers—pipelayers, plumbers,
pipefitters, and steamfitters 57.9 84.2 26.3 45.4 26,740 High school diploma or equivalent13–1121 Meeting, convention, and event planners 71.6 102.9 31.3 43.7 45,260 Bachelor's degree29–2032 Diagnostic medical sonographers 53.7 77.1 23.4 43.5 64,380 Associate's degree31–2011 Occupational therapy assistants 28.5 40.8 12.3 43.3 51,010 Associate's degree31–2022 Physical therapist aides 47.0 67.3 20.3 43.1 23,680 High school diploma or equivalent47–2121 Glaziers 41.9 59.6 17.7 42.4 36,640 High school diploma or equivalent27–3091 Interpreters and translators 58.4 83.1 24.6 42.2 43,300 Bachelor's degree43–6013 Medical secretaries 508.7 718.9 210.2 41.3 30,530 High school diploma or equivalent13–1161 Market research analysts and marketing
specialists 282.7 399.3 116.6 41.2 60,570 Bachelor's degree21–1013 Marriage and family therapists 36.0 50.8 14.8 41.2 45,720 Master's degree47–2021 Brickmasons and blockmasons 89.2 125.3 36.1 40.5 46,930 High school diploma or equivalent29–1123 Physical therapists 198.6 276.0 77.4 39.0 76,310 Doctoral or professional degree29–2021 Dental hygienists 181.8 250.3 68.5 37.7 68,250 Associate's degree49–3091 Bicycle repairers 9.9 13.6 3.7 37.6 23,660 High school diploma or equivalent29–1181 Audiologists 13.0 17.8 4.8 36.8 66,660 Doctoral or professional degree21–1091 Health educators 63.4 86.6 23.2 36.5 45,830 Bachelor's degree47–2022 Stonemasons 15.6 21.4 5.7 36.5 37,180 High school diploma or equivalent13–1051 Cost estimators 185.4 252.9 67.5 36.4 57,860 Bachelor's degree19–1042 Medical scientists, except
epidemiologists 100.0 136.5 36.4 36.4 76,700 Doctoral or professional degree21–1014 Mental health counselors 120.3 163.9 43.6 36.3 38,150 Master's degree47–2072 Pile-driver operators 4.1 5.6 1.5 36.0 47,860 High school diploma or equivalent29–1131 Veterinarians 61.4 83.4 22.0 35.9 82,040 Doctoral or professional degree
1 For wage and salary workers, from the Occupational Employment Statistics survey.
SOURCE: U.S. Bureau of Labor Statistics.
Table 2.
occupations are textile, apparel, or furnishings workers, all concentrated in textile and apparel manufacturing indus-tries, which are declining rapidly because of increased im-ports. Four occupations related to the postal service make the lists as that agency cuts costs and jobs in the face of operating deficits. The occupation expected to decline the fastest, at 53.4 percent, is shoe machine operators and tenders. However, this decline will only cause the loss of 1,700 jobs over the 10-year period because of the occupa-
tion’s small size. Farmers, ranchers, and other agricultural managers will lose 96,100 jobs, more than any other oc-cupation, as technological improvements and consolida-tion continue to reduce the number of workers needed to produce the nation’s food. Nearly all the occupations in tables 4 and 5 typically need no more than a high school diploma for entry. The only exception is semiconductor processors, for which an associate’s degree is the typical education needed for entry.
Monthly Labor Review • January 2012 101
Employment and wages of occupations with the largest numeric growth in jobs, 2010 and projected 2020
(Numbers in thousands)
Matrix code
2010 National Employment Matrix title
Employment Projected change, 2010–2020 Median
annual wage, May 20101
Typical educationneeded for entry
2010 2020 Number Percent
00–0000 Total, all occupations 143,068.2 163,537.1 20,468.9 14.3 $33,840 —29–1111 Registered nurses 2,737.4 3,449.3 711.9 26.0 64,690 Associate's degree41–2031 Retail salespersons 4,261.6 4,968.4 706.8 16.6 20,670 Less than high school31–1011 Home health aides 1,017.7 1,723.9 706.3 69.4 20,560 Less than high school39–9021 Personal care aides 861.0 1,468.0 607.0 70.5 19,640 Less than high school43–9061 Office clerks, general 2,950.7 3,440.2 489.5 16.6 26,610 High school diploma or equivalent35–3021 Combined food preparation and
serving workers, including fast food 2,682.1 3,080.1 398.0 14.8 17,950 Less than high school43–4051 Customer service representatives 2,187.3 2,525.6 338.4 15.5 30,460 High school diploma or equivalent53–3032 Heavy and tractor-trailer truck drivers 1,604.8 1,934.9 330.1 20.6 37,770 High school diploma or equivalent53–7062 Laborers and freight, stock, and
material movers, hand 2,068.2 2,387.3 319.1 15.4 23,460 Less than high school25–1000 Postsecondary teachers 1,756.0 2,061.7 305.7 17.4 45,690 Doctoral or professional degree31–1012 Nursing aides, orderlies, and
attendants 1,505.3 1,807.2 302.0 20.1 24,010 Postsecondary nondegree award39–9011 Childcare workers 1,282.3 1,544.3 262.0 20.4 19,300 High school diploma or equivalent43–3031 Bookkeeping, accounting, and
auditing clerks 1,898.3 2,157.4 259.0 13.6 34,030 High school diploma or equivalent41–2011 Cashiers 3,362.6 3,612.8 250.2 7.4 18,500 Less than high school25–2021 Elementary school teachers, except
special education 1,476.5 1,725.3 248.8 16.8 51,660 Bachelor's degree43–4171 Receptionists and information
clerks 1,048.5 1,297.0 248.5 23.7 25,240 High school diploma or equivalent37–2011 Janitors and cleaners, except maids
and housekeeping cleaners 2,310.4 2,556.8 246.4 10.7 22,210 Less than high school37–3011 Landscaping and groundskeeping
workers 1,151.5 1,392.3 240.8 20.9 23,400 Less than high school41–4012 Sales representatives, wholesale and
manufacturing, except technical and scientific products 1,430.0 1,653.4 223.4 15.6 52,440 High school diploma or equivalent
47–2061 Construction laborers 998.8 1,211.2 212.4 21.3 29,280 Less than high school43–6013 Medical secretaries 508.7 718.9 210.2 41.3 30,530 High school diploma or equivalent43–1011 First-line supervisors of office and
administrative support workers 1,424.4 1,627.8 203.4 14.3 47,460 High school diploma or equivalent47–2031 Carpenters 1,001.7 1,197.6 196.0 19.6 39,530 High school diploma or equivalent35–3031 Waiters and waitresses 2,260.3 2,456.2 195.9 8.7 18,330 Less than high school33–9032 Security guards 1,035.7 1,230.7 195.0 18.8 23,920 High school diploma or equivalent25–9041 Teacher assistants 1,288.30 1,479.30 191.1 14.8 23,220 High school diploma or equivalent13–2011 Accountants and auditors 1,216.90 1,407.60 190.7 15.7 61,690 Bachelor's degree29–2061 Licensed practical and licensed
vocational nurses 752.3 920.8 168.5 22.4 40,380 Postsecondary nondegree award29–1060 Physicians and surgeons 691 859.3 168.3 24.4 111,570 Doctoral or professional degree31–9092 Medical assistants 527.6 690.4 162.9 30.9 28,860 High school diploma or equivalent
1 For wage and salary workers, from the Occupational Employment Statistics survey.
SOURCE: U.S. Bureau of Labor Statistics.
Table 3.
Job openings from replacement needs
New jobs account for only a portion of all jobs that are expected to be available during the projection period. Many workers will retire, leave the labor force, or transfer
to other occupations, creating additional opportunities for workers to enter each occupation. These replacement needs, when added to new jobs, create a more complete picture of job openings. While projections of job growth and decline provide the best picture of how occupational
Occupational Employment
102 Monthly Labor Review • January 2012
Employment and wages of occupations with the largest percentage decline in jobs, 2010 and projected 2020
(Numbers in thousands)
Matrix code
2010 National Employment Matrix title
Employment Projected change, 2010–2020 Median
annual wage, May 20101
Typical educationneeded for entry
2010 2020 Number Percent
00–0000 Total, all occupations 143,068.2 163,537.1 20,468.9 14.3 $33,840 —51–6042 Shoe machine operators and tenders 3.2 1.5 –1.7 –53.4 26,280 High school diploma or equivalent43–5053 Postal service mail sorters, processors,
and processing machine operators 142.0 73.0 –68.9 –48.5 53,080 High school diploma or equivalent43–5051 Postal service clerks 65.6 34.0 –31.6 –48.2 53,100 High school diploma or equivalent51–6092 Fabric and apparel patternmakers 6.0 3.9 –2.1 –35.6 38,970 High school diploma or equivalent11–9131 Postmasters and mail superintendents 24.5 17.7 –6.8 –27.8 60,300 High school diploma or equivalent51–6031 Sewing machine operators 163.2 121.1 –42.1 –25.8 20,600 Less than high school43–2011 Switchboard operators, including
answering service 142.5 109.3 –33.2 –23.3 24,920 High school diploma or equivalent51–6062 Textile cutting machine setters,
operators, and tenders 14.9 11.7 –3.3 –21.8 23,490 High school diploma or equivalent51–6063 Textile knitting and weaving machine
setters, operators, and tenders 22.5 18.4 –4.1 –18.2 25,870 High school diploma or equivalent51–9141 Semiconductor processors 21.1 17.3 –3.8 –17.9 33,130 Associate's degree
1 For wage and salary workers, from the Occupational Employment Statistics survey.
SOURCE: U.S. Bureau of Labor Statistics.
Table 4.
Employment and wages of occupations with the largest numeric decline in jobs, 2010 and projected 2020
(Numbers in thousands)
Matrix code
2010 National Employment Matrix title
Employment Projected change, 2010–2020 Median
annual wage, May 20101
Typical educationneeded for entry
2010 2020 Number Percent
00–0000 Total, all occupations 143,068.2 163,537.1 20,468.9 14.3 $33,840 —11–9013 Farmers, ranchers, and other
agricultural managers 1,202.5 1,106.4 –96.1 –8.0 60,750 High school diploma or equivalent43–5053 Postal service mail sorters, processors,
and processing machine operators 142.0 73.0 –68.9 –48.5 53,080 High school diploma or equivalent51–6031 Sewing machine operators 163.2 121.1 –42.1 –25.8 20,600 Less than high school43–5052 Postal service mail carriers 316.7 278.5 –38.1 –12.0 53,860 High school diploma or equivalent43–2011 Switchboard operators, including
answering service 142.5 109.3 –33.2 –23.3 24,920 High school diploma or equivalent43–5051 Postal service clerks 65.6 34.0 –31.6 –48.2 53,100 High school diploma or equivalent35–2011 Cooks, fast food 530.4 511.4 –19.1 –3.6 18,100 Less than high school45–2090 Miscellaneous agricultural workers 746.4 727.3 –19.1 –2.6 19,180 Less than high school43–9021 Data entry keyers 234.7 218.8 –15.9 –6.8 27,450 High school diploma or equivalent43–9022 Word processors and typists 115.3 102.1 –13.2 –11.5 33,400 High school diploma or equivalent
1 For wage and salary workers, from the Occupational Employment Statistics survey.
SOURCE: U.S. Bureau of Labor Statistics.
Table 5.
employment is expected to change, job openings provide a better description of the labor market that new entrants will face. Projections of job openings also serve as an esti-mate of the minimum number of workers who will need to be trained for occupations that require pre-employment education or training.9
From 2010 to 2020, about 33.7 million job openings are expected to come from replacement needs, compared
with 21.1 million job openings from growth.10 In four out of five occupations, openings due to replacement needs exceed the number due to growth. Occupations where more openings are due to growth tend to be those that are growing the fastest. For example, personal care aides, the fastest growing occupation, will add 607,000 jobs because of growth, but only 68,200 because of replacement needs.
Occupations that have low formal educational require-
Monthly Labor Review • January 2012 103
ments and that are often taken as temporary positions have some of the highest replacement needs. For exam-ple, there will be 1.5 million openings for cashiers due to the need to replace workers who leave the occupation, far more than the 250,200 jobs that will arise because of growth. Waiters and waitresses will have 1.1 million job openings due to replacement needs, compared with 195,900 due to growth.
Job openings due to replacement needs occur even in declining occupations. Although employment of farmers, ranchers, and other agricultural managers is expected to decline by 96,100 jobs, there will be 234,500 job open-ings due to the need to replace workers who leave this occupation.
Job outlook by education
BLS is releasing a new education and training classifica-tion system with the 2010–2020 projections that assigns three classifications to each occupation: typical education needed for entry, work experience in a related occupation commonly considered necessary to be hired, and typical on-the-job training needed to attain competency in an occupation. (See box on next pages.) This new system was developed primarily for career exploration purposes but is also useful in depicting projected trends for occupa-tions grouped by the type of preparation and experience needed for entry and attaining competency. A forthcom-ing article in the Monthly Labor Review will examine the system in more detail; included here are a few highlights of the new system.
Table 6 presents the employment projections for occu-pations on the basis of the new education classifications. BLS makes projections by occupation, not education level, so the data here represent the 2010 and projected 2020 employment for occupations assigned to each category. This is not the same as a projection of the number of workers with each of these education levels. Workers may have educational attainment that is either higher or lower than what is typically needed for entry into the occupa-tion in which they are employed.11
The fastest growth is projected in occupations as-signed to the master’s degree level; these occupations are projected to grow by 21.7 percent. All six categories of occupations that typically need some postsecondary edu-cation are expected to grow faster than the average for all occupations, while those occupations assigned to the high school or less-than-high-school categories will grow slower than the average. However, 62.6 percent of new jobs and 69.2 percent of job openings due to growth and
replacement needs are expected to arise in occupations assigned to these two lowest education categories; these occupations accounted for 69.3 percent of all jobs in 2010.
Wages are much higher in the categories of bachelor’s degree, master’s degree, and doctoral or professional de-gree, with median annual wages above $60,000 in all three categories. The median annual wage is also above $60,000 for occupations in the associate’s degree category; however, wages are considerably less for workers with jobs that typically need less than an associate’s degree. Oc-cupations assigned to the postsecondary nondegree award and the high school diploma or equivalent categories have median wages around $34,000, while wages in the less-than-high-school category are only about $20,000.
An important feature of the new education and train-ing classification system is that it allows examination of projected employment trends across all three dimensions of preparation: entry-level education, work experience in a related occupation, and on-the-job training. For example, in 2010, 43.5 percent of all jobs were in occupations as-signed to the high school diploma or equivalent category. However, not all occupations that typically need a high school diploma need the same type of on-the-job training. Chart 6 shows data for occupations that typically need a high school diploma or equivalent for entry, broken down by the typical on-the-job training needed to attain com-petency in the occupation. Occupations that need short- and moderate-term on-the-job training account for 68.8 percent of the 2010 employment in occupations that need high school or equivalent education for entry and account for the majority of new jobs projected for these occupa-tions. However, jobs in high school diploma occupations that typically receive training through an apprenticeship are expected to grow by 22.5 percent, almost twice as fast as the average for all high school diploma occupations. Apprenticeship occupations have a higher median annual wage in 2010 ($44,430) than the high school occupations that typically need short-term ($28,420) or moderate-term ($34,750) on-the-job training.
Jobs in occupations that need a high school diploma are spread more evenly among training categories than are jobs in occupations that typically need less than high school. As chart 7 shows, more than 90 percent of the jobs in occupations that typically need less than a high school diploma are in occupations that have only short-term on-the-job training. The relatively low skill level of these occupations, both in terms of formal education and on-the-job training, is reflected in the low median annual wage ($20,070 for less than high school occupations), as noted earlier. (See table 6.)

Occupational Employment
104 Monthly Labor Review • January 2012
The Bureau of Labor Statistics (BLS) education and training classification system consists of three catego-ries of information that BLS analysts have assigned to each detailed occupation in the 2010–2020 National Employment Matrix. The categories are
• typical education needed for entry, • commonly required work experience in a related
occupation, and • typical on-the-job training needed to obtain
competency in the occupation.
Each category and its related choice selections are de-fined below. This education and training system replac-es the one used for the 2008–2018 projections cycle.
Typical education needed for entry
This category best describes the typical level of educa-tion that most workers need to enter the occupation. Occupations are assigned one of the following eight education levels:
Doctoral or professional degree. Completion of a doctoral degree (Ph.D.) usually requires at least 3 years of full-time academic work beyond a bachelor’s degree. Completion of a professional degree usually requires at least 3 years of full-time academic study beyond a bachelor’s degree. Ex-amples of occupations for which a professional degree is the typical form of entry-level education include lawyers, physicians and surgeons, and dentists.
Master’s degree. Completion of this degree usually re-quires 1 or 2 years of full-time academic study beyond a bachelor’s degree. Examples of occupations in this category include statisticians, physician assistants, and educational, vocational, and school counselors.
Bachelor’s degree. Completion of this degree gener-ally requires at least 4 years, but not more than 5 years, of full-time academic study beyond high school. Ex-amples of occupations in this category include budget analysts, dietitians, and civil engineers.
Associate’s degree. Completion of this degree usually requires at least 2 years but not more than 4 years of full-time academic study beyond high school. Ex-amples of occupations in this category include me-chanical drafters, respiratory therapists, and dental hygienists.
Postsecondary nondegree award. These programs lead to a certificate or other award but not a degree. The certificate is awarded by the educational institution and is the result of completing formal postsecondary schooling. Certification, which is issued by a profes-sional organization or certifying body, is not included here. Some postsecondary nondegree award programs last only a few weeks, while others may last 1 to 2 years. Examples of occupations in this category include nurs-ing aides, emergency medical technicians (EMTs) and paramedics, and hairstylists.
Some college, no degree. This category signifies the achievement of a high school diploma or equivalent plus the completion of one or more postsecondary courses that did not result in a degree or award. Ex-amples of occupations in this category are actors and computer support specialists.
High school diploma or equivalent. This category sig-nifies the completion of high school or an equivalent program resulting in the award of a high school diplo-ma or an equivalent, such as the General Educational Development (GED) credential. Examples of occupa-tions in this category include social and human service assistants and pharmacy technicians.
Less than high school. This category signifies the comple-tion of any level of primary or secondary education that did not result in the award of a high school diploma or an equivalent. Examples of occupations in this category in-clude janitors and cleaners, cashiers, and carpet installers.
Work experience in a related occupation
For some occupations, work experience in a related oc-cupation may be a typical method of entry. The ma-jority of occupations in this category are first-line su-pervisors or managers of service, sales, and production occupations. Although work experience in a related occupation is beneficial for all occupations, this metric is meant to capture work experience that is commonly considered necessary by employers or is a commonly accepted substitute for other, more formal types of training or education. Occupations are assigned one of the following four categories that deal with length of time spent gaining related work experience:
More than 5 years. This is assigned to occupations if more than 5 years of work experience in a related
Definitions for the education and training classification system
Monthly Labor Review • January 2012 105
occupation is typically needed for entry. Examples in-clude construction managers and computer and infor-mation systems managers.
1 to 5 years. To enter occupations in this category, workers typically need 1–5 years of work experience in a related occupation. Examples include marketing managers and database administrators.
Less than 1 year. Examples of occupations that typi-cally require less than 1 year of work experience in a related occupation include restaurant cooks and indus-trial truck and tractor operators.
None. No work experience in a related occupation is typically required. Examples are audiologists and actuaries.
Typical on-the-job training needed to attain competency in the occupation
This category encompasses any additional training or preparation that is typically needed, once a person is employed in an occupation, to attain competency in the skills needed in that occupation. Training is occu-pation-specific rather than job-specific; skills learned can be transferred to another job in the same occupa-tion. Occupations are assigned one of the following six training categories:
Internship/residency. An internship or residency is train-ing that involves preparation in a field such as medicine or teaching, generally under supervision in a professional setting, such as a hospital or classroom. This type of train-ing may occur before one is employed. Completion of an internship or residency program is commonly required for state licensure or certification in fields including medicine, counseling, architecture, and teaching. This category does not include internships that are suggested for advance-ment. Examples of occupations in the internship/residen-cy category include physicians and surgeons and marriage and family therapists.
Apprenticeship. An apprenticeship is a formal rela-tionship between a worker and sponsor that consists of a combination of on-the-job training and related occupation-specific technical instruction in which the worker learns the practical and theoretical aspects of an occupation. Apprenticeship programs are sponsored by individual employers, joint employer-and-labor groups, and employer associations. The typical apprenticeship
program provides at least 144 hours of occupation-spe-cific technical instruction and 2,000 hours of on-the-job training per year over a 3-to-5 year period. Examples of occupations in the apprenticeship category include elec-tricians and structural iron and steel workers.
Long-term on-the-job training. More than 12 months of on-the-job training or, alternatively, combined work experience and formal classroom instruction are needed for workers to develop the skills to attain competency. Training is occupation specific rather than job specific; therefore, skills learned can be transferred to another job in the same occupation. This on-the-job training category also includes employer-sponsored training programs. Such programs include those offered by fire and police academies and schools for air traffic controllers and flight attendants. In other occupations—nuclear power reac-tor operators, for example—trainees take formal courses, often provided at the jobsite, to prepare for the required licensing exams. This category excludes apprenticeships. Examples of occupations in the long-term on-the-job training category include opticians and automotive ser-vice technicians and mechanics.
Moderate-term on-the-job training. Skills needed for a worker to attain competency in an occupation can be acquired during 1 to 12 months of combined on-the-job experience and informal training. Training is occupation specific rather than job specific; therefore, skills learned can be transferred to another job in the same occupation. This on-the-job training category also includes employer-sponsored training programs. Examples of occupations in the moderate-term category include school bus drivers and advertising sales agents.
Short-term on-the-job training. Skills needed for a worker to attain competency in an occupation can be acquired during 1 month or less of on-the-job expe-rience and informal training. Training is occupation specific rather than job specific; therefore, skills learned can be transferred to another job in the same occupa-tion. This on-the-job training category also includes employer-sponsored training programs. Examples of occupations in the short-term category include retail salespersons and maids and housekeeping cleaners.
None. There is no additional occupation-specific train-ing or preparation typically required to attain compe-tency in the occupation. Examples of occupations that do not require occupation-specific on-the-job training include geographers and pharmacists.

Occupational Employment
106 Monthly Labor Review • January 2012
Employment and total job openings, by education category, 2010 and projected 2020
(Numbers in thousands)
Typical education needed for entry
EmploymentProjected change,
2010–2020
Job openings due to growth and replacement
needs, 2010–20201
Median annual wage,
May 20102
Number Percent distribution
2010 2020 2010 2020 Number Percent Number Percent distribution
Total, all occupations 143,068.2 163,537.1 100.0 100.0 20,468.9 14.3 54,787.4 100.0 $33,840Doctoral or professional degree 4,409.7 5,286.3 3.1 3.2 876.6 19.9 1,701.8 3.1 87,500Master's degree 1,986.0 2,417.2 1.4 1.5 431.2 21.7 903.9 1.6 60,240Bachelor's degree 22,171.1 25,827.2 15.5 15.8 3,656.1 16.5 8,562.4 15.6 63,430Associate's degree 7,994.6 9,434.6 5.6 5.8 1,440.0 18.0 2,941.0 5.4 61,590Postsecondary nondegree award 6,524.0 7,624.9 4.6 4.7 1,100.9 16.9 2,389.6 4.4 34,220Some college, no degree 811.6 953.8 .6 .6 142.2 17.5 362.0 .7 44,350High school diploma or equivalent 62,089.6 69,665.7 43.4 42.6 7,576.1 12.2 21,745.9 39.7 34,180Less than high school 37,081.7 42,327.4 25.9 25.9 5,245.7 14.1 16,180.8 29.5 20,070
1 Total job openings may not equal the sum of replacement needs and employment change. If employment change for a detailed occupation is negative, job openings due to growth are zero and total job openings equal replacement needs.
2 For wage and salary workers, from the Occupational Employment Statistics survey.
SOURCE: U.S. Bureau of Labor Statistics.
Table 6.
Chart 6. Size and projected 2010–2020 growth of occupations that typically require a high school diploma orequivalent for entry, grouped by typical on-the-job training
NOTE: Bubble size shows projected growth in the number of jobs.SOURCE: U.S. Bureau of Labor Statistics.
Occupational employment, 2010 (thousands)
Projected growth rate(percent)
Projected growth rate(percent)
30
25
20
15
10
5
00 5,000 10,000 15,000 20,000 25,000 30,000
30
25
20
15
10
5
0
Apprenticeship
Long-termon-the-job training Moderate-term
on-the-job trainingNone
Short-termon-the-job training
The new education and training classification system also indicates if work experience in a related occupation is commonly considered necessary by employers for entry or is a commonly accepted substitute for formal types of training. For instance, more than three-quarters of the
jobs in occupations that need a bachelor’s degree is in oc-cupations that have no related-work-experience require-ments. However, bachelor’s-degree occupations that do require related work experience, which are often super-visory or management occupations, are generally higher

Monthly Labor Review • January 2012 107
paid. The median annual wage for bachelor’s-degree oc-cupations with no requirement for work experience in a related occupation was $59,160 in 2010, while the median wage for bachelor’s-degree occupations that need 1–5 years of such work experience was $76,090, and in bach-elor’s-degree occupations that need more than 5 years of such work experience, it was $116,290.
Further employment, projected growth, and earnings data based on the education and training system—includ-ing even more detailed groupings which combine educa-tion, work experience, and on-the-job training—can be found on the Employment Projections page of the BLS website.12
ABOUT 20.5 MILLION JOBS are expected to be added between 2010 and 2020 as the economy continues to re-cover from the recent recession. The fastest growth is ex-pected in occupations related to healthcare, personal care, and community and social services, fields that remained relatively strong during the recession. However, there
will also be substantial job gains among certain occupa-tions that were severely affected by the recent recession, such as construction occupations and transportation and material moving occupations. Overall, job growth will be faster for occupations that typically need some form of postsecondary education. In addition to jobs arising from growth, 33.7 million job openings will result from the need to replace workers who leave an occupation perma-nently, creating opportunities in every occupation, even where employment is declining and no new jobs are ex-pected.
Many factors affect the outlook for occupations, in-cluding demographic trends, the size of the economy, the types of goods and services that people consume, and technological advancements. The assumptions that BLS used to develop the projections presented here reflect the best information available at the time. New projections are developed and released every 2 years to account for changes in factors such as laws, consumer preferences, and the U.S. economy.
Notes
1 The 2012–2013 edition of the Occupational Outlook Handbook will be available at http://www.bls.gov/ooh in late March 2012.
Chart 7. Employment by typical on-the-job training among occupations requiring less than high school for entry, 2010
Long-term on-the-job training
Moderate-term on-the-job training
Short-term on-the-job training
None
SOURCE: U.S. Bureau of Labor Statistics.
2 See Mitra Toossi, “Labor force projections to 2020: a more slowly growing workforce,” this issue, pp. 43–64, http://www.bls.gov/opub/

Occupational Employment
108 Monthly Labor Review • January 2012
mlr/2012/01/art3full.pdf. 3 People 65 years of age or older spent an average of $4,843 in
2010 on healthcare, compared with $3,157 for all consumers. See 2010 data from the Consumer Expenditures Survey, U.S. Bureau of Labor Statistics, available at ftp://ftp.bls.gov/pub/special.requests/ce/standard/2010/age.txt.
4 See Kathryn J. Byun and Christopher Frey, “The U.S. economy in 2020, recovery in uncertain times” this issue, pp. 21–42, http://www.bls.gov/opub/mlr/2012/01/art2full.pdf.
5 For more information on the effects of the recession, see Dixie Sommers and James Franklin, “Overview of employment projections to 2020,” this issue, pp. 3–20, http://www.bls.gov/opub/mlr/2012/01/art1full.pdf.
6 See Richard Henderson, “Industry employment and output pro-jections to 2020,” this issue, pp. 65–83, http://www.bls.gov/opub/mlr/2012/01/art5full.pdf.
7 Recessions are identified by the National Bureau of Economic Research (NBER). According to the NBER, the most recent recession began in December 2007 and ended in June 2009. (See http://www.nber.org/cycles/cyclesmain.html.) This article uses 2006 data to examine effects of the recession because employment projections are published biennially and no comparable data were released for 2007. Data for 2006 is derived from the data published in Arlene Dohm and Lynn Shniper, “Occupational employment projections to 2016,”
Monthly Labor Review, November 2007, but are adjusted to take into account changes in occupational classifications effective with the 2010 Standard Occupational Classification system.
8 Wage data used in this article come from the Occupational Employment Statistics (OES) survey, U.S. Bureau of Labor Statistics, http://www.bls.gov/oes/.
9 For a detailed description of the methods used to calculate re-placement needs, see the technical documentation accompanying the 2010 to 2020 projections, available at http://www.bls.gov/emp/ep_replacements.htm.
10 Total job openings may not equal the sum of projected replace-ment needs and projected employment change. If employment change for a detailed occupation is negative, job openings due to growth are zero and total job openings equal replacement needs. For summary occupations, including the total of all occupations, job openings due to growth are summed from detailed occupations. If some detailed oc-cupations are declining and others are growing, job openings due to growth will not equal the projected employment change.
11 Table 1.11 on the employment projections page of the BLS web-site presents data on educational attainment by occupation from the Census Bureau’s American Community Survey: http://www.bls.gov/emp/ep_table_111.htm.
12 In particular, see education and training data at http://www.bls.gov/emp/ep_education_training_system.htm