Embed Size (px)
Citation preview
About this ProfileRestaurants are one of ten industry groupsbeing profiled by the New York City Labor Market Information System (NYCLMIS) for the public workforce development systemin 2009.1 The NYCLMIS identified the ten groups in an earlier report, Gauging Employ-
ment Prospects in New York, City 2009. Inthat report, we found that restaurants com-pared well with the rest of the local labor market: industries within this group have experienced job growth above and beyondwhat would have been expected based on national or industry growth and retained jobs relatively well during at least one of the two previous recessions in New York City.
This profile is meant to help account
managers with business development andjob placement, career advisors with job counseling, and education and training pro-
fessionals plan and refine their curriculum and placement activities in the industry.Jobseekers can also use this information tohelp make career decisions. Icons appear throughout this profile to highlight findingsand recommendations of special interest to
these audiences. See page 2 for a guide onHow to Use This Profile, and an accompa-nying key to the icons.
Terms and DefinitionsIn this report, we discuss two industrygroups under the general term “restau-rants.” They are full-service restaurants
(NAICS 7221) and limited-service eating
places (NAICS 7222). The sidebar on this page shows the definition of the two indus-try groups according to the North American Industrial Classification System (NAICS).
These industry groups are found within the food services and drinking places sub-
sector (NAICS 722). The subsector is orga-nized according to the type and level of services that are provided. Other indus-try groups in the subsector include spe-cial food services (e.g., catering and mobile food service) and drinking places (e.g., bars and nightclubs). Food services and drinking places is one of two subsectors within the larger accommodation and food services
sector (NAICS 72).r
Full service restaurants include tradi-tional restaurants and restaurants that
Employment in New York CityRestaurants
May 2009
INDUSTRY GROUP PROFILE
North American Industrial Classification System Defini-tion of Full-Service Restau-rants (NAICS 7221) and Lim-ited Service Eating Places (NAICS 7222)
Full service restaurants provide food services to patrons whoorder and are served while seatedand who pay after they have fin-ished eating. Limited service eating places provide food ser-vices to patrons who pay beforeeating. All full-service restaurantshave waiters or waitresses; mostlimited-service eating places do not.
Employment in New York City Restaurants2
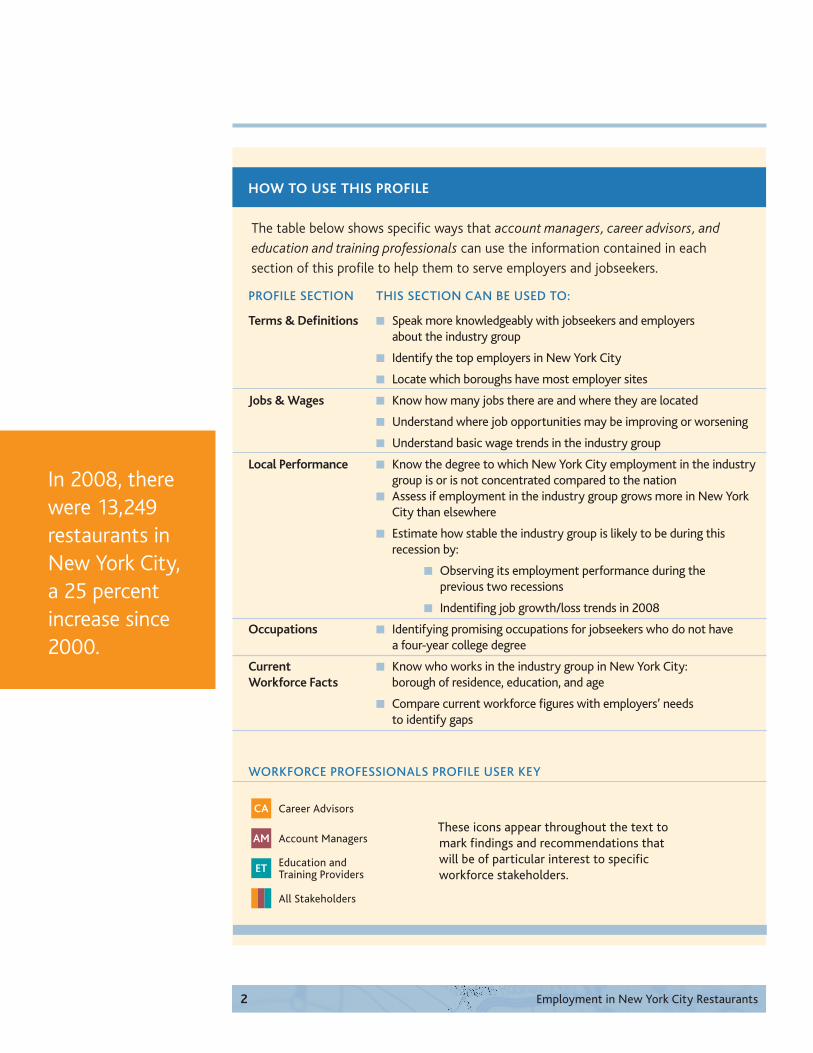
The table below shows specific ways that account managers, career advisors, and
education and training professionals can use the information contained in each section of this profile to help them to serve employers and jobseekers.
HOW TO USE THIS PROFILE
PROFILE SECTION THIS SECTION CAN BE USED TO:
These icons appear throughout the text to mark findings and recommendations that will be of particular interest to specific workforce stakeholders.
WORKFORCE PROFESSIONALS PROFILE USER KEY
Career Advisors
Education and Training Providers
All Stakeholders
CA
AM
ET
Account Managers
Terms & Definitions Speak more knowledgeably with jobseekers and employers about the industry group
Identify the top employers in New York City
Locate which boroughs have most employer sites
Jobs & Wages Know how many jobs there are and where they are located
Understand where job opportunities may be improving or worsening
Understand basic wage trends in the industry group
Local Performance Know the degree to which New York City employment in the industry group is or is not concentrated compared to the nationAssess if employment in the industry group grows more in New York City than elsewhere
Estimate how stable the industry group is likely to be during this recession by:
Observing its employment performance during the previous two recessions
Indentifing job growth/loss trends in 2008
Occupations Identifying promising occupations for jobseekers who do not have a four-year college degree
Current Know who works in the industry group in New York City: Workforce Facts borough of residence, education, and age
Compare current workforce figures with employers’ needs to identify gaps
In 2008, there were 13,249 restaurants in New York City, a 25 percent increase since 2000.
Employment in New York City Restaurants 3
may also serve alcoholic beverages, provide carry-out service or nontheatrical enter-tainment. Limited-service eating places include fast-food restaurants, takeout stands, snack bars, nonalcoholic beverage bars, and cafeterias and buffets. Examples of food services that are not included within this NAICS are bars, dinner theaters, food trucks, concession stands ,and caterers.
NAICS allows users to uniformly iden-tify and classify employers and ensure that people are referring to the same group of firms. The broadest NAICS grouping is the sector: identified by a 2-digit code. The next level is the subsector (3-digit code), fol-lowed by the industry group (4-digit codes). Workforce providers should identify one or more subsectors or industry groups and then identify the types of employers that are included in their selection. If the selec-tion does not reflect the employers they are
interested in, they can expand, reduce, or change the NAICS selection as needed.
AM Account managers need to understand how the food services and drinking places subsector is organized (as described above) so they can speak more knowledgeably with employers.
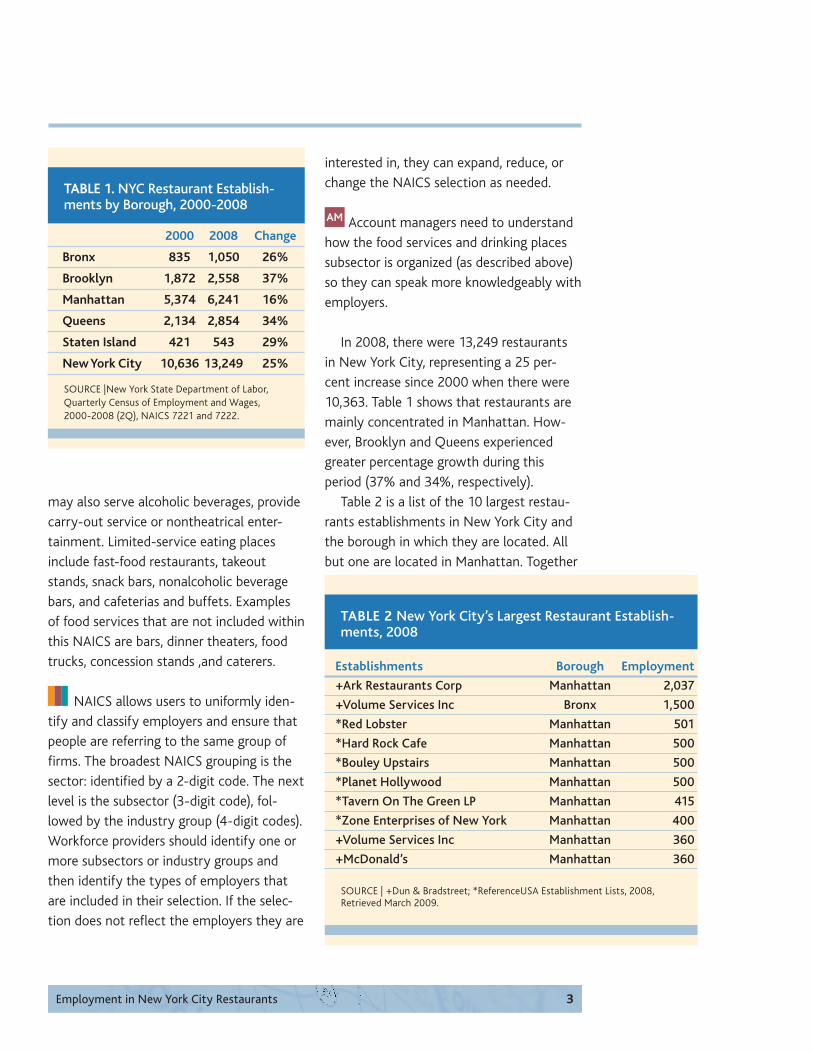
In 2008, there were 13,249 restaurants in New York City, representing a 25 per-cent increase since 2000 when there were 10,363. Table 1 shows that restaurants are mainly concentrated in Manhattan. How-ever, Brooklyn and Queens experienced greater percentage growth during this period (37% and 34%, respectively).
Table 2 is a list of the 10 largest restau-rants establishments in New York City and the borough in which they are located. All but one are located in Manhattan. Together
TABLE 1. NYC Restaurant Establish-ments by Borough, 2000-2008
SOURCE |New York State Department of Labor, Quarterly Census of Employment and Wages, 2000-2008 (2Q), NAICS 7221 and 7222.
2000 2008 Change
Bronx 835 1,050 26%
Brooklyn 1,872 2,558 37%
Manhattan 5,374 6,241 16%
Queens 2,134 2,854 34%
Staten Island 421 543 29%
New York City 10,636 13,249 25%
TABLE 2 New York City’s Largest Restaurant Establish-ments, 2008
Establishments Borough Employment
+Ark Restaurants Corp Manhattan 2,037
+Volume Services Inc Bronx 1,500
*Red Lobster Manhattan 501
*Hard Rock Cafe Manhattan 500
*Bouley Upstairs Manhattan 500
*Planet Hollywood Manhattan 500
*Tavern On The Green LP Manhattan 415
*Zone Enterprises of New York Manhattan 400
+Volume Services Inc Manhattan 360
+McDonald’s Manhattan 360
SOURCE | +Dun & Bradstreet; *ReferenceUSA Establishment Lists, 2008, Retrieved March 2009.
Employment in New York City Restaurants4
Topping the list, however, are two estab-lishments that are less well-known to people outside of the food service indus-tries. Ark runs several large establishments located among other places in Bryant Park, the World Financial Center, and at the South Street Seaport. Volume Services pro-vides all of the concessions at the Javits Convention Center and Yankee Stadium.
AM Account managers should know the largest establishments in restaurants and be aware that these establishments employ only a small portion (4%) of the restaurant workforce in New York City.
AM To collect establishment names and contact information, account managers should:
Purchase commercially available lists such as Hoover’s, Moody’s, Dun & Bradstreet, or ReferenceUSA; orDownload lists for free from the New York Public Library for Science, Indus-try and Business (SIBL) on 34th Street
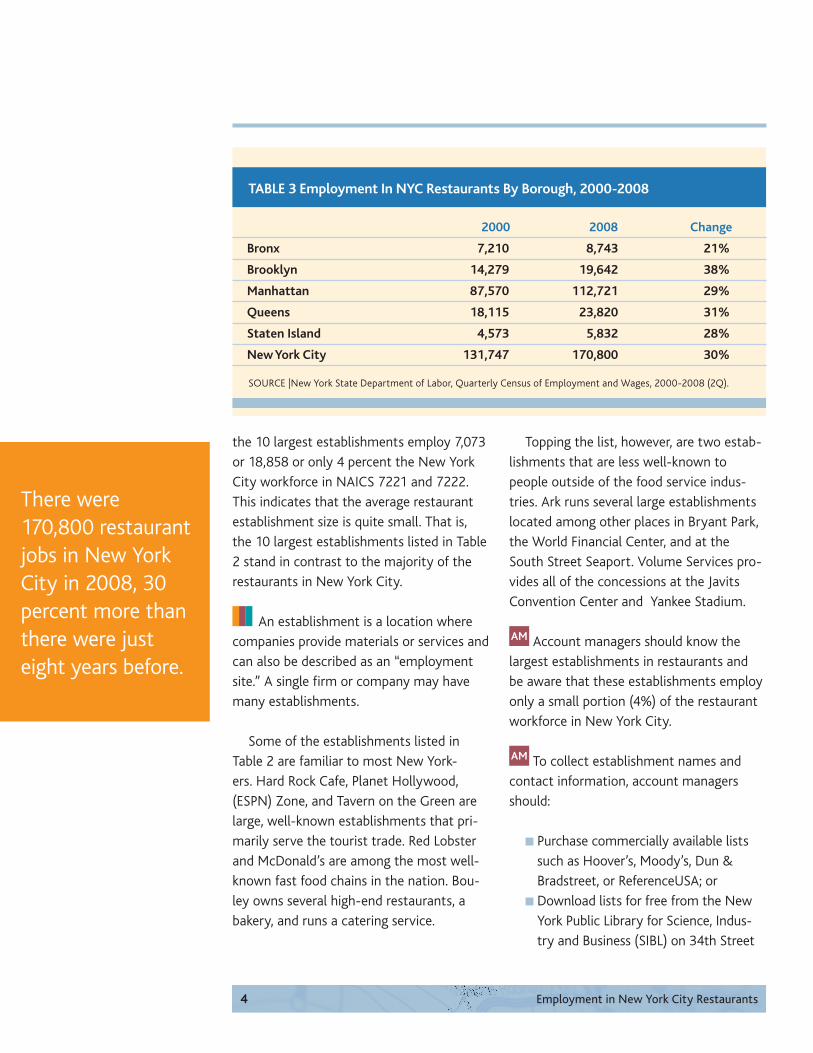
TABLE 3 Employment In NYC Restaurants By Borough, 2000-2008
SOURCE |New York State Department of Labor, Quarterly Census of Employment and Wages, 2000-2008 (2Q).
2000 2008 Change
Bronx 7,210 8,743 21%
Brooklyn 14,279 19,642 38%
Manhattan 87,570 112,721 29%
Queens 18,115 23,820 31%
Staten Island 4,573 5,832 28%
New York City 131,747 170,800 30%
the 10 largest establishments employ 7,073 or 18,858 or only 4 percent the New York City workforce in NAICS 7221 and 7222. This indicates that the average restaurant establishment size is quite small. That is, the 10 largest establishments listed in Table 2 stand in contrast to the majority of the restaurants in New York City.
An establishment is a location where companies provide materials or services and can also be described as an “employment site.” A single firm or company may have many establishments.
Some of the establishments listed in Table 2 are familiar to most New York-ers. Hard Rock Cafe, Planet Hollywood, (ESPN) Zone, and Tavern on the Green are large, well-known establishments that pri-marily serve the tourist trade. Red Lobster and McDonald’s are among the most well-known fast food chains in the nation. Bou-ley owns several high-end restaurants, a bakery, and runs a catering service.
There were 170,800 restaurant jobs in New York City in 2008, 30 percent more than there were just eight years before.
Employment in New York City Restaurants 5
and Madison Avenue. Instructions for downloading establishment lists from SIBL can be found at NYCLMIS’ website at www.urbanresearch.org or www.nyc.gov/wib.
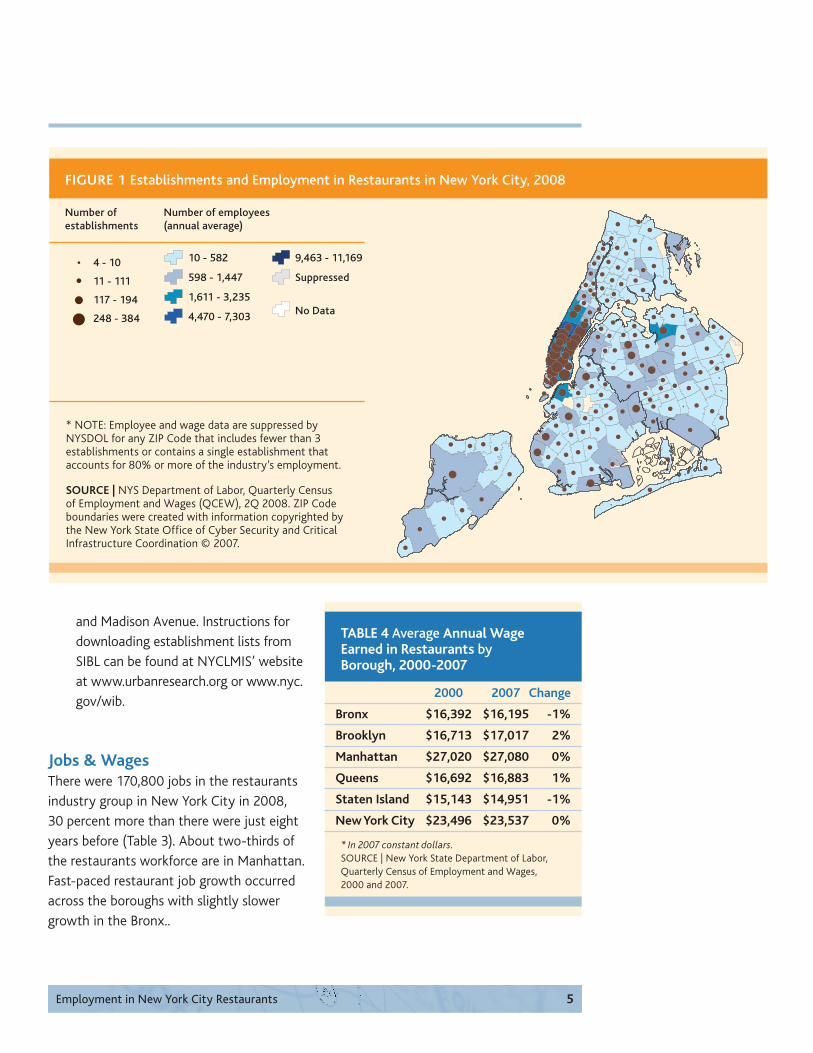
Jobs & WagesThere were 170,800 jobs in the restaurants industry group in New York City in 2008, 30 percent more than there were just eight years before (Table 3). About two-thirds of the restaurants workforce are in Manhattan. Fast-paced restaurant job growth occurred across the boroughs with slightly slower growth in the Bronx..
FIGURE 1 Establishments and Employment in Restaurants in New York City, 2008
TABLE 4 Average Annual Wage Earned in Restaurants by Borough, 2000-2007
* In 2007 constant dollars.SOURCE | New York State Department of Labor,Quarterly Census of Employment and Wages, 2000 and 2007.
2000 2007 Change
Bronx $16,392 $16,195 -1%
Brooklyn $16,713 $17,017 2%
Manhattan $27,020 $27,080 0%
Queens $16,692 $16,883 1%
Staten Island $15,143 $14,951 -1%
New York City $23,496 $23,537 0%
4 - 10
11 - 111
117 - 194
248 - 384
Number of establishments
Number of employees(annual average)
* NOTE: Employee and wage data are suppressed by NYSDOL for any ZIP Code that includes fewer than 3 establishments or contains a single establishment that accounts for 80% or more of the industry’s employment.
SOURCE | NYS Department of Labor, Quarterly Census of Employment and Wages (QCEW), 2Q 2008. ZIP Code boundaries were created with information copyrighted by the New York State Office of Cyber Security and Critical Infrastructure Coordination © 2007.
10 - 582
598 - 1,447
1,611 - 3,235
4,470 - 7,303
9,463 - 11,169
Suppressed
No Data
Employment in New York City Restaurants6
Figure 1 confirms the information in Tables 1 and 3: restaurants (indicated by the larger dots) are most concentrated throughout Manhattan (in most neighbor-hoods except East Harlem), with additional clusters in Brooklyn Heights and Flushing Queens. Job concentration (indicated by darker shading) corresponds with establish-ments concentrations in the same locations.
Table 4 shows the average annual wages in restaurants by borough in 2000 and 2007. In 2007 the overall average annual wage in restaurants was $23,537 in 2007, or just 12 percent over the poverty threshold of $21,027 for a family of four at the time. Manhattan restaurant workers earned the most on average at $27,080 in 2007.
Despite the tremendous job growth dur-ing this period, the average annual wage of restaurant workers did not change between 2000 and 2007.
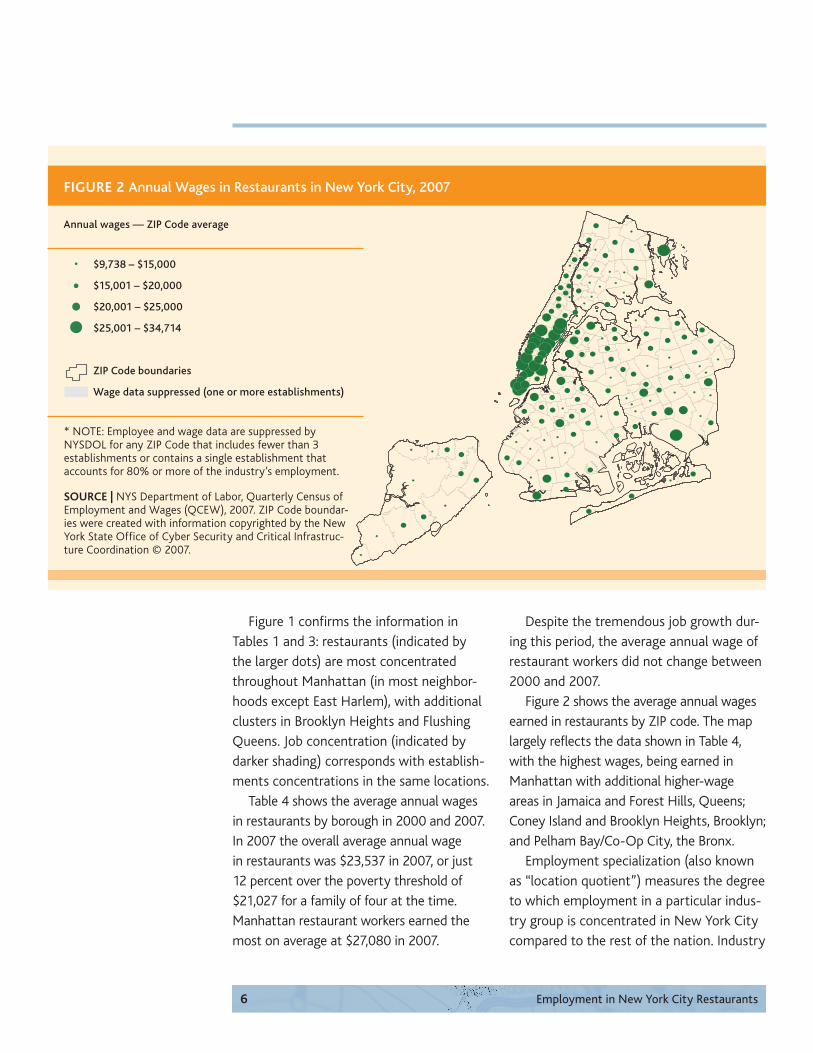
Figure 2 shows the average annual wages earned in restaurants by ZIP code. The map largely reflects the data shown in Table 4, with the highest wages, being earned in Manhattan with additional higher-wage areas in Jamaica and Forest Hills, Queens; Coney Island and Brooklyn Heights, Brooklyn; and Pelham Bay/Co-Op City, the Bronx.
Employment specialization (also known as “location quotient”) measures the degree to which employment in a particular indus-try group is concentrated in New York City compared to the rest of the nation. Industry
FIGURE 2 Annual Wages in Restaurants in New York City, 2007
$9,738 – $15,000
$15,001 – $20,000
$20,001 – $25,000
$25,001 – $34,714
ZIP Code boundaries
Wage data suppressed (one or more establishments)
Annual wages — ZIP Code average
* NOTE: Employee and wage data are suppressed by NYSDOL for any ZIP Code that includes fewer than 3 establishments or contains a single establishment that accounts for 80% or more of the industry’s employment.
SOURCE | NYS Department of Labor, Quarterly Census of Employment and Wages (QCEW), 2007. ZIP Code boundar-ies were created with information copyrighted by the New York State Office of Cyber Security and Critical Infrastruc-ture Coordination © 2007.
Employment in New York City Restaurants 7
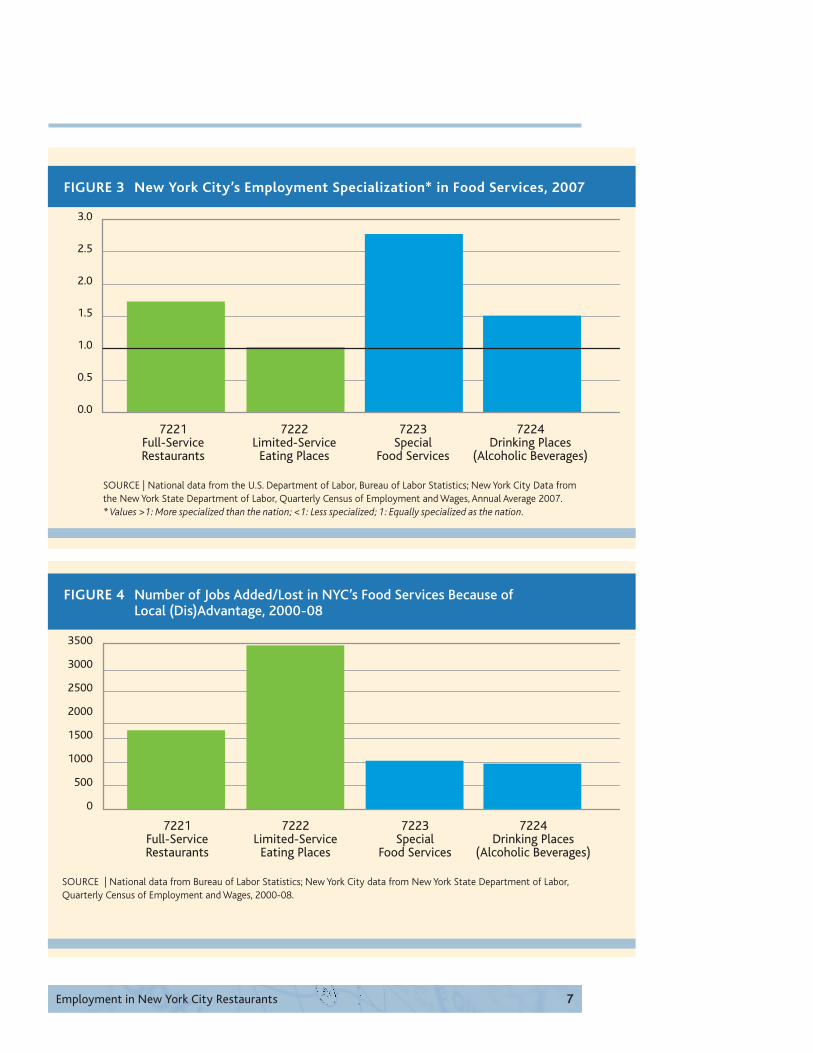
FIGURE 3 New York City’s Employment Specialization* in Food Services, 2007
0.0
0.5
1.0
1.5
2.0
2.5
3.0
7221Full-ServiceRestaurants
7222Limited-Service
Eating Places
7223Special
Food Services
7224Drinking Places
(Alcoholic Beverages)
SOURCE | National data from the U.S. Department of Labor, Bureau of Labor Statistics; New York City Data from the New York State Department of Labor, Quarterly Census of Employment and Wages, Annual Average 2007.* Values >1: More specialized than the nation; <1: Less specialized; 1: Equally specialized as the nation.
0
500
1000
1500
2000
2500
3000
3500
7221Full-ServiceRestaurants
7222Limited-Service
Eating Places
7223Special
Food Services
7224Drinking Places
(Alcoholic Beverages)
SOURCE | National data from Bureau of Labor Statistics; New York City data from New York State Department of Labor, Quarterly Census of Employment and Wages, 2000-08.
FIGURE 4 Number of Jobs Added/Lost in NYC’s Food Services Because of Local (Dis)Advantage, 2000-08
Employment in New York City Restaurants8
groups with high specialization are typically strongly rooted in New York City.
Figure 3 compares restaurants with the other industry groups in the food services subsector on the degree of employment specialization in New York City.
Employment in restaurants is more than one and a half times more specialized in New York City than it is in the rest of the nation overall. Even more specialized are specialty food services and drinking places.
AM Account managers should be aware of how strongly rooted in New York City the industry group they are working with is and the characteristics of the labor market that are important to the employers in that industry group.
Local PerformanceIn any industry, jobs may grow or decrease for several reasons: the economy is grow-ing in general; the industry group is grow-ing nationally above and beyond the overall economy, or because of unique advantages of a local economy. Figure 4 shows – for restaurants and the other industry groups in the subsector – the number of jobs added between 2000 and 2007 because of a unique local advantage.3 Together, full-ser-vice restaurants and limited service eating places added more than 5,000 jobs because of the unique advantages of operating in New York City.
Although caution is warranted when making comparisons, the current reces-sion is similar to the 1989-92 recession in
-7%
-6%
-5%
-4%
-3%
-2%
-1%
0%
1%
2%
3%
1989 1990 1991 1992
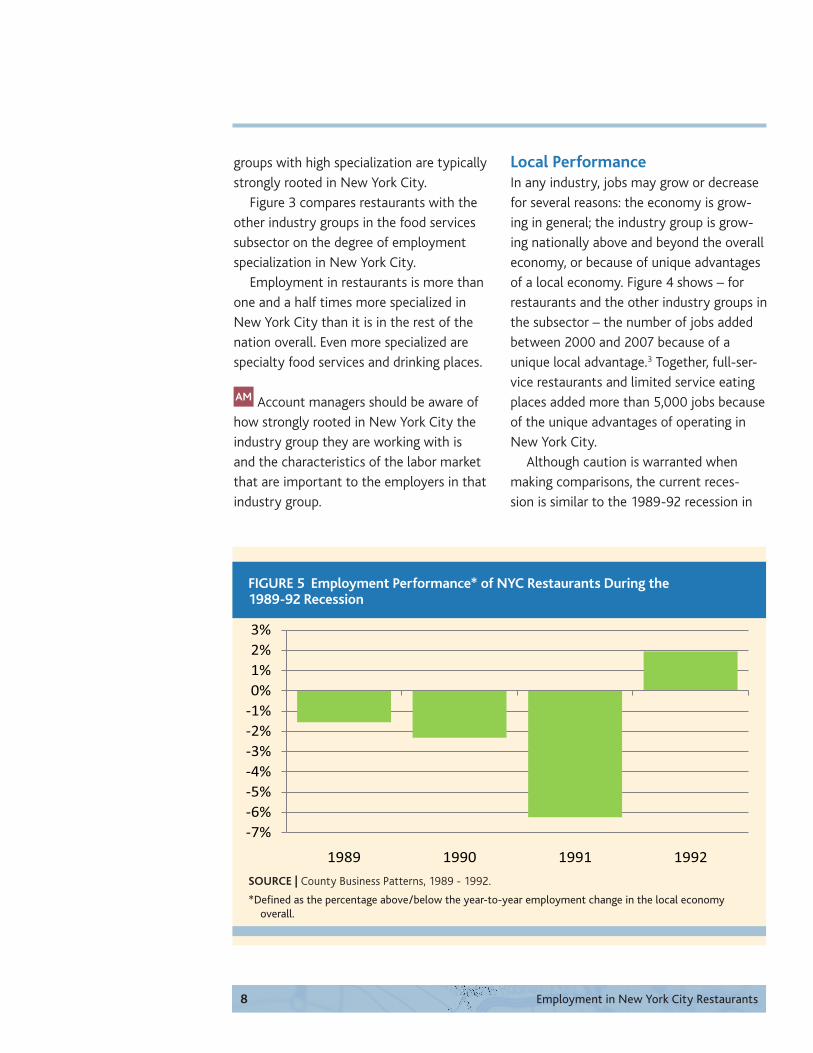
FIGURE 5 Employment Performance* of NYC Restaurants During the 1989-92 Recession
SOURCE | County Business Patterns, 1989 - 1992.
*Defined as the percentage above/below the year-to-year employment change in the local economy overall.
Employment in New York City Restaurants 9
-2%
3% 0%
-5% -2%
4% 0% 1%
-3%
2% 0% 1%0% 3% 0%
-1%
0% 7% 0% 1% 2% 3% 0% 0%
-6%
-4%
-2%
0%
2%
4%
6%
8%
Full-Service Restaurants Limited-Service Eating Places
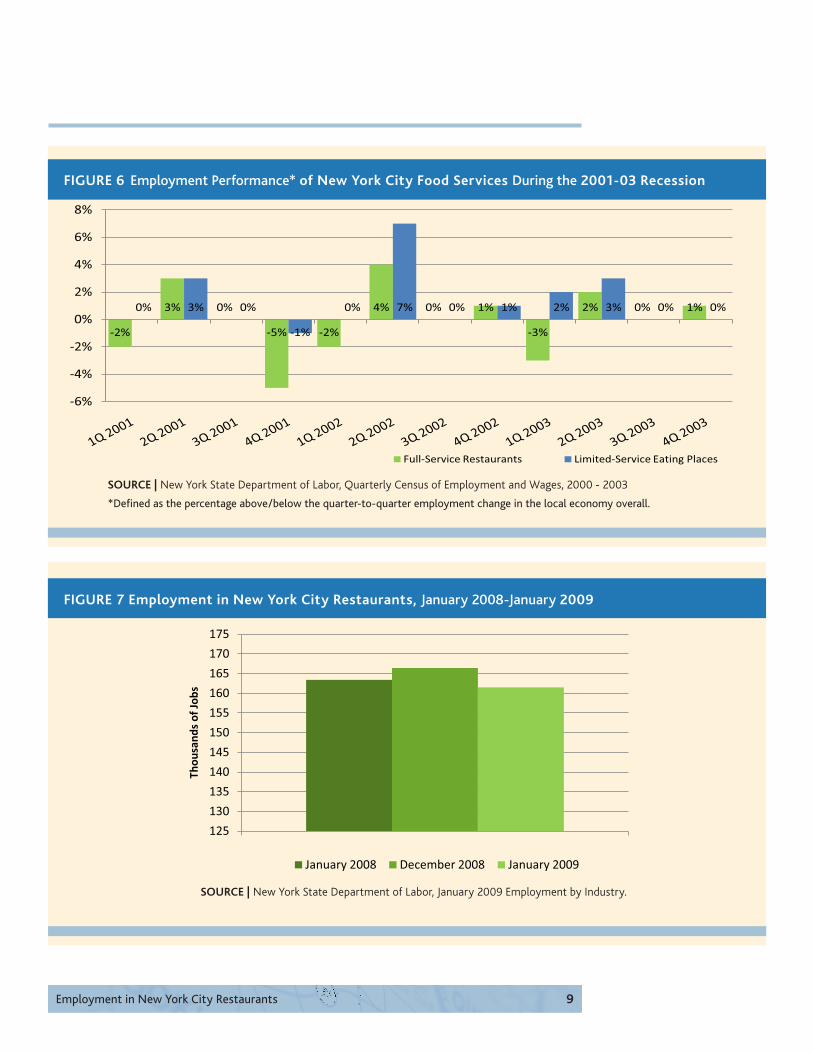
FIGURE 6 Employment Performance* of New York City Food Services During the 2001-03 Recession
125
130
135
140
145
150
155
160
165
170
175
Th
ou
sa
nd
s o
f Jo
bs
January 2008 December 2008 January 2009
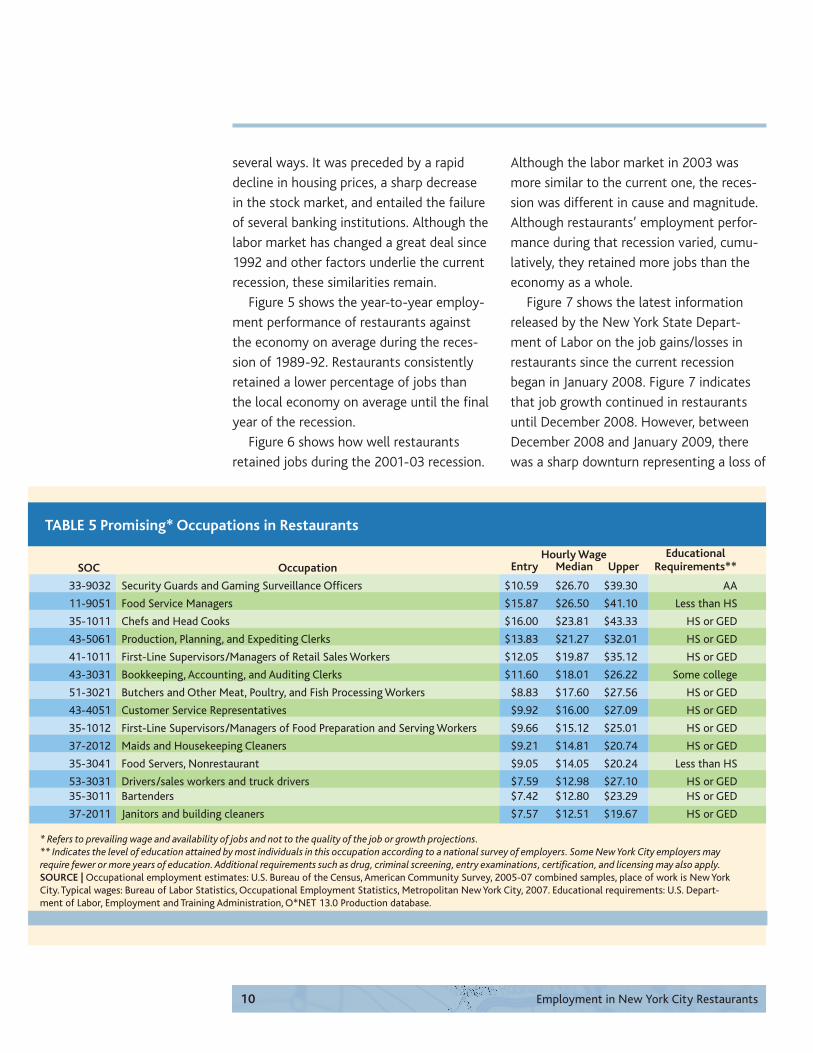
FIGURE 7 Employment in New York City Restaurants, January 2008-January 2009
SOURCE | New York State Department of Labor, Quarterly Census of Employment and Wages, 2000 - 2003
*Defined as the percentage above/below the quarter-to-quarter employment change in the local economy overall.
SOURCE | New York State Department of Labor, January 2009 Employment by Industry.
Employment in New York City Restaurants10
SOC OccupationHourly Wage Educational
Entry Median Upper Requirements**
33-9032 Security Guards and Gaming Surveillance Officers $10.59 $26.70 $39.30 AA
11-9051 Food Service Managers $15.87 $26.50 $41.10 Less than HS
35-1011 Chefs and Head Cooks $16.00 $23.81 $43.33 HS or GED
43-5061 Production, Planning, and Expediting Clerks $13.83 $21.27 $32.01 HS or GED
41-1011 First-Line Supervisors/Managers of Retail Sales Workers $12.05 $19.87 $35.12 HS or GED
43-3031 Bookkeeping, Accounting, and Auditing Clerks $11.60 $18.01 $26.22 Some college
51-3021 Butchers and Other Meat, Poultry, and Fish Processing Workers $8.83 $17.60 $27.56 HS or GED
43-4051 Customer Service Representatives $9.92 $16.00 $27.09 HS or GED
35-1012 First-Line Supervisors/Managers of Food Preparation and Serving Workers $9.66 $15.12 $25.01 HS or GED
37-2012 Maids and Housekeeping Cleaners $9.21 $14.81 $20.74 HS or GED
35-3041 Food Servers, Nonrestaurant $9.05 $14.05 $20.24 Less than HS
53-3031 Drivers/sales workers and truck drivers $7.59 $12.98 $27.10 HS or GED35-3011 Bartenders $7.42 $12.80 $23.29 HS or GED
37-2011 Janitors and building cleaners $7.57 $12.51 $19.67 HS or GED
* Refers to prevailing wage and availability of jobs and not to the quality of the job or growth projections.** Indicates the level of education attained by most individuals in this occupation according to a national survey of employers. Some New York City employers may require fewer or more years of education. Additional requirements such as drug, criminal screening, entry examinations, certification, and licensing may also apply.SOURCE | Occupational employment estimates: U.S. Bureau of the Census, American Community Survey, 2005-07 combined samples, place of work is New York City. Typical wages: Bureau of Labor Statistics, Occupational Employment Statistics, Metropolitan New York City, 2007. Educational requirements: U.S. Depart-ment of Labor, Employment and Training Administration, O*NET 13.0 Production database.
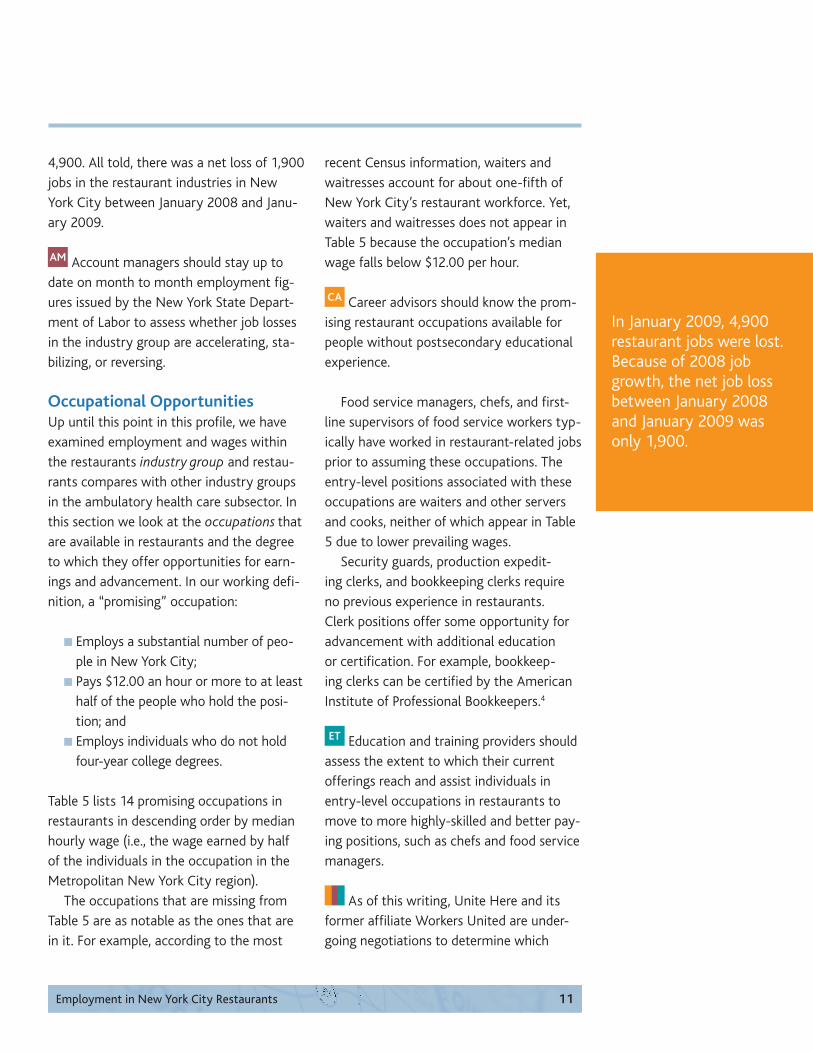
TABLE 5 Promising* Occupations in Restaurants
Although the labor market in 2003 was more similar to the current one, the reces-sion was different in cause and magnitude. Although restaurants’ employment perfor-mance during that recession varied, cumu-latively, they retained more jobs than the economy as a whole.
Figure 7 shows the latest information released by the New York State Depart-ment of Labor on the job gains/losses in restaurants since the current recession began in January 2008. Figure 7 indicates that job growth continued in restaurants until December 2008. However, between December 2008 and January 2009, there was a sharp downturn representing a loss of
several ways. It was preceded by a rapid decline in housing prices, a sharp decrease in the stock market, and entailed the failure of several banking institutions. Although the labor market has changed a great deal since 1992 and other factors underlie the current recession, these similarities remain.
Figure 5 shows the year-to-year employ-ment performance of restaurants against the economy on average during the reces-sion of 1989-92. Restaurants consistently retained a lower percentage of jobs than the local economy on average until the final year of the recession.
Figure 6 shows how well restaurants retained jobs during the 2001-03 recession.
Employment in New York City Restaurants 11
4,900. All told, there was a net loss of 1,900 jobs in the restaurant industries in New York City between January 2008 and Janu-ary 2009.
AM Account managers should stay up to date on month to month employment fig-ures issued by the New York State Depart-ment of Labor to assess whether job losses in the industry group are accelerating, sta-bilizing, or reversing.
Occupational OpportunitiesUp until this point in this profile, we have examined employment and wages within the restaurants industry group and restau-rants compares with other industry groups in the ambulatory health care subsector. In this section we look at the occupations that are available in restaurants and the degree to which they offer opportunities for earn-ings and advancement. In our working defi-nition, a “promising” occupation:
Employs a substantial number of peo-ple in New York City; Pays $12.00 an hour or more to at least half of the people who hold the posi-tion; and Employs individuals who do not hold four-year college degrees.
Table 5 lists 14 promising occupations in restaurants in descending order by median hourly wage (i.e., the wage earned by half of the individuals in the occupation in the Metropolitan New York City region).
The occupations that are missing from Table 5 are as notable as the ones that are in it. For example, according to the most
recent Census information, waiters and waitresses account for about one-fifth of New York City’s restaurant workforce. Yet, waiters and waitresses does not appear in Table 5 because the occupation’s median wage falls below $12.00 per hour.
CA Career advisors should know the prom-ising restaurant occupations available for people without postsecondary educational experience.
Food service managers, chefs, and first-line supervisors of food service workers typ-ically have worked in restaurant-related jobs prior to assuming these occupations. The entry-level positions associated with these occupations are waiters and other servers and cooks, neither of which appear in Table 5 due to lower prevailing wages.
Security guards, production expedit-ing clerks, and bookkeeping clerks require no previous experience in restaurants. Clerk positions offer some opportunity for advancement with additional education or certification. For example, bookkeep-ing clerks can be certified by the American Institute of Professional Bookkeepers.4
ET Education and training providers should assess the extent to which their current offerings reach and assist individuals in entry-level occupations in restaurants to move to more highly-skilled and better pay-ing positions, such as chefs and food service managers.
As of this writing, Unite Here and its former affiliate Workers United are under-going negotiations to determine which
In January 2009, 4,900 restaurant jobs were lost. Because of 2008 job growth, the net job loss between January 2008 and January 2009 was only 1,900.
Employment in New York City Restaurants12
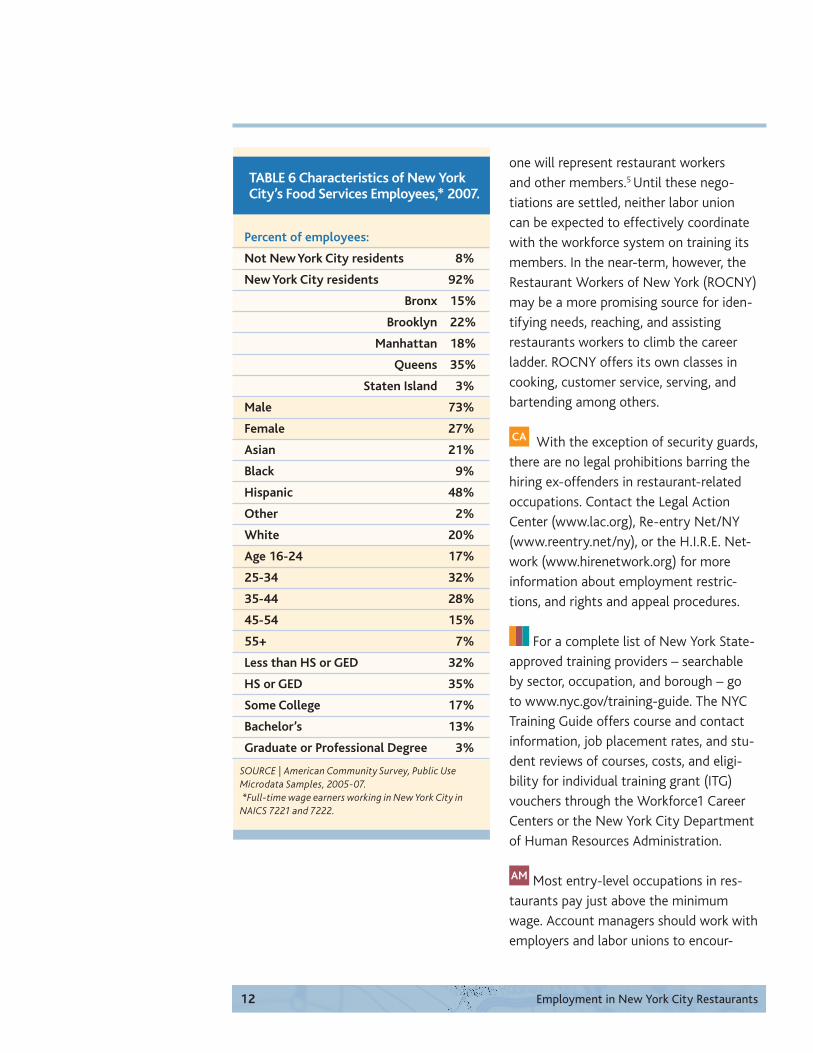
TABLE 6 Characteristics of New York City’s Food Services Employees,* 2007.
SOURCE | American Community Survey, Public Use Microdata Samples, 2005-07. *Full-time wage earners working in New York City in NAICS 7221 and 7222.
Percent of employees:
Not New York City residents 8%
New York City residents 92%
Bronx 15%
Brooklyn 22%
Manhattan 18%
Queens 35%
Staten Island 3%
Male 73%
Female 27%
Asian 21%
Black 9%
Hispanic 48%
Other 2%
White 20%
Age 16-24 17%
25-34 32%
35-44 28%
45-54 15%
55+ 7%
Less than HS or GED 32%
HS or GED 35%
Some College 17%
Bachelor’s 13%
Graduate or Professional Degree 3%
one will represent restaurant workers and other members.5 Until these nego-tiations are settled, neither labor union can be expected to effectively coordinate with the workforce system on training its members. In the near-term, however, the Restaurant Workers of New York (ROCNY) may be a more promising source for iden-tifying needs, reaching, and assisting restaurants workers to climb the career ladder. ROCNY offers its own classes in cooking, customer service, serving, and bartending among others.
CA With the exception of security guards, there are no legal prohibitions barring the hiring ex-offenders in restaurant-related occupations. Contact the Legal Action Center (www.lac.org), Re-entry Net/NY (www.reentry.net/ny), or the H.I.R.E. Net-work (www.hirenetwork.org) for more information about employment restric-tions, and rights and appeal procedures.
For a complete list of New York State-approved training providers – searchable by sector, occupation, and borough – go to www.nyc.gov/training-guide. The NYC Training Guide offers course and contact information, job placement rates, and stu-dent reviews of courses, costs, and eligi-bility for individual training grant (ITG) vouchers through the Workforce1 Career Centers or the New York City Department of Human Resources Administration.
AM Most entry-level occupations in res-taurants pay just above the minimum wage. Account managers should work with employers and labor unions to encour-
Employment in New York City Restaurants 13
Endnotes1. Throughout this report, for the sake of brevity, we refer to the industries being discussed as “restaurants.” According to NAICS protocol, restaurants includes two distinct industry groups: limited-service eating places (fast food) and full-service restaurants.
2. Poverty threshold tables are available at http://www.census.gov/hhes/www/poverty/threshld/thresh07.html.
3. Figure 5 includes the results of a “shift-share” analysis. Shift-share is a method used to measure the competitiveness of a region’s industries. The method divides local job growth into three different types. Local share is the portion of growth (or decline) that cannot be attributed to national or industry growth.
4. Bureau of Labor Statistics, U.S. Department of Labor, Occupational Outlook Handbook, 2008-09 Edition, Bookkeeping, Accounting, and Auditing Clerks, on the Internet at http://www.bls.gov/oco/ocos144.htm (visited March 27, 2009).
5. Maher, K. Union Factions Reject Mediation Offer from SEIU, Wall Street Journal, May 2, 2009..
6. The racial and ethnic composition may not be evenly distributed across occupations, however. A recent study highlighted differences in the racial and ethnic composition of workers in “back of the house” versus “front of the house” restaurant occupations in New York City. See, Lee, Jennifer, “Racial Bias Seen in Hiring of Waiters,” New York Times City Room, March 31, 2009.
age the development and strengthening of advancement pathways for individuals in these low-wage restaurant positions.
Current Workforce FactsIn 2005-2007, 92 percent of the individu-als working in restaurants in New York City were New York City residents (Table 6) and 35 percent were Queens residents. Males predominate the industry making up 73 percent of the restaurant workforce. Indi-viduals of Asian and Hispanic descent are over-represented in the restaurant work-force at 69 percent compared to 37 per-cent of the employed population in New York City.6 Table 5 earlier in this report sug-gests that most employment in restaurants does not require educational experience beyond a high school diploma or GED. Indeed, two-thirds of the workforce has a high school diploma, GED or fewer years of educational experience. New York City
Employment in New York City Restaurants14
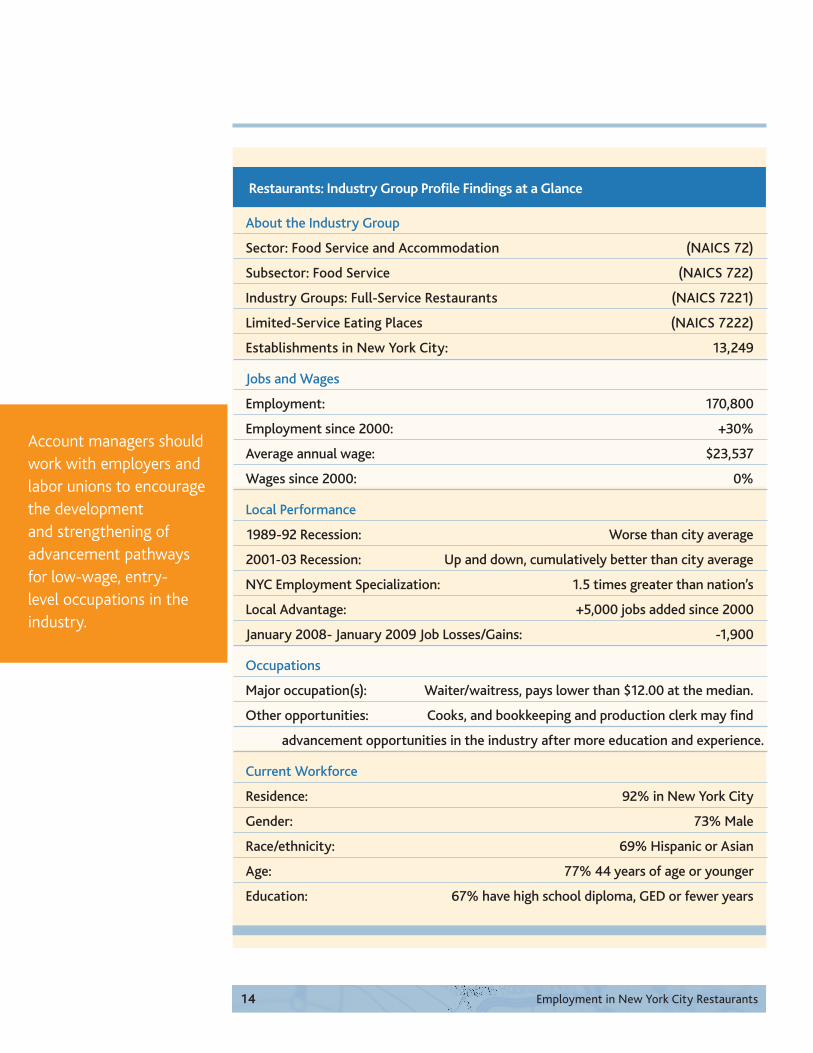
About the Industry Group
Sector: Food Service and Accommodation (NAICS 72)
Subsector: Food Service (NAICS 722)
Industry Groups: Full-Service Restaurants (NAICS 7221)
Limited-Service Eating Places (NAICS 7222)
Establishments in New York City: 13,249
Jobs and Wages
Employment: 170,800
Employment since 2000: +30%
Average annual wage: $23,537
Wages since 2000: 0%
Local Performance
1989-92 Recession: Worse than city average
2001-03 Recession: Up and down, cumulatively better than city average
NYC Employment Specialization: 1.5 times greater than nation’s
Local Advantage: +5,000 jobs added since 2000
January 2008- January 2009 Job Losses/Gains: -1,900
Occupations
Major occupation(s): Waiter/waitress, pays lower than $12.00 at the median.
Other opportunities: Cooks, and bookkeeping and production clerk may find
advancement opportunities in the industry after more education and experience.
Current Workforce
Residence: 92% in New York City
Gender: 73% Male
Race/ethnicity: 69% Hispanic or Asian
Age: 77% 44 years of age or younger
Education: 67% have high school diploma, GED or fewer years
Restaurants: Industry Group Profile Findings at a Glance
Account managers should work with employers and labor unions to encourage the development and strengthening of advancement pathways for low-wage, entry-level occupations in the industry.
Employment in New York City Restaurants 15
About the NYCLMISThe New York City Labor Market Information Service (NYCLMIS) provides labor market analysis for the public workforce system. The service is a joint endeavor of the New York City Workforce Investment Board (WIB) and the Center for Urban Research at The Graduate Center of the City University of New York. The NYCLMIS’ objectives are to:
Develop action-oriented research and information tools that will be used by workforce development service providers and policy makers to improve their practice.Be the portal for cutting-edge and timely labor market data about New York City.
The NYCLMIS primarily serves the program and policy needs of the public workforce system. The NYCLMIS creates research and associated products that are of service to the broader practitioner and policy communities in their day-to-day and strategic decision-making. These products help distill, frame, and synthesize the volumes of data available for the practical use of the public workforce system’s partners and stakeholders, with the overall goal of raising public awareness of the importance of work-force development in New York City.
About the WIBThe New York City Workforce Invest-ment Board (WIB) administers the federal Workforce Investment Act funds in New York City and oversees the public workforce system run by the Department of Small Business Services and the Department of Youth and Community Development. The WIB is made up of over 40 vol-unteer members, appointed by the Mayor, representing local businesses, educational institutions, labor unions, community-based organizations, and other government agencies.
About the Center for Urban ResearchWorking with the City University of New York Graduate Center’s faculty and students, the Center for Urban Research organizes basic research on the critical issues that face New York and other large cities in the U.S. and abroad; collaborates on applied research with public agencies, non-profit organizations, and other part-ners; and holds forums for the media, foundations, community organizations and others about urban research at The Graduate Center of the City University of New York.

CUNY Graduate Center365 Fifth AvenueRoom 6202New York, NY 10016
212 817 2031 [email protected] and www.nyc.gov/wib


![NZ Certificate in Cookery [Level 4]€¦ · NZ Certificate in Cookery [Level 4] programme offers you enhanced employment opportunities in restaurants and commercial kitchens including](https://img.pdfslide.us/doc/110x75/5fa6c31a7169720139704225/nz-certificate-in-cookery-level-4-nz-certificate-in-cookery-level-4-programme.jpg)