Embed Size (px)
Citation preview

National Bureau of StatisticsMinistry of Finance & TreasuryMale’, Maldives
EMPLOYMENTStatistical Release III:

All rights reserved. Requests for permission to reproduce or translate this publication (wheather for sale or for noncommercial distribution) should be addressed to National Bureau
of Statistics.
Cover design by Ashiyath Shazna
Layout and design by Aminath Musfiqa Ibrahim

Household Income and Expenditure Survey (HIES)Analytical Report III: Employment
2016
National Bureau of StatisticsMinistry of Finance & Treasury
Male’, Maldives
4Household Income & Expenditure Survey 2016
PREF
ACE The Household Income and Expenditure Survey (HIES) collects information on the in-
come and expenditure of households in Maldives. It also obtains information on house-
hold characteristics, demographic and socio-economic characteristics and access and
ownership of consumer durables. These include aspects such as education, migration,
employment, marriage and fertility of household members.
Field work of HIES was carried out during March to May 2016 and August to November
2016, with a break during the month of Ramazan. This is the first time that HIES data has
been collected with a sample size and design, that enabled results to be representative
at the level of individual Atolls, in addition to Male’ and the national level. The initial
sample size was 4,985 households across the country. This sample size represents 8% of
households at the national level, 3% in case of Male’ and 11% for the rest of the Atolls. Re-
sponse rate for the survey was 98%. Based on the response rate, the sample of HIES 2016
included 4,910 households with a population of 26,025 individuals across the country.
The HIES 2016 is the third nationwide HIES conducted by the National Bureau of Statis-
tics (NBS) of Maldives. It is a household sample survey conducted regularly, once in every
five years, by NBS. The first nationwide HIES was undertaken in 2002-2003 and its results
representative at national level, for Male’ and for Atolls as a whole. The second HIES car-
ried out in 2009-2010 provided data at an additional level of detail, whereby results were
also representative at region level, based on the grouping of islands that government used
as regions at the time.
The 2016 HIES included a special labour force module designed to capture detailed infor-
mation and to collect relevant data to study the labour market situation in the country.
Data needed to measure different forms of work and labour underutilization were collect-
ed as per international definitions using the new guidelines adopted by the International
Labour Organisation (ILO) in 2013. In the absence of a Labour Force Survey (LFS) in the
country this is the best option available for NBS to collect employment statistics on a more
5Household Income & Expenditure Survey 2016
frequent basis. Special focus and efforts were made in the HIES 2016 to include additional
data needed to improve the methodology used in the estimation of poverty in the country.
Due to these methodological improvements direct comparisons with previous estimates
are not possible. Hence data users need to take these methodological differences into con-
sideration.
This publication primarily focused on the key finding on Employment from HIES 2016. A
series of publications with key findings and analysis focused on different aspects will be
released from HIES 2016 by the NBS.
Results of the survey will be used by NBS to improve the statistics produced on national
accounts and Gross Domestic Product (GDP) as well as the Consumer Price Index (CPI).
Data on household expenditure will be used to update the estimates of household final
consumption aggregates in GDP. Similarly changes in household consumption pattern
observed in HIES will be used to update the expenditure weights assigned and revise
the basket of goods and services. In addition to this NBS will compile poverty statistics,
employment statistics and compile and update the Sustainable Development Goal (SDG)
indicators using the data from HIES 2016.
It is expected that this report and data will be a valuable resource for other government
agencies, researchers, students, NGOs, international agencies as well as the general public
in making evidence-based and informed decisions. I hope that data from this survey will
be used extensively and additional analysis and research outputs will be produced.
I would like to take this opportunity to thank each and every household that participated
in the HIES 2016, for providing valuable information and time during this important ex-
ercise. The hard work and dedication of all the enumerators and supervisors in gathering
the information and those who worked in coding and data entry is appreciated. It is the

6Household Income & Expenditure Survey 2016
cooperation extended by the households and the efforts during the field work, that made
this survey results possible at this level of geographic disaggregation and high level of
precision.
The technical support provided by the World Bank (WB), International Labour Organi-
sation (ILO) and the United Nations Economic and Social Commission for Asia and the
Pacific (ESCAP) is highly valued.
Support and guidance provided at the policy level by the Ministry of Finance and Trea-
sury enabled the mobilization of finances and the smooth implementation of this survey
possible and this is gratefully appreciated.
I commend and applaud the hard working and dedicated staff of NBS for their efforts
during all stages of this survey from its initiation till the dissemination of the results. The
role played by Ms. Aishath Laila who managed the survey operation, Ms.Fathimath Nihan
who led the data processing work, and the staff of survey and data processing division of
NBS deserve a special mention. The efforts made by Ms. Fathimath Riyaza in improving
data required for poverty measurement and analysis is noted with appreciation. It was a
privileged for me to be part of the team and to be able to provide support and guidance to
the team during this important exercise. The names of persons who contributed to make
this survey a success is duly noted under the acknowledgements section.
My appreciation goes to Mr. Mohamed Zuhair, former Deputy Minister of MOFT for the
guidance and advice provided during this exercise. I also thank the Senior Advisor to the
Minister of Finance and Treasury Hon. Mohamed Jaleel for his feedback on the survey
analysis.
I fully acknowledge and value the support provided at the policy level by the Minister of
Finance and Treasury Hon. Ahmed Munawar and Minister of State for Finance and Trea-

7Household Income & Expenditure Survey 2016
sury Mr. Mohamed Ashmalee, throughout this survey.
We hope for continued support from the general public, to our surveys, to be able to pro-
vide high quality statistics, we consider a public good. We welcome your feedback and the
staff of NBS will remain at your service to provide technical support and to facilitate the
use of this data for informed decision making.
Aishath Shahuda
Chief Statistician
National Bureau of Statistics
4 July 2018

8Household Income & Expenditure Survey 2016
ACKN
OW
LEDG
EMEN
TS A study of this magnitude cannot be undertaken without the active help and support of a
number of individuals and organizations.
We extend our thanks and appreciation to the World Bank, International Labour Orga-
nization (ILO) and United Nations Economic and Social Commission for Asia and the
Pacific (ESCAP) for their technical support and guidance provided to the National Bureau
of Statistics (NBS).
A team of consultants from the World Bank Ms. Silvia Redaelli, Mr. Tite Habiyakare from
ILO, Mr. Christopher Ryan from ESCAP provided guidance during questionnaire design.
Ms. Josephine Durazo from the World Bank also provided technical support in finalizing
the consumption module.
Mr. David Megill made the sample design, Mr. Jon Kastelic assisted in developing the
data cleaning. Professor Giovanni Vecchi and Ms. Christina Wieser from World Bank
analysed the poverty part. They were assisted by Ms. Giulia Mancini.
Mr. Jean Marie Hakizimana, Mr. Tite Habiyakare and ILO technical team provided sup-
port in validation of Labour market indicators and provided valuable feedback for the
improvement of employment chapter. Ms. Christina Wieser from World Bank also pro-
vided suggestions for improvement of the expenditure chapter. Similarly, Mr. Arman
Bidar Bakhtnia from ESCAP provided comments on the income chapter.
We also acknowledge the financial support provided by UNFPA Maldives, in increasing
the sample size for the Laamu Atoll under the LECRED project. Support from UNICEF
Maldives, in providing a consultant for capacity building of NBS data processing staff is
also acknowledged.
Team from the National Bureau of Statistics, who played a key role in completing the var-
9Household Income & Expenditure Survey 2016
ious tasks in a timely manner to ensure the successful implementation of the survey are
duly noted below, highlighting their role and contributions.
NBS TEAM
Questionnaire development technical team:
Aishath Laila, Fathimath Riyaza, Fathimath Hana Mansoor, Fathimath Nihan, Aishath
Hassan, Aishath Aniya, Fathimath Hashiya, Mohamed Zuhair and Aishath Shahuda
Questionnaire design:
Fathimath Hashiya, Aishath Aniya, Mohamed Suvaad, Mariyam Mirfath and Mohamed
Fathih
Training material development team:
Fathimath Hana Mansoor, Aishath Laila, Fathimath Riyaza , Mariyam Mirafth
Trainers who conducted Enumerator trainings:
Aishath Aniya, Hudha Haleem, Ashiyath Shazna, Aishath Laila, Fathimath Hana Man-
soor, Mariyam Mirfath, Fathimath Riyaza, Mariyam Shadheena, Sajida Ahmed, Lizama
Faheem, Fathimath Hashiya, Rasheeda Najeeb and Aishath Shahuda
Logistic arrangements:
Lizama Faheem, Fathimath Hashiya, Hamdha Latheef, Mohamed Suvaad, Aishath Ani-
ya, Abdul Rasheed, Shifaz Mohamed, Shaheena Mohamed and Mohamed Fathih
Administrative and Budget support:
Shamila Rasheed, Zumna Hassan, Abdulla Nashid, Sunayya Jaufar, Abdulla Ali and
budget team of MOFT

10Household Income & Expenditure Survey 2016
IT support:
Mohamed Irfan and Ali Nizam
Overall administrative support:
Thahumeela Ibrahim and NBS Corporate Affairs team
Publicity team:
Mariyam Mirfath, Fathimath Riyaza, Hana Mansoor, Ashiyath Shazna, Aishath Laila and
Mohamed Zuhair
Field work supervision:
Aishath Laila, Fathimath Hana Mansoor, Fathimath Nihan, Mariyam Mirfath, Fathimath
Riyaza, Mariyam Shadheena, Sajida Ahmed, Lizama Fahmy, Aishath Aniya, Fathimath
Hashiya, Hamadha Latheef, Rasheeda Najeeb, Hudha Haleem and Mohamed Suvaad
Data entry program developed and data processing and generated tables:
Fathimath Nihan, Naizma Shareef and Ahmed Shaheed
Tabulation plan:
Aishath Laila, Fathimath Hana Mansoor and Hamdha Latheef
Data coding:
Aishath Aniya, Fathimath Hana Mansoor, Fathimath Hashiya, Lizama Fahmy, Mohamed
Suvaad, Hudha Haleem and Fathimath Shazna
Data cleaning and editing:
Aishath Laila, Fathimath Riyaza, Fathimath Hana Mansoor, Hudha Haleem, Mariyam
Mirfath, Ikrisha Abdul Wahid, Hamdha Latheef and Fathimath Hashiya

11Household Income & Expenditure Survey 2016
Analysis and Survey Report:
Household Income: Fathimath Hana Mansoor and Aishath Laila
Household Expenditure: Fathimath Riyaza
Housing and population characteristics:
Housing and population: Ikrisha Abdul Wahid & Aishath Laila
Education and migration: Ashiyath Shazna,
Nuptiality & Fertility: Fathimath Riyaza
Employment: Aishath Laila
Poverty and Inequality: Christina Wieser from World Bank and necessary edits
brought by Fathimath Riyaza
Technical and administrative Report:
Fathimath Hashiya, Aishath Laila, Fathimath Nihan, Nazima Shareef and Ahmed Sha-
heed
Review of all chapters: Aishath Shahuda
Info graphic design: Aishath Laila, Mohamed Irfan, Ismail Mahfooz and Ali Shafeeu
Cover design & layout: Ashiyath Shazna and Aminath Mushfiqa Ibrahim
Statistics Division
National Bureau of Statistics
4 July 2018

12Household Income & Expenditure Survey 2016
TABL
E O
F CO
NTE
NTS
PREFACE 4
ACKNOWLEDGEMENTS 8
TABLE OF CONTENTS 12
LIST OF FIGURES 15
LIST OF TABLES 20
SUMMARY 21
KEY INDICATORS 23
Selcted labour force indicators 23
INTRODUCTION 26
CONCEPT OF WORK USED IN HIES 2016 30
Forms of work 31
3.2.1 Labour Force module of HIES 32
WORKING AGE POPULATION AND LABOUR FORCE 34
3.3.1 Working Age-population by labour force status 34
3.3.2 Summary labour market indicators 35
GEOGRAPHICAL AND GENDER DISPARITIES IN LABOUR FORCE PARTICIPATION 37
LABOUR FORCE PARTICIPATION BY AGE GROUP 40
EMPLOYMENT-TO-POPULATION RATIO BY AGE GROUPS 43
EMPLOYMENT 46
3.7.1 Status in employment, informal sector and 46
informal employment – main activity 46
3.7.1.1 Status in employment in main job 46
3.7.1.2 Employment in informal sector in main job 48
3.7.1.3 Employment in Informal sector in main job 49

13Household Income & Expenditure Survey 2016
3.7.2 Types of establishment – main activity 51
3.7.3 Public versus private sector– main activity 52
3.7.4 Occupation- main activity 53
3.7.5 Proportion of women in management position 55
3.7.6 Top ten occupations- main activity 55
3.7.7 Industries or sectors of employment- main activity 58
3.7.8 Employed population by educational attainment 61
HOURS OF WORK AND TIME-RELATED UNDEREMPLOYMENT 63
3.8.1 Hours of work 63
3.8.2 Excessive hours of work 65
3.8.3 Time-related underemployment 67
EMPLOYMENT RELATED INCOME 69
3.9.1 Average monthly earnings for main job 69
3.9.2 Employees with low earnings in the main job 74
3.9.3 Low earnings workers from all type of employment status 77
GENDER PAY GAP 79
3.10.1 Only for employees – main job 79
3.10.2 For all the status of employment (employed population) – main job
81
UNEMPLOYMENT RATE 85
3.11.1 Methods of search for employment 87
3.11.2 Duration of unemployment 88
3.11.3 Organization and Job preferred 89
PERSONS OUTSIDE THE LABOUR FORCE 92

14Household Income & Expenditure Survey 2016
3.12.1 Potential labour force 96
3.12.2 Others outside of the Labour force (not seeking, not available) 98
3.12.3 Decline job 100
MEASURES OF LABOUR 101
UNDERUTILIZATION 101
3.13.1 Composite measure of labour 101
underutilization 101
3.13.2 Labour underutilization 102
YOUTH WHO ARE NOT IN EMPLOYMENT, EDUCATION OR TRAINING (NEET) 107
OWN-USE PRODUCERS 109
3.15.1 Own use producers 109
3.15.2 Average hours spent by Own-use producers 111
TOTAL HOURS SPENT IN ALL ACTIVITIES- PAID AND UNPAID WORK 112
MAIN CONCEPTS AND DEFINITIONS 115

15Household Income & Expenditure Survey 2016
LIST
OF
FIG
URES
Figure 3.1: Composition of working age population by labour force status, Mal-
dives, 2016 34
Figure 3.2: Headline labour market indicators, HIES 2016 37
Figure 3.3: Labour force participation rate, by location and sex, HIES 2016 38
Figure 3.4: Percentage of population in employment, unemployment, outside the
labour force by sex and location, Maldives, HIES 2016 38
Figure 3.5: Disparities among Atolls, HIES 2016 39
Figure 3.6 Labour force participation rate by sex and age group, Maldives, HIES
2016 40
Figure 3.7 Labour force participation rate by locality, sex and age group, HIES
2016 41
Figure 3.8 Labour force participation rate and employment-population ratio, Mal-
dives, HIES 2016 43
Figure 3.9 Employed population by locality and sex, HIES 2016 46
Figure 3.10: Employed by type of employment and sex, Maldives, HIES 2016 47
Figure 3.11: Proportion of employed persons on the informal sector by sex, age
group and educational attainment, HIES 2016 49
Figure 3.12: Employment by type of establishment by locality, HIES 2016 51
Figure 3.13: Employment by type of establishment by sex, HIES 2016 52
Figure 3.14: Share of employment by private and public sector and location, HIES
2016 53
Figure 3.15: Occupations for main activity, by sex, Maldives, HIES 2016 54
Figure 3.16a: Top ten occupation at main job, Maldives, HIES 2016 57
Figure 3.16b: : Top ten occupation at main job by sex, Maldives, HIES 2016 58

16Household Income & Expenditure Survey 2016
Figure 3.17: : Number in employment by sector, Maldives, HIES 2016 59
Figure 3.18: : Comparison of sectors of employment for main activity, Census
2014 & HIES 2016 60
Figure 3.19: : Employed population by highest level of education attainment
achieved, Maldives, HIES 2016 62
Figure 3.20a : Average hours spent per day on main economic activity by sex,
HIES 2016 63
Figure 3.20b: : Average hours spent per day on main economic activity by sex,
HIES 2016 64
Figure 3.21: Proportion of employed persons with excessive hours of work (48+
hours in a week) at all jobs by sex, locality and main occupation, HIES 2016 66
Figure 3.22: Proportion of employed persons in time-related underemployment
by sex, locality and main occupation, HIES 2016 68
Figure 3.23: Average monthly earnings of employed persons for the main job by
sex, locality, education attainment and age group, HIES 2016 69
Figure 3.24: Average monthly earnings of employed persons for the main job by
public vs. private sector, HIES 2016 70
Figure 3.25: Average monthly earnings of employed persons for the main job by
industry and occupation, HIES 2016 71
Figure 3.26: Average and median monthly earnings of employed persons for the
main job by sex, locality, HIES 2016 72
Figure 3.27: Average and median monthly earnings of employed persons for
main job by status of employment, Maldives, HIES 2016 72

17Household Income & Expenditure Survey 2016
Figure 3.28: Average monthly earnings and median monthly earnings of em-
ployed persons for main job by sex and by local and foreigners, Maldives, HIES
2016 73
Figure 3.29: Number of foreign women workers and mean monthly earnings of
employed foreign women for main job by occupation, Maldives, HIES 2016 74
Figure 3.30: Percentage of employees with low earnings from the main job by
sex, age group, HIES 2016 76
Figure 3.31: Percentage of employees with low earnings from the main job by
sex and by local and foreigners, HIES 2016 76
Figure 3.32: Percentage of low earnings workers from all jobs by sex, HIES 2016
77
Figure 3.33: Percentage of low earnings workers from all jobs by sex and by local
and foreigners, HIES 2016 78
Figure 3.34: Gender pay gap for mean hourly earnings (only employees) in the
main job by locality, HIES 2016 79
Figure 3.35: Gender pay gap ONLY for Maldivian for mean hourly earnings (only
employees) in the main job by occupation, HIES 2016 80
Figure 3.36: Gender pay gap ONLY for Maldivian for mean hourly earnings (only
employees) in the main job by age group, HIES 2016 81
Figure 3.37: Gender pay gap for mean hourly earnings (including employees and
other status of employment) in the main job by locality, HIES 2016 81
Figure 3.38: Unemployment rate by locality, sex, age group and educational at-
tainment, HIES 2016 85
Figure 3.39: Unemployed population who had past experience by the duration
18Household Income & Expenditure Survey 2016
since leaving past job, HIES 2016 87
Figure 3.40: Method of search for employment by sex and locality, HIES 2016 88
Figure 3.41: Duration of unemployment by sex and locality, HIES 2016 88
Figure 3.42: Percentage of unemployed population by type of organization pre-
ferred to work and kind of job preferred 89
Figure 3.43: Population outside labour force by age, HIES 2016 92
Figure 3.44: Percentage distribution of population outside the labour force by
age and sex, 2016 93
Figure 3.45: Reason for not seeking a job and being outside the labour, by sex
and locality HIES 2016 94
Figure 3.46: Reason for not seeking a job and being outside the labour, by sex
and age group HIES 2016 95
Figure 3.47: Reason for not available for work and being outside the labour, by
sex, HIES 2016 95
Figure 3.48: Potential labour force by sex and locality, HIES 2016 96
Figure 3.49: Potential labour force by sex and age group and locality, HIES 2016
97
Figure 3.50: Reason for not seeking a job and being potential labour (not seeking
but available), by sex, HIES 2016 97
Figure 3.51: Others outside the labour force by sex and age group and locality,
HIES 2016 98
Figure 3.52: Reason for not seeking a job and being others outside the labour
(not seeking, not available), by sex, HIES 2016 99
Figure 3.53: Reason for not available for work and being others outside the la-

19Household Income & Expenditure Survey 2016
bour (not seeking, not available), by sex, HIES 2016 99
Figure 3.54: Reasons for decline a job, by sex, HIES 2016 100
Figure 3.55: Type of job preferred to work and kind of job preferred, by sex, HIES
2016 100
Figure 3.56: Extended labour force by sex and by locality, HIES 2016 101
Figure 3.57: Persons by categories of Labour underutilization and Islands, HIES
2016 103
Figure 3.58a: Labour underutilization by Island, HIES 2016 103
Figure 3.58b: Labour underutilization by demographic variables (age and sex), HIES
2016 104
Figure 3.59: NEET rate by sex for youth population (18-34 years), HIES 2016 108
Figure 3.60: Own-use producers by activities and sex, HIES 2016 110
Figure 3.61: Own-use producers by age group, HIES 2016 110
Figure 3.62: Own-use producers by status of employment, HIES 2016 111
Figure 3.63: Average weekly hours spent by the own-use producers by activities and
sex, HIES 2016 111
Figure 3.64: Average weekly hours spent on all economic and non-economic activi-
ties, HIES 2016 113
Figure 3.65: Amount of time spent on paid and unpaid activities by sex, HIES 2016
114
Figure A1: Labour force and labour underutilization framework 118
Table A1. Main labour force and labour underutilization indicators 121

20Household Income & Expenditure Survey 2016
LIST
OF
TABL
ES Table 3.1: Composition of working age persons by labour force status and of key
labour market indicators, HIES 2016 35
Table 3.2: Labour force status of population aged 15 and above, by location and
sex, Maldives, HIES 2016 37
Table 3.3: Joint distribution of informal sector and informal employment, HIES
2016 51
Table 3.4: Average hours spent per day on main economic activity by public vs.
private sector, HIES 2016 65
Table 3.5: Composite measure of labour underutilization by sex, local and foreign-
ers and locality, HIES 2016 105

21Household Income & Expenditure Survey 2016
SUM
MAR
Y The main results of the employment chapter of the HIES 2016 are summarized in the se-
lected indicators presented below. The key findings are:
• In HIES 2016, the working-age population (aged 15+) was 263,311, of which slightly
more than one-half (53 percent) were women.
• The labour force participation rate was 58 percent. However, the rate for men was
higher than that for women (75 percent for men and 42 percent for women).
• Employment totaled 142,422, with women accounting for 39 percent. More than one
third of employment was in the informal sector (35 percent). More than 50 of the em-
ployed population had informal employment including about 4 percent informal em-
ployment jobs in formal sector enterprises and other non-informal production units.
• Among the employed persons 71 percent were employees, and 20 percent were ei-
ther own-account or contributing family workers.
• Employment was heavily concentrated in the services sector (70 percent), particular-
ly in public administration (15 percent) and trade (13 percent). Industry accounted for
18 percent of total employment and agriculture for 9 percent.
• Almost 65 percent of the employed population had secondary or tertiary education-
al attainment.
• Average hours usually worked per day at the main job were about 8 hours, lower
among women (7 hours) than among men (9 hours). Some 9% of all employed persons
reported to have more than one job or activity during the reference week.
• On average women spent more hours in household work than men (6 hours vs. 3
hours per day respectively)
• Average monthly earnings at main job were MVR 10,229 and significantly lower for
women (MVR 7,510) vis-a-vis men (MVR 11,977).
• The size distribution of earnings showed considerable inequality with about 27.9
percent of all employed persons earning less than two-third of the median monthly

22Household Income & Expenditure Survey 2016
earnings (calculated at MVR 5,366.67 per month).
• The gender pay gap for the resident population at national level is 20% and if only
Maldivian’s are considered, the gender pay gap at national level is 26%. This means
that on average Maldivian women earn MVR 22.51 per hour less than men. The dif-
ference between 20% vs. 26% indicates that foreign women earn higher earnings com-
pared to local women.
• The overall unemployment rate was 6.1 percent, considerably higher among men
(6.4 percent) than among women (5.6 percent).
• The youth (18-34 years) unemployment rate at 8 percent was higher than the nation-
al average.
• In total, 24,135 persons falls under the potential labour force as available non-job-
seekers or unavailable jobseekers. Out of this 97% of the population is available for a
work but not seeking (discourage workers). The main reason for young people (15-17
years) was due to studying and old age (65+ years) people was due to ill health. For
those age 18-64 years the main reason was household chores work. This indicate that
if child care facilities can be established these populations can be utilized in the labour
force.
• One third of the men (34%) prefer to work in the government while nearly half of
the women (46%) who are not employed prefer to work at home or home-based work.
• In total, more than 47,000 persons were either time-related underemployed, unem-
ployed or in the potential labour force as available non-jobseekers or unavailable job-
seekers. The combined measure of labour underutilization was 26.8 percent more than
four times higher the unemployment rate.
• There were 183,195 persons engaged in own-use production, essentially women and
mostly in family responsibilities and house work. Among the own-use producers, a
relative important group was also involved in labour market activities as unemployed
(5,811) or as potential labour force (19,067).

23Household Income & Expenditure Survey 2016
KEY
INDI
CATO
RS Selcted labour force indicatorsHousehold Income and Expenditure Survey (HIES 2016)
Total Women MenChildren(15-17 years)
Adults(18-64 years)
Elderly(65+ years)
Population (15+ years) 263,311 139,956 123,354 17,463 223,120 18,515 Labour force 151,706 59,047 92,659 1,970 144,276 2,880 Employment 142,422 55,721 86,701 1,635 135,552 2,742 Labour underutilized 47,689 28,875 18,815 2,239 43,719 1,284
-Time related underemployment 14,270 8,027 6,243 157 13,880 233 -Unemployment 9,284 3,326 5,958 335 8,725 138 -Potential labour force 24,135 17,522 6,613 1,747 21,114 912
Labour force participation rate 57.6% 42.2% 75.1% 11.3% 64.7% 15.6%Employment-to-population ratio 54.1% 39.8% 70.3% 9.4% 60.8% 14.8%LU1: Unemployment rate 6.1% 5.6% 6.4% 17.0% 6.0% 4.8%LU4: Labour underutilization 27.1% 37.7% 19.0% 60.2% 26.4% 33.8%Education level of employed population 100% 100% 100% 100% 100% 100%
-Primary education and below 32% 29% 35% 10% 31% 92%-Secondary & higher secondary education 57% 59% 56% 89% 58% 4%-Tertiary education 8% 11% 7% 0% 9% 3%- Level not stated 2% 1% 2% 1% 2% 2%
Top 5 occupation- Deep-sea Fishery Workers 9,581 270 9,311 123 8,978 221 - Cleaners and Helpers in offices, Hotels and Other Establishments 7,085 3,423 3,662 29 6,971 50 - General office clerks 5,759 3,112 2,648 - 5,619 - - Handcraft workers, basketry and related materials 4,587 4,277 311 18 4,100 433 - Shopkeepers 3,854 2,250 1,604 339 3,294 182
Branch of economic activity 100% 100% 100% 100% 100% 100%-Agriculture 9% 3% 13% 8% 9% 26%-Industry 18% 20% 17% 11% 19% 30%
-Manufacturing 11% 18% 6% 8% 11% 29%-Service 70% 75% 67% 81% 73% 44%
-Public administration 15% 13% 16% 5% 15% 3%-Trade 13% 13% 13% 43% 12% 23%
Status in employment 100% 100% 100% 100% 100% 100%-Employees 71% 67% 74% 72% 72% 26%-Employers 4% 2% 6% 0% 4% 13%-Own account workers 17% 26% 11% 18% 16% 45%-Contributing family workers 3% 4% 2% 5% 3% 11%-Group workers 5% 1% 7% 4% 4% 5%
Informal employment 35% 40% 31% 66% 33% 72%Employment in informal sector 52% 52% 52% 88% 50% 89%
Average hours usually worked per day at main job 8 hrs 7 hrs 9 hrs 7 hrs 8 hrs 7 hrsAverage hours usually worked per day at household work 5 hrs 6 hrs 3 hrs 2 hrs 5 hrs 4 hrsAverage monthly earnings- main job 10,229 MVR 7,510 MVR 11,977 MVR 4,875 MVR 10,366 MVR 6,356 MVRLow earners at main job for employees 26% 24% 28% 58% 26% 44%Gender pay gap- for employees (only Maldivian) 26%Own-use producers 183,124 117,690 65,434 8,965 164,400 7,522
-Unemployed 5,811 2,934 2,877 184 5,478 117 -Potential labour force 19,067 15,953 3,114 1,033 17,255 527
NEET (18-35 population) 29% 39% 17%
Note: Excludes age not stated, person which accounts for 1.6% of total 15 years and above population.

24Household Income & Expenditure Survey 2016

25Household Income & Expenditure Survey 2016

26Household Income & Expenditure Survey 2016
INTRODUCTIONThe working age population and the labour force is a vital part of any society, enabling
households to generate income, contributing to national economic growth. The working
age population constitutes the human capital of the country contributing to the economic
productivity as well as its potential labour supply.
Labour statistics provides a measurement of the productive activities of workers, and
the labour market deficiencies associated with them. Recognizing the need to revise and
broaden the existing standards to produce labour statistics and in order to enable better
statistical measurement of participation of all persons in all forms of work and in all sec-
tors of the economy, ILO revised these statistical standards in 2013 at the 19th Internation-
al Conference of Labour Statisticians (ICLS)1 . Information gathered from the working age
population on all productive activities (paid or unpaid) considered as “work”, will enable
better understanding of labour market issues. In the context of Maldives, women shoul-
der more of the unpaid care work such as cooking and caring for children and elderly
family members helps to paint a more realistic picture. Inclusion of time spend by women
on these tasks as productive activity helps in quantifying and providing evidence to help
reason out and explain the lower labour force participation rates among women. Further-
more, following recommendations in use more than one measure of labour underutiliza-
tion for monitoring labour market performance in the local context will help shed light
on these aspects among women and men and those living in the capital compared to the
Atolls. Labour underutilization refers to mismatches between labour supply and demand,
which translate into an unmet need for employment among the population. The unem-
ployment rate (termed as LU1 in the new ILO standards) is the most restrictive measure
1 ILO, Resolution concerning statistics of work, employment and labour underutilization, NineteenthInternational Conference of Labour Statisticians, Geneva, October 2013. According to the resolution “Recognizing the need to revise and broaden the existing standards in order to enable better statistical measurement of participation of all persons in all forms of work and in all sectors of the economy; of labour underutilization; and of interactions between different forms of work; as well as to provide guidelines on a wider set of measures than previously defined internation-ally, thereby enhancing the relevance and usefulness of the standards for countries at all stages of development.”
3.1

27Household Income & Expenditure Survey 2016
of labour underutilization. The most expansive among those proposed by the ILO stan-
dards is the composite measure of labour underutilization (LU4), defined as the sum of
time-related underemployment, unemployment, and potential labour force expressed as
a percentage of the extended labour force.
The HIES 2016 administered a Labour force module specially designed to measure the
labour supply and the characteristics of the working age population 15 years of age and
residing in administrative islands and in regular households, outside of collective living
quarters. Detailed questions to capture all persons in all forms of work and to produce
labour statistics and indicators and as per the ILO guidelines were included in the module.
The main objective of the HIES 2016 is to capture the spending pattern of households that
live in normal /regular households. Given the differences in the food and other consump-
tion expenses of households living in non-administrative islands (such as tourist resorts)
and collective living quarters (ten or more unrelated people living together, mostly for-
eign workers in labour quarters) were excluded from the sample of HIES 2016.
To get a comprehensive picture of the labour market situation of the country, data from
the employed population living in the resorts, other non-administrative islands and col-
lective living quarters are important 2.
However, in the absence of a Labour Force Survey in the country and considering the
high costs and limited funding available to conduct nationwide surveys, it was decided to
introduce a labour force module to the HIES 2016 and to make use of the opportunity, to
capture the labour market issues among the population living in administrative islands.
Due to this difference in scope of the population covered, the resulting labour statistics
from HIES will not be directly comparable to the employment data from the Census. Some
2 In general, statistics of work should cover the resident population comprising all persons who are usual resi-dents of the country, regardless of sex, country of origin, nationality, citizenship or geographic location of their place of work. This includes usual residents who work outside the country (e.g. short-term migrant workers).

28Household Income & Expenditure Survey 2016
of this difference is due to the fact that, a high proportion of population employed in tour-
ism industry live in tourist resorts, which are non-administrative islands. Similarly, the
construction industry, which is dominated by foreign workers, have a high proportion
of workers who live in collective living quarters, including the capital Male’. Such differ-
ences have an impact on the distribution of employed population by industry as well as
occupation.
Similarly, as this is the first time the concept of work as defined in the 19th ICLS) resolu-
tion, 2013 are being adopted in the country, differences in the concepts and definitions in
HIES 2016, need to be considered, in making any comparisons with existing labour market
data of Maldives.
This chapter aims to provide a comprehensive set of labour market statistics and indi-
cators to assess the current situation and to help in monitoring the labour market perfor-
mance. It provides headcounts of the labour force, of persons in employment, of those in
time-related underemployment, of persons in unemployment, of potential labour force
and subsistence food producers. Indicators in relation to the working-age population such
as employment-to-population ratio, labour force participation rate is provided as well. In
addition, various measures of labour underutilization are compiled and presented. Data
on the working-age population engaged in all different forms of work falling within the
general production boundary such as own-use production of goods and services and time
use on different forms of work is also presented. It highlights the gaps among women and
men in terms of these indicators as well as the differences observed between Male’ and
the Atolls.
Adhering to these standards for producing labour market statistics, will help to enhance
the international comparability of the national statistics, help in measurement some key
aspects and indicators to measures of decent work. These data will also facilitate the mea-
surement of related Sustainable Development Goal indicators. It is aimed to shed some

29Household Income & Expenditure Survey 2016
light on the evidence needed for making better labour market policies to help close these
gaps and support the efforts in the achievement of gender equality and sustainable devel-
opment.

30Household Income & Expenditure Survey 2016
3.2CONCEPT OF WORK USED IN HIES 2016
Work comprises any activity performed by persons of any sex and age to produce goods
or to provide services for use by others or for own use, and labour statistics potentially
cover all forms of work. This includes work for pay or profit for use by others (employ-
ment), work not for pay or profit for use by others (unpaid trainee work, volunteer work,
and other work activities) and work for own final use (own-use production work).1
31 ILO, Resolution concerning statistics of work, employment and labour underutilization, NineteenthInternational Conference of Labour Statisticians, Geneva, October 2013.
Box 3.1: What is work? Work is defined as any activity performed by persons of any sex and age in order to produce goods and services for use by others or for own final use3. This definition is consistent with the scope of productive activities included in the general production boundary and with the definition of economic units as specified in the System of National Accounts (SNA). However, the concept of work excludes activities that cannot be performed on one’s behalf such as self-care activities, learning and activities for one’s own recreation as well as all other activities that do not involve producing goods or services for one’s own or for other units’ consumption, such as begging and stealing. Work can be performed in all kinds of economic units that comprise market unit (producing goods and services mostly for sale at prices that are economically significant), non-market units (producing goods and services mostly for supply to other units without charge or at prices that are not economically significant) and households (producing goods and services for own final use or fixed capital formation by the producers).
Activities Non-productive activities
Productive activities
Self-care Households Non-market units Market units Sleeping Producing for
own final use Government non-profit institution
Incorporated, unincorporated
Learning Own-recreation Services Goods Services Goods Services Goods Begging Stealing
3 ILO, Resolution concerning statistics of work, employment and labour underutilization, Nineteenth International Conference of Labour Statisticians, Geneva, October 2013.
General production boundary
“WORK” == ALL productive activities
SNA production boundary
31Household Income & Expenditure Survey 2016
Five mutually exclusive forms of work are identified for separate measurement as per the
ILO. These forms of work are distinguished on the basis of the intended destination of the
production (for own final use; or for use by others, i.e. other economic units) and the na-
ture of the transaction (i.e. monetary or non-monetary transactions, and transfers). These
productive (work) activities are mutually exclusive.
It is important to keep in mind that during a given period, persons may engage in several
Forms of Work. For instance, a person can have a paid job in the government during week
days, do volunteer work during the construction of a mosque in their island community
during the week end, spend time to grow food stuff for consumption by his/her house-
hold members and spend time cooking and taking care of one’s own children and family
on a daily basis. All these are considered as productive activities and fall within the gen-
eral production boundary.
Forms of work

32Household Income & Expenditure Survey 2016
Labour force module included questions to help measure the labour supply and the char-
acteristics of the working age population. HIES 2016, gathered information, from every-
one aged 15 and older, about whether they were engaged in any economic activity and, if
so, what type of work they do.
Based on the information collected, the working age population is classified according to
participation in the labour market and in different forms of work. It enabled the working
age population by labour force status as per the three mutually exclusive categories, em-
ployed, unemployed and outside the labour force.
Persons in employment is defined as all those persons 15 years of age and over who,
during the reference week, were engaged in any activity to produce goods or provide
services for pay or profit for one hour or more, during that week.
3.2.1 Labour Force module of HIES
Box 3.2: What labour market related data was collected in HIES? For all the person aged 15 years and above, the HIES gathers information on:
The types of paid work (e.g. working in the government, private sector job, running your own business, operate a fishing vessel with family, giving tuition from home, work in construction projects with a group of friends etc) during the past four weeks
The type of activity they usually do – employer, employee, own-account workers, family contributing workers
Details of main economic activity -based on most time during past week (industry/ sector they work, main occupation, status in employment, hours worked)
Details of secondary economic activity -based on most time (industry/ sector they work, main occupation, status in employment, hours worked)
Total time spent on other jobs/economic activities Sources of income (e.g. wages, profit from business, pensions) for main job
and second job and a lump sum income for other economic activities they engaged
Persons looking and available for work – unemployed Persons not wanting to work- more hours Persons not looking neither want to work Own-use production of goods and unpaid care work (e.g. growing vegetables
for consumption by family, caring for own child and cooking for family etc) during the past four weeks
How many hours persons work per week (paid as well as unpaid work) Means of job search Reasons for not working

33Household Income & Expenditure Survey 2016
Time-related underemployed persons among those employed persons is based on hours
worked in employment and their desire and availability to work additional hours. In ad-
dition to identifying the unemployed persons, in its strictest form based on the seeking
and availability criteria, a broader concept of extended labour force is applied to identify
potential labour force among the persons categorized as being outside of the labour force.
Detailed definitions on these labour force status categories are provided under the con-
cepts and definitions section.

34Household Income & Expenditure Survey 2016
3.3WORKING AGE POPULATION AND LABOUR FORCE
3.3.1 Working Age-population by labour force statusBased on the results from HIES 2016, around 263,311 residents in Maldives are in the
working age population. The resident population of foreigner’s accounted for 4 percent of
the working age population. Also, this survey shows that the above working age popula-
tion were engaged in productive work either producing goods or services for pay or profit
or for own use within the specified economic units. This population can be classified into
three mutually exclusive categories: employed, unemployed and those outside the labour
force (refer Figure 3.1 below).
Figure 3.1: Composition of working age population by labour force status, Maldives, 2016
Source: Household Income and Expenditure Survey, 2016

35Household Income & Expenditure Survey 2016
The working age population, 15 years and above, living in regular households in Mal-
dives constituted 263,311 persons (69 percent of the population) in 2016, as per HIES re-
sults. From the above universe of working age population, 151,706 persons were in the
labour force representing the sum of 142,422 employed and 9,284 unemployed. Among
those person in employment, some 14,270 persons were in time-related underemploy-
ment, meaning 10 percent of those already employed are still available and want to work
more hours. Among the 111,604 persons outside the labour force, around 24,135 persons
were in the potential labour force, meaning 22 percent of those persons outside the labour
force were seeking work although not available at the time or they were available for
work although not seeking at the time.
3.3.2 Summary labour market indicatorsKey Labour market data and indicators derived from the HIES 2016 are shown in Table
3.1 below.
Table Error! No text of specified style in document.-1: Composition of working age persons by labour force status and of key labour market indicators, HIES 2016 Republic
In numbers 2016 (%) 2016 Working age population (15+ yrs) 263,3111 LFPR (Labour force participation
rate) 57.6%
Labour force 151,706 Employment to population ratio 54.1% Employed 142,422 LU1: Unemployment rate 6.1%
(time-related underemployed)
14,270 LU2: Unemployment and time-related underemployment
15.5%
unemployed 9,284 LU3: Unemployment & potential labour force
19.0% Outside the labour force 111,604 (potential labour force) 24,135 LU4: Composite measure of labour
underutilization 27.1%
1 Out of the 270,932 working age population (15+ population) in the survey, employment analysis includes 263,311 working age population (15+ population) that had reported employment status, in order to avoid distortions.
Source: Household Income and Expenditure Survey, 2016
The labour force participation rate (LFRP) is an indicator of the level of labour market
activity. It provides information about the relative1 size of the supply of labour currently
available for the production of goods and services in an economy. It is defined as the ratio
of labour force to the working age population expressed in percentage term. LFPR was
58 percent, indicating that out of the population 15 years of age and above in the country
41 Out of the 270,932 working age population (15+ population) in the survey, employment analysis includes 263,311 working age population (15+ population) that had reported employment status, in order to avoid distortions.
Table 3.1: Composition of working age persons by labour force status and of key labour market indicators, HIES 2016
4
36Household Income & Expenditure Survey 2016
58 percent were either gainfully employed or unemployed (looking and available for em-
ployment). The employment-to-population ratio, the percentage of the working age pop-
ulation who has employment, an indicator of the performance of the national economy in
providing employment to its growing population was 54.1%.
The unemployment rate, defines as the percentage of the labour force that is unemployed,
was 6.1%, indicating that roughly for every 100 persons in the labour force there was 6
unemployed persons, who are looking for work and available for work. Nevertheless,
the unemployment rate (LU1) is just one indicator of the unmet needs for employment
in a country. Other indicators that take into account not only unemployment but also
time-related underemployment and available potential jobseekers and other non-avail-
able jobseekers are shown in table 3.1 and Box 3.3 as LU2, LU3, LU4. This is because only
measuring unemployment rate is not sufficient to reflect the absence of jobs. Those look-
ing for jobs are located among those under Time-related underemployed, Unemployed
and those in potential labour force.
According to Table 3.1, the combined rate of unemployment and time-related underem-
ployment (LU2) was 15.5%, the combined rate of unemployment and potential labour
force (LU3) was 19.0% and the overall composite measure of labour underutilization
(LU4) was 27.1%. This implies that the country jobs generating institutions need to target
over one-fourth (27.1%) of the extended Labour force. Even though the narrow view of
unemployment requires jobs generating policies for those in immediate needs of jobs, the
overall lack of satisfactory jobs in the labour force need to be supported by labour policies
with sustainable jobs for all underutilised. They represent the potential labour capacity
that can be enabled to increase the productive level of the country.

37Household Income & Expenditure Survey 2016
3.4GEOGRAPHICAL AND GENDER DISPARITIES IN LABOUR FORCE PARTICIPATION
The HIES 2016 data show that among the population in the working age, a higher propor-
tion of persons are participating in the labour force in Male’ (59.7%) than in Atolls (53.0%).
The unemployment rate was also higher in Male’ (7.5%) compared to the Atolls (4.9%).
Table 3.2: Labour force status of population aged 15 and above, by location and sex, Maldives, HIES 2016
Republic Male’ Atolls
Total Men Women Total Men Women Total Men Women
Employed 142,422 86,701 55,721 66,323 42,755 23,568 76,099 43,946 32,153
Unemployed 9,284 5,958 3,326 5,378 3,548 1,830 3,906 2,410 1,496
Labour force 151,706 92,659 59,047 71,701 46,304 25,398 80,005 46,356 33,650
Outside labour force
111,604 30,695 80,909 46,372 12,192 34,180 65,232 18,503 46,730
Potential labour 24,135 6,613 17,522 7,937 1,954 5,983 16,197 4,659 11,539
Labour force participation rate (%)
57.6% 75.1% 42.2% 60.7% 79.2% 42.6% 55.1% 71.5% 41.9%
Employment to population ratio (%)
54.1% 70.3% 39.8% 56.2% 73.1% 39.6% 52.4% 67.8% 40.0%
Unemployment rate (%)
6.1% 6.4% 5.6% 7.5% 7.7% 7.2% 4.9% 5.2% 4.4%
Figure 3.2: Headline labour market indicators, HIES 2016
58% 61% 55%54% 56% 52%
6% 8% 5%0%
20%
40%
60%
80%
Rep Male' Atollsperc
ent (
%) o
f res
iden
t po
pula
tion
Labour force participation rate (%) Employment to population ratio (%)
Unemployment rate (%)
With reference to Table 3.2 and Figure 3.2, 58% of the population 15 years and above
population are in the labour force, with around 75% of men and 42% of women aged 15
and above in some form of employment, or seeking and available for work. There are
differences in the labour force participation rates between Male’ and Atolls (Figure 3.3).
In Male’, 79% of men are in the labour force and women’s labour force participation is

38Household Income & Expenditure Survey 2016
much low at 43%. This shows a significant gender gap between men and women’s labour
force participation rates with a difference of almost 37 percentage points. In Atolls, 72% of
men and 42% of women are in the labour force, and a gender gap of around 30 percentage
points observed which is lower compared to Male’.
75.1%
42.2%
79.2%
42.6%
71.5%
41.9%
0%
20%
40%
60%
80%
100%
Men Women Men Women Men Women
Republic Male' Atolls
Labo
ur fo
rce
part
icipa
tion
rate
(%)
Figure 3.3: Labour force participation rate, by location and sex, HIES 2016
Figure 3.4: Percentage of population in employment, unemployment, outside the labour force by sex and location, Maldives, HIES 2016
70%
40%
73%
40%
68%
40%
5%
2%
6%
3%
4%
2%
25%
58%
21%
57%
29%
58%
0% 20% 40% 60% 80% 100%
Men
Women
Men
Women
Men
Women
Repu
blic
Mal
e'At
olls
percent (%) of resident populationEmployed Unemployed Outside labour force
When looking across the country, 70% of adult men (age 15 and above) are employed (Fig-
ure 3.4). The proportion of the population that is unemployed is highest for both men and
women in Male’ (6% for men and 3% for women). Considering the whole country, women
are much more likely to be outside the labour force than men.
Lower labour force participation rates of women are due to many women being outside
the labour force. This have been the case in previous statistical surveys and censuses as
well and hence it is expected. This is mainly resulting from the uneven distribution of un-
paid care work within the household that is undertaken by women vis-a-vis that of men,
39Household Income & Expenditure Survey 2016
and the gender roles pertaining in this respect in the society in addition to other factors.
With the availability of data on population engaged in unpaid care work and time use in
these activities from HIES 2016, the extent of the unpaid care burden can be substantiated
with evidence. This aspect will be studied in section 3.16 in the chapter.
The disparities among individual Atoll are presented in Figure 3.5. The left panel shows
the administrative Atolls ordered from highest to lowest labour force participation rates,
while the right shows the administrative Atolls in reverse order from lowest to highest
unemployment rates.
Figure 3.5 shows that there are four Atolls with relatively high labour force and low un-
employment rates. These Atolls are Faafu (F), Vaavu (V), Haa Alif (HA) and Meemu (M)
Atoll.
At the other extreme, Thaa (Th) Atoll have mid-level labour force participation rates and
high unemployment rates. And Seenu (S) and Gnaviyani (Gn) Atolls have a low labour
force participation rates and high unemployment rates.
Figure 3.5: Disparities among Atolls, HIES 2016
46.1%48.7%48.7%50.2%50.4%51.5%52.4%52.5%
56.1%56.5%57.1%57.6%
59.9%60.0%60.7%61.2%61.6%63.3%
65.4%66.4%67.9%
0.0% 20.0% 40.0% 60.0% 80.0%
SGdh
GnR
GALhNB
HdhL
ThDhHA
AdhMale'
ShK
AAMVF
Labour force participation rate
Labour Force Participation Rate
9.2%8.7%
8.4%7.8%
7.5%6.7%
5.4%5.3%
4.4%4.2%4.2%
3.9%3.8%
3.6%3.5%
3.2%3.0%3.0%
2.7%2.1%
1.4%
0.0% 5.0% 10.0%
ThGn
SLh
Male'B
GARN
HdhGdh
AAL
AdhK
DhShM
HAVF
unemployment rate
Unemployment rate
40Household Income & Expenditure Survey 2016
Figure 3.6 Labour force participation rate by sex and age group, Maldives, HIES 2016
0%
20%
40%
60%
80%
100%
15-1
7
18-1
9
20-2
4
25-2
9
30-3
4
35-3
9
40-4
4
45-4
9
50-5
4
55-5
9
60-6
4
65+Labo
ur fo
rce
part
icipa
tion
rate
Labour force participation rate
Women Men
The doubled inverted-U shape graph (Figure 3.6) confirmed that men are still more like-
ly than women to participate in the labour force. The labour supply remained relatively
small among younger workers. The LFPR curve for both sexes increased at the lower age
groups reflecting the transition of young generation leaving school and entering the la-
bour market. In contrary, the LFPR curve finally declined as older workers begin to exit
the labour force for reasons of retirement, health or other reasons. The Male LFPR curve
reaches a peak at the age group of 45-49 years, before slowly decreasing as people leave
and retire from the labour market at older ages. The female LFPR curve reaches a peak
at the age group of 25-29 years. Afterward, women reduced their participation in labour
market mainly to focus on the family responsibilities and children care. This increases the
gap between male and female Labour force participation across ages.
The age-specified labour force participation rates show that both men and women join
the labour force in their early twenties. For both men and women, the LFPR is lowest in
the age group 15-17 years of age who are attending full-time education and among older
3.5LABOUR FORCE PARTICIPATION BY AGE GROUP
The breakdown of the labour force participation rate by sex and age group gives a profile
of the labour participation as shown in Figure 3.6.

41Household Income & Expenditure Survey 2016
people 65 years of age and above. A LFPR of around 15% for the 65 years and above age
group is expected as less people tend to work as they age and as they become entitled for
social security pension payments.
Youth population (18-34 years) makes up a significant proportion of the labour force, they
accounted more than half (51%) of the labour force in the country. For both men as well as
for the female, the proportion of the labour force among youths in 18-34 years age group
is significantly high (48% of men and 54% of women).
Figure 3.7 Labour force participation rate by locality, sex and age group, HIES 2016
0%
20%
40%
60%
80%
100%15
-17
18-1
9
20-2
4
25-2
9
30-3
4
35-3
9
40-4
4
45-4
9
50-5
4
55-5
9
60-6
4
65+
Labo
ur fo
rce
part
icipa
tion
rate
Labour Force participation rate
Atoll Women Atoll men Male'Women Male' men
For both Male’ and Atolls, LFPR is much higher for males than females. The lower level
of women’s participation is partly a reflection of the traditional gender division of labour,
which allocates household responsibilities primarily to women and which, along with the
responsibilities of motherhood, keeps many women occupied with activities considered
outside the labour force.
The differences in the pattern of labour force participation during the life-span of women
living in differing geographic locations such as Male’ and the Atolls are likely to be the dif-
fering life styles of women and the society. In case of Male’, women’s participation starts
to decline from 30 years onwards, as seen from Figure 3.7. Difficulties in balancing work
and personal life when they have children, poses a challenge for women who have formal

42Household Income & Expenditure Survey 2016
jobs and work away from home51. In case of Atolls, women’s participation drops some-
what at around 30-34 and again starts increasing at a slow rate from 35 years onwards till
it starts to decline at older ages of 60 years onwards. Perhaps this is indicating a return
of married women in the Atolls into the labour market after giving birth. Furthermore,
getting engaged in self-employed economic activity of an informal nature in the islands
is likely to be easier in the Atolls. Another contributing factor would be the more affluent
society in Male’ compared to Atolls.
51 According to Census 2014, mean age of marriage for women in Male’ was 23.6 years while in the Atolls it was 21.5 years. And median age at birth of first child was 22 years in Male’ and 20 years in Atolls.

43Household Income & Expenditure Survey 2016
3.6EMPLOYMENT-TO-POPULATION RATIO BY AGE GROUPS
The LFPR curve and employment-to population ratio curve brings additional information
in the pattern of labour force activity of the working age population. Figure 3.8 represent
the double U shape LFPR curve and the employment-to population ratio curve in graphi-
cal form. The top curve is the labour force participation rate (LFPR) plotted by age group.
Below it is the corresponding curve of employment-to population ratio curve (Emp-Pop).
There is a similar trend. Both increase at lower groups as young people leave the school
system and enter the labour force. They reach a peak at the core working age of 25-29
years. They both then decrease as workers retire and leave the labour force.
Figure 3.8 Labour force participation rate and employment-population ratio, Maldives, HIES 2016
0.0%
20.0%
40.0%
60.0%
80.0%
15-1
7
18-1
9
20-2
4
25-2
9
30-3
4
35-3
9
40-4
4
45-4
9
50-5
4
55-5
9
60-6
4
65+Pe
rcen
tage
of 1
5 po
pula
tion
Labour force participation rate & Employment to population
LFPR Emp-Pop
The gap between the two curves represents unemployment. It can be observed that the
gap is more prominent in the lower age groups. In the higher age groups, the two curves
get closer to each other and at the age of 60 year and above the two curve overlaps entire-
ly, reflecting the narrowing down of the unemployment in the higher age group.


46Household Income & Expenditure Survey 2016
3.7EMPLOYMENTThe employed population in 2016 is around 142,400 of which 86,700 are male and 55,700are
female. In Male’, the employed population was 66,300 while in Atolls, the employed pop-
ulation was 76,000.
Figure 3.9 Employed population by locality and sex, HIES 2016
142,42286,701
55,72166,323
42,75523,568
76,09943,946
32,153
0 20,000 40,000 60,000 80,000 100,000 120,000 140,000 160,000
TotalMen
WomenTotalMen
WomenTotalMen
Women
Repu
blic
Mal
e’At
olls
Number of employed population
Employed population
3.7.1 Status in employment, informal sector andinformal employment – main activity
3.7.1.1 Status in employment in main job
For understanding the structure and functioning of labour force in the country, it is im-
portant to know the employment status which categorizes the employed by number
of persons working for others (employees) or working for themselves (self-employed/
own-account worker). Hence, the employed population was classified into the follow-
ing 7 statuses in employment categories: “employee”, “employer/owner”, “own-account
worker”, “own-account worker with assistance from family member”, “contributing fam-
ily worker”, and “group worker”. Group worker is not defined in the international classi-
fication but used to address the local context of how people work.
Group workers have been added to capture one of the forms in which locals organize their
work, mainly in the fishing, construction and small-scale manufacturing industries. These
workers organize themselves in groups whereby the income they get will be distributed

47Household Income & Expenditure Survey 2016
among the group, with each member acting an own-account worker, with one person act-
ing as a group leader.
Figure 3.10 shows how the employed population is divided according to type of employ-
ment (left panel shows men employed population while right panel shows women em-
ployed population). Majority of employed men and women are working as employees,
either in the private or public sector (Figure 3.10). Higher proportion of employed men
is employees (74%) compared to those amongst women (67%). Women are more likely to
be own-account workers (21%) than men (9%). Few people work as contributing family
members (4% of women vs 2% of men). A small proportion of women are working as em-
ployer or owner (2% men and 7% women) and group worker (7% men and 1% women).
Figure 3.10: Employed by type of employment and sex, Maldives, HIES 2016
Men aged 15 and above
Women aged 15 and above
Employee74%Employer
or owne6%
Own account
work9%
Own account worker(with
family members)
2%
Contributing fam2%
Group worker
7%
Employee67%Employer
or owne2%
Own account
work21%
Own account
worker(with family
members)5%
Contributing fam4%
Group worker
1%
Certain types of employment tend to be more vulnerable than others. They might be un-
paid, or have an irregular income, or lack of formal work arrangements and protection.
According to the international definition (ILO), people who are own-account workers and
contributing family workers are considered to be in vulnerable employment. In Republic,
around 20% of employed population are in these forms of work: 13% of men and 30% of
women. In Male’, around 11% of employed population are considered as vulnerable (16%
of women and 8% of men) while in the Atolls 28% population are in these forms of work
(41% of women and 19% of men).

48Household Income & Expenditure Survey 2016
3.7.1.2 Employment in informal sector in main jobMany persons who cannot find a decent job with sufficient income try to earn a living by
working as self-employed or employee in the informal sector. The concept of informal
sector may be broadly characterized as consisting of units engaged in the production of
goods or services with the primary objective of generating employment and incomes to
the persons concerned. These units typically operate at a low level of organization, with
little or no division between labour and capital as factors of production and on a small
scale. Labour relations - where they exist - are based mostly on casual employment, kin-
ship or personal and social relations rather than contractual arrangements with formal
guarantees61.
In the HIES 2016, employment in the informal sector was defined as all persons 15 years of
age and over who were engaged in any business which is not registered with the relevant
national authority or person who is working in house/living quarter or no fixed premis-
es or in the agricultural plots who is not employee and have no social-security. Informal
sector excludes persons engage in government unit or activities of private households as
employers of domestic staff.
Based on this definition, there were 49,328 persons working in the informal sector in 2016,
representing 35% of the employed population. The corresponding proportions for differ-
ent of categories of the population are shown in Figure 3.11. Accordingly, the incidence
of employment in the informal sector was somewhat higher among women (40%) than
among men (31%) and is higher in Atolls (38%) than in Male’ (31%). The age pattern is
U-shaped higher rates among young employed people 15-18 years old and the elderly 65+
years old than among the middle age groups. In terms of educational attainment, the data
show a clear decreasing rate: 48% among employed people with pre-school education,
46% among employed people with primary education, 20% among those with secondary
education, and 4% among those with degree and above education.
61 Extract from ILO, Resolution on the measurement of employment in the informal sector, adopted by theFifteenth International Conference of Labour Statisticians (ICLS), Geneva, 1993.

49Household Income & Expenditure Survey 2016
Figure 3.11: Proportion of employed persons on the informal sector by sex, age group and educa-tional attainment, HIES 2016
Figure Error! No text of specified style in document.-1: Proportion of employed persons on the informal sector by sex, age group and educational attainment, HIES 2016 By sex and locality
35% 31%38%
31% 33% 30%
40%
28%
49%
0%
10%
20%
30%
40%
50%
60%
70%
80%
Maldives Male' Atolls
Perc
enta
ge o
f em
ploy
ed
popu
latio
n
Both Sexes Male Female
By Educational attainment
By Age group
47% 46%
35%28%
22%16%
49% 45%
0%10%20%30%40%50%60%70%80%
Pre-
scho
ol e
duca
tion
Prim
ary
educ
atio
n
Seco
ndar
y ed
ucat
ion
High
er se
cond
ary…
Cert
ifica
te/ D
iplo
ma
Degr
ee &
abo
ve
Leve
l not
stat
ed
Neve
r att
ende
d
Perc
enta
ge o
f em
ploy
ed p
opul
atio
n 66%
47%
28%
26% 31
% 33% 35%
36% 41
%42
% 49%
72%
0%
10%
20%
30%
40%
50%
60%
70%
80%
15-1
718
-19
20-2
425
-29
30-3
435
-39
40-4
445
-49
50-5
455
-59
60-6
465
+Perc
enta
ge o
f em
ploy
ed p
opul
atio
n
Age group
3.7.1.3 Employment in Informal sector in main job
The concept of informal employment refers to jobs as observation units as opposed to the
concept of informal sector that refers to production units as observation units71. The two
concepts are nevertheless related. Informal employment is a broader concept including (a)
employment in the informal sector (except those rare employees in that sector who may
have formal employment), and (b) informal employment outside the informal sector.
71 ILO guidelines concerning a statistical definition of informal employment, adopted by the seventeenth ICLS, Gene-va, 2003.

50Household Income & Expenditure Survey 2016
In the case of own-account workers and employers, the informal employment status of the
job is determined by the informal sector nature of the enterprise in which they operate.
Thus, own-account workers (without hired workers) operating an informal enterprise are
classified as in informal employment. Similarly, employers (with hired workers) operat-
ing an informal enterprise are classified as in informal employment. All contributing fam-
ily workers are classified as having informal employment, irrespective of whether they
work in formal or informal sector enterprises.
For jobs held by employees, informal employment is defined in terms of the employment
relationship. Four elements are identified. For a job held by an employee to be considered
as informal, the employment relationship should not, in law or in practice, be subject to
national labour legislation, income taxation, social protection or entitlement to certain em-
ployment benefits (paid annual or sick leave, etc.).
In HIES 2016, the operational definition of informal employment comprises all persons
15 years of age and over employed as a contributing family worker; employer or own-ac-
count worker of an informal sector unit; employee or group workers with no social secu-
rity, or no paid sick leave, or no paid annual leave.
Based on this definition, there were 73,632 persons having informal employment in their
main jobs in 2016, representing 52% of the employed population.
Table 3.3 presents the joint distribution of informal sector and informal employment. It
can be observed that virtually all persons in the informal sector have informal jobs. Only
2,028 employed persons in the informal sector have formal jobs. By contrast, a substantial
number of persons engaged outside the informal sector have formal jobs (66,762).

Table 3.3: Joint distribution of informal sector and informal employment, HIES 2016
Production units Informal jobs Formal jobs Informal sector enterprises 47,300 (A) 2,028 (B) Other units of production 26,332 (C) 66,762 (D) Employment in the informal sector: A+B= 49,328 Informal employment: A+C= 73,632 Informal employment outside the informal sector: C= 26,332
3.7.2 Types of establishment – main activityFigure 3.12 provides an indication of the employment shares in the different types of
establishments existing in the country. It shows that government is largest employer, em-
ploying over one in every four workers in the country. Nearly one third (32%) of the em-
ployed population in the Atolls and 22% of the employed population in Male’ fall in this
category of government. Private establishments are the second highest employer, with a
20% of persons employed in the country, 26% in Male’ and 14% in the Atolls.
Over one third (38%) of the Atoll employed population are either working in agricultural
plot or living quarter or home or no fixed location which can be categorized as informal
sector.
0%5%
10%15%20%25%30%35%
Gove
rnm
ent o
ffice
Inde
pend
ent g
over
nmen
tin
stitu
tion
M.N
.D.F
/ Po
lice
Priv
ate
esta
blish
men
ts
Priv
ate
Com
pany
Stat
e ow
ned
ente
rpris
es
Agric
ultu
ral p
lots
Hous
e / l
ivin
g qu
arte
r
No fi
xed
prem
ises
Othe
r
Prec
net o
f em
ploy
ed p
opul
atio
n
Type of estbalishment
Republic Male' Atolls
Figure 3.12: Employment by type of establishment by locality, HIES 2016
The share of women employment in government is relatively higher than men. As expect-
ed, employment in the Maldives National Defense Force (MNDF) and the Maldives Police
Service is dominated by men.

52Household Income & Expenditure Survey 2016
Work place of employed persons by sex shows that a sizeable proportion of women work-
ing from their living quarters or homes. More than one third (35%) the employed women
in the Atolls and 16% in case of employed women in Male’ fall in this category. This high-
lights the economic vulnerability of women, especially those in the Atolls.
Apart those working in government and living quarter or house, men dominate being
employed in all other type of establishment as seen from Figure 3.13.
0%5%
10%15%20%25%30%35%40%
Gove
rnm
ent o
ffice
Inde
pend
ent g
over
nmen
tin
stitu
tion
M.N
.D.F
/ Po
lice
Priv
ate
esta
blish
men
ts
Priv
ate
Com
pany
Stat
e ow
ned
ente
rpris
es
Agric
ultu
ral p
lots
Hous
e / l
ivin
g qu
arte
r
No fi
xed
prem
ises
Othe
r
Prec
net o
f em
ploy
ed p
opul
atio
n
Type of estbalishment
Women Men
Figure 3.13: Employment by type of establishment by sex, HIES 2016
3.7.3 Public versus private sector– main activity
The public sector is the main employer in the Maldives, providing jobs for 39% of the
employed population. Around one third (32%) of the jobs are in the private sector fol-
lowed by those who work at the house/ living quarter. In the case of Male’, the public and
private sector almost have the share in providing jobs when all the status of employment
is considered. Atolls show that the majority of employed population are working in the
public sector followed by the private sector as seen from Figure 3.14.

53Household Income & Expenditure Survey 2016
Figure 3.14: Share of employment by private and public sector and location, HIES 2016
39%
42%
36%
32%
42%
23%
14%
7%
19%
11%
4%
17%
0% 10% 20% 30% 40% 50% 60% 70% 80% 90% 100%
Maldives
Male'
Atolls
percent(%) of employed population
Public and Private sector - For all status of employment
Public Private House / living quarter No fixed premise Others
If only employees are considered the public sector is the main employer in the Maldives,
providing jobs for more than half of the employees (57%). Around one third (36%) of jobs
are in the private sector.
Note: Public sector includes government office, Independent government institution, MNDF/police, embassy/interna-tional bodies and state-owned enterprises. Private sector includes non-profit organization, private companies/ establish-ments and agricultural plots. House and no fixed location are kept separately. In other category, ‘other’ types of employers not elsewhere classified are included.
3.7.4 Occupation- main activityThe type of jobs people do tend to vary between men and women. Occupation for main
activity is shown in Figure 3.15 for the national level.
As seen from Figure 3.15, overall at national level, the most common occupation for men
is as “Technicians and associate professionals” (15.3%) followed by “Service and sales
workers” (14.8%) and for women it is a “Professionals” (22.5%) and followed by “Craft
and related trades workers” (18.4%). In terms of the proportion of women employed in
these two occupational categories accounts approximately 40% of women employed pop-
ulation.
Majority of “Technicians and associate professionals” workers among men were engaged
in “Public administration and defence; compulsory social security” industry (21.2%) and
“Transportation and storage” industry (16.2%). Among men, the second highest occupa-
tional category was “Service and sales workers“. These occupations were concentrated

54Household Income & Expenditure Survey 2016
in the industries: “Wholesale and retail trade; repair of motor vehicles and motorcycles”
(32.3%) and “Public administration and defence; compulsory social security” (23.1%).
Among women the majority of “Professionals” workers were engaged in “Education”
which accounts 80.0% of employed professional women. The second highest was “Craft
and related trades workers” and 96.3% of the employed craft and trade related workers
are engaged in “Manufacturing” industry. Those employed in manufacturing are mostly
engaged in small scale manufacturing activities. Detailed breakdown of activities under
manufacturing industry (ISIC classification at 4-digit level) shows that the “Manufacture
of other products of wood and cork, straw and plaiting materials” has the highest share
at 44.2%.Figure 3.15: Occupations for main activity, by sex, Maldives, HIES 2016
Men
22.5%18.4%
13.9%13.5%
11.3%10.5%
4.8%2.0%
0.7%0.3%
2.2%
0% 5% 10% 15% 20% 25% 30%
2. Professionals7. Craft and related trades workers
5. Service and sales workers4. Clerical support workers9. Elementary occupations
3. Technicians and associate professionals1. Managers
6. Skilled agricultural, forestry and fishery workers0. Armed forces occupations
8. Plant and machine operators and assemblersNot stated
Percent (%) of employed population
15.3%14.8%
12.7%12.2%
10.0%9.8%
7.7%6.5%6.2%
2.4%2.3%
0% 5% 10% 15% 20% 25% 30%
3. Technicians and associate professionals5. Service and sales workers
1. Managers6. Skilled agricultural, forestry and fishery workers
9. Elementary occupations7. Craft and related trades workers
4. Clerical support workers2. Professionals
8. Plant and machine operators and assemblers0. Armed forces occupations
Not stated
Percent (%) of employed population
Women

55Household Income & Expenditure Survey 2016
3.7.5 Proportion of women in management positionProportion of women in managerial position is one of indicator of the Sustainable De-
velopment Goal (SDG - Goal 5). The indicator provides information on the proportion
of women who are employed in decision-making and management roles in government,
large enterprises and institutions, thus providing some insight into the proportion of
women in decision making positions compared to men81 . According to HIES 2016, of
all people employed in decision-making and management roles, only 19.5% are women.
This rate is under the world average of one third. Taking into account the wage difference
between Maldivian and Foreign women (refer to Section 3.9.1, Figure 3.28), it is import-
ant to see contribution of Maldivian and foreign within the managerial position. If only
Maldivian is considered the decision-making and management roles is 18.8% and if only
foreigners are considered than the rate is 37.2%.
8 The indicator was derived using women employed in ISCO-08 category 1 (1 digit which are managers) minus women employed in the 2-digit ISCO-08 category 14 (hospitality, retail and other services managers) divided by all persons employed in ISCO-08 category 1 minus all persons employed in 2-digit ISCO-08 category 14 multiplied by 100 (SDG indicator. Methodology repository: https://unstats.un.org/sdgs/metadata/ ).
3.7.6 Top ten occupations- main activityThe International Classification of Occupation (ISCO-08) classifies occupations in 10 ma-
jor occupational groups subdivided into 43 sub-major groups, 130 minor groups and 436
unit groups91 . HIES 2016 provided data on the distribution of employed population by
detail occupation level. Figure 3-16a shows top ten occupation for the 15 years and above,
15-24 years and 18-34 years employed population at the main job. Among 15 years and
above employed population, “deep-sea fishery workers” constitute the largest occupation
group (9,581 people), followed by “Cleaners and Helpers in offices, Hotels and Other Es-
tablishments” (7,085 people). These ten occupational groups cover almost one third of the
employed population.
9 ILO, International Standard Classification of Occupations, ISCO-08,http://www.ilo.org/public/english/bureau/stat/download/res/futisco.pdf

56Household Income & Expenditure Survey 2016
“Cashiers and ticket clerks”, “general office clerks” and “deep-sea fishery workers” are
top three occupation for the young population (15-24 years). While among youth popula-
tion (18-34 years), “general office clerks” constitute the largest occupation group, followed
by “deep-sea fishery workers” and “Cashiers and ticket clerks”.
Looking at the top 10 occupations for the total employed population (15 years and above)
and the employed young population (15-24 years), “Cleaners and Helpers in offices, Ho-
tels and Other Establishments”, “Handcraft workers, basketry and related materials”,
“Retail and wholesale managers” “Secondary Education teachers” and “Security guards”
is there among the top 10 occupations of employed population, but not among the top 10
occupations of the young population (15-24 years). Instead, “Early childhood educators”,
“Shop sales assistant”, “Clearing and forwarding agent”, “Accounting and bookkeeping
clerks” and “Receptionists (general)” is there among the top 10 occupations of the young
population but not in the top 10 occupation of the employed population, in general.
Comparing total employed population (15 years and above) with employed youth popu-
lation (18-34 years), one finds that “Handcraft workers, basketry and related materials”,
“Retail and wholesale managers” and “Security guards” among top 10 occupations of
employed population, but not among the top 10 occupations of the youth. Instead, one
finds “Early childhood educators”. “Police” and “Accounting and bookkeeping clerks”
among top 10 occupations of the youth but not in the top 10 occupations of the employed,
in general.
57Household Income & Expenditure Survey 2016
Figure 3.16a: Top ten occupation at main job, Maldives, HIES 2016
0 4,000 8,000 12,000
Deep-sea Fishery WorkersCleaners and Helpers in offices, Hotels and Other Establishments
General office clerksHandcraft workers, basketry and related materials
ShopkeepersPrimary school teachers
Cashiers and ticket clerksRetail and wholesale managersSecondary Education teachers
Security guards
Number of employed population
Young population (15-24 years)
Youth population (18-34 years)
0 4,000 8,000 12,000
Cashiers and ticket clerksGeneral office clerks
Deep-sea Fishery WorkersShopkeepers
Early childhood educatorsShop sales assistant
Primary school teachersClearing and forwarding agent
Accounting and bookkeeping clerksReceptionists (general)
Number of employed population
Total (15 years and above)
0 4,000 8,000 12,000
General office clerksDeep-sea Fishery WorkersCashiers and ticket clerks
Primary school teachersEarly childhood educators
Police officersShopkeepers
Cleaners and Helpers in offices, Hotels and Other EstablishmentsSecondary Education teachers
Accounting and bookkeeping clerks
Number of employed population
Figure 3.16b shows the top ten occupations of men and women. Looking at the top 10
occupations by sex, the highest number of women work as “Handcraft workers, basketry
and related materials”, followed by “Cleaners and Helpers in offices, Hotels and Other
Establishments”. As seen from Figure 3.16b, these ten occupational groups for women
cover almost one half (47%) of the employed women population.

58Household Income & Expenditure Survey 2016
Figure 3.16b: : Top ten occupation at main job by sex, Maldives, HIES 2016
3.7.7 Industries or sectors of employment- main activityThe economy is divided into three broad sectors (a) Primary, including “Agriculture, for-
estry and fishing”, “Mining and quarrying” ; (b) Secondary, including “Manufacturing”,
“Electricity, gas, steam and air conditioning supply”, “Water supply; sewerage, waste
management and remediation activities”, “Construction”; and (c) Tertiary including
“Wholesale and retail trade; repair of motor vehicles and motorcycles”, “Transportation
and storage”, “Accommodation and food service activities”, “Information and communi-
cation”, “Financial and insurance activities”, “Real estate activities”, “Professional, scien-
tific and technical activities”, “Administrative and support service activities“, “Public ad-
In case of men, the highest number of men work as “deep-sea fishery workers”. The top
ten occupational groups for men cover 35% of the employed men population.
Women (15 years and above)
Men (15 years and above)
0 4,000 8,000 12,000
Handcraft workers, basketry and related materialsCleaners and Helpers in offices, Hotels and Other Establishments
General office clerksPrimary school teachers
ShopkeepersEarly childhood educators
Secondary Education teachersCashiers and ticket clerks
Bakers, pastry-cooks and confectionery makersTailors, dressmakers, furriers and hatters
Number of employed population
0 4,000 8,000 12,000
Deep-sea Fishery WorkersCleaners and Helpers in offices, Hotels and Other Establishments
Retail and wholesale managersGeneral office clerks
Security guardsHouse builders
Ships' deck crews and related workersPolice officers
Carpenters and joinersFreight Handlers
Number of employed population
59Household Income & Expenditure Survey 2016
ministration and defence; compulsory social security”, “Education”, “Human health and
social work activities”, “Arts, entertainment and recreation”, “Other service activities”,
“Activities of households as employers; undifferentiated goods- and services-producing
activities of households for own use” and “Activities of extraterritorial organizations and
bodies”.
Examining only main activity, as seen from Figure 3.17, the service sector employs the
greatest number of people (100,366 jobs) and represents 70% of all employment in the
Maldives. By comparison, the agricultural sector is only 9% (12,868 jobs) and industry
sector including mining and quarrying, manufacturing, electricity and water and con-
struction, provides 18% or 26,143 jobs.
Figure 3.17: : Number in employment by sector, Maldives, HIES 2016
11,338
15,087
58,471
1,530
11,057
41,895
0 20,000 40,000 60,000 80,000 100,000 120,000
Agriculture
Industry
Services
Number of employed
Men
Women
Note: Agriculture sector includes agriculture, forestry and fishing (ISIC category A), industry sector includes mining and quarrying, manufacturing, electricity and water and construction (ISIC category B to F), and service sector includes all other categories. (ISIC category G to U). 101
10 International Standard Industrial Classification of All Economic Activities (ISIC) Rev. 4,August 11 2008.

60Household Income & Expenditure Survey 2016
Figure 3.18: : Comparison of sectors of employment for main activity, Census 2014 & HIES 2016
0% 5% 10% 15% 20% 25%
Agriculture Forestry and Fishing
Manufacturing
Electricity Gas Steam and Air conditioning supply
Water supply; Sewerage Waste management andremediation activities
Construction
Whole sale and retail trade; Repair of motor vehiclesand motorcycles
Transportation and Storage
Accommodation and Food Service activities
Information and Communication
Financial and Insurance activities
Real estate activities
Professional scientific and technical activities
Administrative and Support service activities
Public Administration and Defense; Compulsory SocialSecurity
Education
Human Health and Social Work activities
Arts Entertainment and Recreation
Other service activities
Activities of households as employers; undifferentiatedservice producing activities of households for own use
Percentage of employed population
(a) Census 2014 Vs. HIES 2016
Census 2014- including non-admin islands HIES 2016
0% 5% 10% 15% 20% 25%
Agriculture Forestry and Fishing
Manufacturing
Electricity Gas Steam and Air conditioningsupply
Water supply; Sewerage Waste managementand remediation activities
Construction
Whole sale and retail trade; Repair of motorvehicles and motorcycles
Transportation and Storage
Accommodation and Food Service activities
Information and Communication
Financial and Insurance activities
Real estate activities
Professional scientific and technical activities
Administrative and Support service activities
Public Administration and Defense;Compulsory Social Security
Education
Human Health and Social Work activities
Arts Entertainment and Recreation
Other service activities
Activities of households as employers;undifferentiated service producing activities…
Percentage of employed population
(b) Census 2014 Vs. HIES 2016
Census 2014- for admin islands excluding collective living quartersHIES 2016
The result shows that the highest number (21,023 out of 142,422 total employed persons
or 15%) were engaged in “Public administration and Defense; compulsory social security”
industry in HIES 2016.
When compared with Census 2014, as seen from Figure 3.18a the employed population in
the accommodation and food service industry is low in HIES. This is mainly because the
resorts have a high proportion of employed persons, and the resorts are excluded in the
scope of HIES. Similarly, the coverage of employment in the construction is low in HIES as
many of the construction workers constitute foreigners living in collective living quarters.
The sample design of HIES excludes collective living quarters and hence this account for
the low figures in 2016.

61Household Income & Expenditure Survey 2016
Figure 3.18b compares HIES 2016 with Census 2014 comparable data as it excludes collec-
tive living quarters from administrative islands. As seen from the Figure 3.18b, the mag-
nitude of these changes is minimal once the Census 2014 results are generated according
to the HIES coverage.
It is important to note here that this distribution is different from Census 2014, due dif-
ference in the population covered in HIES 2016 and Census 2014. For example, in 2014
census there were 41,355 persons in the accommodation and food service activities and if
non-administrative islands are excluded the figure comes to 7,239 people. Hence, in HIES
2016 employed population in some of sectors are under-represented as the HIES 2016 was
only focused to the administrative islands.
3.7.8 Employed population by educational attainmentThe skill level of the employed population is to some extent determined by the education-
al attainment of employed population. In broad terms, it may be said that the larger the
proportion of the employed population having higher level of education, the higher the
skill level of the employed population. Also, it is widely recognized that there is a close re-
lationship between educational achievement and employment opportunities. Figure 3.19,
show the distribution of employed population by highest level of educational attainment
achieved for men and women separately.

62Household Income & Expenditure Survey 2016
Figure 3.19: : Employed population by highest level of education attainment achieved, Maldives, HIES 2016
Women
Men
Secondary education
31%
Primary education
23%
Certificate/ Diploma
22%
Degree & above11%
Higher secondary education
6%
Never attended
6%
Level not stated
1%Pre-school education
0%
Secondary education
37%
Primary education
27%
Certificate/ Diploma
14%
Degree & above…
Higher secondary education
6%
Never attended
7%
Level not stated
2%
Pre-school education
0%
The data shows that employed women are relatively more educated than men. Almost one
third of the employed men (37%) as well as the women (31%) have attended secondary
education, compared to 40% and 37% respectively in the entire population aged 15 years
and above. Also, it shows that almost one fourth of the employed men (27%) as well as the
women (23%) has attended primary education, compared to 26% and 28% respectively in
the entire population aged 15 years and above. More than 20% of employed women have
reached certificate/ diploma level of education, against 14% among men. Almost 11% of
employed women have university education against 7% among men, compared to 5%
and 5% respectively in the entire population aged 15 years and above. (see Figure 3.19).

63Household Income & Expenditure Survey 2016
3.8HOURS OF WORK AND TIME-RELATED UNDER-EMPLOYMENT
It is important to analyze the data on hours of work in order to differentiate the various in-
tensities of employment. Data on hours of work are also essential to calculate time-related
underemployment as well as average wages per hour so that the resulting wage data are
comparable across different categories of workers.
Employed persons worked on average, 8 hours per day on their main activity, with men
spending 9 hours while women spent 7 hours. According to Figure 3.20a, at national level
average and median working hours remain same at 8 hours per day showing a normal
distribution. However, women tend to spend less hours in their employed work lead-
ing to right (positive) skewness (the mass of the distribution is concentrated in the lower
working hours - many women work less than 7 hours) as seen from Figure 3.20a and b.
Figure 3.20a and b shows the distribution average working spent by men workers. It clear-
ly shows that the distribution is skewed to the left (negative). This means that the mass
of the distribution is concentrated in the right of the figure and it has relatively few low
values. The majority of the men work 8 or more hours per day.
3.8.1 Hours of work
Figure 3.20a : Average hours spent per day on main economic activity by sex, HIES 2016
Both sexes
- 10,000 20,000 30,000 40,000 50,000 60,000
1 2 3 4 5 6 7 8 9 10 11 12 13 14 15 16 17 18
Empl
oyed
pop
ulat
ion
Time spent per day (in hours)
Distrubution of average working hours per day on the main job
Mean & Median: 8 hours per day
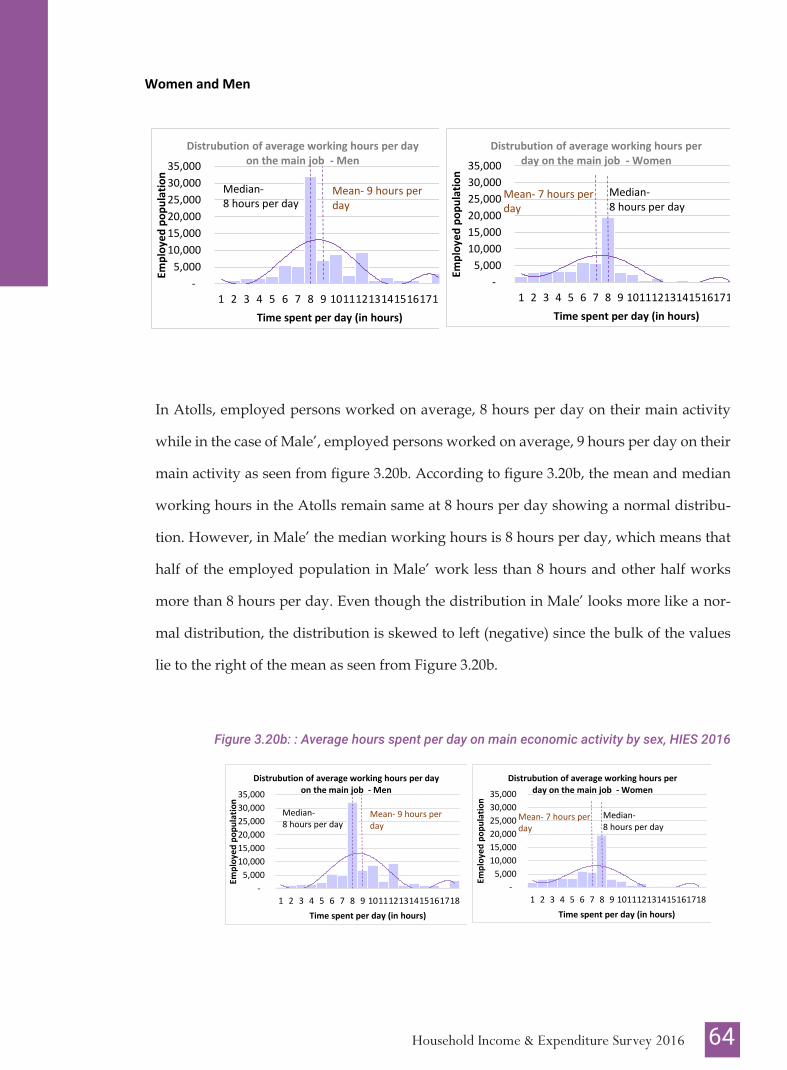
64Household Income & Expenditure Survey 2016
Women and Men
- 5,000
10,000 15,000 20,000 25,000 30,000 35,000
1 2 3 4 5 6 7 8 9 101112131415161718
Empl
oyed
pop
ulat
ion
Time spent per day (in hours)
Distrubution of average working hours per day on the main job - Men
- 5,000
10,000 15,000 20,000 25,000 30,000 35,000
1 2 3 4 5 6 7 8 9 101112131415161718
Empl
oyed
pop
ulat
ion
Time spent per day (in hours)
Distrubution of average working hours per day on the main job - Women
Mean- 9 hours per day
Median- 8 hours per day
Mean- 7 hours per day
Median- 8 hours per day
In Atolls, employed persons worked on average, 8 hours per day on their main activity
while in the case of Male’, employed persons worked on average, 9 hours per day on their
main activity as seen from figure 3.20b. According to figure 3.20b, the mean and median
working hours in the Atolls remain same at 8 hours per day showing a normal distribu-
tion. However, in Male’ the median working hours is 8 hours per day, which means that
half of the employed population in Male’ work less than 8 hours and other half works
more than 8 hours per day. Even though the distribution in Male’ looks more like a nor-
mal distribution, the distribution is skewed to left (negative) since the bulk of the values
lie to the right of the mean as seen from Figure 3.20b.
Figure 3.20b: : Average hours spent per day on main economic activity by sex, HIES 2016Women and Men
- 5,000
10,000 15,000 20,000 25,000 30,000 35,000
1 2 3 4 5 6 7 8 9 101112131415161718
Empl
oyed
pop
ulat
ion
Time spent per day (in hours)
Distrubution of average working hours per day on the main job - Men
- 5,000
10,000 15,000 20,000 25,000 30,000 35,000
1 2 3 4 5 6 7 8 9 101112131415161718
Empl
oyed
pop
ulat
ion
Time spent per day (in hours)
Distrubution of average working hours per day on the main job - Women
Mean- 9 hours per day
Median- 8 hours per day
Mean- 7 hours per day
Median- 8 hours per day

65Household Income & Expenditure Survey 2016
Table 3.4: Average hours spent per day on main economic activity by public vs. private sector, HIES 2016
Main job
Republic Male' Atoll Public 8 9 8 Private 9 9 8 House / living quarter 6 6 6 No fixed premise 10 9 10 Others 9 9 9 Not stated 8 9 8
On average, those working in the private sector spend more hours in their main job com-
pared to those in the public sector. Those who worked without any fixed location spend
on average 10 hours per day in their main activity as seen from Table 3.4.
The distribution of employed persons according to hours worked per week at all jobs
provides information on persons working on short hours (leading to time-related under-
employed) and persons working long hours. Long or excessive hours of work as termed in
the framework of decent work indicators is considered as a threat to physical and mental
health, interfering with the balance between work and family life, reducing productivity
and often signaling an inadequate hourly pay.
Figure 3.21 shows that overall 45% of the employed population worked excessively long
hours (more than 48 hours during a week) at all jobs in HIES 2016. The incidence of long
hours of work was higher among men (58%) than women (25%), and more in Male’ (46%)
than in Atolls (44%). In terms of main occupations, the highest incidence is among armed
forces occupations (70%) and skilled agricultural, forestry and fishery workers (68%).
3.8.2 Excessive hours of work

66Household Income & Expenditure Survey 2016
Figure 3.21: Proportion of employed persons with excessive hours of work (48+ hours in a week) at all jobs by sex, locality and main occupation, HIES 2016
By Sex
25%
58%
45%
0%
20%
40%
60%
80%
WomenMenTotal
perc
ent (
%) o
f em
ploy
ed
poul
atio
n
By Locality
By Occupation
46% 44%
0%
20%
40%
60%
80%
Male' AtollsPerc
ent (
%) o
f em
ploy
ed
popu
latio
n
Locality
59%
25%
47%
28%
54%68%
35%
65%
47%
70%
0%
20%
40%
60%
80%
1. M
anag
ers
2. P
rofe
ssio
nals
3. T
echn
ician
s and
asso
ciate
pro
fess
iona
ls
4. C
leric
al su
ppor
tw
orke
rs
5. S
ervi
ce a
nd sa
les
wor
kers
6. S
kille
d ag
ricul
tura
l,fo
rest
ry a
nd fi
sher
y…
7. C
raft
and
rela
ted
trad
esw
orke
rs
8. P
lant
and
mac
hine
oper
ator
s and
ass
embl
ers
9. E
lem
enta
ry o
ccup
atio
ns
0. A
rmed
forc
esoc
cupa
tions
Perc
ent (
%) o
f em
ploy
ed p
opul
atio
n
Occupation
Out of 133,241 employed Maldivian’s, 44% of the employed Maldivian’s worked exces-
sively long hours. While, among those foreign employed population (9,032 people), 56%
of them worked excessively long hours.
Majority of those employed who worked excessively long hours are employee (72%). And
incidence is common in the private sector (40%).
Currently the threshold used to identify whether a person is working excessively long
hours is more than 48 hours in a week111. This threshold is expected to change depending
on the country context. With the change in the threshold the number of people working
for excessively long hours would change.
11 According to the employment act of Maldives clause 32, excess hours define as 48 hours in a week.https://www.ilo.org/dyn/natlex/docs/ELECTRONIC/85764/96218/F1772069692/MDV85764%20English.pdf

67Household Income & Expenditure Survey 2016
Short hours of work are a sign of labour underutilization. However, if the short hours of
work are voluntary, then it is not considered as labour underutilization or time-related
underemployment.
Time-related underemployment refers to persons who are employed and who, during
the reference period (i) wanted to work additional hours; (ii) whose working time in all
jobs was less than threshold (i.e. 48 hours per week), and (iii) who were available to work
additional hours given an opportunity for more work.
The data in Figure 3.22 show that 10% of employed population is considered as time-re-
lated underemployment in Maldives in 2016. The incidence was almost double for women
(14%) compared to men (7%). Time-related underemployment was higher in Atolls (14%)
than in Male’ (6%), and highest among craft and related trades workers (18%) followed by
elementary occupations (14%) and professionals (14%). The “Professional” category also
includes teachers who work in the government sector. Their working hours are set accord-
ing to government hours. Hence, this might be one of the reasons why underemployment
is among Professionals.
3.8.3 Time-related underemployment

68Household Income & Expenditure Survey 2016
Figure 3.22: Proportion of employed persons in time-related underemployment by sex, locality and main occupation, HIES 2016
By Sex
14%
7%10%
0%
5%
10%
15%
WomenMenTotal
perc
ent (
%) o
f em
ploy
ed p
oula
tion
By Locality
By Occupation
46% 44%
0%
20%
40%
60%
80%
Male' AtollsPerc
ent (
%) o
f em
ploy
ed
popu
latio
n
Locality
59%
25%
47%
28%
54%
68%
35%
65%
47%
70%
0%
20%
40%
60%
80%
1. M
anag
ers
2. P
rofe
ssio
nals
3. T
echn
ician
s and
ass
ocia
tepr
ofes
siona
ls
4. C
leric
al su
ppor
t wor
kers
5. S
ervi
ce a
nd sa
les w
orke
rs
6. S
kille
d ag
ricul
tura
l, fo
rest
ry a
ndfis
hery
wor
kers
7. C
raft
and
rela
ted
trad
es w
orke
rs
8. P
lant
and
mac
hine
ope
rato
rs a
ndas
sem
bler
s
9. E
lem
enta
ry o
ccup
atio
ns
0. A
rmed
forc
es o
ccup
atio
ns
Perc
ent (
%) o
f em
ploy
ed p
opul
atio
n
Occupation

69Household Income & Expenditure Survey 2016
3.9EMPLOYMENT RELATED INCOME
HIES gathered information from each individual aged 15 years and above about their
sources of income and the total income they received over the past month from all sourc-
es. Employment-related income includes any payments received in cash or in kind by an
individual or by the family members, as a result of paid or self-employed jobs. Income
derived from other sources such as property, dividend, social assistance and transfers, etc.
which is not related to the employment is excluded.
3.9.1 Average monthly earnings for main jobThe average monthly earnings for an employed person for the main job is MRV 10,229,
while in Male’ it is MVR 13,528 and in the Atolls it is MVR 7,385. The data shows there is
a huge earning gap between Male’ and Atolls. In Male’, the average monthly earning is
almost double compared to Atolls. The average monthly earnings in the Male’ is higher
than the overall national averages. Figure 3.23 shows the distribution of earning among
men and women, and among age groups and level of education and by locality. On aver-
age, women received lower monthly earnings than men.
Figure 3.23: Average monthly earnings of employed persons for the main job by sex, locality, edu-cation attainment and age group, HIES 2016
7,51
0
10,0
94
5,64
0 11,9
77
15,4
17
8,66
2
10,2
29
13,5
28
7,38
5
-
5,000
10,000
15,000
20,000
25,000
Republic Male' Atolls
Aver
age
mon
thly
ea
rnin
g-m
ain
job
(in
MVR
)
Women Men Total

70Household Income & Expenditure Survey 2016
-
5,000
10,000
15,000
20,000
25,000
Pre-
scho
ol e
duca
tion
Prim
ary
educ
atio
n
Seco
ndar
y ed
ucat
ion
High
er se
cond
ary
educ
atio
n
Cert
ifica
te/ D
iplo
ma
Degr
ee &
abo
ve
Leve
l not
stat
ed
Neve
r att
ende
d
Aver
age
mon
thly
ear
ning
-mai
n jo
b (in
M
VR)
Women Men Both sex
-
5,000
10,000
15,000
20,000
25,000
15-1
718
-19
20-2
425
-29
30-3
435
-39
40-4
445
-49
50-5
455
-59
60-6
465
+
Aver
age
mon
thly
ear
ning
-mai
n jo
b (in
M
VR)
age groupTotal Women Men
As expected, employed persons with lower level of education received on average lower
monthly earnings than workers with tertiary educational attainment as seen from Figure
3.23. Based on the graph, it can be clearly seen that the average monthly earnings of work-
ers increase with age groups, as workers get more experience. After peaking at the age
group of 35-39 years, the average earnings decrease with age in the case of men and in the
case of women the decline in the average earnings starts from the age group 25-29 years
onward. Even though experience comes with age, the current civil service system does not
consider this fact. This requires further research.
Figure 3.24: Average monthly earnings of employed persons for the main job by public vs. private sector, HIES 2016
11,650 11,568
4,241
9,175 7,364
-
5,000
10,000
15,000
Publ
ic
Priv
ate
Hous
e /
livin
gqu
arte
r
No fi
xed
prem
ise
Othe
rAver
age
mon
thly
ea
rnin
g-m
ain
job
(in
MVR
)
On average those employed who are working in the public sector or private sector earns
about MVR 11,000 per month (Figure 3.24). There is no pay gap between public and pri-
vate sector. This could be due to the fact that public sector also includes state owned
companies and independent government organization. These institutes have a higher pay
scale compared to other public institutions. If the data is disaggregated by government

71Household Income & Expenditure Survey 2016
office and the independent institute, on average a person who is working in the govern-
ment sector earns MVR 10,820 while a person in the independent institute earns MVR
14,169. Hence it is important to study the average income per earner by sector and by
occupation. Figure 3.25 depict the average monthly earnings of employed person at main
job by sector/ industry they worked and by occupation. The highest earning was report-
ed by those who are working in the “Financial and insurance activities” sector while the
lowest earning is reported by those who are working in “Activities of households as em-
ployers” sector. Looking at the occupations, one finds that “Managers”, “Armed forces
occupations” and “Technicians and associate professionals” are top three occupations
which earn highest earning. Those workers who engaged in the “Craft and related trades
workers” earns the lowest earning followed by “Elementary occupations” as seen from
Figure 3.25.
Figure 3.25: Average monthly earnings of employed persons for the main job by industry and occu-pation, HIES 2016
Note: excluding “real estate activities” as the sample size is too small to present the overall market
By Industry By Occupation
3,980
5,643
6,239
8,072
8,193
8,257
8,354
8,537
10,166
10,261
10,496
11,199
11,469
11,593
12,345
12,401
12,472
12,679
13,182
13,288
- 5,000 10,000 15,000 20,000 25,000
Activities of households as employers; undifferentiated goods- andservices-producing activities of households for own use
Mining and quarrying
Manufacturing
Other service activities
Education
Agriculture, forestry and fishing
Water supply; sewerage, waste management and remediationactivities
Activities of extraterritorial organizations and bodies
Wholesale and retail trade; repair of motor vehicles andmotorcycles
Information and communication
Electricity, gas, steam and air conditioning supply
Arts, entertainment and recreation
Accommodation and food service activities
Human health and social work activities
Administrative and support service activities
Public administration and defence; compulsory social security
Professional, scientific and technical activities
Construction
Transportation and storage
Financial and insurance activities
in MVR
5,176
5,924
7,732
8,618
9,089
9,666
11,211
13,034
15,622
22,275
- 10,000 20,000
7. Craft and related tradesworkers
9. Elementary occupations
5. Service and sales workers
6. Skilled agricultural, forestryand fishery workers
4. Clerical support workers
8. Plant and machine operatorsand assemblers
2. Professionals
3. Technicians and associateprofessionals
0. Armed forces occupations
1. Managers
in MVR

72Household Income & Expenditure Survey 2016
Mean could be affected by the extreme values. Hence, it is important to study the median
earnings. Median earning is the income value at which the income distribution is divided
equally into two groups. This middle point or the median is important as always the earn-
ings of one half of the population falls either above or below that value.
Figure 3.26: Average and median monthly earnings of employed persons for the main job by sex, locality, HIES 2016
10
,229
13,5
28
7,38
5
8,00
0
10,2
65
6,00
0
-
5,000
10,000
15,000
Total Male' Atoll
Aver
age
mon
thly
ea
rnin
g-m
ain
job
(in
MVR Mean
Median
The average monthly earnings for an employed person for the main job is MRV 10,229,
while the median monthly earnings are MVR 8,000 as seen from Figure 3.26. The gap
between median and average earning is highest in Male’, indicates there are more people
with low income in Male’.
Figure 3.27 shows the data on average and median monthly earnings of employed person
at main job by the status of employment. The results show that on average employer earn
MVR 24,200 per month while employee earners MVR 10,765 which is 2 times lower than
what employer earns. The third highest average income is earned by the group works.
The mean is above the median for all the categories, which implies that the earnings dis-
tribution is more concentrated at the lower end than at the upper end.
Figure 3.27: Average and median monthly earnings of employed persons for main job by status of employment, Maldives, HIES 2016
10,765
24,200
5,619
6,975
5,525
8,261
9,000
14,400
2,990
4,000
3,000
6,000
- 5,000 10,000 15,000 20,000 25,000 30,000
Employee
Employer or owner (with employees)
Own account worker
Own account worker(with family…
Contributing family worker
Group worker
Average monthly earning- main job (in MVR)
Median
Mean

73Household Income & Expenditure Survey 2016
Figure 3.28 shows average and median monthly earnings of employed persons for main
job by local and foreigners. Overall, average monthly earnings for both Maldivian and
foreigners are almost equal at MVR 10,000 for their main job. However, foreign women
earn double than what Maldivian women earn (MVR 14,000 for foreign women vs. MVR
7,000 for Maldivian women) as average monthly earnings from their main job.
Figure 3.28: Average monthly earnings and median monthly earnings of employed persons for main job by sex and by local and foreigners, Maldives, HIES 2016
Mean monthly earnings from main job
Median monthly earnings from main jobs
10,2
20
7,29
6 12,2
05
10,4
56
14,2
78
9,53
1 -
5,000
10,000
15,000
20,000
25,000
Both sex Women MenAver
age
mon
thly
ear
ning
-m
ain
job
(in M
VR)
MALDIVIAN FOREIGNER
8,00
0
6,00
0 10,0
00
5,65
6
12,3
00
5,20
0
-
5,000
10,000
15,000
20,000
25,000
Both sex Women MenMed
ian
mon
thly
ear
ning
-m
ain
job
(in M
VR)
MALDIVIAN FOREIGNER
Overall, median monthly earnings for Maldivian are higher than the foreign workers for
their main job as seen from Figure 3.28. However, foreign women earn twice higher than
what Maldivian women earns (MVR 12,000 for foreign women vs. MVR 6,000 for Mal-
divian women) as median monthly earnings from their main job. Reverse can be seen in
the case of men. Maldivian men earn almost double compared to foreign men as median
monthly earnings from their main job.
The mean is above the median for both Maldivians as well as foreigners, which implies
that the earnings distribution is more concentrated at the lower end than at the upper end.
The median for foreign men being much lower than the mean for foreign men indicates
that the distribution is much more concentrated at the lower end having more people with
lower incomes.
Both mean and median earnings for foreign women workers are high compared to Mal-
divian women workers. This could be due to the fact that more foreign women are work-
ing in more skilled jobs or foreign women mostly employees in jobs while high proportion

74Household Income & Expenditure Survey 2016
of local women are self-employed and have lower incomes especially in Atolls. Based on
Figure 3.29, almost half of the foreign women workers are acting either as “Manager”,
“Professionals” or “Technicians and associate professionals”. Additionally, 7% of foreign
women works are engaged in “Craft and related trades workers’.
Figure 3.29: Number of foreign women workers and mean monthly earnings of employed foreign women for main job by occupation, Maldives, HIES 2016
Number of foreign women workers
Mean monthly earnings from main jobs – foreign
women
131
546
157 178115
571
0
100
200
300
400
500
600
1. M
anag
ers
2. P
rofe
ssio
nals
3. T
echn
ician
s and
asso
ciate
pro
fess
iona
ls
5. S
ervi
ce a
nd sa
les
wor
kers
7. C
raft
and
rela
ted
trad
es w
orke
rs
9. E
lem
enta
ryoc
cupa
tions
Num
ber o
f for
eign
wom
en w
orke
r
26,843
19,409 16,950
7,034
31,407
4,565
- 5,000
10,000 15,000 20,000 25,000 30,000 35,000
1. M
anag
ers
2. P
rofe
ssio
nals
3. T
echn
ician
s and
asso
ciate
pro
fess
iona
ls
5. S
ervi
ce a
nd sa
les
wor
kers
7. C
raft
and
rela
ted
trad
es w
orke
rs
9. E
lem
enta
ryoc
cupa
tions
Aver
age
mon
thly
ear
ning
-m
ain
job
(in M
VR)
Note: Foreign population in the survey is very low. So the result will not represent to the total foreign population
3.9.2 Employees with low earnings in the main job
According to ILO framework of decent work indicators, the employees with low pay rate
(ELPR) aim to capture the percentage of employees that are working for low wages. It
is defined as the percentage of employees whose hourly earnings in all jobs equal less
than two-thirds of the median hourly earnings of all employees. However, as the hourly
earnings from all jobs are not available, the analysis is limited to hourly earnings from the
main job.
Number of foreign women workers
Mean monthly earnings from main jobs – foreign
women
131
546
157 178115
571
0
100
200
300
400
500
600
1. M
anag
ers
2. P
rofe
ssio
nals
3. T
echn
ician
s and
asso
ciate
pro
fess
iona
ls
5. S
ervi
ce a
nd sa
les
wor
kers
7. C
raft
and
rela
ted
trad
es w
orke
rs
9. E
lem
enta
ryoc
cupa
tions
Num
ber o
f for
eign
wom
en w
orke
r
26,843
19,409 16,950
7,034
31,407
4,565
- 5,000
10,000 15,000 20,000 25,000 30,000 35,000
1. M
anag
ers
2. P
rofe
ssio
nals
3. T
echn
ician
s and
asso
ciate
pro
fess
iona
ls
5. S
ervi
ce a
nd sa
les
wor
kers
7. C
raft
and
rela
ted
trad
es w
orke
rs
9. E
lem
enta
ryoc
cupa
tions
Aver
age
mon
thly
ear
ning
-m
ain
job
(in M
VR)
If all the jobs are considered then the average monthly earnings for an employed person
from all the jobs is MRV 10,762, while in Male’ it is MVR 14,108 and in the Atolls, it is
MVR 7,878. Similar pattern as the main job is observed when it comes to average monthly
earnings for all jobs.
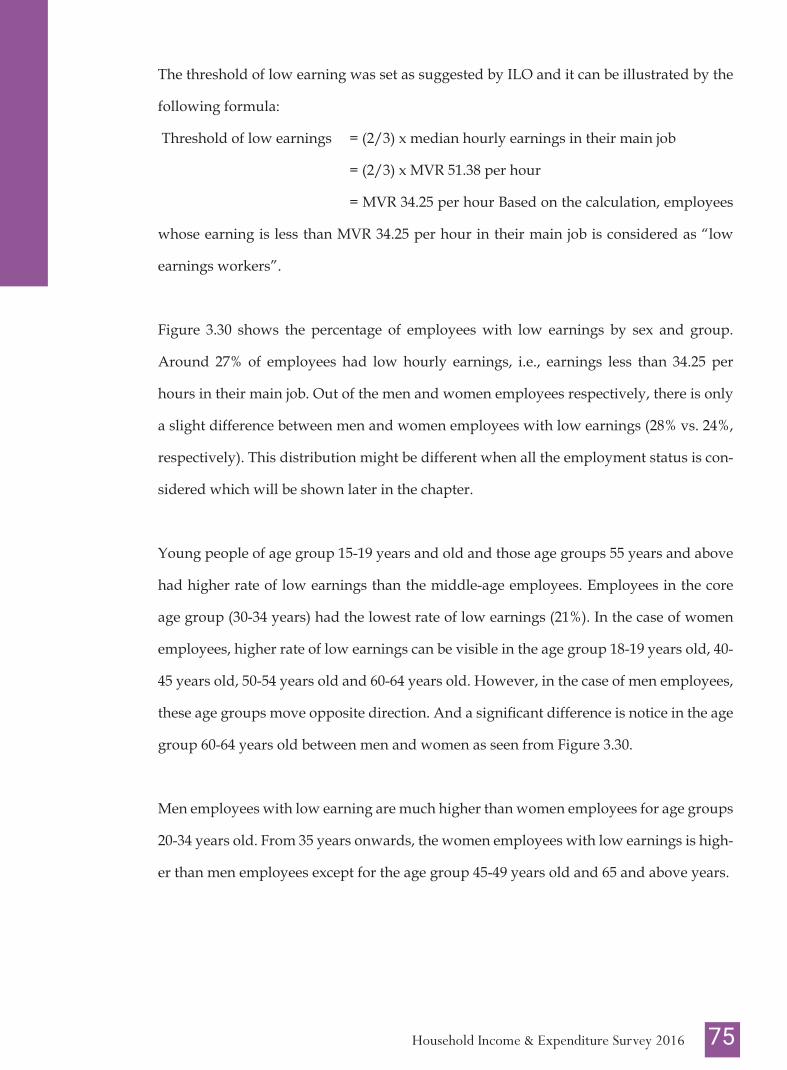
75Household Income & Expenditure Survey 2016
The threshold of low earning was set as suggested by ILO and it can be illustrated by the
following formula:
Threshold of low earnings = (2/3) x median hourly earnings in their main job
= (2/3) x MVR 51.38 per hour
= MVR 34.25 per hour Based on the calculation, employees
whose earning is less than MVR 34.25 per hour in their main job is considered as “low
earnings workers”.
Figure 3.30 shows the percentage of employees with low earnings by sex and group.
Around 27% of employees had low hourly earnings, i.e., earnings less than 34.25 per
hours in their main job. Out of the men and women employees respectively, there is only
a slight difference between men and women employees with low earnings (28% vs. 24%,
respectively). This distribution might be different when all the employment status is con-
sidered which will be shown later in the chapter.
Young people of age group 15-19 years and old and those age groups 55 years and above
had higher rate of low earnings than the middle-age employees. Employees in the core
age group (30-34 years) had the lowest rate of low earnings (21%). In the case of women
employees, higher rate of low earnings can be visible in the age group 18-19 years old, 40-
45 years old, 50-54 years old and 60-64 years old. However, in the case of men employees,
these age groups move opposite direction. And a significant difference is notice in the age
group 60-64 years old between men and women as seen from Figure 3.30.
Men employees with low earning are much higher than women employees for age groups
20-34 years old. From 35 years onwards, the women employees with low earnings is high-
er than men employees except for the age group 45-49 years old and 65 and above years.

76Household Income & Expenditure Survey 2016
40% 42%30%
18% 13%3%
40%55%
-10%0%
10%20%30%40%50%60%70%
Pre-
scho
oled
ucat
ion
Prim
ary
educ
atio
n
Seco
ndar
yed
ucat
ion
High
er se
cond
ary
educ
atio
n
Cert
ifica
te/
Dipl
oma
Degr
ee &
abo
ve
Leve
l not
stat
ed
Neve
r att
ende
d
Perc
ent o
f em
ploy
ees w
ith lo
w
pay
-in
mai
n
Education attainment
Employees with low rate of earnings in the main job decreases with educational attain-
ment. Among employees with secondary level or below, 34% of employees had low hour-
ly earnings. 55% of employees who have never attended school had low hourly earnings.
Among those who have degree and above, 3% of employees had low hourly earnings.
Figure 3.31: Percentage of employees with low earnings from the main job by sex and by local and foreigners, HIES 2016
24% 24% 24%
53%34%
58%
0%20%40%60%80%
Both sex Women Men Both sex Women Men
MALDIVIAN FOREIGNER
Perc
ent o
f em
ploy
ees
with
low
pay
-in
mai
n jo
b
Figure 3.31 shows the percentage of employees with low earnings from the main job by
sex and by local and foreigners. Altogether, more than half of foreign employees had low
hourly earnings from their main jobs. More than half of the foreign men employees earn
less than MVR 34.25 per hour in their main job while one-third of foreign women employ-
ee earns less than MVR 34.25 per hour in their main job. Maldivian employees with low
earnings affect men and women equally (24%).
Figure 3.30: Percentage of employees with low earnings from the main job by sex, age group, HIES 2016
26.4% 24.2% 27.7%
0%
20%
40%
60%
Both sex Women Men
Perc
ent o
f em
ploy
ees
with
low
pay
-in
mai
n jo
b0%
10%20%30%40%50%60%70%
15-1
7
18-1
9
20-2
4
25-2
9
30-3
4
35-3
9
40-4
4
45-4
9
50-5
4
55-5
9
60-6
4
65+
Perc
ent o
f em
ploy
ees w
ith
low
pay
-in
mai
n jo
b
Both sex Women Men

77Household Income & Expenditure Survey 2016
3.9.3 Low earnings workers from all type of employment status
If the same concept as employees with low earning can be utilized to identify the low
earning workers from all the jobs for all the types of employment status, then low pay rate
can be defined as the percentage of the all employed population whose average monthly
earnings is below two-third of the median of the earning.
The median employed persons earnings from all jobs is MVR 8,050 per month. If 2/3 of
this amount is taken as a threshold than employed who earned below MVR 5,366.67 per
month is considered as “low earning workers”.
Figure 3.32: Percentage of low earnings workers from all jobs by sex, HIES 2016
27.9%
40.4%
19.8%
0.0%
10.0%
20.0%
30.0%
40.0%
50.0%
Both sex Women Men
Perc
ent o
f em
ploy
ed
popu
latio
n w
ith lo
w
pay
-in
all j
ob
Figure 3.32 shows the percentage of low earnings by sex. Altogether, 28% of employed
population had low monthly earnings, i.e., earning less than MVR 5,366.67 per month in
all jobs. Among employed women population, more than 40% of employed women pop-
ulation had low monthly earnings from all the jobs. This rate is twice higher compared to
men employed with low monthly earnings (19.8%).
If the population is disaggregated by local and foreigners, 45% of the foreign employed
population is consider as “low earning workers” while 27% of the Maldivian employed
population is consider as “low earning workers” as seen from Figure 3.33. Among Maldiv-
ian women employed population, 41% of Maldivian women employed had low monthly
earnings.
Almost half of the foreign employed men had low monthly earnings while only 17% of
Maldivian employed men had low monthly earnings from all their jobs.
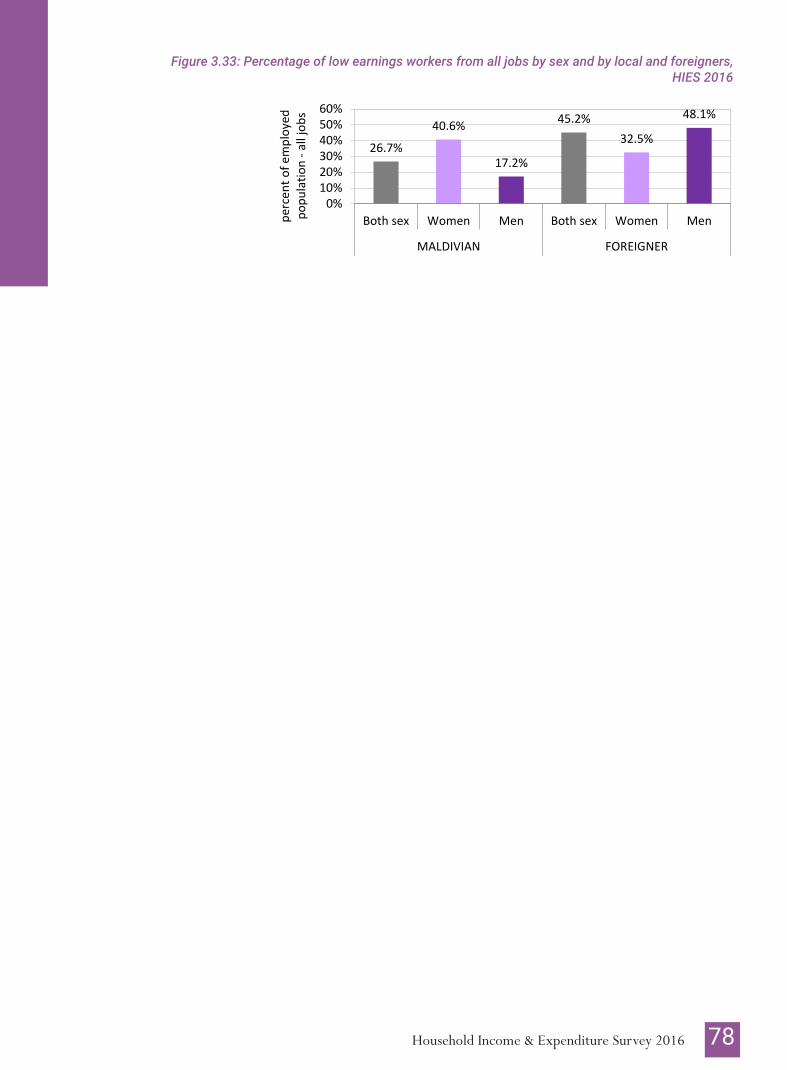
78Household Income & Expenditure Survey 2016
Figure 3.33: Percentage of low earnings workers from all jobs by sex and by local and foreigners, HIES 2016
26.7%40.6%
17.2%
45.2%32.5%
48.1%
0%10%20%30%40%50%60%
Both sex Women Men Both sex Women Men
MALDIVIAN FOREIGNER
perc
ent o
f em
ploy
ed
popu
latio
n -a
ll jo
bs

79Household Income & Expenditure Survey 2016
3.10GENDER PAY GAP
3.10.1 Only for employees – main job
The gender pay gap is a measure of the difference between men’s and women’s average
earnings. Gender pay gap provides a high-level indicator of women’s and men’s relative
earning power and reflects inequalities in the labour market. The gender pay gap is de-
rived as the difference between women’s and men’s average hourly earnings, expressed
as a percentage of men’s earning. In HIES 2016, when the resident population (Maldivian
and foreigner) is considered the national gender pay gap for all employees (based on the
main job) is 20%. This means that on average resident women work as employees earned
around 20% less than men. In Male’ the gender pay gap for all employees (based on the
main job) is 32%. This means that on average women employees in Male’ earned around
32% less than men employees in Male’. However, in Atolls, gender pay gap for all em-
ployees is -1%, indicating that on average women employees in the Atolls earned 1% more
than men in the atolls as seen from Figure 3.34. Figure 3.34: Gender pay gap for mean hourly earnings (only employees) in the main job by locality,
HIES 2016
26%
37%
6%
20%
32%
-1%
-10% 0% 10% 20% 30% 40%
Maldives
Male'
Atolls
Maldives
Male'
Atolls
Only
for
Mal
divi
anBo
th M
aldi
vian
and
Fore
ign
Gender pay gap for mean hourly earnings by locality
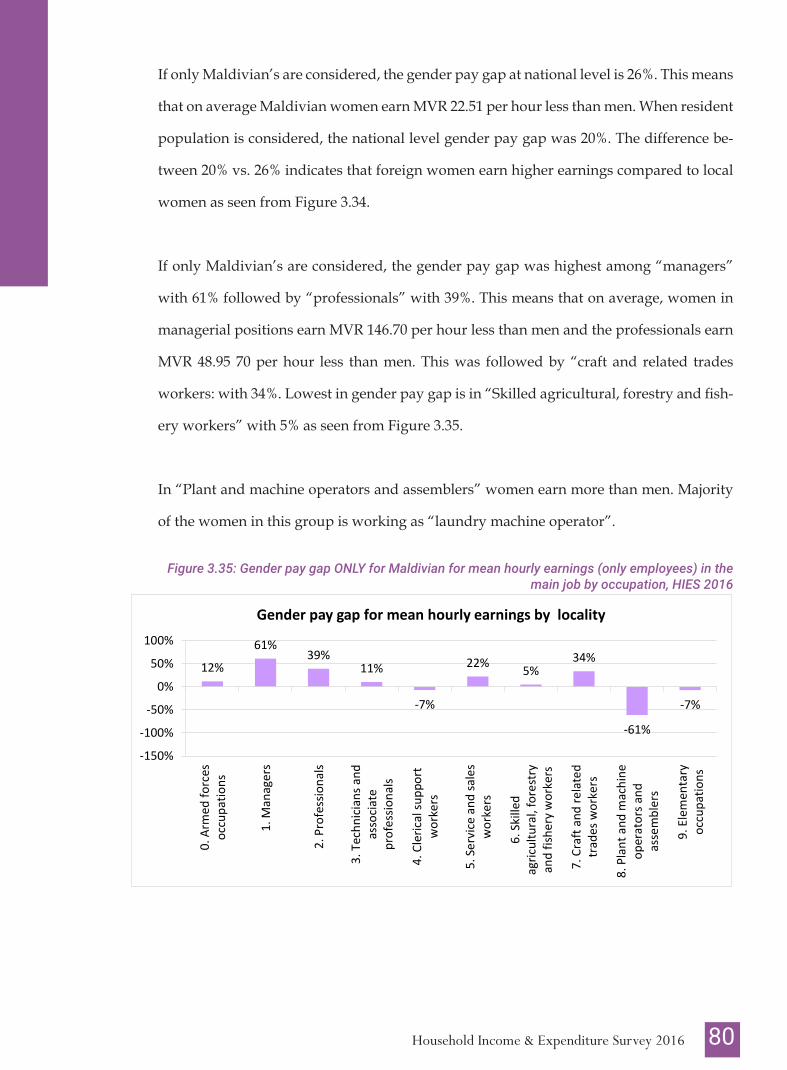
80Household Income & Expenditure Survey 2016
If only Maldivian’s are considered, the gender pay gap at national level is 26%. This means
that on average Maldivian women earn MVR 22.51 per hour less than men. When resident
population is considered, the national level gender pay gap was 20%. The difference be-
tween 20% vs. 26% indicates that foreign women earn higher earnings compared to local
women as seen from Figure 3.34.
If only Maldivian’s are considered, the gender pay gap was highest among “managers”
with 61% followed by “professionals” with 39%. This means that on average, women in
managerial positions earn MVR 146.70 per hour less than men and the professionals earn
MVR 48.95 70 per hour less than men. This was followed by “craft and related trades
workers: with 34%. Lowest in gender pay gap is in “Skilled agricultural, forestry and fish-
ery workers” with 5% as seen from Figure 3.35.
In “Plant and machine operators and assemblers” women earn more than men. Majority
of the women in this group is working as “laundry machine operator”.
Figure 3.35: Gender pay gap ONLY for Maldivian for mean hourly earnings (only employees) in the main job by occupation, HIES 2016
12%
61%39%
11%
-7%
22% 5%34%
-61%
-7%
-150%
-100%
-50%
0%
50%
100%
0. A
rmed
forc
esoc
cupa
tions
1. M
anag
ers
2. P
rofe
ssio
nals
3. T
echn
ician
s and
asso
ciate
prof
essio
nals
4. C
leric
al su
ppor
tw
orke
rs
5. S
ervi
ce a
nd sa
les
wor
kers
6. S
kille
dag
ricul
tura
l, fo
rest
ryan
d fis
hery
wor
kers
7. C
raft
and
rela
ted
trad
es w
orke
rs
8. P
lant
and
mac
hine
oper
ator
s and
asse
mbl
ers
9. E
lem
enta
ryoc
cupa
tions
Gender pay gap for mean hourly earnings by locality

81Household Income & Expenditure Survey 2016
Figure 3.36: Gender pay gap ONLY for Maldivian for mean hourly earnings (only employees) in the main job by age group, HIES 2016
29%
1%9%
50%
32%
7% 6% 5% 4%
30%
61%
0%10%20%30%40%50%60%70%
15-1
9
20-2
4
25-2
9
30-3
4
35-3
9
40-4
4
45-4
9
50-5
4
55-5
9
60-6
4
65+
Age group
Gender pay gap for mean hourly earnings by age group
In almost age groups women earn less than men as seen from Figure 3.36. Women in the
age group 30-34 experience the widest gap at 50% apart from the age group 65 years and
old.
3.10.2 For all the status of employment (employed population) – main job
As most of the women are working in the informal sector it is important to see the gender
pay gap by including all the status of employment. Figure 3.37 shows gender pay gap by
including all status of employment and for employees. It can be clearly seen that the gap
decreases from 20% to 13% when all types of statuses are included. Women are paid MVR
11.61 per hour less than men when all employment status are included.
Figure 3.37: Gender pay gap for mean hourly earnings (including employees and other status of employment) in the main job by locality, HIES 2016
13%
17%
5%
20%
32%
-1%
-10% 0% 10% 20% 30% 40%
Maldives
Male'
Atolls
Maldives
Male'
Atolls
All s
tatu
s of
empl
oym
ent
Only
empl
oyee
Gender pay gap for mean hourly earnings by locality

82Household Income & Expenditure Survey 2016
In the case of Male’ the gap narrows from 32% to 17% when all employment statuses are
included. This indicates that in Male’ there are more women working as employees (80%
of employed women in Male’ are employees) and these women earns less compared to
men.
In the case of Atoll, the gender pay gap widens (-1% vs. 5%). This indicators that in Atolls
more women are working as own account workers or contributing family members.


85Household Income & Expenditure Survey 2016
3.11UNEMPLOYMENT RATEThe unemployment rate is widely regarded as one of the key labour market indicators.
The unemployment rate is a measure of prevalence of unemployment or shows the imbal-
ance in the labour market in extent of unutilized labour supply of the country. People are
considered as unemployed if they: (a) did not work or have a job; (b) spent time looking
for work; and (c) were available to work if a job was offered to them. There is an exception
in the case of future starters. Future starters are considered as unemployed even if they
don’t spend time looking for work, and if they meet criteria (c) on availability.
Unemployment rate is calculated as a percentage of people in the labour force who are
unemployed.
There are 9,284 people who are seeking for a job and are available for work. Of the 9,284
unemployed persons, almost 4,900 (53%) are aged 15-24 years (young population) and
6,397 (70%) are aged 18-34 years (youth population).
Figure 3.38 illustrates the unemployment rate by locality, sex, age group and educational
attainment. The national unemployment is 6.1%. Unemployment rates are higher in Male’
than Atolls. The overall, unemployment rate for men is a bit higher than unemployment
rate for women, 6.4% for men and 5.6% for women.
Figure 3.38: Unemployment rate by locality, sex, age group and educational attainment, HIES 2016Locality and Sex
Education attainment
6.1%
7.5%
4.9%5.
6%
7.2%
4.4%
6.4% 7.
7%
5.2%
0%
2%
4%
6%
8%
10%
12%
14%
Republic Male' Atolls
Perc
enta
ge o
f une
mpl
oyed
pop
ulat
ion
amon
g lab
our f
orce
Both sex Women Men
1.6%
4.9%
8.9%
12.1
%
3.6%
3.1%
2.4%
1.9%
0%2%4%6%8%
10%12%14%
Pre-
scho
ol e
duca
Prim
ary
educ
atio
Seco
ndar
y ed
ucat
High
er se
cond
ary
Cert
ifica
te/ D
ip
Degr
ee &
abo
ve
Leve
l not
stat
ed
Neve
r atte
nded
perc
enta
ge o
f une
mpl
oyed
pop
ulat
ion
amon
g th
e la
bor f
orce

86Household Income & Expenditure Survey 2016
Age group and Locality
Age group and sex
0%
5%
10%
15%
20%
25%
30%
35%
15-1
7
18-1
9
20-2
4
25-2
9
30-3
4
35-3
9
40-4
4
45-4
9
50-5
4
55-5
9
60-6
4
Perc
enta
ge o
f une
mpl
oyed
pop
ulat
ion
amon
g th
e La
bour
forc
e (u
nem
ploy
men
t rat
e)
Republic Male' Atolls
0%
5%
10%
15%
20%
25%
30%
35%
15-1
718
-19
20-2
425
-29
30-3
435
-39
40-4
445
-49
50-5
455
-59
60-6
465
+perc
enta
ge o
f une
mpl
oyed
pop
ulat
ion
amon
g the
labo
r for
ce (u
nem
ploy
men
t ra
te)
Male'- Women Male' - Men
Atoll- Women Atoll- Men
In terms of educational attainment, the result shows that unemployment rate is highest
among persons with higher secondary (12.1%) followed by secondary education (9.8%)
and lowest among persons with lower levels of education. Persons with degree and above
also show higher rates of unemployment.
Unemployment rate is low at the age group 15-17 years, as expected, as the majority of
population in this group is still studying. Unemployment is highest for new labour mar-
ket entrants at age group 18-19 years as expected. As these fresh school leavers will not
have either the requested skills or the work experience to be among employed population.
Unemployment rates for Male’ in all the age groups except age group 40-44 years and 55-
59 years, are higher than the unemployment rates in the Atolls.
In terms of gender, unemployment rate in Male’ as well as in the Atolls is highest in the
age group 18-19 years for both men and women. In Male’, unemployment rate for men
is always higher than women except for the age group 35-39 years and 50-54 years. Un-
employment rates among men in Male’ and in Atolls remains almost same except for the
age group 35-39 years and the gap has widen after the age group 55-59 years as seen from
Figure 3.38. In the case of Atolls, unemployment rates for women in the age group 35-39
years is the only age group which shows a higher unemployment rate compared to unem-
ployment rate among men.

87Household Income & Expenditure Survey 2016
Unemployment for young population aged 15 to 24 years (16%) is higher than overall un-
employment rate (6%), and the difference is greatest for men. It is often difficult for school
leavers, who have little or no work experience, to find jobs. Unemployment rate for the
youth population aged 18 to 34 years is 8%, is still higher than the overall unemployment
rate.
Almost one fourth of the unemployed (24%) had no past work experience while the ma-
jority (76%) of the currently unemployed had held a job or were engaged in an income
generating activity before. Among those with no past work experience, almost one third
of the population (35%) falls under the age group 18- 19 years and almost one fourth of the
population (23%) falls under the age group 20-24 years.
Among those with past work experience (76%), the majority of them had left their jobs
during the last 3 months from the reference period of survey as seen from Figure 3.39.
Among those who have left their jobs during the last 3 months from the reference period
of survey, more than half of the unemployed population falls under the age 24 years and
below.
Figure 3.39: Unemployed population who had past experience by the duration since leaving past job, HIES 2016
38%16%
15%12%
7%11%
0% 5% 10% 15% 20% 25% 30% 35% 40%
Less than 3 monthsBetween 3 months to 6 months
Between 6 months to 1 yearBetween 1 year to 2 yearsBetween 2 year to 3 years
More than 3 years
Percent of unemployed who had past work experience
3.11.1 Methods of search for employmentFigure 3.40 shows the main channel used by the unemployed person to search for an em-
ployment opportunity in the four-week reference period of the survey.
The majority of the unemployed population seeks employment opportunities through

88Household Income & Expenditure Survey 2016
internet, news, gazette, etc. (47%) followed by assistance from friends and relatives (30%).
The pattern was similar for both women and men. And the same pattern was seen in the
case of Male’ and Atolls.
Only 3% of unemployed population joined a job centre to search for employment oppor-
tunities. In Male’ only 1% of the unemployed population joined a job centre while 6% of
unemployed population in the Atolls joined a job centre to seek employment opportuni-
ties.
Figure 3.40: Method of search for employment by sex and locality, HIES 2016
0%10%20%30%40%50%60%70%
Join
ed a
job
cent
er
Surfe
d on
inte
rnet
, new
s,ga
zzet
te, a
dvAs
ked
for h
elp
from
frien
ds a
nd re
lativ
Mak
ing
nece
ssar
ypr
epar
atio
ns to
star
t
Mee
t with
em
ploy
ers
Appl
ied
for l
icens
e to
star
t a b
usin
ess
Seek
fund
ing/
loan
to st
art
a bu
sines
s
Othe
rs
perc
ent o
f une
mpl
oyed
pop
ulat
ion
Both sex Women Men
0%10%20%30%40%50%60%70%
Join
ed a
job
cent
er
Surfe
d on
inte
rnet
, new
s,ga
zzet
te, a
dv
Aske
d fo
r hel
p fro
m fr
iend
san
d re
lativ
Mak
ing
nece
ssar
ypr
epar
atio
ns to
star
t
Mee
t with
em
ploy
ers
Appl
ied
for l
icens
e to
star
t abu
sines
s
Seek
fund
ing/
loan
to st
art a
busin
ess
Othe
rs
perc
ent o
f une
mpl
oyed
pop
ulat
ion
Republic Male' Atoll
3.11.2 Duration of unemploymentDuration of unemployment is the length of time during which unemployed person was
seeking and available for work. The duration of unemployment is measured on the basis
of the response to the survey question on “how long have you been available and actively
looking for a job”.
Figure 3.41: Duration of unemployment by sex and locality, HIES 2016
0%5%
10%15%20%25%30%35%40%
Less
than
1 m
onth
1 to
6 m
onth
s
6 m
onth
s to
1 ye
ar
1 to
2 y
ears
Mor
e th
an 2
yea
rs
Prec
ent o
f une
mpl
oyed
pop
ulat
ion
duration of unemployment
RepublicMale'Atolls
40 20 0 20 40
Less than 1 month
1 to 6 months
6 months to 1 year
1 to 2 years
More than 2 years
Percent of unemployed population
Men Women
89Household Income & Expenditure Survey 2016
3.11.3 Organization and Job preferred
Most unemployed have been looking for a job for less than 6 months (61%). Almost one-
fourth (25%) of unemployed population have reported that they were looking for an em-
ployment opportunity for more than 12 months. According to international standards
long-term unemployment is defined as duration of search for employment lasting 12
months or more. Thus, one-fourth of the unemployed were long-term unemployed in
2016. Long-term unemployment was higher in Atolls (28%) than in Male’ (22%). The per-
centage was higher among women (27%) than men (23%).
Figure 3.42 shows the organization and job preferred by unemployed person. Among
unemployed people, 46% of the unemployed population would like to work in the gov-
ernment sector and 23% of unemployed population would like to start their own business.
The majority of unemployed population would like to do manual job (without specific
skills) (31%) followed by clerical/ administrative job (29%). This could be explained by
the educational attainment given in Figure 3.38. The majority of unemployed population
have higher secondary and below educational level.
Figure 3.42: Percentage of unemployed population by type of organization preferred to work and kind of job preferred
23%46%
9%15%
2%5%
31%29%
24%7%9%
0% 10% 20% 30% 40% 50%
Starting a businessGovernment organization
State Owned EnterprisePrivate company
Family businessHome-based work
Manual job (without special skills)Clerical/Administrative jobTechnical/Professional job
Managerial jobDon't know
Type
of
ORGA
NISA
TION
pref
er to
wor
kKi
nd o
f JOB
pref
er to
hav
e
Percent of unemployed population


92Household Income & Expenditure Survey 2016
3.12PERSONS OUTSIDE THE LABOUR FORCE
Persons outside the labour force are defined as persons aged 15 years and above who are
neither employed nor unemployed (i.e. they are neither working nor seeking and avail-
able for work) during the reference period. It consists of all people 15 years and above
who, were not employed but who were either (a) seeking employment but not currently
available or (b) currently available for employment but did not seek employment and (c)
currently not available for employment and did not seek employment. These first two
categories are referred as potential labour force.
In total, there are 111,604 people 15 years and older outside the labour force. Of them,
33,036 are aged 15 to 24 years and 39,403 are aged 18 to 34 years. Out of the youth popu-
lation aged 18 to 35 years, 31,336 women and 8,067 men.
Persons outside the labour force accounted for 42% of the total 15 years and above during
HIES 2016. The majority of persons who are outside the labour force are either teenagers
15-17 years old or elderly persons 65years and above, as seen from Figure 3.43.
Figure 3.43: Population outside labour force by age, HIES 2016
14%
6%
9% 9%11%
7% 7% 6% 6% 6%4%
14%
0%
5%
10%
15%
15-1
7
18-1
9
20-2
4
25-2
9
30-3
4
35-3
9
40-4
4
45-4
9
50-5
4
55-5
9
60-6
4
65+pe
rcen
t of o
utsid
e la
bour
fo
rce
popu
layi
on
age group

93Household Income & Expenditure Survey 2016
Among the young age population (15-24 years) almost one-third of them are outside the
labour force with majority of them (65%) attending educational institutions. Another 14%
of those outside the labour force are elderly people beyond their retirement age 65 years
and above. Composition of population outside labour force by sex, shows that much high-
er proportion (72%) of them are women, with almost same proportion of women among
those outside the labour in Male’ (72%) as well as in the Atolls (74%). The proportion of
population outside the labour force is higher in the Atolls (58%) than in Male’ (42%).
A huge difference exists between women and men by age group as seen from Figure 3.44.
A major chunk of the men who were outside the labour force falls to the age group 15-17
years and 65+ years. For women the largest proportion of population outside the labour
force falls under the age group 25-29 years, 30-34 years and 65 years and above. Number
of men outside the labour force was substantially lower compared to women in all age
groups from 18 years till 64 years of age.
Figure 3.44: Percentage distribution of population outside the labour force by age and sex, 2016
10000 5000 0 5000 10000 15000
15-1718-1920-2425-2930-3435-3940-4445-4950-5455-5960-64
65+
population outside the labour force
MenWomen
For those who were outside the labour force, there were two separate questions which
were asked in HIES to capture the reason for not seeking a job and reason for not available
for the job. The reason for not seeking a job is shown in Figure 3.45. The majority of people
who were not seeking a job and were outside labour force because of household chores
/ babysitting (37%) followed by those are outside the labour force because of attending
educational / training program (21%) and due to ill health (21%). Among those how have
said due to ill health, 70% of them are aged 55 years and above.

94Household Income & Expenditure Survey 2016
Most women outside the labour force were not seeking a job due to household chores /
babysitting (49%) compared to 3% of men. The main reason men do not participate in the
labour force and are not seeking a job is being attending educational / training program
(34%) and due to ill health (32%). This could be explained from Figure 3.44, that majority
of men falls to the age group 15-17 years and 65+ years. For women, 16% of those outside
the labour force were not seeking a job due to ill health and 16% are attending educational
/ training program.
Figure 3.45: Reason for not seeking a job and being outside the labour, by sex and locality HIES 2016
By Sex
By Locality
21%
37%
21%
22%
16%
49%
16%
18%
34%
3%
32%
30%
0%
10%
20%
30%
40%
50%
60%
Atte
ndin
ged
ucat
iona
l /tr
aini
ng p
rogr
a
Hous
ehol
d ch
ores
/Ba
bysit
ting
Due
to il
l hea
lth
Othe
r
perc
ent o
f out
side
labo
ur fo
rce
popu
latio
n
Reason for not seeking a job
Both sex Women Men
30% 38
%
16%
17%
15%
36%
24%
25%
-10%0%
10%20%30%40%50%60%
Atte
ndin
g ed
ucat
iona
l/ t
rain
ing
prog
ra
Hous
ehol
d ch
ores
/Ba
bysit
ting
Due
to il
l hea
lth
Othe
r
perc
ent o
f out
side
labo
ur fo
rce
popu
latio
n
Reason for not seeking a job
Male' Atoll
Some differences exist in Male’ and the Atolls to the response to the main reason for not
seeking a job, as seen from Figure 3.45 left panel. Both in Male’ as well as in the Atolls,
the majority of people who were not seeking a job and were outside labour force because
of household chores / babysitting (38% in Male’ vs. 36% in Atolls). Higher proportion of
those outside the labour force was not seeking a job in Male’ due to attending education-
al/ training program (30% in Male’ vs. 15% in the Atolls) while higher proportion of those
living in the Atolls (24% in Atolls vs. 16% in the Male’) stated bad health as their main
reason for not being in the labour force.

95Household Income & Expenditure Survey 2016
Figure 3.46: Reason for not seeking a job and being outside the labour, by sex and age group HIES 2016
Some differences exist among young population (15-24 years) and rest of the population
to the response to the main reason for not seeking a job, as seen from Figure 3.46. Among
the reasons for not seeking a job in the young population (15-24 years), for both men and
women attending educational / training program ranks the highest. However, when the
population 25 years and above is considered these reasons vary considerably. Number one
reason for women is household chores / babysitting while for men it is due to ill health.
Figure 3.47: Reason for not available for work and being outside the labour, by sex, HIES 2016
23% 33
%
12%
12% 20
%
17%
45%
10%
9%
19%
39%
3%
17%
19% 22%
-10%0%
10%20%30%40%50%60%
Atte
ndin
g ed
ucat
iona
l /tr
aini
ng p
rogr
a
Hous
ehol
d ch
ores
/Ba
bysit
ting
Due
to h
ealth
cond
ition
at
the
mom
ent
Old
age
wea
knes
s
Othe
r
perc
ent o
f out
side
labo
ur fo
rce
popu
latio
n
Reasons not available for a job
Both sex Women Men
A similar pattern was seen for the main reason for not available for work. The majority of
women are not available for work due to household chores while majority of men is not
available to work due to studying as seen from Figure 3.47.
62%
16%4%
19%
74%
0% 4%
22%
2%
60%
20% 18%2% 6%
55%
37%
0%
20%
40%
60%
80%
Atte
ndin
g ed
ucat
iona
l /tr
aini
ng p
rogr
aHo
useh
old
chor
es /
Baby
sittin
g
Due
to il
l hea
lth
Othe
r
Atte
ndin
g ed
ucat
iona
l /tr
aini
ng p
rogr
aHo
useh
old
chor
es /
Baby
sittin
g
Due
to il
l hea
lth
Othe
r
Atte
ndin
g ed
ucat
iona
l /tr
aini
ng p
rogr
aHo
useh
old
chor
es /
Baby
sittin
g
Due
to il
l hea
lth
Othe
r
Atte
ndin
g ed
ucat
iona
l /tr
aini
ng p
rogr
aHo
useh
old
chor
es /
Baby
sittin
g
Due
to il
l hea
lth
Othe
r
Women Men Women Men
15-24 years 25 years and abovepe
rcen
t of o
utsid
e la
bour
forc
e po
pula
tion

96Household Income & Expenditure Survey 2016
3.12.1 Potential labour forceThe ILO defines the potential labour force as all persons 15 years and above, who, during
the reference period, were neither in employment nor in unemployment but who were
considered as whether (a) unavailable jobseekers (seeking for employment but not cur-
rently available) or (b) available potential jobseekers (currently available for employment
but not carry out activities to seek employment).
In HIES 2016, the potential labour force comprised 24,135 persons. Out of this, 97% of the
population falls under the sub-category “available potential job seekers”, that is persons
who were currently available for employment by who had not taken any steps to seek em-
ployment during the past month. Among the potential labour force, women population is
significantly high compare to men and bulk of the potential labour force lives in Atolls as
seen from Figure 3.48.
Figure 3.48: Potential labour force by sex and locality, HIES 2016
Republic
Potential labour force by available potential job seekers and unavailable job seekers
24,135
17,522
6,613
-
10,000
20,000
30,000
Both sex Women Men
Num
ber o
f peo
ple
-
10,000
20,000
30,000
Available but not seeking Seeking but not available
Num
ber o
f peo
ple
Both sex Women Men
By locality
7,937 5,983 1,954
16,197 11,539
4,659
-
10,000
20,000
30,000
Both sex Women Men Both sex Women Men
Male' Atolls
Num
ber o
f peo
ple
For men, nearly half (46%) of population in the potential labour force falls to age group
15-24 years while for women, majority of the population falls to age groups 20-24 years
(15%) and 25-29 years (14%) and 30-34 years (15%).

97Household Income & Expenditure Survey 2016
Figure 3.49: Potential labour force by sex and age group and locality, HIES 2016
1000 500 0 500 1000 1500 2000
15-1718-1920-2425-2930-3435-3940-4445-4950-5455-5960-64
65+
Number of peopleAg
e gr
oup
Men-AtollsWomen-AtollsMen- Male'Women- Male'
Figure 3.49 shows potential labour force by age group and by sex and by locality. Both in
Male’ and in the Atolls, the majority of men in the potential labour force falls to age group
15-24 years. However, in Male’, the majority of women in the potential labour force fall to
age group 30-34 years while in the Atolls, the age group is 24-29 years as seen in Figure
3.49.
Figure 3.50: Reason for not seeking a job and being potential labour (not seeking but available), by sex, HIES 2016
57%
10%0%2%
48%
2%3%10%
59%
38% 32%40%
0%
20%
40%
60%
80%
15-17 years 18-64 years 65+ years
perc
ent o
f out
side
labo
ur fo
rce
popu
latio
n
Attending educational / training progra Household chores / Babysitting
Due to ill health Other
For age group 15-17 years more than 50% falls in potential labour force due to them being
currently in studying, while for age group 65 years and above almost 60% of the popula-
tion falls in potential labour force due to ill health as seen from Figure 3.50. For age group
18-64 years the main reason for not seeking a job was due to household chores work.
Hence, policy such as establishing daycare system need to be implemented in order to
utilized this population.
98Household Income & Expenditure Survey 2016
3.12.2 Others outside of the Labour force (not seek-ing, not available)
Person who are neither seeking nor available for work, are counted as others outside of
the labour force. This may be due to being retired, a student, housewife or simply choos-
ing not to work. In total, there are 87,469 people, 15 years and older, who are not seeking
and not available for the work or considered as others outside of the Labour force. Of
them, 25,653 are aged 15 to 24 years and 27,570 are aged 18 to 34 years. Out of the youth
population aged 18 to 35 years, 22,724 women and 4,846 men.
Figure 3.51 shows women are more likely to be in the category of others outside the labour
force. Both in Male’ as well as in the Atolls, the majority of men who are not seeking and
not available for work are either 15-17 years who could be engaged in the studies or elder-
ly persons 65 years and above, as seen from Figure 3.51.
In the case of women in Male’, those who are not seeking and not available for a work as
decreased in the age group 18-19 years and then started to increase. After peaking at the
age group 35-39 years, those not seeking and not available for a work declined and again
peaked at elderly aged 65 years and above. In the Atolls, women who are not seeking and
not available for a work peaked at the age group 35-39 years, and afterwards declined and
again peaked at elderly aged 65 years and above as seen from Figure 3-51.
Figure 3.51: Others outside the labour force by sex and age group and locality, HIES 2016
01,0002,0003,0004,0005,0006,000
15-1
7
18-1
9
20-2
4
25-2
9
30-3
4
35-3
9
40-4
4
45-4
9
50-5
4
55-5
9
60-6
4
65+
Num
ber o
f peo
ple
Age groupAtoll_women Atoll_men Male'_women Male'_men

99Household Income & Expenditure Survey 2016
Figure 3.52: Reason for not seeking a job and being others outside the labour (not seeking, not available), by sex, HIES 2016
23
%
35%
23%
18%
18%
47%
18%
17%
38%
3%
36%
23%
0%5%
10%15%20%25%30%35%40%45%50%
Atte
ndin
g ed
ucat
iona
l /tr
aini
ng p
rogr
a
Hous
ehol
d ch
ores
/Ba
bysit
ting
Due
to il
l hea
lth
Othe
r
perc
ent o
f oth
ers o
utsid
e la
bour
forc
e po
pula
tion
Reason for not seeking a job
Both sex Women Men
Nearly half of the women not seeking for a job is due to household chores / babysitting
(47%) compared to 3% of men. The main reason men not seeking for a job is being attend-
ing educational / training program (38%) and due to ill health (36%). For women, 18% of
those others outside the labour force were not seeking a job due to ill health and 18% are
attending educational / training program as seen from Figure 3.52.
Figure 3.53: Reason for not available for work and being others outside the labour (not seeking, not available), by sex, HIES 2016
23% 33
%
12%
12% 19
%
17%
45%
10%
9%
19%
39%
3%
17% 20%
22%
0%10%20%30%40%50%
Atte
ndin
g ed
ucat
iona
l /tr
aini
ng p
rogr
a
Hous
ehol
d ch
ores
/Ba
bysit
ting
Due
to h
ealth
cond
ition
at th
e m
omen
t
Old
age
wea
knes
s
Othe
r
perc
ent o
f oth
ers o
utsid
e la
bour
forc
e po
pula
tion
Reasons not available for a job
Both sex Women Men
A similar pattern was seen for the main reason for not available for work. The majority of
women are not available for work due to household chores while majority of men is not
available to work due to studying as seen from Figure 3.53.

100Household Income & Expenditure Survey 2016
3.12.3 Decline jobIf a person is not employed a question was asked “did you ever decline a job offer?” based
on this question the analysis has been carried out. Based on HIES 2016, 10% of those who
are not employed have declined a job. Out of those who declined a job, 75% of them were
women.
Majority of the men (34%) have declined a job due to low pay while 40% of the women
have declined the job because they don’t want to work as seen from Figure 3.54.
Figure 3.54: Reasons for decline a job, by sex, HIES 2016
0%10%20%30%40%50%60%
Low
pay
Do n
ot li
ke th
e jo
b
Tran
spor
tatio
ndi
fficu
lties
Not i
deal
com
pare
d to
the
educ
atio
nal l
evel
Shor
t wor
king
hour
s
Long
wor
king
hour
s
Do n
ot w
ant t
ow
orkPe
rcen
tage
of p
opul
atio
n w
ho
have
dec
lined
a jo
b
Reason
Reason for decline a job
Both sex Women Men
One third of the men (34%) prefer to work in the government while nearly half of the
women (46%) who are not employed prefer to work at home or home-based work as seen
from Figure 3.55. Both men and women prefer to do manual job (without special skill).
This could be due to the low educational level among those not working.
Figure 3.55: Type of job preferred to work and kind of job preferred, by sex, HIES 2016
0%10%20%30%40%50%60%
Star
ting
a bu
sin
Gove
rnm
ent o
rgan
Stat
e Ow
ned
Ente
Priv
ate
com
pany
Non-
prof
it or
gan
Fam
ily b
usin
ess
Hom
e-ba
sed
wor
k
Perc
enta
ge o
f pop
ulat
ion
who
are
NOT
em
ploy
ed
Type of organisation prefer to work
Both sex
Women
Men
0%10%20%30%40%50%60%
Man
ual j
ob (w
ithou
tsp
ecia
l ski
lls)
Cler
ical/A
dmin
istra
tive
job
Tech
nica
l/Pro
fess
iona
ljo
b
Man
ager
ial j
ob
Don'
t kno
w
Perc
enta
ge o
f pop
ulat
ion
who
are
NOT
em
ploy
ed
Kind of job prefer
Both sexWomenMen

101Household Income & Expenditure Survey 2016
3.13MEASURES OF LABOURUNDERUTILIZATION
The ILO introduced the concept of extended labour force, which is defined as the sum
of the labour force plus the potential labour. At the national level, potential labour force
represented 14% of the extended labour force. The potential labour force was significantly
higher among women than men and in Atolls than in Male’ as seen from Figure 3.56.
71,701
25,398 46,304
80,005
33,650 46,356
7,937
5,983
1,954
16,197
11,539 4,659
79,639
31,381
48,258
96,203
45,188 51,014
-
50,000
100,000
150,000
Both sex Women Men Both sex Women Men
Male' Atolls
Num
ber o
f peo
ple
Labour force Potential Labour force
3.13.1 Composite measure of labourunderutilization
Potential labour force together with time-related underemployment and unemployment
are different dimensions of labour underutilization. Labour underutilization refers to mis-
matches between labour supply and demand, which translate into an unmet need for
employment among the population.
The ILO recommends the use of more than one measure of labour underutilization for
monitoring labour market performance. The unemployment rate (termed as LU1 in the
ILO standards) is the most restrictive measure of labour underutilization. The most ex-
pansive among those proposed by the ILO standards is the composite measure of labour
underutilization on (LU4), defined as the sum of time-related underemployment, unem-
ployment, and potential labour force expressed as a percentage of the extended labour
force.
Figure 3.56: Extended labour force by sex and by locality, HIES 2016

102Household Income & Expenditure Survey 2016
3.13.2 Labour underutilizationThe labour Underutilization refers to mismatches between labour supply and demand,
which translate into an unmet need for employment among the population.
• Time-related underemployed: Employed, but with insufficient working time
(wanting and available to work more hours)
• Unemployed: Not employed, but “currently available supply of labour” and seek-
ing and available to work
• Potential labour force: Not employed, but “potential supply of labour” and seek-
ing, but not available to work, not seeking, but available and wanting to work
Box 3.3: Main Labour underutilization indicators
LU1: Unemployment rate represents the persons without employment, putting pressure on labour market. This is a narrow view of absence of employment highlighting the potential matches between available labour supply (people) and available demand (jobs) at a given point in time. LU2: Combined rate of time-related underemployment and unemployment highlights the extend of the pressure on labour market caused by mostly people in precarious working condition (i.e. working less hours while looking for other job opportunity) in addition to those already available and looking for jobs. The inclusion of the time-related underemployment brings together into the LU2 the situation of insufficient working time in relation to alternative employment situations. LU3: Combined rate of unemployment and potential labour force allows understanding the overall extend of lack of employment by including for instance those who has been discouraged. If opportunity is provided through new investment or entrepreneurial initiative, the country jobs to be created will be able to absorb all those looking for jobs depending whether there has been upskilling or jobs created in remote areas. LU4: Composite measure of labour underutilization represents the overall lack of satisfactory jobs in the labour market. Hence, it is a combination of Time-related underemployment, Unemployment and potential labour force.
As illustrated in Figure 3.57, specific policies intervention will be required for the people
in Time-related underemployment in the Atolls (10,349 persons). As expected, the Atolls
have a large number of people in the potential labour force (16,191 persons), as there are
no opportunities for jobs in remote Islands. The main concentration of unemployed per-
son is seen in Male’.

103Household Income & Expenditure Survey 2016
Figure 3.57: Persons by categories of Labour underutilization and Islands, HIES 2016
3,921 5,378 7,937
10,3493,906
16,197
0
5,000
10,000
15,000
20,000
25,000
TRU Unemployed Potential labour
Rese
iden
t Pop
ulat
ion
Persons by labour underutilization type
Male' Atolls
The composition of labour underutilization is different between Male’ and the Atolls. In
Atolls the main issues are Time-related underemployment (TRU) and potential labour
force, while in Male’ it is to some extend unemployment
Women and youth were also more affected by the labour underutilization than their other
counterpart (Figure 3.58b) resulting in significant gender gap. The measure of potential
labour force provides, indicating some of discourage job seekers, was the highest con-
tributing component to the labour underutilization. The other significant contributor to
the labour underutilization came from those in time-related underemployment. Only the
unemployment rate (LU1) appears slightly high in Male’s (8%) than in Atolls (5%) even
though there is no noticeable gender gap (Figure 3.58a). A significant high rate of youth
unemployment for those in age group 15-24 was estimated at 16% (Figure 3.58b).
Figure 3.58a: Labour underutilization by Island, HIES 2016
6%16% 19%
27%
8%13% 17%
22%
5%
18% 21%
32%
0%
20%
40%
60%
LU1 LU2 LU3 LU4
Perc
enta
ge o
f pop
ulat
ion Unemployment and Labour underutilisation measures
Republic Male' Atolls

104Household Income & Expenditure Survey 2016
Figure 3.58b: Labour underutilization by demographic variables (age and sex), HIES 2016
6%
19%27%
38%
6%13% 13%
19%16%25%
32%39%
8%17% 20%
28%
0%
20%
40%
60%
LU1 LU2 LU3 LU4Perc
enta
ge o
f pop
ulat
ion Unemployment and Labour underutilisation measures
Women Men 15-24 (international Youth) 18-35 (local youth)
The calculation of the composite measure of labour underutilization (LU4) on the basis
of results of HIES 2016 is presented in Table 3.5 for the total working age population by
locality and for men and women and local and foreigners. The results show that the com-
position measure of labour underutilization (LU4) is almost four times higher than the
national unemployment rate (LU1) (27% vs. 6%). The difference is particularly significant
among women (38% combine rate of labour underutilization against 6% unemployment
rate).
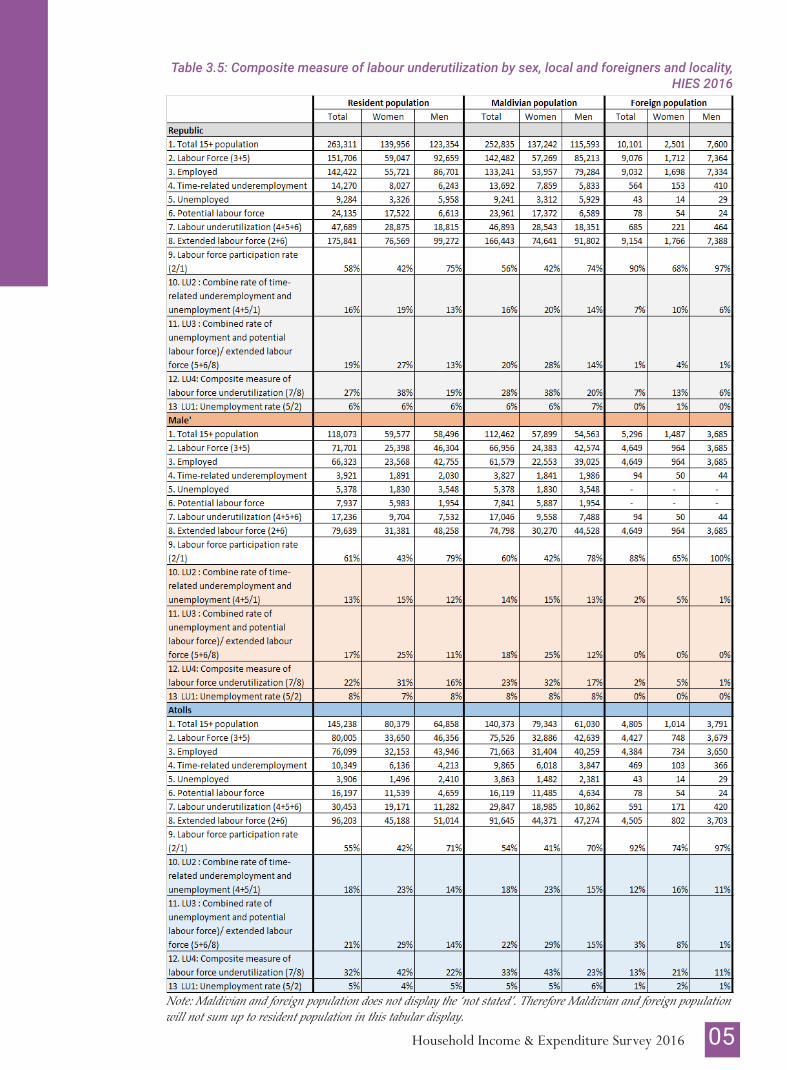
105Household Income & Expenditure Survey 2016
Table 3.5: Composite measure of labour underutilization by sex, local and foreigners and locality, HIES 2016
Note: Maldivian and foreign population does not display the ‘not stated’. Therefore Maldivian and foreign population will not sum up to resident population in this tabular display.

106Household Income & Expenditure Survey 2016
In Male’, the composite measure of labour underutilization (LU 4) is at 22% while in the
Atolls the rate is at 32%. Both in Male’ and in Atolls, the difference between combine
rate of labour underutilization and unemployment rate is particularly significant among
women as seen from Table 3.5.

107Household Income & Expenditure Survey 2016
3.14YOUTH WHO ARE NOT IN EMPLOYMENT, EDUCATION OR TRAINING (NEET)
Youth not in employment, education or training (NEET) provides a measure of youth
who are outside the educational system, not in training and not in employment, and thus
serves as a broader measure of potential youth labour market entrants than youth un-
employment. It includes discouraged worker youth as well as those who are outside the
labour force due to disability and engagement in household chores, among other reasons.
NEET is also a better measure of the current universe of potential youth labour market
entrants as compared with the youth inactivity rate, as the latter includes those youth who
are not in the labour force and are in education, and thus cannot be considered currently
available for work121.
It is vital that youth have the chance to study or engage in employment so they can spend
their time productively and develop their skills.
The proportion of men and women aged 18 to 34 years who are neither in education nor
training nor in employment (NEET) is shown in Figure 3.59. Pattern of the NEET rate is
very similar for men and women for ages 18 to 21 years. NEET rate is higher for women
from 22 years and older, 32% for women aged 22 years and 56% for women aged 32 years
and decreased to 44% for the age 35 years. A high NEET rate among women as compared
to men is often an indication that women youths are engaged in household chores such as
cooking, washing clothes, cleaning and taking care of siblings.
The NEET rate for men increase at the age 18 till age 19. Starting from age 19 years, for
men the NEET rate decreased and reached to 4% in the age 34 years.
12 Decent work indicators, guideline for producers and users of statistical and legal frame indicators, ILO man-ual, second version, December 2013
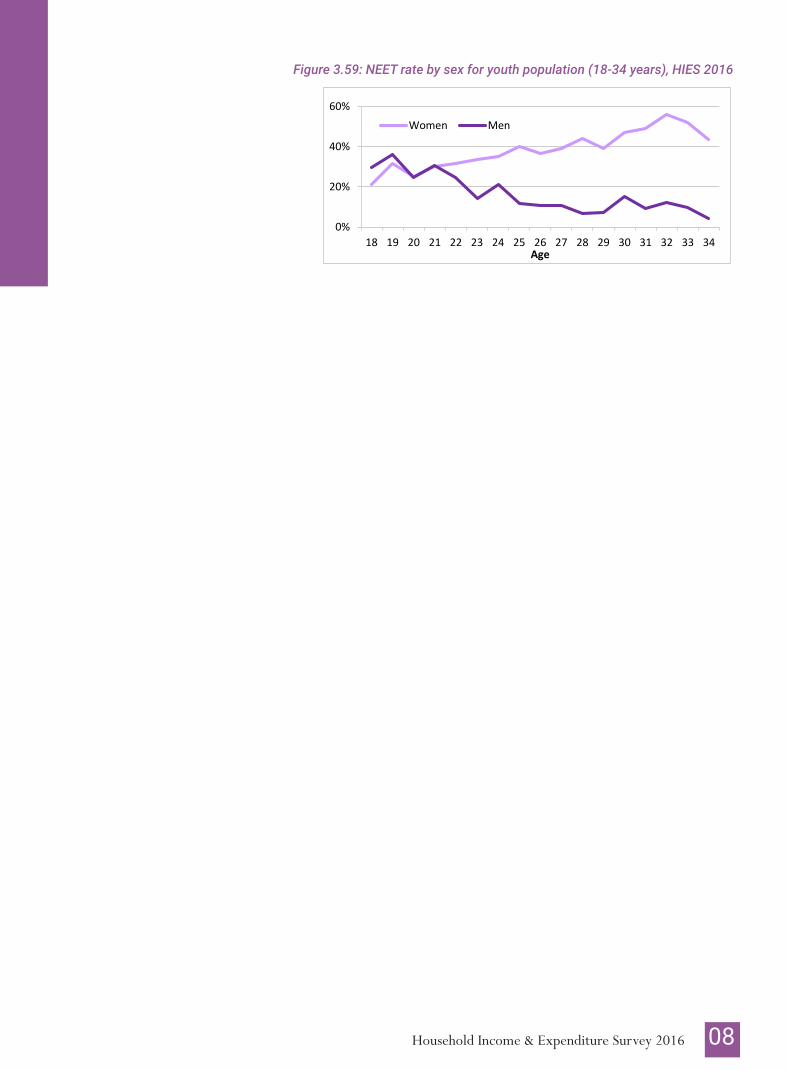
108Household Income & Expenditure Survey 2016
Figure 3.59: NEET rate by sex for youth population (18-34 years), HIES 2016
0%
20%
40%
60%
18 19 20 21 22 23 24 25 26 27 28 29 30 31 32 33 34Age
Women Men

109Household Income & Expenditure Survey 2016
3.15OWN-USE PRODUCERS
According to the ILO, own-use producers are all persons of working age (15 years old
and over) who were engaged in own-use production work for at least one hour during
the reference period. Own-use production comprises any activity to produce goods or
provide services for own final use by household members or by individual person living
in the household.
Production of “goods” includes: (i) producing or processing for storage agricultural, fish-
ing and gathering products; (ii) collecting or processing of forestry products, including
firewood; (iii) manufacturing household goods (such as furniture, textiles, clothing etc.);
(v) building, or effecting major repairs to, one’s own dwelling etc.
Provision of “services” includes (i) household activities such as buying items for house-
hold use; (ii) preparing or serving meals, household waste disposal; (iii) cleaning and
maintaining one’s own dwelling or premises, durables and other goods, and gardening;
(iv) childcare, transporting and caring for elderly, dependent or other household mem-
bers etc.
In HIES 2016, 183,195 persons were identified as own-use producers, out of this 64% of
the population were women. More than half (54%) of own-use producers reside in Atolls.
Figure 3.60 shows the activities engaged by own-use producers. The bulk of own-use
producers, mostly women, were engaged in family responsibilities (116,354 women). The
second highest among women was agriculture production mainly for own-consumption
(10,112 women).
Among men, most of the own-use producers were engaged in family responsibilities
3.15.1 Own use producers

110Household Income & Expenditure Survey 2016
Figure 3.60: Own-use producers by activities and sex, HIES 2016
- 50,000 100,000 150,000 200,000
Agriculture
Poultry
Fisheries
Preparing long-lasting food items
Making or repairing items
Family responsibilities and house work
Number of people
Women Men
Among the own-use producers, 27,527 people may be classified as subsistence foodstuff
producers. Subsistence foodstuff producer are classified as those who engaged in own-
use production of agriculture goods and fishing that contribute to the livelihood of the
household or family.
17% of the own-use producers involved in both production of goods and provision of
services. The others were either exclusively engaged in the production of goods (5%) or
exclusively engaged in the provision of services (78%).Figure 3.61: Own-use producers by age group, HIES 2016
9%12%
14% 15%11%
9% 9% 7% 6%3%
5%
0%
5%
10%
15%
20%
15-1
9
20-2
4
25-2
9
30-3
4
35-3
9
40-4
4
45-4
9
50-5
4
55-5
9
60-6
4
65+Pe
rcen
t of o
wn-
use
prod
ucer
s
Age group
As seen from Figure 3.61, majority of the own-use producers falls under the age group 30-
34 years. This was the age group where the labour force participation was lower.
The result shows that among the 183,195 own-use producers some 5,811 were unem-
ployed and 19,067 were potential labour force as seen from Figure 3.62. The bulk of the
unemployed and potential labour force own-producers were women (76%) and most of
them are in Atolls (81%).
(57,431 men) followed by fishing activity mainly for own-consumption (10,504 men).

111Household Income & Expenditure Survey 2016
Figure 3.62: Own-use producers by status of employment, HIES 2016
0
50,000
100,000
150,000
Employed Unemployed Potential LF Other Outside th
Popu
latio
n-Ow
n us
e pr
oduc
ers
Both sex Women Men
3.15.2 Average hours spent by Own-use producersOwn-use producer worked on average 34 hours per week, with men spending 18 hours
while women spent 43 hours. Own-user producers in the Atolls worked 39 hours per
week while in Male’ own-use producer worked 29 hours per week.
Given the gender difference observed on time-use, Figure 3.63 looks at the time spent by
men and women on activities for own-use production.
Figure 3.63: Average weekly hours spent by the own-use producers by activities and sex, HIES 2016
8 6 12
5 7
34
7 6 7 4 5
43
9 6 13 10 11
17
- 10 20 30 40 50
Agric
ultu
re
Poul
try
Fish
erie
s
Prep
arin
glo
ng-la
stin
gfo
od it
ems
Mak
ing
orre
pairi
ngite
ms
Fam
ilyre
spon
sibili
ties a
nd h
ouse
wor
kHour
s spe
nt p
er w
eek Both Sex Women Men
Women engaged in family responsibilities spend on average 43 hours per week compared
to 17 hours by men. On other activities men spend more hours than women as seen from
Figure 3.63.

112Household Income & Expenditure Survey 2016
3.16TOTAL HOURS SPENT IN ALL ACTIVI-TIES- PAID AND UNPAID WORK
HIES 2016 captured information on the time spent:
• Growing crops/ vegetables or fruits for own consumption
• Raise poultry or graze animals for meats/eggs for own consumption
• Catch/ trap fish, sell fish or sea products or other water products for food or raw
material for own consumption
• Prepare non-perishable or long lasting food items such as fish paste, dried fish,
pickles or other food products for own consumption
• Make garments, furniture items for household members or carry out construction
or repair work, etc for own consumption.
• Spend any time during unpaid household works, taking care of elderly family
members/ children, people with special needs, preparing meals for household
members, cleaning, shopping, etc.
• Spend anytime providing services to an association, charity organization, school,
Box 3.4: Unpaid work Unpaid work refers to all unpaid own production and services provided within a household for its members, including care of persons, household work, agricultural, fishing, hunting or gathering goods intended mainly for own consumption. In addition to this, unpaid work also includes volunteer work and unpaid training. These activities are considered work, because theoretically one could pay a third person to perform them.
Unpaid = the individual performing this activity is not remunerated Work= the activity involves mental or physical effort and is costly in terms of
time resources

113Household Income & Expenditure Survey 2016
hospital, etc without any pay (voluntary)
• Spend any time working without pay (salary, commission or stipend, as an ap-
prentice, intern or trainee, for the purpose of acquiring knowledge or gaining prac-
tical experience)
• Hours spent in economic activity/ paid activity.
Through these questions, the total hours spent in all activities was roughly estimated.
Since, there is no Time Use Survey conducted in Maldives. In the absence of a Time Use
Survey, this is the closest estimate that can be derived for time use among the population.
Hence, it should be noted that time can be valuably estimated through Time Use Survey.
When the total hours worked per week on all activities was added, paid and unpaid, the
time spent by employed person, women spent 68 hours on a week while men spent 67
hours per week. On average women spent more hours on work than men as seen from
Figure 3.64.
Figure 3.64: Average weekly hours spent on all economic and non-economic activities, HIES 2016
67
32
47 44
68
43 53 49
67
20 21 17
-
20
40
60
80
Employed Unemployed Potential LF Other Outside th
Hour
s per
wee
k
Both sex Women Men

114Household Income & Expenditure Survey 2016
Figure 3.65: Amount of time spent on paid and unpaid activities by sex, HIES 2016
Own-used agri products
6%Own-used poultry
2% Own-used catching fish3%
Own-used prepare long-last food
3%Own-used services such has repair
4%
Household work such as take care of children
53%
Volunteer work3%
Unpaid - intern4%
paid job22%
FEMALE
Own-used agri products
7% Own-used poultry2%
Own-used catching fish10%
Own-used prepare long-last food
3%Own-used services
such has repair 6%
Household work such as take care of children
18%Volunteer work4%
Unpaid - intern6%
paid job44%
MALE
As the women spent more hours in their work it is important to see the detail distribution.
Irrespective of women employment status, marital status, age or income group, a woman
works on average 12 hours per day. However, while 22% of her day’s work is paid, the
majority of her work is unpaid (Figure 3.65). Cooking and caring for children etc. make up
for the majority of women’s daily unpaid tasks: 53% (6 hours per day) of their total work-
ing time or 69% of their unpaid working time. Other unpaid activities, such as own-used
production and services require approximately the same amount of time and represent a
total of 1 hour per day. In Maldives, men also participate in unpaid activities. However,
women spent more time on the household chores and childcare, spending almost double
the amount of time on the care of children compared to men (6 hours per day vs. 3 hours
per day).

115Household Income & Expenditure Survey 2016
MAIN CONCEPTS AND DEFINITIONSThe main concepts and definitions used in the survey are in with the international stan-
dards on statistics of work, employment, and labour underutilization adopted by the
Nineteenth International Conference of Labour Statisticians (Geneva, 2013). They are
briefly described below.
• Work
The starting point of the international standards on statistics of work, employment and
labour underutilization is the concept of work defined as:
-“Any activity performed by persons of any sex and age to produce goods or to pro-
vide services for use by others or for own use” in line with the General production
boundary defined in the System of National Accounts 2008.
-Work is defined “irrespective of its formal or informal character or the legality of
the activity.”
-It excludes “activities not involving production of goods or services (begging, steal-
ing), self-care (personal grooming, hygiene) and activities that cannot be performed
by another person on one’s own behalf (sleeping, learning, own recreation).”
• Economic unit or institutional unit
An economic unit or institutional unit is an economic entity that is capable, in its own
right, of owning assets, incurring liabilities and engaging in economic activities and in
transactions with other entities. The main attributes of institutional units may be described
as follows:
a. An institutional unit is entitled to own goods or assets in its own right; it is there-
fore able to exchange the ownership of goods or assets in transactions with other
institutional units;
b. It is able to take economic decisions and engage in economic activities for which
it is itself held to be directly responsible and accountable at law;
c. It is able to incur liabilities on its own behalf, to take on other obligations or future

116Household Income & Expenditure Survey 2016
commitments and to enter into contracts;
d. Either a complete set of accounts, including a balance sheet of assets and liabili-
ties, exists for the unit, or it would be possible and meaningful, from an economic
viewpoint, to compile a complete set of accounts if they were to be required13.
• Employment
Persons in employment are defined as all those are 15 years and above who, during a short
reference period, were engaged in any activity to produce goods or provide services for
pay or profit.
It excludes persons engaged wholly in activities to produce goods or services for own final
use such as producing agricultural, fishing and gathering products for own-consumption
or cleaning, decorating, gardening and maintaining one’s own dwelling or premises, du-
rables and other goods.
Persons in employment comprise: (a) employed persons “at work,” i.e., who worked in
a job for at least one hour; and (b) employed persons “not at work” due to temporary
absence from a job, or to working-time arrangements (such as shift work, flexi-time and
compensatory leave for overtime).
• Unemployment
Persons in unemployment are defined as all those are 15 years and above who (a) were
not in employment; (b) carried out activities to seek employment during a specified recent
period; and (c) were currently available to take up employment given a job opportunity.
The definition of unemployment provides an exception in the case of future starters. They
are considered as unemployed even if they did not carry out activities to seek employ-
ment during the specified recent period, criterion (c) as long as they satisfy the availability
condition.
13 Updated System of National Accounts (SNA2008): Chapter 4: Institutional units and sectors, Statistical commission

117Household Income & Expenditure Survey 2016
• Time-related underemployment
Persons in time-related underemployment are defined as all persons in employment who,
during a specified reference period, (a) wanted to work extra hours, (b) whose work-
ing hours in all jobs was less than a specified hours threshold, (c) who were available to
work extra hours given an opportunity for more work and (d) number of additional hours
wanted is greater than zero.
In the Maldives, the threshold of weekly hours was set at 48 hours, based on the labour
Law of Maldives.
• Potential labour force
Potential labour force is defined as all persons above a 15 years and above who, during the
short reference period, were neither in employment nor in unemployment but who were
considered as either (a) unavailable jobseekers (seeking employment but not currently
available) or (b) available potential jobseekers (currently available for employment but
did not carry out activities to seek employment).
The relationship among the various concepts is show in Figure A1 below.

118Household Income & Expenditure Survey 2016
Figure A1: Labour force and labour underutilization framework
15+ population
Labour force
Employed
Other employed Time- related underemployed
Unemployed
Outisde the labour force
Potential labour force
other outside the labour force
Labour underutilization
• Gender Pay Gap
Step 1: Gather the correct pay data
Step 2: Calculate hourly pay
1.For each employee, identify all the amounts of “ordinary pay” paid during the
specific pay period (weekly/monthly etc.). This could include basic income and
shift premium.
Example:
MVR 1,000 paid to employee on 30th May, paying for April’s work
MVR 150 shift premium for the same month
2.Exclude any amount which is paid outside of the pay period.
3.Add together all the amounts identified in step 1.
= MVR 1,150
4.Multiply the amount by the appropriate multiplier. “The appropriate multiplier”
means 7 divided by the number of days in the pay period. The number of days in
the pay period:
(a) a month is 30.44 days;
(b) a year is 365.25 days.
7 / 30.44 = 0.23

119Household Income & Expenditure Survey 2016
1,150 x 0.23 = 264.5
5.Divide the amount found by the number of working hours in a week for that
employee.
264.5 / 35 = MVR 7.56
Step 3: Work out the average hourly pay for male and female staff
The calculation for the mean gender pay gap must be based on mean hourly pay.
• Own-use producers
Persons in own-use production work are defined as all those of working age who, during
the reference period, performed any activity to produce goods or provide services for
own final use for a cumulative total of at least one hour. “For own final use” is interpret-
ed as production where the intended destination of the output is mainly for final use (in
the form of capital formation, or final consumption by household members, or by family
members living in other households). In the case of agricultural, fishing, hunting or gath-
ering goods intended mainly for own consumption, a part or surplus may nevertheless
be sold or bartered.
Subsistence foodstuff producers constitute an important subgroup of persons in own-use
production work. They are defined as all those who performed any of the specified activ-
ities to produce foodstuff from agriculture, fishing, hunting or gathering that contribute
to the livelihood of the household or family.
Own-use producers and in particular subsistence foodstuff producers may be engaged,
in the same reference period, in other activities, including employment or search for em-
120Household Income & Expenditure Survey 2016
ployment. On the basis of their other activity, therefore, certain own-use producers may
also be in the labour force and classified as employed, unemployed or other labour un-
derutilization category.
• NEET
Youth not in employment, education or training (NEET) provides a measure of youth
who are outside the educational system, not in training and not in employment, and thus
serves as a broader measure of potential youth labour market entrants than youth unem-
ployment. It includes discouraged worker youth as well as those who are economically
inactive due to disability and engagement in household chores, among other reasons.
NEET is also a better measure of the current universe of potential youth labour market
entrants as compared with the youth inactivity rate, as the latter includes those youth who
are not in the labour force and are in education, and thus cannot be considered currently
available for work.
Method of computation NEET
The NEET is defined as the percentage of youth (15-24 years old) who are not in employ-
ment and not in education or training. The indicator is calculated as follows:
Table A1 lists the terminology and definitions of the main labour force and labour un-
derutilization indicators used in the survey.

121Household Income & Expenditure Survey 2016
Concept Definition Working age population (Pop 15+) E+U+N Labour force (LF) LF=E+U Potential labour force P Extended labour force (XLF) XLF=E+U+P Employment E Unemployment U Time-related underemployment T Labour force participation rate LF/Pop15+ Employment-population ratio E/ Pop15+ Unemployment rate (LU1) U/LF Combine rate of unemployment and time-related underemployment (LU2)
(U+T)/LF
Combine rate of unemployment and potential labour force (LU3) (U+P)XLF Combine measure of labour force underutilization (LU4) (U+T+P)/XLF
Table A1. Main labour force and labour underutilization indicators


123Household Income & Expenditure Survey 2016
National Bureau of StatisticsMinistry of Finance & Treasury
Male’, Maldives